Article

Spatiotemporal Differentiation Characteristics of Land Ecological Quality and Its Obstacle Factors in the Typical Compound Area of Mine Agriculture Urban

1
School of Surveying and Land Information Engineering, Henan Polytechnic University, Jiaozuo 454000, China
2
College of Surveying and Geo-Informatics, North China University of Water Resources and Electric Power, Zhengzhou 450046, China
*
Author to whom correspondence should be addressed.
Sustainability 2022, 14(16), 10427; https://doi.org/10.3390/su141610427
Submission received: 25 July 2022 / Revised: 13 August 2022 / Accepted: 19 August 2022 / Published: 22 August 2022

Abstract

:
Mining activity combines industrialization, urbanization, and urban-rural integration in the compound area of mine agriculture urban. The land ecological environment has become a major hidden problem, restricting the sustainable development and ecological security of the region. It is imminent to understand the spatiotemporal differentiation characteristics of land ecological quality and its obstacle factors to scientifically carry out land ecological restoration. Here, the Macun coal area in Jiaozuo City, Central China, was selected for the case study, and an evaluation index system including four criteria layers of ecological foundation, structure, benefit, and stress was established. The multiperiod evaluation index data were acquired by utilizing remote sensing and geographic information system (GIS) technology. Based on the multi-objective comprehensive evaluation method, a comprehensive evaluation of land ecological quality was conducted, and the spatiotemporal differentiation characteristics of land ecological quality were explored. Moreover, an obstacle factor diagnosis model was constructed to confirm the spatiotemporal differentiation characteristics of obstacle factors affecting the change of the land ecological quality in the study zone. The results showed the following: (1) From 1980 to 2020, the land ecological quality index in the study zone showed a downward trend, and the proportion of the regional area with general and poor land ecological quality increased from 6.55% to 35.02%. (2) The areas with lower land ecological quality in each period of the study zone were mainly distributed in the mining areas with long mining history in the west and the areas with continuous urbanization and industrialization in the south. In contrast, the compound area of mine agriculture urban with short mining history in the east and southeast had higher land ecological quality. The aggregation of the land ecological quality index also showed similar spatial distribution characteristics. (3) The diagnosis results of obstacle factors showed that, due to the poor land ecological foundation and interference of mining activities, the land ecological quality of the mountain area in the north and west of the study area has been low. It is suggested that the land ecological quality of the area should be improved through measures such as terrain regulation, soil reconstruction, afforestation, and forest land conservation. Under the influence of mining activities and the continuous promotion of urbanization in the south of the study area, the regional ecological quality has been reduced. It is suggested that the regional land ecological quality should be improved by building ecological agriculture and ecological communities. The northeast of the study area is still in the mining area, and the ecological quality of the land tends to deteriorate. The ecological restoration in this area should be conducted by the combination of pre-mining planning, while-mining control, and post-mining restoration. The methodology of this study can provide reference for the identification and restoration of land ecological problems in the compound area of mine agriculture urban.

1. Introduction

The compound area of mine agriculture urban refers to the resource-based urban region, where the main industries are the exploitation and utilization of underground mineral resources and aboveground agricultural production [1]. The mining of mineral resources in the compound area inevitably destroys the regional land in many forms, such as surface subsidence, soil pollution, occupation, and productivity decline [2,3], influencing the regional land use and cover, soil physicochemical properties, and landscape pattern. The structure and function of land ecosystems can thus be changed [4], and a series of land ecological problems may be caused, restricting the sustainable development of the economic society [5,6]. Moreover, the mining activity combines industrialization, urbanization, and urban-rural integration in the compound area of mine agriculture urban, causing prominent regional ecological environment and socioeconomic problems. This can produce a major hidden danger inregional sustainable development and even ecological security [1]. Currently, ecological protection and restoration has become one of the key efforts to the construction of ecological civilization in China [7]. The severe land ecological problems in the compound area of mine agriculture urban necessitate the urgent ecological restoration work. To carry out the ecological restoration of the land in practice, regional natural and economic characteristics as well as the spatiotemporal differentiation characteristics of land ecological quality and contributing factors need to be thoroughly analyzed. Then, precise ecological restoration of the land can be performed to reestablish a complete land ecosystem and restore its ecological functions [5,8,9]. Therefore, it is theoretically and practically significant to study the spatiotemporal differentiation characteristics of land ecological quality and its obstacle factors in the compound area of mine agriculture urban so as to restore the regional land ecological functions and improve the regional ecological environment.
In recent years, researchers have conducted many studies on the ecological quality of mining land from different perspectives [3,10,11,12,13,14,15,16,17]. For instance, Yu et al., investigated the influence of mining and climate change on the land ecosystem of the Gobi mining area in Western China by using the arid remote sensing ecological index based on remote sensing datafrom 2000 to 2020. Their research results showed that the impact of climate change on the quality of the land ecosystem in the Gobi mining area was greater than that of mining activity, mining had a negative effect on the quality of the land ecosystem, and the degradation induced by mining was concentrated in the new mining area and on both sides of the new road. On the basis of the above analysis, the study believes that unnecessary road network construction should be reduced as much as possible, relying on the favorable climate trend and necessary manual guidance so as to promote the ecological restoration measures of overall protection, systematic restoration, and comprehensive treatment of the Gobi mining area [10]. Gao analyzed the change of land ecological quality and its obstacle factors ina mining area in the semiarid area of Northwest China. The study found that the overall land ecological quality in the study area is gradually improving from 1990 to 2019, but the land ecological quality is declining in some areas due to human activities. Some suggestions for ecological restoration are put forward, such as making full use of the self-restoration of the ecosystem, building an ecological industrial park, and controlling the population growth rate [11]. Pandey et al., conducted research on the impact of coal mining on land-use dynamics and soil quality in the Manendragarh coal-mining area located in Central India using analytical hierarchy process and geospatial tools. Their research results showed that the area under forest, agriculture-fallow, and water bodies fell by different degrees due mainly to conversion into degraded land, while the mining and built-up areas were proportionally enhanced between 1990 and 2020 in the coal-mining area located in northern Chhattisgarh, Central India. The intense mining resulted in the deterioration of soil health [12]. Based on Landsat TM data, Luise and Gläβer monitored the water quality data of lakes formed after the open-pit lignite mining in eastern Germany and revealed that the open-pit lignite mining has a negative effect on the ecological environment of the mining area [13]. Konstantinos and Demetrios selected six typical indicators in the aspects of atmosphere, soil, water, and biology to build an evaluation index system and determined the index weight by the fuzzy Delphi method to comprehensively evaluate the ecological environment quality of the northwest coal mine area in Greece and Macedonia. The results showed that the ecological environment quality in the study area was deteriorating from 1983 to 1998 [14]. Antwi et al., calculated a variety of land-use and landscape pattern indexes with the support of GIS technology to reveal the land-use changes in the coal-mining subsidence area in Lusatia, Germany. The research results showed that the coal-mining subsidence leads to drastic changes in surface land use and ultimately changes in the landscape pattern of the mining area [15]. Xu et al., studied the changes of land ecological quality in the Jiawang plain mining area of Xuzhou City, south central China, from 2001 to 2010 from the perspective of the landscape ecosystem. Their research results showed that due to coal mining, there are many subsidence areas, and the land is seriously damaged. In 2001, the areas with poor land ecological quality were concentrated in coal-mining and subsidence areas. With the implementation of the land reclamation project, the coal-mining subsidence area is reclaimed into different plant landscape areas and wetland parks, and the land with broken landscape caused by coal mining is reclaimed into dry and paddy fields. The ecological quality of the land after reclamation has been significantly improved. However, due to the rapid development of cities and towns, the continuation of coal mining, the second collapse of the reclaimed area, and other reasons, the ecological environment quality of some areas is still declining. The study further proposed the combination of land economy and ecological benefits, and the ecological restoration strategy for the damaged farmland, water, industrial and mining, residential, and other landscapes [3].
The above studies showed that due to the differences in the natural environment, mineral occurrence, mining history, and social development, spatial heterogeneity exists in the spatiotemporal differentiation of land ecological quality and its influencing factors in the mining area [9]. Currently, there are still several problems in the research of land ecological quality in mining areas, such as relatively single research perspective, unreasonable selection of evaluation indexes [10], short time scale of research, and a lack of research on systematic and long-term evaluation of land ecological quality in the mining area (especially in the compound area of mine agriculture urban) based on the comprehensive land ecological system.
Jiaozuo City in central China is a city developed based on mining [18]. The Macun coal area is located in the northeast of Jiaozuo. Since the 1950s, large-scale coal mining has begun in this area, which has significantly promoted local economic and social development. The southern part of this region has developed as a built-up area of Jiaozuo City, where a series of problems such as land destruction, ecological degradation, and environmental pollution have arisen [19,20]. Therefore, this representative area can be chosen as a sample area for carrying out the study of the land ecological quality in the compound area of mine agriculture urban.
In this paper, the Macun coal area was chosen as the study zone.Remote sensing and geographic information system (GIS) technology were used to integrate basic geographic, remote sensing image, and soil physicochemical data to construct the more comprehensive and reasonable evaluation index system of land ecological quality on the basis of fully considering the comprehensive nature of the land ecosystem and characteristics of the compound area of mine agriculture urban. The evaluation model of land ecological quality was optimized, and land ecological quality was accurately evaluated. Moreover, the spatiotemporal differentiation characteristics of land ecological quality and its influencing factors were clarified based on the multidimensional and multiscale analysis in the compound area of mine agriculture urban, providing a scientific basis for the land ecological restoration and sustainable development there. The methodology of this study can provide reference for the identification and restoration of land ecological problems in similar regions.

2. Data and Methods

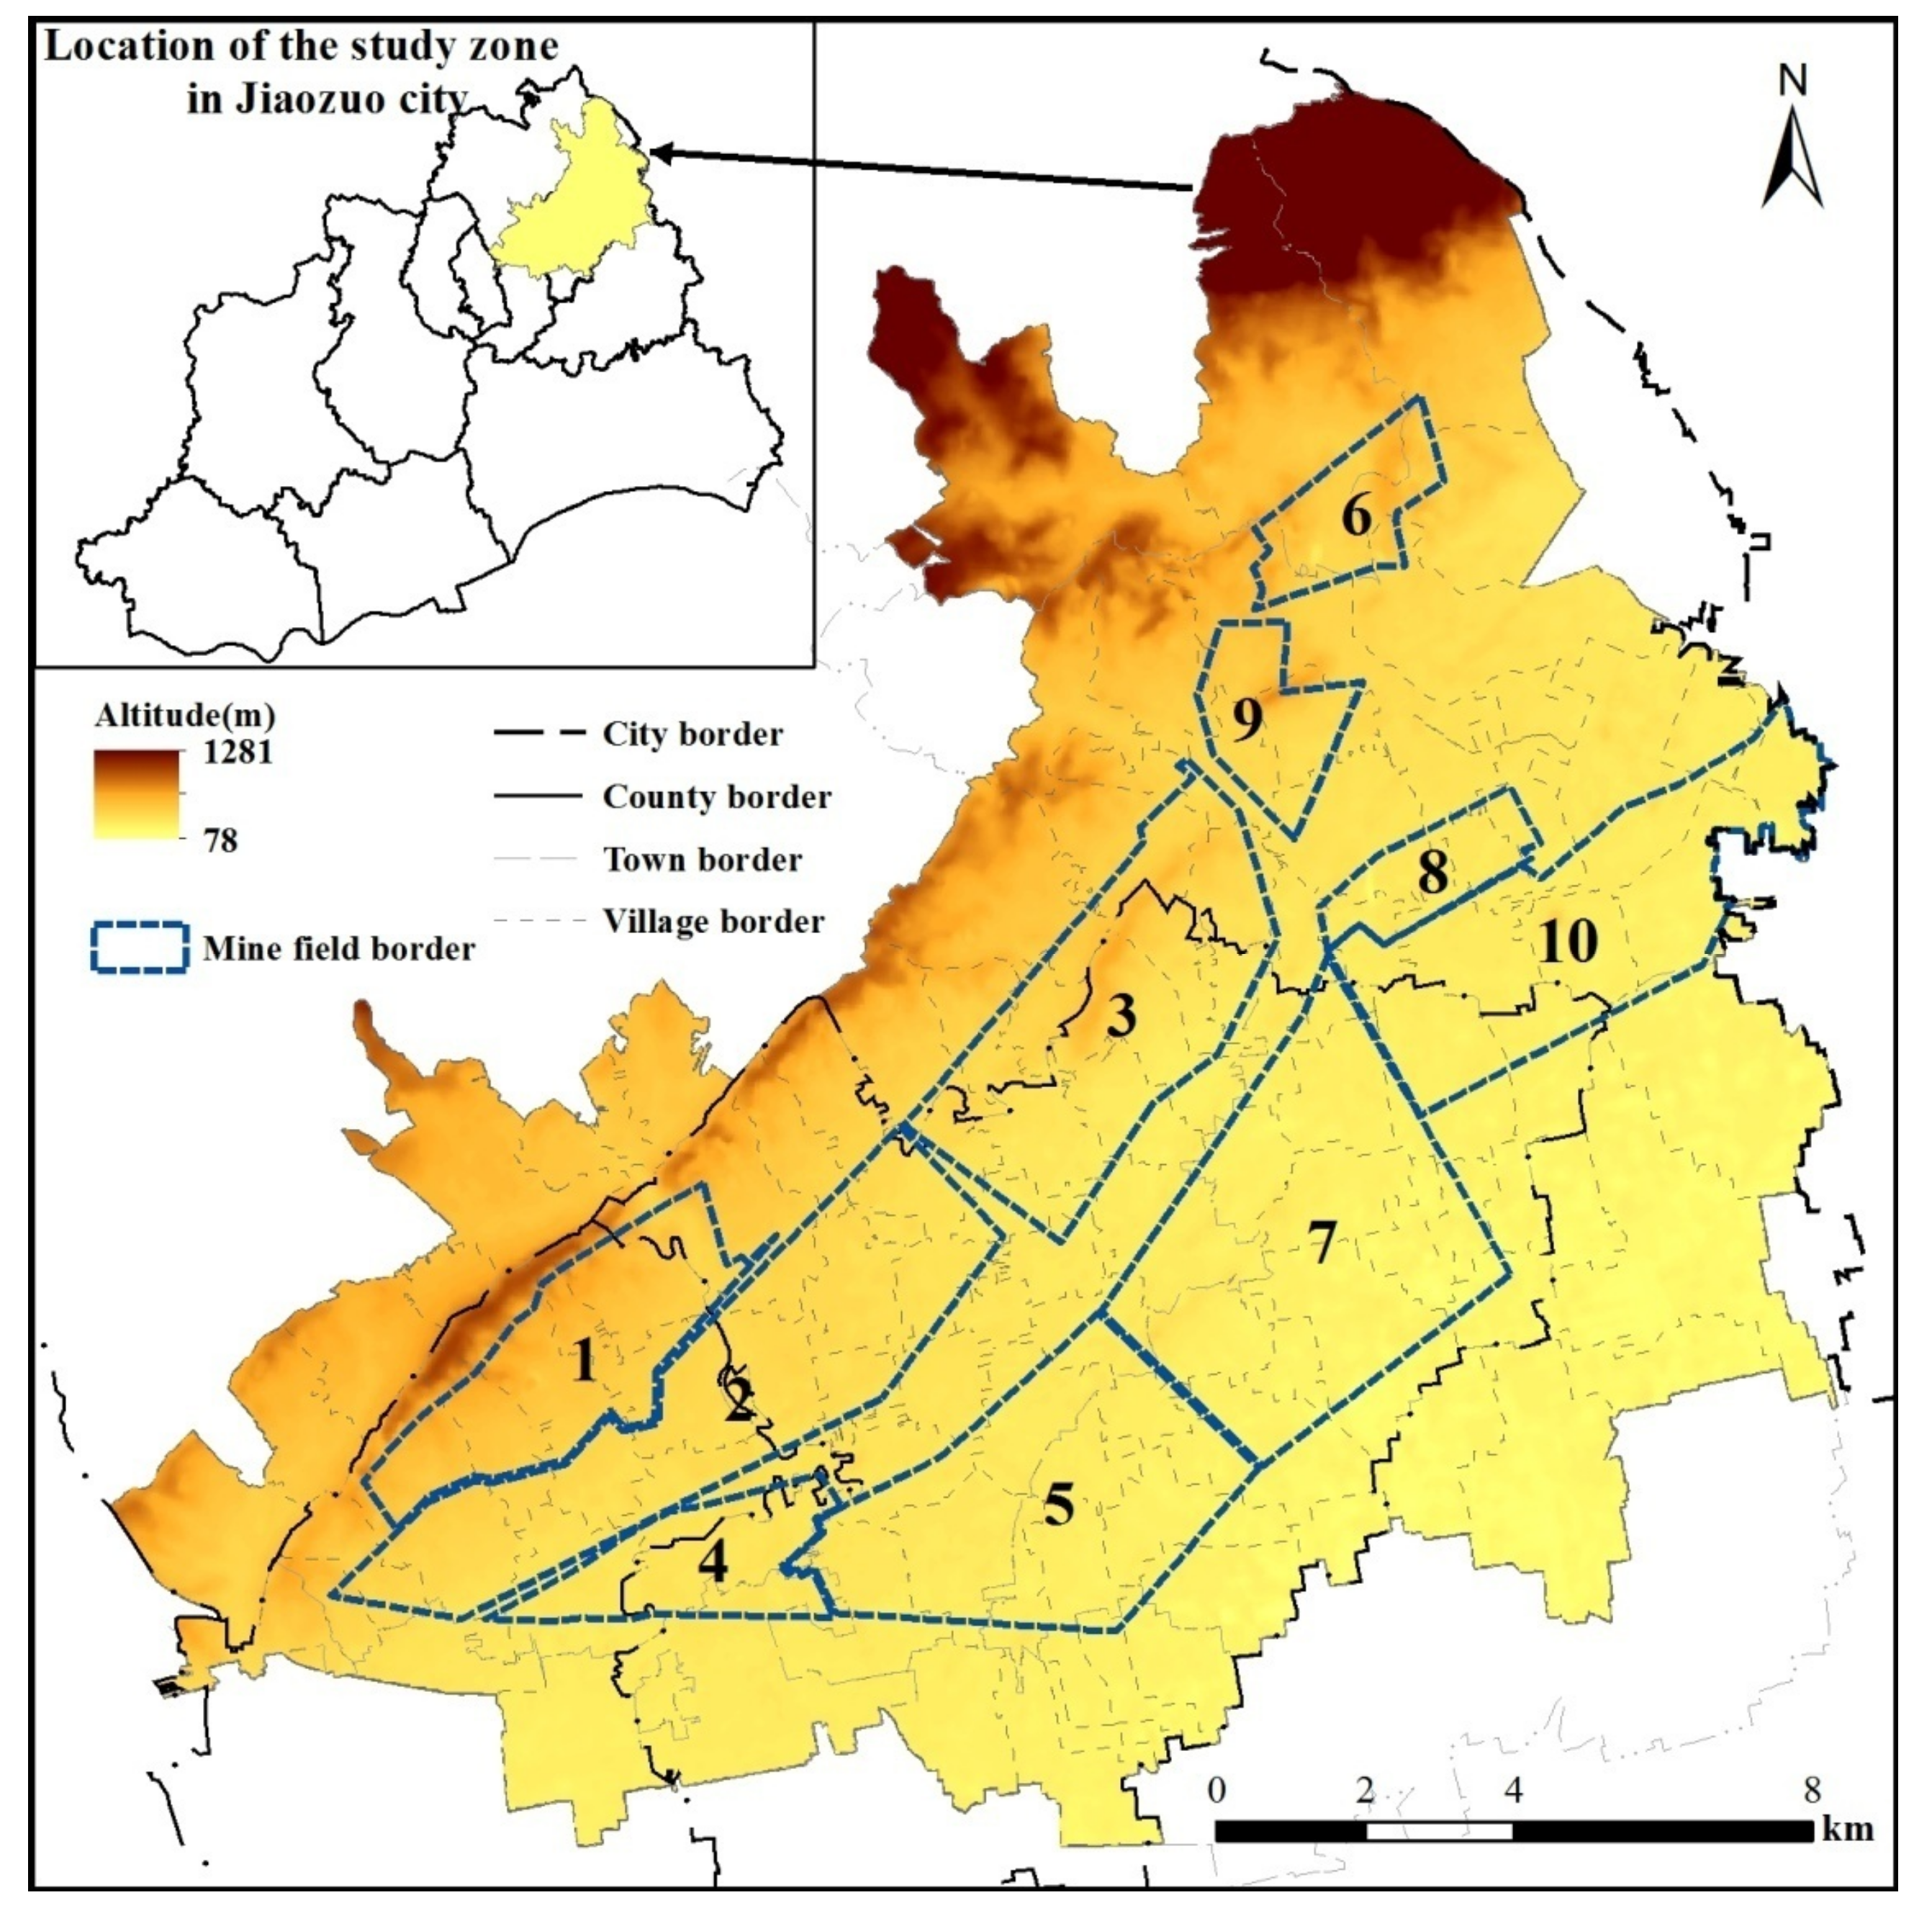
2.1. Overview of the Study Zone

The study zone (113°15′–113°28′ E, 35°15′–35°25′ N) is located at the southern foot of Taihang Mountain, crossing the Jiefang District, Macun District, and Xiuwu County. With the Macun District as its main body, it covers 109 village-level administrative districts and some parts of the built-up area of Jiaozuo City, occupying a total area of 275.00 km2. This area has a temperate continental monsoon climate, with an average annual temperature of 14.9 °C and an average annual precipitation of 695.7 mm.
The overall landform is piedmont alluvial fan plain, which consists of low mountain, hill, slope, and plain from northwest to southeast in sequence [21]. The altitude ranges from 78 to 1281 m, and the height of the terrain decreases from northwest to southeast.
There are ten mines in this region: Xiaoma Mine, Zhongma Mine, Fengying Mine, Hanwang Mine, Yanma Mine, Fangzhuang No. 1 Mine, Jiulishan Mine, Baizhuang Mine, Fangzhuang No. 2 Mine, and Guhanshan Mine (Figure 1). The IDs of the ten mines are shown in Table 1. Among them, the Xiaoma Mine, Zhongma Mine, Fengying Mine, Hanwang Mine, Yanma Mine, and Fangzhuang No. 1 Mine started production in the 1950s; the Jiulishan Mine, Baizhuang Mine, and Fangzhuang No. 2 Mine started production in the 1980s; and the Guhanshan Mine started production in 2004. Since the 1990s, the coal output in the study zone has declined on a large scale. Note that, except for the Jiulishan Mine and Guhanshan Mine in the northeast, the Xiaoma Mine and Fengying Mine in the suburban have been closed, and productions in mines such astheZhongma Mine, Hanwang Mine, Fangzhuang No. 1 Mine, and Yanma Mine came to end. As a result of coal mining, 19 coal-mining subsidence zones with a total area of 2648 ha have been formed in the study region. An area of 270 ha has been mitigated, but the arable land destroyed in the subsidence area has reached 1529 ha [18]. It is worth mentioning that limestone, dolomite, clay ore, and iron ore are distributed in the western mountainous area of the study region.
Since 1999, Jiaozuo City has been transforming from a resource-based to tourist city [18], and its industrial enterprises have been moving to the suburbs. The study zone in this study is one of the key immigration areas, where continuous progress has been made in its urbanization and industrialization processes.

2.2. Data Sources

The research data mainly included basic geographic, remote sensing image, and soil physicochemical property and pollution data.

2.2.1. Basic Geographic Data

The data included village-level administrative boundary data (from the land-use change survey data of Jiaozuo City) and digital elevation model (DEM) data. ASTER GDEM data with 30 m resolution were used for DEM data, which were obtained from the geospatial data cloud platform of the Computer Network Information Center of Chinese Academy of Sciences (http://www.gscloud.cn, accessed on 1 July 2021).

2.2.2. Remote Sensing Image Data

The data included historical data of Landsat and Google Image for 1980, 1990, 2000, 2010, 2015, and 2020. The Landsat data were obtained from the geospatial data cloud platform of the Computer Network Information Center of Chinese Academy of Sciences (http://www.gscloud.cn, accessed on 1 July 2021).

2.2.3. Soil Physicochemical Property and Pollution Data

Soil physicochemical property and pollution data were obtained from the multi-objective geochemical survey data in 2005; data of field-survey, soil sampling, and lab analysis in 2015; and basic fertility survey data of the agricultural sector.

2.3. Research Methods

2.3.1. Construction of the Evaluation Index System of Land Ecological Quality

By following the principles of regionalism, comprehensiveness, operability, and hierarchy, the characteristics of the land ecological quality index system were summarized by analyzing relevant studies [3,11,12,13,14,15,22,23,24,25]. Based on the physical geography and land ecological status of the study zone, an evaluation index system including four criteria layers of ecological foundation, structure, benefit, and stress was constructed (Table 2). The criterion layer index of ecological foundation microscopically reflects the ability of natural endowments, including soil, topography, and vegetation, to maintain regional land ecological balance and stability. The criterion layer index of ecological structure reflects the land-use structure and landscape pattern affected by human activities in terms of landscape. The criterion layer index of ecological benefit mainly quantifies regional ecosystem functions from the comprehensive and macro scale. The criterion layer index of ecological stress microscopically quantifies the human impact on land ecology based on the actual problems of regional land ecology.

2.3.2. Land Ecological Quality Index Acquisition Based on Remote Sensing and GIS

The long-term acquisition of land ecological quality indicators is the basis of land ecological quality evaluation and analysis. In this paper, remote sensing and GIS technology were used to study the acquisition method of long-term land ecological quality indicators. The remote sensing and GIS software packages used are ENVI 5.3 and ArcGIS 10.1, respectively [26].
(1)
Ecological foundation index acquisition
Data collection and laboratory determination of soil samples
In 2015, soil samples were collected in the study area according to the mechanical distribution of 1 km2. Soil samples were collected from the study area at a depth of 0–20 cm, 3–5 soil samples were collected in an “S” shape, and each sample was thoroughly mixed by the quadrat method [27]. The potassium dichromate oxidation-colorimetric method was used to determine the organic matter content of the soil. Soil heavy metal content was determined by the HNO3-HF -HCLO4 method to determine the content of Cr, Cd, Cu, Pb, Zn, and other heavy metals [20].
Spatial distribution data acquisition of soil organic matter content based on remote sensing retrieval
Remote sensing images can be used to reflect various properties of surface soil. Previous studies showed that there is a significant negative correlation between soil spectral reflectance and soil organic matter content [27]. Therefore, remote sensing images can be used to retrieve the content of surface soil organic matter and obtain the spatial data of soil organic matter in historical years [28]. However, because the spectral characteristics of soil organic matter not only are related to soil organic matter but also depend on the soil-forming parent material in the study area, plus the influence of the vegetation cover, the previous retrieval results are often very different, so more research is needed to determine the appropriate retrieval model and method.
Based on Landsat multispectral images and soil organic matter sample data in 2015, after image geometric correction, projection transformation, atmospheric correction, and other pretreatment, this study analyzed the correlation between 2/3 surface soil organic matter sample and the spectral reflectance of multiple bands of the image and established a soil organic matter inversion model (Equation (1)):
S O M = 7.463 0.053 l n B 4 2 + 8.773 l n B 4 1 0.33 l n B 6 2
where SOM is the organic matter content of topsoil (g/kg); B4 and B6 are the reflectance values of bands 4 and 6, respectively; and the regression equation has R2 = 0.481, with p < 0.001. Using the remaining 1/3 soil organic matter sample, the model was validated. The RMSE of the independent sample validation was 0.8 g/kg, indicating that the model estimation is more reliable.
The pseudo-invariant feature method [29] is used to correct the relative radiation of remote sensing images in 1980, 1990, 2000, 2010, and 2020, and Equation (1) is applied to obtain the spatial distribution data of soil organic matter in the corresponding year.
Effective soil thickness
The effective soil thickness data in the study area were collected from the Jiaozuo City Basic Geotechnical Survey Data. The soil body thickness in the study area is basically stable during the study time period, so the same data were used for all years.
Topographic position index
A single elevation or slope cannot fully reflect the comprehensive influence of topographic conditions on land ecological quality, and this paper adopted the topographic position index [30] as an indicator of regional topographic conditions. The calculation formula is shown in Equation (2):
  T = l o g E E ¯ × S S ¯ + 1
where T is the topographic position index, E is the elevation value of any raster, E ¯ is the average elevation value in the study zone, S is the slope value of any raster, and S ¯ is the average slope value in the study zone.
Elevation data are ASTER GDEM digital elevation data products, and the slope data used were generated from the DEM data. Since the macroscopic topography of the study area remained basically stable during the study period, the same data were used for all time phases.
Vegetation cover
Using Landsat multiband remote sensing data, the vegetation cover of the study area was calculated using the pixel dichotomy model [31,32].
NPP
The NPP data for 2000, 2010, and 2020 used in this paper werefromtheMOD17A3 data from NASA EOS/MODIS (https://lpdaac.usgs.gov/get_data/data_pool, accessed on 1 July 2021).
The construction land NPP in this NPP product is a null value. In order to correct the NPP value of the construction land in the MOD17A3 product, we referred to the average value of NPP for different land-use types provided by the study of Zhu et al. [33]. It was verified that this NPP value is in good agreement with the 1 km × 1 km scale NPP value of the MOD17A3 product in the study area, so this value was used to correct the NPP value of the construction land in 2000, 2010, and 2020.
The NPP data of MOD17A3 were not available for 1980 and 1990. Based on the analysis of the relationship between vegetation coverage and NPP of different land-use types in 2000 and 2010, the NPP data in 1980 and 1990 were generated by using the proportional relationship between the vegetation coverage of grid units corresponding to the NPP data in 2000 and the vegetation coverage in 1980 and 1990.
(2)
Acquisition of ecological structure indicators
Methods for acquiring land-use data
The land-use data of the study area were obtained by processing and interpreting the five-period Landsat images;and the land-use types of the study area were classified into six types, specifically cultivated land, forest land, grassland, construction land, industrial and mining land, and water area, by using ENVI 5.3 [34]. The accuracy of the classification results was verified by using high-resolution Google images, and the results showed that the overall classification accuracy was above 90%, and the Kappa coefficient was above 0.85, which satisfied the accuracy requirements of the classification.
Landscape index analysis method
Based on the acquired regional land use and cover data, indicators such as the landscape diversity index, landscape dominance, and landscape aggregation index were obtained using Fragstats 3.3 calculations [35,36,37].
Land-use structure index
Based on the actual contribution of each landscape type to land ecological quality, the land-use types were quantified as 3 for arable land, 2 for forest land, 1 for grassland and water, and 0 for built-up land. The four main land-use types were weighted and summed to calculate the land-use-type index [3]:
L = i = 1 4 g i w i = 0.4 g 1 + 0.3 g 2 + 0.2 g 3 + 0.1 g 4
where L is the land-use structure index; gi is the score of each land-use type; and wi is the weight of gi, which is 0.4, 0.3, 0.2, and 0.1 according to the size of the area proportion of the land-use type.
(3)
Ecosystem service value
Based on the research theory of Costanza et al. [38] and the value coefficients developed by Xie et al. [39], and combined with the local socioeconomic development of the region, the value coefficients were optimized and adjusted from the existing research results [39].It is known that the national average net profit per unit area of grain production in 2005 was 449.1 CNY/ha, which is the value of the national ecosystem service value equivalent factor. Combining the relevant data ofthe2006 Henan Provincial Statistical Yearbook and China Statistical Yearbook, it is known that the average grain production in Henan Province in 2005 is 5006 kg/ha and the national average grain production is 5896 kg/ha, according to which the value of the national ecosystem service value equivalent factor of 449.1 CNY/ha is corrected by the coefficient;and the ecosystem service value in Henan Province is obtained by calculating the value oftheequivalent factor of ecosystem services in Henan Province, which is 381.3 CNY/ha, that is, the value of one standard equivalent factor in the Jiaozuo mining area is 381.3 CNY/ha. The ecological service value of the study area was obtained based on the land-use data of the study area, adjusted value coefficient, and value equivalent factors such as those by Xie et al. [39].
(4)
Ecological stress index
Comprehensive soil pollution index
The spatial distribution data of heavy metals (Cd, Cr, Cu, Pb, and Zn) in the study area were obtained by an interpolation method using the 2015 soil sampling point and 2005 geochemical survey data, and the data of other years were obtained through the historical accumulated data of the subject group and literature data [40,41,42]; the soil pollution status of the study area was obtained by using the 2005 and 2015 heavy-metal data. The average accumulation rate of heavy metals in different regions was calculated, and combined with the distribution of industrial and mining land in the study area, the distribution data of five kinds of heavy metals in the study area were finally generated in five periods. The natural background value of soil in Henan Province was used as the standard value [40], and the Nemerow Index method [43,44] was used to evaluate the soil heavy-metal pollution status in the study area.
Damaged land proportion
Damaged land refers to land subsidence, compression, and excavation damage caused by mining activities, which is an important aspect affecting the ecological quality of the regional land, and the calculation formula is shown in Equation (4):
T = Damaged area/total regional area
According to the distribution data of goafs in mines of the study zone at different phases, the damaged area was generated based on the corresponding relationship between the land subsidence area and goafs of each mine. The land reclamation areas were removed. Meanwhile, based on remote sensing images of different periods, damaged areas caused by non-coal-mining activities were identified.
Disturbance index of industrial and mining land
Reflecting the degree of ecosystem damage caused by industrial and mining construction in the mining area, the calculation formula is shown in Equation (5):
Gk = area of industrial and mining land/area
The disturbance index of industrial and mining land in the study area was calculated based on the aforementioned land-use data.

2.3.3. Evaluation Method of Land Ecological Quality

(1)
Determining the Evaluation Unit of Land Ecological Quality
Too large evaluation units such as towns can cause local features to be ignored, while too small evaluation units lead to local data fragmentation and break administrative divisions, causing inconvenient application of the evaluation method in the practical land management [45]. Thus, two scales were selected for evaluation, with 110 village-level administrative units and 30 m × 30 m grid as evaluation units. The combined use of these two evaluation units can not only accurately evaluate the regional land ecology but also meet the needs of land ecological control.
(2)
Determining the Evaluation Model of Land Ecological Quality
In this study, the multi-objective comprehensive evaluation method was used to evaluate the regional ecological quality. The multi-objective comprehensive evaluation method eliminates the influence of different index dimensions and makes the index values have the characteristics of unified measurement. Then, different weights are assigned to the evaluation indexes, and, finally, the index value of comprehensive evaluation is obtained [46,47]. There are m evaluation units and n evaluation indexes, as shown in the following equation:
C i = j = 1 n w j r i j     i = 1 , 2 ,   , m ;   j = 1 , 2 ,   ,   n
where Ci is the land ecological quality index, wj is the weight of the jth index, and rij is the standardized value.
The land ecological quality index in 2020 was divided into five grades from low to high according to the natural breakpoint value. The corresponding grades were poor, general, medium, good, and excellent. In order to make the evaluation results of 2020 comparable with those of other time phases, the evaluation results of other time phases were classified based on the grading values determined in 2020.
(3)
Standardizing the Evaluation Index of Land Ecological Quality
The NPP, landscape diversity index, land-use structure index, and ecosystem service value were positively correlated with land ecological quality; these indexes were standardized by the extremum method. On the other hand, the topographic position index, landscape aggregation index, landscape dominance index, damaged land proportion, and disturbance index of industrial and mining land were negatively correlated with land ecological quality; these indexes were standardized by range analysis. The interval classification indexes included the soil organic matter content, effective soil thickness, vegetation coverage, and comprehensive soil pollution index.
(4)
Determining the Weight of the Evaluation Index of Land Ecological Quality
The evaluation index weight impacts the accuracy of the final evaluation result. In the study of land ecological evaluation, there are various methods of assigning the evaluation index weight, and they can be classified into two major categories—subjective and objective weight assignments. Since multiperiod land ecological quality evaluations were conducted in this paper, a more objective hierarchical analysis weighting method was used [14]. The specific steps are as follows.
① Construct the comparison judgment matrix. This is the key step of the analytic hierarchy process. Based on the meaning of the evaluation index data, the preliminary subjective judgment is made, and then the balance is made with the help of expert advice. The relative importance of each index at the same level is compared in pairs and expressed in numerical form. It is divided into five levels: 1, 3, 5, 7, and 9. The intermediate value of each level is represented by 2, 4, 6, and 8. On this basis, the comparative judgment matrix is constructed. Its manifestation is as follows:
A = x 11 x 12 x 1 n x 21 x 22 x 2 n x m 1 x m 2 x m n
where xij is the importance of index i (m = 1, 2, …, i) relative to index j (n = 1, 2, …, j).
② According to the judgment matrix, the weight coefficient of each index is obtained. Calculate the maximum eigenvalue of the judgment matrix λmax and its corresponding normalized eigenvector W; that is, for the judgment matrix A, the calculation needs to meet A · W = λmax · W and j = 1 n W j = 1 . Where, Wj is the jth component of W, which is equivalent to the weight coefficient of the jth index.
③ Consistency test is performed in order to find out whether the determined weight conforms to the objective reality. The formula is
C I = λ m a x n n 1
C R = C I / R I
where CI is the consistency index, RI is the average random consistency index (see Table 3), CR is the consistency test, and n is the order of the judgment matrix. When CR < 0.1, it is considered that the consistency of the judgment matrix meets the requirements; otherwise, it is necessary to adjust the judgment matrix to meet CR < 0.1.

2.3.4. Spatial Correlation Analysis of Land Ecological Quality Index

Spatial correlation is the correlation between an evaluation unit and its surrounding units in a certain characteristic within a spatial range. Its analysis can be used to characterize the aggregation degree of attribute values of these units [48]. In this study, OpenGeoda software was used to calculate Moran’s I of global spatial autocorrelation and Moran’s Ii of local spatial autocorrelation to analyze the spatial agglomeration characteristics of the land ecological quality index [49].

2.3.5. Diagnosing and Analyzing the Obstacle Factors of Land Ecological Quality

The obstacle factor diagnosis model [11] of land ecological quality in the mining area was established based on the mathematical models of “factor contribution degree” (Ij), “index deviation degree” (Jij), and “obstacle degree” (Mij) (Equation (10)). The limitation degree and spatial difference of each obstacle factor on land ecological quality were evaluated.
M i j = I j × J i j j = 1 P I j × J i j × 100 %
where I j = W j × W k , J i j = 1 b i j ; Jij is the index deviation degree of the jth index in the ith year of the evaluation unit; Mij is the obstacle degree of the jth index in the ith year of the evaluation unit; bij is the standardized value of the jth index in the ith year of the evaluation unit; Wj is the weight of the index layer of the jth index; and Wk is the weight of the criterion layer of the jth index.

3. Results

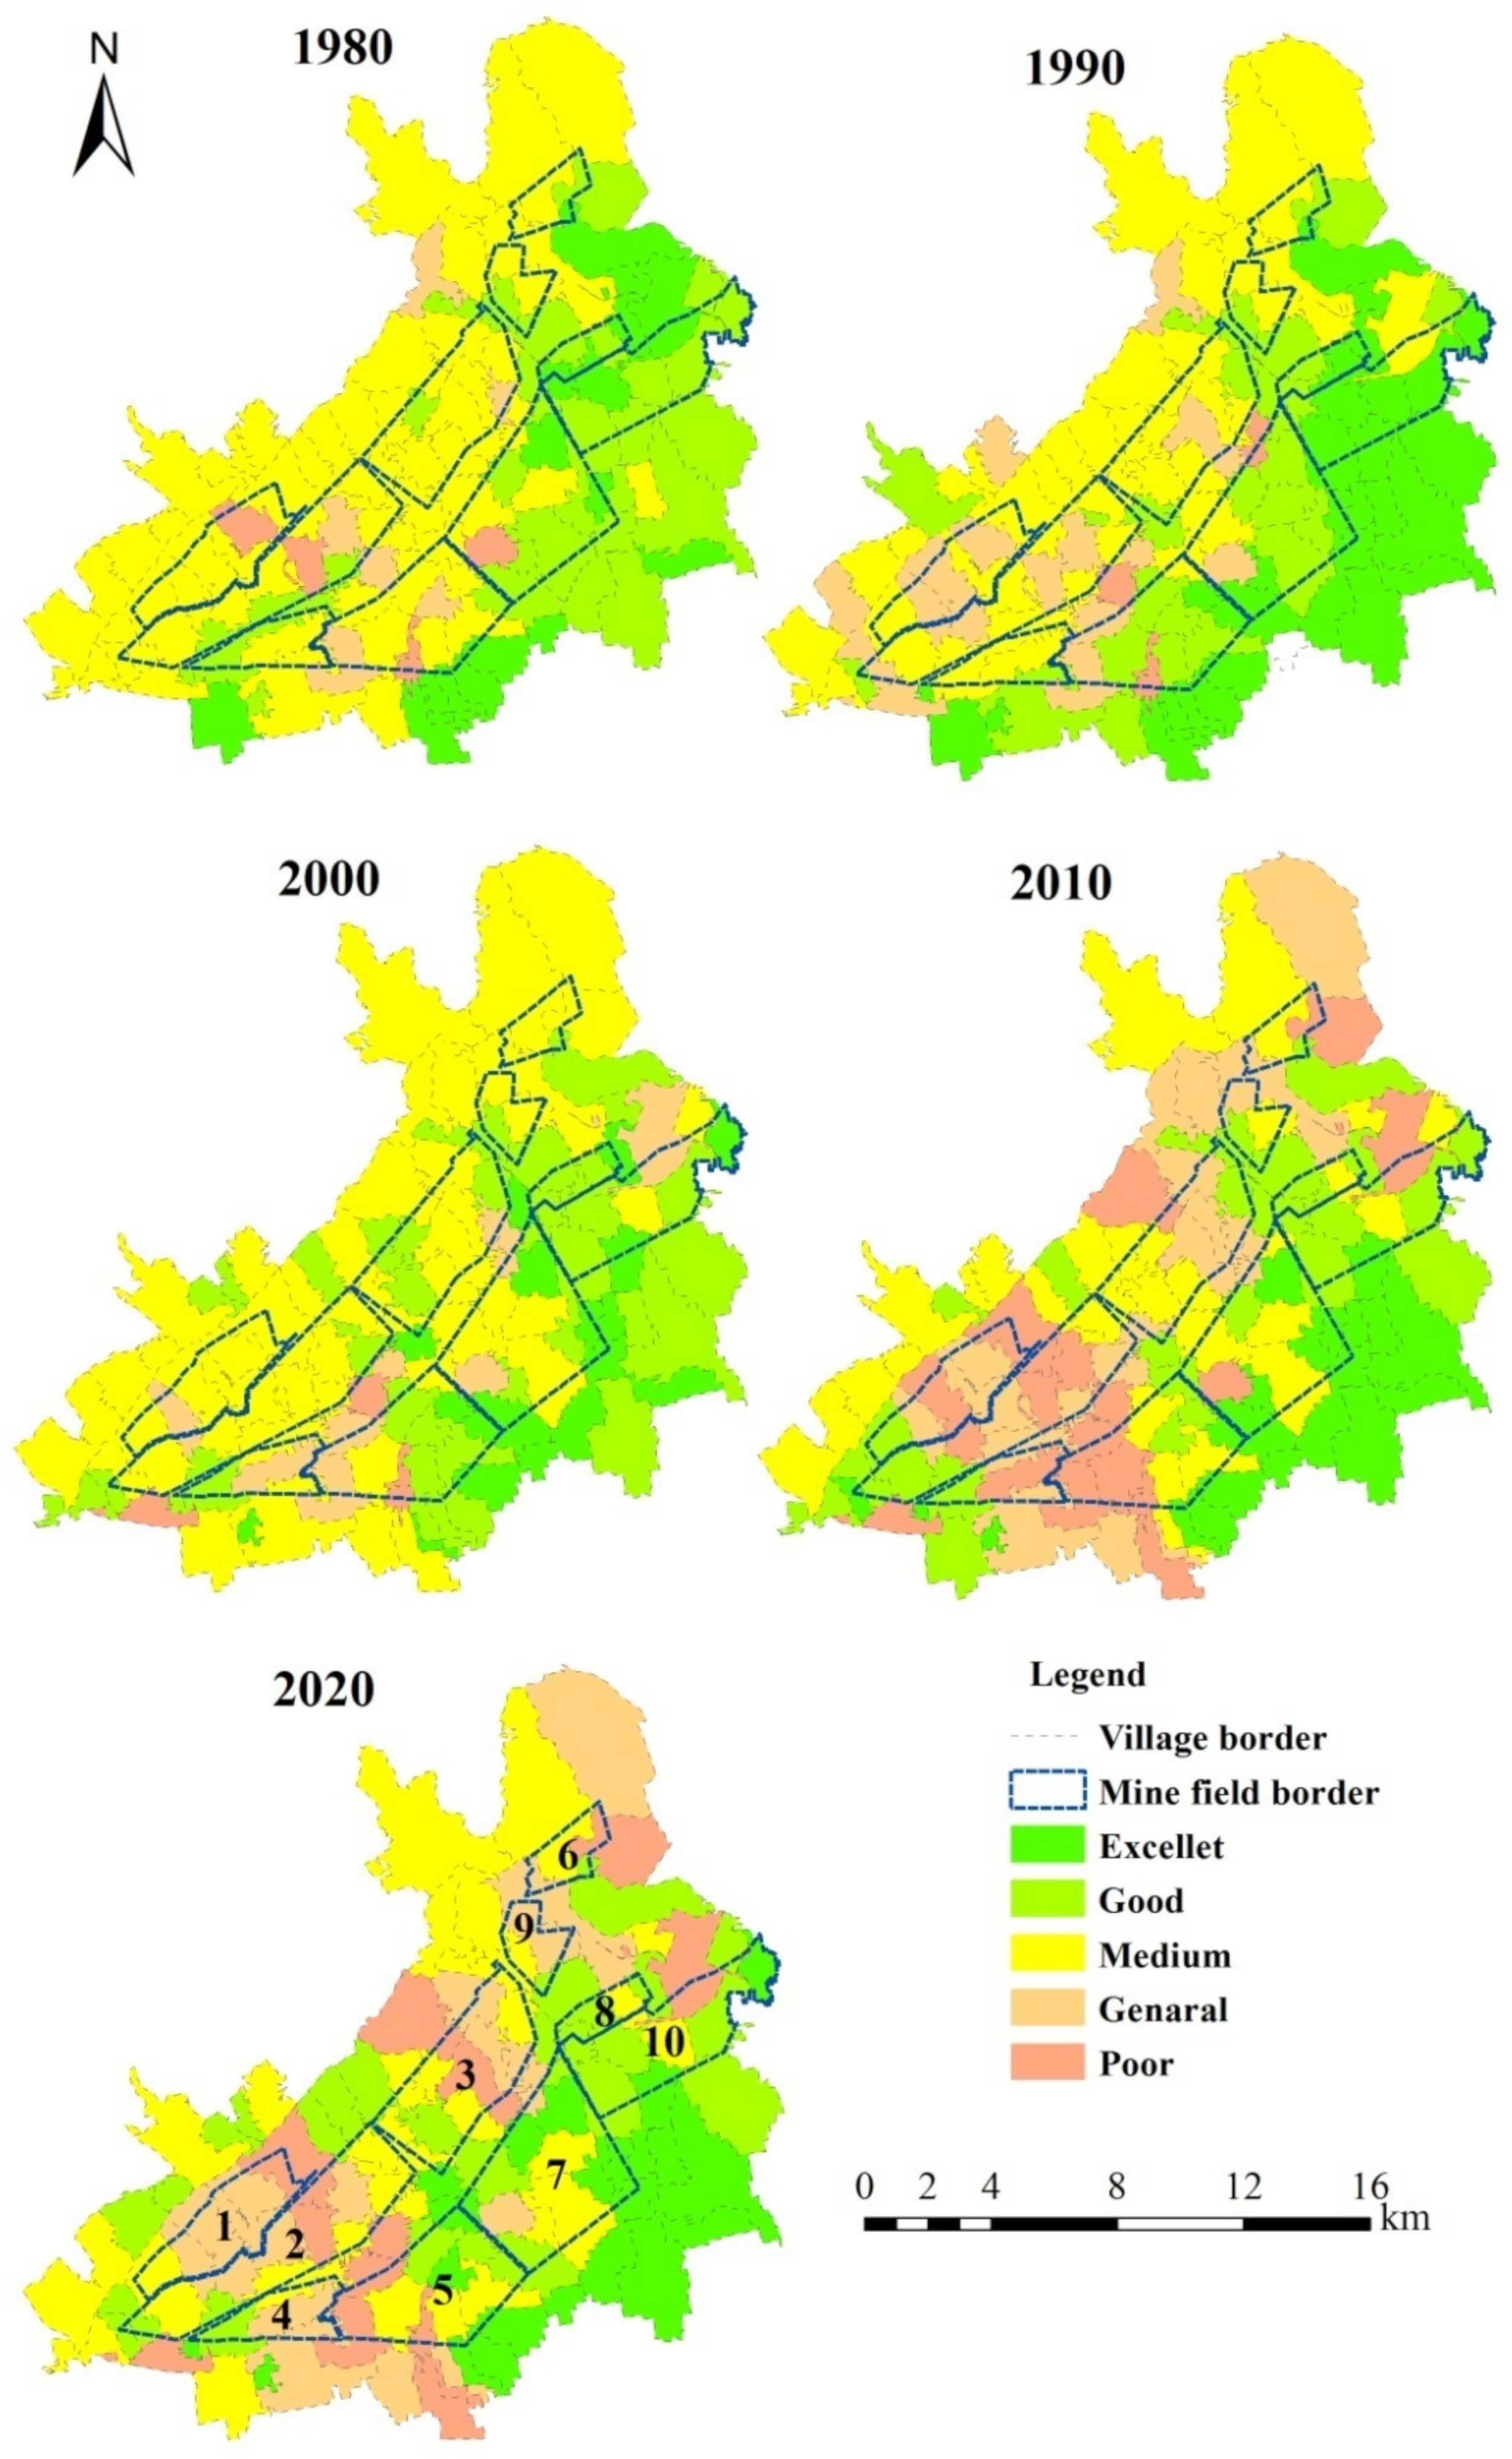
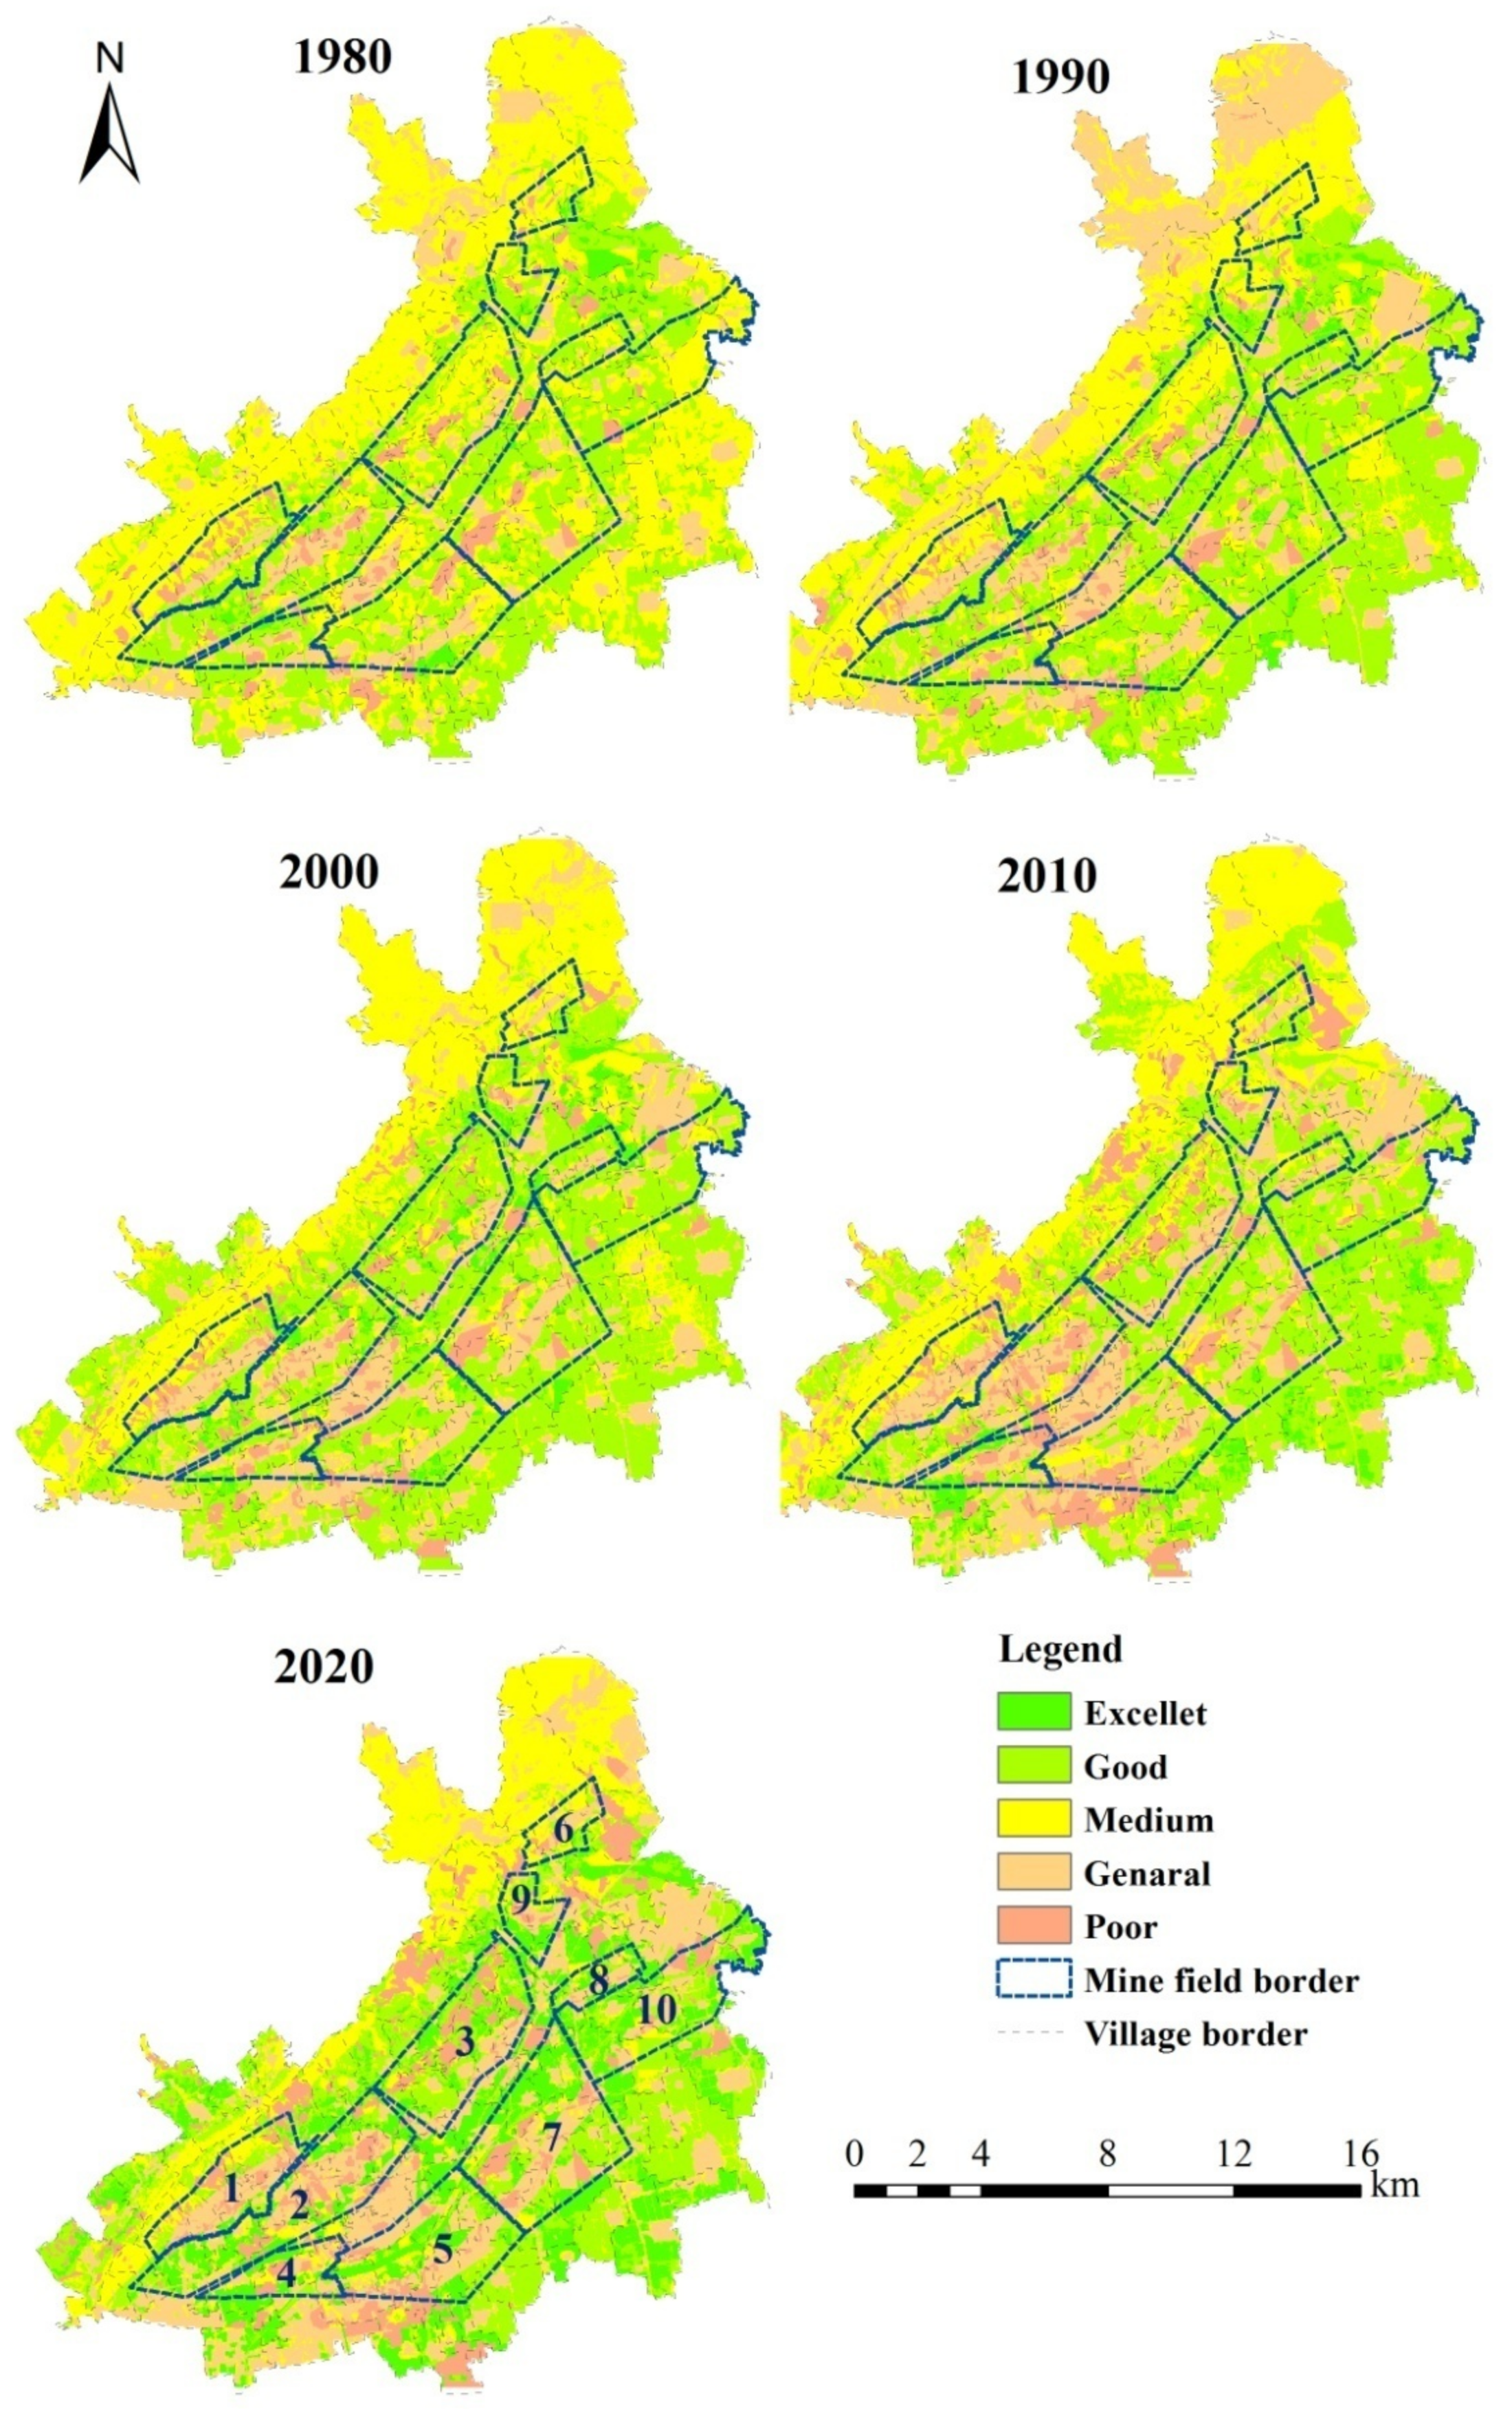
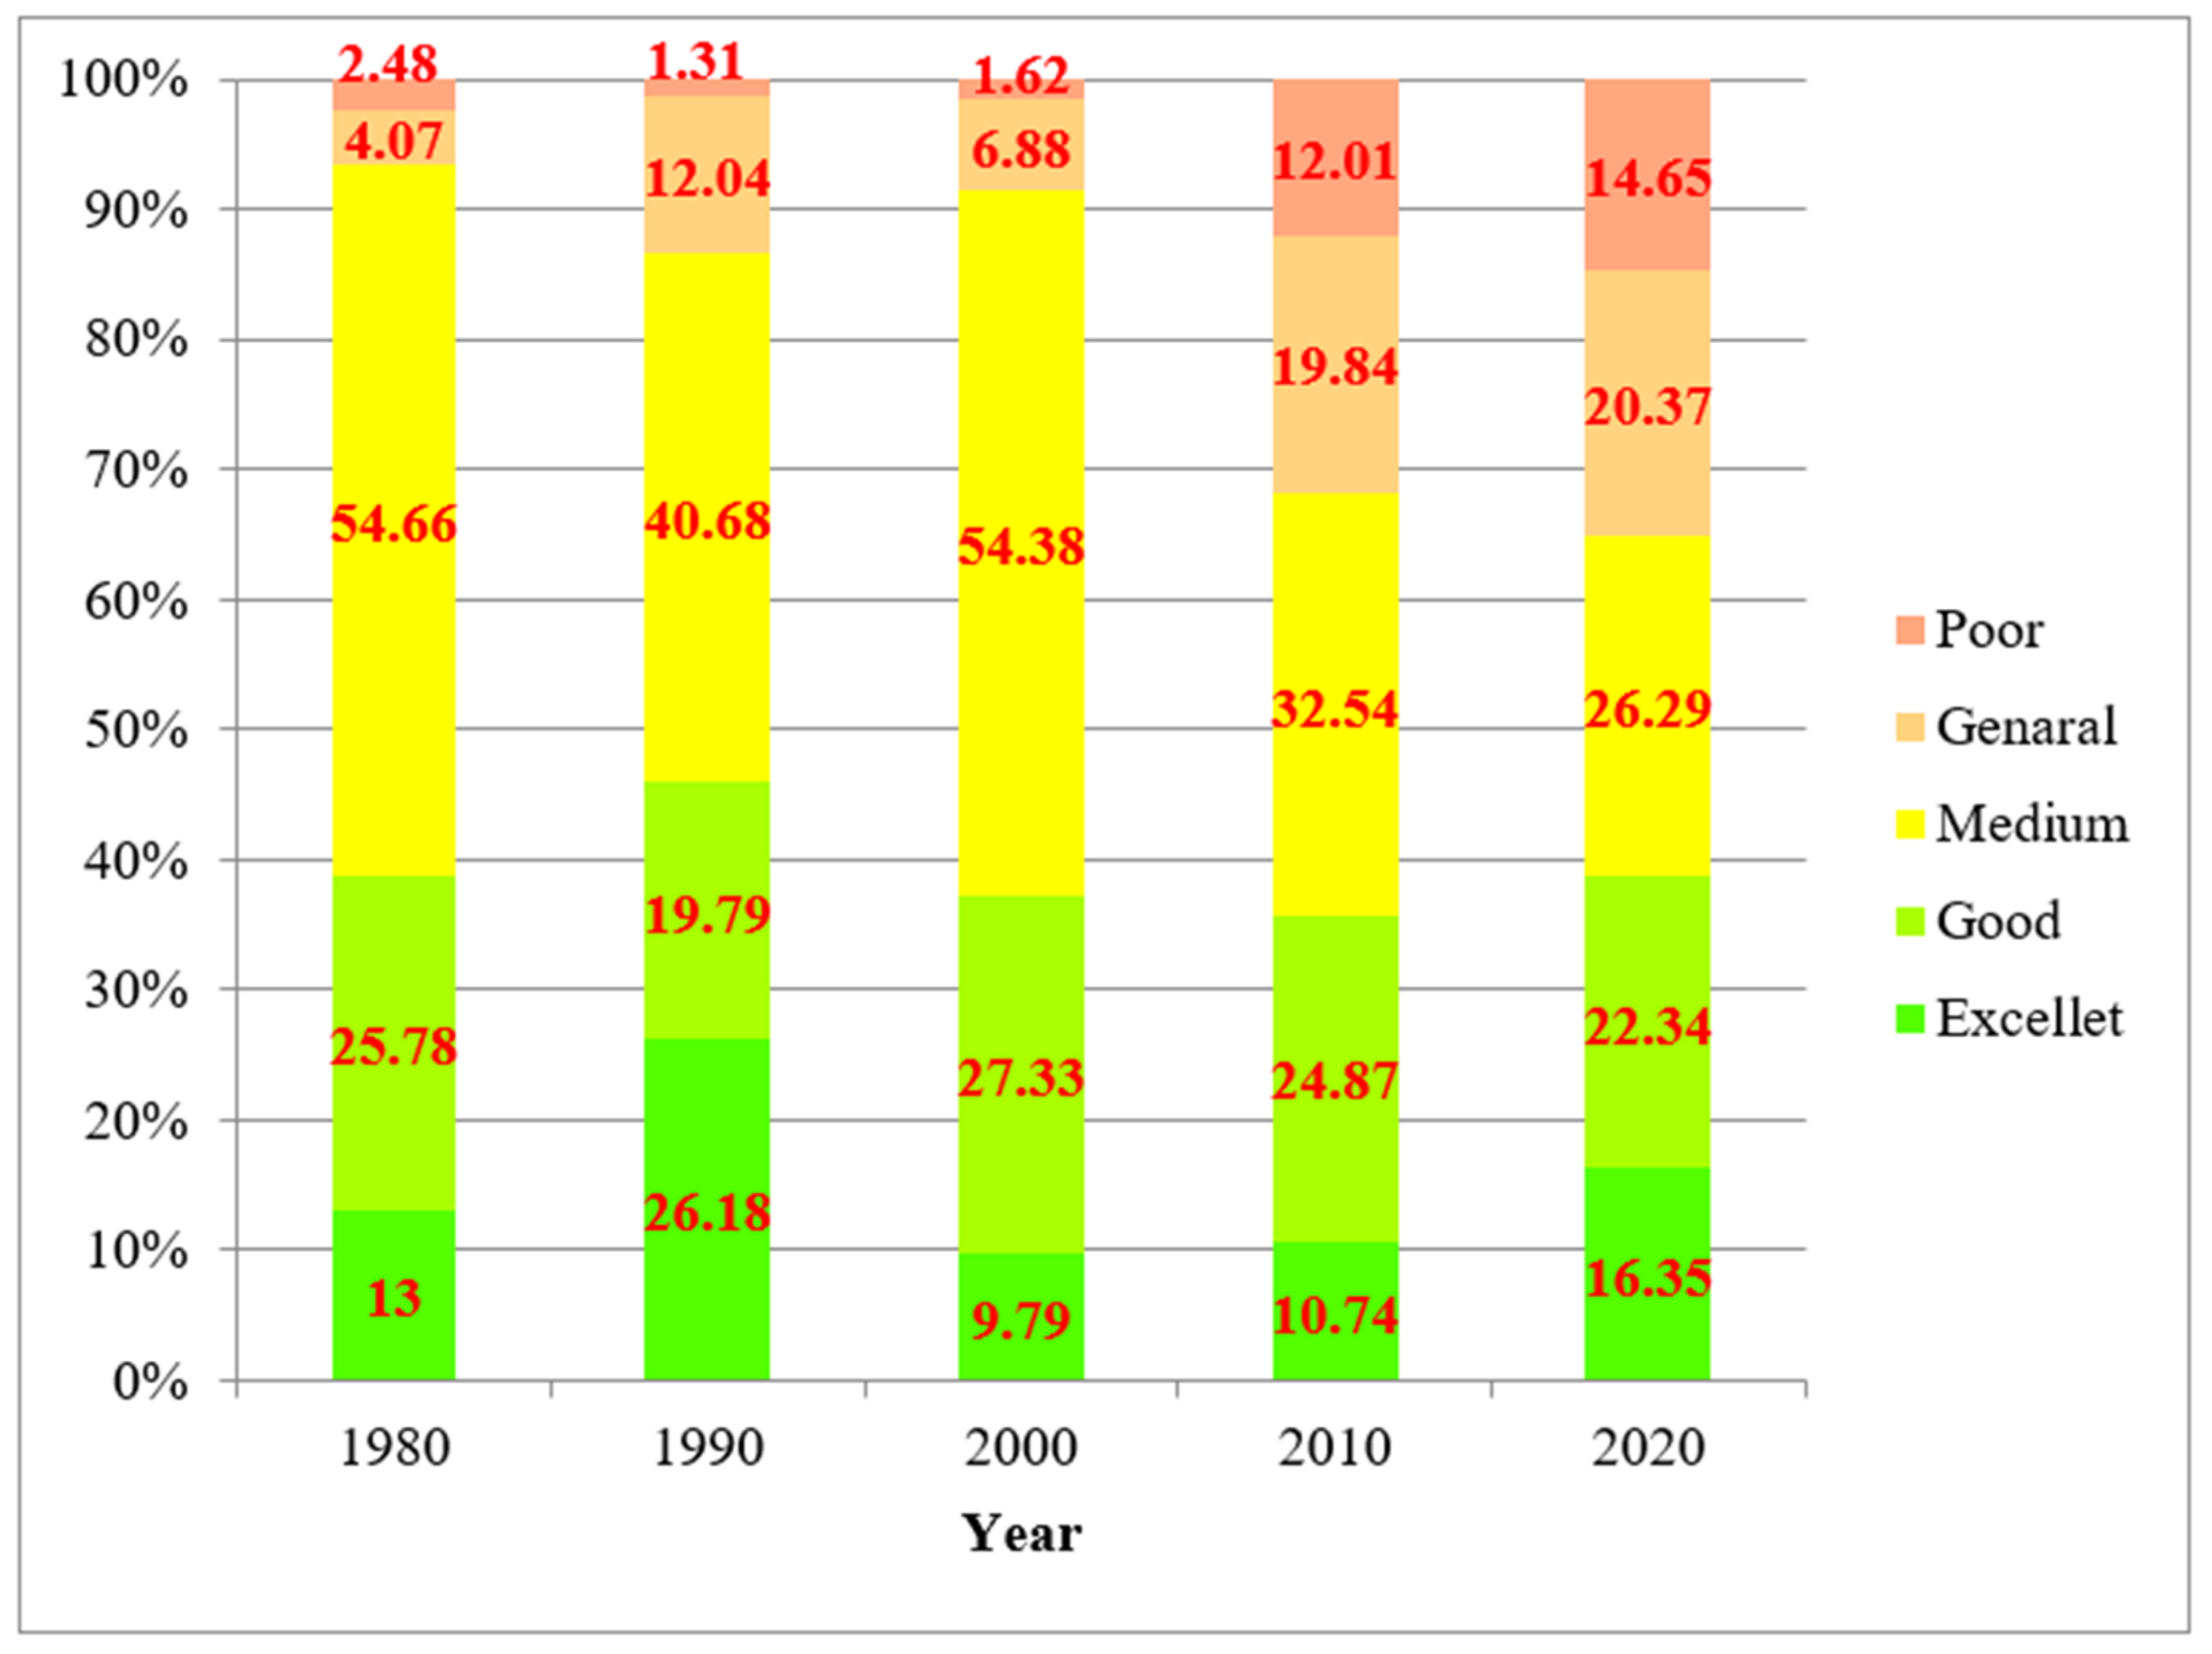
3.1. Spatiotemporal Differentiation of Distribution Characteristics of Land Ecological Quality Grades

The comprehensive evaluation results of village- and grid-level grading are shown in Figure 2 and Figure 3. They had strong consistency in the spatial distribution of different levels but differed in local details. The mean value of the grid evaluation results on the village-level grading was analyzed, and a correlation analysis was made between the results and the village-level grading results. The evaluation results of each period had significant correlation, with correlation coefficients greater than 0.91, indicating that there is a good agreement between grid- and village-level grading results. The evaluation result of grid-level grading can refine the village-level grading result. In other words, as a beneficial supplement to the evaluation result of village-level units, it can provide more detailed basic data and basis for land ecological management and control at the village level.
The village-level unit is the smallest unit of administration. It has similarities with other units of administration but also has certain independence in terms of land use and management mode. It thus can be regarded as an independent unit for land use, management, and control. The village-level unit not only facilitates the implementation of land ecological control from the perspective of land management but also has a certain degree of refinement. Since the spatiotemporal differentiation of land ecological quality is more practically significant at the village level, the subsequent correlation analysis of land ecological quality is mainly conducted at the village level.
The evaluation results showed that there were five grades of land ecological quality (poor, general, medium, good, and excellent) in all five periods. As presented in Figure 4, from 1980 to 2020, under the dual pressure of mining activities and urbanization, the overall level of land ecological quality in the study area was not high. The assessment units with medium land ecological quality in each period accounted for the largest proportion, mainly distributed in the mountainous and hilly areas in the north and west of the study area (Figure 2 and Figure 3).The area with excellent and good land ecological quality accounts for about 38% (Figure 4), which is basically stable and mainly distributed in the Northeast Plain mine agricultural complex area with short mining time (Figure 2 and Figure 3).The proportion of general and poor-grade areas significantly increased from 6.55% to 35.02% (Figure 4). The increased areas were mainly distributed in the mine and southern urbanization area (Figure 2 and Figure 3). The proportion of the medium-grade area showed a significant downward trend, from 54.66% to 26.29% (Figure 4). The overall characteristics of the grid scale are consistent.

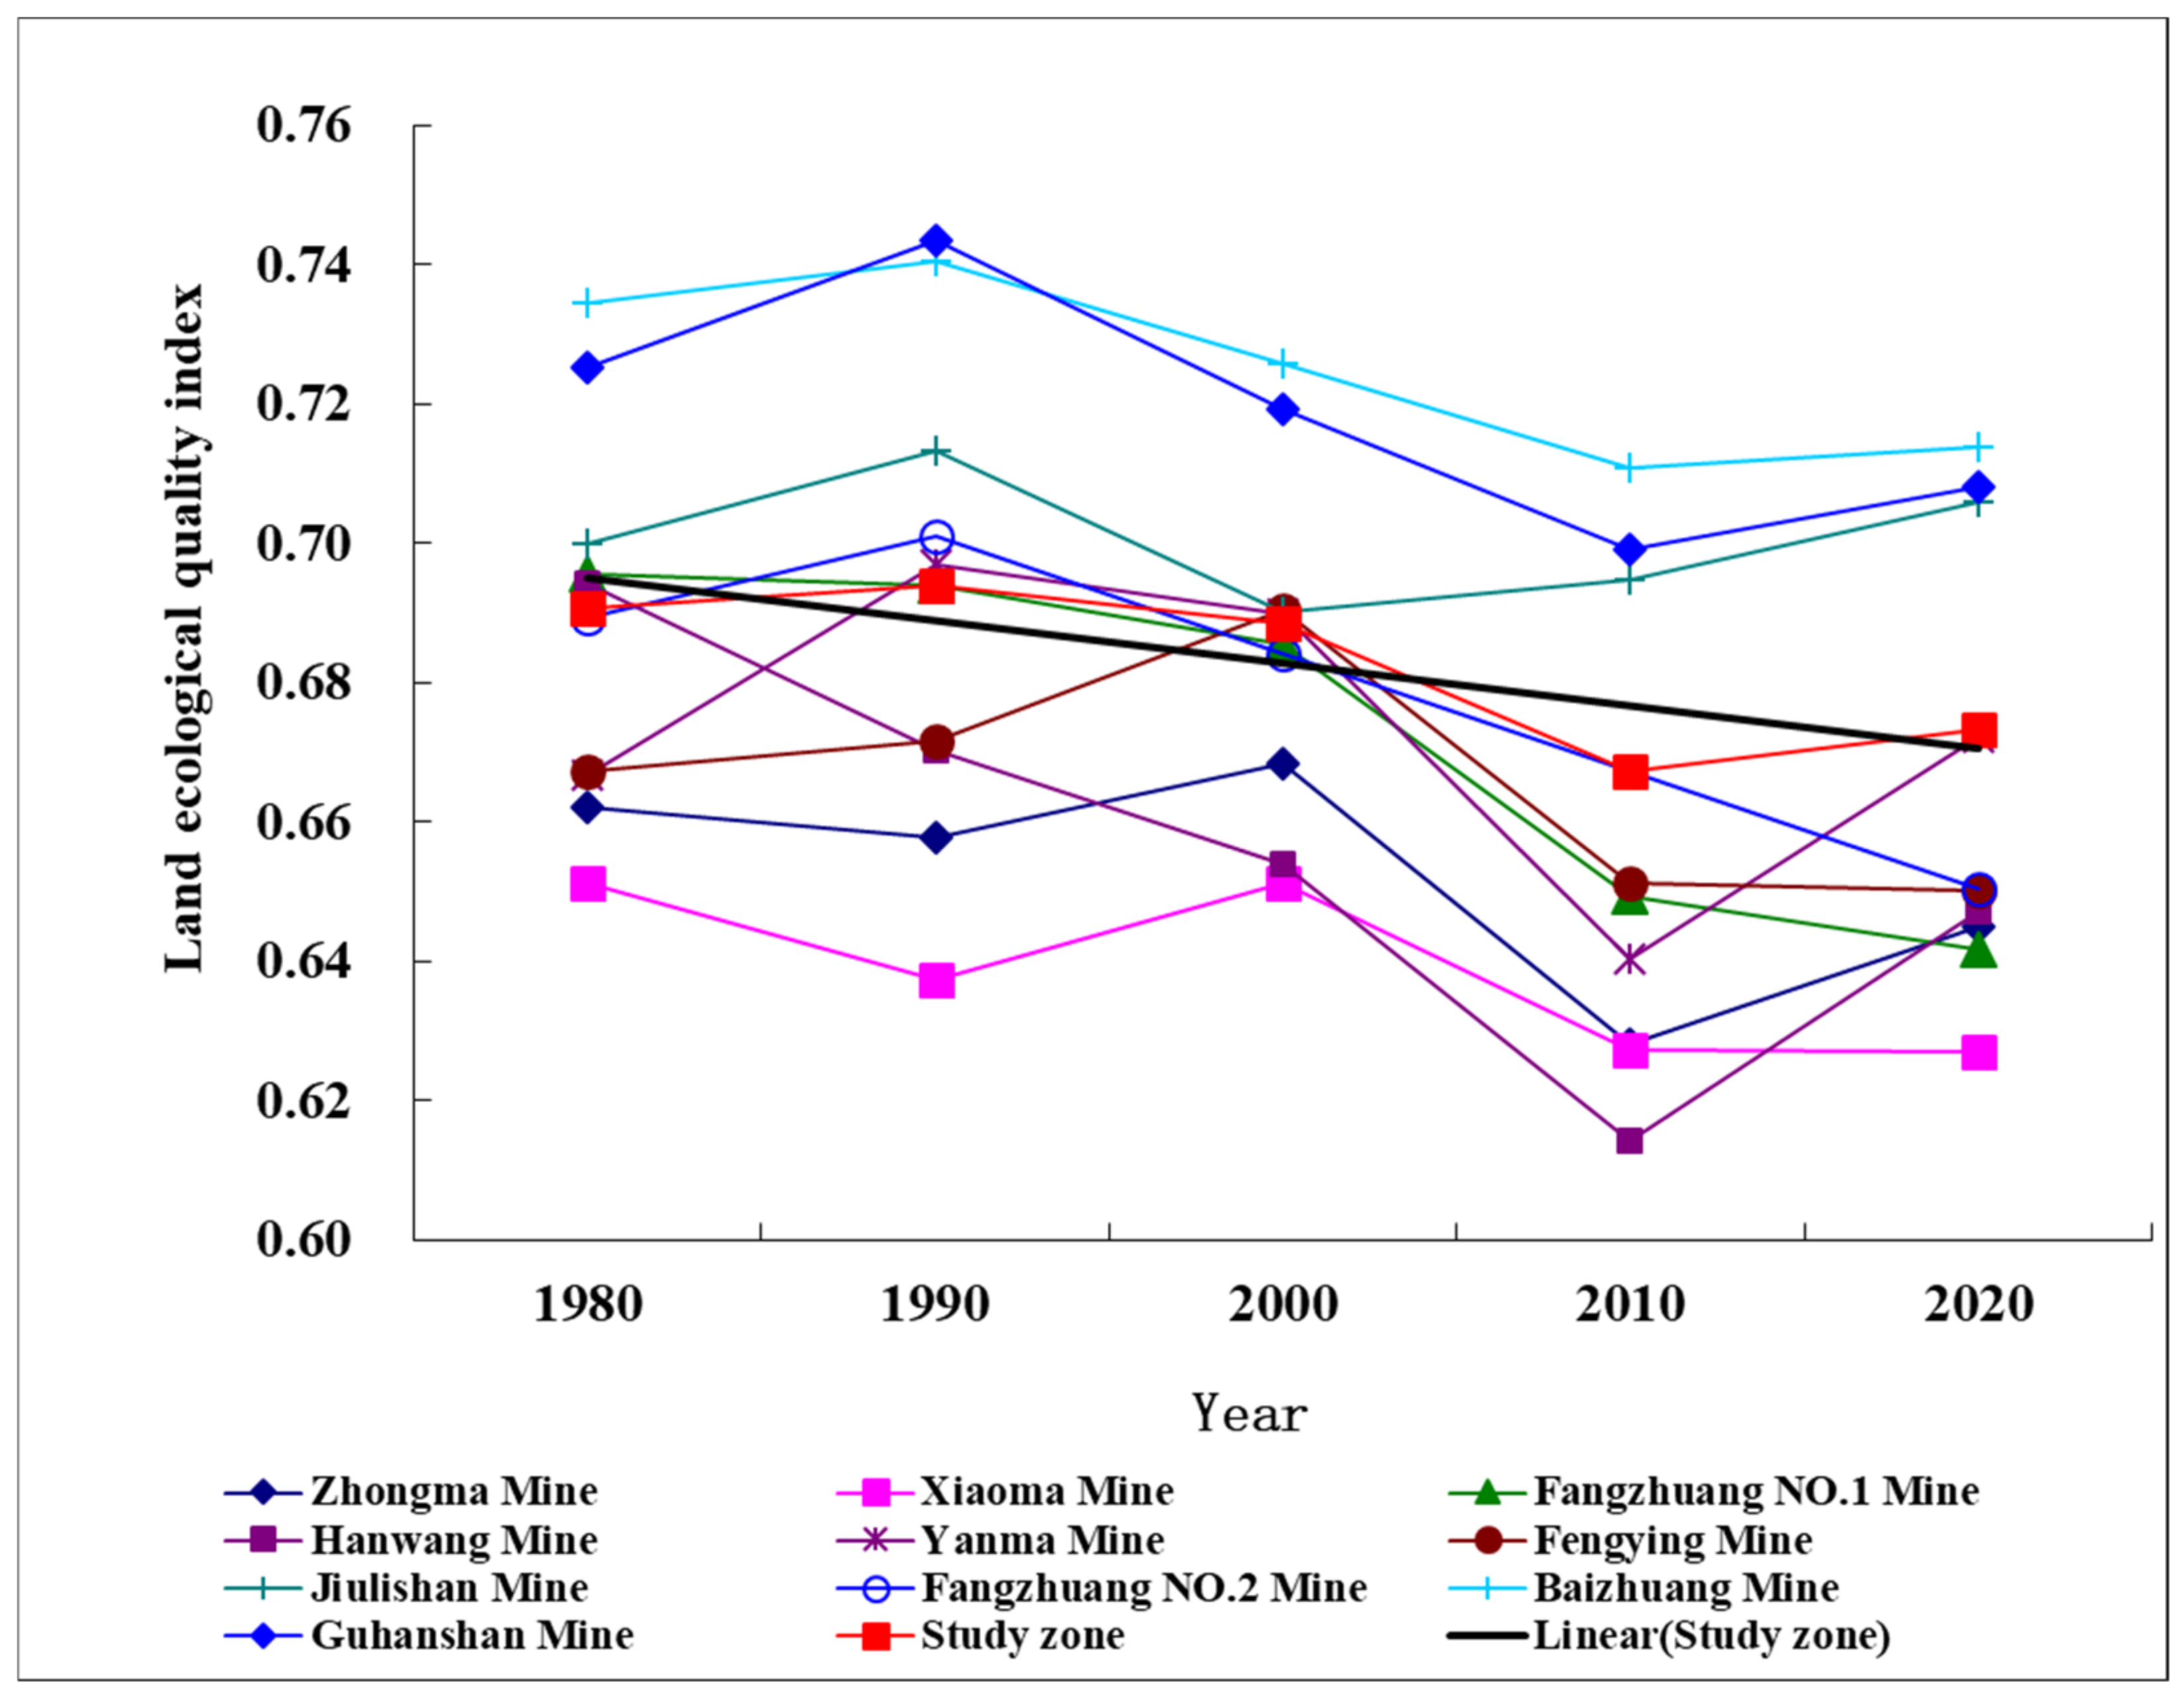
3.2. Analysis on the Change of Average Land Ecological Quality Index in the Study Zone and Various Mining Fields

For the ease of analysis of the regional land ecological quality change from a macro perspective, it is necessary to analyze the land ecological quality index of the study zone as a whole and the scope of each minefield as a whole. In this study, the boundary polygons and boundaries of each minefield were taken as statistical areas, and the land ecological quality indexes of the study zone and each mine in five periods were obtained through the spatial statistics method (Figure 5).
From Figure 5, from1980 to 2020, the average land ecological quality index of the study area and each mine is between 0.6141 and 0.7435, showing certain volatility on the whole. The average land ecological index in the study area was 0.6906 in 1980, 0.6940 in 1990, and 0.6884 in 2000, which remained basically stable during the period. From 2000 to 2010, the land ecological quality index decreased to 0.6673, showing a significant decline. From 2010 to 2020, it increased to 0.6733, and from 1980 to 2000, it showed a downward trend.
The average land ecological quality index and its change law are different in different mines in different periods. The average land ecological quality index of the mines in the hilly area (the Xiaoma Mine, Zhongma Mine, Fengying Mine, and FangzhuangNo.1Mine) with a long mining time and near the built-up area in the southern plain (the Hanwang Mine and Yanma Mine) is between 0.6141 and 0.6969, which is lower than that of the mines in the plain area (the Baizhuang Mine, Jiulishan Mine, and Guhanshan Mine) with a short mining time in the same period. The average land ecological quality index is between 0.6902 and 0.7435. The average land ecological index of the Guhanshan Mine was the highest in 1990. The mine is located in the plain farmland area. The mining started in 2004. Among the mines, the Hanwang Mine in 2010 is the latest and the lowest. Part of the mine has become a built-up area of Jiaozuo City in 2010. From 1980 to 2000 and 2020, the average land ecological index of the Xiaoma Mine was the lowest. It is located in the hilly area, with poor land ecological basic conditions and long mining time. In 1980 and 2000–2020, the average land ecological index of the Baizhuang Mine, which is located in the plain area, was the highest. The mining time is late, and the design production capacity of the mine is low. The land use in the area is basically stable. The Hanwang Mine has the largest change in the average land ecological index. Its land ecological index has continuously decreased from 0.6943 in 1980 to 0.6141 in 2010, with a decrease of 11.56%. From 2010 to 2020, with the water diversion from the south to north in the region, its land ecological index increased to 0.6472.

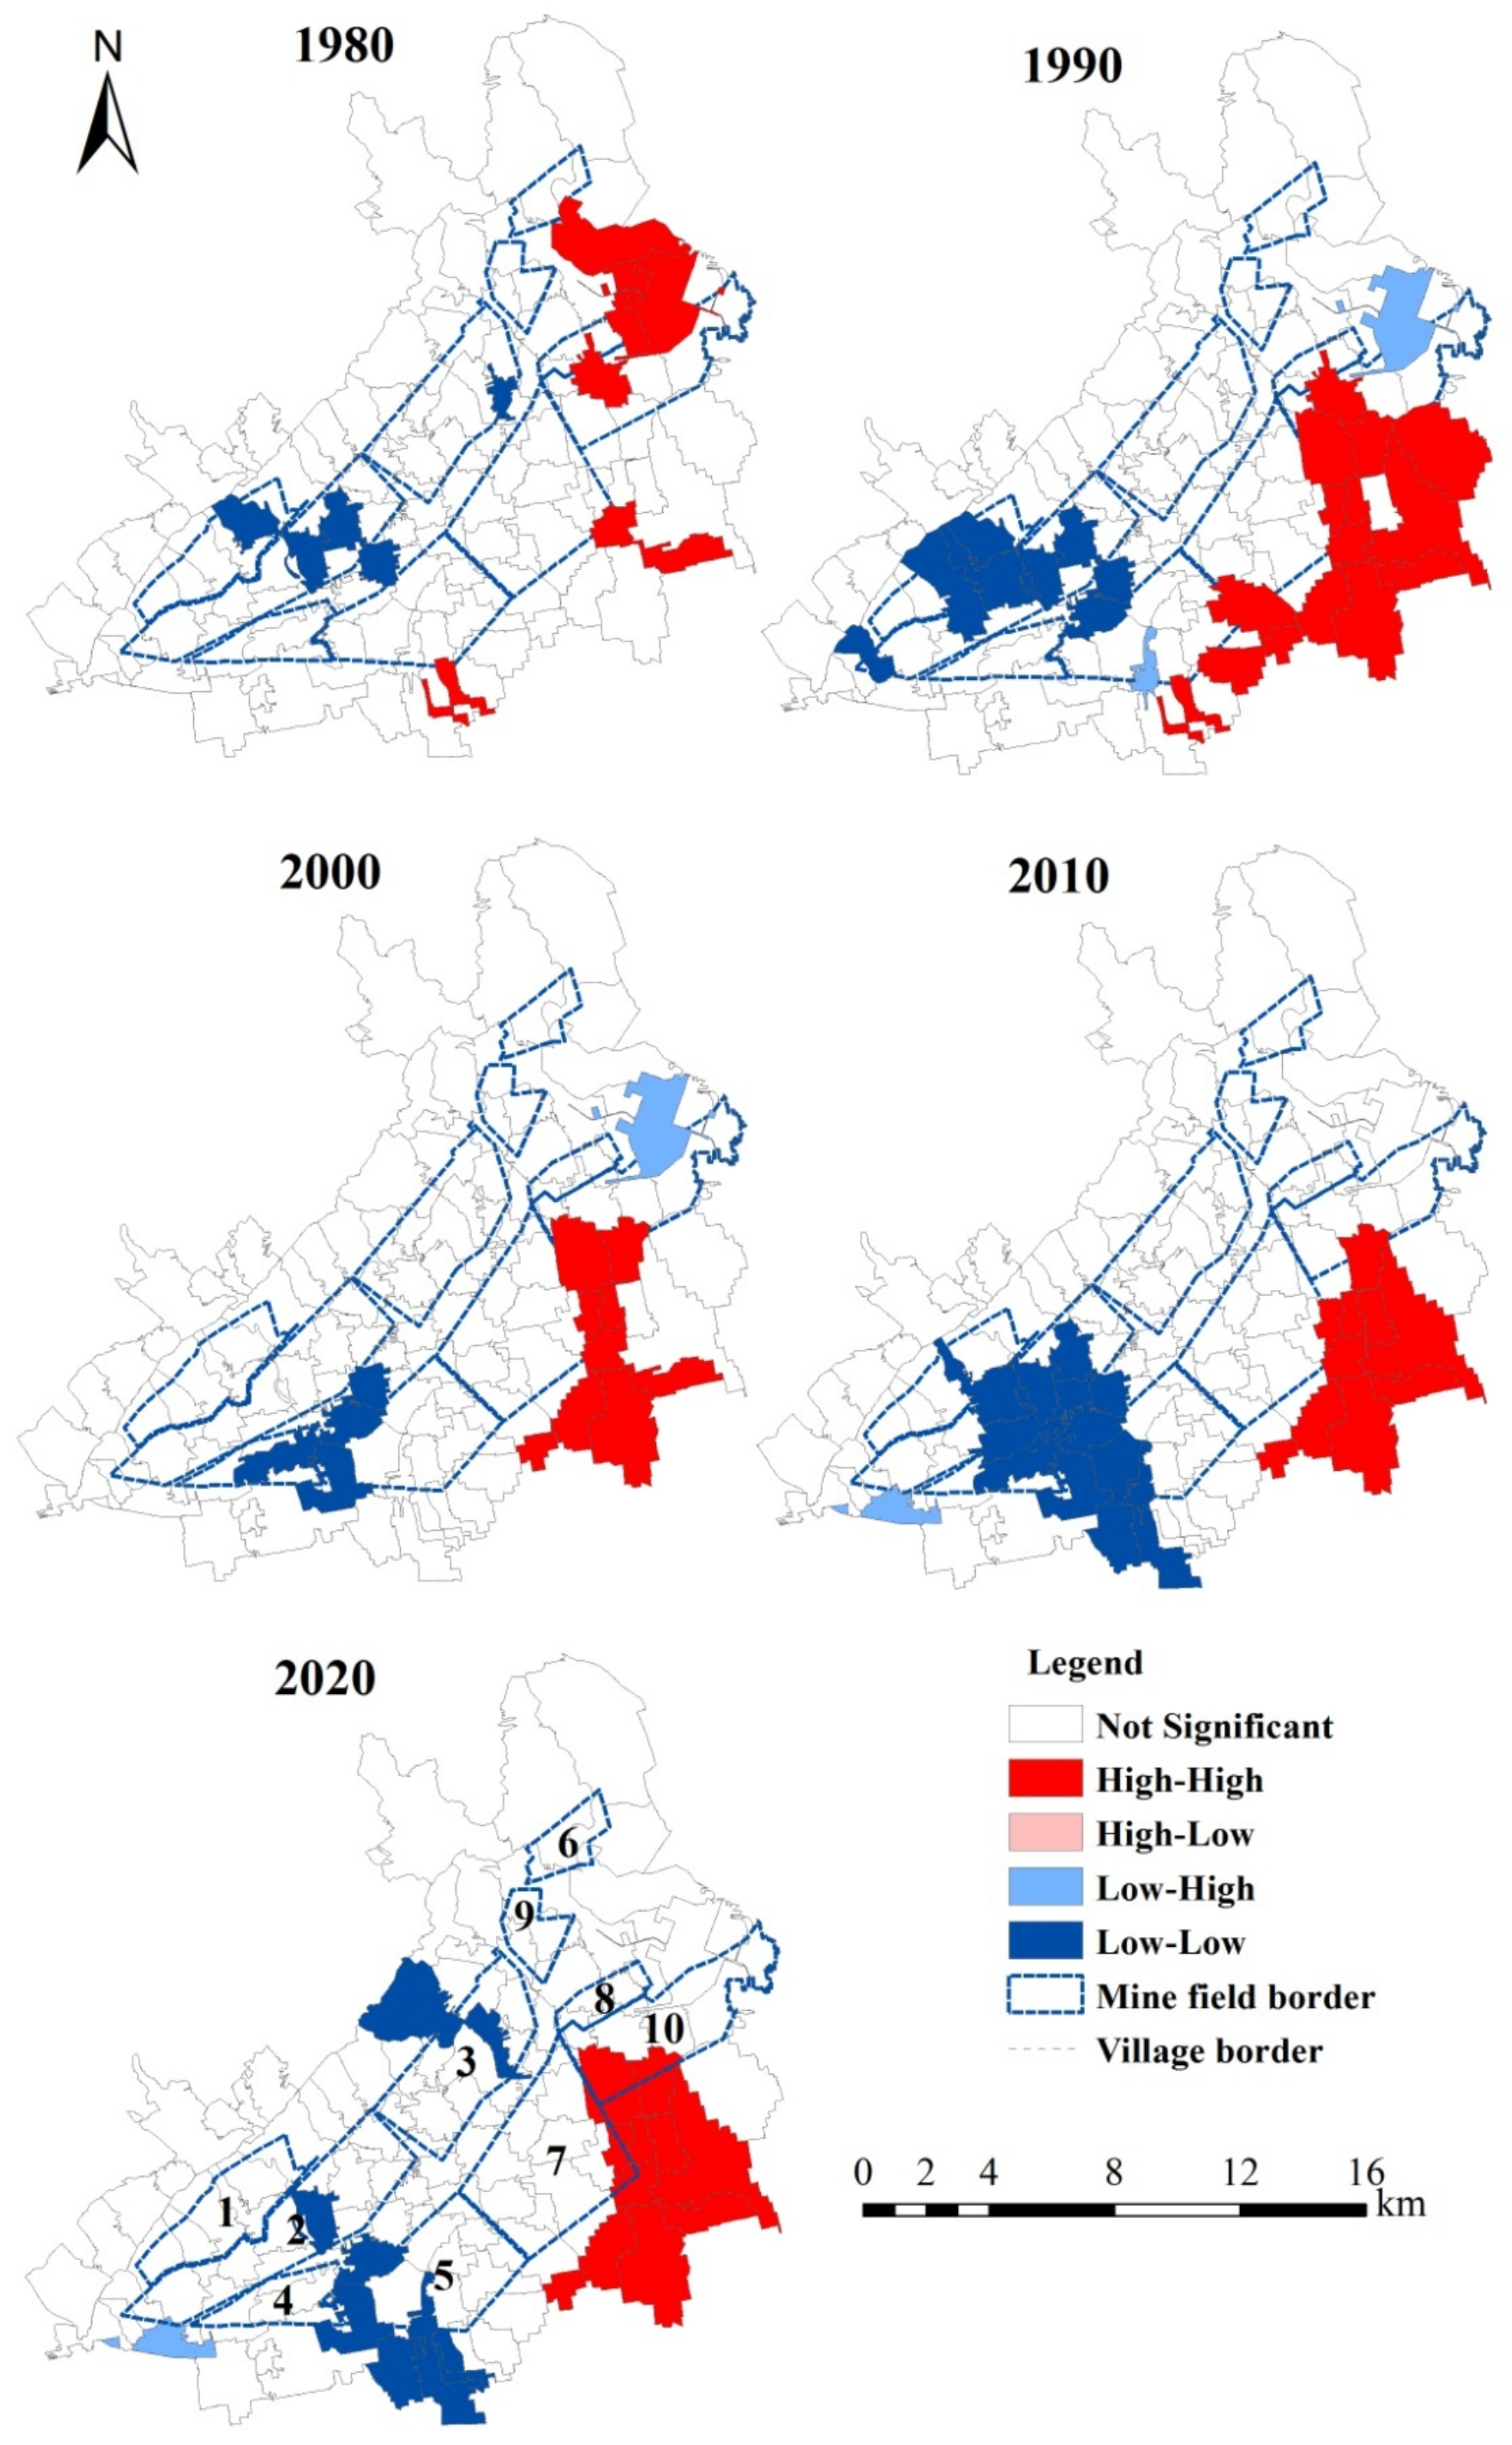
3.3. Spatiotemporal Differentiation of the Correlation Characteristics of Land Ecological Quality

According to the spatial autocorrelation analysis of the land ecological quality index from 1980 to 2020 (Table 4), the land ecological quality index of each period showed significant positive spatial correlations, indicating that the land ecological quality index has strong spatial agglomeration characteristics. In terms of time series, the agglomeration of the regional land ecological quality index has a process of basically stable-weakening-strengthening-weakening.
According to the results of local autocorrelation analysis, the spatial agglomeration map of the land ecological quality index of five periods was obtained (LISA agglomeration map, Figure 6). From 1980 to 2020, the spatial agglomeration of the land ecological index in the study zone changed to some extent. On the whole, there is a spatial aggregation differentiation characteristic: low-value aggregation areas are distributed in the southwest area near the southern part of the study zone (urban build-up area) and with long mining history, while high-value aggregation areas are in the eastern farmland area.
In 1980, the low-value aggregation areas were in the south-central region, where the Xiaoma Mine, Zhongma Mine, and Yanma Mine were all mines with long mining history. The high-value aggregation areas were distributed in the northeast. The construction of mines in the area has not started yet, and there are many woodlands and water areas in the area. In 1990, the low-value aggregation areas were still located in the south-central area rich in coal mines, while the high-value aggregation areas moved from the northeast to eastern farmland area. From 1980 to 1990, a large-scale factory was built in the northeast of the study area, which converted part of the cultivated and forest land into construction land with low ecological function. Compared with 1990, the number of high-value aggregation areas decreased in 2000, and the low-value aggregation areas moved to the southern part with rapid urbanization. In 2010, low-value aggregation areas increased in the south, while high-value aggregation areas remained in the east where the farmland was concentrated. In 2020, low-value aggregation areas remained stable. With the water flow of the South-to-North Water Transfer River in the study area [], the range of low-value accumulation areas has decreased. The low-high and high-low types of the land ecological quality index in five periods were only sporadically distributed in the surrounding areas with high and low values, covering a limited number and a small area of evaluation units.
In general, the high-value aggregation areas of the land ecological quality index from 1980 to 2020 are distributed near the farmland areas in the northeast with relatively short coal mining history, less construction land, and better ecological foundation, while the low-value aggregation areas are mainly located in the southwest with long coal mining history and the southeast with gradually expanding urbanization.

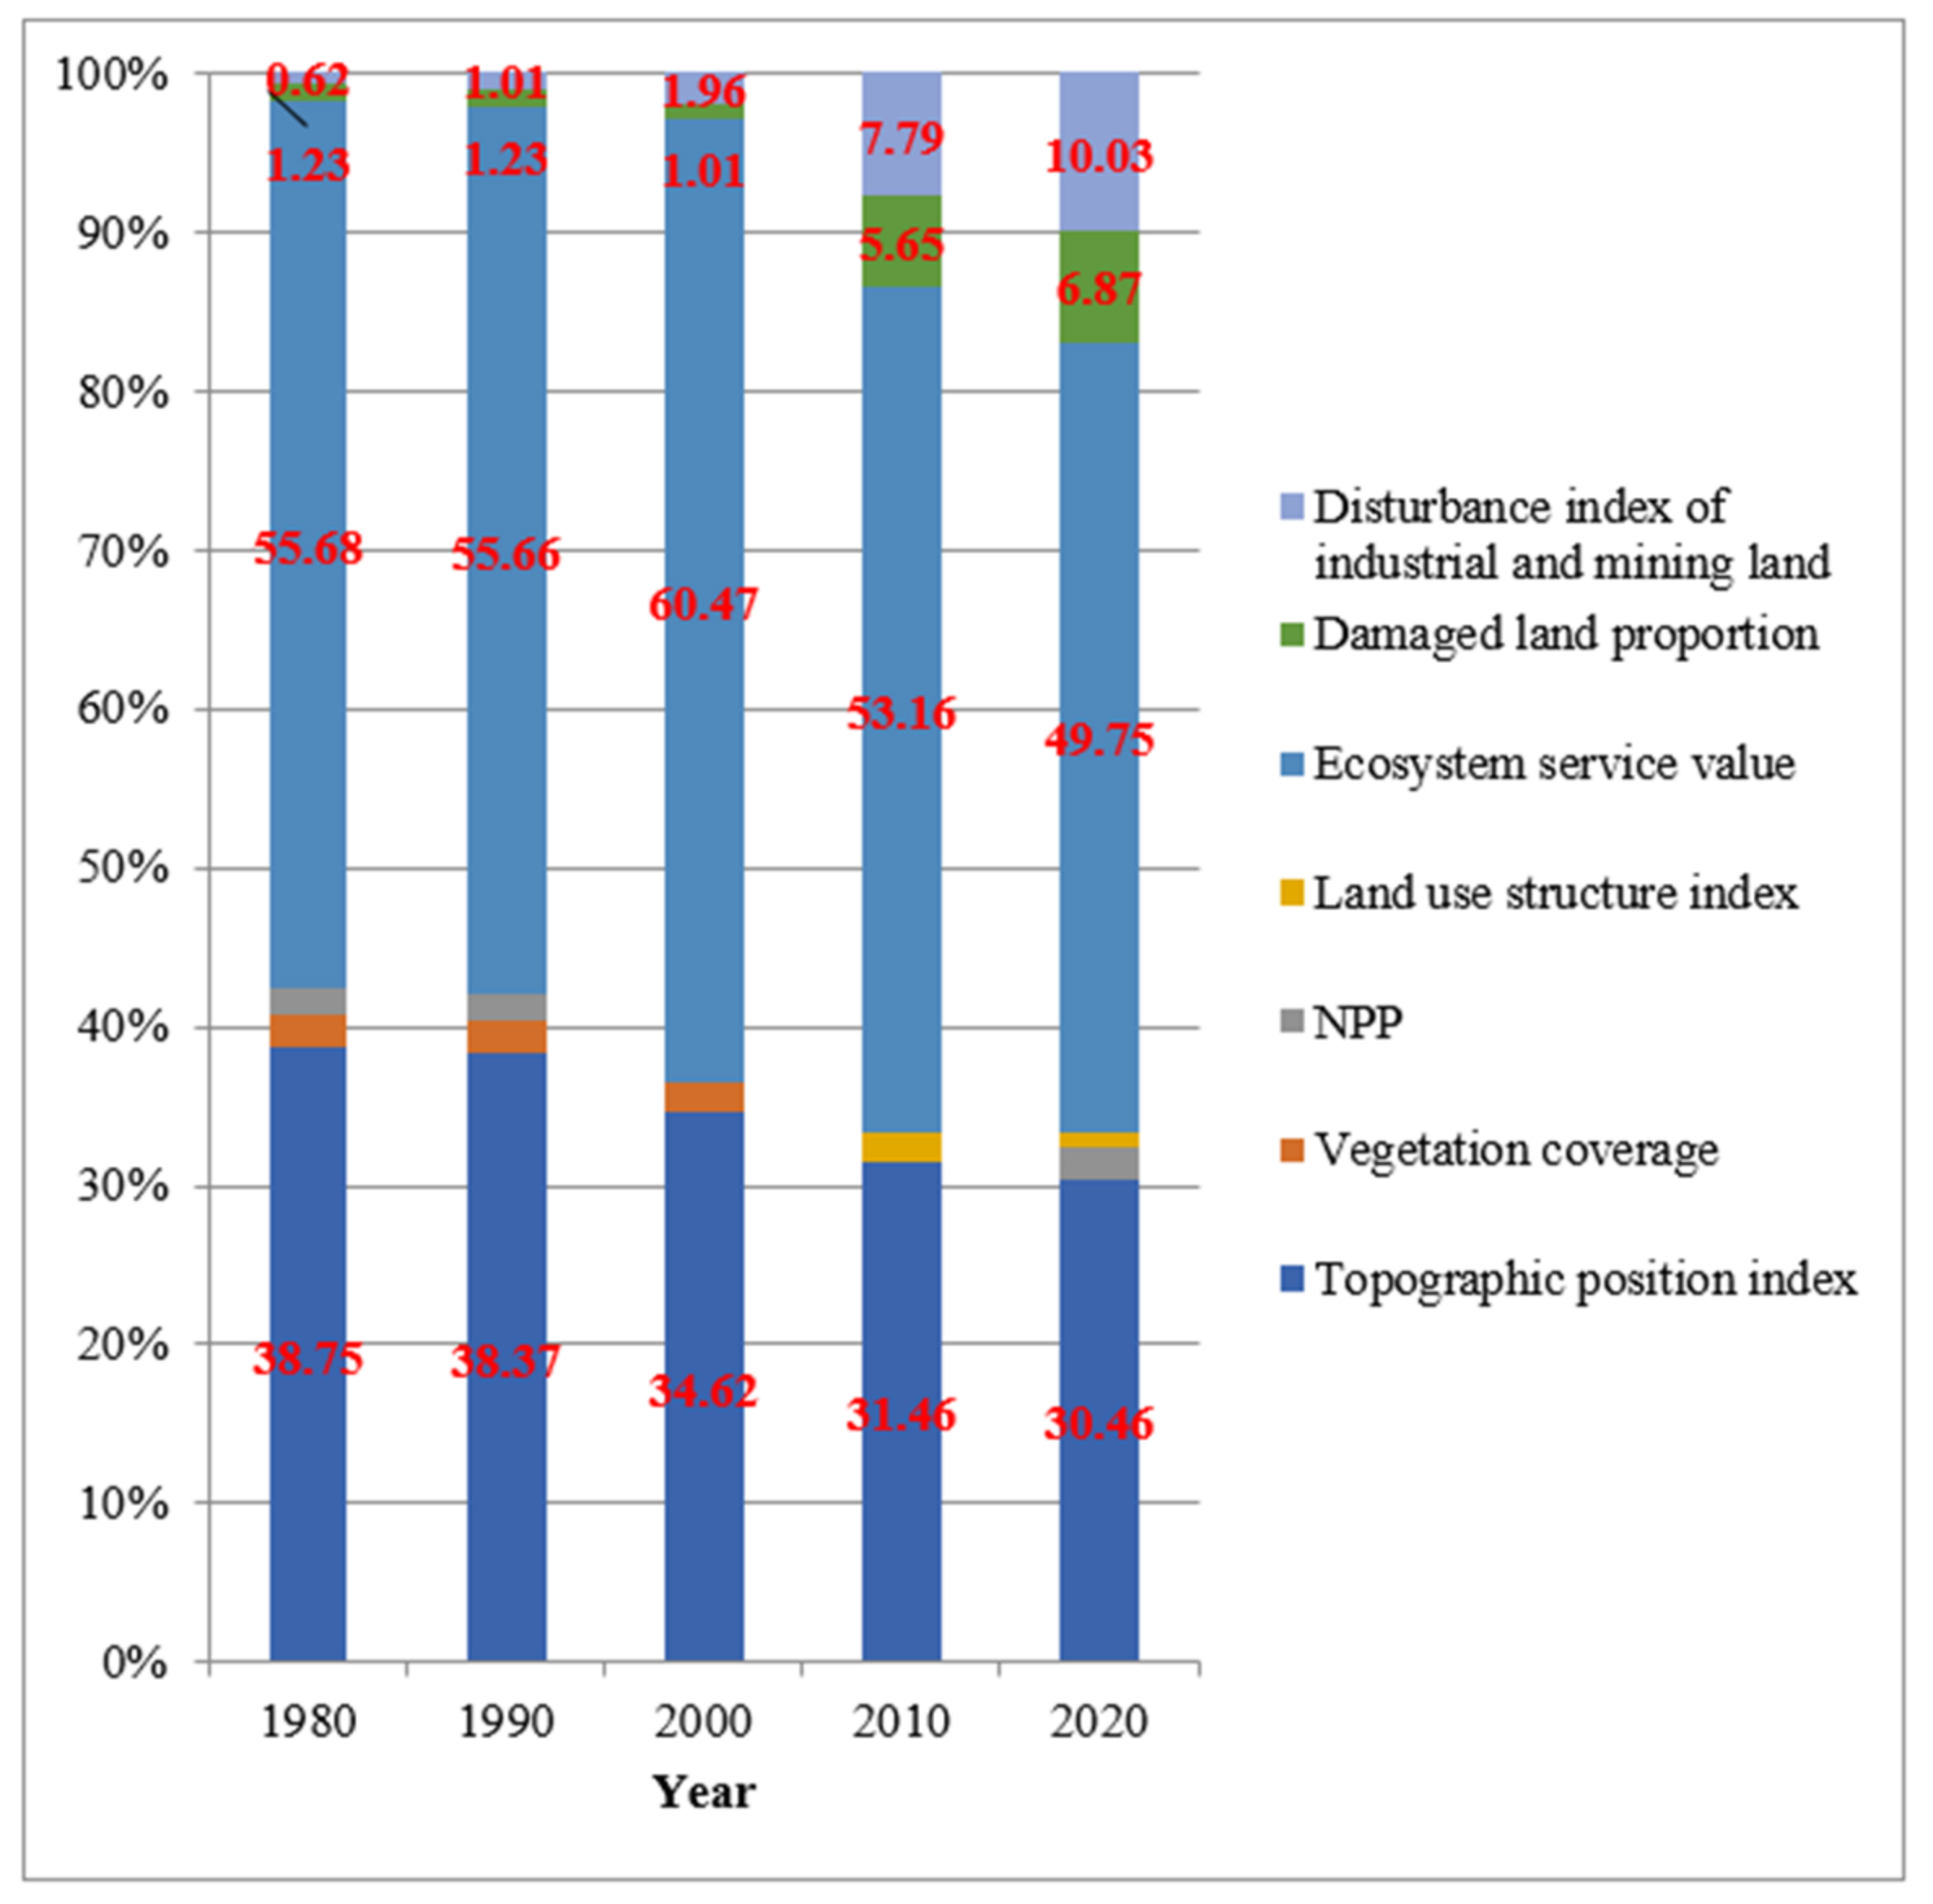
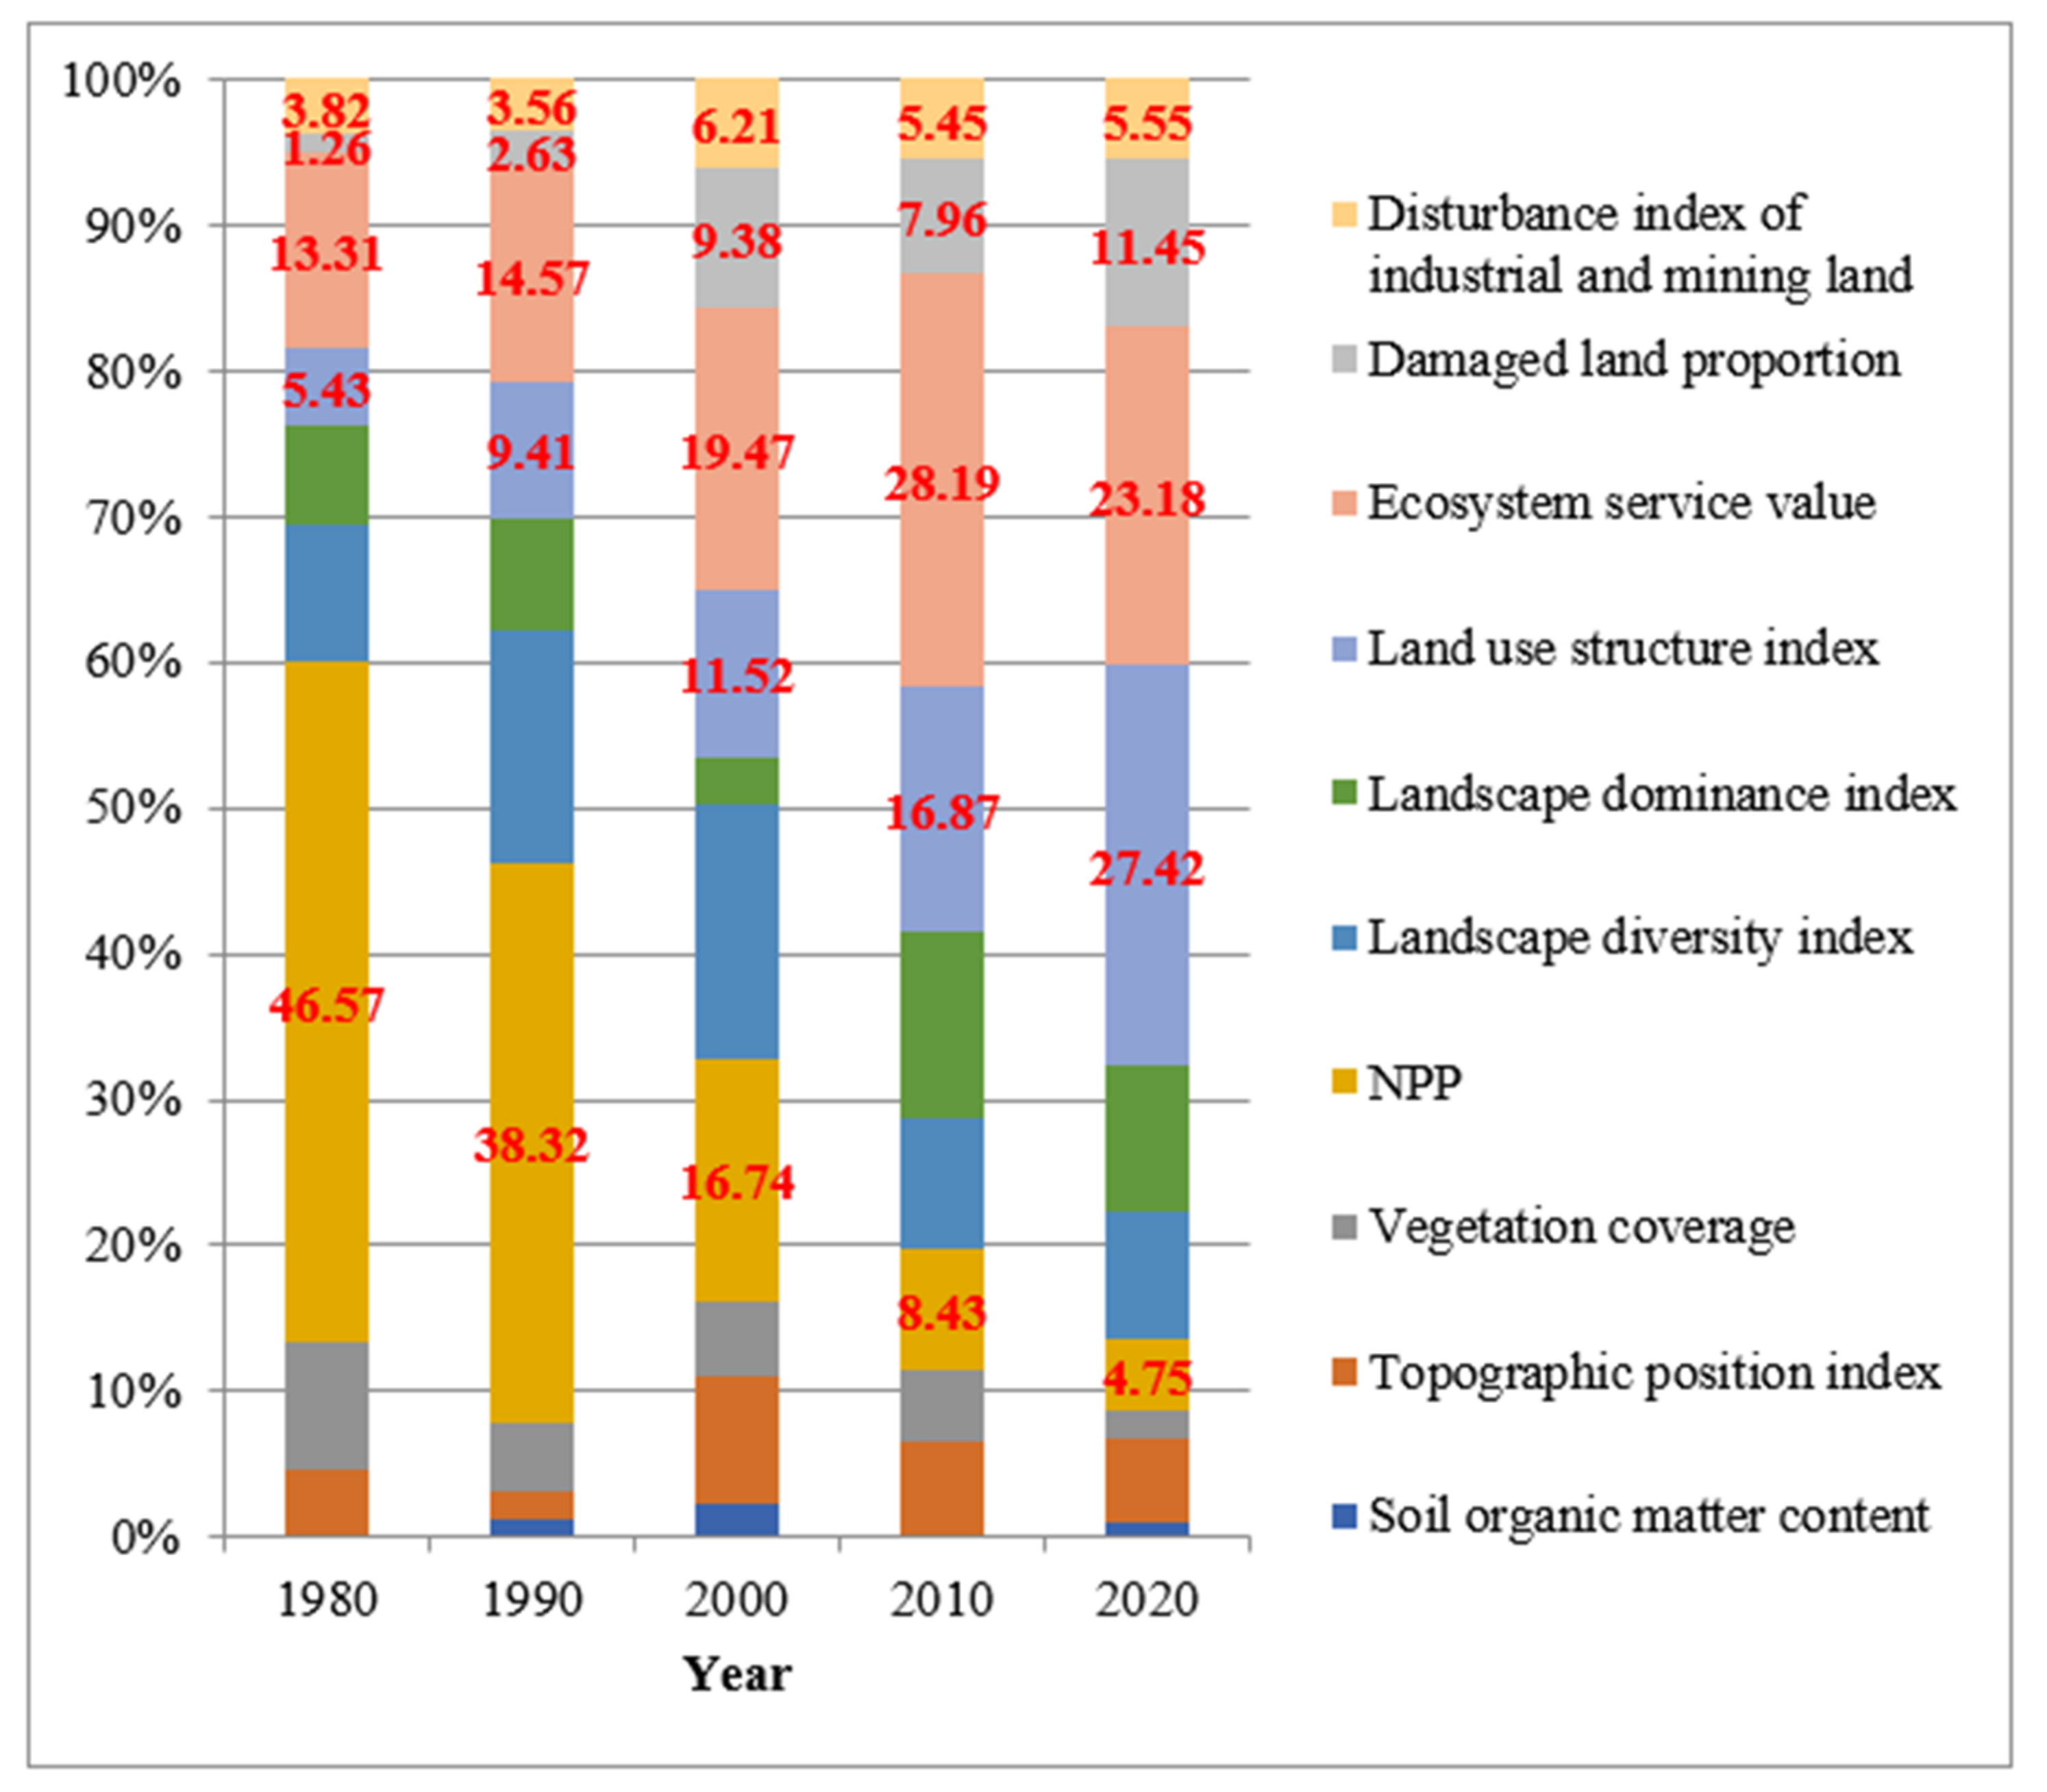
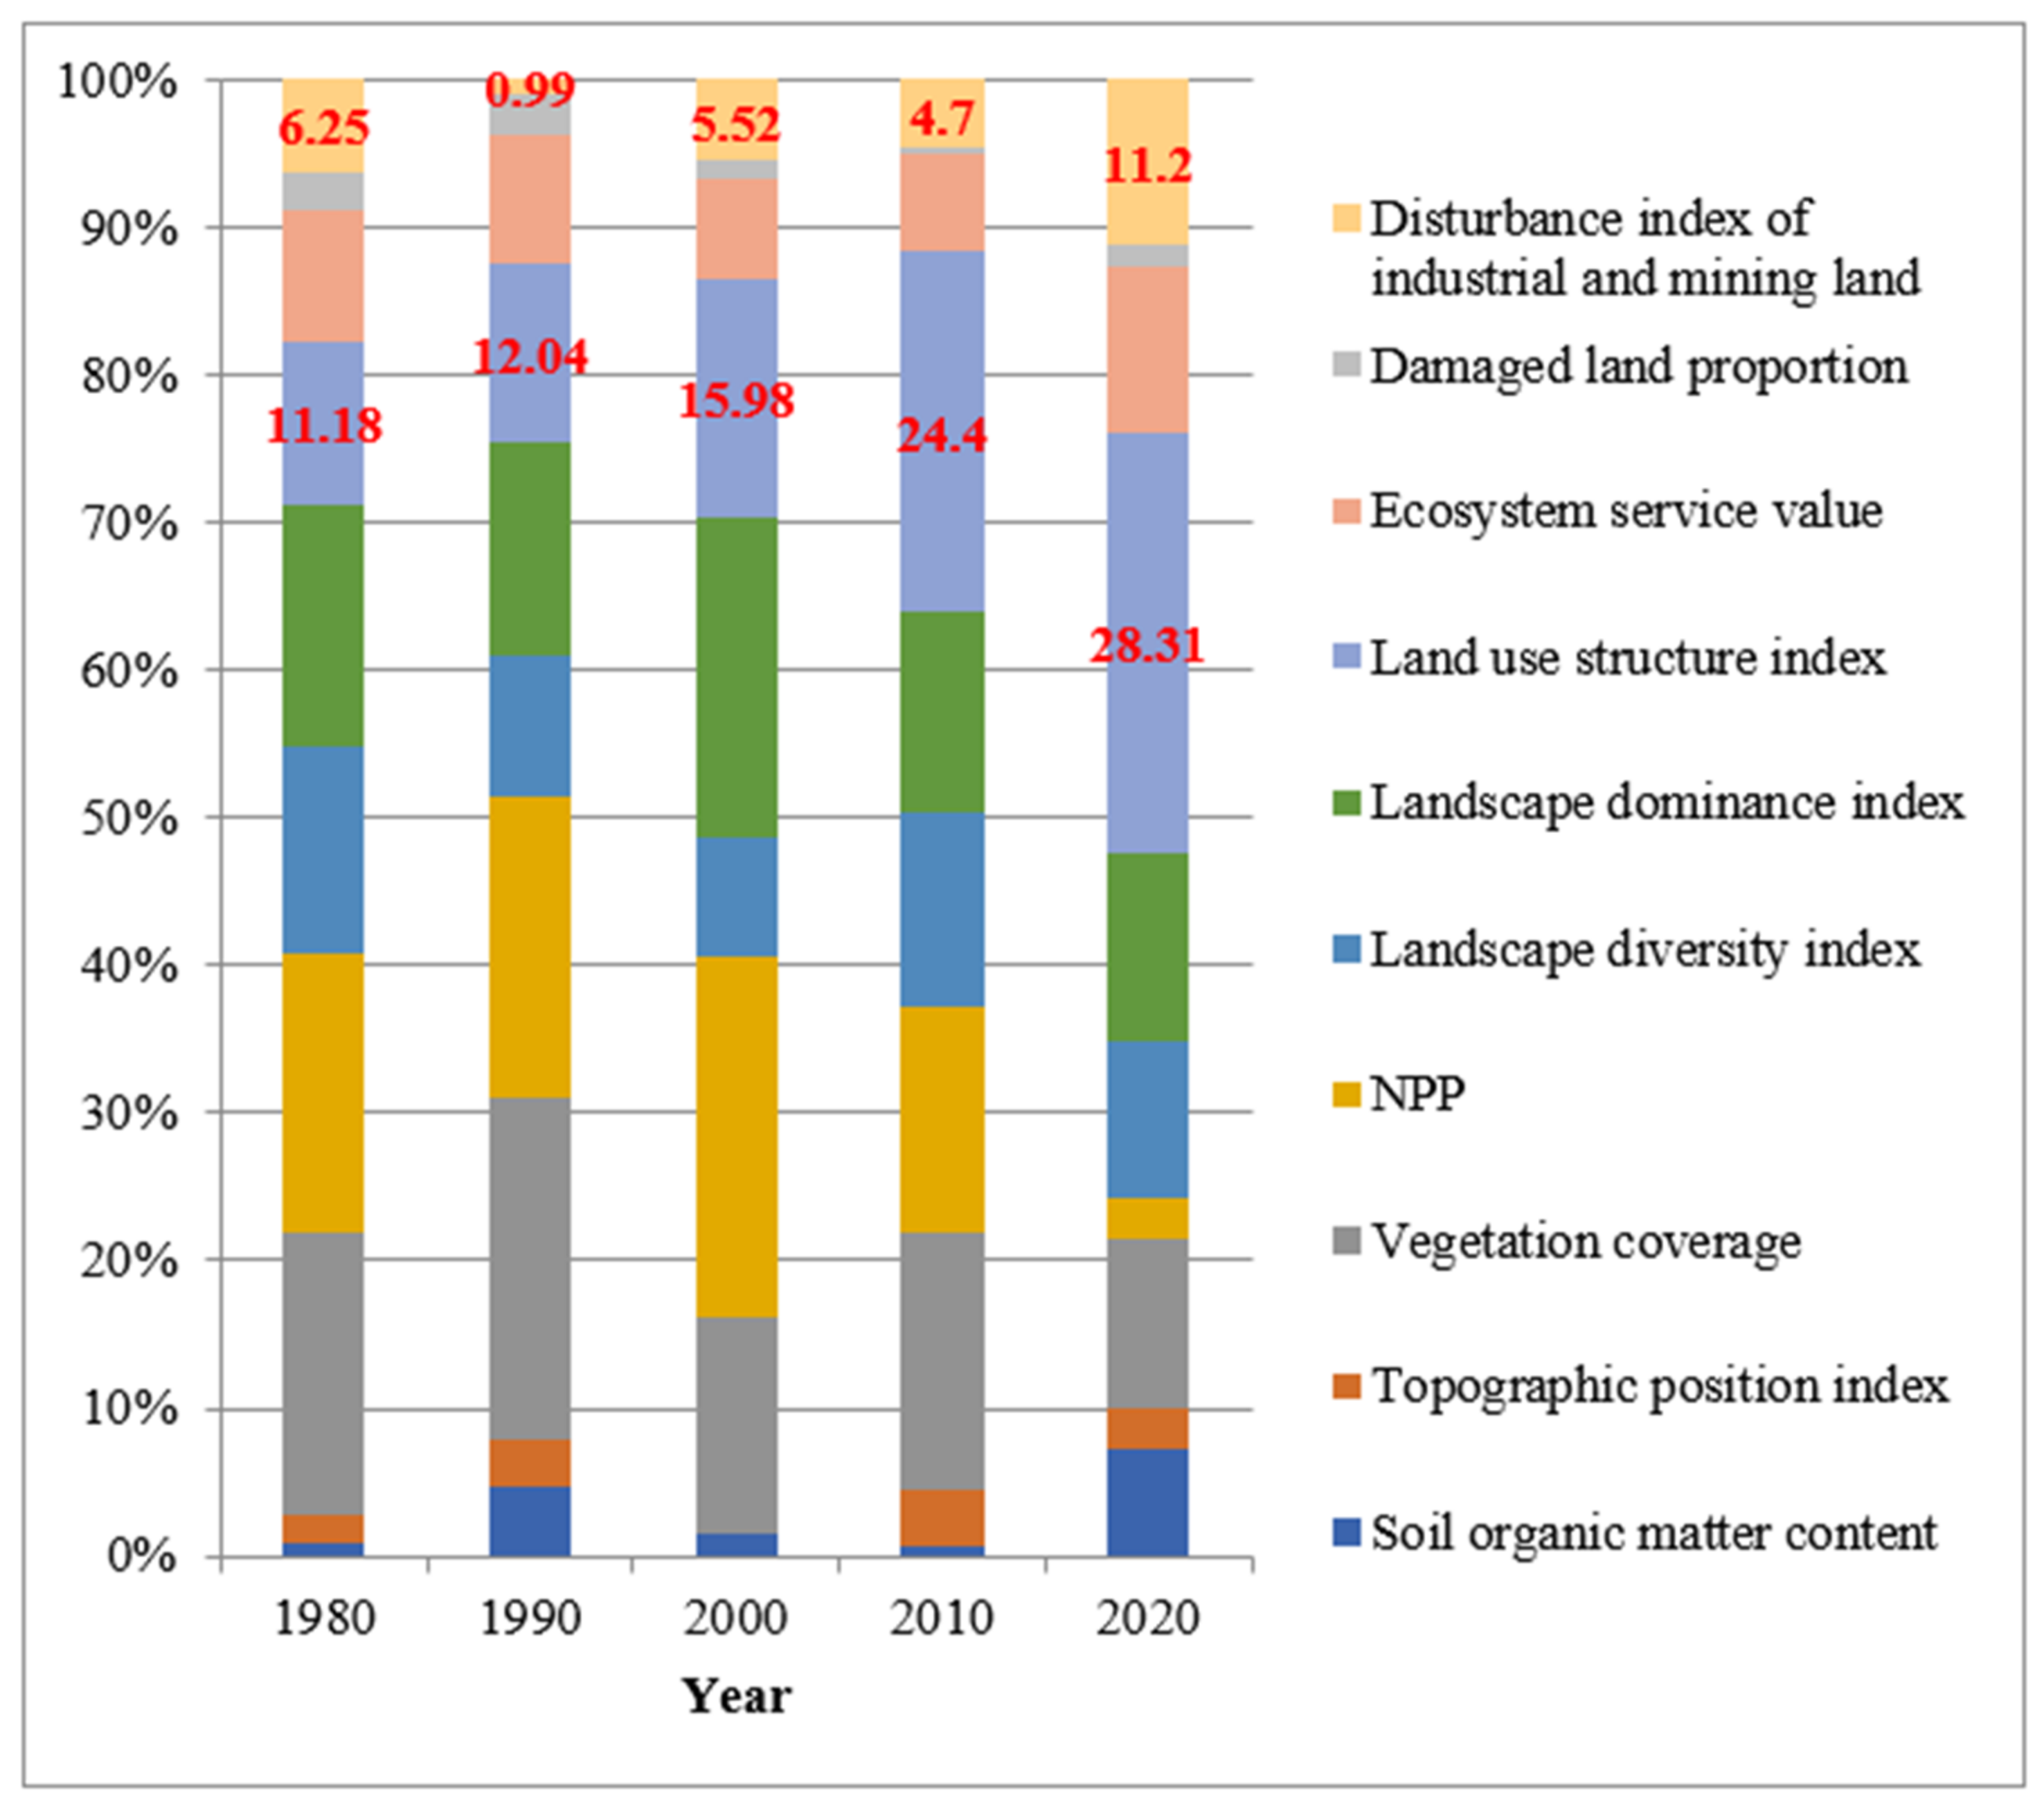
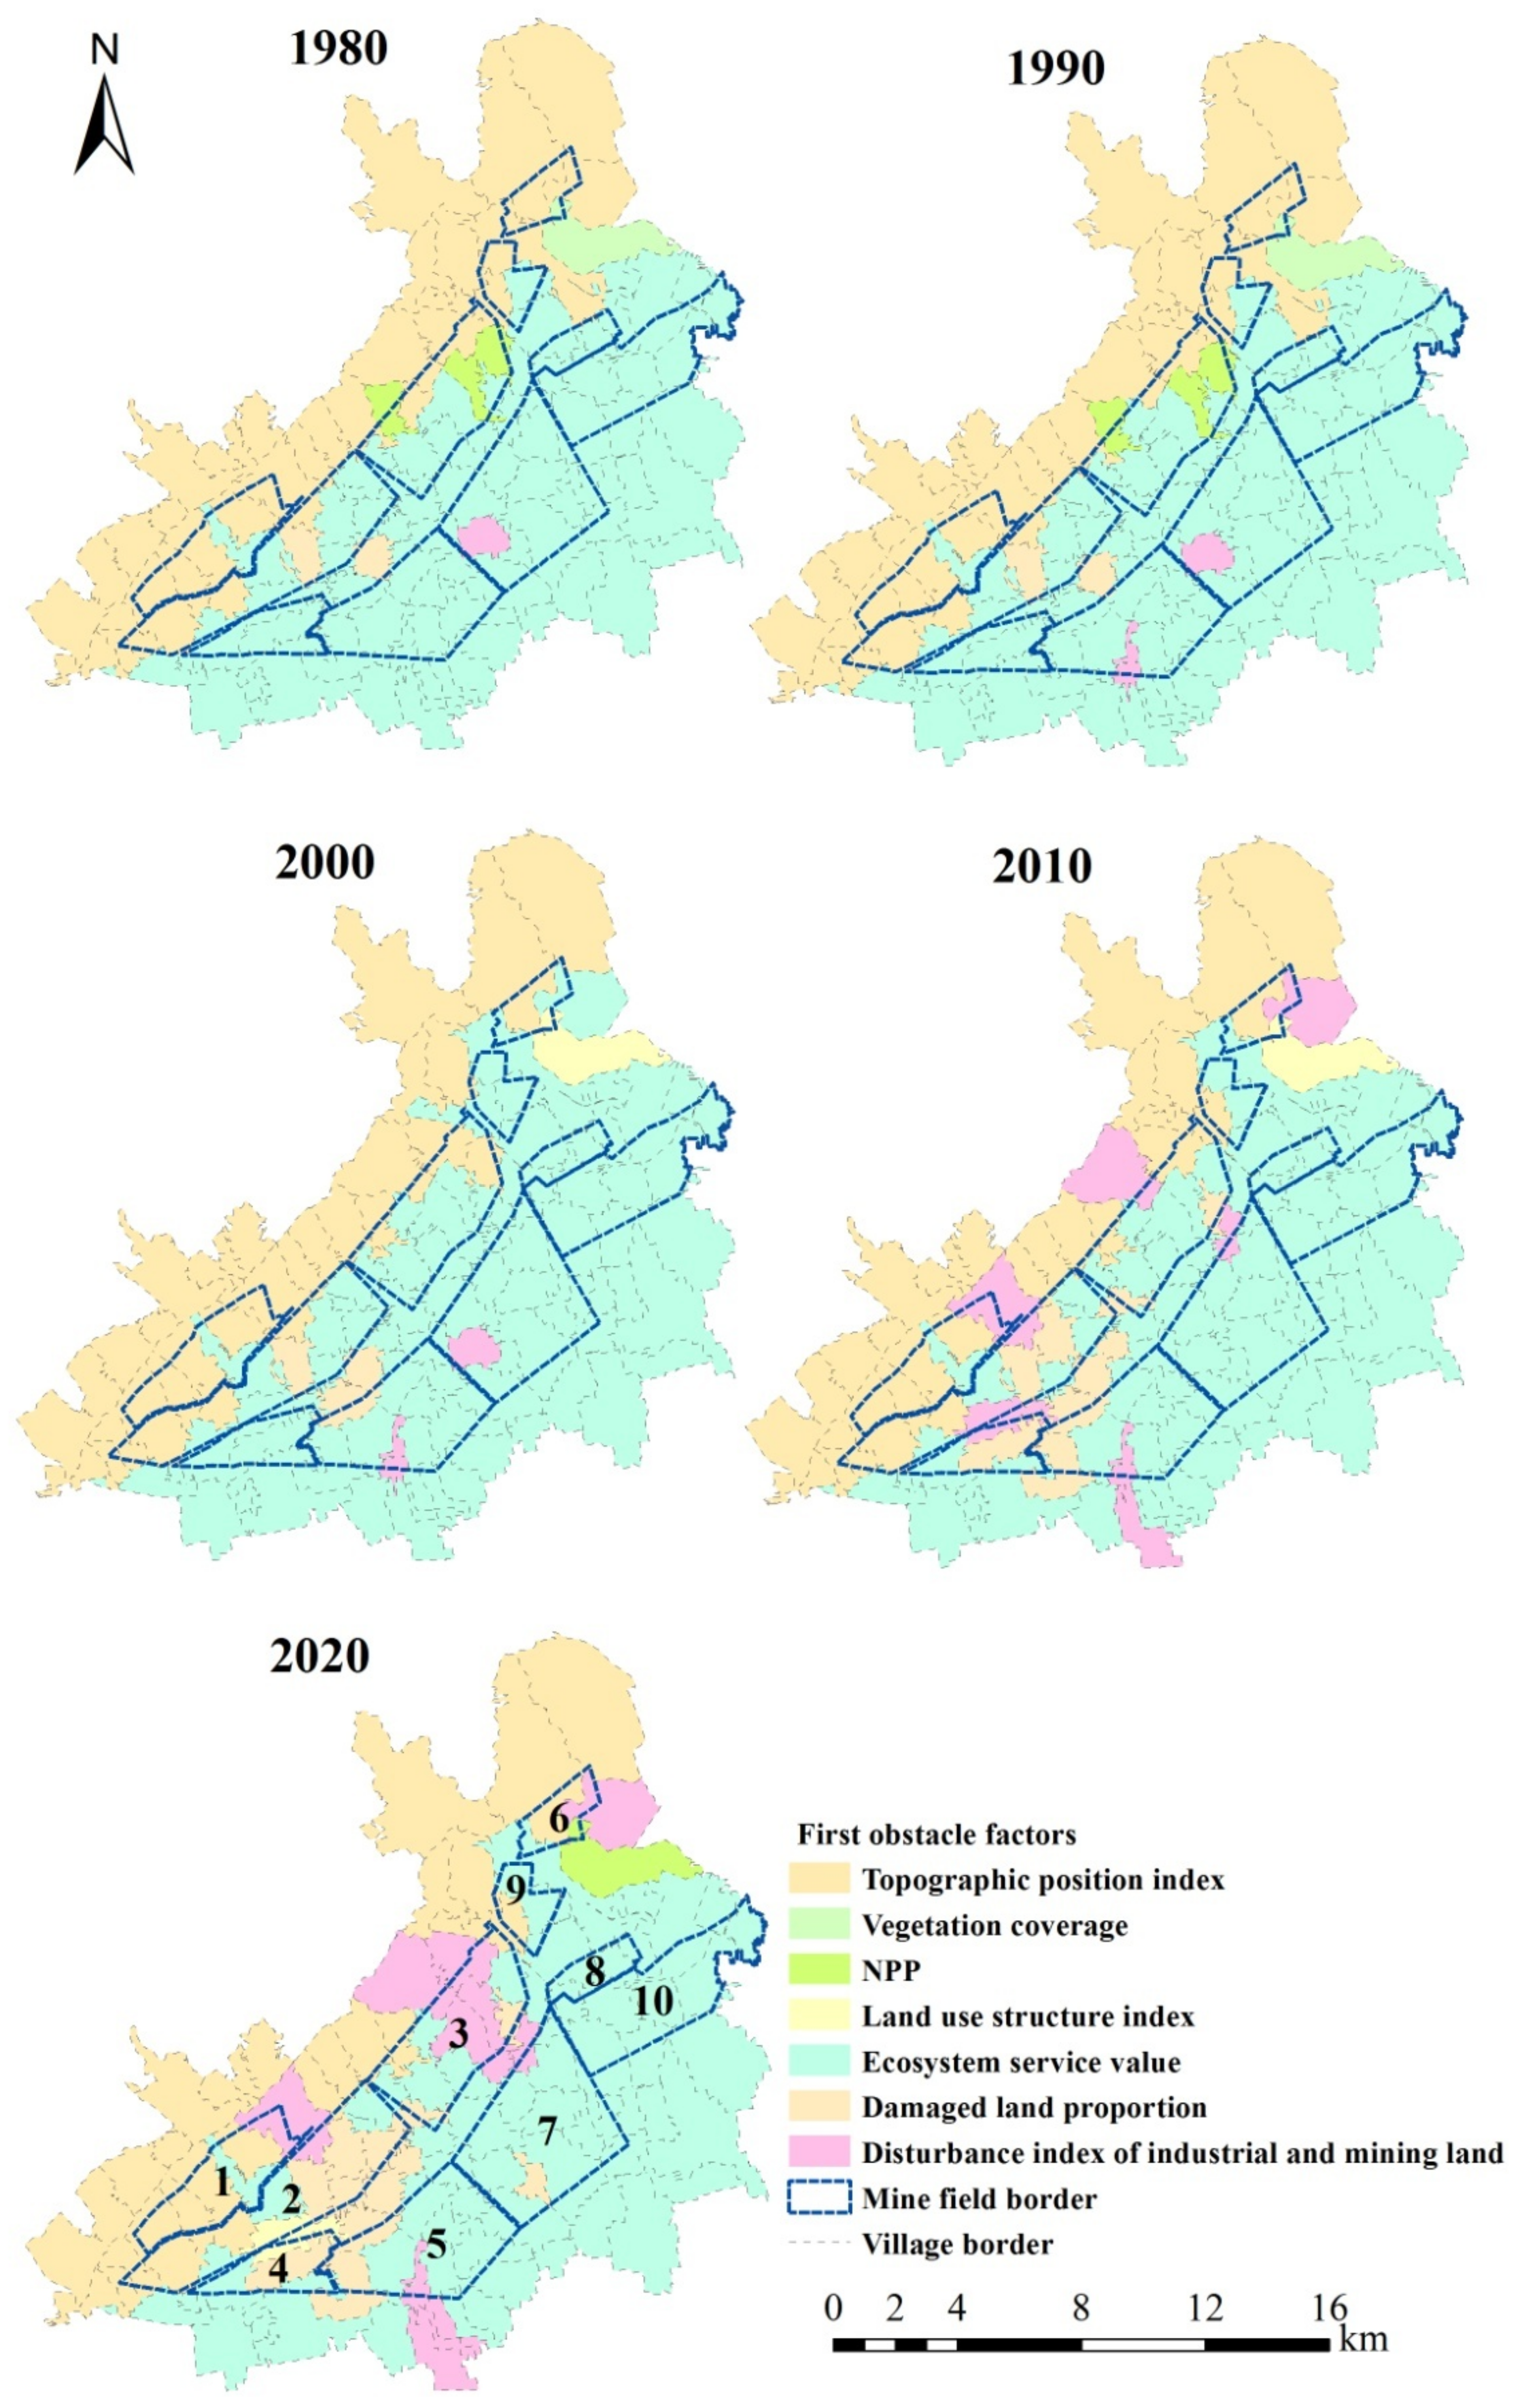
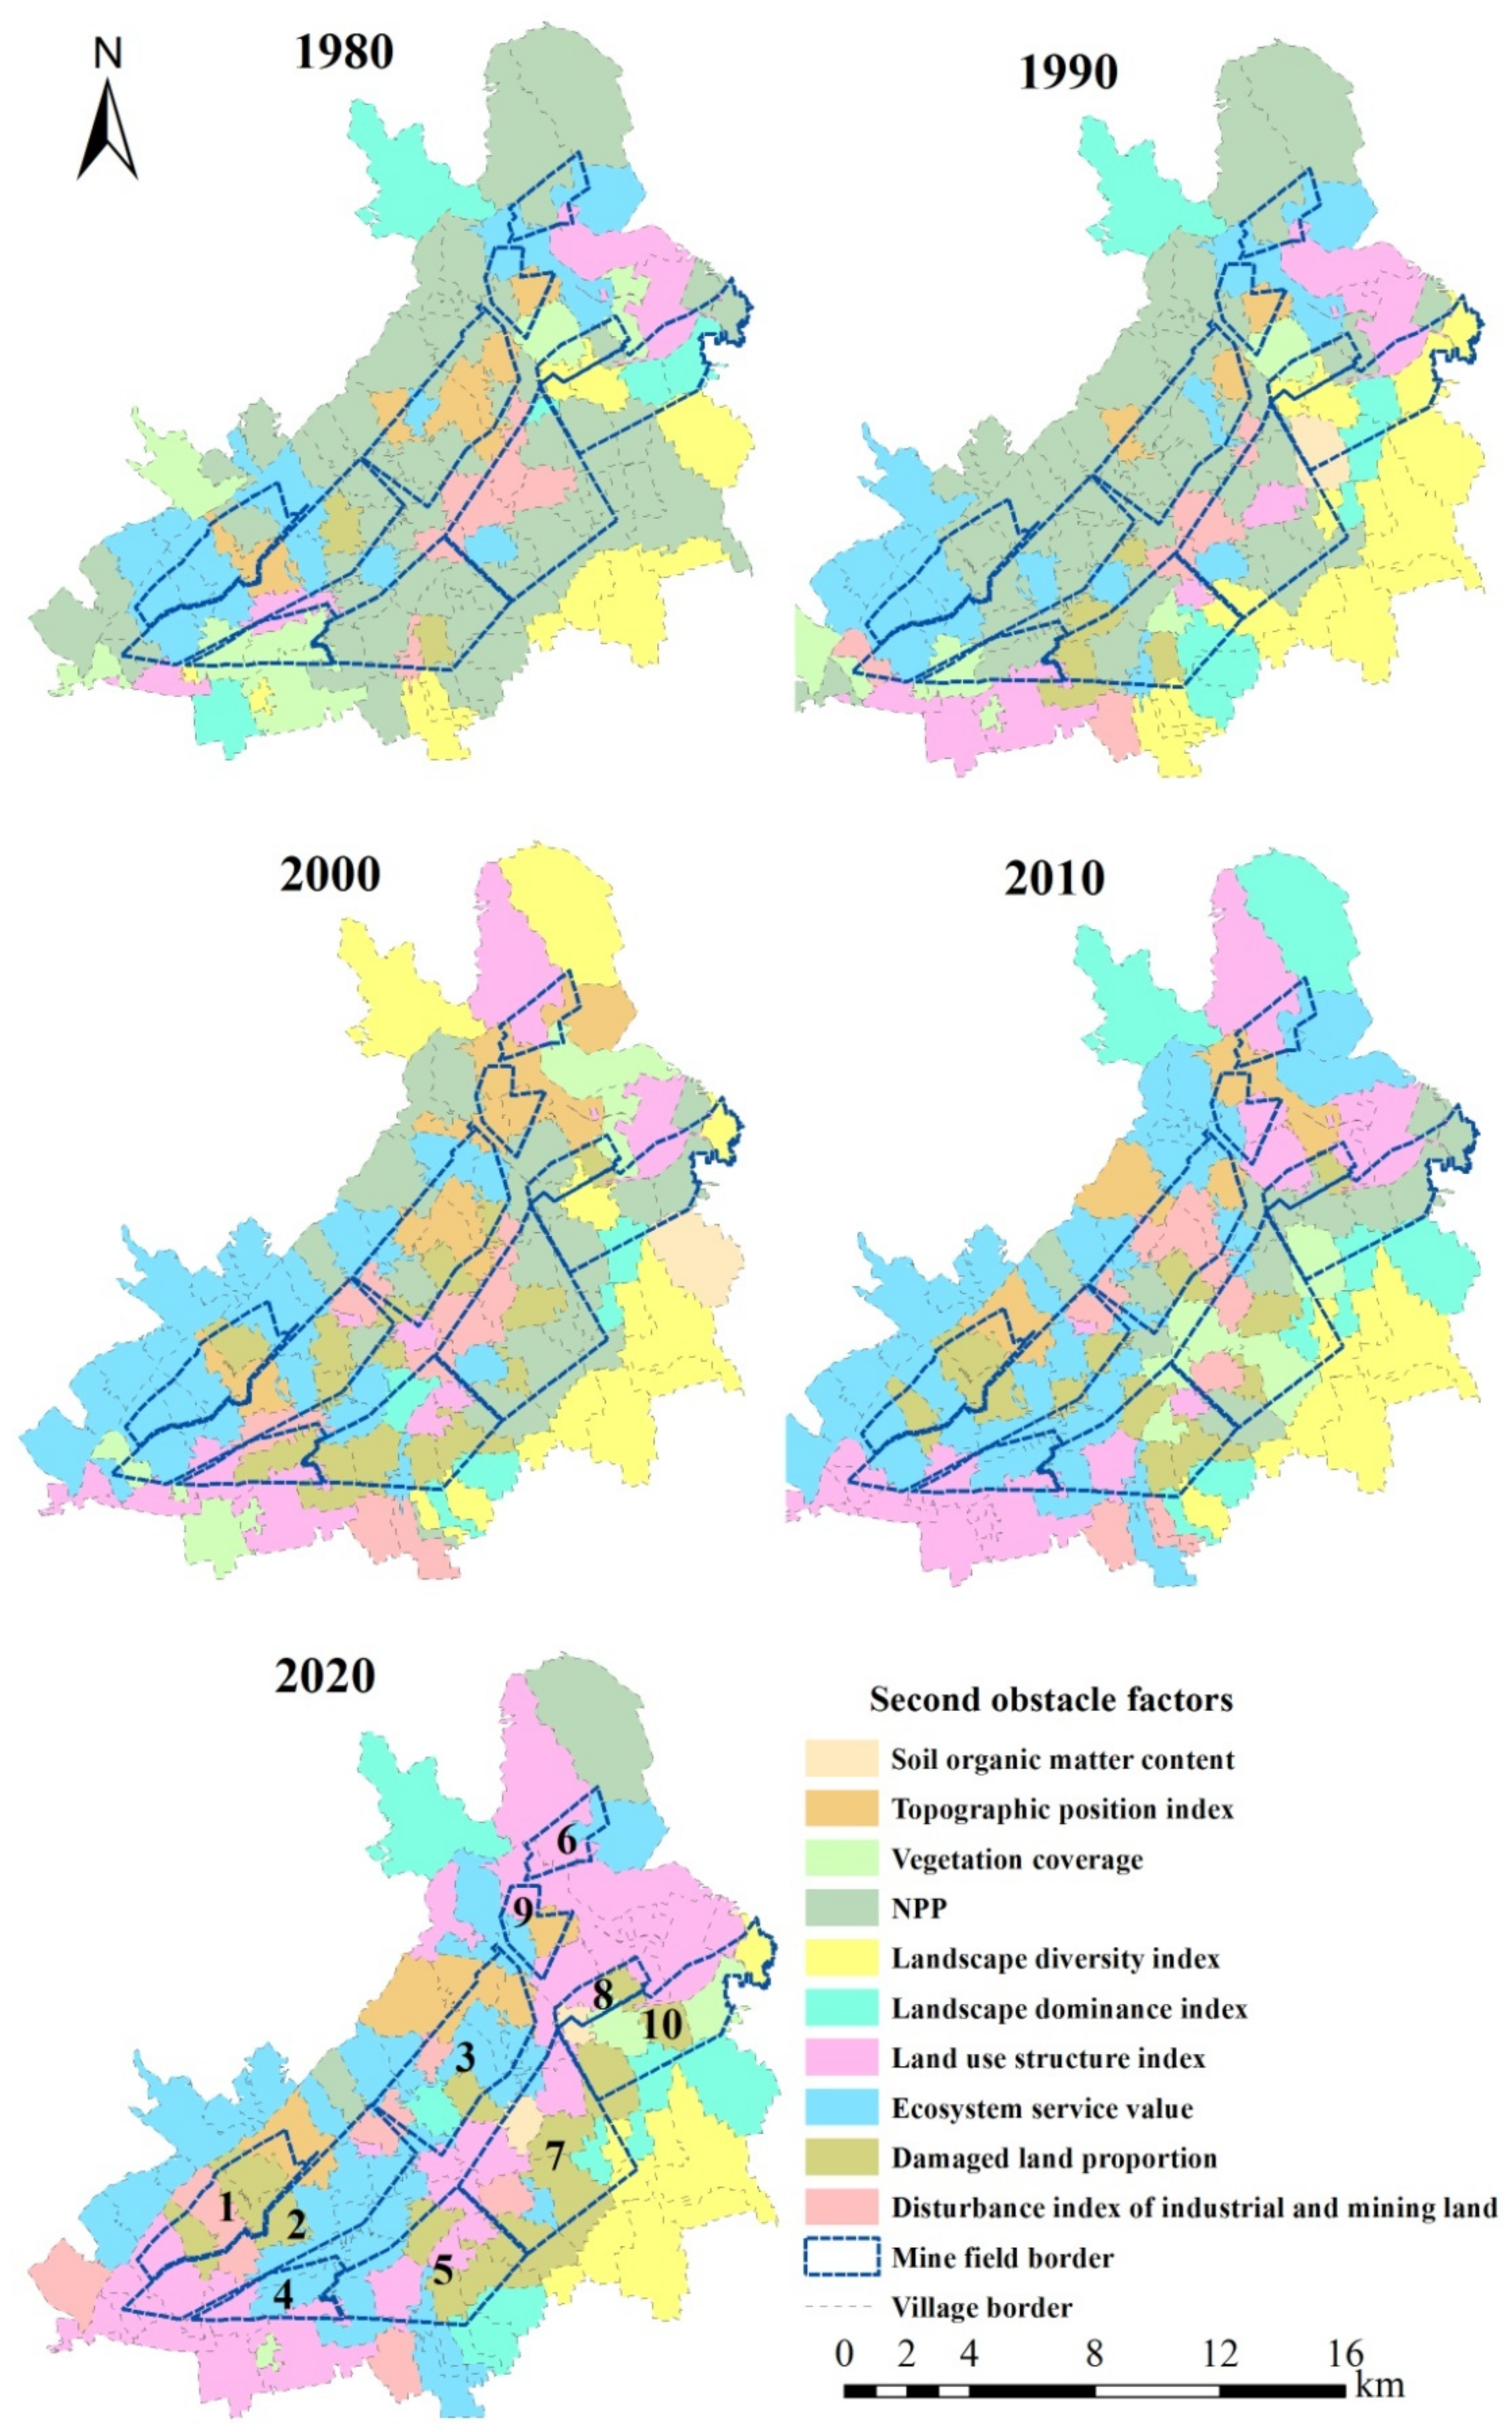
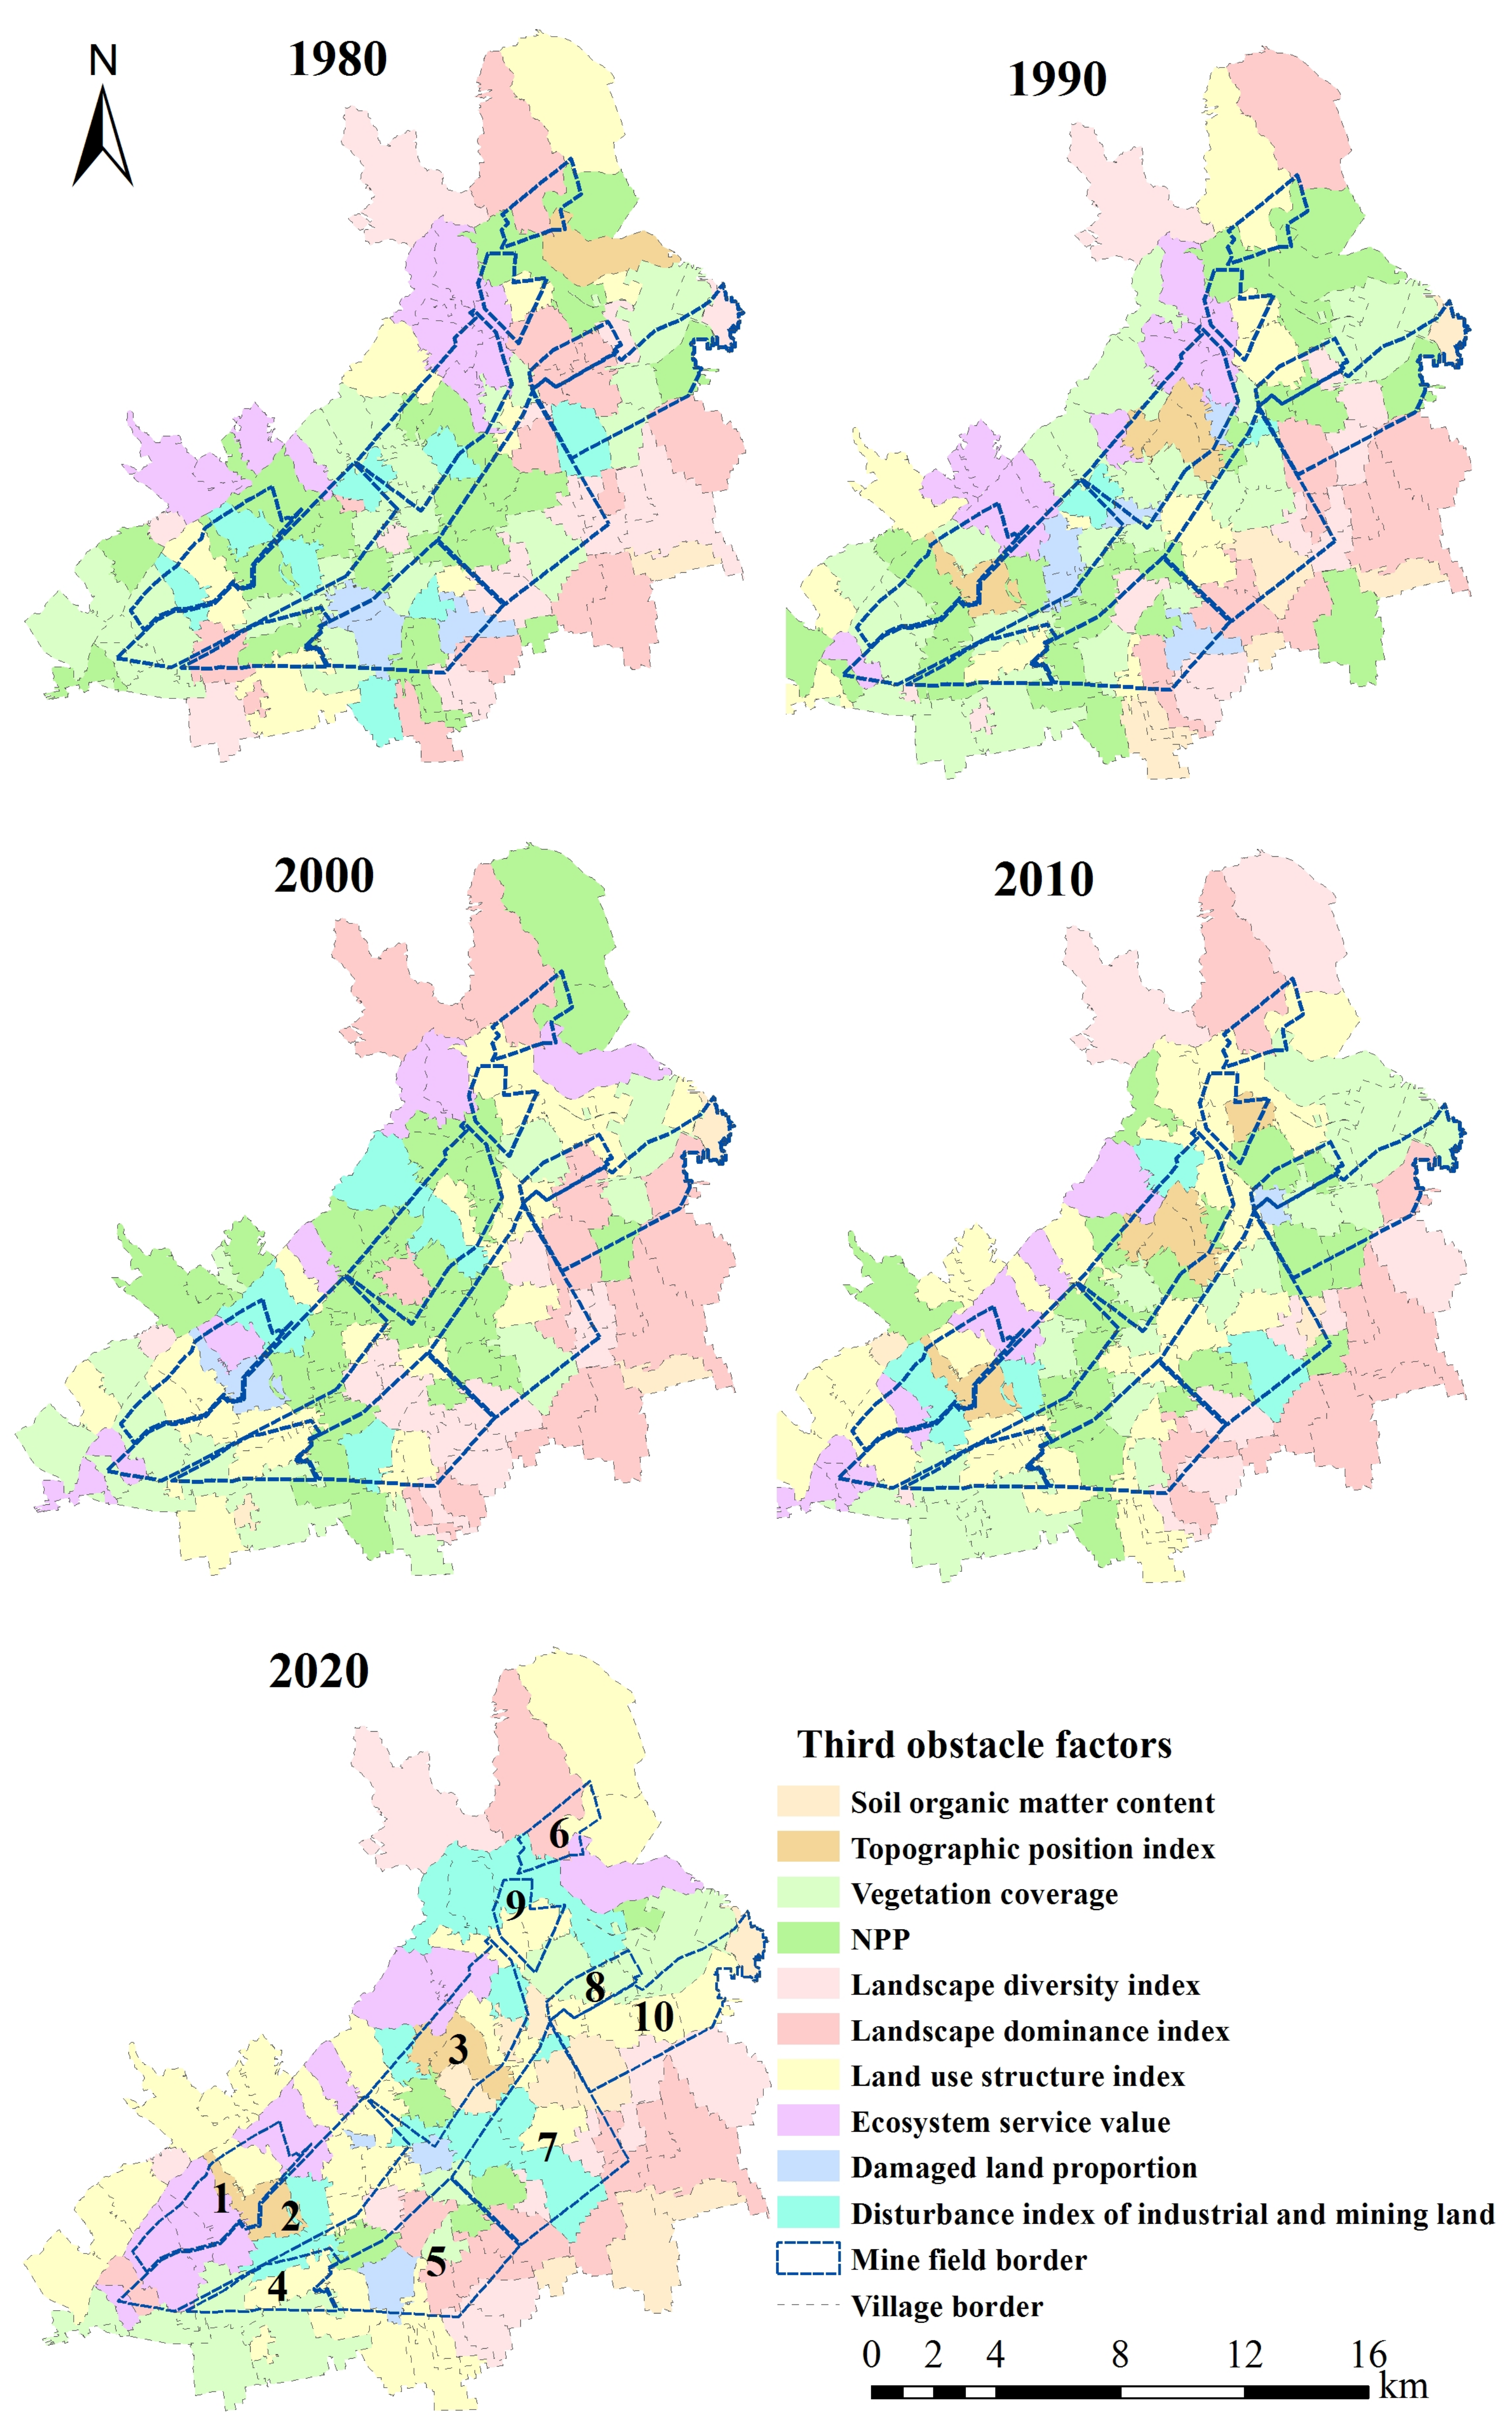
3.4. Spatiotemporal Changes of Obstacle Factors of Land Ecological Quality

The top three obstacle degree indexes (cumulative obstacle degree over 75%) were selected as the main obstacle factors. Figure 7, Figure 8 and Figure 9 show the area proportion of the first, second, and third obstacle factors in order of obstacle degree. Based on the first, second, and third obstacle factors identified in each evaluation unit, the distribution maps of obstacle factors were generated as shown in Figure 10, Figure 11 and Figure 12.
Figure 7, Figure 8 and Figure 9 show that from 1980 to 2020, the area proportion of evaluation units with the ecosystem service value as the first obstacle factor was always the largest (49.75–60.47%), and the second factor was the topographic position index (30.46–38.75%). The proportion of these two factors gradually decreased (from 94.43% in 1980 to 80.21% in 2020), whereas the area proportion of evaluation units with damaged land proportion and the disturbance index of industrial and mining land as the first obstacle factors gradually increased (from 1.85% in 1980 to 16.9% in 2020). The area proportion of evaluation units with NPP as the second obstacle factor had an obvious downward trend(from 46.57% in 1980 to 4.75% in 2020), while the area proportion of evaluation units with the land-use structure index(from 5.43% in 1980 to 27.42% in 2020), ecosystem service value(from 13.31% in 1980 to 23.18% in 2020), and damaged land proportion(from 1.26% in 1980 to 11.45% in 2020) as the second obstacle factors showed a sharp increase. In the third obstacle factors, the area proportion of each obstacle factor was similar. The area proportion of the land-use structure index (from 11.18% in 1980 to 28.31% in 2020) and the disturbance index of industrial and mining land (from 6.25% in 1980 to 11.2% in 2020) as the third obstacle factors presented an obvious upward trend. This indicates that the main factors causing the difference of land ecological quality among the evaluation units in the study zone are the difference of terrain and ecosystem service functions. Terrain and ecosystem service functions in the study zone greatly influence the stability of land ecosystems, and they are important factors affecting the land ecological quality. The study zone is a compound area of mine agriculture urban. With the continuous mining activities in the study zone, the mining activities lead to increased damaged land and industrial and mining land. Thus, the damaged land proportion and disturbance index of industrial and mining land have gradually become the main obstacle factor of regional land ecological quality. Moreover, with the simultaneous urbanization process in the study zone, the construction land in the study zone continuously increases, which makes the land-use structure becoming one of the main obstacles to the regional land ecological quality.
In 1980, Figure 10 shows that the main obstacles to land ecological quality in the north and west of the study zone were the topographic position index and NPP. The land ecological quality in this region was not high (Figure 2 and Figure 3), which indicates that the land ecological quality in this region is mainly affected by the poor terrain conditions and low vegetation productivity. This is consistent with the fact that the area is mainly mountainous or hilly, and the vegetation distributed there is mainly shrubbery with low productivity [50]. The northeast part of the study zone had a high land ecological quality (Figure 2), where a high-value aggregation area of the land ecological quality index formed (Figure 6). This area is mostly plain area with good terrain conditions. The Fangzhuang No. 2 Mine, Baizhuang Mine, Guhanshan Mine, and large factories distributed in this area had not been constructed at that time. In addition, there are many forests and rivers in the region, with relative high vegetation productivity and little human disturbance. The main obstacle factors of land ecological quality in the eastern area were the ecosystem service value, NPP, and land-use landscape index. The land ecological quality in this region is mainly good, where the main land-use type is cultivated and construction land. The obstacle degree of these factors is not high and has little influence on regional land ecological quality. The south-central part of the study zone was an aggregation area with low land ecological quality. The main obstacle factors were the topographic position index, damaged land proportion, and ecosystem service value. The Xiaoma Mine, Zhongma Mine, Yanma Mine, and industrial squares, which had been developed for a long time, were distributed in this area. Under the combined effect of natural and human factors, it becomes an aggregation area with low land ecological quality.
In 1990, due to the poor natural occurrence of land (topography, vegetation), the land ecological quality in the western part of the study zone was not high. With the implementation of China’s reform and opening-up policy, the contract responsibility system has been carried out in the cultivated land concentrated areas in the northeast. Farmers’ enthusiasm for labor has been stimulated greatly, agricultural production has gradually resumed, and regional land has been effectively managed. Thus, the productivity of cultivated land was improved, the vegetation coverage and NPP increased, and the obstacle degree began to decrease. The regional land ecological quality transformed from good to excellent, where an aggregation area with a high land ecological quality index formed. However, the land ecological quality of some parts in the south-central area transformed to a poor level due to regional natural conditions and the continuous intensification of mining disturbance, as well as the untimely land reclamation (Figure 3). It was still an aggregation area of low land ecological quality (Figure 6).
In 2000, the first obstacle factors in the western part of the study zone were still the topographic position index and NPP (Figure 10). In some regions, the obstacle factor changed from the NPP to ecosystem service value, which was mainly because the development of mineral resources in the region produced part of the bare land, resulting in a significant decrease in the ecosystem service value of the region. The land ecological quality in this region was still medium. In the southern region, land ecological quality transformed to poor quality (Figure 3). The obstacle factors of land ecological quality in this region were land-use structure index and vegetation coverage. This area is close to downtown Jiaozuo City. With the economic development and population growth, the construction land area in this region has significantly increased, resulting in the decrease in the land-use structure index and vegetation coverage. Thus, its regional land ecological quality transformed from excellent and good to medium. The area with low regional land ecological quality was still located in the southern mining area (Figure 2 and Figure 3), and its obstacle factors were damaged land proportion and ecosystem service value.
In 2010, the areas where the first obstacle factors were damaged land proportion and the disturbance index of industrial and mining land were mainly distributed in the south-central mining areas (Figure 10). It was a golden decade for the coal industry, and coal prices continued to climb from 2000 to 2010 [18]. The coal resources of the mines in the south were close to exhaustion, but they were still mined. Although land reclamation had begun, the phenomenon of untimely and low-quality reclamation was widespread, resulting in an expanding damaged land area. In the meantime, other mineral resources rapidly developed in western mountainous areas, and bare land was formed, resulting in a continual decline in the land ecological quality of the south-central region (Figure 3). Since 2000, with the gradual depletion of coal resources, Jiaozuo City has entered the transition from a resource-based to new ecological city. As the surface subsidence caused by coal mining was basically stabilized in the southern part of the study zone, close to the urban area of Jiaozuo City, some industries in the urban area were transferred there. Thus, the built-up area extended to the south, and the proportion of the construction land in this area was further increased, deteriorating the land ecological quality (Figure 3).
In 2020, land ecological quality improved in some mountainous areas in the southwest (Figure 2). This is because since 2005, with the increasing attention to ecological protection in China, Jiaozuo City has gradually begun to comprehensively rectify the widespread phenomenon of private digging and disorderly mining in northern mountainous areas. Comprehensive environmental control and ecological restoration have been carried out, and land reclamation in coal-mining areas has been effectively promoted [18]. By 2020, vegetation in this region has been restored to a certain extent. In addition, in 2014, a large river, the South-to-North Water Diversion River, was newly built in the middle of the study area from south to north, which improved the ecological service capacity of the regional land, which is consistent with the change of the ecological quality of the land in the region (Figure 2).

4. Discussion

In this paper, the Macun coal area was chosen as the study zone for the land ecological restoration of the compound area of mine agriculture urban. Remote sensing and GIS technology were used to integrate multisource and multiscale data, such as land-use change survey, geochemical survey, sample monitoring, and remote sensing data. The evaluation index system of land ecological quality suitable for the compound area of mine agriculture urban was established. Moreover, the land ecological quality was evaluated by using the multi-objective comprehensive evaluation method. The spatiotemporal differentiation characteristics of land ecological quality and its influencing factors were analyzed. The land ecological quality index in the study zone decreased from 2000 to 2010 and increased from 2010 to 2020, which is consistent with the research conclusions of other researchers [51,52].
Our research showed that mining activities and urbanization have a negative effect on the regional land ecological quality on the whole, which is the main factor leading to the decline of the regional land ecological quality, which is also consistent with the research conclusions of other researchers [3,8,10,12,13,14,15,16,17,47]. Actively repairing the damaged land ecosystem helps to improve the regional land ecological quality. It is precisely for this reason that the land ecological quality has been improved in 2010–2020 in both closed or still-in-operation mines (Figure 5). This is also consistent with the research conclusion of other researchers [3,16,47]. Their study showed that active ecological protection and restoration policies and measures can improve regional ecological quality.
The long-term, dynamic, multiscale analysis of spatiotemporal differentiation characteristics of land ecological quality and its influencing factors in the compound area of mine agriculture urban was achieved. It can provide a basis for the formulation of scientific land ecological restoration strategies in the similar regions and realize regional sustainable development.
The obstacle factors of land ecological quality and their influences on land ecological quality are different in different regions and periods, and terrain and ecosystem services have important effects on land ecological quality (Figure 10). The impact of damaged land and land-use structure change caused by mining activities on regional land ecological quality gradually intensifies (Figure 11 and Figure 12). On the whole, the influence of natural factors gradually decreased, while the influence of human factors gradually increased. Given the spatiotemporal differentiation of regional land ecological quality and its obstacle factors, the following restoration strategies can be formulated.
From 1980 to 2020, the mountainous region in the northern and western parts of the study zone was subject to poor natural endowments and mining activities. The land ecological quality in this region was not high due to the high distribution of the damaged land by mining and the low quality of the forest land. Topographic remediation and soil reconstruction technology can be used to restore the ecological function of the soil in this region. On this basis, suitable tree species should be selected for afforestation, and the improvement of low-quality forest land and conservation and protection of high-quality forest land should be strengthened to enhance the regional ecosystem service capacity.
In the southern part of the study zone, influenced by the mining activities and continuous advancement of urbanization, the regional ecological quality decreased. As some mines in this area have been closed with the exhaustion of coal resources and the surface subsidence has stabilized, it is suggested to conduct a full and detailed investigation on the damaged land and its reclamation effect in the mining area. According to different damage and restoration situations, different ecological suitability evaluation and analysis should be carried out to select reasonable ecological restoration measures. For example, secondary development of tailings occupying a large amount of land should be carried out to increase the comprehensive utilization rate of tailings. The tailings with large consumption, small investment, and marketable market will be developed to realize large-scale operation and resource and commercialization of multi variety development to turn waste into treasure and truly become a part of economic commodities. The ecological restoration of abandoned land in mines and damaged villages is not enough only for the restoration of soil and vegetation. It is necessary to restore the microbial community of the abandoned land and improve the function of the ecosystem so that the restored abandoned land ecosystem can be naturally maintained. For the restoration of heavy-metal contaminated land, considering the ecological problems that may be brought by the introduction and adaptability of local plants to local climate conditions, it is recommended to select local heavy-metal-tolerant plants for restoration. Moreover, due to the area proximity to Jiaozuo City’s built-up area, in the regional farmland area, new ecological agriculture can be built around the mine industrial square and office area. At the same time, in promoting urbanization in this region, it is necessary to follow the principle of ecology first and green development, rationally plan the ecological land use, and create a new urban area that is ecological and livable.
The Jiulishan Mine and Guhanshan Mine in the northeast of the study zone are still in operation. The land ecological quality in this area tends to worsen. The ecological restoration in this area should be conducted by the combination of pre-mining planning, while-mining control, and post-mining restoration. First of all, it is required to make a restoration plan for the area planned to be mined, delimit the buffer zone for preventing ecological degradation, evacuate residents in the involved areas in time, plant ecological shelterbelts in time according to the plan, and enhance the regional resistance to disturbance. Second, protective mining should be carried out during mining. Reasonable measures such as filtration and purification of goaf, replacement of coal gangue, and closure of all links of coal mining and transportation should be taken to reduce the impact of mine water, coal gangue, and coal dust on the ecological environment of the mining area, and ecological restoration should be combined to effectively protect the ecological environment of the surface [11]. For the land subsidence area in the mining area, according to the characteristics of land subsidence, the guided restoration method of mainly plant restoration supplemented by engineering restoration is adopted for the non-uniform deep subsidence land. For the uniform subsidence land, the role of natural restoration can be fully utilized. Specifically, the method of “introducing plants” is adopted to carry out natural closed restoration, and the soil of the damaged land is improved through microbial and other technologies. If necessary, engineering restoration measures shall be taken to accelerate the ecological restoration of the regional cultivated land. The occupation and destruction of land caused by coal mining have brought environmental damage and economic loss to the production and living environment of local residents. Thus, different forms of land ecological compensation should be adopted, for example, giving direct economic compensation, conducting environmental remediation, reclaiming the land, strengthening “green industry” support, carrying out skill training, and implementing policy guidance [11].
In this way, the evaluation and diagnosis of land ecological quality can be reasonably carried out, and the spatiotemporal differentiation characteristics of regional land ecological quality and influencing factors can be clarified when we are dealing with the regional land ecological problems. Scientific land ecological restoration strategies can be made in terms of the specific factors affecting the land ecological quality.

5. Conclusions

From 1980 to 2020, the change of land ecological quality in the study zone showed significant spatiotemporal heterogeneity. The land ecological quality index presented a trend of increasing first, then decreasing, and then increasing in time series, and on the whole, there was a downward trend. In terms of spatial pattern, the land ecological quality index of each period showed a certain regional aggregation. The overall correlation of the land ecological quality index experienced a change process of weakening first and then strengthening, and aggregation characteristics showed certain fluctuations. In the past 40 years, the low-value aggregation areas were relatively fixed in the core mining area, towns, and surrounding areas. On the other hand, the high-value aggregation areas repeatedly oscillated between the northern and east-central farmland areas, and the changes of high and low values of the regional land ecological quality index were closely related to ecological foundation and human activities, such as coal mining and urbanization. The main obstacle factors of land ecological quality in the study zone were the topographic position index, ecosystem service value, NPP, vegetation coverage, land-use structure index, landscape diversity index, damaged land proportion, and disturbance index of the industrial and mining land. Obstacle factors changed with time, and their influences on land ecological quality also varied. On the whole, the influence of natural factors gradually decreased, while the influence of human factors gradually increased. Furthermore, according to the spatiotemporal differentiation characteristics of land ecological quality and obstacle factors in the study zone, several suggestions on land ecological restoration are proposed: improving the ecological quality of the land in the west and north through topographic regulation, soil reconstruction, and forest land conservation, and improving the ecological quality of the land in the south through building ecological agriculture and communities. The ecological restoration in the northeast should be conducted by combining the planning and restoration of pre-mining planning, while-mining control, and post-mining restoration.

Author Contributions

Conceptualization, X.W. and W.L.; methodology, X.W. and H.Z.; software, F.L.; validation, X.W. and W.L.; formal analysis, X.W.; investigation, X.W. and F.L.; resources, H.Z.; data curation, X.W. and F.L.; writing—original draft preparation, X.W.; writing—review and editing, W.L.; visualization, X.W. and W.L.; supervision, X.W.; project administration, X.W. and W.L.; funding acquisition, X.W. and W.L. All authors have read and agreed to the published version of the manuscript.

Funding

This research was funded by the Key Joint Funds of the National Natural Science Foundation of China (grant no. U21A20109), Science and Technology Projects of Henan Province (grant no.222102320433), and Scientific and Technological Innovation Team of Universities in Henan Province (grant no. 22IRTSTHN008).

Institutional Review Board Statement

Not applicable.

Informed Consent Statement

Not applicable.

Data Availability Statement

Not applicable.

Conflicts of Interest

The authors declare no conflict of interest.

References

  1. Cao, Y.G. Pattern Evolution and Management Countermeasures on Land Use in Typical Compound Area of Mine Agriculture Urban. Ph.D. Thesis, China University of Geosciences, Beijing, China, 2020. [Google Scholar]
  2. Zhang, C.; Fang, S. Identifying and Zoning Key Areas of Ecological Restoration for Territory in Resource-Based Cities: A Case Study of Huangshi City, China. Sustainability 2021, 13, 3931. [Google Scholar] [CrossRef]
  3. Xu, J.X.; Li, G.; Chen, G.L.; Zhao, H. Dynamic changes and evaluation of land ecological quality in coal mining area. J. China Coal Soc. 2013, 38 (Suppl. S1), 180–185. [Google Scholar]
  4. Dube, F.; Zagal, E.; Stolpe, N. The influence of land-use change on the organic carbon distribution and microbial respiration in a volcanic soil of the Chilean Patagonia. For. Ecol. Manag. 2009, 257, 1695–1704. [Google Scholar] [CrossRef]
  5. Hu, Z.Q.; Zhao, Y.L. Main problems in ecological restoration of mines and their solutions. China Coal 2021, 47, 2–7. [Google Scholar]
  6. Su, S.L.; Li, D.; Yu, X.; Zhang, Z.H.; Zhang, Q.; Xiao, R.; Zhi, J.J.; Wu, J.P. Assessing land ecological security in Shanghai (China) based on catastrophe theory. Environ. Res. Risk Assess. 2011, 25, 737–746. [Google Scholar] [CrossRef]
  7. Peng, J.; Pan, Y.J.; Liu, Y.X.; Zhao, H.J.; Wang, Y.L. Linking ecological degradation risk to identify ecological security patterns in a rapidly urbanizing landscape. Habitat Int. 2018, 71, 110–124. [Google Scholar] [CrossRef]
  8. Dubńiski, J. Sustainable development of mining mineral resources. J. Sustain. Min. 2013, 12, 1–6. [Google Scholar] [CrossRef] [Green Version]
  9. Yu, H.C.; Bian, Z.F.; Chen, F.; Mu, S.G. Diagnosis and its regulations for land ecosystem degradation in mining area. Coal Sci. Tec. 2020, 48, 214–223. [Google Scholar]
  10. Yu, H.C.; Chen, F.; Yin, D.Y.; Han, X.T.; Mu, S.G.; Lei, S.G.; Bian, Z.F. Effects of mining activities and climate change on land ecosystem in Gobi mining area: A case study of Zhundong Coal Base. J. China Coal Soc. 2021, 46, 2650–2662. [Google Scholar]
  11. Gao, X.M. Study on the Change and Evaluation of Land Ecological Quality in Coal Mining Subsidence Area of Mu Us Sandy Land—A Case Study of the Bulianta Coal Mine. Master’s Thesis, Inner Mongolia Normal University, Huhhot, China, 2021. [Google Scholar]
  12. Pandey, M.; Mishra, A.; Swamy, S.L.; Thakur, T.K.; Pandey, V.C. Impact of coal mining on land use dynamics and soil quality: Assessment of land degradation vulnerability through conjunctive use of analytical hierarchy process and geospatial techniques. Land Degrad. Dev. 2022, in press. [CrossRef]
  13. Luise, S.; Gläβer, C. Analyses and monitoring of lignite mining lakes in Eastern Germany with spectral signatures of Landsat TM satellite data. Int. J. Coal Geol. 2011, 86, 27–39. [Google Scholar] [CrossRef]
  14. Konstantinos, I.V.; Demetrios, C.K. An Overall Index of Environmental Quality in Coal Mining Areas and Energy Facilities. Environ. Manag. 2006, 38, 1031–1045. [Google Scholar] [CrossRef]
  15. Antwi, E.K.; Krawczynski, R.; Wiegleb, G. Detecting the effect of disturbance on habitat diversity and landcover change in a post-mining area using GIS. Landsc. Urban Plan. 2008, 87, 22–32. [Google Scholar] [CrossRef]
  16. Zhang, L.J.; Zhai, Z.H.; Zhou, Y.; Liu, S.H.; Wang, L.W. The Landscape Pattern Evolution of Typical Open-Pit Coal Mines Based on Land Use in Inner Mongolia of China during 20 Years. Sustainability 2022, 14, 9590. [Google Scholar] [CrossRef]
  17. Yu, J.; Chen, Y.H.; Peng, J.; Li, J.Y.; Nie, Y. Comprehensive evaluation on land ecological quality based on GIS and Fragstats: A case study in Xiantao City, Hubei Province. Acta Ecol. Sin. 2020, 40, 2932–2943. [Google Scholar]
  18. Zhao, Y.Q.; Yang, Y.; Keszek, S.; Wang, X.Y. Experience in the transformation process of “coal city” to “beautiful city”: Taking Jiaozuo City as an example. Energy Policy 2021, 150, 112164. [Google Scholar] [CrossRef]
  19. Song, X. Preliminary study on land impact and reclamation model of coal mining subsidence land. Pub. Com. Sci. Tech. 2012, 10, 135–137. [Google Scholar]
  20. Ma, S.C.; Shao, Y.; Yang, J.F.; Li, C.X. Risk assessment of heavy metal contamination in soil-plant system of the overlapped areas of crop and mineral production. Ecol. Environ. Sci. 2012, 21, 937–941. [Google Scholar]
  21. He, K.; Guo, L.; Guo, Y.; Luo, H.; Liang, Y. Research on the effects of coal mining on the karst hydrogeological environment in Jiaozuo mining area, China. Environ. Earth Sci. 2019, 78, 434. [Google Scholar] [CrossRef]
  22. El-Raey, M.; Fouda, Y.; Gal, P. GIS for Environmental Assessment of the Impacts of Urban Encroachment on Rosetta Region, Egypt. Environ. Monit. Assess. 2000, 60, 217–233. [Google Scholar] [CrossRef]
  23. Messing, I.; Hoang, F.M.; Chen, L. Criteria for land suitability evaluation in a small catchment on the Loess Plateau in China. Catena 2003, 54, 215–234. [Google Scholar] [CrossRef]
  24. Dumanski, J.; Gameda, S.; Pieri, C. Indicators of Land Quality and Sustainable Land Management: An Annotated Bibliography; Environmentally and Socially Sustainable Development Series: Rural Development; The International Bank for Reconstruction and Development, The World Bank: Washington, DC, USA, 1998. [Google Scholar]
  25. Parcerisas, L.; Marull, J.; Pino, J.; Tello, E.; Coll, F.; Basnou, C. Land use changes, landscape ecology and their socioeconomic driving forces in the Spanish Mediterranean coast (EL Maresme County, 1850–2005). Environ. Sci. Pol. 2012, 23, 120–132. [Google Scholar] [CrossRef]
  26. Brandmeier, M. Remote sensing of Carhuarazo volcanic complex using ASTER imagery in Southern Peru to detect alteration zones and volcanic structures—A combined approach of image processing in ENVI and ArcGIS/ArcScene. Geocarto Int. 2010, 25, 629–648. [Google Scholar] [CrossRef]
  27. Mccarty, G.W.; Reeves, J.B.; Reeves, V.B.; Follett, R.F.; Kimble, J.M. Mid-infrared diffuse reflectance spectroscopy for soil carbon measurement. Soil Sci. Soc. Am. J. 2002, 66, 640–646. [Google Scholar] [CrossRef]
  28. Chen, F.; Kissel, D.E.; West, L.T.; Adkins, W. Field-scale mapping of surface soil organic carbon using remotely sensed imagery. Soil Sci. Soc. Am. J. 2000, 64, 746–753. [Google Scholar] [CrossRef] [Green Version]
  29. Myeong, S.; Nowak, D.J.; Duggin, M.J. A temporal analysis of urban forest carbon storage using remote sensing. Remote. Sens. Environ. 2006, 101, 277–282. [Google Scholar] [CrossRef]
  30. De Reu, J.; Bourgeois, J.; Bats, M.; Zwertvaegher, A.; Gelorini, V.; De Smedt, P.; Chu, W.; Antrop, M.; De Maeyer, P.; Finke, P.; et al. Application of the topographic position index to heterogeneous landscapes. Geomorphology 2013, 186, 39–49. [Google Scholar] [CrossRef]
  31. Li, F.; Chen, W.; Zeng, Y.; Zhao, Q.J.; Wu, B.F. Improving Estimates of Grassland Fractional Vegetation Cover Based on a Pixel Dichotomy Model: A Case Study in Inner Mongolia, China. Remote Sens. 2014, 6, 4705–4722. [Google Scholar] [CrossRef] [Green Version]
  32. Tong, S.Q.; Bao, Y.H.; Zhang, Q.F.; Du, W.L. Spatiotemporal Changes of Vegetation Coverage in Inner Mongolia Based on the Dimidiate Pixel Model and Intensity Analysis. Ecol. Environ. Sci. 2016, 25, 737–743. [Google Scholar]
  33. Zhu, W.Q.; Pan, Y.Z.; Zhang, J.S. Estimation of Net Primary Productivity of Chinese terrestrial vegetation based on Remote Sensing. China J. Plant Ecol. 2007, 31, 413–424. [Google Scholar] [CrossRef] [Green Version]
  34. Bahadur, K.C.K. Improving Landsat and IRS Image Classification: Evaluation of Unsupervised and Supervised Classification through Band Ratios and DEM in a Mountainous Landscape in Nepal. Remote Sens. 2009, 1, 1257–1272. [Google Scholar] [CrossRef] [Green Version]
  35. Paudel, S.; Yuan, F. Assessing landscape changes and dynamics using patch analysis and GIS modeling. Int. J. Appl. Earth Obs. Geoinf. 2012, 16, 66–76. [Google Scholar] [CrossRef]
  36. Caillault, S.; Mialhe, F.; Vannier, C.; Delmotte, S.; Kedowide, C.; Amblard, F.; Etienne, M.; Becu, N.; Houet, T. Influence of incentive networks onlandscape changes: A simple agent-based simulation approach. Environ. Model. Softw. 2013, 45, 64–73. [Google Scholar] [CrossRef] [Green Version]
  37. Chen, W.B.; Xiao, D.N.; Li, X.Z. Classification, application, and creation of landscape indices. Chin. J. Appl. Ecol. 2002, 1, 121–125. [Google Scholar]
  38. Costanza, R.; d’Arge, R.; Groot, R.D.; Farber, S.; Grasso, M.; Hannon, B.; Limburg, K.; Naeem, S.; O’Neill, R.V.; Paruelo, J.; et al. The value of the world’s ecosystem services and natural capital. Nature 1997, 387, 253. [Google Scholar] [CrossRef]
  39. Xie, G.D.; Zhang, C.X.; Zhang, L.M.; Chen, W.H.; Li, S.M. Improvement of the evaluation method for ecosystem service value based on per unit area. J. Nat. Resour. 2015, 30, 1243–1254. [Google Scholar] [CrossRef]
  40. Kang, Y.L.; Qi, Y.A.; Guan, N. Analysis of heavy metals in soil in Jiaozuo city. Energy Environ. Prot. 2006, 20, 60–62. [Google Scholar]
  41. Li, X.H.; Wang, X.Y.; Yang, J.; Guo, H.X. Review on Heavy Metal Pollution to Soil and Corn near Coal Waste Rock Dump in Jiaozuo Diggings. Environ. Prot. Sci. 2009, 35, 66–68. [Google Scholar]
  42. Wang, Z.H.; Ren, J.; Tao, L.; Tian, C.X.; Hou, P.Q.; Jia, C.J. Analysis of heavy metals pollution in soil around the gangue dumpinYanma mine of Jiaozuo city in Henan province. Resour. Environ. Eng. 2007, 21, 272–275. [Google Scholar]
  43. Boularbah, A.; Schwartz, C.; Bitton, G.; Aboudrar, W.; Ouhammou, A.; Morel, J.L. Heavy metal contamination from mining sites in South Morocco: 2. Assessment of metal accumulation and toxicity in plants. Chemosphere 2006, 63, 811–817. [Google Scholar] [CrossRef]
  44. Meng, Z.; Liu, T.; Bai, X.; Liang, H. Characteristics and Assessment of Soil Heavy Metals Pollution in the Xiaohe River Irrigation Area of the Loess Plateau, China. Sustainability 2022, 14, 6479. [Google Scholar] [CrossRef]
  45. Zhang, H.B. Research of Land Ecological QualityEvaluation and Spatial Differentiation at CityDomain Scale. Ph.D. Thesis, Henan Polytechnic University, Jiaozuo, China, 2015. [Google Scholar]
  46. Chen, Y.; Cai, H.S.; Zhang, X.L.; Zeng, H.; Shao, H.; Hong, T.L. Comprehensive evaluation of spatially ecological quality of Rao River Basin and its spatial differentiation based on multi-objective comprehensive evaluation method. Acta Ecol. Sin. 2021, 41, 2236–2247. [Google Scholar]
  47. Shi, F.; Li, M. Assessing Land Cover and Ecological Quality Changes under the New-Type Urbanization from Multi-Source Remote Sensing. Sustainability 2021, 13, 11979. [Google Scholar] [CrossRef]
  48. Zhang, S.; Zhang, K. Comparison between General Moran’s Index and Getis-Ord Genara G of spatial autocorrelation. Acta Sci. Nat. Univ. Sunyatseni 2007, 4, 93–97. [Google Scholar]
  49. Anselin, L.; Syabri, I.; Kho, Y. GeoDa: An Introduction to Spatial Data Analysis. In Handbook of Applied Spatial Analysis: Software Tools, Methods and Applications; Fischer, M.M., Getis, A., Eds.; Springer: Berlin/Heidelberg, Germany, 2010; pp. 73–89. ISBN 978-3-642-03647-7. [Google Scholar]
  50. Wang, X.C.; Wang, S.D.; Zhang, H.B. Spatiotemporal pattern of vegetation net primary productivity in Henan Province of China based on MOD17A3. Chin. J. Ecol. 2013, 31, 2797–2805. [Google Scholar]
  51. Zhang, J.; Wen, G.C.; Wang, E.Y.; Xie, H.B.; Liu, Z.J. Dynamic monitoring and evaluation of ecological environment at Jiaozuo City based on remote sensing ecological index. Bulle. Soil Water Conserv. 2020, 40, 107–114. [Google Scholar]
  52. Wang, G. Analysis on ecological sustainability in resource-based cities in transformation period: A case of Jiaozuo City. Ecol. Econ. 2016, 32, 53–56. [Google Scholar]
Figure 1. Location of the study zone (names of each mine are listed in Table 1).
Sustainability 14 10427 g001
Figure 2. Village-level grading results of comprehensive evaluation of land ecological quality in the study area.
Sustainability 14 10427 g002
Figure 3. Grid-level grading results of comprehensive evaluation of land ecological quality in the study zone.
Sustainability 14 10427 g003
Figure 4. Area proportion of different land ecological quality grades in different years.
Sustainability 14 10427 g004
Figure 5. Land ecological quality index sequence diagram of the study zone and mining fields.
Sustainability 14 10427 g005
Figure 6. Spatial aggregation map of land ecological quality index in the study zone.
Sustainability 14 10427 g006
Figure 7. Area proportion of first obstacle factors of land ecological quality in the study zone.
Sustainability 14 10427 g007
Figure 8. Area proportion of second obstacle factors of land ecological quality in the study zone.
Sustainability 14 10427 g008
Figure 9. Area proportion of third obstacle factors of land ecological quality in the study zone.
Sustainability 14 10427 g009
Figure 10. Distribution of first obstacle factors of land ecological quality in the study zone.
Sustainability 14 10427 g010
Figure 11. Distribution of second obstacle factors of land ecological quality in the study zone.
Sustainability 14 10427 g011
Figure 12. Distribution of third obstacle factors of land ecological quality in the study zone.
Sustainability 14 10427 g012
Table 1. IDs and names of the ten mines of the study zone.
IDMine NameIDMine NameIDMine Name
1Xiaoma Mine2Zhongma Mine3Fengying Mine
4Hanwang Mine5Yanma Mine6Fangzhuang No.1 Mine
7Jiulishan Mine8Baizhuang Mine9Fangzhuang No.2 Mine
10Guhanshan Mine
Table 2. Evaluation index system of land ecological quality in the study zone.
Criterion Layer (Weight)Index Layer (Weight)Attribute
Ecological foundation (0.3509)Soil organic matter content (0.1093)+
Effective soil thickness (0.1093)+
Topographic position index (0.3689)
Vegetation coverage (0.2063)+
Net primary productivity (NPP) (0.2063)+
Ecological structure (0.1891)Land-use structure index (0.4488)+
Landscape aggregation index (0.0819)
Landscape dominance index (0.2346)
Landscape diversity index (0.2346)+
Ecological benefit (0.1091)Ecosystem service value (1)+
Ecological stress (0.3509)Comprehensive soil pollution index (0.2809)
Damaged land proportion (0.3546)
Disturbance index of industrial and mining land (0.3546)
Table 3. Mean random consistency index.
Matrix Order12345678
RI000.580.901.121.241.321.41
Table 4. Global Moran’s I value and test coefficient of land ecological quality index.
Moran’s I/Z19801990200020102020
Moran’s I0.400.410.250.450.38
Z(I)5.625.773.496.384.39
Z(I) > 2.58 represents a significant level of 1%.
Publisher’s Note: MDPI stays neutral with regard to jurisdictional claims in published maps and institutional affiliations.

