
Flash Flood Assessment and Management for Sustainable Development Using Geospatial Technology and WMS Models in Abha City, Aseer Region, Saudi Arabia


Abstract
:1. Introduction
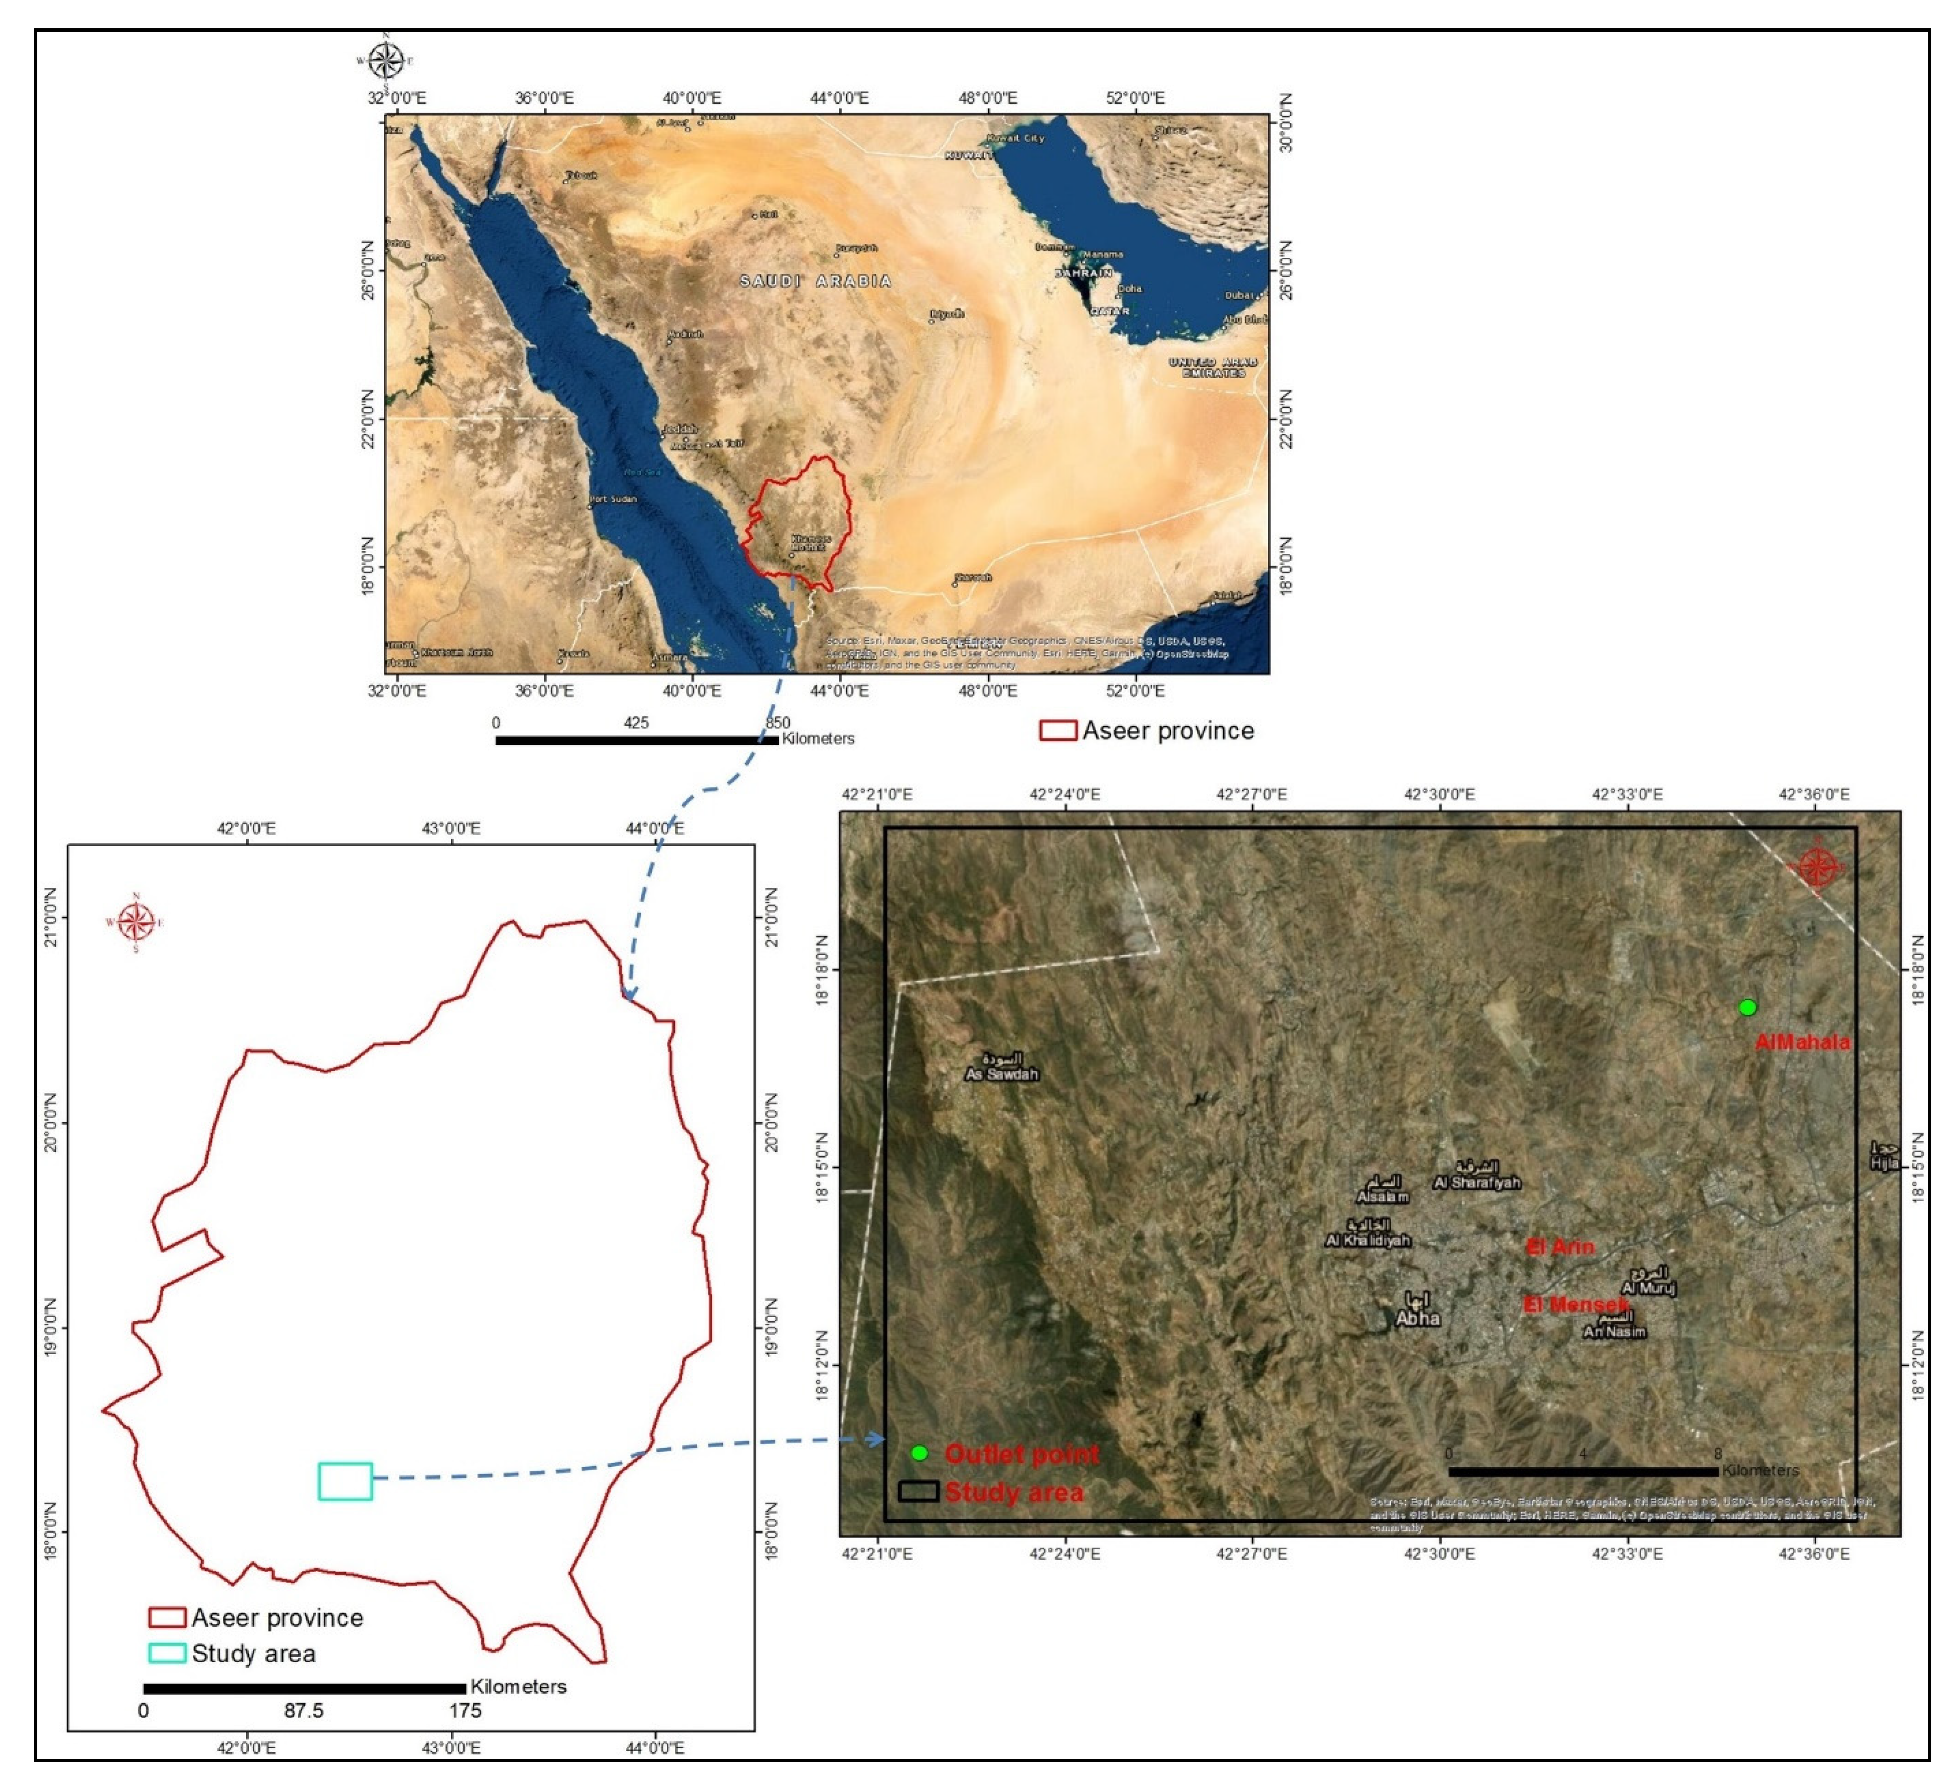
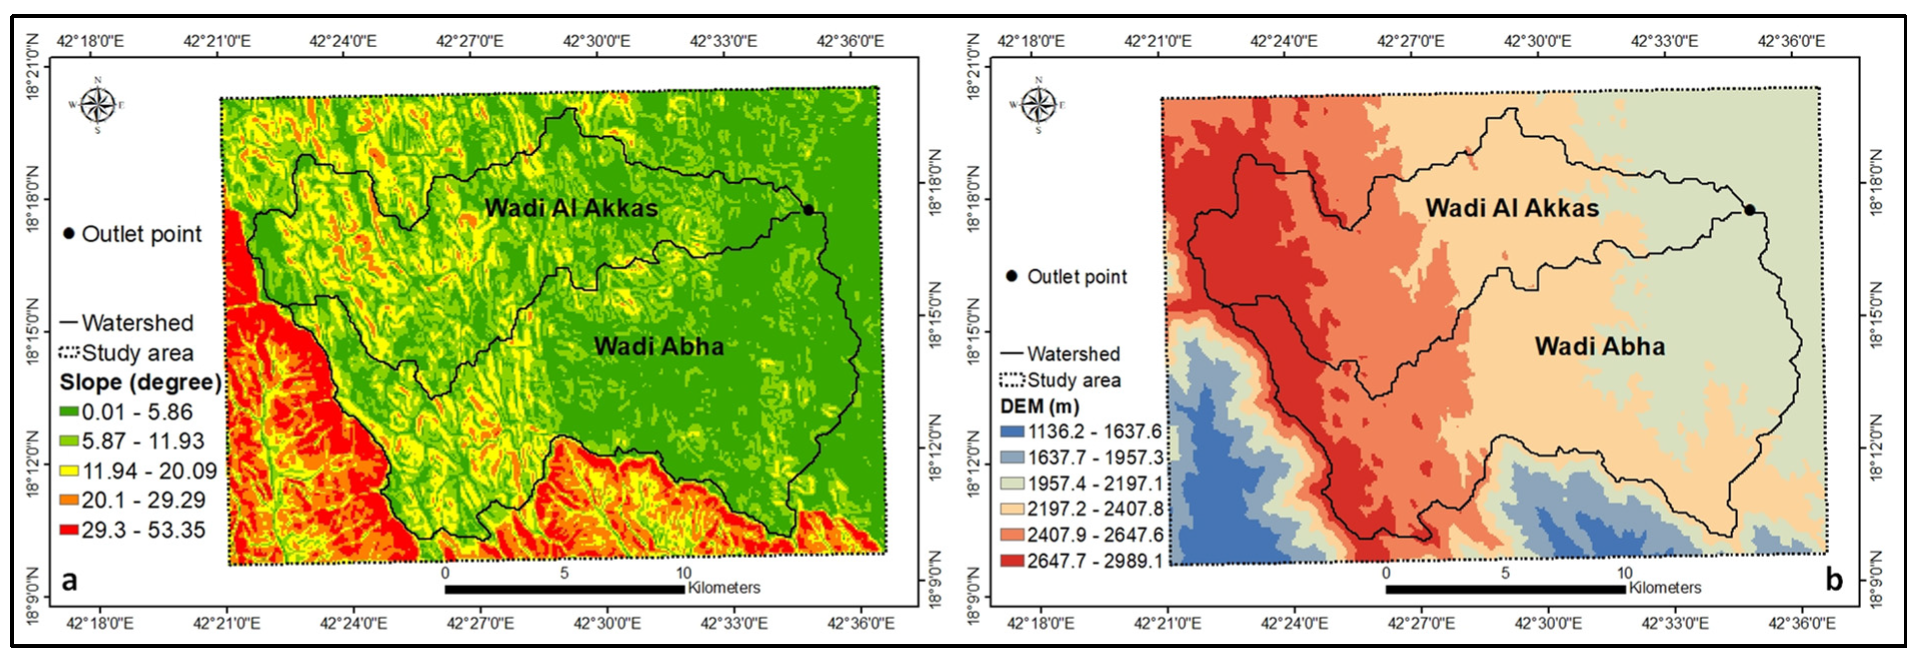
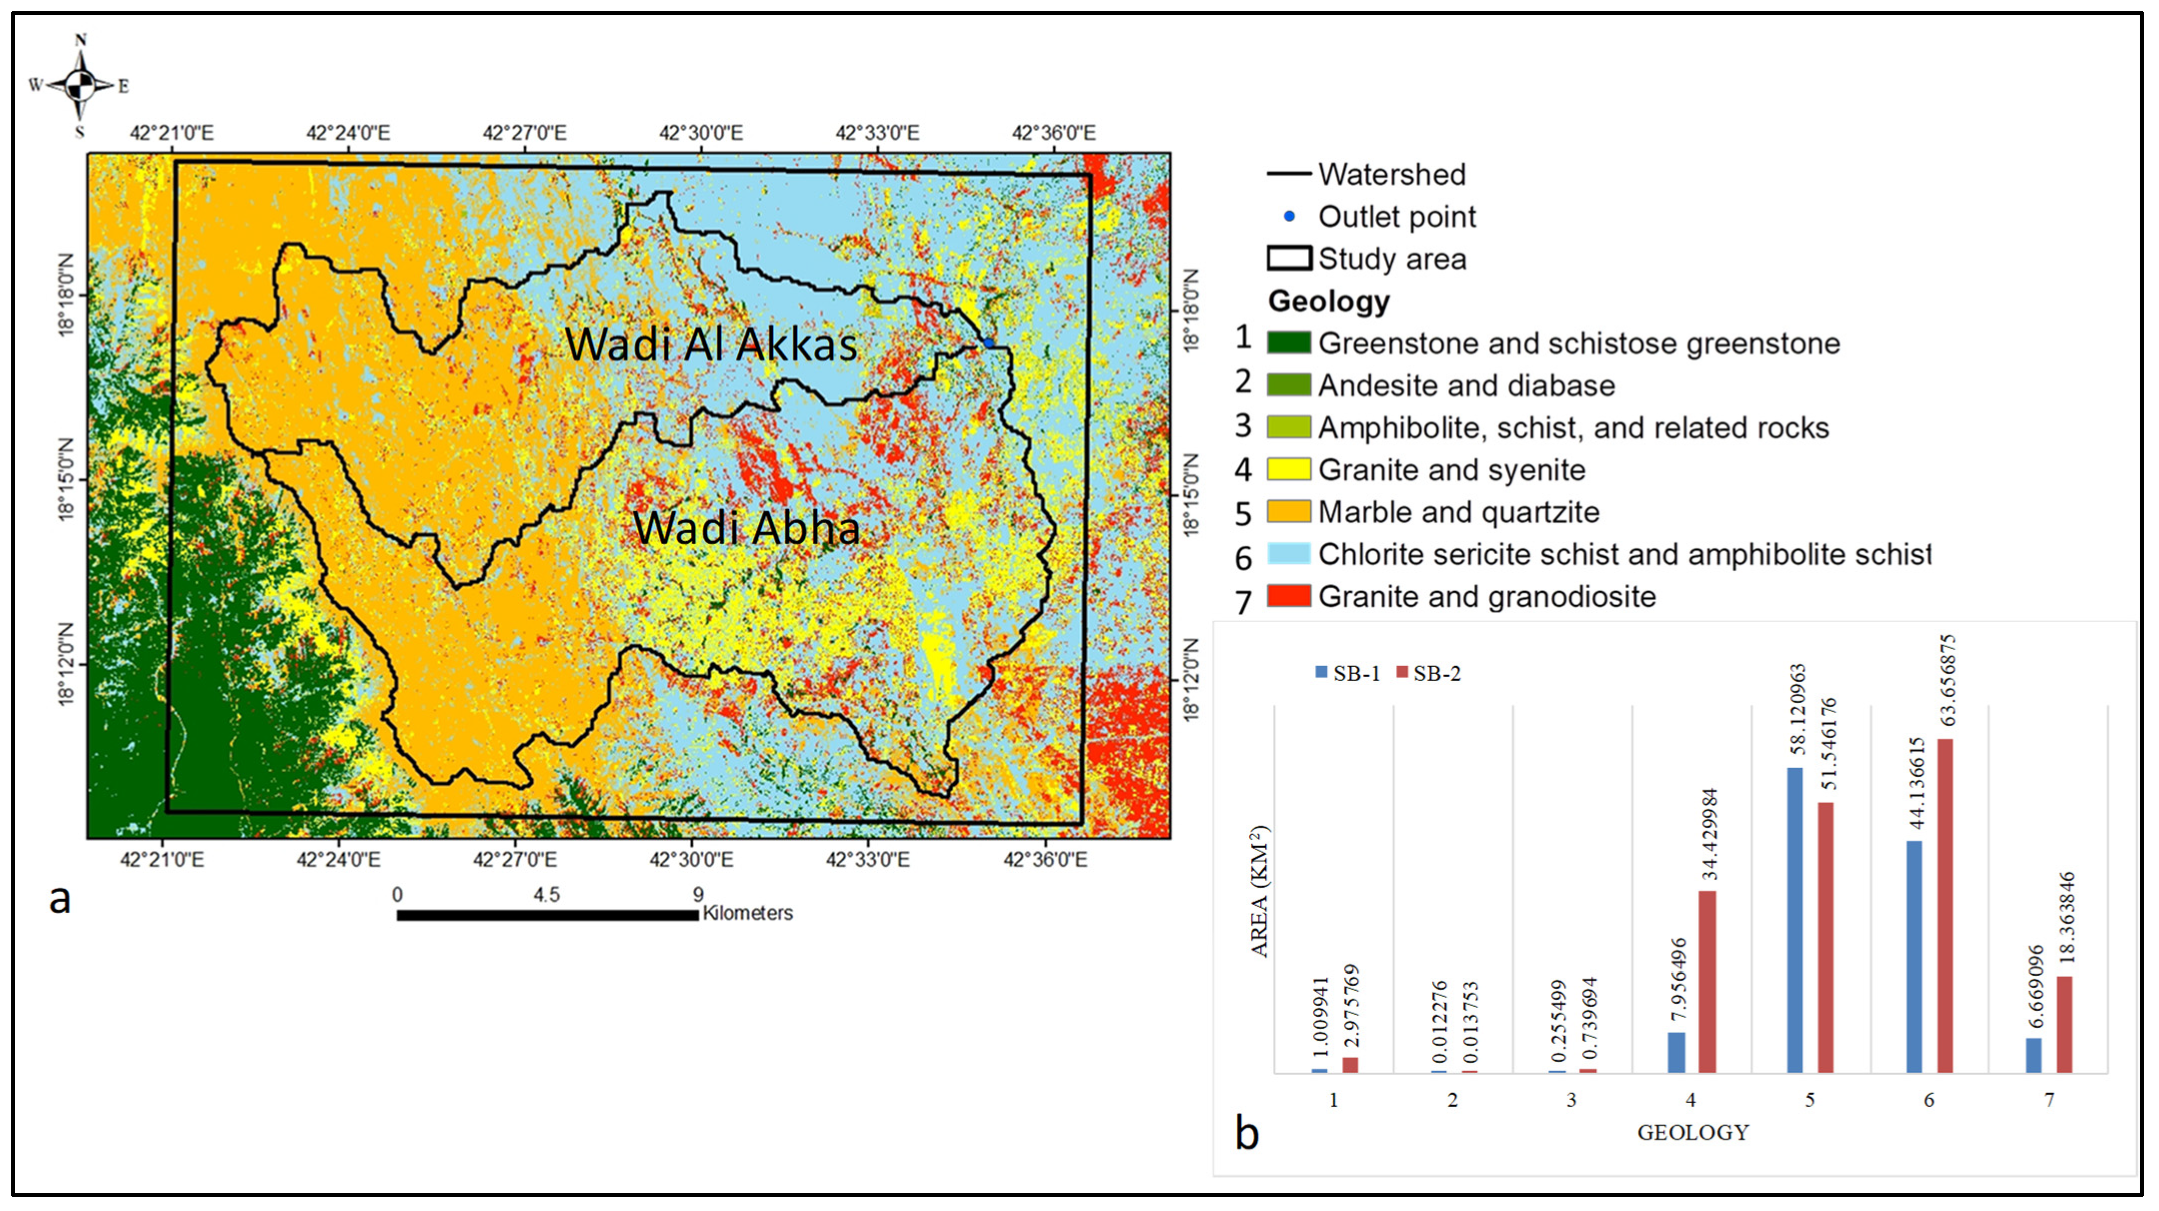
2. Study Area
3. Materials and Methods
3.1. General Ideas
3.2. Satellite Data
3.3. Hydrological Data
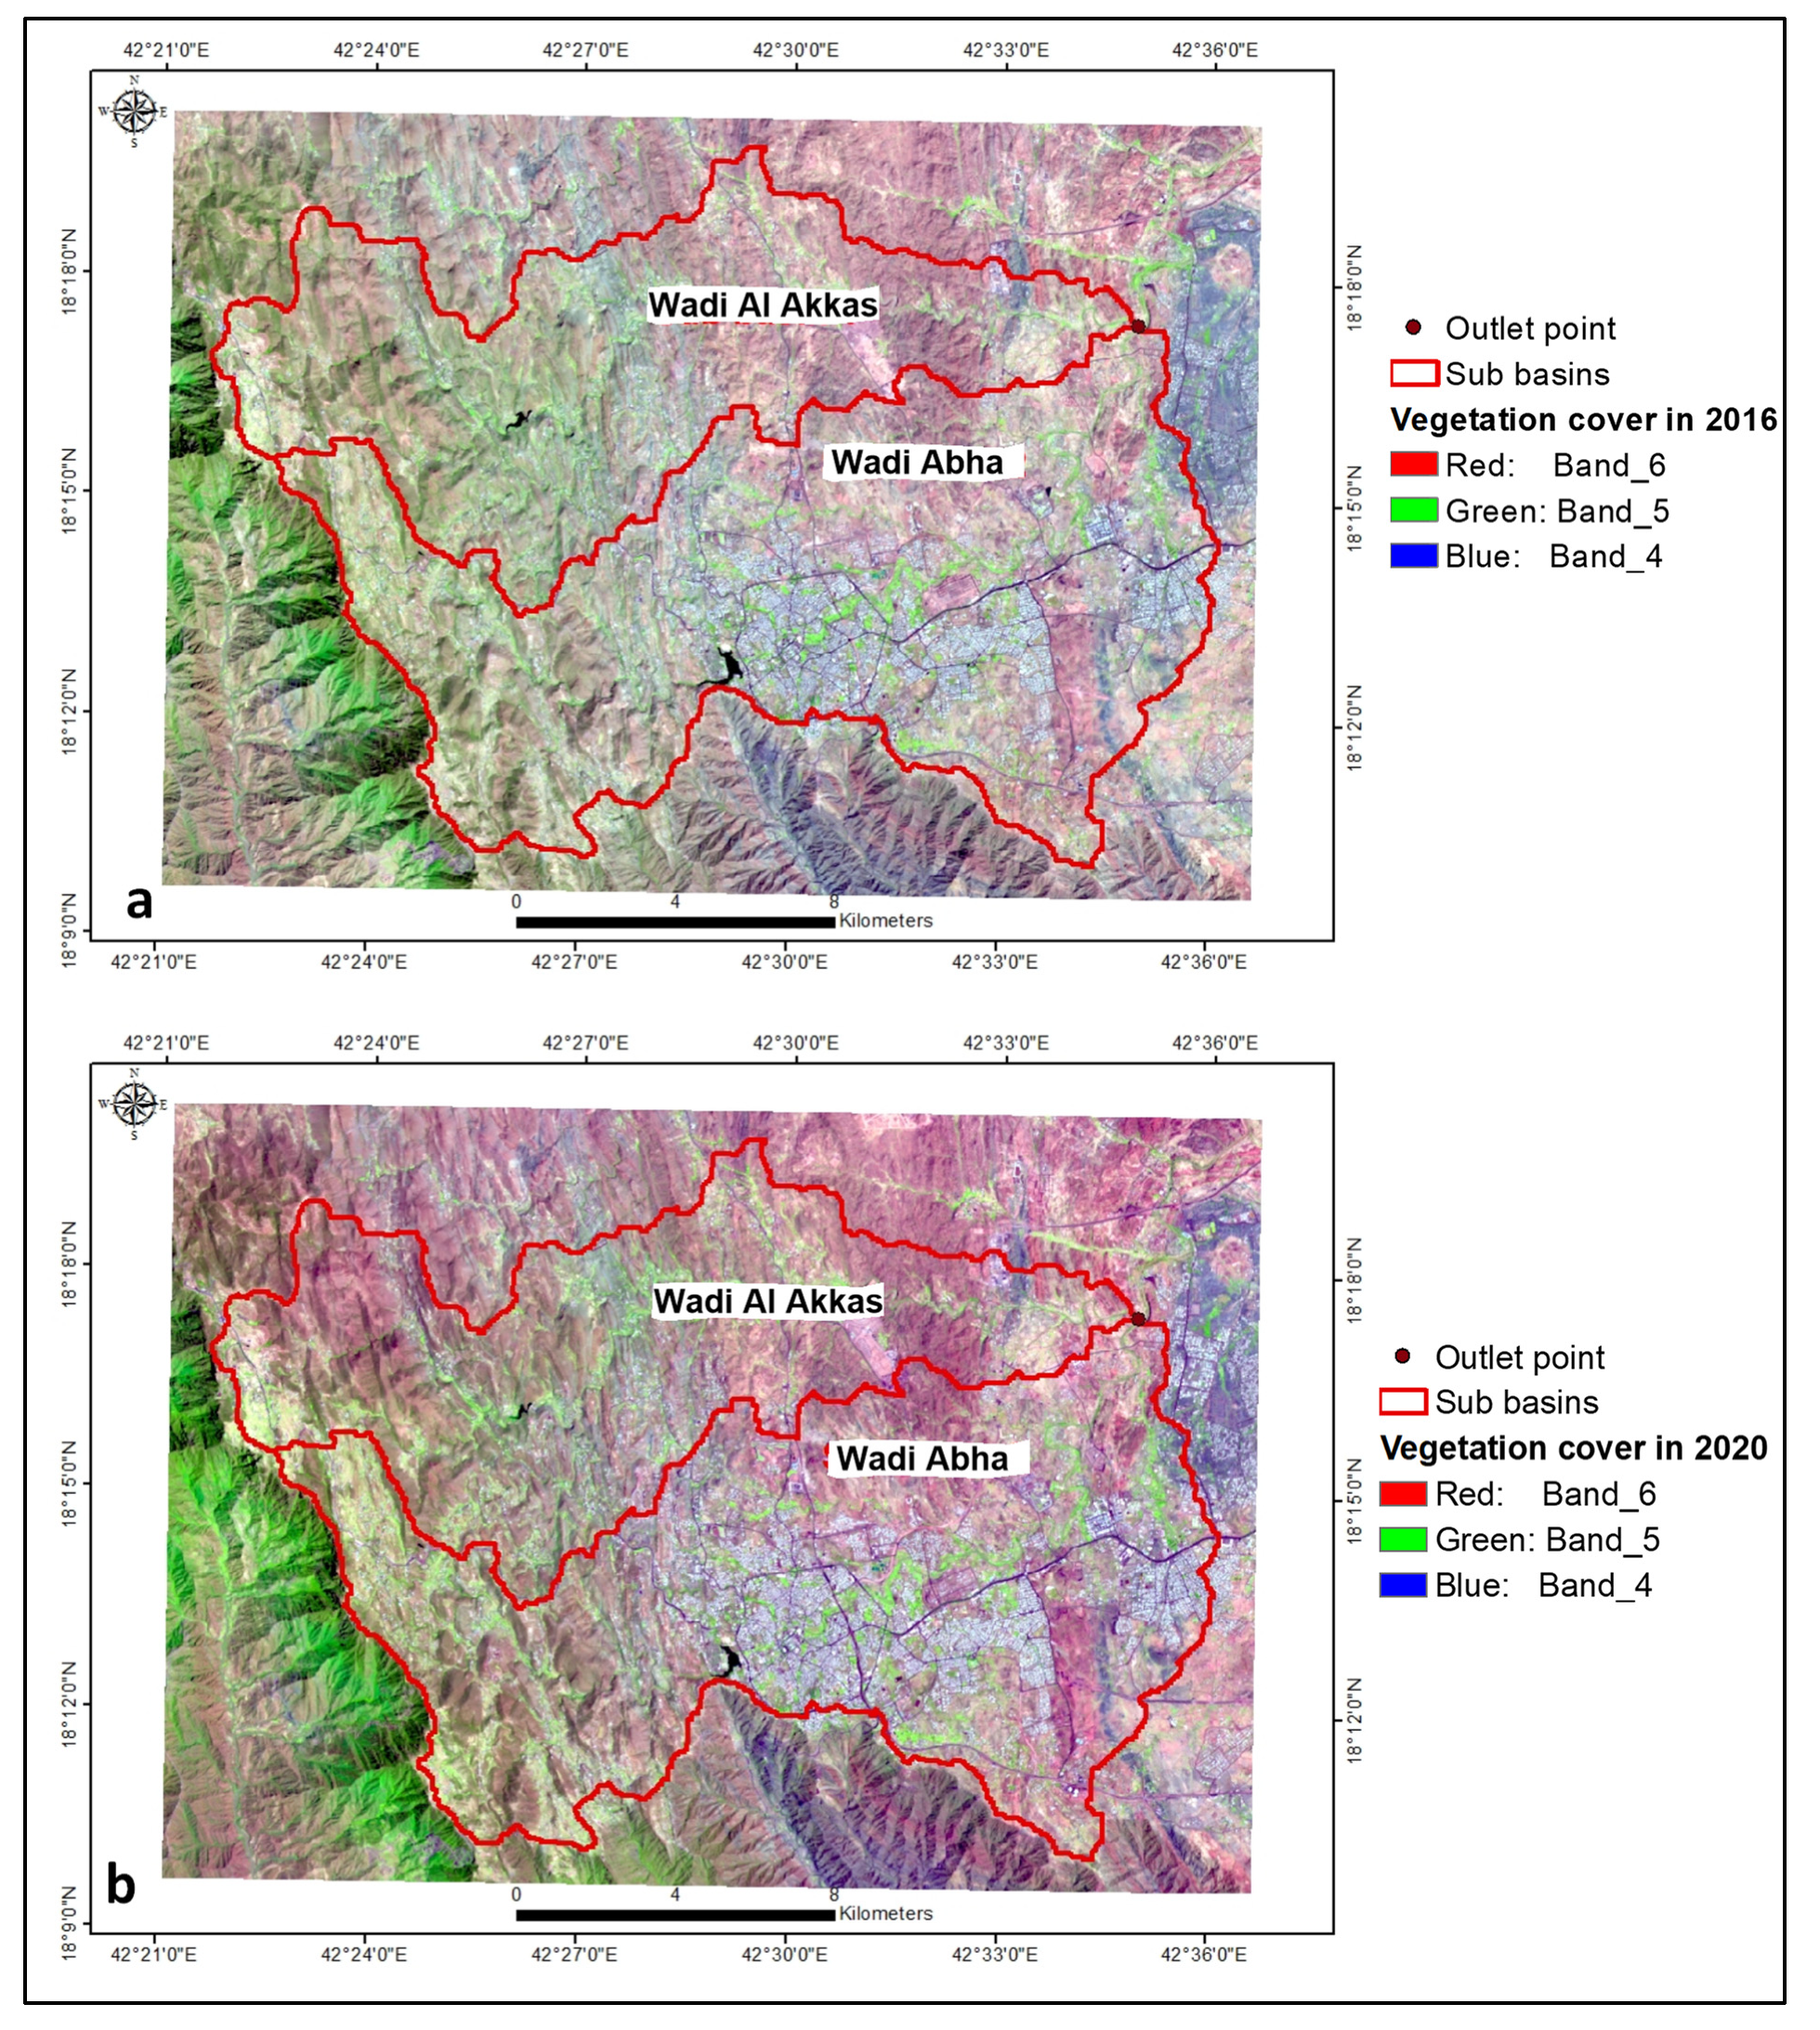
3.4. Land Cover Change
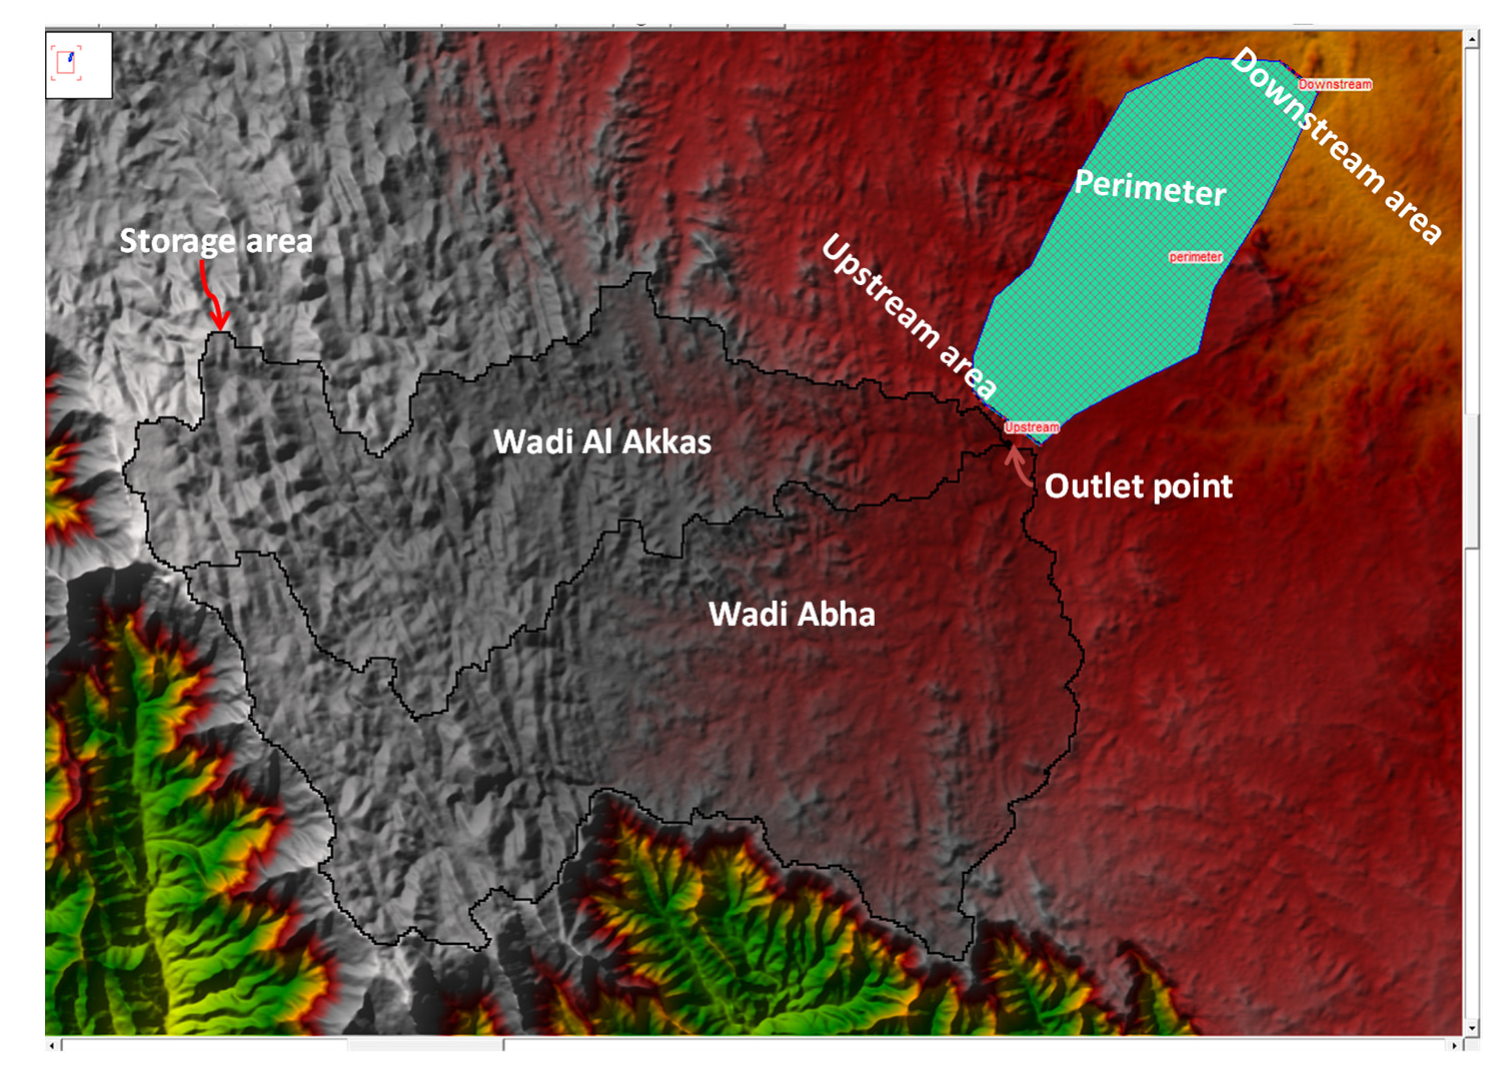
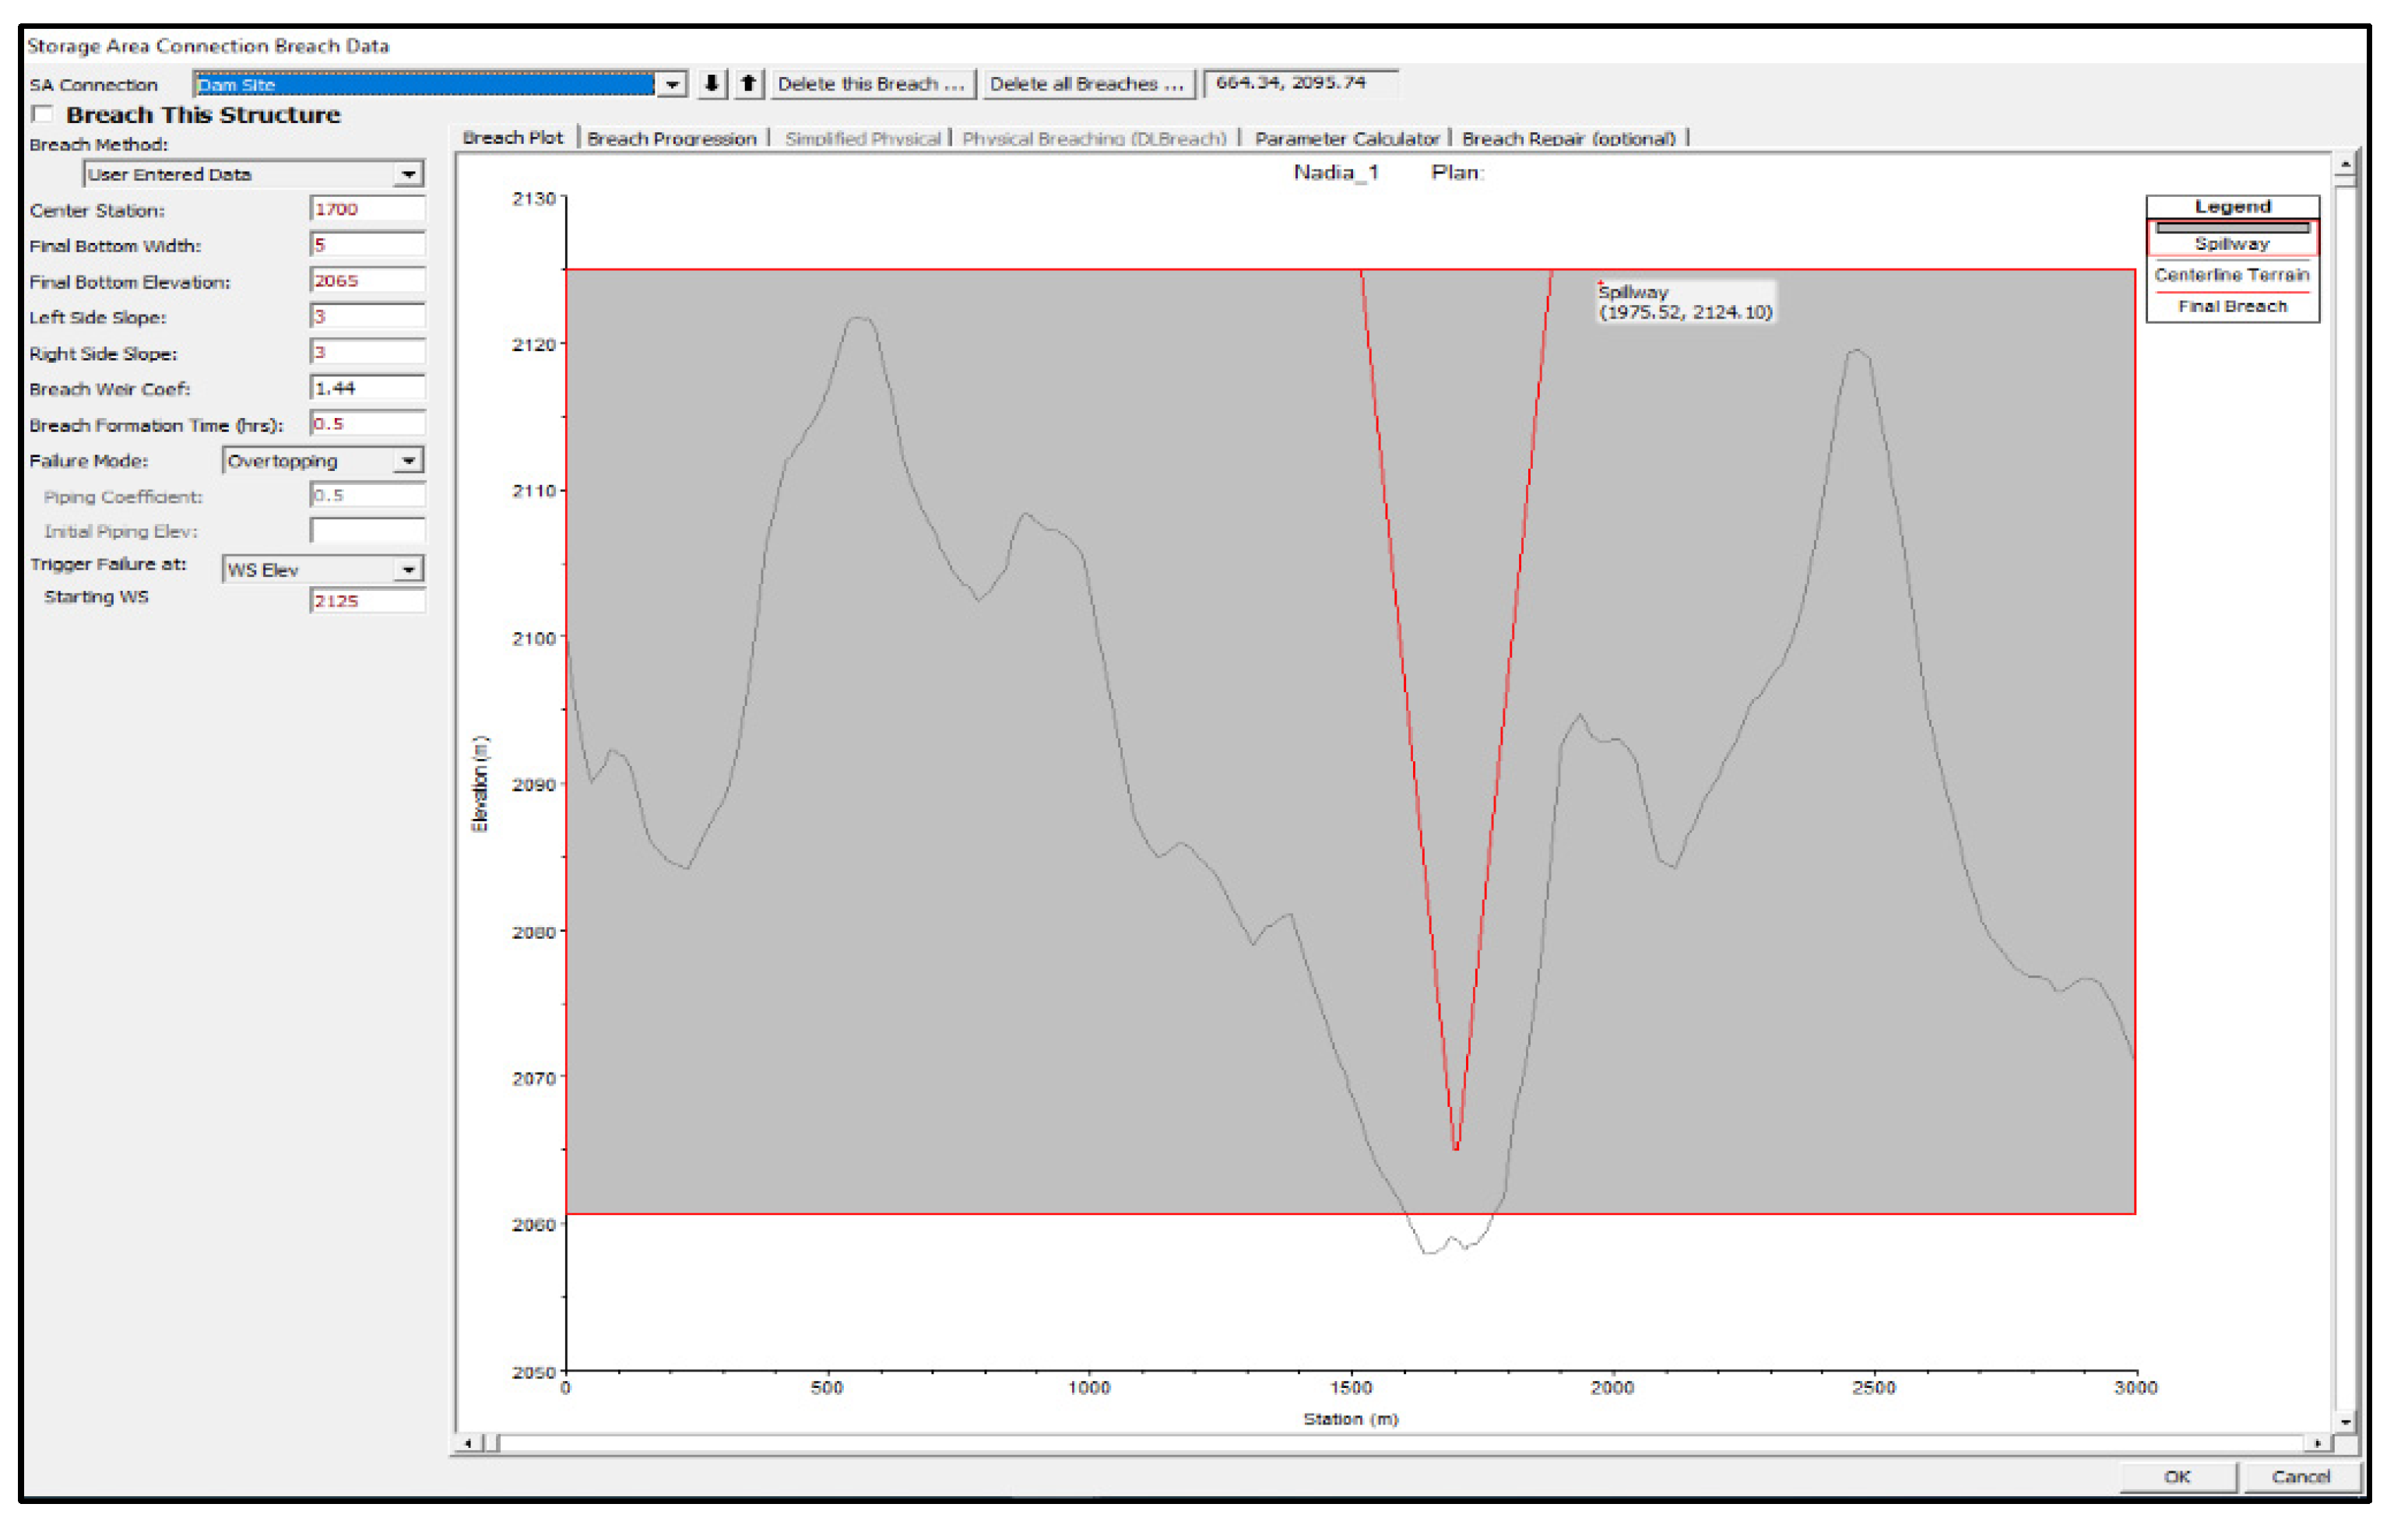
3.5. HEC-RAS 2D Software (Mitigation and Protection from Flooding Risks)
4. Results and Discussion
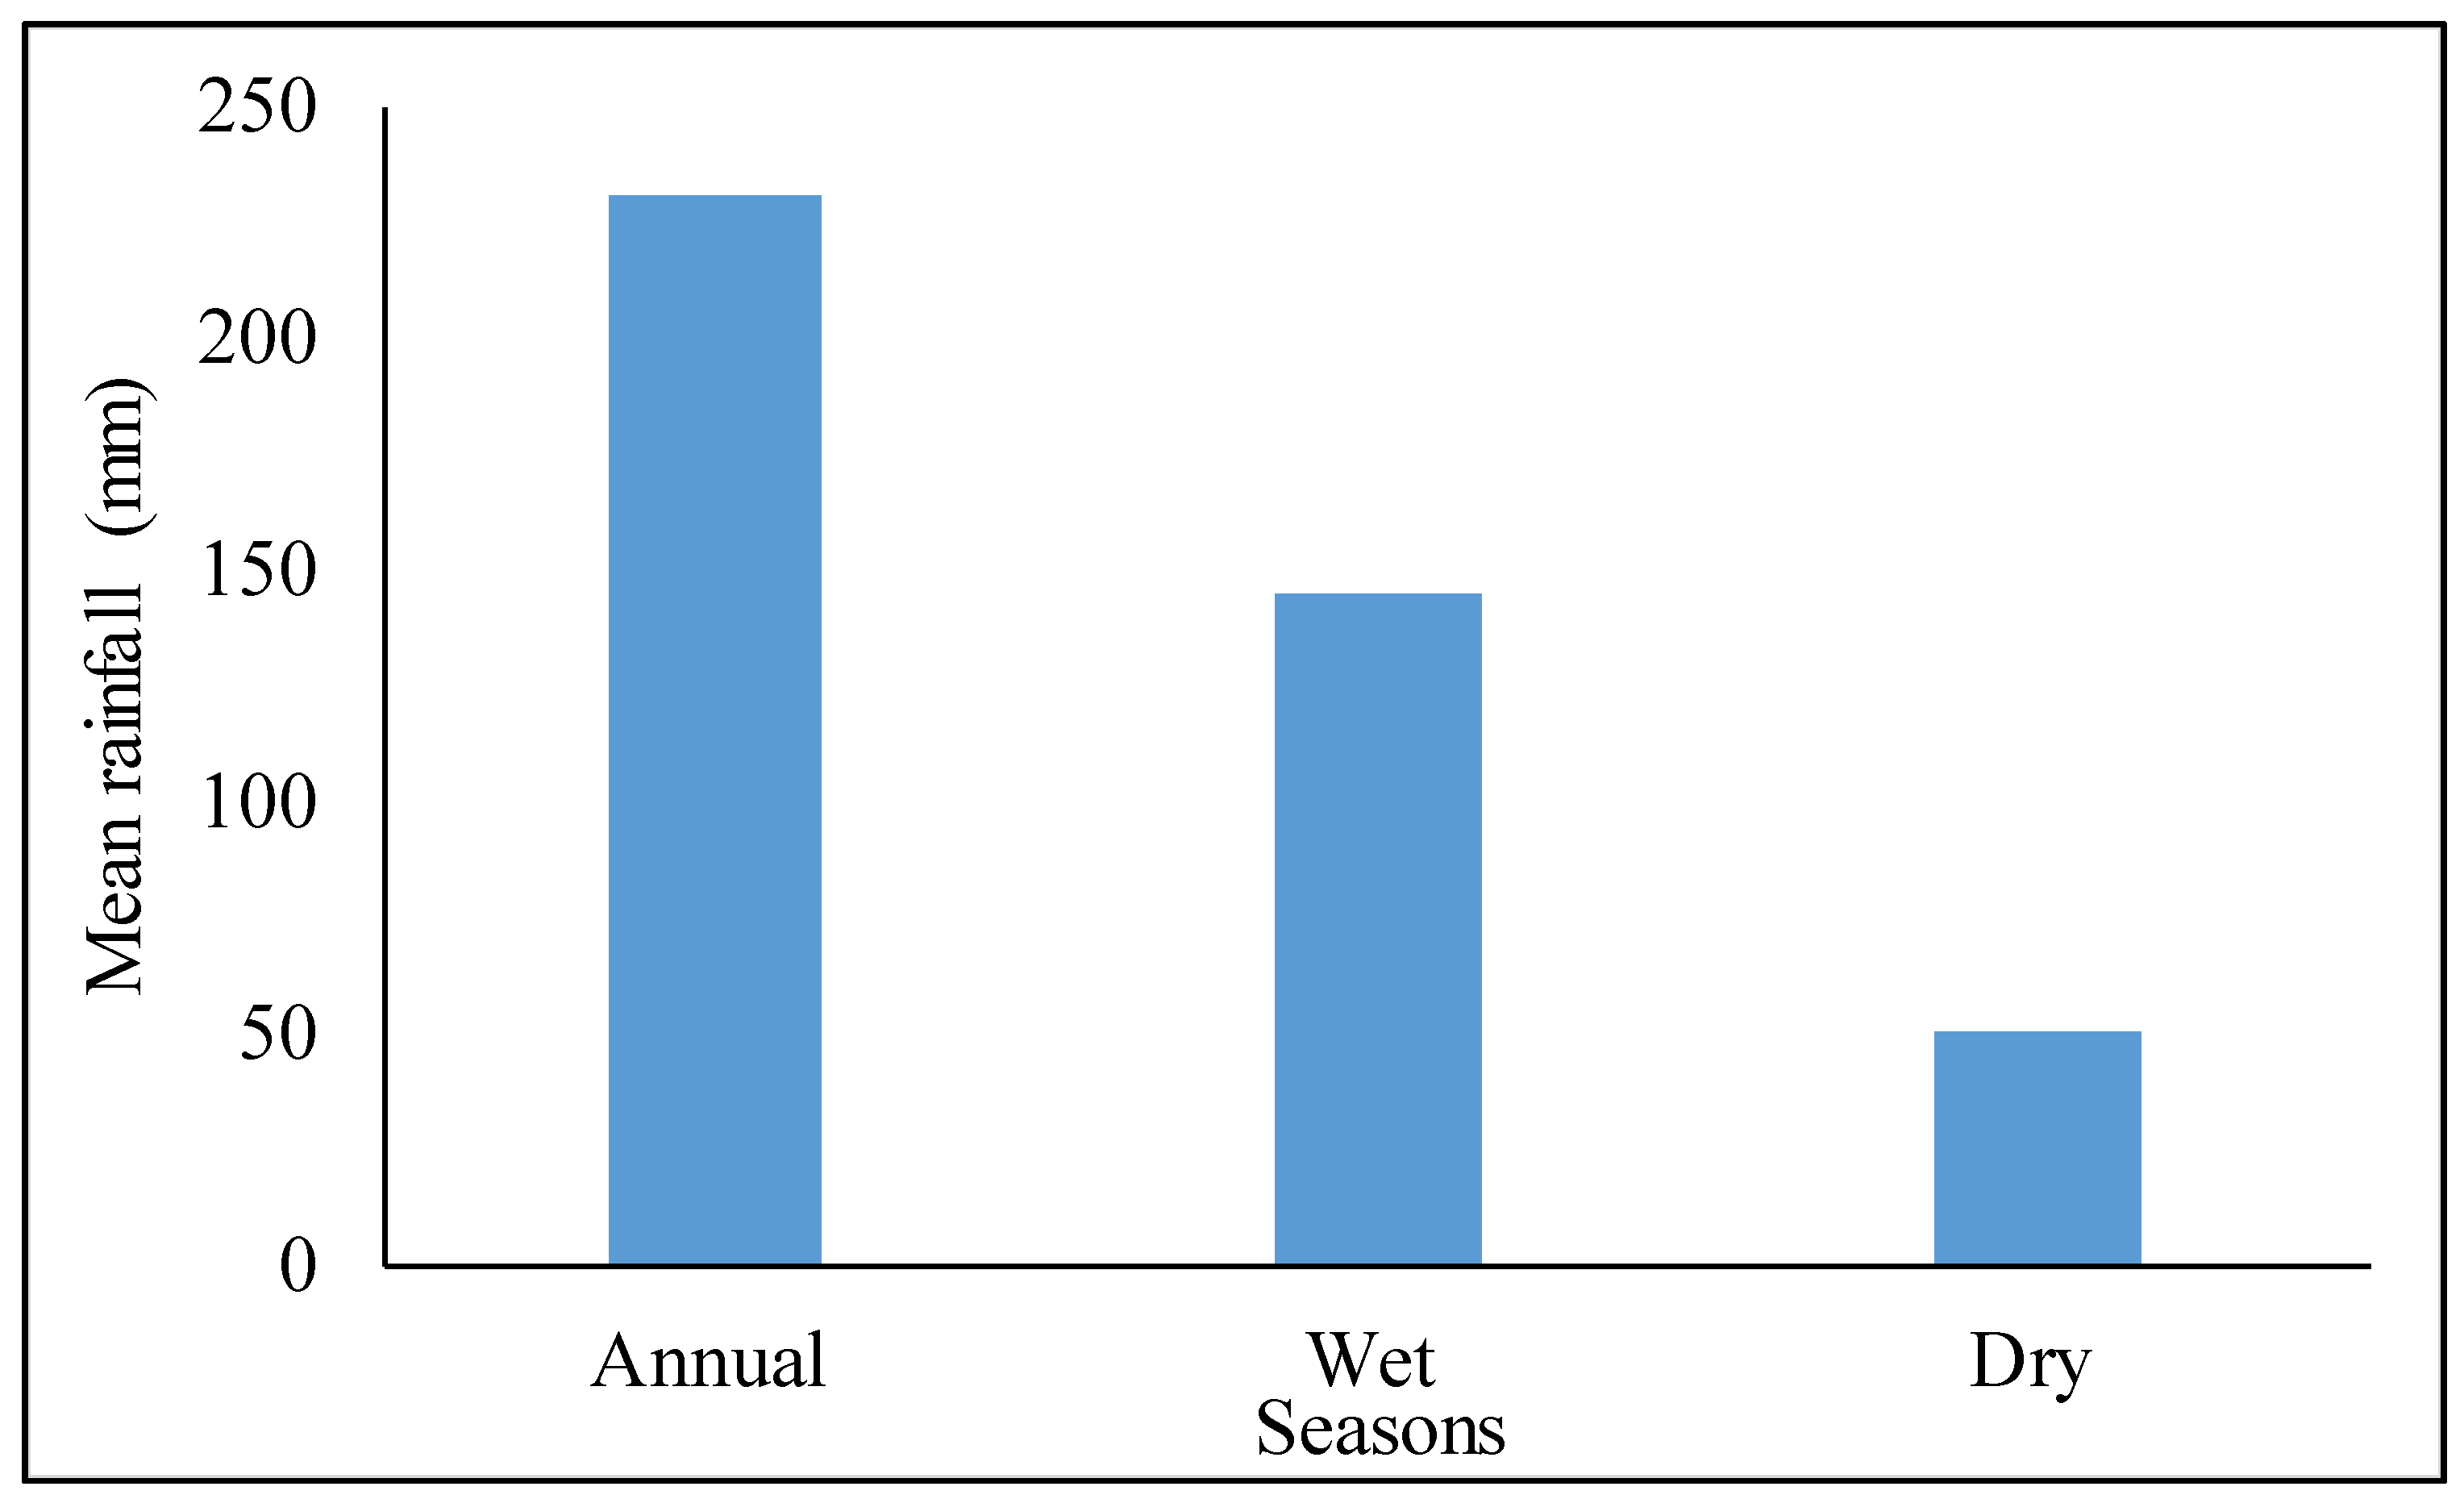
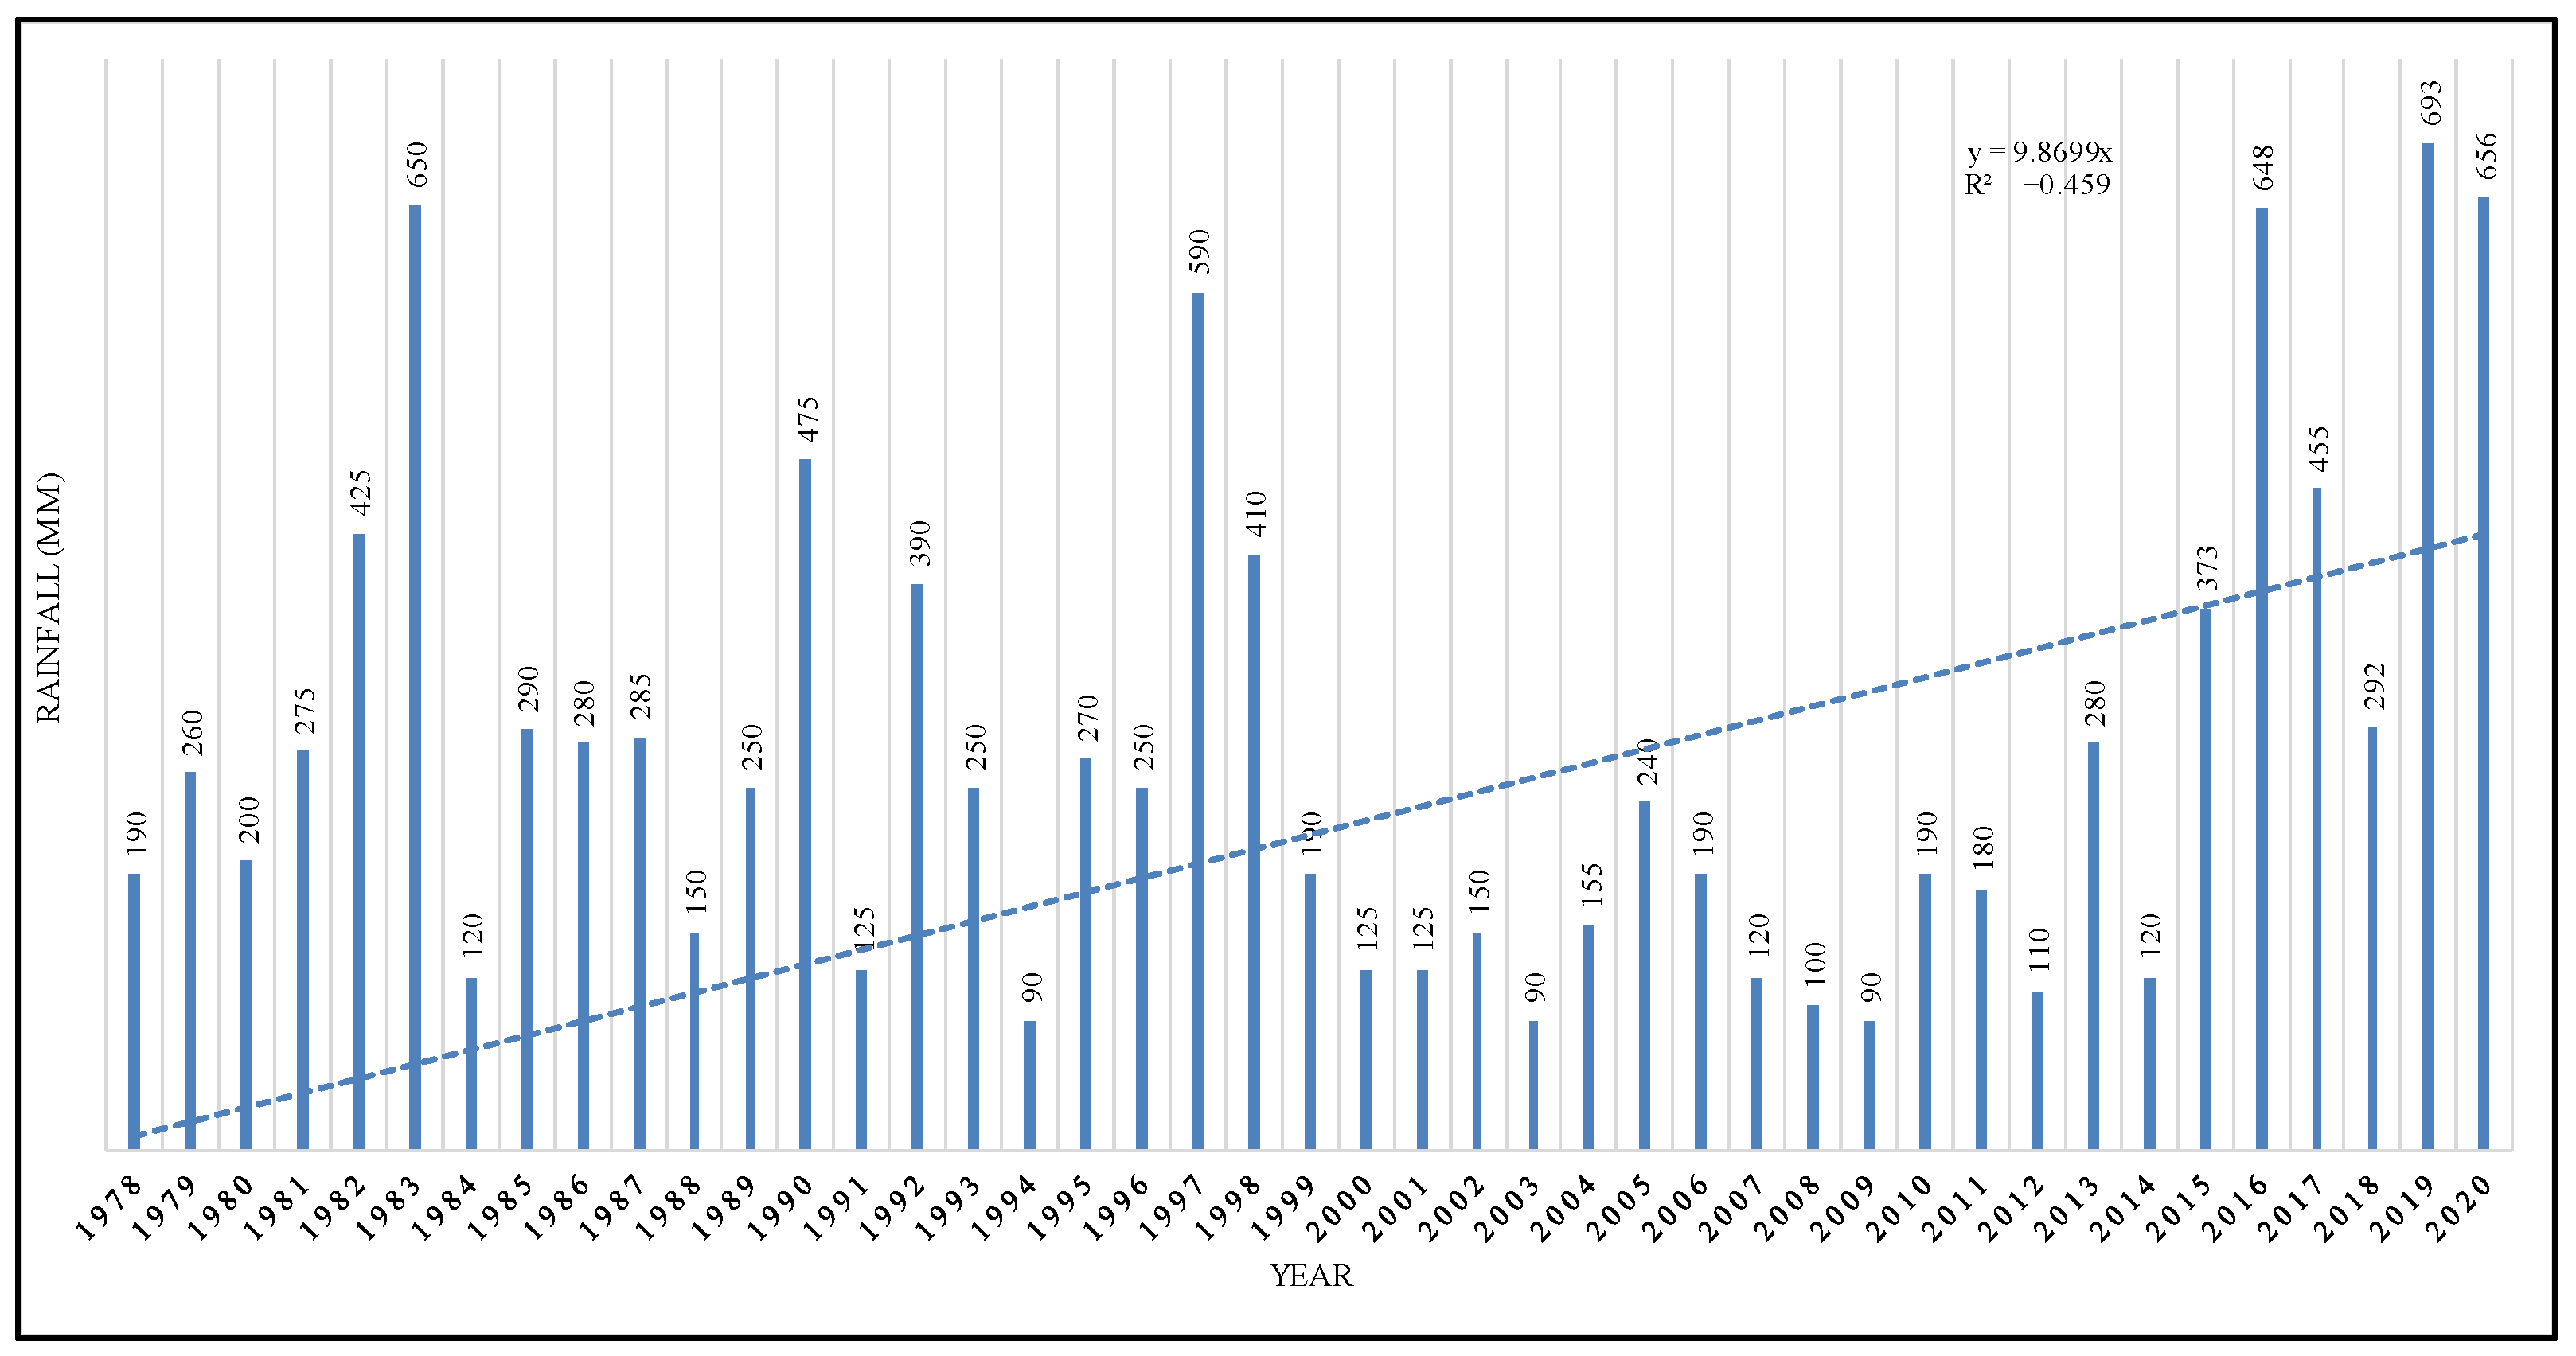
4.1. Rainfall Trend
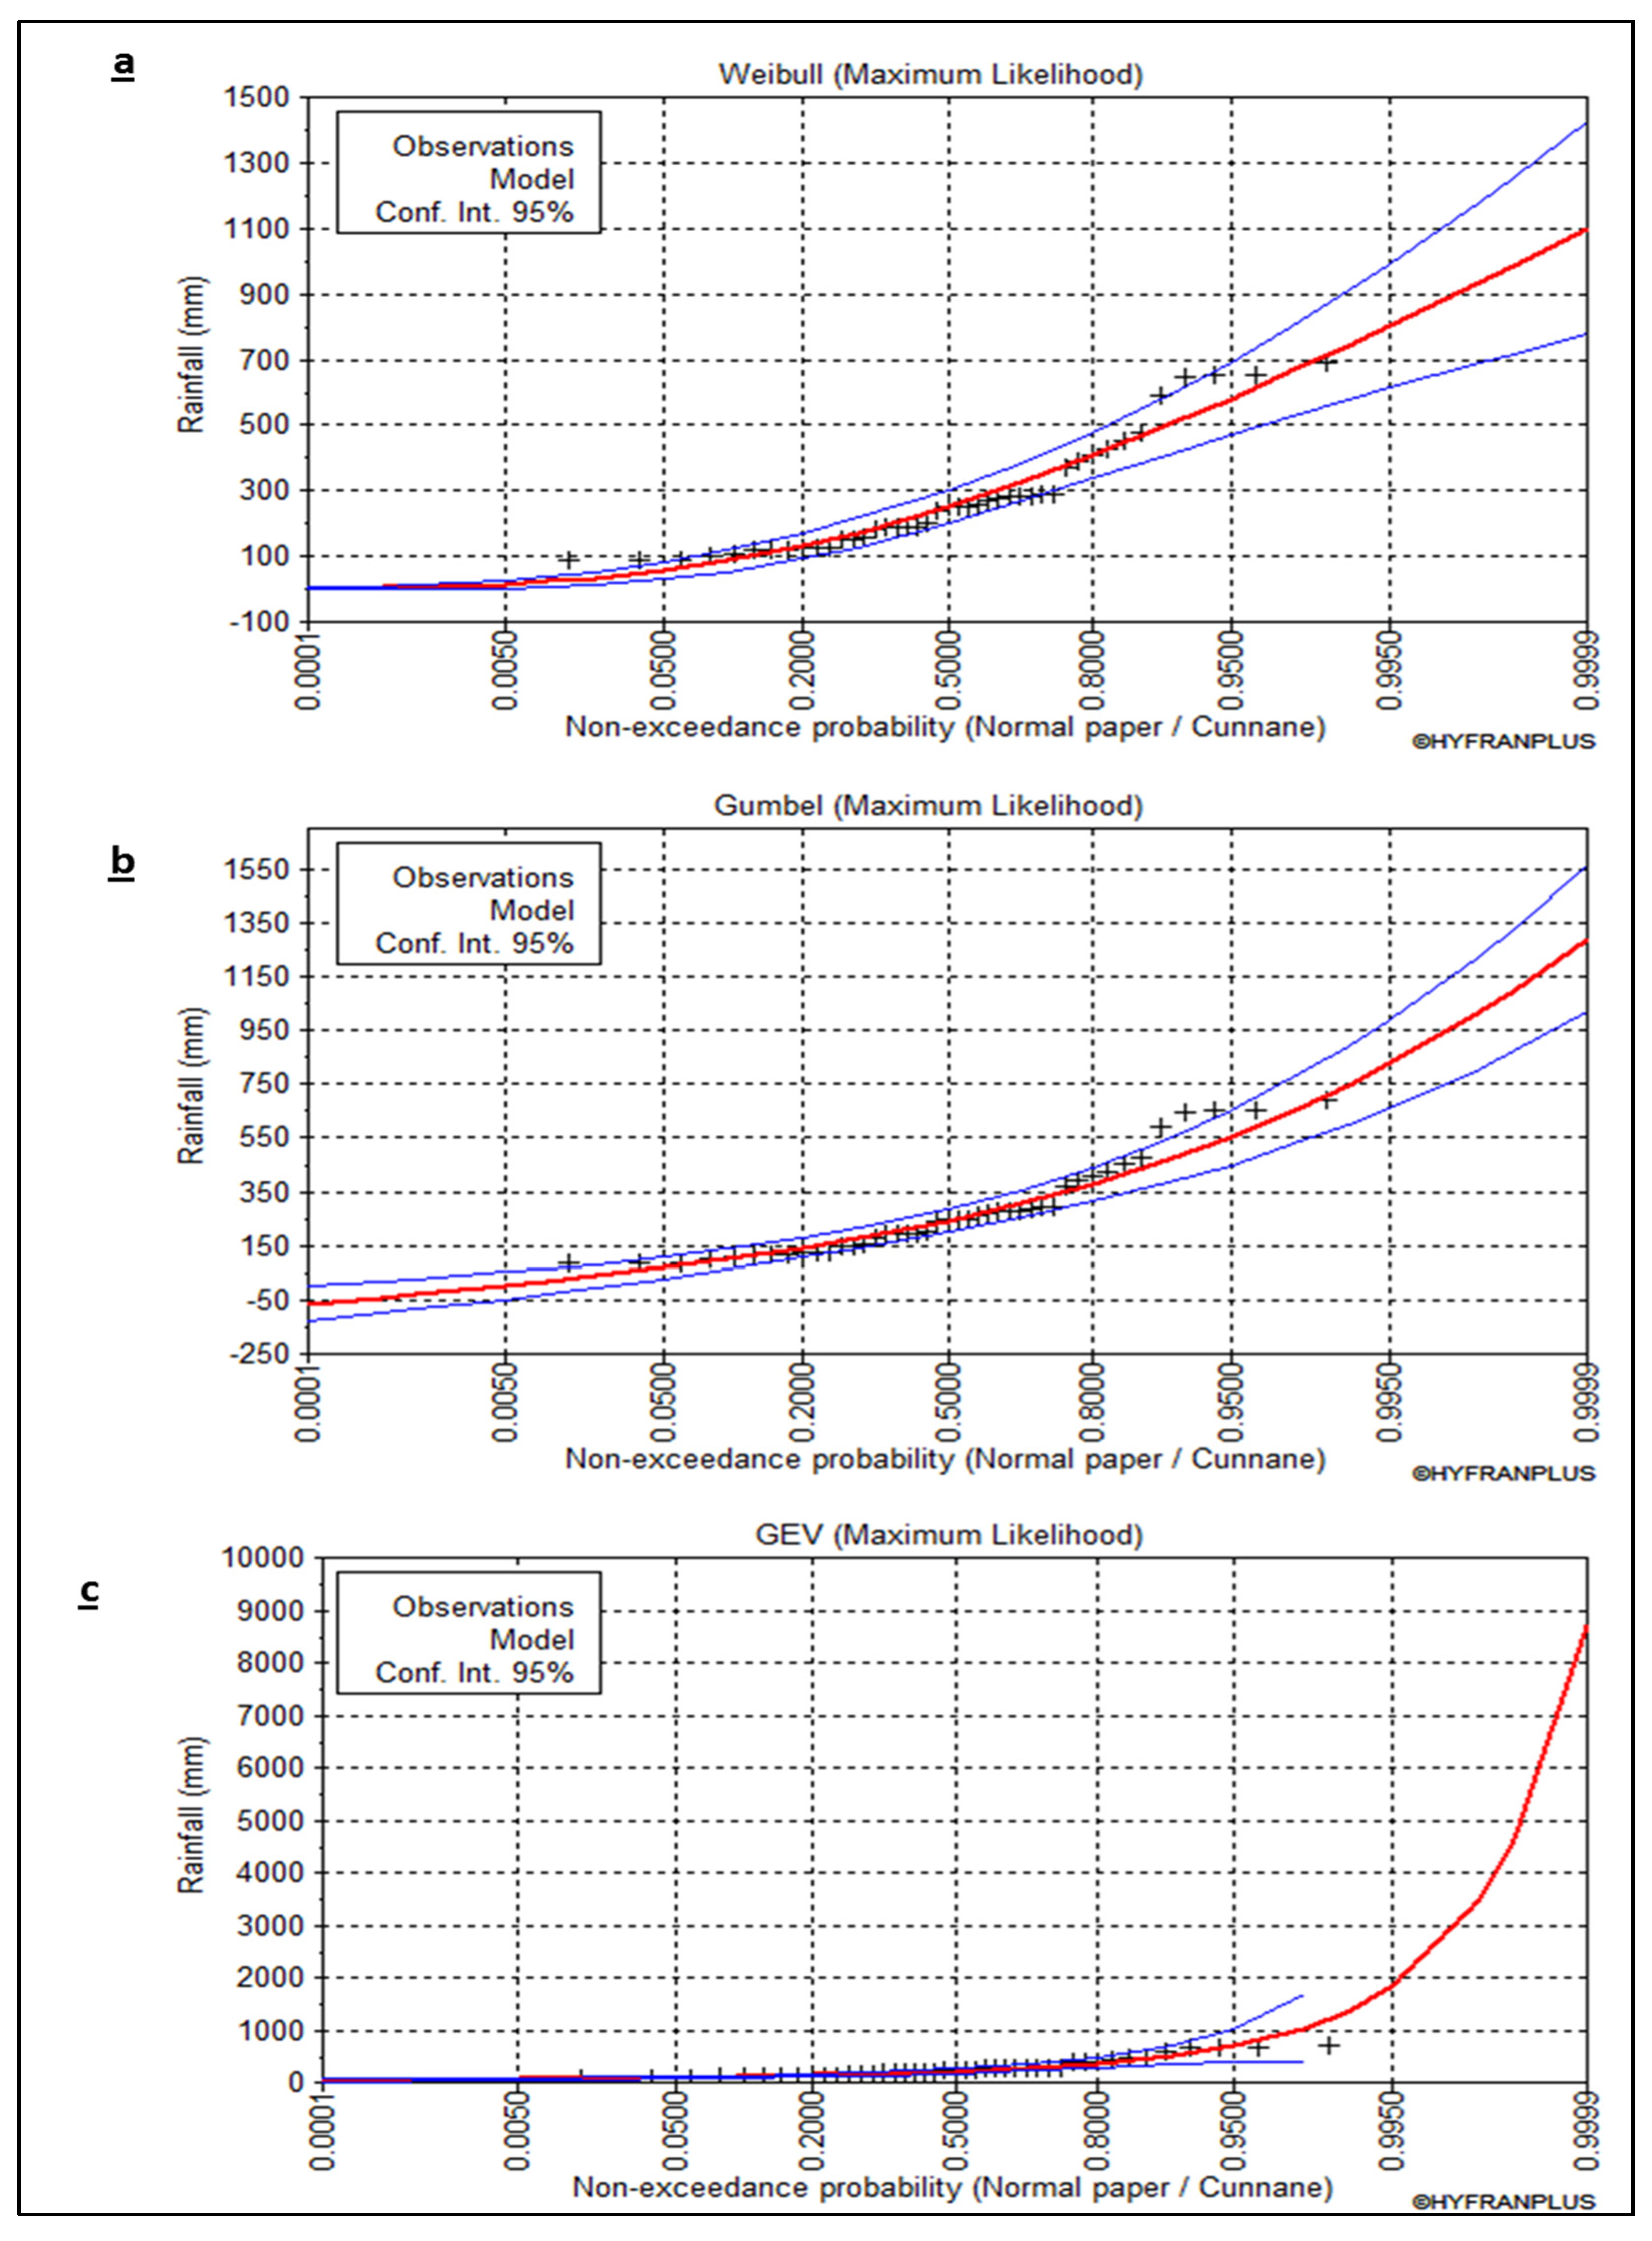
4.2. Precipitation Analysis of Watersheds
4.3. Drainage Networks and Basins Characteristics
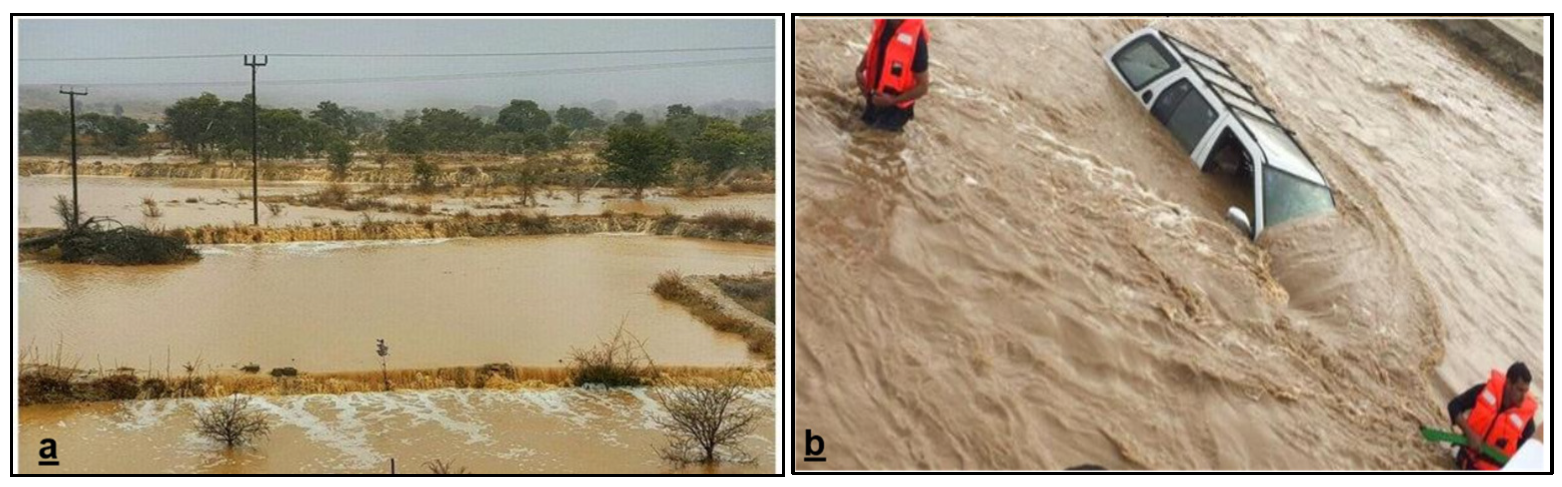
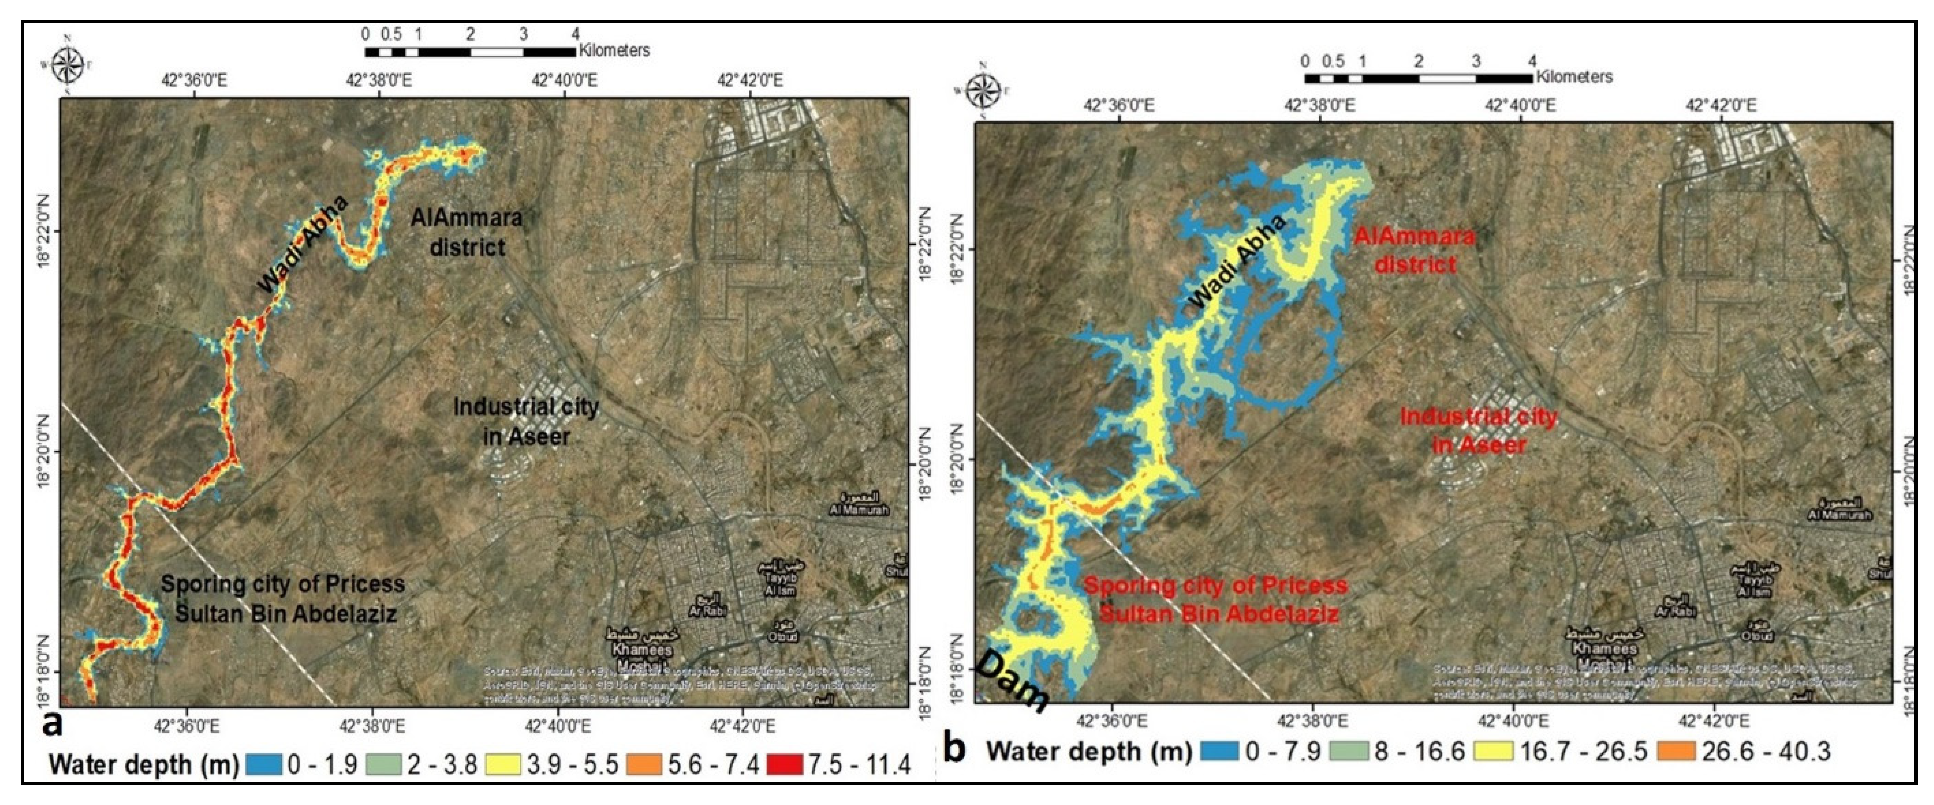
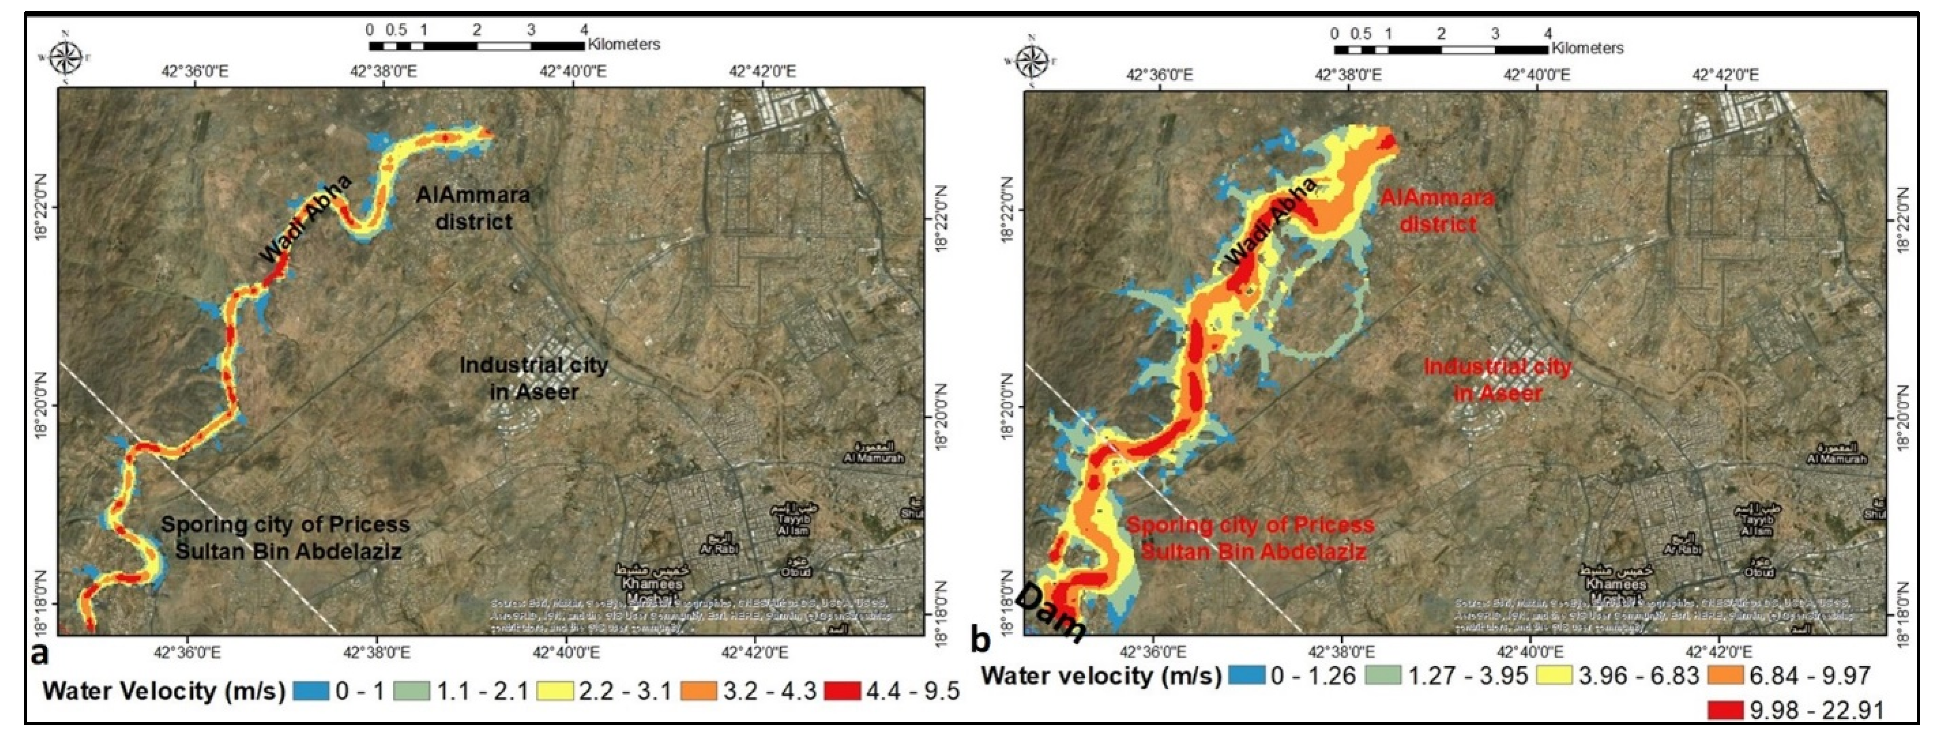
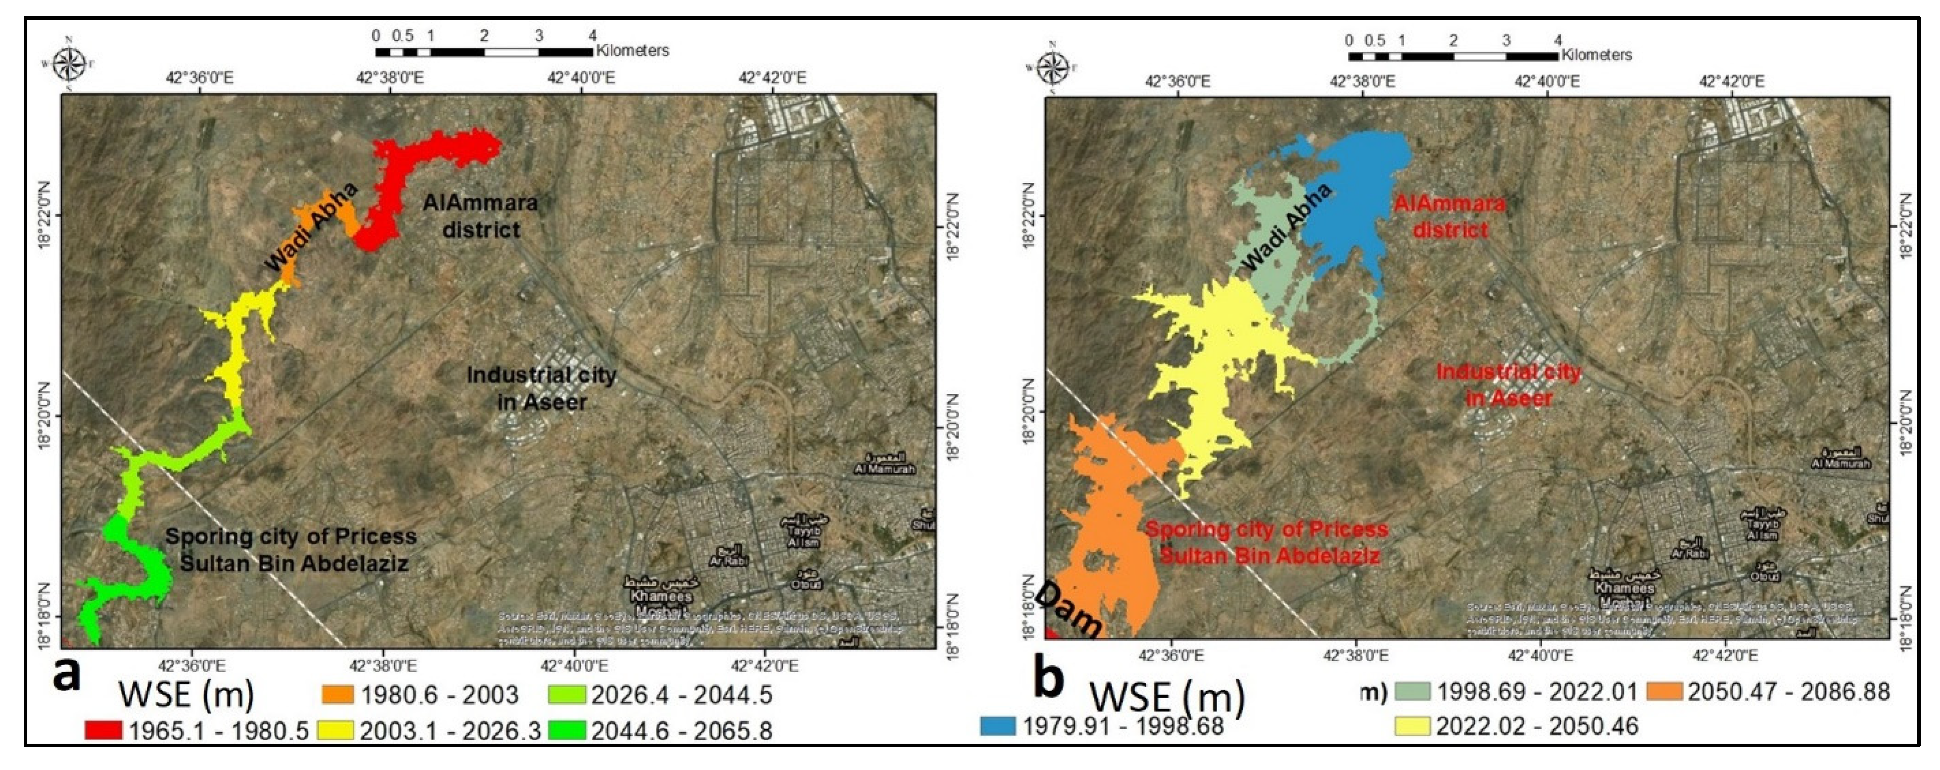
4.4. Flooding Process
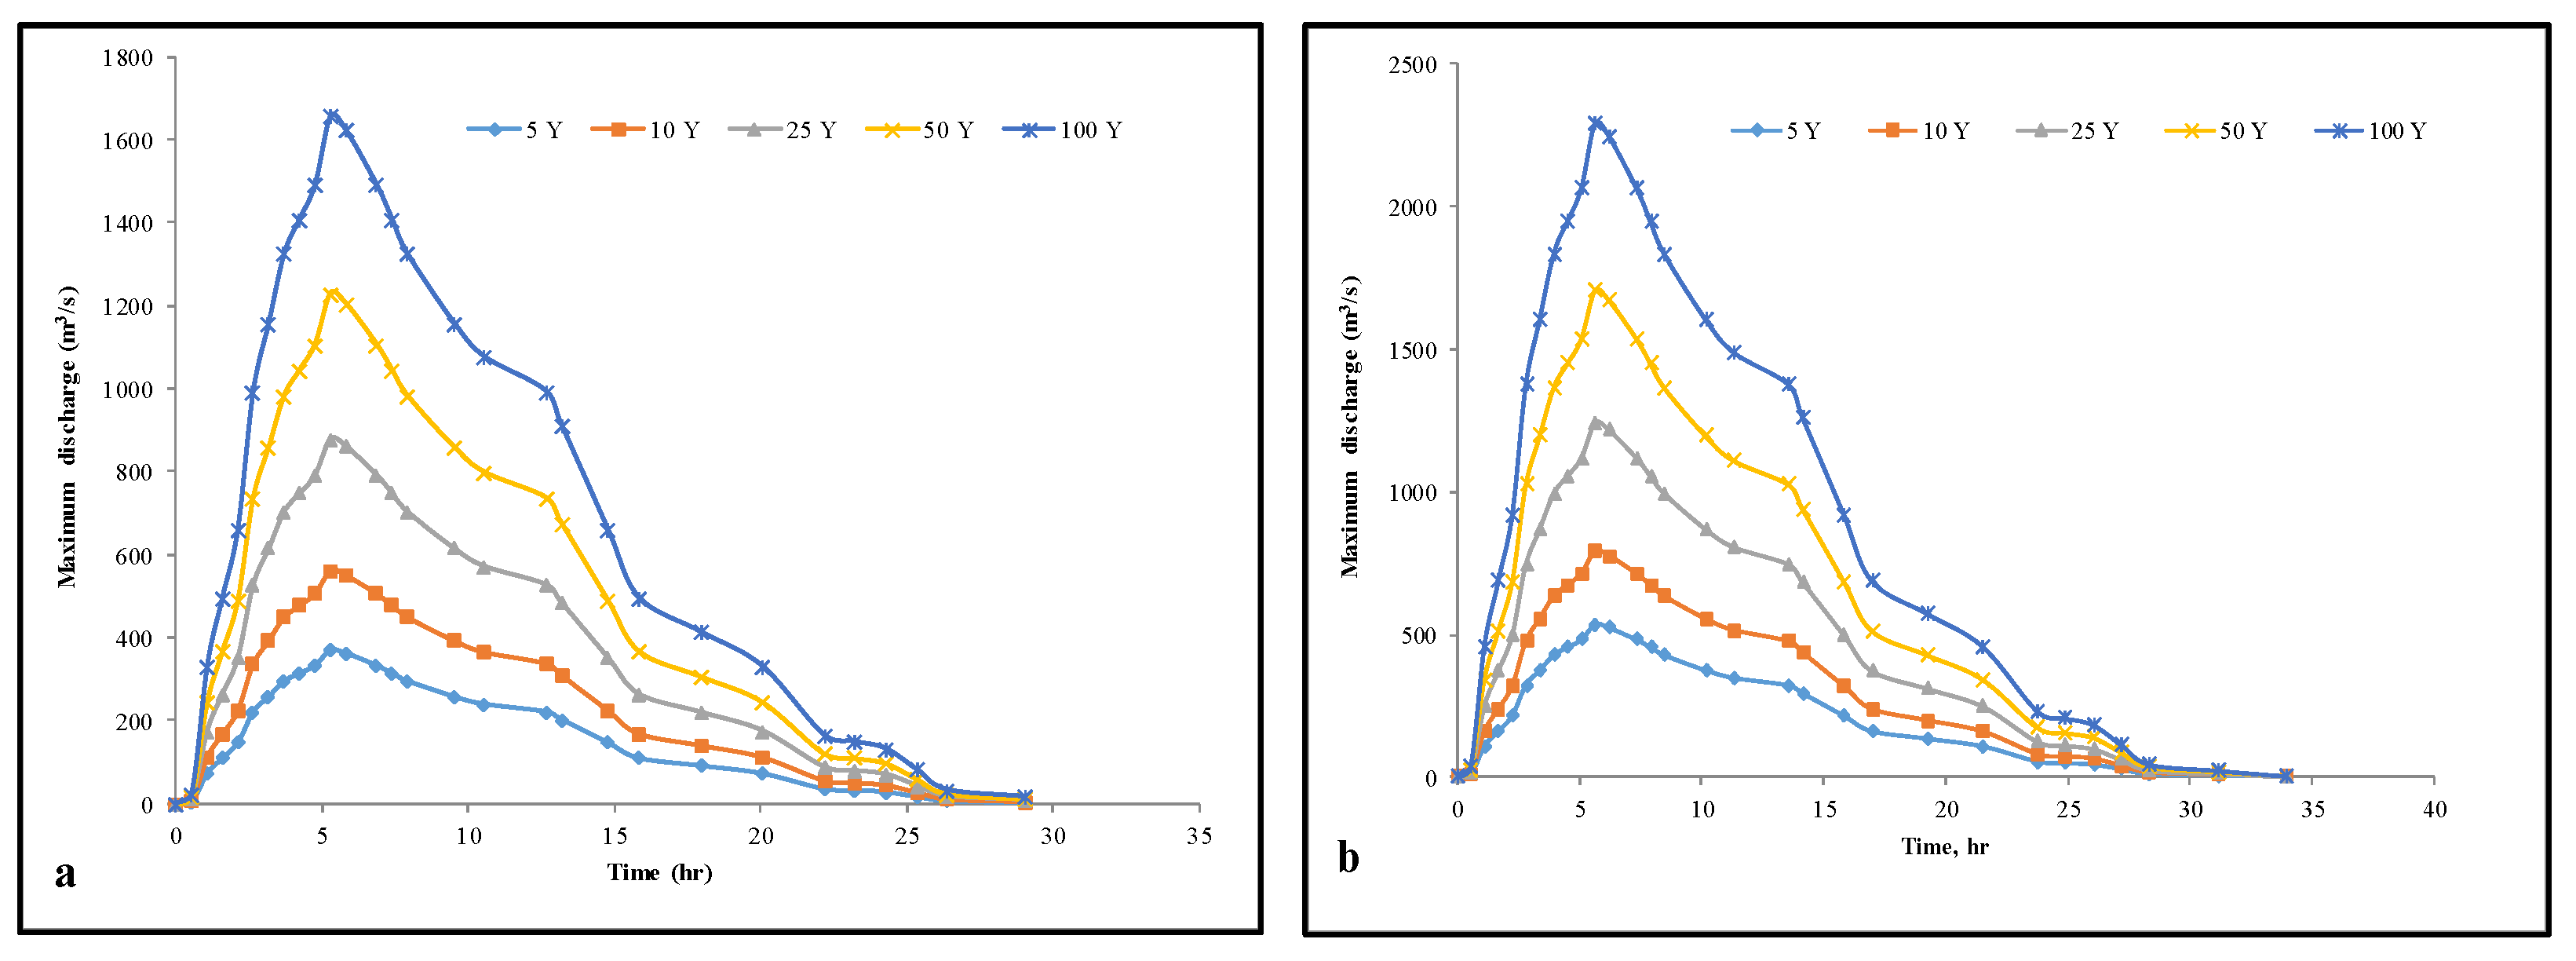
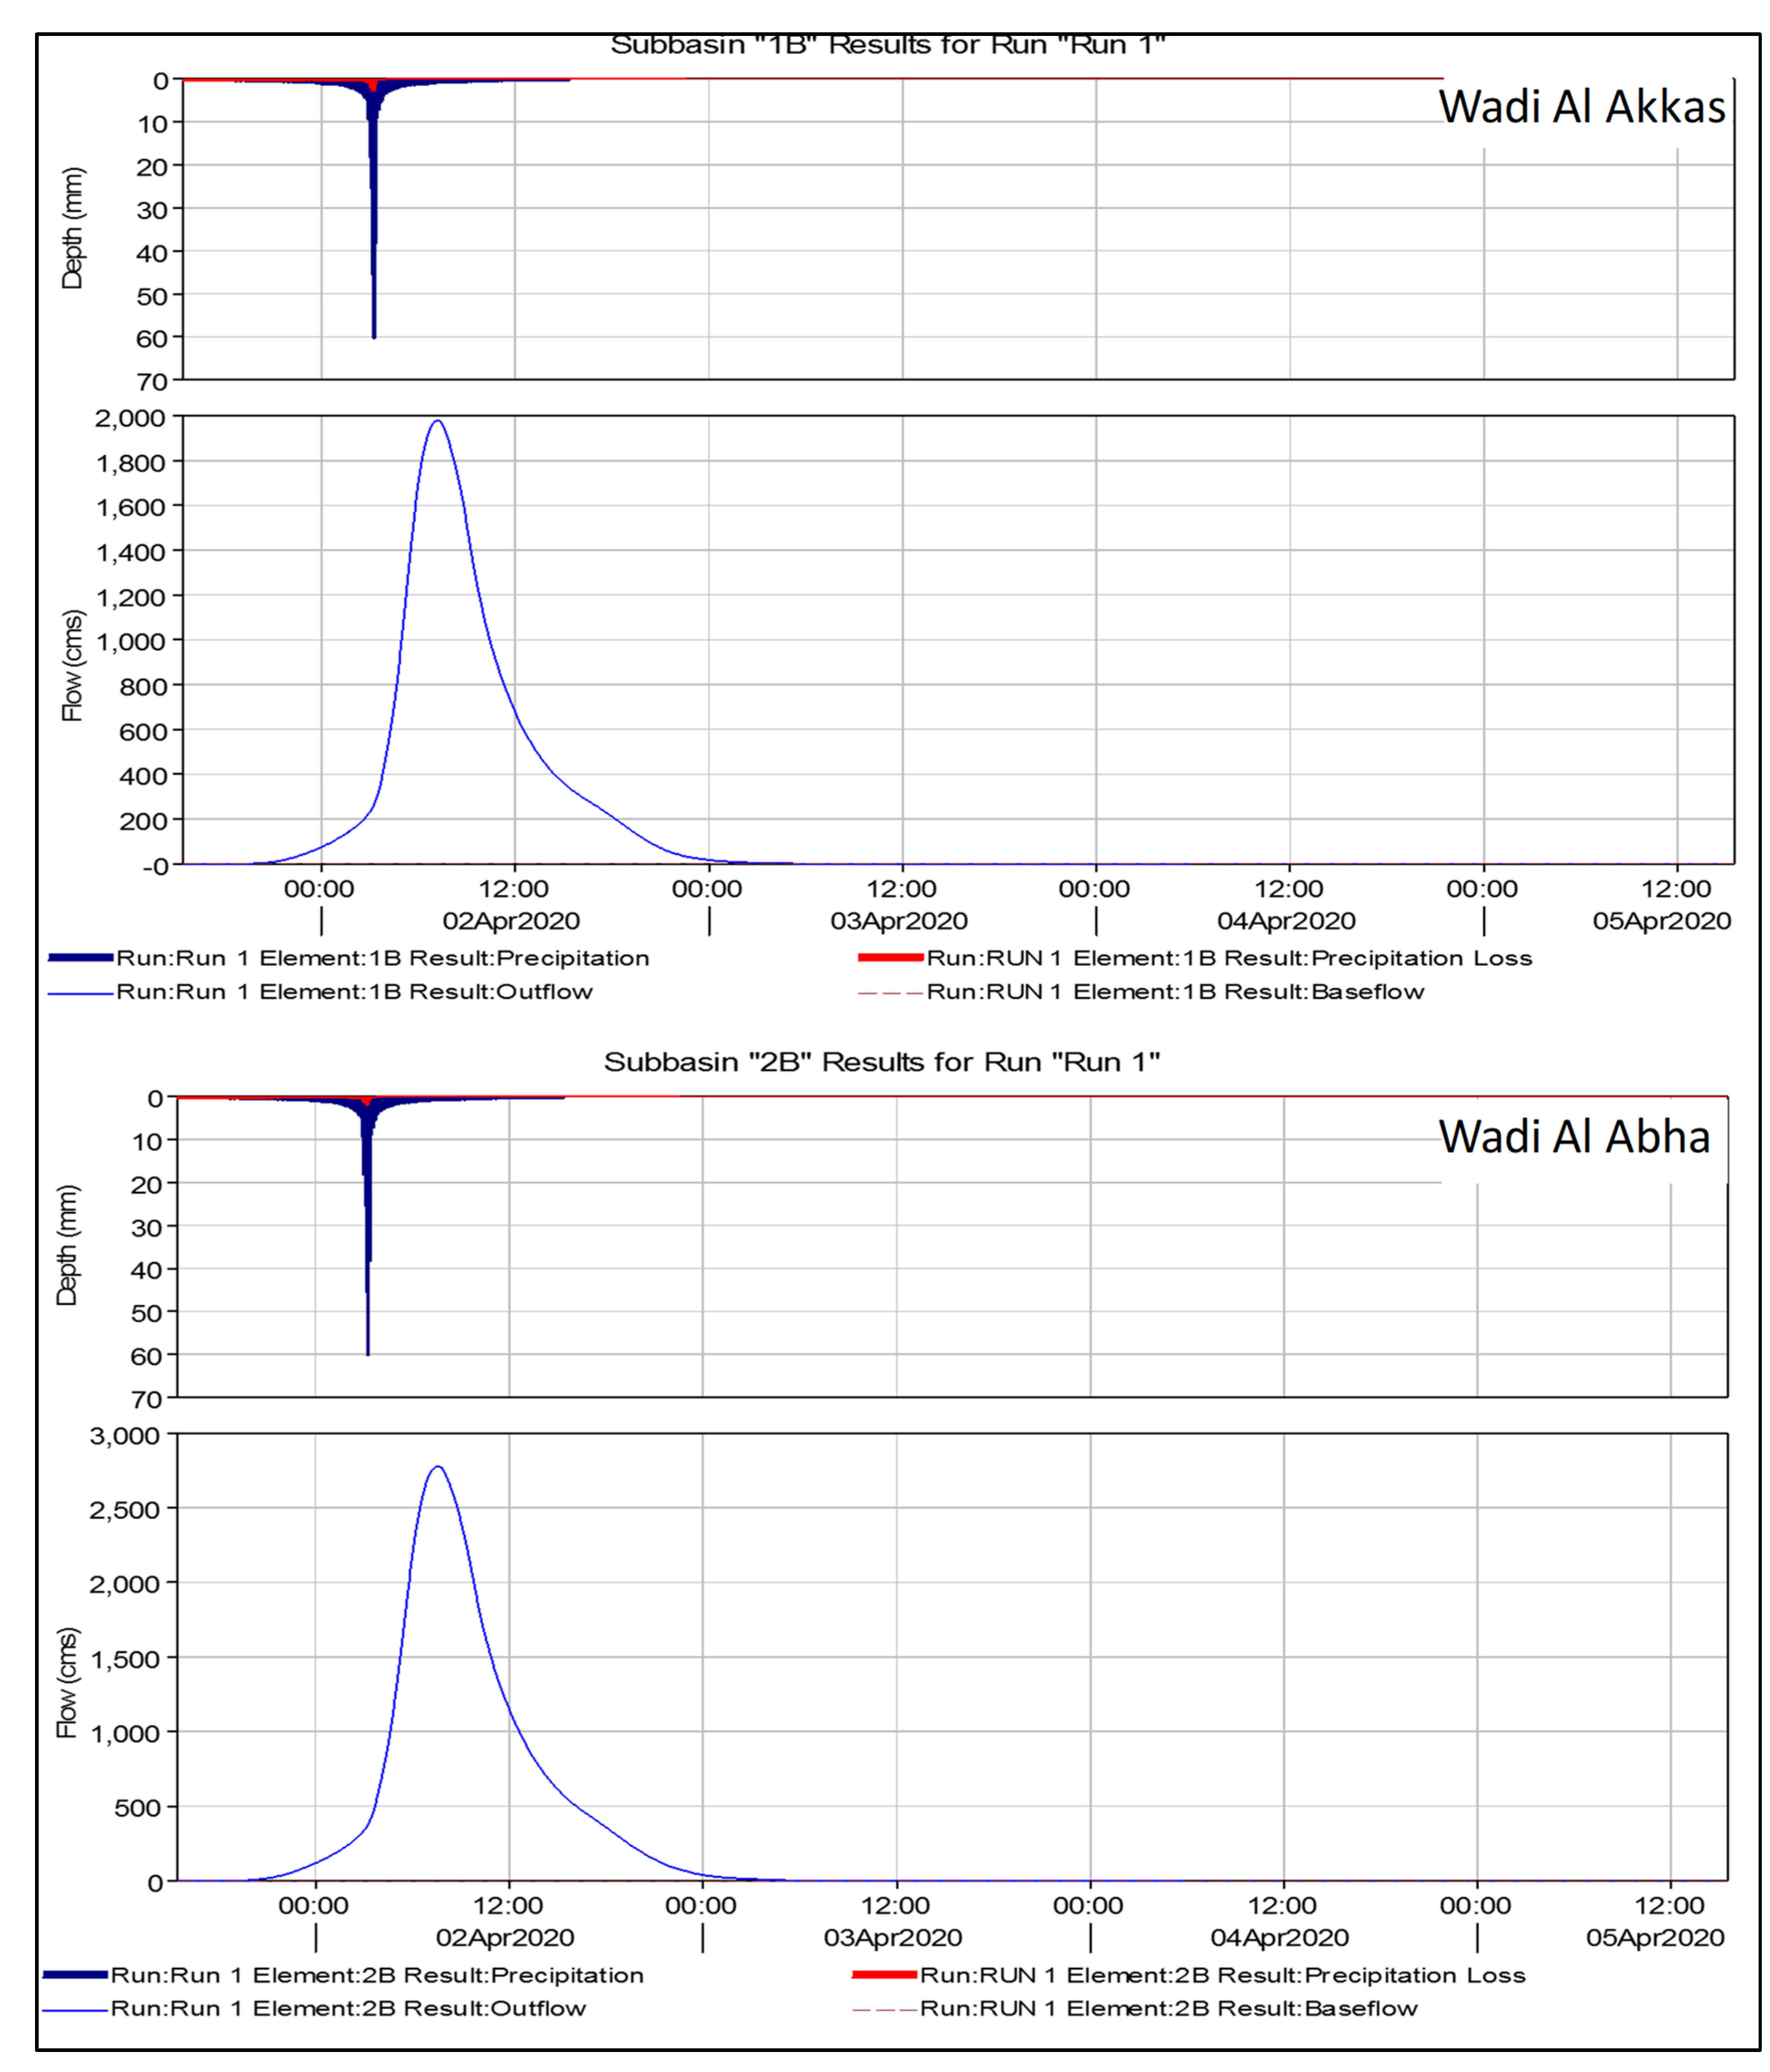
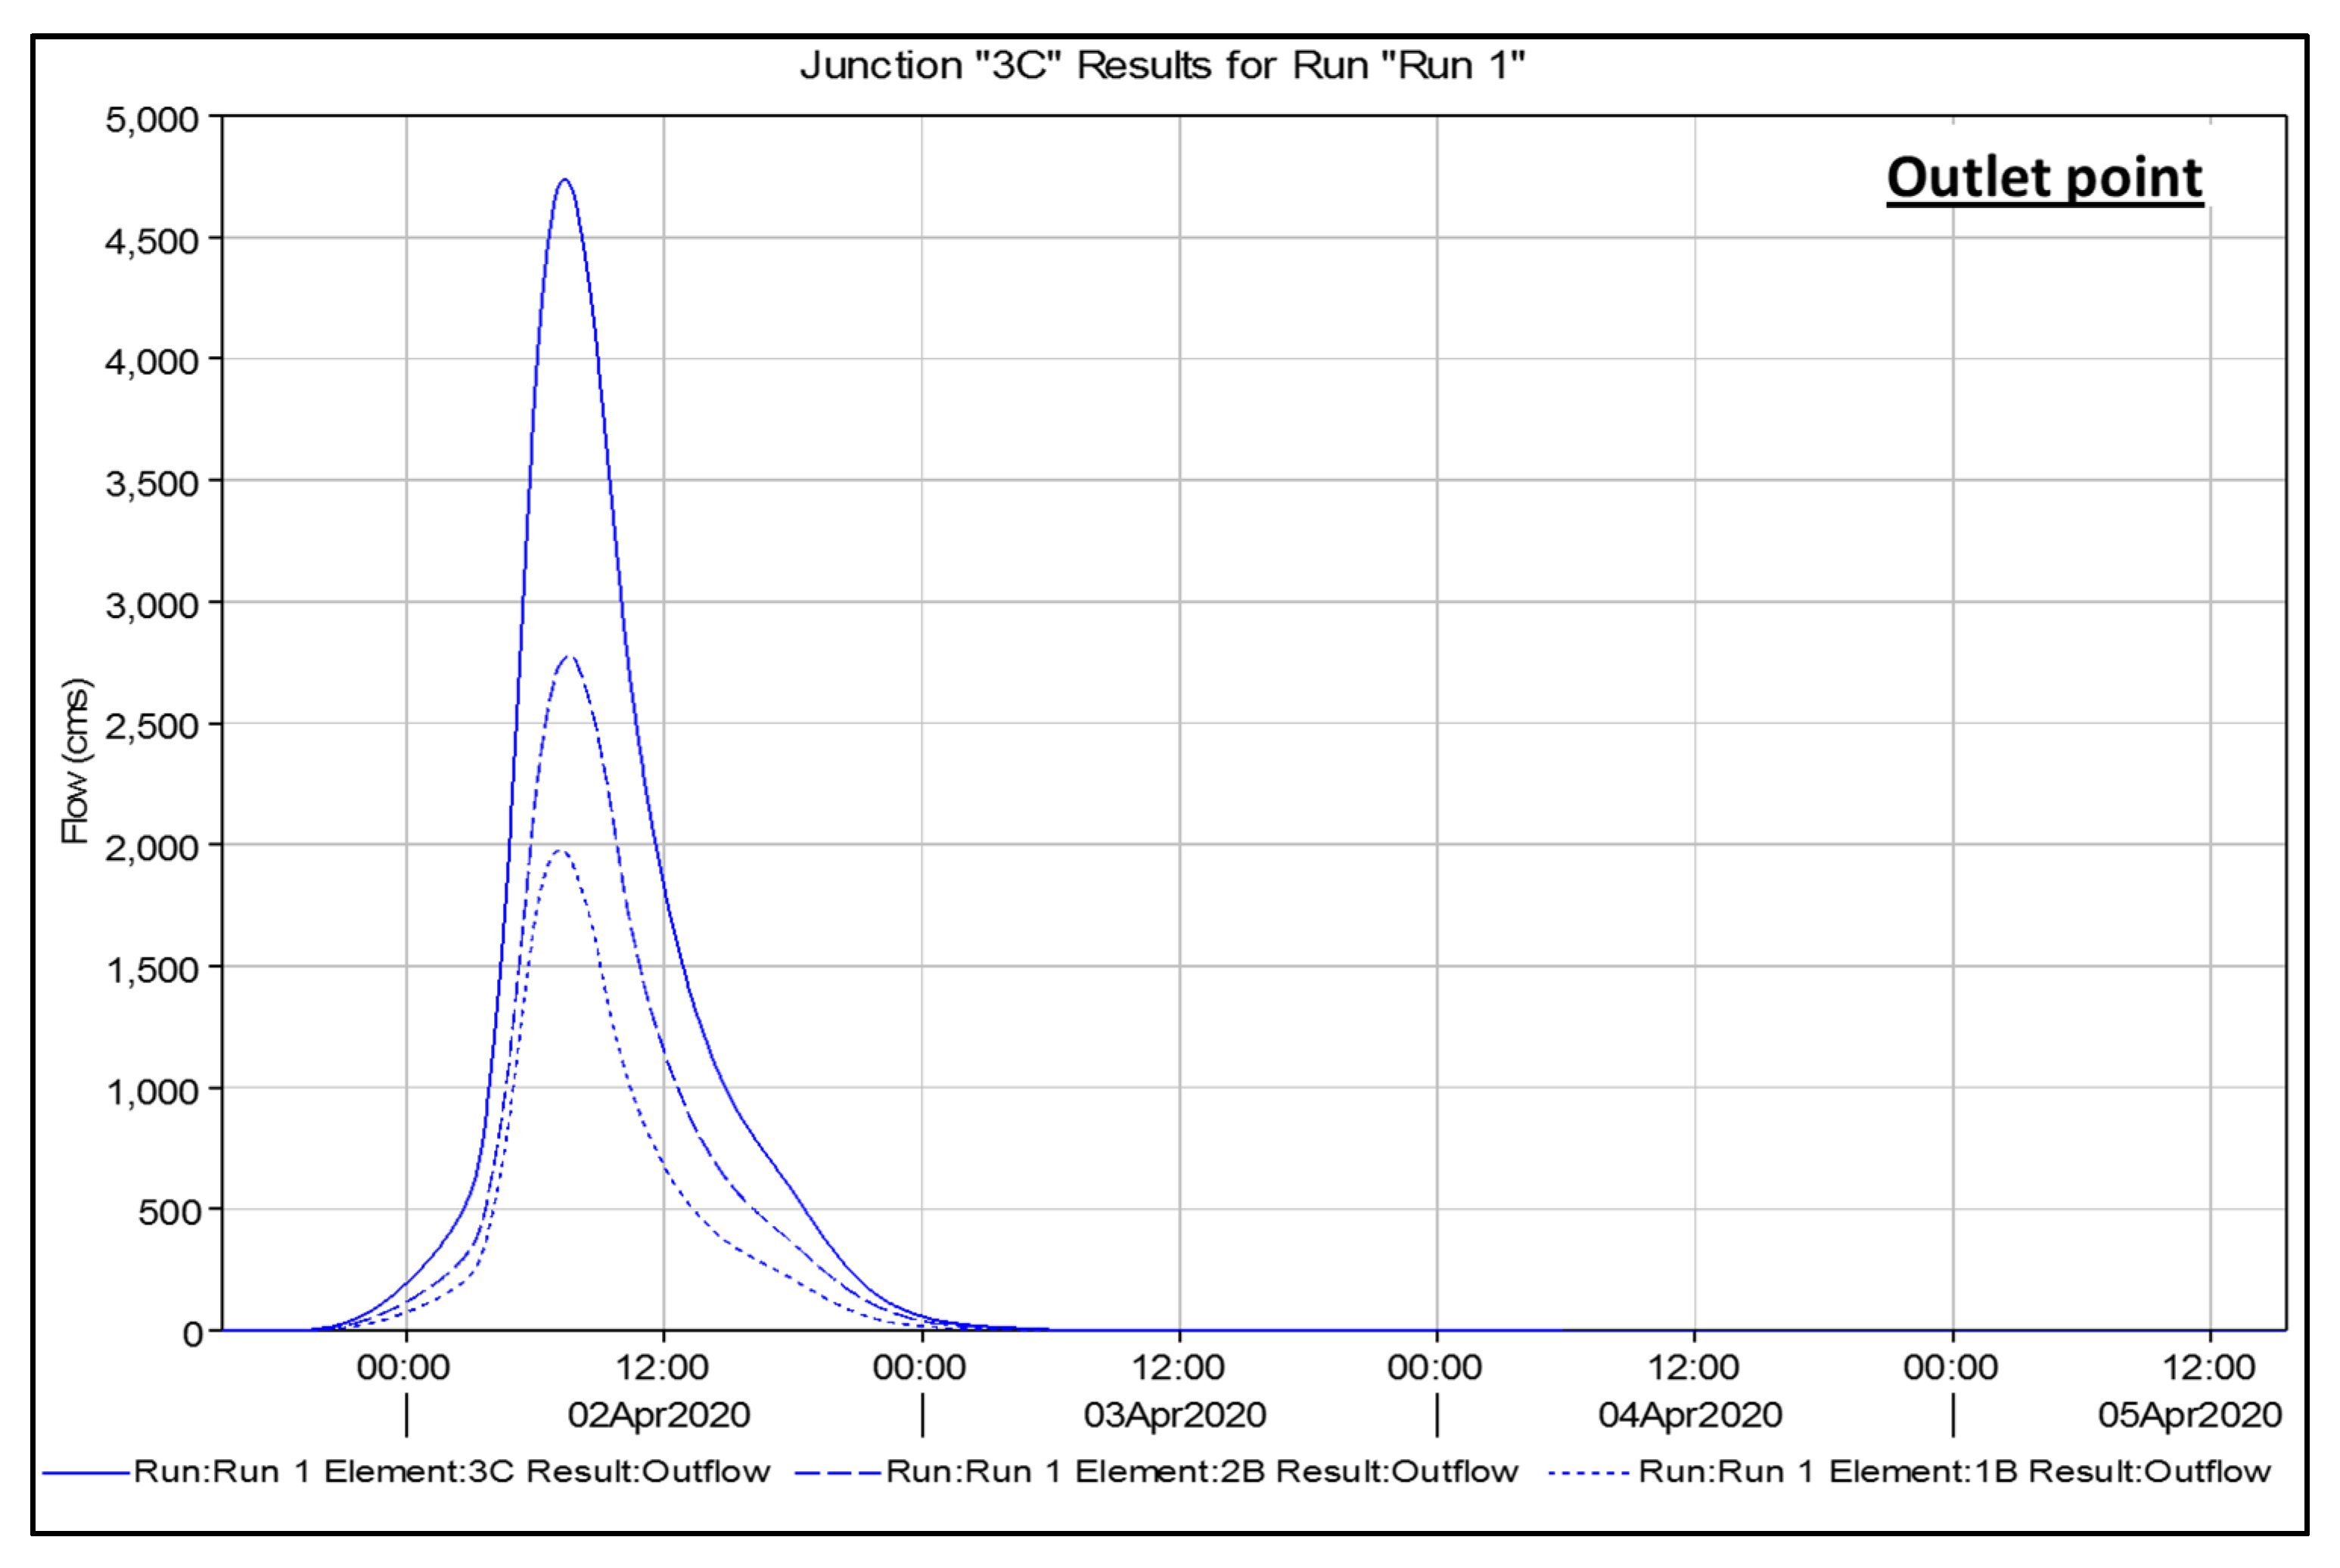
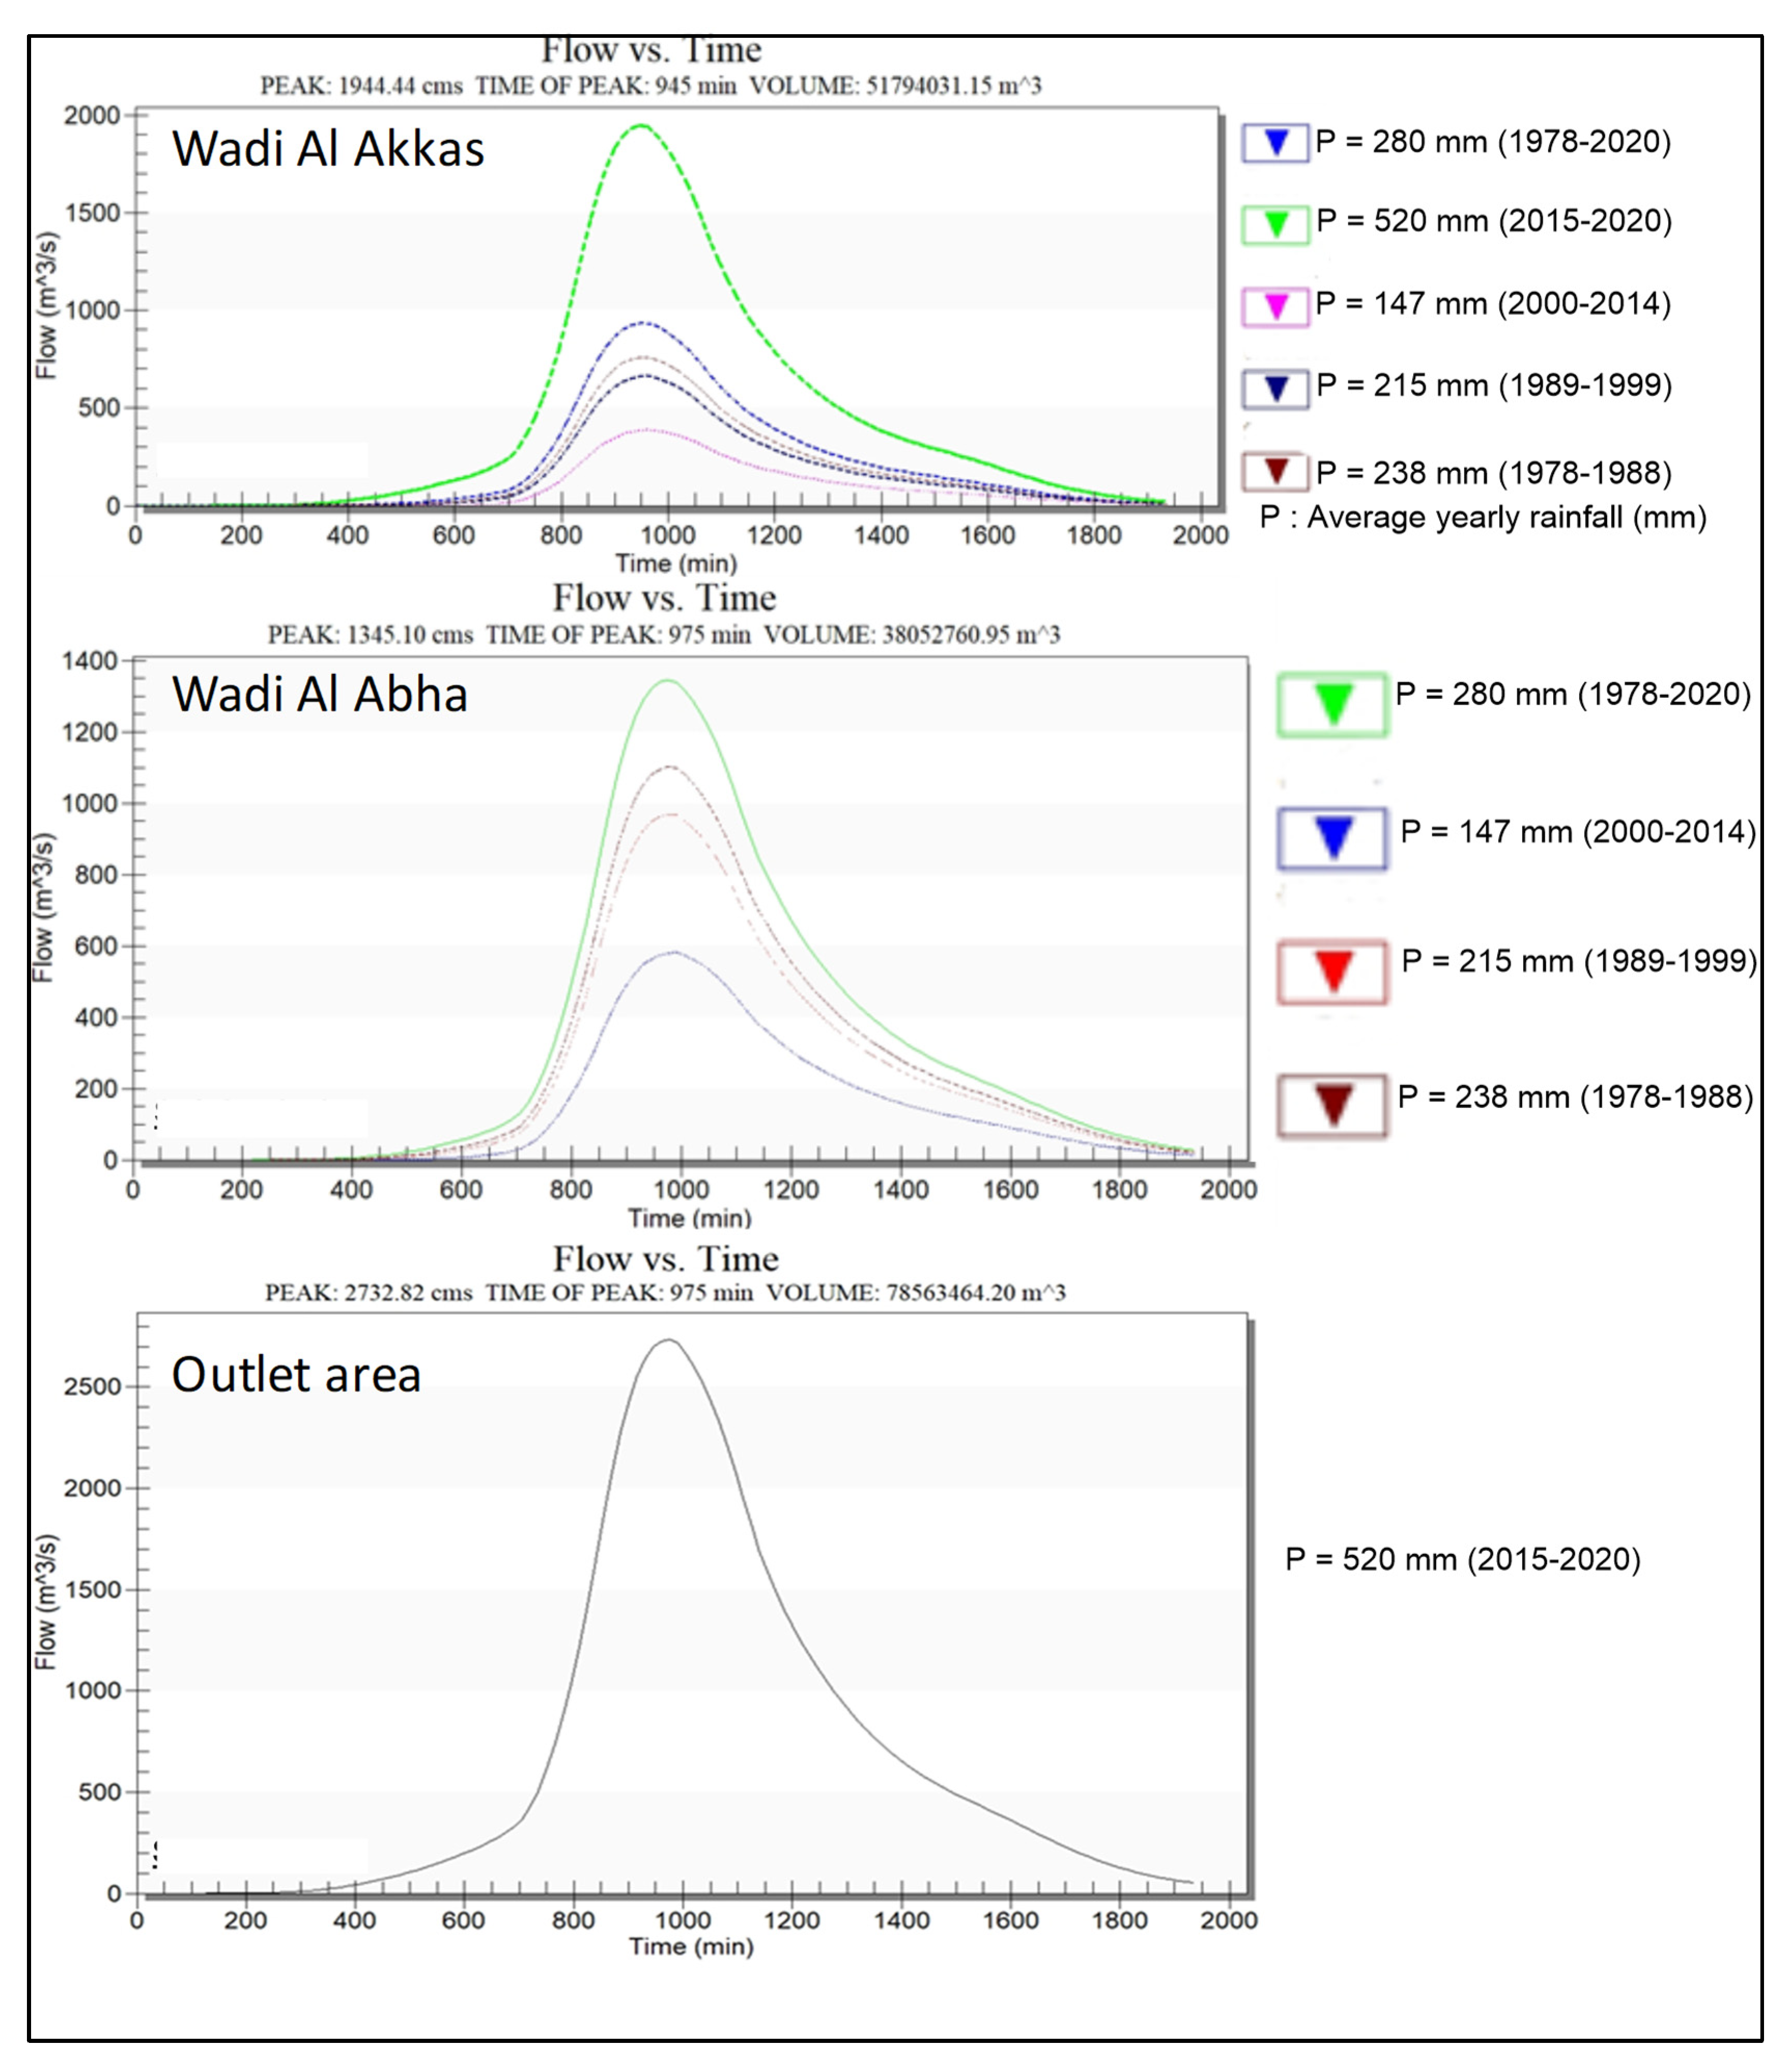
4.5. Hydrograph Simulation
4.6. Agricultural Areas Change within 2006 and 2020 Periods
4.7. Maximum Flooding Probability (MFP)
5. Conclusions and Recommendations
Supplementary Materials
Author Contributions
Funding
Institutional Review Board Statement
Informed Consent Statement
Data Availability Statement
Acknowledgments
Conflicts of Interest
References
- Youssef, A.M.; Pradhan, B.; Gaber, A.F.D.; Buchroithner, M.F. Geomorphological hazards analysis along the Egyptian Red Sea Coast between Safaga and Quseir. Nat. Hazards Earth Syst. Sci. 2009, 9, 751–766. [Google Scholar] [CrossRef]
- Kjeldsen, T.R. Modelling the impact of urbanization on flood frequency relationships in the UK. Hydrol. Res. 2010, 41, 391–405. [Google Scholar] [CrossRef] [Green Version]
- Zwenzner, H.; Voigt, S. Improved estimation of flood parameters by combining space based SAR data with very high resolution digital elevation data. Hydrol. Earth Syst. Sci. 2009, 13, 567–576. [Google Scholar] [CrossRef] [Green Version]
- Tehrany, M.S.; Pradhan, B.; Mansor, S.; Ahmad, N. Flood susceptibility assessment using GIS-based support vector machine model with different kernel types. Catena 2015, 125, 91–101. [Google Scholar] [CrossRef]
- Alexander, D. Natural Disasters; UCL Press: London, UK, 1993; p. 631. [Google Scholar]
- Green, C.H.; Penning-Rowsell, E.C. Flooding and the quantification of intangibles. J. Inst. Water Environ. Man. 1989, 3, 27–30. [Google Scholar] [CrossRef]
- Hassan, O.A. Salient geoenvironmental parameters of Ras Malaab—Abu Zenima Area, Gulf of Suez, Egypt, with an emphasis on flash flood potential and mitigative measures, Egypt. J. Remote Sens. Space Sci. 2000, 3, 37–58. [Google Scholar]
- Youssef, A.M.; Abdel Moneim, A.A.; Abu El-Maged, S.A. Flood hazard assessment and its associated problems using geographic information systems, Sohag Governorate, Egypt. In Proceedings of the Fourth International Conference on the Geology of Africa, Assiut, Egypt, 15–16 November 2005; Volume 1, pp. 1–17. [Google Scholar]
- Youssef, A.M.; Hegab, M.A. Using geographic information systems and statistics for developing a database management system of the flood hazard for Ras Gharib area, Eastern Desert, Egypt. In Proceedings of the Fourth International Conference on the Geology of Africa, Assiut, Egypt, 15–16 November 2005; Volume 2, pp. 1–15. [Google Scholar]
- Taylor, J.; Davies, M.; Clifton, D.; Ridley, I.; Biddulph, P. Flood management: Prediction of microbial contamination in large-scale floods in urban environments. Environ. Int. 2011, 37, 1019–1029. [Google Scholar] [CrossRef]
- Dawod, G.M.; Mirza, M.N.; Al-Ghamdi, K.A. GIS-based estimation of flood hazard impacts on road network in Makkah city. Saudi. Arabia. Environ. Earth Sci. 2012, 67, 2205–2215. [Google Scholar] [CrossRef]
- Regmi, A.D.; Yoshida, K.; Dhital, M.R.; Pradhan, B. Weathering and mineralogical variation in gneissic rocks and their effect in Sangrumba Landslide, East Nepal. Environ. Earth Sci. 2013, 71, 2711–2727. [Google Scholar] [CrossRef]
- Rodier, J. Aspects of arid zone hydrology. In Facets of Hydrology; Rodda, J.C., Ed.; Wiley: Chichester, UK, 1985; Volume II, pp. 205–247. [Google Scholar]
- Sorman, A.; Abdulrazzaq, J. Infiltration-recharge through wadi beds in arid region. Hydrol. Sci. J. 1993, 38, 173–186. [Google Scholar] [CrossRef]
- Al-Qurashi, A.; McIntyre, N.; Wheater, H.; Unkrich, C. Application of the Kineros2 rainfall–runoff model to an arid catchment in Oman. J. Hydrol. 2008, 355, 91–105. [Google Scholar] [CrossRef]
- El Bastawesy, M.; White, K.; Nasr, A. Integration of remote sensing and GIS for modelling flash floods in Wadi Hudain catchment, Egypt. Hydrol. Process. 2009, 23, 1359–1368. [Google Scholar] [CrossRef]
- Öztürk, M.; Copty, N.K.; Saysel, A.K. Modeling the impact of land use change on the hydrology of a rural watershed. J. Hydrol. 2013, 497, 97–109. [Google Scholar] [CrossRef]
- Gheith, H.; Sultan, M. Construction of a hydrologic model for estimating Wadi runoff and groundwater recharge in the Eastern Desert, Egypt. J. Hydrol. 2002, 263, 36–55. [Google Scholar] [CrossRef]
- Foody, G.M.; Ghoneim, E.M.; Arnell, N.W. Predicting locations sensitive to flash flooding in an arid environment. J. Hydrol. 2004, 292, 48–58. [Google Scholar] [CrossRef]
- SCS. National Engineering Handbook, Section 4, Hydrology; US Department of Agriculture, US Government Printing Office: Washington, DC, USA, 1972.
- Reich, B. Short-duration rainfall intensity estimation and other design aids for regions of spare data. J. Hydrol. 1963, 1, 3–28. [Google Scholar] [CrossRef]
- Graf, L. Fluvial Processes in Dryland Rivers; Springer: New York, NY, USA, 1988; 387p. [Google Scholar]
- Walters, O. Transmission losses in arid region. Hydraul. Eng. 1990, 116, 127–138. [Google Scholar] [CrossRef]
- Al-Khalaf, A. Predicting Short-Duration, High-Intensity Rainfall in Saudi Arabia. Master’s Thesis, Faculty of the College of Graduate Studies, King Fahad University of Petroleum and Minerals, Dhahran, Saudi Arabia, 1997; 196p. [Google Scholar]
- Michaud, J.; Sorooshian, S. Comparison of simple versus complex distributed runoff models on a midsized semiarid watershed. Water Resour. Res. 1994, 30, 593–605. [Google Scholar] [CrossRef]
- Wagener, T.; Wheater, H.; Gupta, H. Rainfall-Runoff Modelling in Gauged and Ungauged Catchments; Imperial College Press: London, UK, 2004; 330p. [Google Scholar]
- Dawod, G.; Mirza, M.; Al-Ghamdi, K. GIS-based spatial mapping of flash flood hazards in Makkah city, Saudi Arabia. J. Geogr. Inf. Syst. 2011, 3, 217–223. [Google Scholar] [CrossRef] [Green Version]
- Dawod, G.M.; Koshak, N.A. Developing GIS-Based Unit Hydrographs for Flood Management in Makkah Metropolitan Area, Saudi Arabia. J. Geogr. Inf. Syst. 2011, 3, 153–159. [Google Scholar] [CrossRef] [Green Version]
- Hublart, P.; Ruelland, D.; Atauri, I.G.D.C.; Ibacache, A. Reliability of a conceptual hydrological model in a semi-arid Andean catchment facing water-use changes. Proc. Int. Assoc. Hydrol. Sci. 2015, 371, 203–209. [Google Scholar] [CrossRef] [Green Version]
- US Army Corps of Engineers (USACE) 2010 HEC-HMS. User’s Manual Version 3.5; Hydrologic Engineering Center: Davis, CA, USA, 2010. [Google Scholar]
- Youssef, A.M.; Pradhan, B.; Sefry, S.A. Flash flood Susceptibility mapping in Jeddah city (Kingdom of Saudi Arabia) using bivariate and multivariate statistical models. Environ. Earth Sci. 2016, 75, 12. [Google Scholar] [CrossRef]
- Youssef, A.M.; Sefry, S.A.; Pradhan, B.; Abu Alfadail, E. Analysis on causes of flash flood in Jeddah city (Kingdom of Saudi Arabia) of 2009 and 2011 using multi-sensor remote sensing data and GIS. Geomat. Nat. Hazards Risk 2016, 7, 1018–1042. [Google Scholar] [CrossRef]
- Benz, U.C.; Hofmann, P.; Willhauck, G.; Lingenfelder, I.; Heynen, M. Multi-resolution, object-oriented fuzzy analysis of remote sensing data for GIS-ready information. ISPRS J. Photogramm. Remote Sens. 2004, 58, 239–258. [Google Scholar] [CrossRef]
- Burns, D.; Vitvar, T.; McDonnell, J.; Hassett, J.; Duncan, J.; Kendall, C. Effects of suburban development on runoff generation in the Croton River basin, New York, USA. J. Hydrol. 2005, 311, 266–281. [Google Scholar] [CrossRef]
- Dutta, D.; Herath, S. Trend of floods in Asia and a proposal for flood risk management with integrated river basin approach. In Proceedings of the Second International Conference of Asia–Pacific Hydrology and Water Resources Association, Singapore, 5–9 July 2004; Volume 1, pp. 128–137. [Google Scholar]
- Fernandez, D.; Lutz, M. Urban flood hazard zoning in Tucumán Province, Argentina, using GIS and multicriteria decision analysis. Eng. Geol. 2010, 111, 90–98. [Google Scholar] [CrossRef]
- Gaitan, S.; ten Veldhuis, M.-C.; van de Giesen, N. Spatial Distribution of Flood Incidents Along Urban Overland Flow-Paths. Water Resour. Manag. 2015, 29, 3387–3399. [Google Scholar] [CrossRef] [Green Version]
- Horritt, M. A methodology for the validation of uncertain flood inundation models. J. Hydrol. 2006, 326, 153–165. [Google Scholar] [CrossRef]
- Mason, D.C.; Bates, P.D.; Dall’ Amico, J.T. Calibration of uncertain flood inundation models using remotely sensed water levels. J. Hydrol. 2009, 368, 224–236. [Google Scholar] [CrossRef]
- Ahmad, S.; Simonovic, S. A three dimensional fuzzy methodology for flood risk analysis. J. Flood Risk Manag. 2011, 4, 53–74. [Google Scholar] [CrossRef]
- Billa, L.; Shattri, M.; Mahmud, A.R.; Ghazali, A.H. Comprehensive planning and the role of SDSS in flood disaster management in Malaysia. Disaster Prev. Manag. Int. J. 2006, 15, 233–240. [Google Scholar] [CrossRef]
- Chormanski, J.; Van de Voorde, T.; De Roeck, T.; Batelaan, O.; Canters, F. Improving Distributed Runoff Prediction in Urbanized Catchments with Remote Sensing based Estimates of Impervious Surface Cover. Sensors 2008, 8, 910–932. [Google Scholar] [CrossRef] [Green Version]
- Cunderlik, J.M.; Burn, D.H. Analysis of the linkage between rain and flood regime and its application to regional flood frequency estimation. J. Hydrol. 2002, 261, 115–131. [Google Scholar] [CrossRef]
- Essel, B. The application of GIS in mapping of flood hazard areas and assessing of risk in kumasi, Ghana. J. Energy Nat. Resour. Manag. JENRM 2017, 3, 97–103. [Google Scholar] [CrossRef]
- Heo, J.-H.; Salas, J.; Boes, D. Regional flood frequency analysis based on a Weibull model: Part 2. Simulations and applications. J. Hydrol. 2001, 242, 171–182. [Google Scholar] [CrossRef]
- Knebl, M.R.; Yang, Z.-L.; Hutchison, K.; Maidment, D.R. Regional scale flood modeling using NEXRAD rainfall, GIS, and HEC-HMS/RAS: A case study for the San Antonio River Basin Summer 2002 storm event. J. Environ. Manag. 2005, 75, 325–336. [Google Scholar] [CrossRef]
- Merwade, V.; Cook, A.; Coonrod, J. GIS techniques for creating river terrain models for hydrodynamic modeling and flood inundation mapping. Environ. Model. Softw. 2008, 23, 1300–1311. [Google Scholar] [CrossRef]
- Pradhan, B.; Shafie, M. Flood hazard assessment for cloud prone rainy areas in a typical tropical environment. Disaster Adv. 2009, 2, 7–15. [Google Scholar]
- Rahmati, O.; Zeinivand, H.; Besharat, M. Flood hazard zoning in Yasooj region, Iran, using GIS and multi-criteria decision analysis. Geomat. Nat. Hazards Risk 2017, 7, 1000–1017. [Google Scholar] [CrossRef] [Green Version]
- Sanyal, J.; Lu, X.X. Remote sensing and GIS-based flood vulnerability assessment of human settlements: A case study of Gangetic West Bengal, India. Hydrol. Process. 2005, 19, 3699–3716. [Google Scholar] [CrossRef]
- Youssef, A.M.; Pradhan, B.; Hassan, A.M. Flash flood risk estimation along the St. Katherine road, southern Sinai, Egypt using GIS based morphometry and satellite imagery. Environ. Earth Sci. 2011, 62, 611–623. [Google Scholar] [CrossRef]
- Portugués-Mollá, I.; Bonache-Felici, X.; Mateu-Bellés, J.F.; Marco-Segura, J.B. A GIS-Based Model for the analysis of an urban flash flood and its hydrogeomorphic response. The Valencia event of 1957. J. Hydrol. 2016, 541, 582–596. [Google Scholar]
- Coumou, D.; Rahmstorf, S. A decade of weather extremes. Nat. Clim. Chang. 2012, 2, 491–496. [Google Scholar] [CrossRef]
- Ali, S.A.; Aadhar, S.; Shah, H.L.; Mishra, V. Projected Increase in Hydropower Production in India under Climate Change. Sci. Rep. 2018, 8, 12450. [Google Scholar] [CrossRef] [Green Version]
- Fowler, H.J.; Cooley, D.; Sain, S.R.; Thurston, M. Detecting change in UK extreme precipitation using results from the climateprediction.net BBC climate change experiment. Extremes 2010, 13, 241–267. [Google Scholar] [CrossRef] [Green Version]
- Kundzewicz, Z.; Kanae, S.; Seneviratne, S.; Handmer, J.; Nicholls, N.; Peduzzi, P.; Mechler, R.; Bouwer, L.M.; Arnell, N.; Mach, K.; et al. Flood risk and climate change: Global and regional perspectives. Hydrol. Sci. J. 2014, 59, 1–28. [Google Scholar] [CrossRef] [Green Version]
- Abdelkarim, A.; Gaber, A.F.D. Flood Risk Assessment of the Wadi Nu’man Basin, Mecca, Saudi Arabia (During the Period, 1988–2019) Based on the Integration of Geomatics and Hydraulic Modeling: A Case Study. Water 2019, 11, 1887. [Google Scholar] [CrossRef] [Green Version]
- El Shinnawy, I.; Bestawy, A.; Tahawy, T.E. Assessment and Management of Flash Floods for Sustainable Development in Al-Sail Al Kabir Area, Kingdom of Saudi Arabia. Int. J. Appl. Eng. Res. 2017, 12, 2807–2814. [Google Scholar]
- Elkhrachv, I. Flash Flood Hazard Mapping Using Satellite Images and GIS Tools: A case study of Najran City, Kingdom of Saudi Arabia (KSA). Egypt. J. Remote. Sens. Space Sci. 2015, 18, 261–278. [Google Scholar]
- Sharif, H.O.; Al-Juaidi, F.H.; Al-Othman, A.; Al-Dousary, I.; Fadda, E.; Jamal-Uddeen, S.; Elhassan, A. Flood hazards in an urbanizing watershed in Riyadh, Saudi Arabia. Geomat. Nat. Hazards Risk 2014, 7, 702–720. [Google Scholar] [CrossRef] [Green Version]
- Abdul Karim, A.A.A. Effect of spatial changes of urban growth and land uses on increasing flood risks in the Saudi City: Case Study of Ha’il city Using Geographical Information Systems and Remote Sensing (GIS & RS). Arab. J. Geogr. Inf. Syst. Saudi Geogr. Soc. 2013, 6. Available online: http://abjdh.com/mag/wp-content/uploads/2016/12/ABSTRACTSISSUE12622014Last.pdf (accessed on 28 February 2019).
- Al-Ghamdi, K.; Elzahrany, R.; Mirza, M.; Dawod, G. Impacts of urban growth on flood hazards in Makkah City, Saudi Arabia. Int. J. Water Resour. Environ. Eng. 2012, 4, 23–34. [Google Scholar]
- El Alfy, M. Assessing the Impact of Arid Area Urbanization on Flash Floods Using GIS, Remote Sensing, and HEC-HMS Rainfall–Runoff Modeling. Hydrol. Res. 2016, 47, 1142–1160. [Google Scholar] [CrossRef] [Green Version]
- Shwehdi, M.H. Reliable Maps of LightningThunderstorms for Saudi Arabia. IEEE Ransactions Power Deliv. 2006, 21, 1571–1577. [Google Scholar] [CrossRef]
- Qari, M.H. Geomorphology of Jeddah Governate, with emphasis on drainage systems JKAU. Earth Sci. 2009, 20, 93–116. [Google Scholar]
- Subyani, A.M.; Qari, M.H.; Matsah, M.E.; Al-Modayan, A.A.; Al-Ahmadi, F.S. Utilizing Remote Sensing and GIS Techniques to Reduce Hydrological and Environmental Hazards in some Wadis, Western Saudi Arabia (JeddahYanbu); Project No. APR 25/101; King Abdulaziz City for Sciences and Technology: Riyadh, Saudi Arabia, 2009. [Google Scholar]
- Subyani, A. Hydrologic behavior and flood probability for selected arid basins in Makkah area, western Saudi Arabia. Arab. J. Geosci. 2010, 4, 817–824. [Google Scholar] [CrossRef]
- Ledraa, T.; Al-Ghamidi, A.M. Planning and Management Issues and Challenges of Flash Flooding Disasters in Saudi Arabia: The Case of Riyadh City. J. Archit. Plan. 2020, 32, 155–171. [Google Scholar] [CrossRef]
- Ashammari, E.Z.; Ruslan, R.B.; Int Abdurrahman, A.; Abdulkadir, M. Flash flood causes in Ha’il city kingdom of Saudi Arabia using Remote Sensing data and GIS. J. Crit. Rev. 2020, 7, 144–153. [Google Scholar]
- Alamri, Y.A. Rains and floods in Saudi Arabia. Crying of the sky or of the people? Saudi. Med. J. 2011, 32, 311–313. [Google Scholar]
- Alqahtani, F.; Qaddah, A.A. GIS digital mapping of flood hazard in Jeddah–Makkah region from morphometric analysis. Arabian J. Geosci. 2019, 12, 199. [Google Scholar] [CrossRef]
- Al Saud, M. Flood Control Management for the City and Surroundings of Jeddah, Saudi Arabia; The Springer Natural Hazards: Dordrecht, The Netherlands, 2015; p. 177. [Google Scholar] [CrossRef]
- Rahman, M.T.; Aldosary, A.S.; Nahiduzzaman, K.M.; Reza, I. Vulnerability of flash flooding in Riyadh, Saudi Arabia. Nat. Hazards 2016, 84, 1807–1830. [Google Scholar] [CrossRef]
- Natarajan, S.; Radhakrishnan, N. Flood hazard delineation in an ungauged catchment by coupling hydrologic and hydraulic models with geospatial techniques—A case study of Koraiyar basin, Tiruchirappalli City, Tamil Nadu, India. Environ. Monit. Assess. 2020, 192, 689. [Google Scholar] [CrossRef] [PubMed]
- Ansar, A.; Naima, A. Mapping of Flood Zones in Urban Areas through a Hydro-climatic Approach: The Case of the City of Abha. Earth Sci. Res. 2021, 10, 1. [Google Scholar] [CrossRef]
- Mallick, J. Geospatial-based soil variability and hydrological zones of Abha semi-arid mountainous watershed, Saudi Arabia. Arab. J. Geosci. 2016, 9, 28. [Google Scholar] [CrossRef]
- Hasanean, H.; Almazroui, M. Rainfall: Features and Variations over Saudi Arabia, A Review. Climate 2015, 3, 578–626. [Google Scholar] [CrossRef] [Green Version]
- Ben Menaa el Amri, A. Pedological Characteristics of the Soil in Wadi Bisha. Master’s Thesis, King Saoud University, Riyadh, Saudi Arabia, 2007. [Google Scholar]
- Scipal, K.; Scheffler, C.; Wagner, W. Soil moisture-runoff relation at the catchment scale as observed with coarseresolution microwave remote sensing. Hydrol. Earth Syst. Sci. 2005, 9, 173–183. [Google Scholar] [CrossRef] [Green Version]
- Milzow, C.; Kgotlhang, L.; Kinzelbach, W.; Meier, P.; Bauer-Gottwein, P. The role of remote sensing in hydrological modelling of the Okavango Delta, Botswana. J. Environ. Manag. 2009, 90, 2252–2260. [Google Scholar] [CrossRef]
- Bioresita, F.; Puissant, A.; Stumpf, A.; Malet, J.-P. A Method for Automatic and Rapid Mapping of Water Surfaces from Sentinel-1 Imagery. Remote Sens. 2018, 10, 217. [Google Scholar] [CrossRef] [Green Version]
- Farhadi, H.; Najafzadeh, M. Flood Risk Mapping by Remote Sensing Data and Random Forest Technique. Water 2021, 13, 3115. [Google Scholar] [CrossRef]
- Farhadi, H.; Esmaeily, A.; Najafzadeh, M. Flood monitoring by integration of Remote Sensing technique and Multi-Criteria Decision Making method. Comput. Geosci. 2022, 160, 105045. [Google Scholar] [CrossRef]
- Wheater, S.; Bell, N. Northern Oman flood study. Proc. Inst. Civ. Engrs 1983, 2, 453–473. [Google Scholar] [CrossRef]
- USDA. Urban Hydrology for Small Watersheds; US Department of Agriculture, Natural Resources Conservation Services, Conservation Engineering Division: London, UK, 1986; 164p.
- Gabr, S.S.; Alkhaldy, I.A.; El-Saoud, W.A.; Habeebullah, T.M. Flash flood modeling and mitigation of Al-Hussainiyah area, Makkah, Saudi Arabia. Arab. J. Geosci. 2021, 14, 2044. [Google Scholar] [CrossRef]
- Alagha, M.O.; Gutub, S.A. Estimation of nrcs curve number from watershed morphometric parameters: A case study of Yiba watershed in Saudi Arabia. Int. J. Civ. Eng. Technol. 2016, 7, 247–265. [Google Scholar]
- Mishra, S.; Singh, V. Long-term hydrological simulation based on the Soil Conservation Service curve number. Hydrol. Process. 2004, 18, 1291–1313. [Google Scholar] [CrossRef]
- Wheater, H.S.; Larentis, P.; Hamilton, G.S. Design rainfall characteristics for south-west of Saudi Arabia. In Proceedings of the Institution of Civil Engineers, Part 2; Institution of Civil Engineers: London, UK, 1989; pp. 517–538. [Google Scholar]
- Sadek, M.; Li, X.; Mostafa, E.; Dossou, J.F. Monitoring flash flood hazard using modeling-based techniques and multi-source remotely sensed data: The case study of Ras Ghareb City, Egypt. Arab. J. Geosci. 2021, 14, 2030. [Google Scholar] [CrossRef]


| Parameters | Values |
|---|---|
| Min. | 90 |
| Max. | 693 |
| Mean | 274.35 |
| Std. Dev. | 171 |
| Skewness | 1.14 |
| Kurtosis | 0.45 |
| Variance | 29,240.8 |
| Rainfall Depth (mm) within 24 h | |||
|---|---|---|---|
| Return Period (Years) | Weibull | Gumbel | GEV |
| Maximum Likelihood | |||
| 5 | 407 | 377 | 369 |
| 10 | 500 | 466 | 516 |
| 25 | 605 | 578 | 774 |
| 50 | 676 | 661 | 1040 |
| 100 | 742 | 744 | 1380 |
| Parameters/Watersheds | Legends | SB 1 | SB 2 |
|---|---|---|---|
| Basin slope (m/m) | BS | 0.1426 | 0.1145 |
| Average overland flow (m) | AOFD | 915.1 | 1057.33 |
| Basin aspects | NF | 0.56 | 0.55 |
| Basin aspects | SF | 0.44 | 0.45 |
| Basin length (m) | L | 23,321.1 | 21,962.2 |
| Perimeter (m) | P | 90,551 | 109,443 |
| Shape factor mi2/mi2 | SHAPE | 4.66 | 2.79 |
| Sinusoity factor (MSL/L) | SIN | 1.33 | 1.52 |
| Mean basin elevation (m) | AVEL | 2442.7 | 2329.9 |
| Maximum flow distance (m) | MFD | 33,635.3 | 37,382.1 |
| Maximum flow slope (m/m) | MFS | 0.0267 | 0.024 |
| Maximum stream length (m) | MSL | 31,082.5 | 33,293.1 |
| Maximum stream slope (m/m) | MSS | 0.022 | 0.0187 |
| Distance from centroid to stream (m) | CTOSTR | 227 | 316.7 |
| centroid stream distance (m) | CSD | 18434.6 | 16,505 |
| centroid stream slope (m/m) | CSS | 0.015 | 0.0086 |
| Curve number | CN | 78.6 | 81.6 |
| Lag time (min) | TLAG | 226.74 | 249.66 |
| Watershed area (km2) | A | 116.71 | 172.67 |
| Time of concentration (min) | TC | 316.74 | 339.66 |
| Time to peak (min) | TP | 945 | 975 |
| Watershed | Parameters | Values | ||||
|---|---|---|---|---|---|---|
| Wadi Al Akkas | Returned period (year) | 5 | 10 | 25 | 50 | 100 |
| Rain depth (mm) | 369 | 516 | 774 | 1040 | 1380 | |
| Direct flood (mm) | 289.662 | 441.198 | 689.254 | 961.898 | 1296.16 | |
| Lag time | 3.779 | 3.779 | 3.779 | 3.779 | 3.779 | |
| Peak discharge (m3/s) | 370.44 | 563.32 | 880.11 | 1228.83 | 1655.47 | |
| Flood volume (m3) | 33,845,900 | 51,469,110 | 80,413,190 | 112,000,000 | 151,000,000 | |
| Wadi Abha | Returned period (year) | 5 | 10 | 25 | 50 | 100 |
| Rain depth (mm) | 369 | 516 | 774 | 1040 | 1380 | |
| Direct flood (mm) | 303.273 | 447.98 | 703.885 | 967.74 | 1299.72 | |
| Lag time | 4.1609 | 4.1609 | 4.1609 | 4.1609 | 4.1609 | |
| Peak discharge (m3/s) | 534 | 789.5 | 1240.7 | 1706 | 2289.3 | |
| Flood volume (m3) | 52,319,010 | 77,356,160 | 122,000,000 | 167,000,000 | 224,000,000 | |
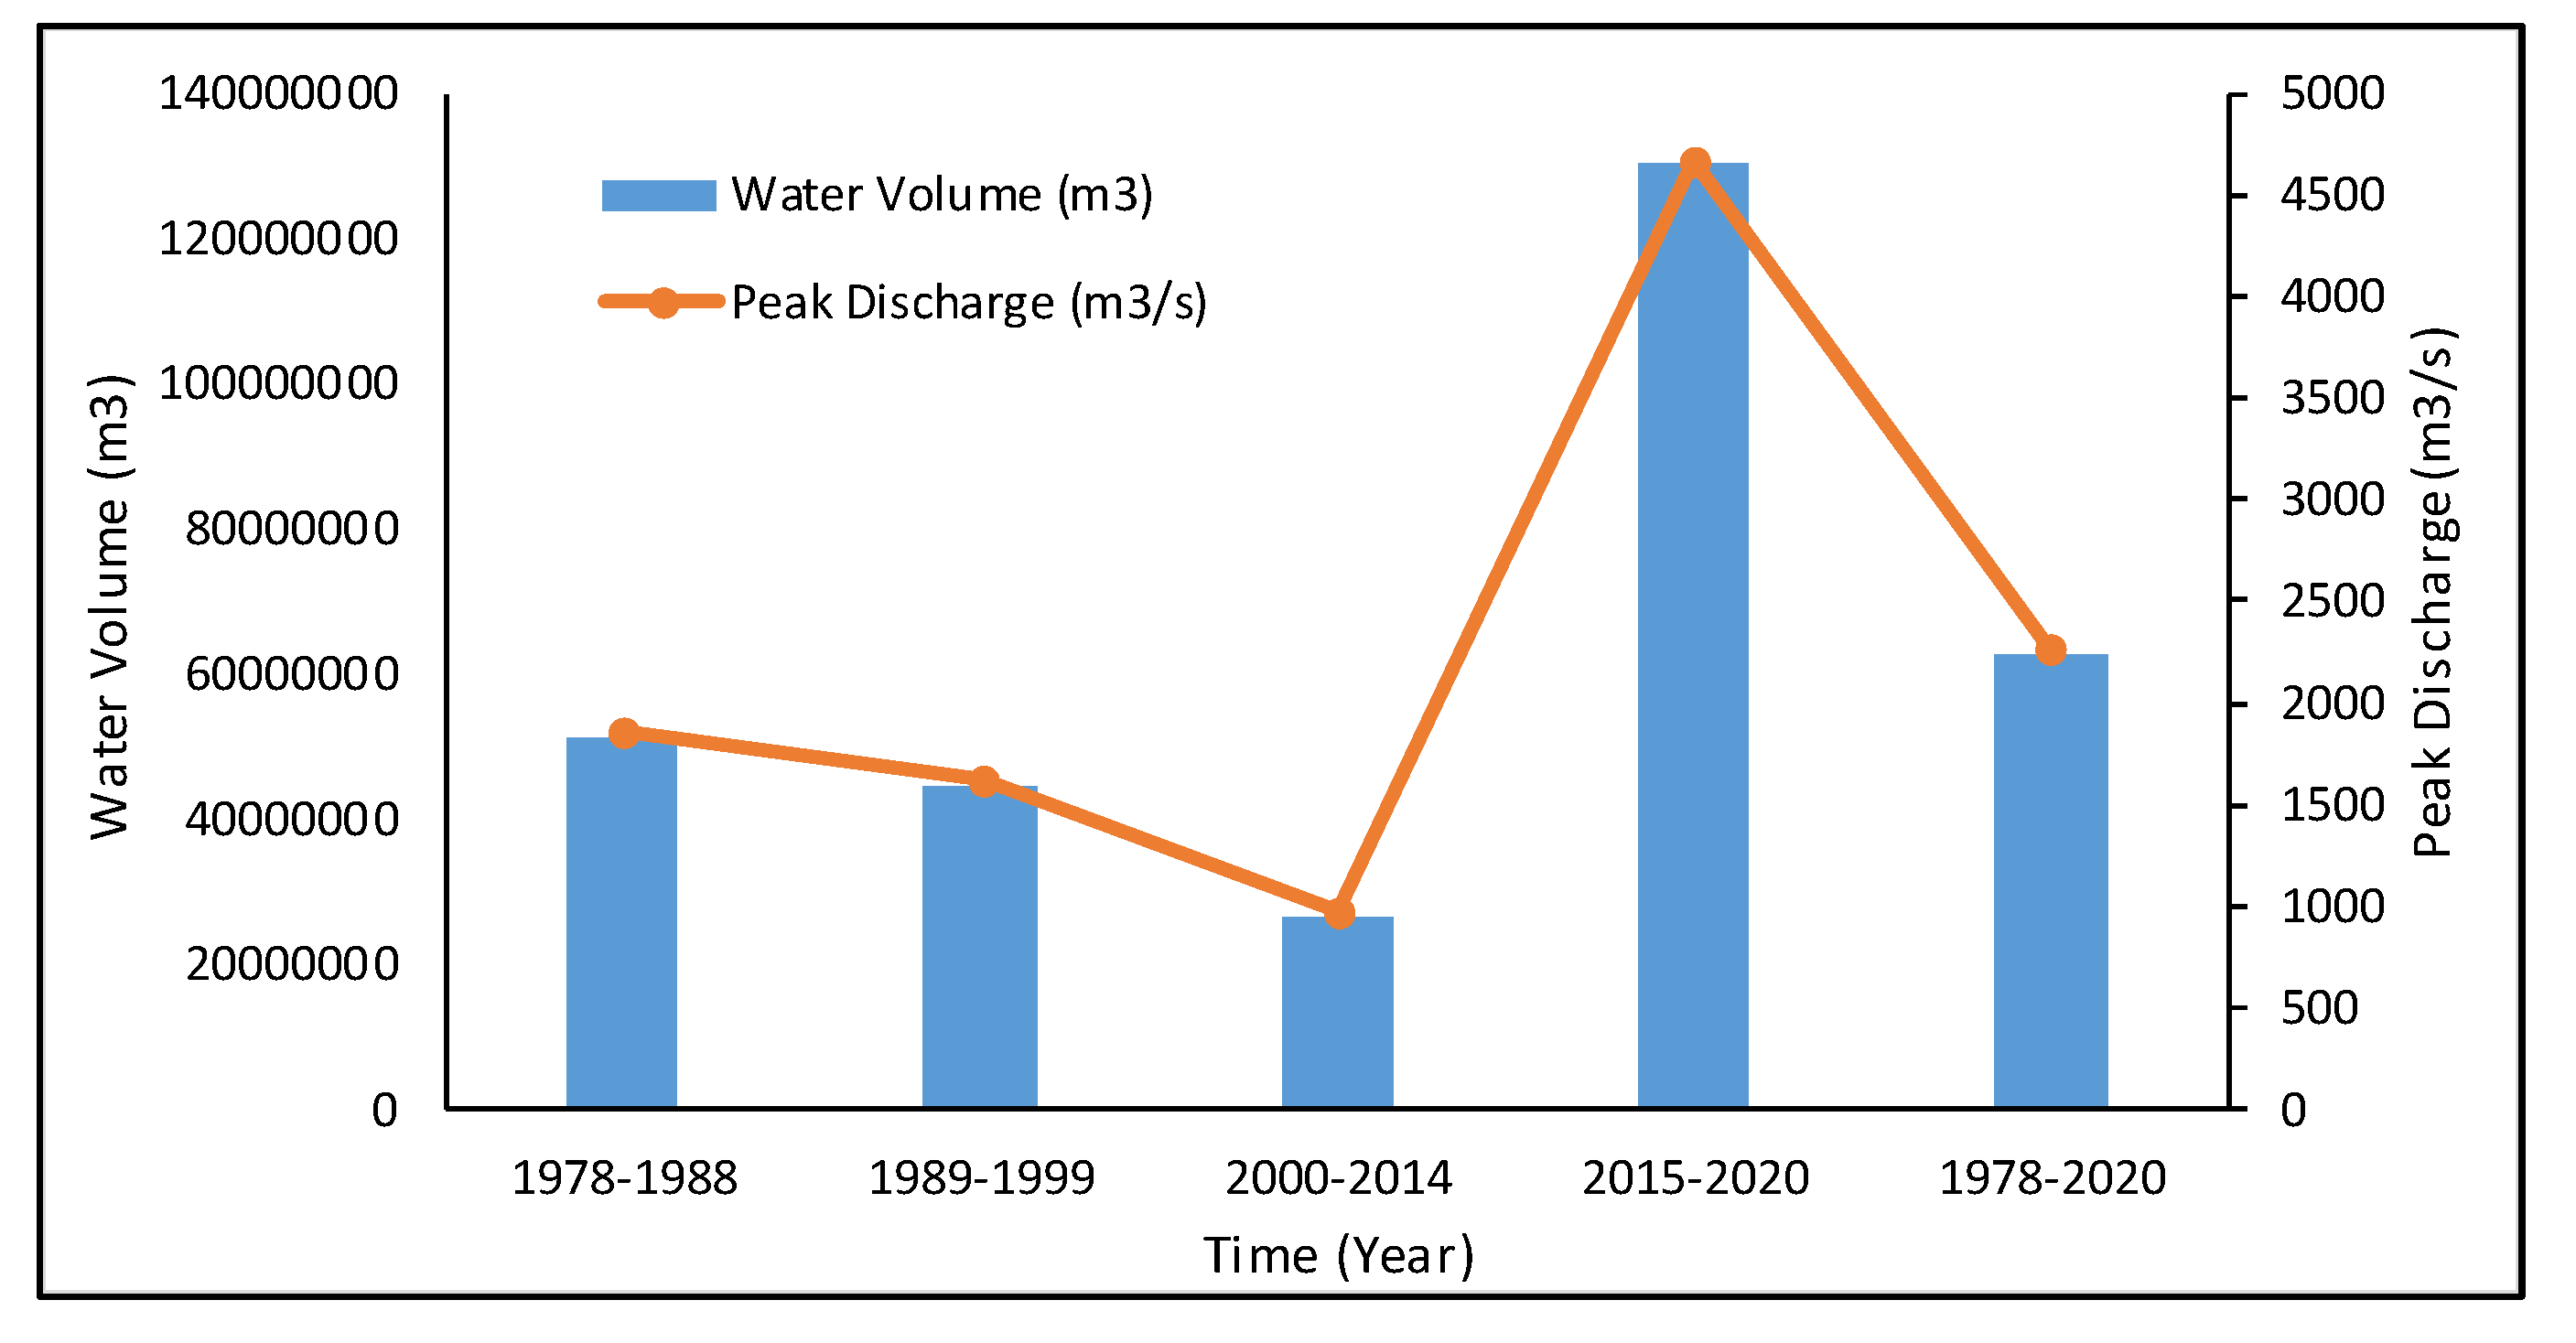
| Watershed | Time Interval | Av. Rainfall (mm/y) | Peak Discharge (m3/s) | Time to Peak (min) | Water Volume (m3) |
|---|---|---|---|---|---|
| Wadi Al Akkas | 1978–1988 | 238 | 759.32 | 960 | 19,915,989.8 |
| 1989–1999 | 215 | 663.79 | 960 | 17,401,970.7 | |
| 2000–2014 | 147 | 386.61 | 960 | 10,184,670 | |
| 2015–2020 | 520 | 1944 | 945 | 51,794,031.1 | |
| 1978–2020 | 280 | 934.72 | 960 | 24,564,206.7 | |
| Wadi Abha | 1978–1988 | 238 | 1101.69 | 975 | 31,090,603.5 |
| 1989–1999 | 215 | 968.73 | 975 | 27,312,840.5 | |
| 2000–2014 | 147 | 580.78 | 990 | 16,387,502 | |
| 2015–2020 | 520 | 2732.82 | 975 | 78,563,464.2 | |
| 1978–2020 | 280 | 1345.1 | 975 | 38,052,761 | |
| Outlet area | 1978–1988 | 238 | 1861.01 | 51,006,593.3 | |
| 1989–1999 | 215 | 1632.52 | 44,714,811.2 | ||
| 2000–2014 | 147 | 967.39 | 26,572,172 | ||
| 2015–2020 | 520 | 4676.82 | 130,357,495.3 | ||
| 1978–2020 | 280 | 2279.82 | 62,616,967.7 |
Publisher’s Note: MDPI stays neutral with regard to jurisdictional claims in published maps and institutional affiliations. |
© 2022 by the authors. Licensee MDPI, Basel, Switzerland. This article is an open access article distributed under the terms and conditions of the Creative Commons Attribution (CC BY) license (https://creativecommons.org/licenses/by/4.0/).
Share and Cite
Khan, M.Y.A.; ElKashouty, M.; Subyani, A.M.; Tian, F. Flash Flood Assessment and Management for Sustainable Development Using Geospatial Technology and WMS Models in Abha City, Aseer Region, Saudi Arabia. Sustainability 2022, 14, 10430. https://doi.org/10.3390/su141610430
Khan MYA, ElKashouty M, Subyani AM, Tian F. Flash Flood Assessment and Management for Sustainable Development Using Geospatial Technology and WMS Models in Abha City, Aseer Region, Saudi Arabia. Sustainability. 2022; 14(16):10430. https://doi.org/10.3390/su141610430
Chicago/Turabian StyleKhan, Mohd Yawar Ali, Mohamed ElKashouty, Ali M. Subyani, and Fuqiang Tian. 2022. "Flash Flood Assessment and Management for Sustainable Development Using Geospatial Technology and WMS Models in Abha City, Aseer Region, Saudi Arabia" Sustainability 14, no. 16: 10430. https://doi.org/10.3390/su141610430