
Does Particle Size in Nanofluid Synthesis Affect Their Performance as Heat Transfer Fluid in Flat Plate Collectors?—An Energy and Exergy Analysis

 , , and
Abstract
:1. Introduction
2. Materials and Methods
2.1. Mathematical Modeling of the FPC
- The effect of dust on the FPC was neglected.
- The thermal capacitance of the FPC was not considered.
- The front and back of the FPC were assumed to have the same temperature.
- The assumption of a one-dimensional perpendicular to the flow region in terms of the heat transfer was made.
- Consideration was given to the rear insulation’s natural convection with the surrounding air.
- Losses from radiation and convection from the insulation’s bottom and side surfaces were negligible.
- The translucent cover blocked off infrared light. It was assumed that the physical characteristics of materials were unaffected by changes in temperature.
- The insulation materials, absorber, and glass cover were not affected by temperature change.
2.2. Mathematical Modeling
2.3. Fly Ash Particles
2.4. Description of Nanoparticles/Nanofluids Used in This Study
Thermophysical properties and Correlation Equations
2.5. Model Validation
3. Result and Discussion
4. Conclusions
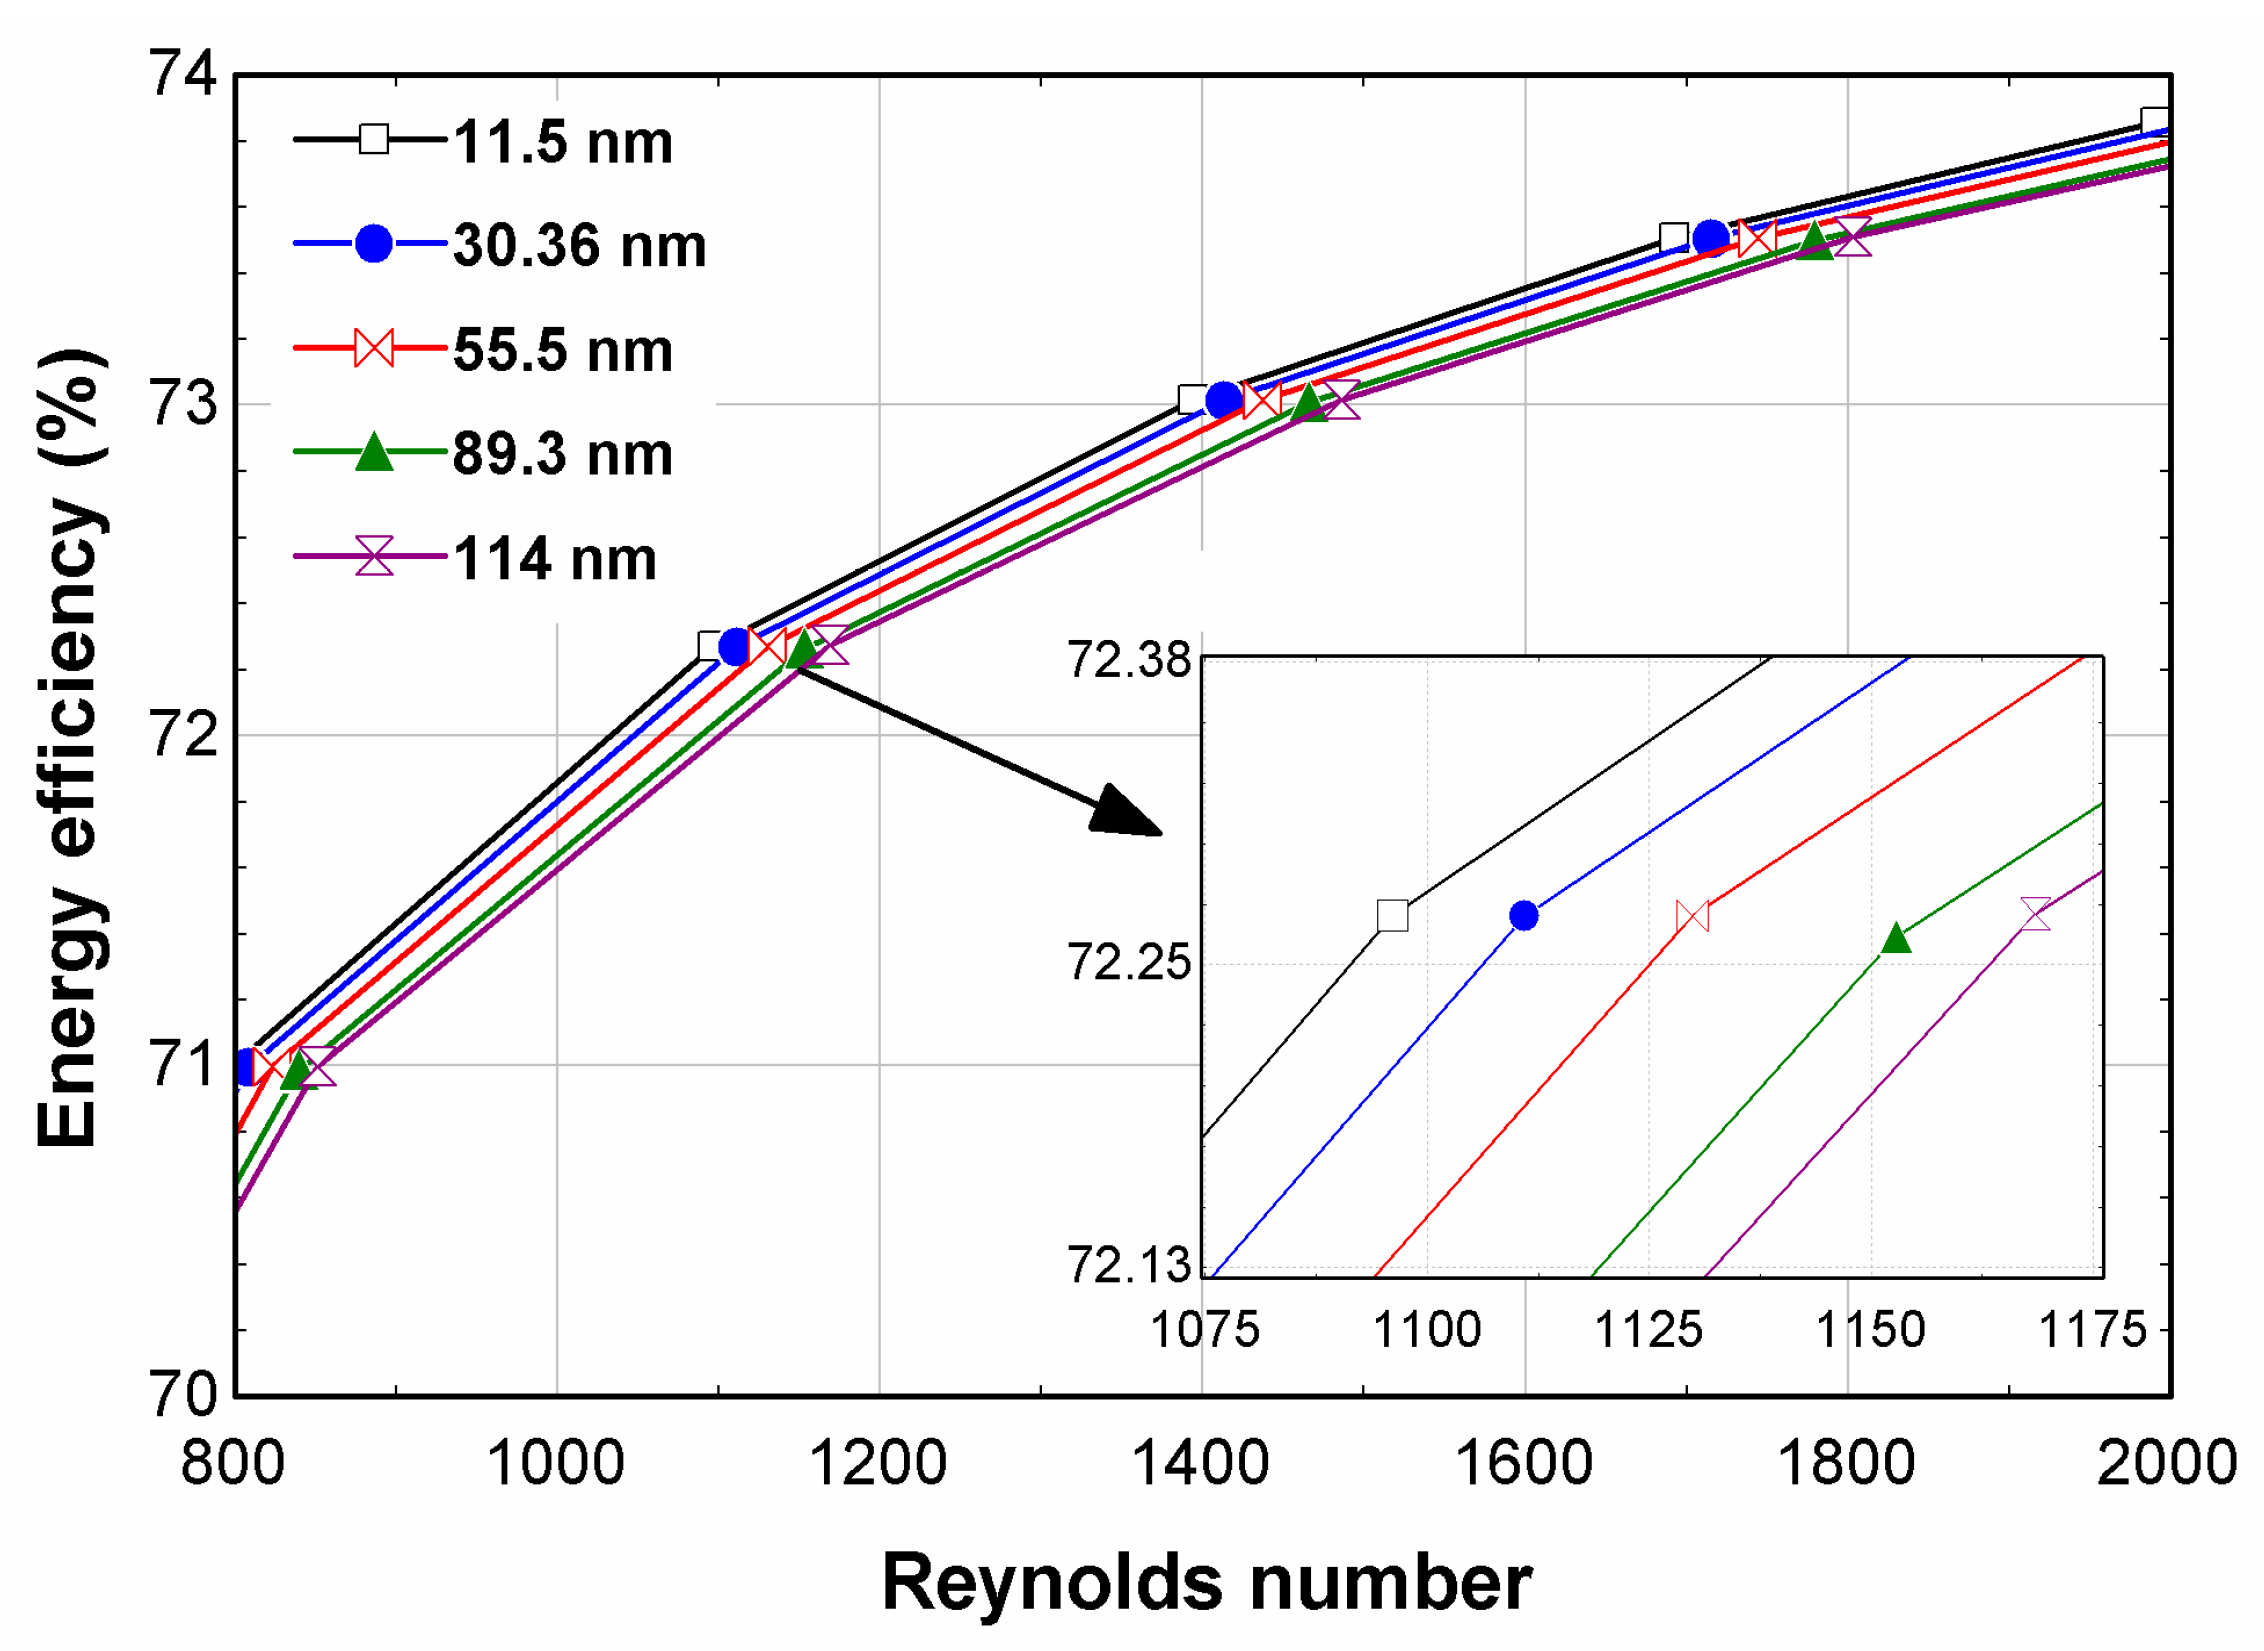
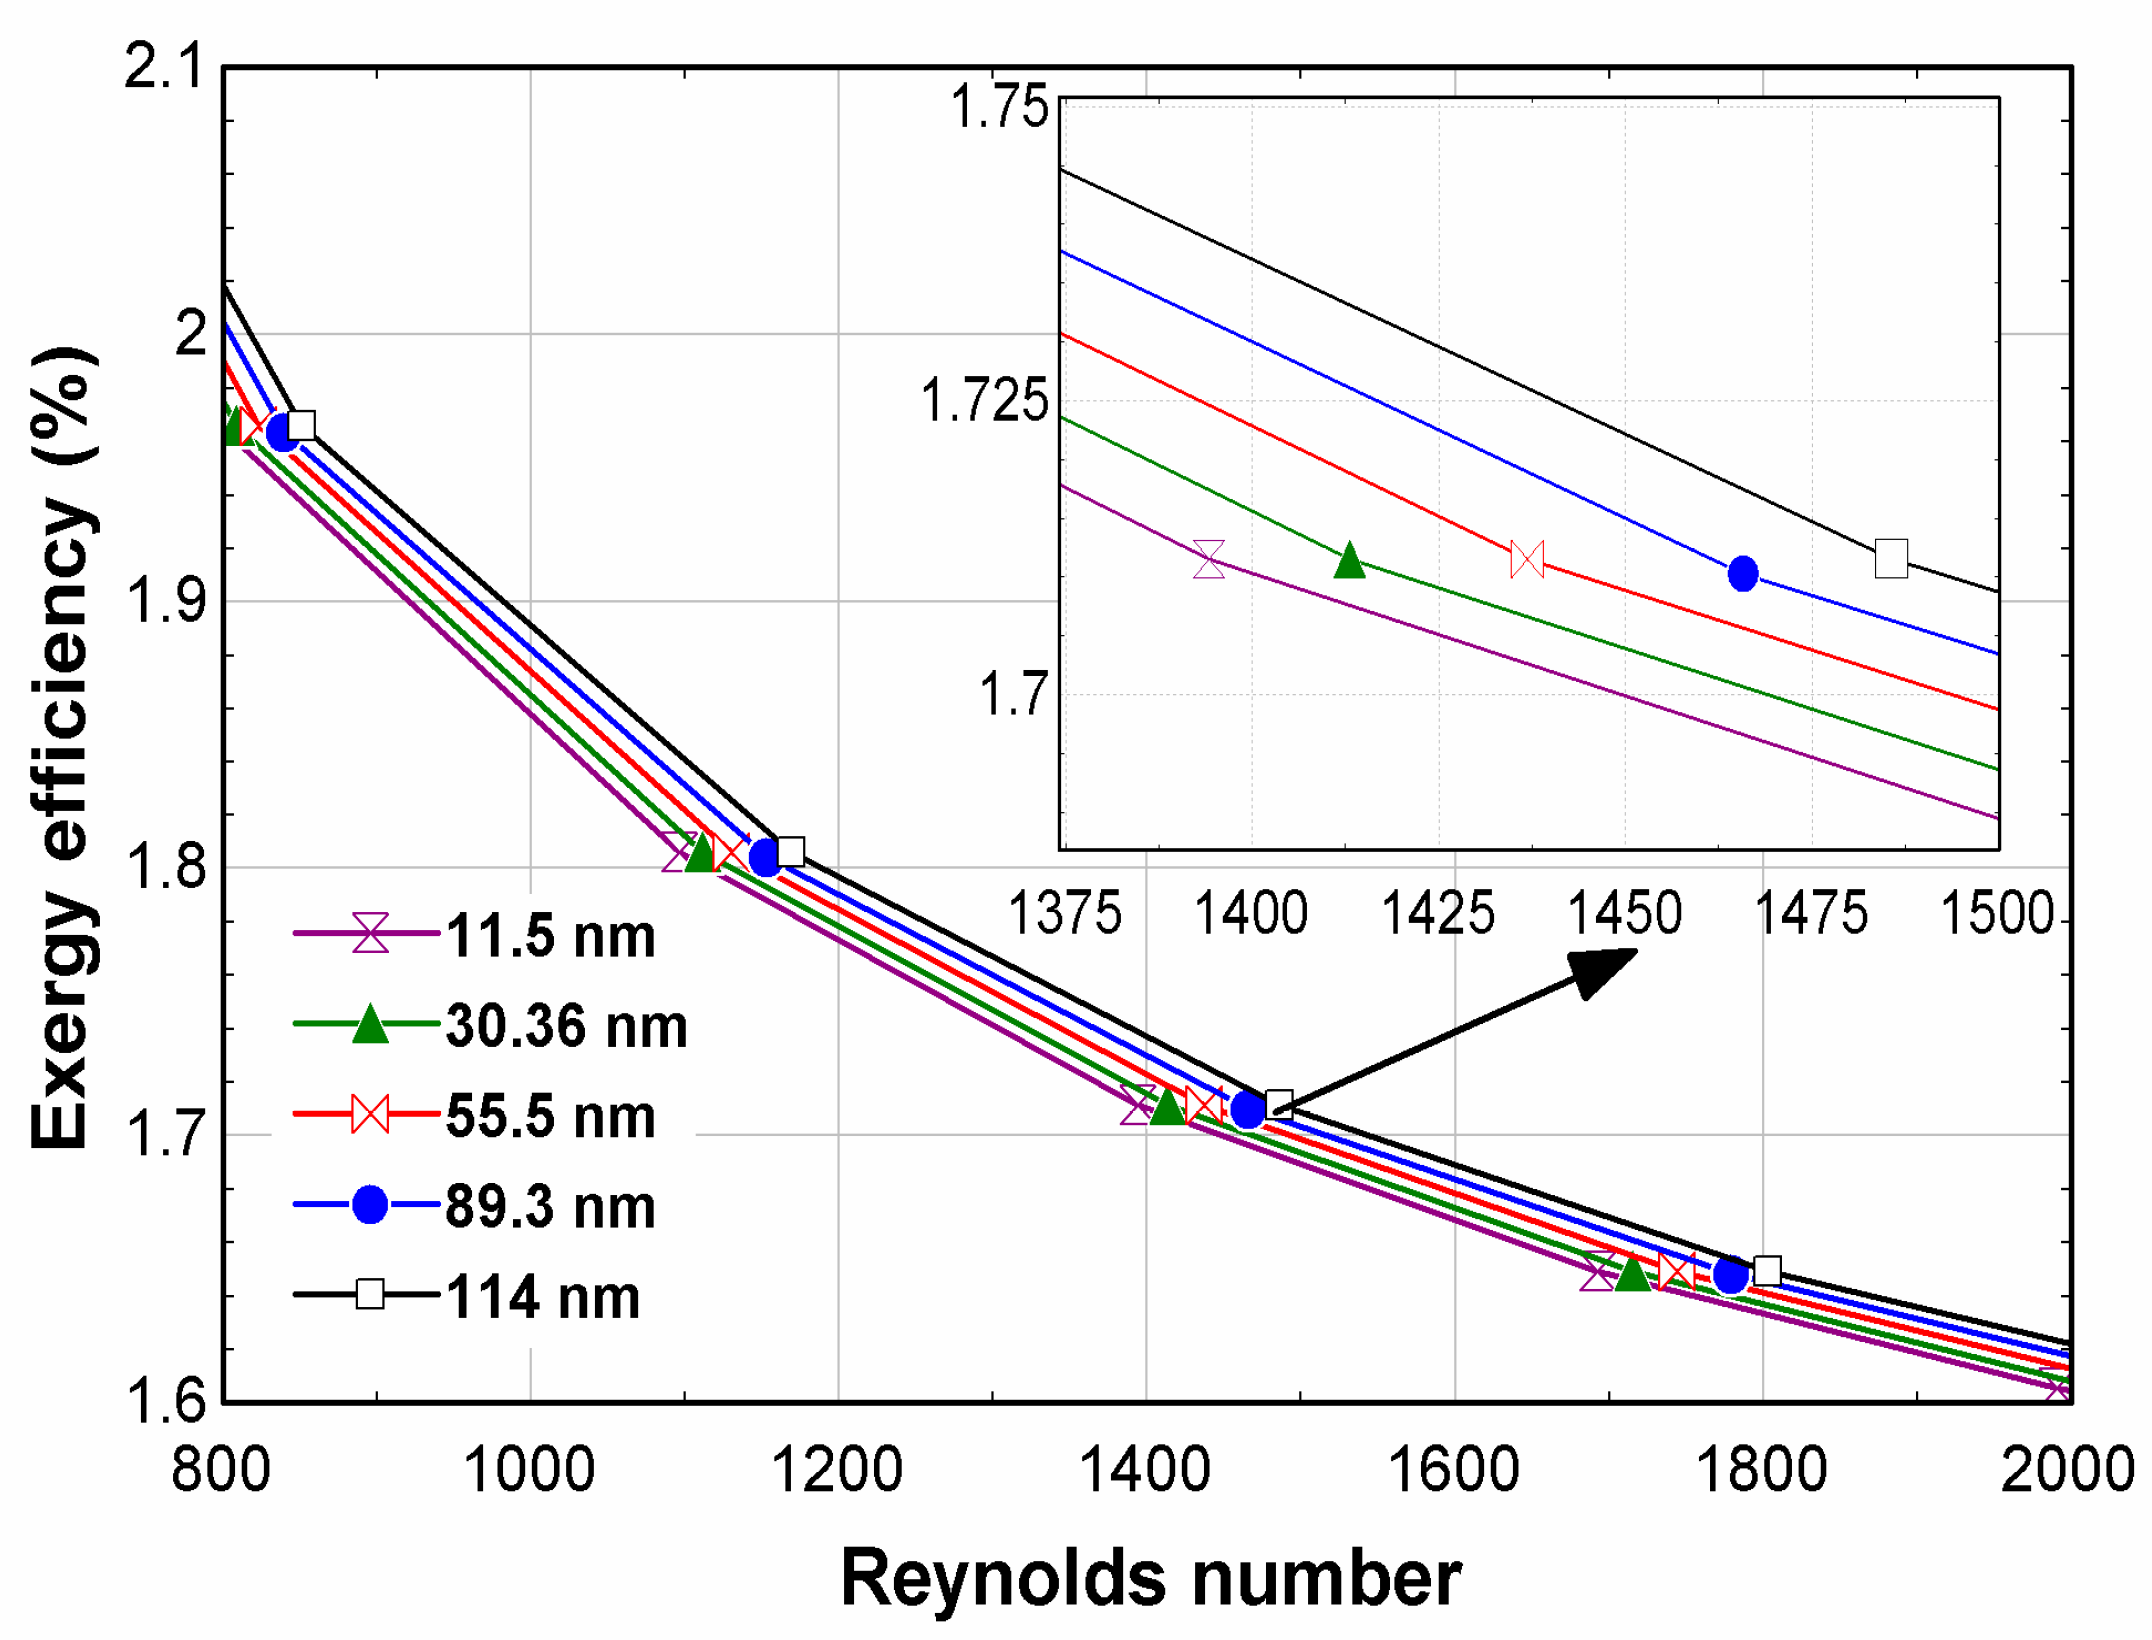
- The maximum energy efficiency measured was 73.8%, which was recorded for the fly ash nanofluid with a nanoparticle size of 11.5 nm.
- The maximum energy efficiency of the 114 nm fly ash nanofluid was 73.5%, which was 0.41% less than the 11.5 nm NPS at a Reynolds number of 2000. At a Reynolds number of 800, the energy efficiencies of 11.5, 30.36, 55.5, 89.3, and 114 nm were 71.3%, 71%, 70.72%, 70.67%, and 70.5%.
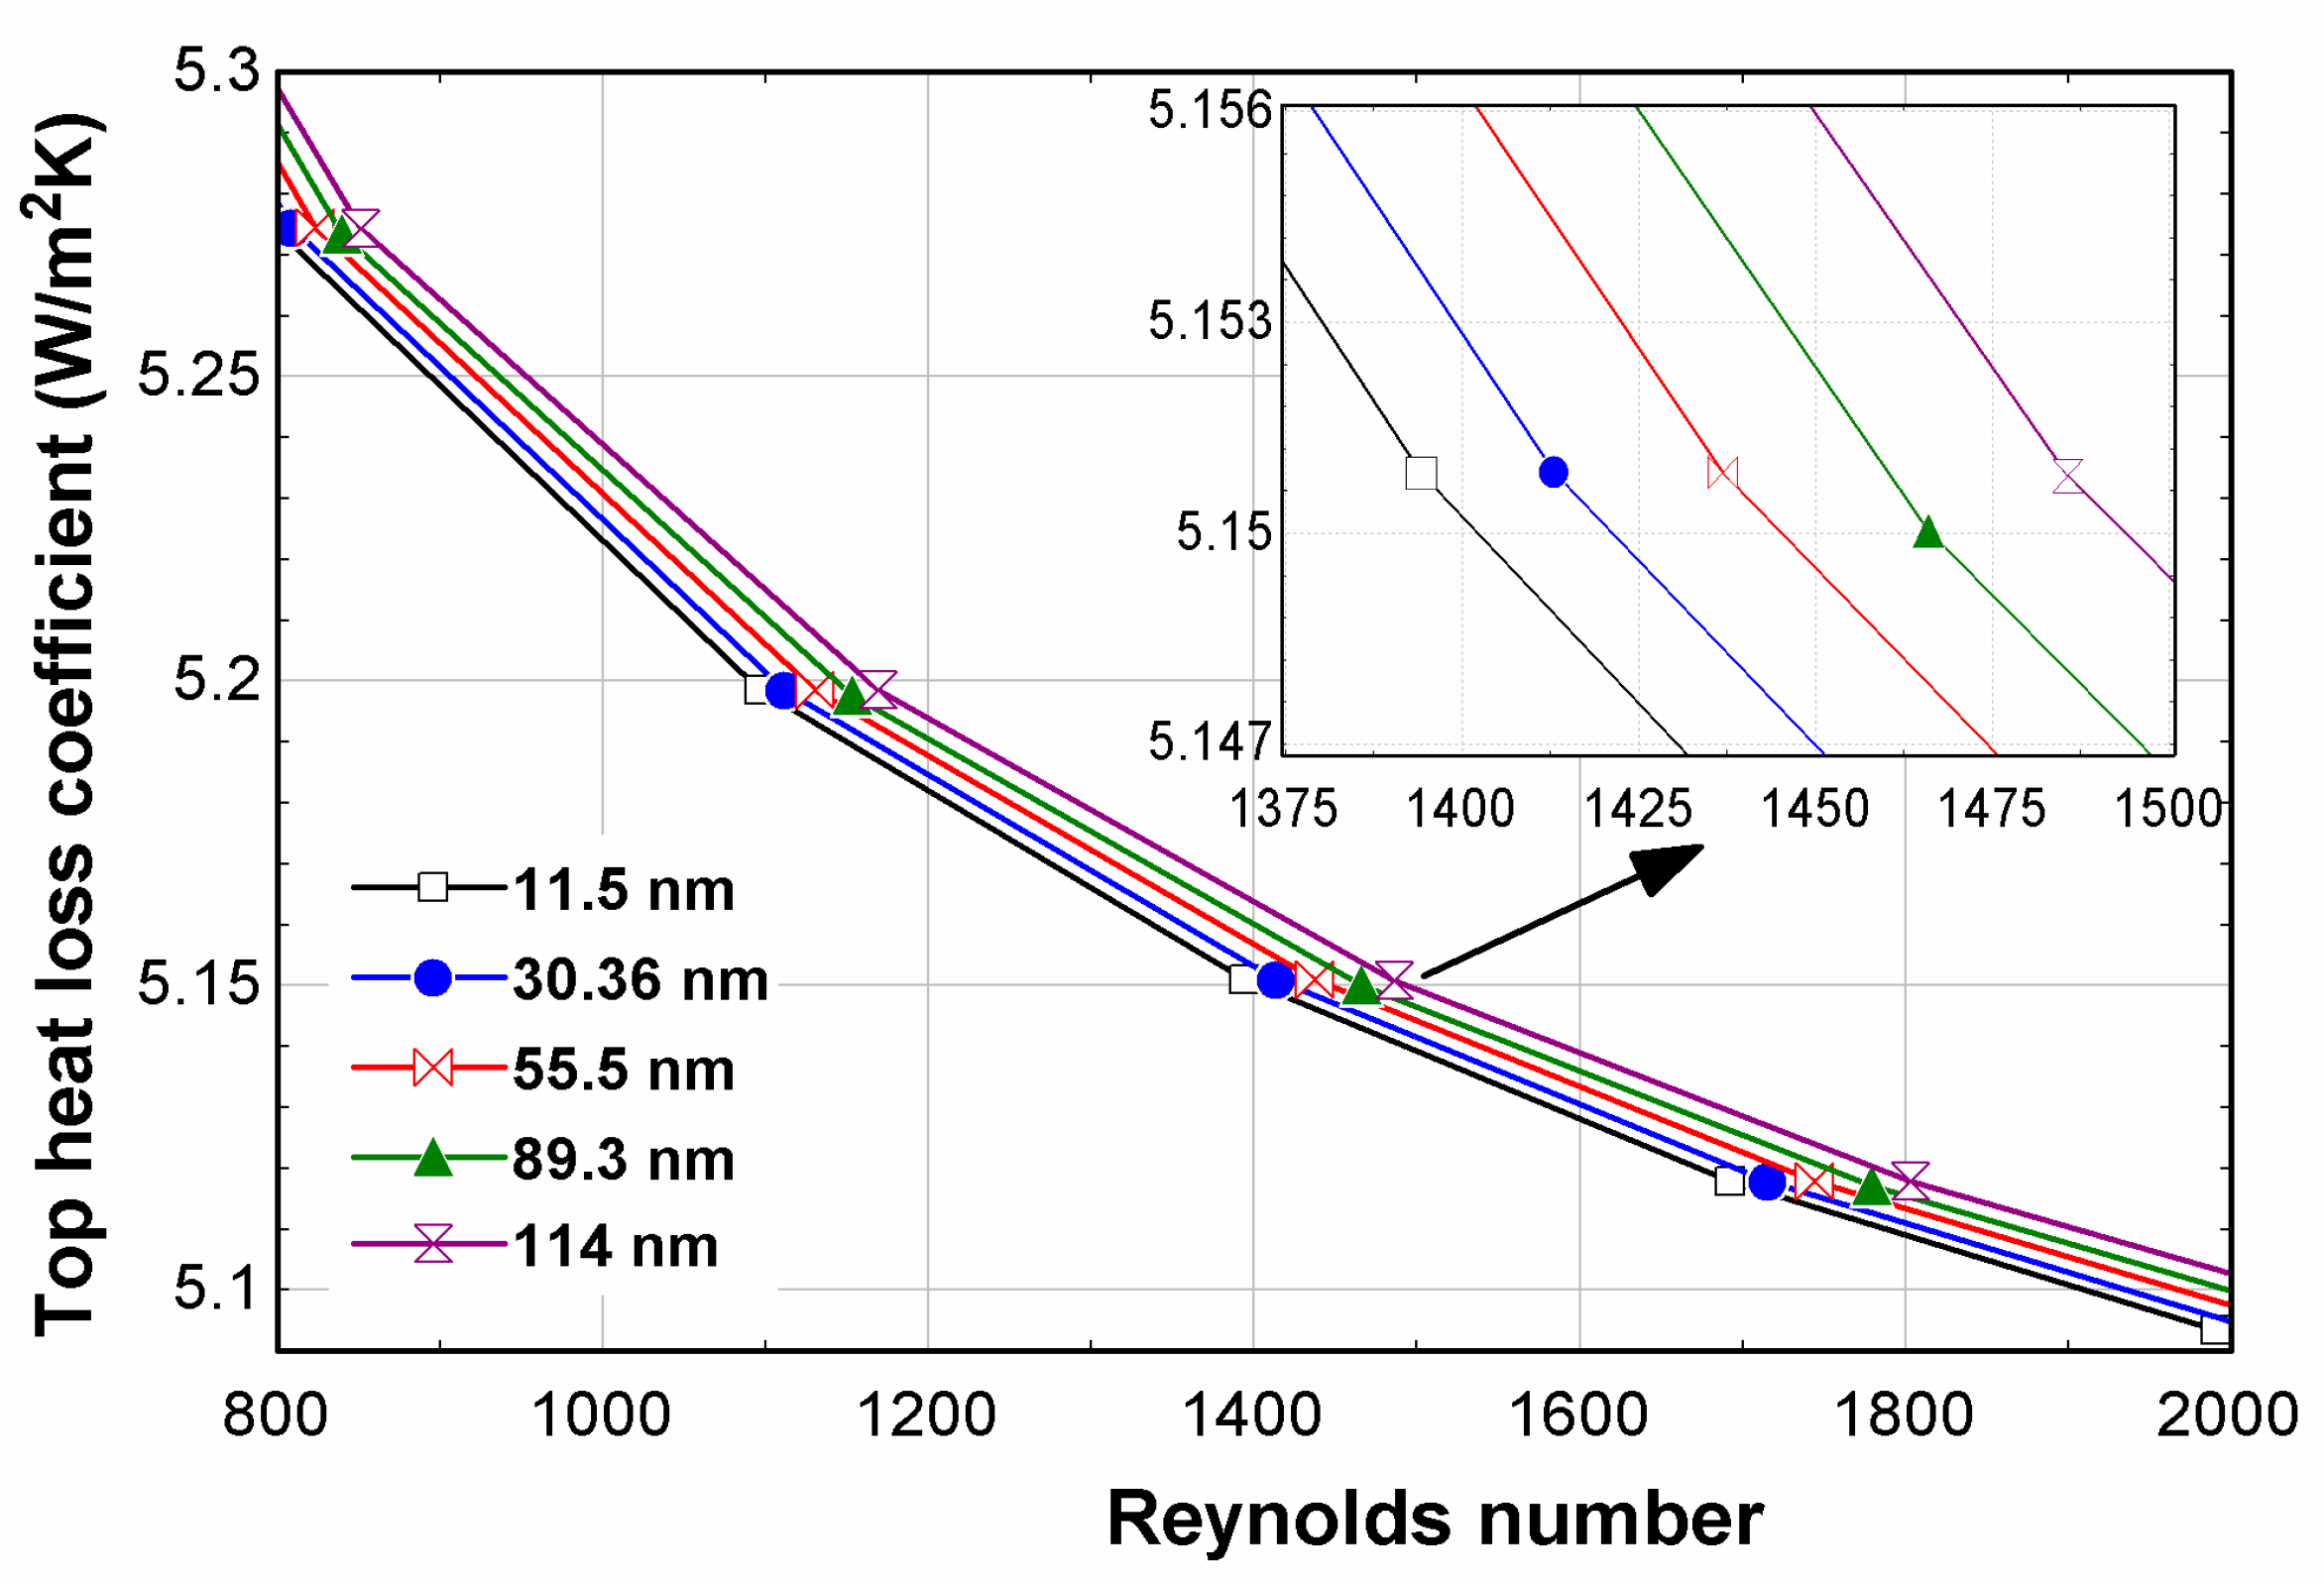
- At a Reynolds number of 2000, the fly ash nanofluid with a nanoparticle size of 11.5 nm showed a top heat loss coefficient of 4.78 W/m2K, while the top heat loss coefficient of a NPS of 114 nm was 5.17 W/m2K.
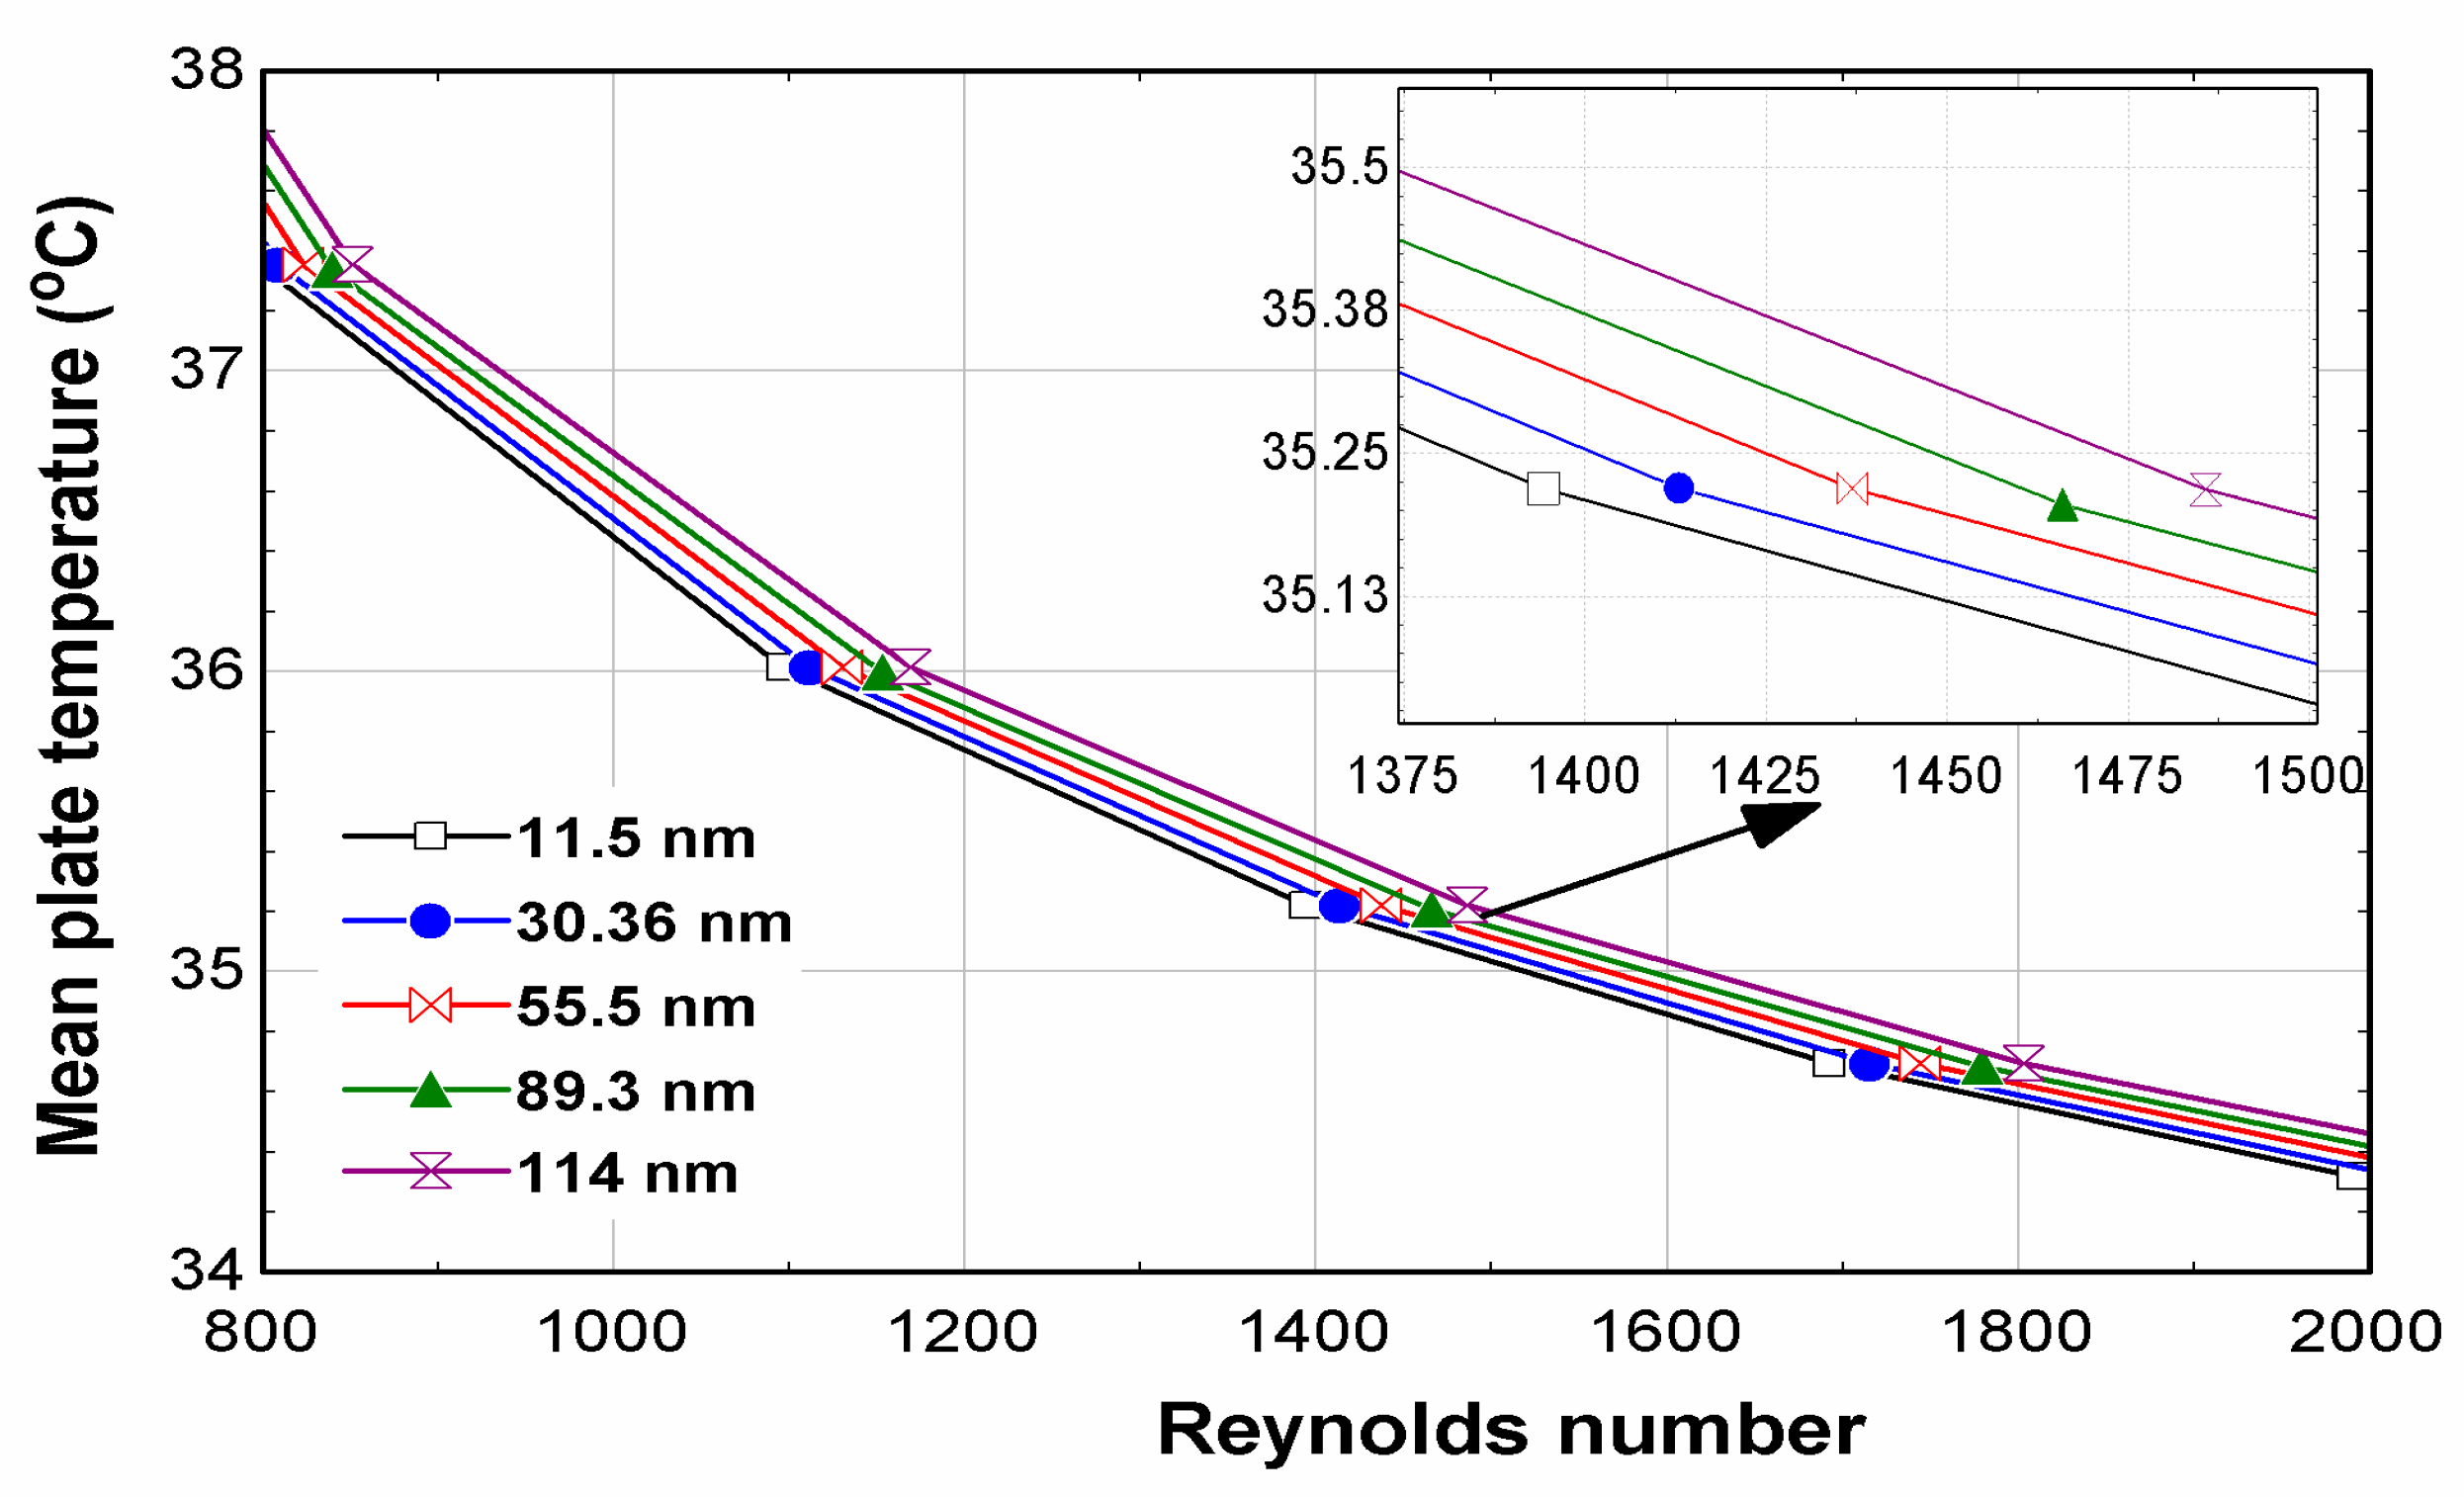
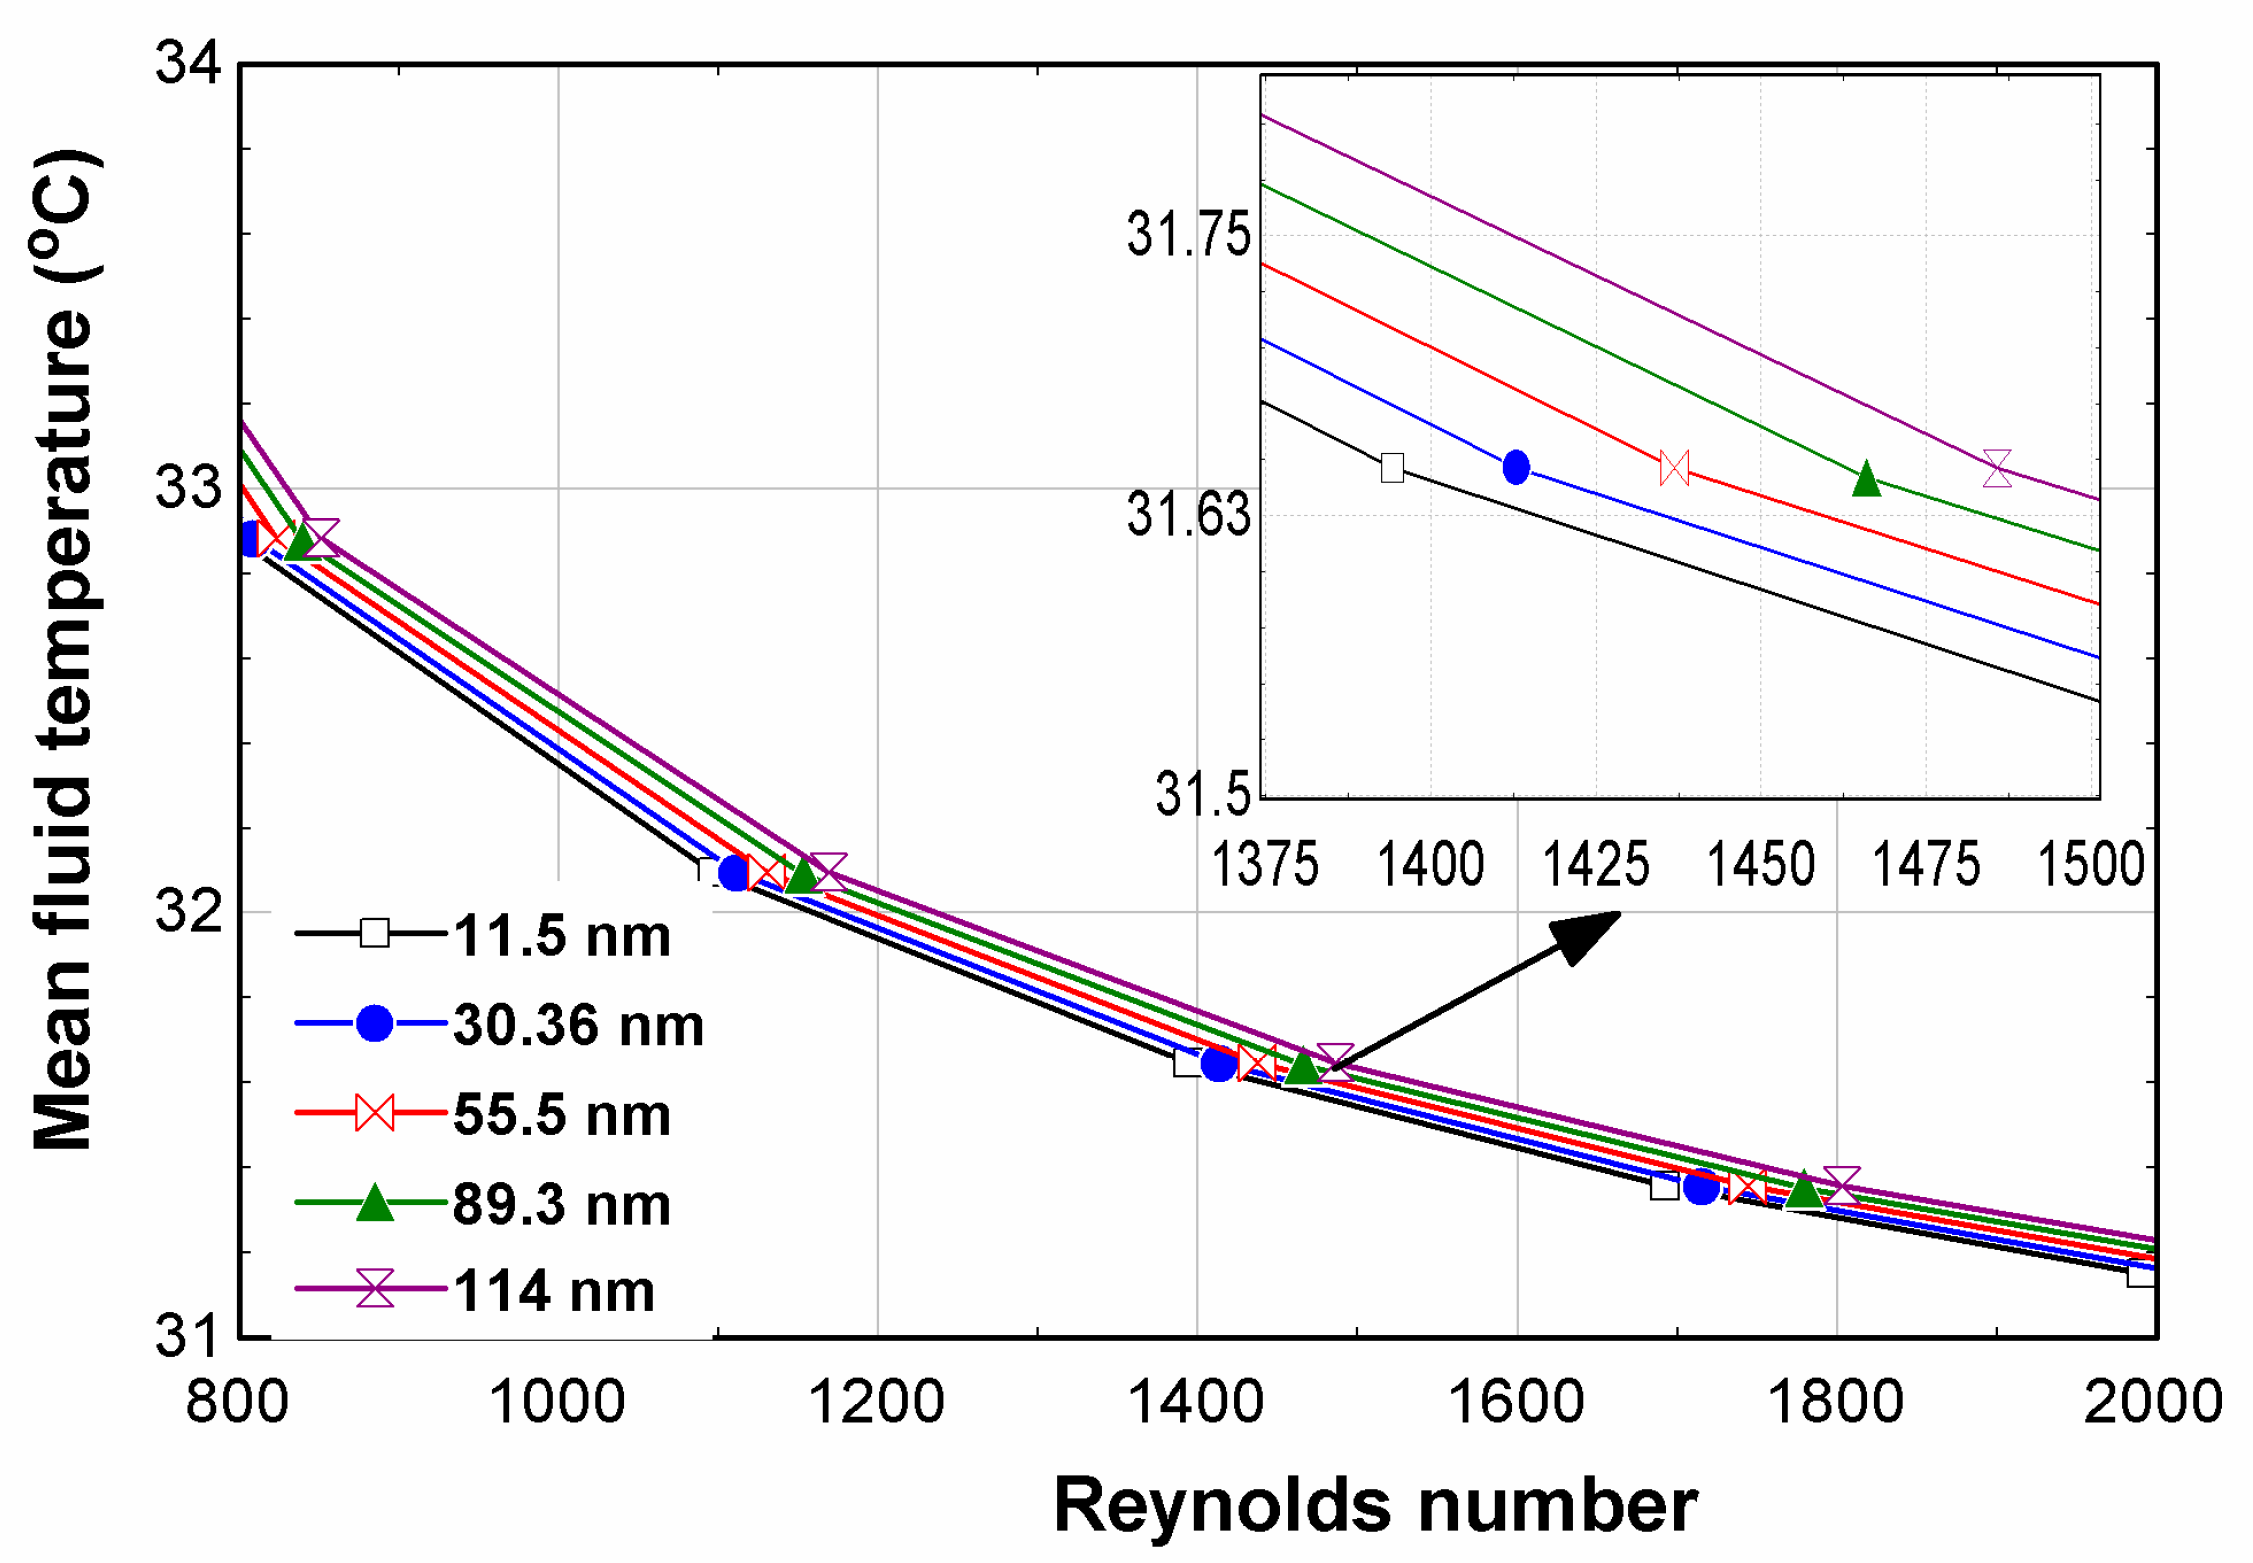
- The numerical analysis measured the least and maximum mean plate temperatures at a Reynolds number of 2000 at 34.21 °C and 34.57 °C, respectively.
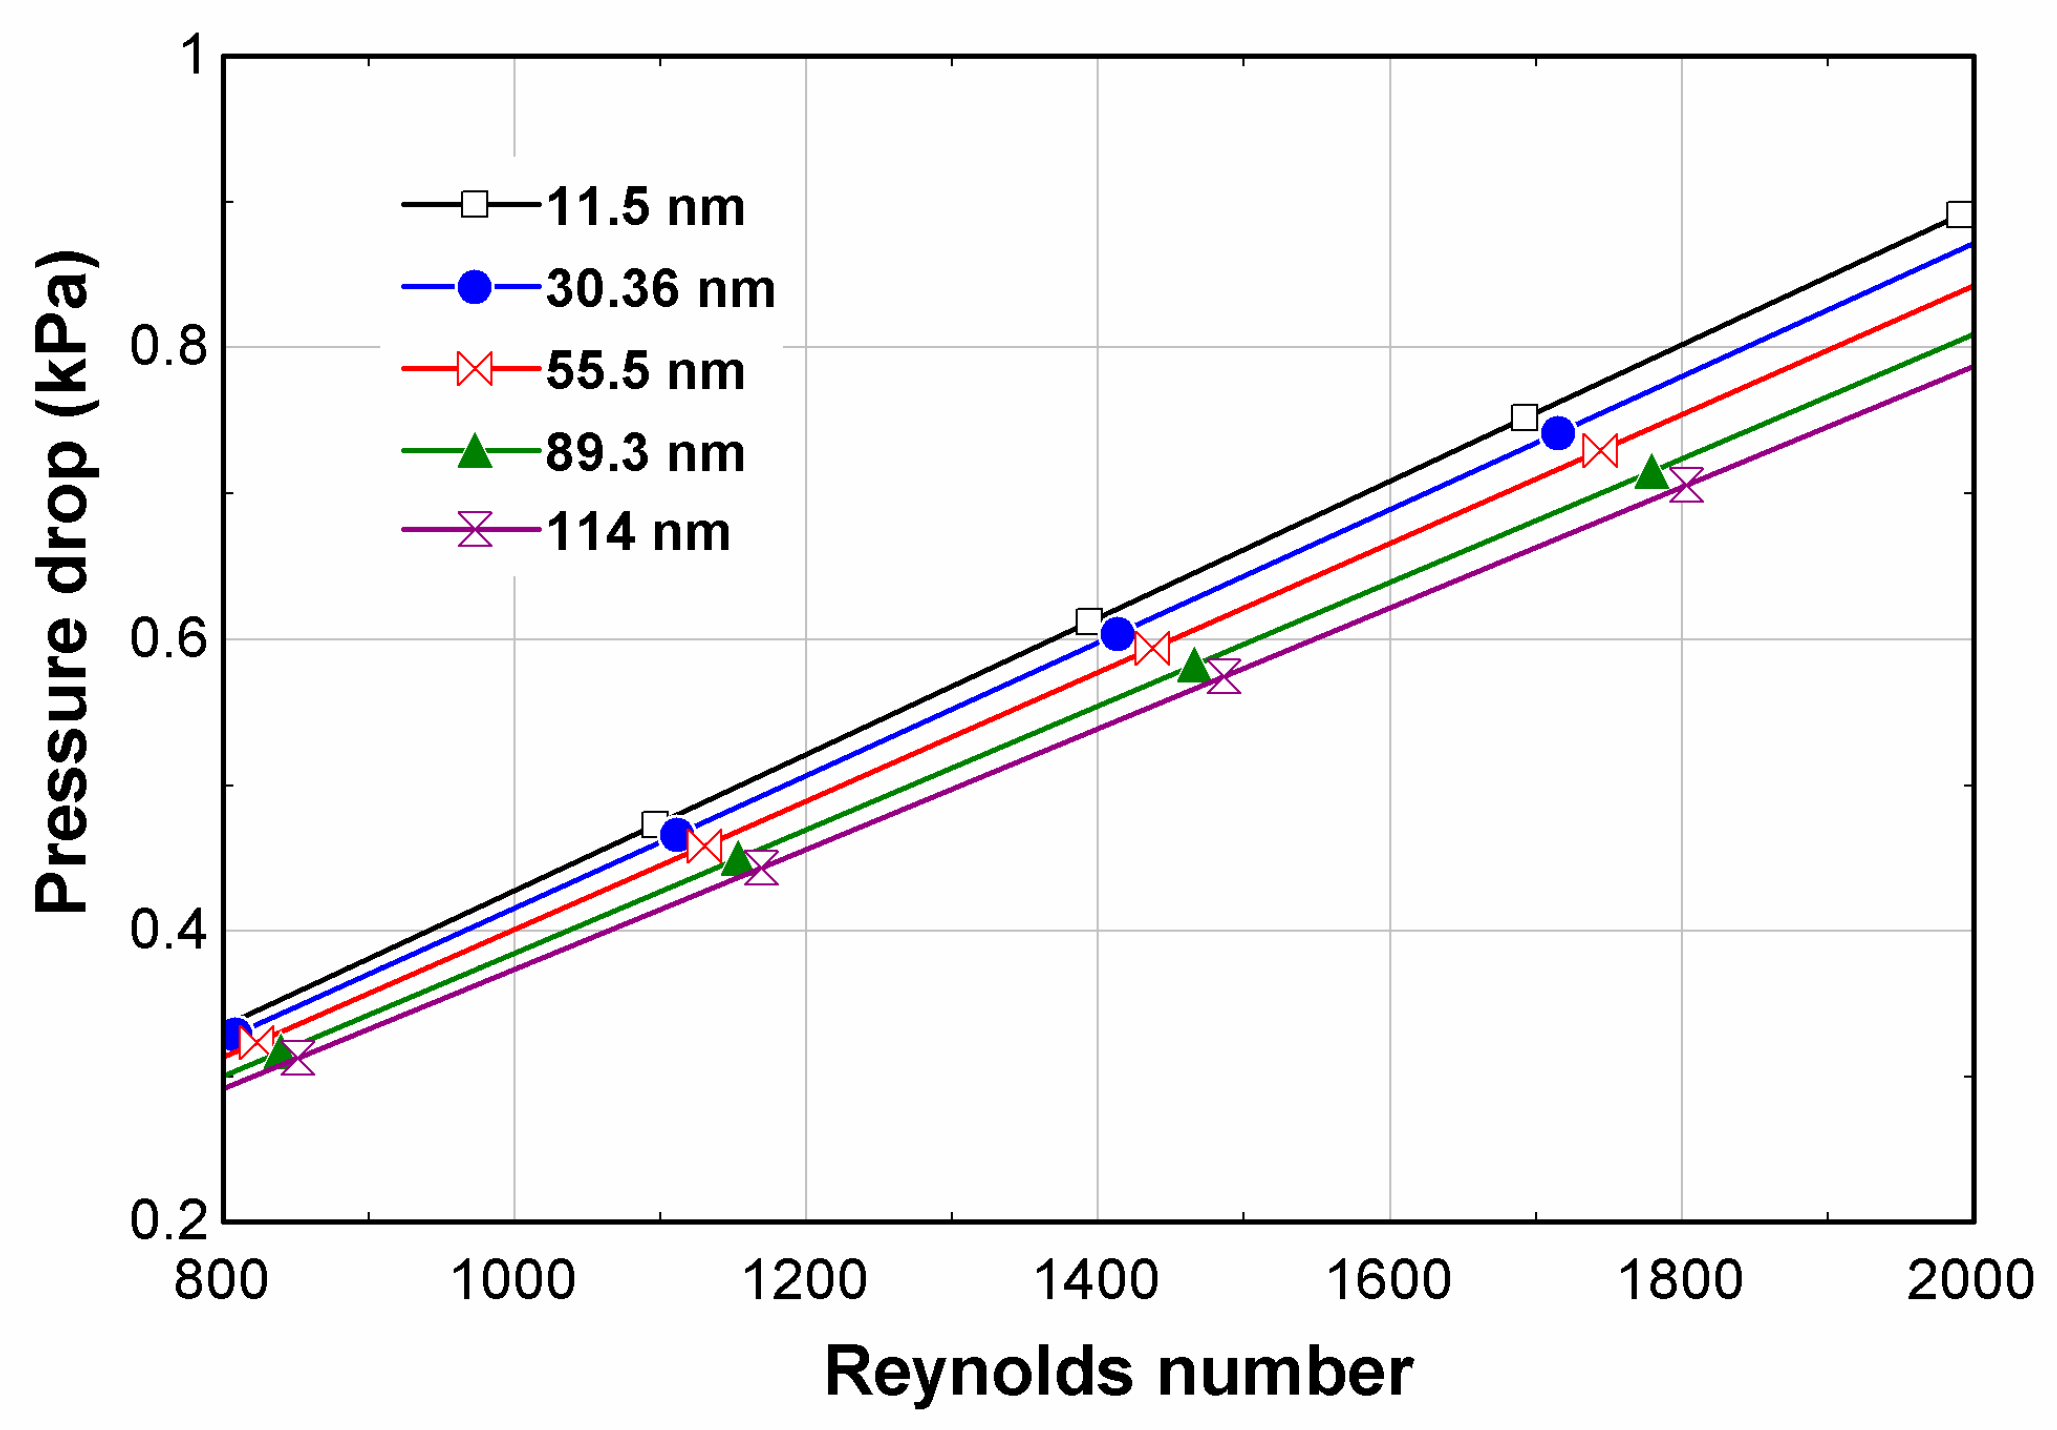
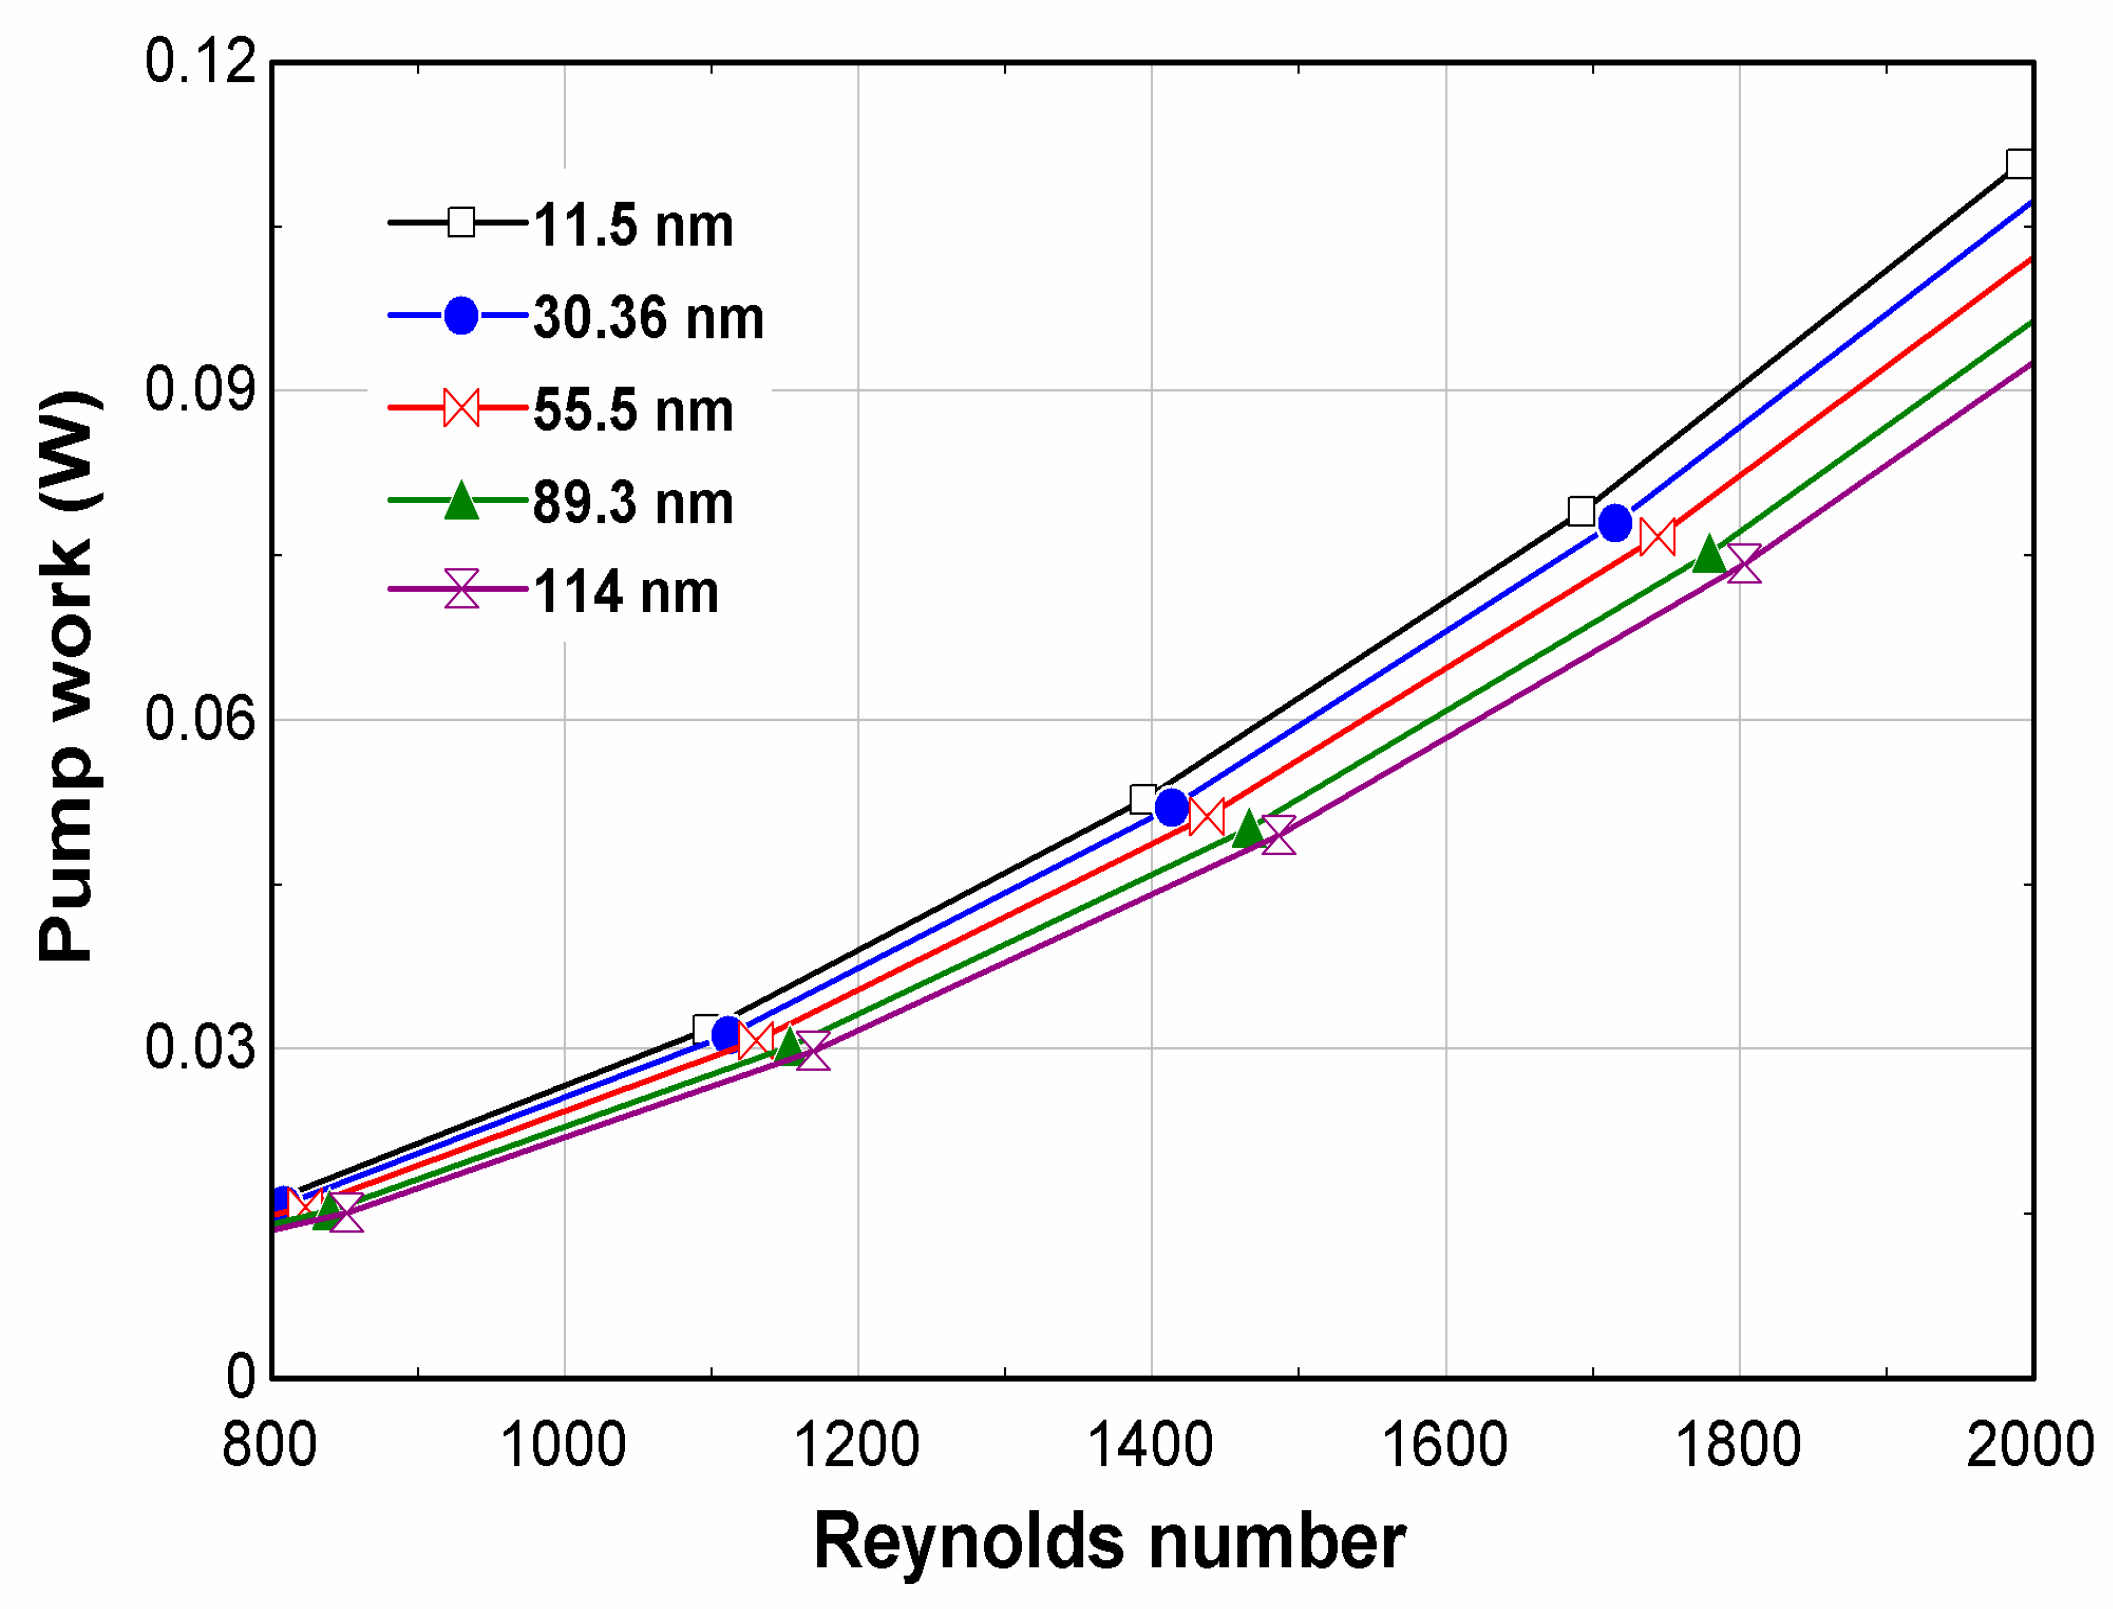
- At a higher Reynolds number, the pumping power increased significantly. A maximum pump work of 0.114 W was calculated at a Reynolds number of 2000 for the 11.5 nm fly ash nanofluid.
Author Contributions
Funding
Institutional Review Board Statement
Informed Consent Statement
Data Availability Statement
Conflicts of Interest
References
- Curtin, J.; Mcinerney, C.; Gallachóir, B.Ó.; Hickey, C.; Deane, P.; Deeney, P. Quantifying stranding risk for fossil fuel assets and implications for renewable energy investment: A review of the literature. Renew. Sustain. Energy Rev. 2019, 116, 109402. [Google Scholar] [CrossRef]
- Yang, X.; Pang, J.; Teng, F.; Gong, R.; Springer, C. The environmental co-benefit and economic impact of China ’ s low-carbon pathways: Evidence from linking bottom-up and top-down models. Renew. Sustain. Energy Rev. 2021, 136, 110438. [Google Scholar] [CrossRef]
- Al-maamary, H.M.S.; Kazem, H.A.; Chaichan, M.T. The impact of oil price fl uctuations on common renewable energies in GCC countries. Renew. Sustain. Energy Rev. 2017, 75, 989–1007. [Google Scholar] [CrossRef]
- Hawwash, A.A.; Abdel, A.K.; Nada, S.A.; Ookawara, S. Numerical Investigation and Experimental Verification of Performance Enhancement of Flat Plate Solar Collector Using Nanofluids. Appl. Therm. Eng. 2018, 130, 363–374. [Google Scholar] [CrossRef]
- Chen, X.; Zhou, P.; Chen, M. Enhancing the solar absorption performance of nanoparticle suspensions by tuning the scattering effect and incident light location. Int. J. Therm. Sci. 2022, 177, 107547. [Google Scholar] [CrossRef]
- Chen, X.; Wu, D.; Zhou, P.; Chen, M.; Yan, H. Modeling the solar absorption performance of Copper@Carbon core–shell nanoparticles. J. Mater. Sci. 2021, 56, 13659–13672. [Google Scholar] [CrossRef]
- Chen, M.; Chen, X.; Wu, D. Solar Thermal Conversion of Plasmonic Nanofluids: Fundamentals and Applications. In Advances in Microfluidics and Nanofluids; IntechOpen: London, UK, 2021. [Google Scholar]
- Qiu, L.; Zhu, N.; Feng, Y.; Michaelides, E.E.; Żyła, G.; Jing, D.; Zhang, X.; Norris, P.M.; Markides, C.N.; Mahian, O. A review of recent advances in thermophysical properties at the nanoscale: From solid state to colloids. Phys. Rep. 2019, 843, 1–81. [Google Scholar] [CrossRef]
- Yu, W.; Xie, H. A Review on Nanofluids: Preparation, Stability Mechanisms, and Applications. J. Nanomater. 2012, 2012, 435873. [Google Scholar] [CrossRef] [Green Version]
- Khanafer, K.; Vafai, K. A critical synthesis of thermophysical characteristics of nanofluids. Int. J. Heat Mass Transf. 2011, 54, 4410–4428. [Google Scholar] [CrossRef]
- Kanchana, C.; Zhao, Y.; Siddheshwar, P.G. A comparative study of individual influences of suspended multiwalled carbon nanotubes and alumina nanoparticles on Rayleigh-Bénard convection in water. Phys. Fluids 2018, 30, 084101. [Google Scholar] [CrossRef]
- Hassan, M.I.; Alzarooni, I.A.; Shatilla, Y. The Effect of Water-Based Nanofluid Incorporating Al2O3 Nanoparticles on Heat Pipe Performance. Energy Procedia 2015, 75, 3201–3206. [Google Scholar] [CrossRef] [Green Version]
- Jeong, J.; Li, C.; Kwon, Y.; Lee, J.; Kim, S.H.; Yun, R. Particle shape effect on the viscosity and thermal conductivity of ZnO nanofluids. Int. J. Refrig. 2013, 36, 2233–2241. [Google Scholar] [CrossRef]
- Singh, M.; Lara, S.; Tlali, S. Effects of size and shape on the specific heat, melting entropy and enthalpy of nanomaterials. J. Taibah Univ. Sci. 2017, 11, 922–929. [Google Scholar] [CrossRef] [Green Version]
- Maheshwary, P.B.; Handa, C.C.; Nemade, K.R.; Chaudhary, S.R. Role of nanoparticle shape in enhancing the thermal conductivity of nanofluids. Mater. Today Proc. 2019, 28, 873–878. [Google Scholar] [CrossRef]
- Ranga Babu, J.A.; Kumar, K.K.; Srinivasa Rao, S. State-of-art review on hybrid nanofluids. Renew. Sustain. Energy Rev. 2017, 77, 551–565. [Google Scholar] [CrossRef]
- Jai, S.S.; Momin, M.; Nwaokocha, C.; Sharifpur, M.; Meyer, J.P. An empirical study on the persuasive particle size effects over the multi- physical properties of monophase MWCNT-Al2O3 hybridized nanofluids. J. Mol. Liq. 2022, 361, 119668. [Google Scholar] [CrossRef]
- Bai, J.; Hussein, D.; Fagiry, M.A.; Tlili, I. Numerical analysis and two-phase modeling of water Graphene Oxide nanofluid flow in the riser condensing tubes of the solar collector heat exchanger. Sustain. Energy Technol. Assess. 2022, 53, 102408. [Google Scholar] [CrossRef]
- Mustafa, J.; Alqaed, S.; Sharifpur, M. Evaluation of energy efficiency, visualized energy, and production of environmental pollutants of a solar flat plate collector containing hybrid nanofluid. Sustain. Energy Technol. Assess. 2022, 53, 102399. [Google Scholar] [CrossRef]
- Yurddaş, A.; Çerçi, Y.; Sarı Çavdar, P.; Bektaş, A. The effects of the use of hybrid and mono nanofluids on thermal performance in flat-plate solar collectors. Environ. Prog. Sustain. Energy 2022, 41, e13770. [Google Scholar] [CrossRef]
- Gulzar, O.; Qayoum, A.; Gupta, R. Experimental study on stability and rheological behaviour of hybrid Al2O3-TiO2 Therminol-55 nanofluids for concentrating solar collectors. Powder Technol. 2019, 352, 436–444. [Google Scholar] [CrossRef]
- Gulzar, O.; Qayoum, A.; Gupta, R. Experimental study on thermal conductivity of mono and hybrid Al2O3–TiO2 nanofluids for concentrating solar collectors. Int. J. Energy Res. 2021, 45, 4370–4384. [Google Scholar] [CrossRef]
- Khetib, Y.; Abo-dief, H.M.; Alanazi, A.K.; Sajadi, S.M. Effect of nanoparticles shape on turbulent nanofluids flow within a solar collector by using hexagonal cross-section tubes. Sustain. Energy Technol. Assess. 2022, 51, 101843. [Google Scholar] [CrossRef]
- Keblinski, P.; Eastman, J.A.; Cahill, D.G. Nanofluids for thermal transport. Mater. Today 2005, 8, 36–44. [Google Scholar] [CrossRef]
- Kim, S.H.; Choi, S.R.; Kim, D. Thermal conductivity of metal-oxide nanofluids: Particle size dependence and effect of laser irradiation. ASME 2012 Int. Mech. Eng. Congr. Expo. 2007, 129, 298–307. [Google Scholar] [CrossRef]
- Das, S.K. An experimental investigation into the thermal conductivity enhancement in oxide and metallic nanofluids. J. Nanoparticle Res. 2010, 12, 1015–1031. [Google Scholar] [CrossRef]
- Hemmat Esfe, M.; Saedodin, S.; Wongwises, S.; Toghraie, D. An experimental study on the effect of diameter on thermal conductivity and dynamic viscosity of Fe/water nanofluids. J. Therm. Anal. Calorim. 2015, 119, 1817–1824. [Google Scholar] [CrossRef]
- Xia, G.; Jiang, H.; Liu, R.; Zhai, Y. International Journal of Thermal Sciences Effects of surfactant on the stability and thermal conductivity of Al2O3/de-ionized water nano fluids. Int. J. Therm. Sci. 2014, 84, 118–124. [Google Scholar] [CrossRef]
- Beck, M.P.; Yuan, Y.; Warrier, P.; Teja, A.S. The effect of particle size on the thermal conductivity of alumina nanofluids. J. Nanoparticle Res. 2009, 11, 1129–1136. [Google Scholar] [CrossRef]
- Timofeeva, E.V.; Smith, D.S.; Yu, W.; France, D.M.; Singh, D.; Routbort, J.L. Particle size and interfacial effects on thermo-physical and heat transfer characteristics of water-based α-SiC nanofluids. Nanotechnology 2010, 21, 215703. [Google Scholar] [CrossRef]
- He, Y.; Jin, Y.; Chen, H.; Ding, Y.; Cang, D.; Lu, H. Heat transfer and flow behaviour of aqueous suspensions of TiO2 nanoparticles (nanofluids) flowing upward through a vertical pipe. Int. J. Heat Mass Transf. 2007, 50, 2272–2281. [Google Scholar] [CrossRef]
- Turgut, A.; Tavman, I.; Chirtoc, M.; Schuchmann, H.P.; Sauter, C.; Tavman, S. Thermal Conductivity and Viscosity Measurements of Water-Based TiO2 Nanofluids. Int. J. Thermophys. 2009, 30, 1213–1226. [Google Scholar] [CrossRef]
- Nguyen, C.T.; Desgranges, F.; Roy, G.; Galanis, N.; Maré, T.; Boucher, S.; Angue Mintsa, H. Temperature and particle-size dependent viscosity data for water-based nanofluids—Hysteresis phenomenon. Int. J. Heat Fluid Flow 2007, 28, 1492–1506. [Google Scholar] [CrossRef]
- Teng, T.; Hung, Y.; Teng, T.; Mo, H.; Hsu, H. The effect of alumina / water nano fluid particle size on thermal conductivity. Appl. Therm. Eng. 2010, 30, 2213–2218. [Google Scholar] [CrossRef]
- Anoop, K.B.; Sundararajan, T.; Das, S.K. International Journal of Heat and Mass Transfer Effect of particle size on the convective heat transfer in nanofluid in the developing region. Int. J. Heat Mass Transf. 2009, 52, 2189–2195. [Google Scholar] [CrossRef]
- Angayarkanni, S.A.; Sunny, V.; Philip, J. Effect of Nanoparticle Size, Morphology and Concentration on Specific Heat Capacity and Thermal Conductivity of Nanofluids. J. Nanofluids 2015, 4, 302–309. [Google Scholar] [CrossRef]
- Dudda, B.; Shin, D. Effect of nanoparticle dispersion on specific heat capacity of a binary nitrate salt eutectic for concentrated solar power applications. Int. J. Therm. Sci. 2013, 69, 37–42. [Google Scholar] [CrossRef]
- Riazi, H.; Mesgari, S.; Ahmed, N.A.; Taylor, R.A. The effect of nanoparticle morphology on the specific heat of nanosalts. Int. J. Heat Mass Transf. 2016, 94, 254–261. [Google Scholar] [CrossRef]
- Tiznobaik, H.; Shin, D. Enhanced specific heat capacity of high-temperature molten salt-based nanofluids. Int. J. Heat Mass Transf. 2013, 57, 542–548. [Google Scholar] [CrossRef]
- Seo, J.; Shin, D. Size effect of nanoparticle on specific heat in a ternary nitrate (LiNO3-NaNO3-KNO3) salt eutectic for thermal energy storage. Appl. Therm. Eng. 2016, 102, 144–148. [Google Scholar] [CrossRef]
- Dhairiyasamy, R.; Saleh, B.; Govindasamy, M.; Ayman, A.; Afzal, A.; Abdelrhman, Y. Effect of particle size on thermophysical and heat transfer properties of Ag nanofluid in a radiator—An experimental investigation. Inorg. Nano-Metal Chem. 2021, 1–15. [Google Scholar] [CrossRef]
- Amin, T.E.; Roghayeh, G.; Fatemeh, R.; Fatollah, P. Evaluation of nanoparticle shape effect on a nanofluid based flat-plate solar collector efficiency. Energy Explor. Exploit. 2015, 33, 659–676. [Google Scholar] [CrossRef] [Green Version]
- Yousefi, T.; Shojaeizadeh, E.; Veysi, F.; Zinadini, S. An experimental investigation on the effect of pH variation of MWCNT-H2O nanofluid on the efficiency of a flat-plate solar collector. Sol. Energy 2012, 86, 771–779. [Google Scholar] [CrossRef]
- Kanti, P.; Sharma, K.V.; Raja Sekhar, Y. Influence of particle size on thermal conductivity and dynamic viscosity of water—Based Indian coal fly ash nanofluid. Heat Transf. 2021, 51, 413–433. [Google Scholar] [CrossRef]
- Verma, S.K.; Tiwari, A.K.; Chauhan, D.S. Experimental evaluation of flat plate solar collector using nanofluids. Energy Convers. Manag. 2017, 134, 103–115. [Google Scholar] [CrossRef]
- Faizal, M.; Saidur, R.; Mekhilef, S.; Alim, M.A. Energy, economic and environmental analysis of metal oxides nanofluid for flat-plate solar collector. Energy Convers. Manag. 2013, 76, 162–168. [Google Scholar] [CrossRef]
- Said, Z.; Saidur, R.; Sabiha, M.A.; Rahim, N.A.; Anisur, M.R. ScienceDirect Thermophysical properties of Single Wall Carbon Nanotubes and its effect on exergy efficiency of a flat plate solar collector. Sol. Energy 2015, 115, 757–769. [Google Scholar] [CrossRef]
- Youse, T.; Veysi, F.; Shojaeizadeh, E.; Zinadini, S. An experimental investigation on the effect of Al2O3–H2O nano fl uid on the ef fi ciency of fl at-plate solar collectors. Renew. Energy 2012, 39, 293–298. [Google Scholar] [CrossRef]
- Sarsam, W.S.; Kazi, S.N.; Badarudin, A. Thermal performance of a flat-plate solar collector using aqueous colloidal dispersions of multi- walled carbon nanotubes with different outside diameters. Exp. Heat Transf. 2022, 35, 258–281. [Google Scholar] [CrossRef]
- Dobriyal, R.; Negi, P.; Sengar, N.; Singh, D.B. Materials Today: Proceedings A brief review on solar flat plate collector by incorporating the effect of nanofluid. Mater. Today Proc. 2020, 21, 1653–1658. [Google Scholar] [CrossRef]
- Yazdanifard, F.; Ebrahimnia-Bajestan, E.; Ameri, M. Investigating the performance of a water-based photovoltaic/thermal (PV/T) collector in laminar and turbulent flow regime. Renew. Energy 2016, 99, 295–306. [Google Scholar] [CrossRef]
- Duffie, J.A.; Beckman, W.A.; Blair, N. Solar Engineering of Thermal Processes, Photovoltaics and Wind; John Wiley & Sons: Hoboken, NJ, USA, 2020. [Google Scholar]
- Dominguez, J. Solar Energy Engineering Processes and Systems, 2nd ed.; Academic Press: Cambridge, MA, USA, 2017. [Google Scholar]
- Said, Z.; Sabiha, M.A.; Saidur, R.; Hepbasli, A.; Rahim, N.A.; Mekhilef, S.; Ward, T.A. Performance enhancement of a Flat Plate Solar collector using Titanium dioxide nanofluid and Polyethylene Glycol dispersant. J. Clean. Prod. 2015, 92, 343–353. [Google Scholar] [CrossRef]
- Çengel, A.Y.; Cimbala, M.J. Fluid Mechanics: Fundamentals and Applications, 2nd ed.; McGraw-Hill Higher Education: New York, NY, USA, 2009. [Google Scholar]
- Kumar, V.; Sarkar, J. Particle ratio optimization of Al2O3-MWCNT hybrid nanofluid in minichannel heat sink for best hydrothermal performance. Appl. Therm. Eng. 2020, 165, 114546. [Google Scholar] [CrossRef]
- Adun, H.; Mukhtar, M.; Adedeji, M.; Agwa, T.; Ibrahim, K.H.; Bamisile, O.; Dagbasi, M. Synthesis and Application of Ternary Nanofluid for Photovoltaic-Thermal System: Comparative Analysis of Energy and Exergy Performance with Single and Hybrid Nanofluids. Energies 2021, 14, 4434. [Google Scholar] [CrossRef]
- Prahalad, A.K.; Soukup, J.M.; Inmon, J.; Willis, R.; Ghio, A.J.; Becker, S.; Gallagher, J.E. Ambient air particles: Effects on cellular oxidant radical generation in relation to particulate elemental chemistry. Toxicol. Appl. Pharmacol. 1999, 158, 81–91. [Google Scholar] [CrossRef] [PubMed]
- Dwivedi, S.; Saquib, Q.; Al-Khedhairy, A.A.; Ali, A.Y.S.; Musarrat, J. Characterization of coal fly ash nanoparticles and induced oxidative DNA damage in human peripheral blood mononuclear cells. Sci. Total Environ. 2012, 437, 331–338. [Google Scholar] [CrossRef]
- Jang, S.P.; Choi, S.U.S. Role of Brownian motion in the enhanced thermal conductivity of nanofluids. Appl. Phys. Lett. 2004, 84, 4316–4318. [Google Scholar] [CrossRef]
- Asadi, A.; Alarifi, I.M.; Ali, V.; Nguyen, H.M. An experimental investigation on the effects of ultrasonication time on stability and thermal conductivity of MWCNT-water nanofluid: Finding the optimum ultrasonication time. Ultrason. Sonochem. 2019, 58, 104639. [Google Scholar] [CrossRef]
- Akram, N.; Montazer, E.; Kazi, S.N.; Elahi, M.; Soudagar, M.; Ahmed, W.; Nashrul, M.; Zubir, M.; Afzal, A.; Ridha, M.; et al. Experimental investigations of the performance of a fl at-plate solar collector using carbon and metal oxides based nano fl uids. Energy 2021, 227, 120452. [Google Scholar] [CrossRef]
- Gulzar, O.; Qayoum, A.; Gupta, R. Photo-thermal characteristics of hybrid nanofluids based on Therminol-55 oil for concentrating solar collectors. Appl. Nanosci. 2019, 9, 1133–1143. [Google Scholar] [CrossRef]
- Prasher, R.; Bhattacharya, P.; Phelan, P.E. Thermal conductivity of nanoscale colloidal solutions (nanofluids). Phys. Rev. Lett. 2005, 94, 025901. [Google Scholar] [CrossRef]
- Malvi, C.S.; Gupta, A.; Gaur, M.K.; Crook, R.; Dixon-Hardy, D.W. Experimental investigation of heat removal factor in solar flat plate collector for various flow configurations. Int. J. Green Energy 2017, 14, 442–448. [Google Scholar] [CrossRef]
- Okonkwo, E.C.; Wole-Osho, I.; Kavaz, D.; Abid, M.; Al-Ansari, T. Thermodynamic evaluation and optimization of a flat plate collector operating with alumina and iron mono and hybrid nanofluids. Sustain. Energy Technol. Assess. 2020, 37, 100636. [Google Scholar] [CrossRef]
- Mahian, O.; Kianifar, A.; Sahin, A.Z.; Wongwises, S. International Journal of Heat and Mass Transfer Entropy generation during Al2O3/water nanofluid flow in a solar collector: Effects of tube roughness, nanoparticle size, and different thermophysical models. Int. J. Heat Mass Transf. 2014, 78, 64–75. [Google Scholar] [CrossRef]
- Brottier, L.; Brottier, L.; Bennacer, R. Pressure Drop in Parallel Flow Flat-Plate PVT Collectors. ISES 2017, 1–11. [Google Scholar] [CrossRef]
- Reza, M.; Moravej, M.; Hossein, M. Heat transfer enhancement in a flat plate solar collector with different flow path shapes using nano fluid. Renew. Energy 2020, 146, 2316–2329. [Google Scholar] [CrossRef]
- Wole-osho, I.; Okonkwo, E.C.; Kavaz, D.; Abbasoglu, S. An experimental investigation into the effect of particle mixture ratio on specific heat capacity and dynamic viscosity of Al2O3-ZnO hybrid nano fluids. Powder Technol. 2020, 363, 699–716. [Google Scholar] [CrossRef]


| Reference | Nanofluid Synthesized | Nanoparticle Property Considered | Range of Factor | Results |
|---|---|---|---|---|
| [43] | MWCNT/H2O | PH variation | 3.5, 6.5, 9.5 | Their results show that enhancing the performance of the FPC arises with more difference between the PH of the nanofluid and the PH of the isoelectric point. |
| [45] | MWCNT/water, graphene/water, copper oxide/water, aluminum/water, titanium oxide/water, and silicon oxide/water | Nanoparticle type, volume fraction | 0.25%, 0.5%, 0.75%, 1.0%, 1.5%, and 2.0% for each nanoparticle type | Their results showed that the optimum collector efficiency was measured for 0.75 wt % MWCNT/water. |
| [46] | Metal oxides | Nanoparticle type | CuO, SiO2, TiO2, and Al2O3 nanofluid | CuO showed the maximum thermal efficiency due to its lower SHC. |
| [47] | Single-walled carbon nanotubes | Volume fraction | 0.1%, and 0.3% | The maximum efficiency of the collector was measured for the 0.3% volume fraction. |
| [48] | Al2O3/water 12 nm particle size | Volume fraction Surfactant | 0.2%, and 0.4%, With and without surfactant | Their results showed that the efficiency of the FPC was higher with the nanofluid synthesized using a surfactant. Moreover, the performance of the FPC was higher in the 0.4% volume fraction. |
| [42] | Al2O3 | Nanoparticle shape | Platelets, blades, cylindrical, bricks, spherical | Their study showed that the blade-shaped nanoparticle gave the highest collector efficiency. |
| [49] | Multi-walled carbon nanotubes | Outside diameter of Nanoparticles | <8 nm with SSA of 500 m2/g, and 20–30 nm with SSA of 110 m2/g | Their study showed that the nanoparticle with an outside diameter of <8 nm gave a distinguishable result in terms of the FPC performance. |
| [23] | boehmite-alumina | Nanoparticle shape | Bricks, cylinder, platelets, blades | Their study showed that brick-shaped nanoparticles gave the maximum outlet temperature from the collector, while platelet-shaped NPs gave the least. |
| FPC Parameters | Specifications |
|---|---|
| Area of collector | 2 m2 |
| Collector length | 2 m |
| Collector width | 1 m |
| Collector height | 0.15 m |
| Tilt angle of collector | 15 |
| Thickness of back insulation | 0.05 m |
| Thickness of edge insulation | 0.025 m |
| Thickness of absorber plate | 0.00045 m |
| Absorber plate’s thermal conductivity | 386 W/m k |
| Absorber plate’s emissivity | 0.95 |
| Effective transmittance-absorptance product | 0.82 |
| Glass cover’s thickness | 0.004 m |
| Glass cover’s absorptivity | 0.05 |
| Glass cover’s emissivity | 0.88 |
| Tube spacing between risers (9 nos) | 0.095 m |
| Inner diameter of the riser pipe | 0.0095 m |
| Outer diameter of the riser pipe | 0.01 m |
| Diameter of header pipe | 0.0254 m |
| Mass Flow Rate (kg/min) | Weight Concentration (%) f-GNP | FRUL [62] | FRUL (Model Result) | Error Percentage (%) | Mass Flow Rate (L/min) | Weight Concentration (%) Al2O3 | FRUL [48] | FRUL (Model Result) | Error Percentage (%) |
|---|---|---|---|---|---|---|---|---|---|
| 0.8 | 0.1 | 6 | 5.89 | 1.867572 | 3 | 0.2 | 30.194 | 30.09 | 0.34563 |
| 0.05 | 5.5449 | 5.53 | 0.269439 | 0.4 | 24.672 | 24.56 | 0.456026 | ||
| 0.025 | 5.4050 | 5.35 | 1.028037 | ||||||
| 1.2 | 0.1 | 6.3832 | 6.28 | 1.643312 | |||||
| 0.05 | 5.9923 | 5.97 | 0.373534 | ||||||
| 0.025 | 5.9528 | 5.93 | 0.384486 |
Publisher’s Note: MDPI stays neutral with regard to jurisdictional claims in published maps and institutional affiliations. |
© 2022 by the authors. Licensee MDPI, Basel, Switzerland. This article is an open access article distributed under the terms and conditions of the Creative Commons Attribution (CC BY) license (https://creativecommons.org/licenses/by/4.0/).
Share and Cite
Ogungbemi, A.T.; Adun, H.; Adedeji, M.; Kavaz, D.; Dagbasi, M. Does Particle Size in Nanofluid Synthesis Affect Their Performance as Heat Transfer Fluid in Flat Plate Collectors?—An Energy and Exergy Analysis. Sustainability 2022, 14, 10429. https://doi.org/10.3390/su141610429
Ogungbemi AT, Adun H, Adedeji M, Kavaz D, Dagbasi M. Does Particle Size in Nanofluid Synthesis Affect Their Performance as Heat Transfer Fluid in Flat Plate Collectors?—An Energy and Exergy Analysis. Sustainability. 2022; 14(16):10429. https://doi.org/10.3390/su141610429
Chicago/Turabian StyleOgungbemi, Ayomide Titus, Humphrey Adun, Michael Adedeji, Doga Kavaz, and Mustafa Dagbasi. 2022. "Does Particle Size in Nanofluid Synthesis Affect Their Performance as Heat Transfer Fluid in Flat Plate Collectors?—An Energy and Exergy Analysis" Sustainability 14, no. 16: 10429. https://doi.org/10.3390/su141610429