Article

TOC Standards for Sustainably Managing Refractory Organic Matter in Swine Wastewater Effluent

1
Environmental Resources Research Department, National Institute of Environmental Research (NIER), Gyeongseo-dong, Seo-gu, Incheon 22689, Korea
2
Water Environment Research Department, National Institute of Environmental Research (NIER), Gyeongseo-dong, Seo-gu, Incheon 22689, Korea
3
Department of Railroad, Civil & Environmental Engineering, Woosong University, Dong-gu, Daejeon 34606, Korea
*
Author to whom correspondence should be addressed.
Sustainability 2022, 14(16), 10092; https://doi.org/10.3390/su141610092
Submission received: 5 July 2022 / Revised: 1 August 2022 / Accepted: 10 August 2022 / Published: 15 August 2022
(This article belongs to the Section Sustainable Water Management)

Abstract

:
Swine wastewater effluent is a key source of water contamination since it contains high levels of nutrients, including nitrogen and phosphorus, as well as nitrates and refractory organic matter (ROM). ROM refers to organic compounds that are usually resistant to microbial degradation. When swine wastewater effluent containing high levels of ROM is subsequently discharged into rivers and streams without being adequately treated, purification costs for drinking water increase and there remains a possibility for harmful substances to enter the human body. In this study, we introduce new methods for setting total organic carbon (TOC) water quality standards for discharging swine wastewater effluent containing high levels of ROM after treatment. To set the TOC water quality standards, various analysis methods based on statistics, technology, and experience based on operational data of livestock-manure treatment facilities were applied. In addition, the achievability of the proposed TOC standards in livestock-manure treatment facilities and the financial burden of their implementation on livestock farms were also reviewed. Here, we set tentative values that include all of our results derived from each methodology and set the TOC standards to levels that can be achieved through the normal operation of swine-wastewater treatment facilities (60 mg/L for public treatment facilities and 140 mg/L for treatment facilities operated by individual farms). When setting TOC standards, both single and combined methodologies should be considered and employed after comprehensively assessing livestock management policies, regional conditions, and the burden on stakeholders.

1. Introduction

As of April 2022, China has the largest swine population, approximately 450 million heads, in the world. The European Union (EU) and United States were second and third, with over 140 and 74 million heads, respectively [1]. Unsurprisingly, increases in the number of swine have resulted in proportional increases in the amount of wastewater effluent. Livestock manure management and relevant systems and policies in many developed countries differ only slightly. Swine wastewater is managed under the Nutrient Management Guidelines in the USA [2], the Nitrates Directive of the European Union (EU) in the Netherlands [3], and the Water Pollution Prevention Act in Japan [3]. While each country has its own regulations for managing swine wastewater, manure is usually converted to resources, such as organic fertilizers, as compost and liquid fertilizers, to be returned to farmlands or they are used as soil conditioners [2]. Returning this resource back to farmlands may be desirable from the standpoint of resource recycling. However, swine manure can act as a nonpoint source pollutant or cause groundwater contamination, especially from nitrate, which is why the EU has implemented the Nitrates Directive [3]. Additionally, to prevent groundwater contamination, the amounts of fertilizers and nutrients [2] introduced to the soil when swine manure is reapplied to farmlands is also being limited.
The EU has established an integrated environmental management system that can minimize pollutant emissions through the best available techniques (BATs) and has applied this system to livestock manure [4]. Specifically, the BAT-based reduction of nutrients excreted by livestock (N and P) has received considerable attention [5,6]. Nitrogen content in livestock manure has been reduced by 3% in the EU by reducing the protein content in feed, and using different feeds at different growth stages, as well as approved additives (enzymes, growth accelerators, and microorganisms) [6]. Meanwhile, the N content in manure from finishing swine has decreased to 7.0–13.0 kg/head/year and that of sows has reduced to 17.0–30.0 kg/head/year in the EU [5]. However, the N content in manure from finishing swine was 22.2 kg/head/year in Korea [5]. The P content in the manure of finishing swine has been reduced to 3.2–5.4 kg P2O5/head/year and that of sows has reduced to 9.0–15.0 kg P2O5/head/year in the EU [5]. While, the P content in manure from finishing swine was 7.3 kg/head/year in Korea [5]. Thus, about 30% N and about 50% P could be reduced. These reductions in P content have been achieved using different feeds at different growth stages, phytase enzymes, and highly digestible inorganic phosphate [5]. Education and training programs for farm workers, emergency action plans for responding to unexpected emissions and water pollution accidents, continuous inspections, repairs, and maintenance of equipment and facilities, water use minimization protocols, and the use of various BATs (e.g., the spraying wastewater on soils) have also been established and expanded [5].
In the USA, animal feeding operations are considered nonpoint sources of pollution, while concentrated animal feeding operations (CAFOs) are defined as point sources [7,8]. A National Pollutant Discharge Elimination System (NPDES) permit is required for the latter if pollutants are expected to be discharged, but the scope of the NPDES permit is not applicable to all CAFOs. Under the NPDES, the impact of pollutants discharged into water bodies is considered with respect to limiting livestock manure effluent. Nevertheless, managing all of the pollutants discharged from CAFOs is limited by effluent management technologies and standards [7]. Such limitations and standards govern the discharge of point sources of pollution based on the level of control applicable according to industry-specific technologies [7]. If these technologies cannot satisfy the applicable water quality standards, stricter standards and water quality-based limitations on effluent may be applied [7].
In Japan, most swine manure is applied to farmlands, but some swine excreta in slurry or sewage form is treated separately as feces, urine, or a mixture, as in Korea [9]. As of 2010, purification accounted for 76.3% of all swine manure treatment, with public sewage treatment accounting for 0.4% of the separate treatment of swine urine [9]. Further, purification accounted for 18.5% and public sewage treatment accounted for 0.7% of the treatment of swine manure and urine mixture [9]. In other developed countries, swine wastewater is mostly recycled and applied to farmlands and soils [10]; consequently, the nutrients and nitrates infiltrating the groundwater and the impacts of swine wastewater are of the most interest. Here, the term “purification” refers to directly treating livestock manure at a treatment facility for reducing the emission of pollutants and not recycling livestock manure on farmland.
In Korea, approximately 72.7% of swine wastewater effluent is used to produce liquid fertilizers and compost [11] that is applied to farmlands. However, they are less preferred by farmers in comparison to chemical fertilizers due to the difficulty in storing them and the malodor when they are sprayed. Unlike in other developed countries, 27.3% of all swine wastewater is discharged into public water bodies after physical/chemical/biological treatment in public or private treatment facilities [11]. As in other developed countries, there are concerns over excessive nutrient (N and P) discharge and groundwater contamination due to swine wastewater. Moreover, because dam and river waters are primarily used as domestic water (33.1 billion m3/year, 89%) in Korea, interest in the management of swine-wastewater treatment facilities and the water quality of rivers where swine wastewater is discharged is higher than that in other countries [12]. Since the managing of organic matter (OM) is critical to water quality, there is an urgent need to set management standards for the OM in swine wastewater, as well as the water quality of nearby rivers and other water bodies.
Despite the effectiveness of established biochemical oxygen demand (BOD) and chemical oxygen demand (COD)-permanganate index (CODMn) in the effluent water quality standards of the livestock manure treatment facilities in terms of the management of biologically degradable organic substances, the management of refractory organic matter (ROM) is limited. Biochemical oxygen demand (BOD) can be leveraged to maintain the stable discharge of OM via the expansion and advancement of treatment facilities. However, even under these circumstances, the amount of refractory organic matter (ROM) can still increase [13,14], making the targeted management of ROM necessary. Total organic carbon (TOC) standards have been established for public waters, sewage treatment plants, and industrial wastewater treatment to manage ROM content [13,14,15,16]. Livestock manure flows into public waters (rivers, lakes, and reservoirs), causing nutrient and heavy metal contamination [17], as well as increasing ROM inflow. Although ROM is reportedly introduced into public waters through industrial wastewater or sewage [18,19], it is also found in large amounts in livestock manure.
The management of TOC from the livestock sector, which produces large amounts of ROM, requires more attention. In particular, it is necessary to strengthen the management of swine wastewater; the high rate of increase in the number of breeding heads consequently generates a large amount of wastewater [11]. In this study, we explored the management and operation of swine-wastewater treatment facilities in Korea and the influence of swine breeding on nearby rivers as part of an effort to manage ROM pollution. Here, we introduce new reference TOC standards that may be applied in the field, as well as domestic case studies on the methods used to set such standards.

2. Materials and Methods

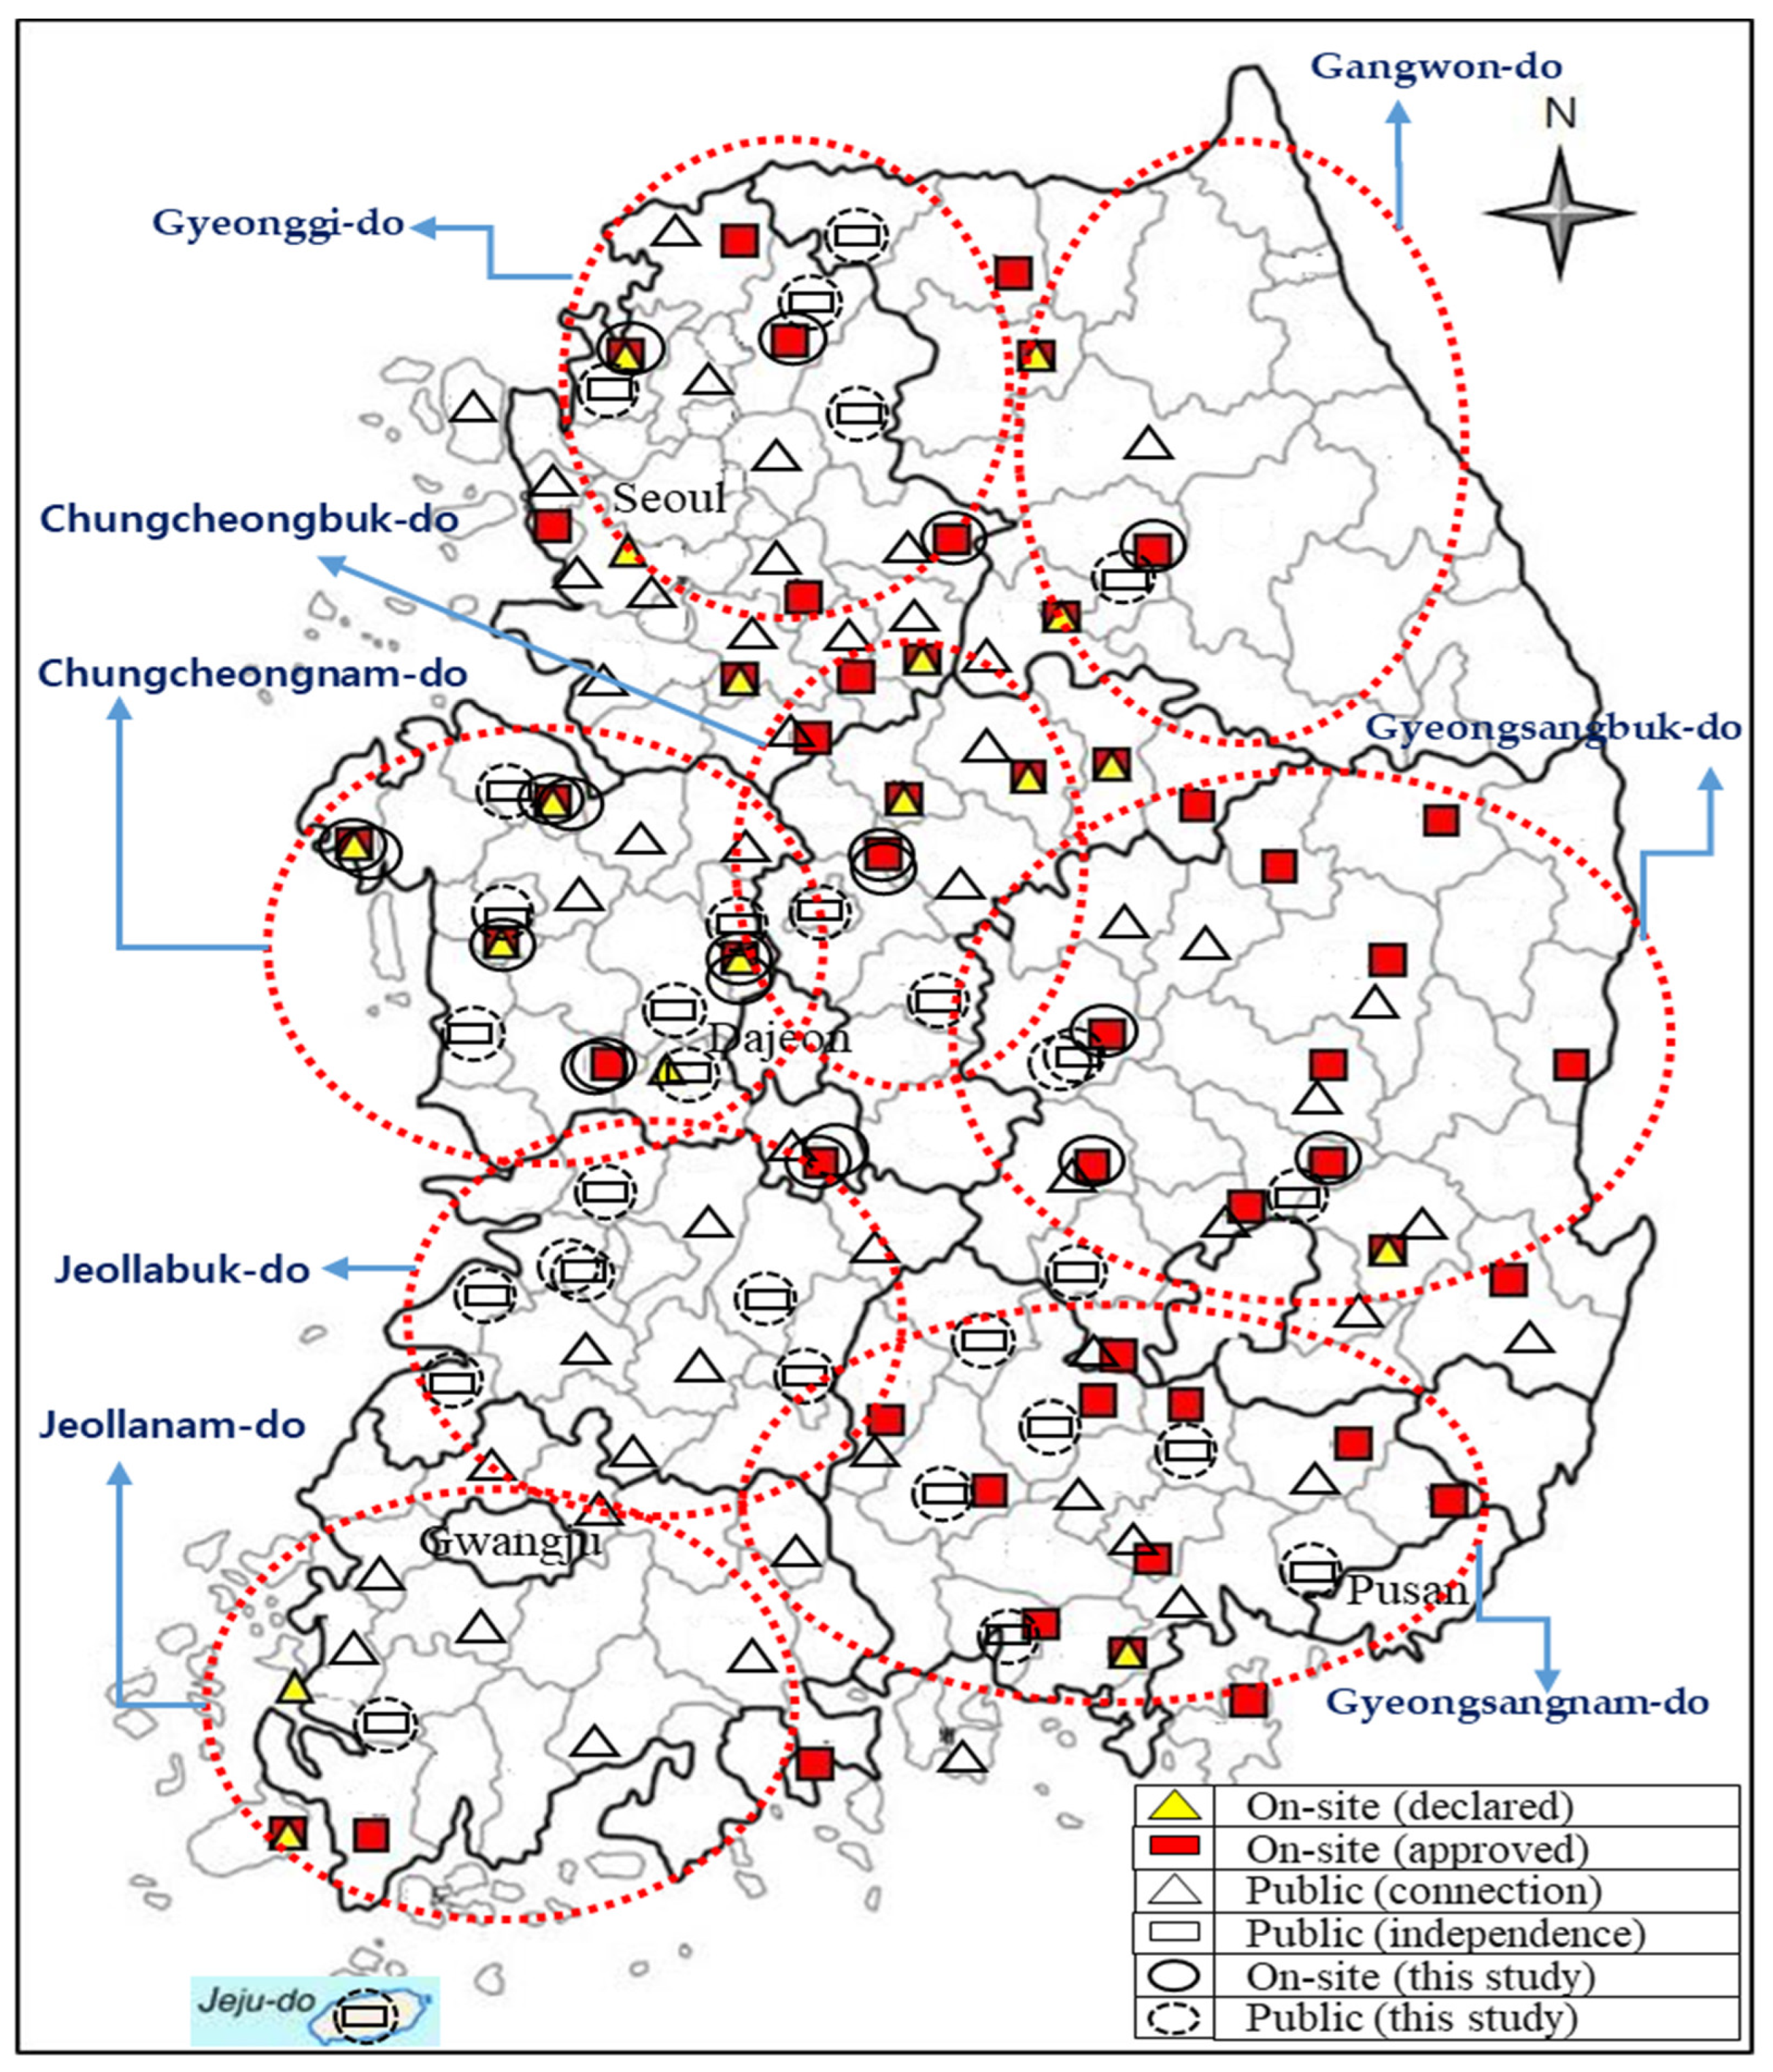
2.1. Study Facilities and Sampling

To investigate the water quality of swine-wastewater treatment facilities, targets were selected by identifying the operational status of public livestock manure treatment and individual, on-site treatment facilities (Figure 1). A total of 104 public treatment facilities were operating across Korea as of 2016 [20]. Of these, 32 on-site facilities were selected, and facilities connected to sewage treatment plants, recycling facilities for liquid fertilizers and compost, and bio-gasification were excluded. As of 2016, a total of 381 private, on-site treatment facilities were in operation, including 94 declared and 287 approved facilities [20]. Among them, 20 (~5%), were selected as target facilities.
Each target facility was surveyed four times—once per season. The sample size needed from the 381 private, on-site facilities to achieve a statistically significant 90% confidence interval (CI) was calculated to be 70. Therefore, 20 facilities were surveyed four times, each to ensure that more than 70 samples were obtained. Additionally, 13 facilities in Chungcheongnam-do and Chungcheongbuk-do, 4 in Gyeonggi-do and Gangwon-do, and 3 in Gyeongsangnam-do and Gyeongsangbuk-do were selected for analysis, as these regions contained the greatest number of approved facilities. Surveys were conducted by dividing the facilities into pre-treatment, bioreactor, and post-treatment facilities based on the treatment technique used.

2.2. Flow Rate and Load by Source

We analyzed the amount of livestock manure generated, flow rate of livestock effluent, load per major pollutant source, treatment status by livestock manure type, and installation status of individual on-site treatment facilities based on verified data from the National Pollution Source Survey System [21].

2.3. Trends in OM in Densely Populated Swine Farming Areas and TOC in Nearby Rivers

Sites for investigating trends in OM and TOC concentrations were selected in densely populated swine farming areas and nearby rivers following a survey of candidate sites that included rivers near livestock farms [22]. Site A, which was deemed hazardous based on our survey results, was selected as the target area and was divided into three sub-areas based on the density of livestock farms (0.99, 0.78, and 0.00 facilities/km2). Subsequently, trends in the water quality (BOD and COD) of nearby rivers over the past three years (2019–2021) were analyzed.

2.4. Analytical Method by Water Quality Parameter

Among the various methods for testing water pollution, we used high-temperature combustion–oxidation to analyze TOC concentrations, including dissolved organic carbon (DOC) [23]. This method is more suitable for analyzing TOC when there is a high concentration of suspended matter, such as livestock manure [20]. Analyses were performed using a TOC-L Total Organic Carbon Analyzer (Shimazdu Corp., Tokyo, Japan). Biochemical oxygen demand, as well as the COD based on potassium dichromate (CODCr) and potassium permanganate (CODMn) oxidation were analyzed in accordance with the water pollution test standards [23].

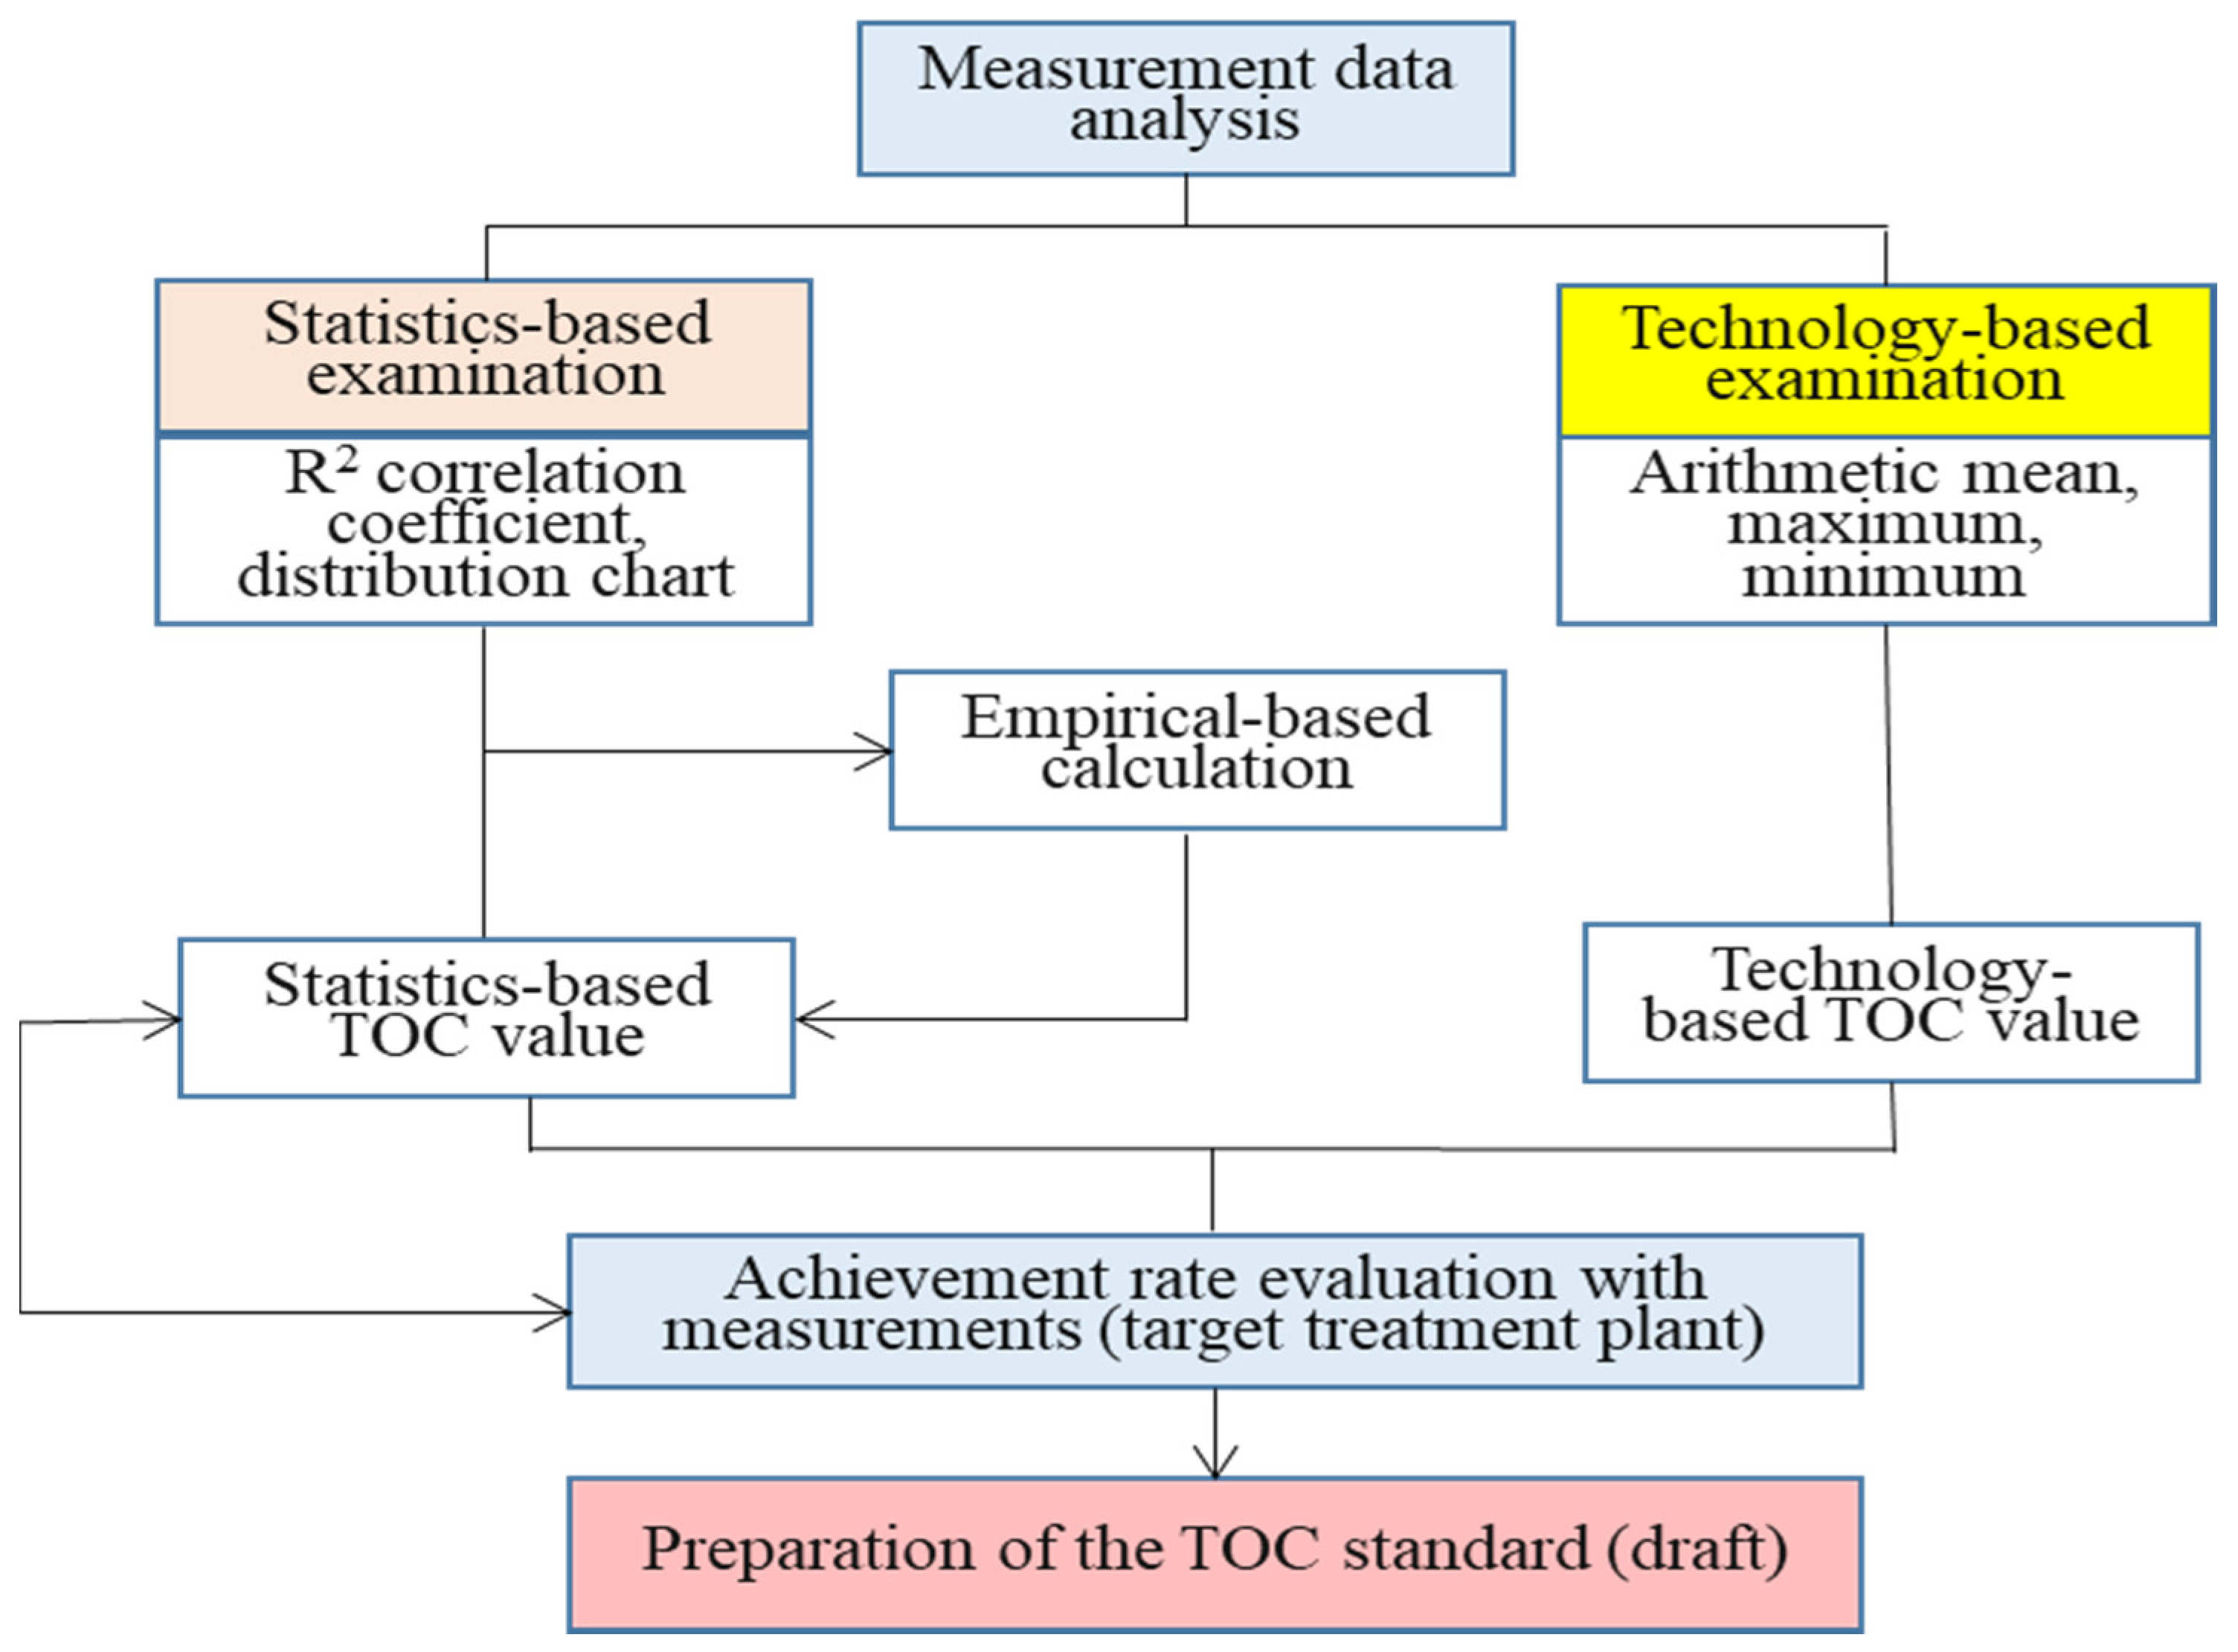
2.5. TOC Standard-Setting

To set the TOC effluent standards for swine-wastewater treatment facilities, we employed a statistical method based on the analytical results of survey data, as well as a technology-based effluent limit method widely used worldwide [24]. The process applied to livestock-manure treatment facilities in Korea aims to bring BOD and CODMn levels below the respective standards [20]. Therefore, at the current technical level, all processes applied in livestock-manure treatment facilities may be considered as BATs [20]. On application of these processes, the 5th percentile value may be considered as the optimal emission concentration, adjusting for error statistical data and empirical judgment errors [20]. However, since the emission concentration of 5th percentile is very strict, 50th percentile, which was applied when setting TOC regulation standards for industrial wastewater, was considered as an appropriate technology level value [20]. Stepwise analyses and comparisons between the results of each approach were also considered. In the first step, the statistical TOC standards were determined using a high-quality dataset prepared based on our survey results. Second, the technology-based optimal ranges for meeting the current standards (i.e., the properties and rate and scale of treatment rate) were determined. Third, the applicable levels of each standard were determined. Finally, we comprehensively analyzed the results of each step to determine the final standards.
Figure 2 shows a schematic of the methodology used for standard-setting [20]. The proposed method included the identification of current data levels and a statistical review of the links between existing systems (e.g., BOD and CODMn) in the first step. The second step included a technology-based review of the ranges of TOC effluent concentrations that may be applicable during optimal operation. A water quality-based review by region and dilution/mixing with public waters is also available; while this technique requires the impacts of discharged effluent on public water quality to be assessed, it is impossible to quantify the TOC concentration of each pollution source that flows into public waters [20]. Additionally, because the fate of each pollution source cannot be clearly identified, calculating the contribution or impact of swine wastewater effluent is difficult. Thus, we substituted the water quality-based technique for the empirical method used in the United Kingdom and USA, which is based on percentiles of measured values [20].

2.6. Data Analysis

Measurement and monitoring data were analyzed using Microsoft Excel 2010 v. 2014 (Microsoft Corp., Redmond, WA, USA) and SPSS Grad Pack 22.0 statistical software (IBM Corp., Armonk, NY, USA). Basic statistical analysis, descriptive statistical analysis, regression analysis, and correlation analysis were also conducted. Except for the basic analysis set used to analyze the standards, only measured results that satisfied the current BOD and CODMn standards were used.

3. Results and Discussion

3.1. Swine Manure Generation and Management in Korea

As of 2017, the total amount of livestock manure in Korea was 132,109.1 m3/day, with swine responsible for the highest manure generation with 56,228.8 m3/day (42.6%) [11,25], followed by Korean cattle 39,393.3 m3/day (29.8%), dairy cattle 15,562.0 m3/day (11.8%), chicken 17,824.0 m3/day (13.5%), and others 3100.9 m3/day (2.3%) [11,25]. Together, swine and Korean and dairy cattle generated 84.2% of all livestock manure. Livestock manure is treated both on-site at individual farms (80.5%) and off-site by subcontractors (19.5%) (Table 1) [11]. Livestock manure treated on-site is primarily converted into compost and liquid fertilizer, whereas manure treated off-site at public or private treatment facilities is often purified or converted into liquid fertilizer or public resources (biogas, energy conversion, etc.) via recycling [11]. To summarize, 87.8% (sum of compost, liquid fertilizer, recycling companies) of livestock manure is recycled into liquid fertilizer, compost, and biogas; 72.7% of swine wastewater is recycled, while the remaining 27.3% (sum of purification, public treatment, livestock-manure treatment companies) is purified.
The total amount of livestock manure converted into resources (i.e., recycled) has remained nearly constant since 2007 [20] due to limits on the amount returned to farmlands, limited distribution, and preference for chemical fertilizers among farmers. Conversely, the percentage of subcontracted, off-site treatment has continually increased since 2007 (9300 m3/day (2007) → 22,400 m3/day (2010) → 31,100 m3/day (2013) → 36,500 m3/day (2016)) [11]. As in other developed nations, Korea is facing concerns regarding nonpoint source pollutants and groundwater contamination caused by the spraying of livestock manure on farmlands. However, the main focus has been on preventing riverine pollution caused by the discharge of swine wastewater, as the domestic water supply is largely dependent upon river and lake water. Thus, in contrast to other developed countries, Korea is using physicochemical and biological treatment facilities to purify livestock manure and has imposed strict management practices according to national water quality standards for livestock manure effluent. Approximately 27.3% of swine wastewater is purified by treatment facilities; most of it is treated in public facilities (65.8%), while ~31.8% is treated on-site at individual farms. Swine-wastewater treatment facilities have effluent water quality standards that are set in accordance with the Enforcement Regulations of the Act on the Management and Use of Livestock Excreta [26], as shown in Table 2.
In public livestock-manure treatment facilities operated by the state or local governments, six pollutant items (BOD, COD, suspended solid (SS), Total N, Total P) are set in effluent standards, and relatively strict water quality standards are applied. In addition, livestock manure generated by livestock farms is entrusted to a livestock-manure treatment company that operates a treatment facility. Consigned treatment companies, similar to public treatment facilities manage six pollutant items and apply the same standards for effluent treatment. On the other hand, livestock breeding farms that install and directly operate livestock manure treatment facilities manage, only 4 items (BOD, SS, Total N, Total P), and the effluent water quality standards are more relaxed compared to public or consignment treatment facilities. It is being applied considering that livestock-manure treatment facilities are operated by non-specialists, relatively few water quality management items are set, and the effluent water quality is set high. When livestock breeding farms are located in specific areas that require stricter control of emitted pollutant concentrations, such as a protected water source area, water quality standards are more stringent than those for farms located in general areas. Unlike public treatment facilities, COD and coliform count are not recorded for on-site purification facilities at individual farms.

3.2. Need for Swine Wastewater Management

3.2.1. Characteristics of Swine Wastewater

The focus of livestock wastewater management in Korea is on controlling the influx of OM into surface waters (rivers and lakes) that serve as the main sources of domestic water supplies. The contribution of livestock manure, especially swine wastewater, to OM is very high [25]. As shown in Table 3, which lists the BOD discharge by pollution source identified in a national survey in 2019, livestock manure contributed the highest amount of BOD, except for that from soils due to rainfall [25]. However, BOD emission in land is mainly caused by rainfall and is very difficult to manage because it is largely emitted during the rainy season (usually in summer). However, livestock manure is discharged uniformly throughout the year regardless of the season, making it essential to control the emission of pollutants. On the other hand, since BOD emissions from landfill, industry, and aquaculture are relatively low, management of BOD-emitting pollutants may be more effective. The BOD discharge of livestock manure accounted for ~25.5% of the total BOD load. As swine manure accounts for the highest percentage of livestock manure generated (Table 1), managing swine wastewater is imperative.
With the exception of poultry (chicken and duck), which generate a small amount of manure and thus a low BOD load, swine account for the highest number of livestock based on number of heads. Table 4 shows the increasing trend in the number of livestock animals over the past 25 years. The number of heads of Korean and dairy cattle in Korea increased by ~59%, while that of swine increased by 132%, with a similar trend expected in the near future [27]. The increase rate of poultry (chickens and ducks) was found to be the highest, but as mentioned in Section 3.1, the amount of manure generated accounted for only 13.5% of the total. The growth rate of Korean and dairy cattle is about 1/3 of that of swine, which is not large; additionally, the growth rate of dairy cattle is reportedly decreasing. Accordingly, swine has drawn attention as the livestock that poses the greatest risk for water pollution.

3.2.2. Shortage of On-Site Treatment Facilities

Examining the types of livestock manure for which treatment facilities were installed at individual farms revealed the importance of managing swine manure. The number of farms that required the installation of livestock manure treatment facilities was 78,192; however, such facilities were actually installed at only 1% of these farms (831 farms) as of 2016 (Table 5) [20]. Although highly concentrated water pollutants are discharged as a result of the specialization and industrialization of livestock farms, farmers are reluctant to invest in on-site treatment facilities due to a lack of awareness regarding how they might improve environmental conditions.
Among the farms with on-site treatment facilities, most were for swine (45.8%), followed by dairy (38.9%), and Korean (11.1%) cattle [20]. With respect to dairy cattle, the facilities were mostly milking-parlor wastewater treatment facilities with solid matter sedimentation functions rather than true manure treatment facilities, and their influent/effluent treatment processes differed markedly from those used in public or on-site swine-manure treatment facilities [20]. Additionally, because most of the treatment facilities for other livestock produce compost, the majority of livestock-manure treatment facilities were for treating swine wastewater [20].

3.2.3. Effluent Water Quality Standards and Non-Compliance at On-Site Swine-Wastewater Treatment Facilities

The effluent water quality standards for on-site treatment facilities installed at individual swine farms allow higher concentrations to be discharged than the standards in place at public facilities; consequently, swine wastewater discharged from on-site treatment facilities is regarded as one of the main causes of water pollution. As shown in Table 2, the effluent water quality standards for individual, on-site swine wastewater treatment are 3.6–12.5 times higher than those at public facilities. Moreover, the rate of non-compliance for effluent water quality standards at public treatment facilities is 2.5% for BOD, while at individual, on-site treatment facilities it was 35% for BOD, 8.8% for SS, 35% for total N, and 3.8% for total P [28]. Additionally, the standards applied to on-site treatment facilities only included BOD for managing OM, excluding CODMn for managing some refractory substances, unlike in public facilities. Because swine wastewater effluent from on-site treatment facilities is discharged directly into rivers, managing these wastewaters is a critical environmental and public health issue.
As shown in Table 1, the amount of livestock manure treated at on-site treatment facilities (5031.9 m3/d) accounts for ~50% of that treated in public facilities (10,546.1 m3/day). However, considering that the effluent water quality standards are lower at on-site facilities and that the rate of non-compliance is higher than that at public treatment facilities, improving the management of on-site swine-wastewater treatment facilities is more important because the pollutant load discharged into waterways by such facilities is often greater than that discharged from public facilities. Therefore, the effluent water quality standards of on-site swine-wastewater treatment facilities must be gradually strengthened until they are comparable to those of public treatment facilities; on-site facilities should also be differentiated according to the year of installation to ensure the greatest possible reduction in water pollution.
When strengthening effluent water quality standards according to water quality parameters, it is necessary to determine the appropriate time for implementation with consideration for the burdens placed on farmers. Moreover, administrative management must be aggressively reinforced to ensure that the pollutant loads permitted under current effluent water quality standards are not exceeded. Other developed countries are also gradually strengthening their effluent water quality standards for livestock-manure treatment facilities. In Japan, tentative standards for swine-wastewater discharging businesses have been strengthened such that the same standards as for general wastewater have been applied since 2018–2019 [27]. In the EU, permits are based on BAT; BAT conclusions for setting ammonia discharge standards have been implemented since 2017 at large-scale swine farms [27].

3.2.4. Inadequate Management and Operation of On-Site Treatment Facilities

In Korea, swine wastewater directly impacts public waters through the effluent discharged from both public and private, on-site treatment facilities. Therefore, it is necessary to increase the amount of wastewater treated by expanding swine-wastewater treatment facilities, as well as to strengthen the management of on-site treatment facilities. While public treatment facilities are managed by environmental professionals, on-site facilities are managed by non-professionals, such as farm owners, who have limited operational and management capabilities. According to a study by Park et al. [29], individual farms have relatively poor environmental oversight with respect to facility operation and management as stipulated by law when compared to public treatment facilities. Moreover, 74% of surveyed farms failed to clean their reactor tank once per year; at these on-site facilities, the rate of non-compliance for mandatory environmental manager education was 70%, and the rate of maintaining adequate storage to address potential fluctuations in inflow volume was only 30% [29]. Therefore, it is necessary to strengthen the management of on-site swine-wastewater treatment facilities operating at individual farms. However, farms with around-the-clock operation of the treatment facility (17% unfulfilled), daily management log maintenance (9% unrecorded), measurement collections and periodic inspections (7% uncomplied) were relatively well managed [29].

3.2.5. Refractory Characteristics of Swine Wastewater

Livestock manure, including swine wastewater, consists of non-biodegradable OM in the form of tannic and humic acids, as well as humate generated by the degradation of lignin; as a result, wastewater exhibits a dark yellowish-brown color during treatment [30,31]. The traditional sewage treatment methods that usually use physical treatment (primary treatment) and biological treatment (secondary treatment) cannot effectively remove ROM. Therefore, ROM clearance requires quire advanced treatments such as ozone (O3), ultraviolet (UV), and etc. [32,33,34,35,36,37,38]. According to a study by Choi [39], the concentration of OM (CODCr) in Korean sewage is ~200 mg/L, of which, ROM accounts for ~35% (70 mg/L). Lee et al. [40] analyzed the ROM content in livestock manure and found that the CODCr was ~22,000 mg/L, of which, ROM accounted for ~32% (7000 mg/L)—a 100-fold increase relative to general sewage, despite their similar ratios.
Table 6 [41] shows the TOC/OM contents in swine and other wastewaters derived from a review of the literature. The BOD/TOC ratio (1.0:1.1) was higher in swine wastewater than that in other types of wastewater (0.7:0.8), while the CODMn/TOC ratio (1.0:1.2) was lower (vs. 1.2:1.8). Further, it has been reported that increased ROM contents in water systems may cause disinfection costs to rise due to reduced membrane filtration and coagulation during the disinfection of water treatment plants. Disinfection may also produce high volumes of carcinogenic precursors, such as trihalomethane (THM), as by-products than can have serious health impacts [42,43,44]. Increases in ROM content may have a negative aesthetic impact on people by altering the color of public waters to yellow/brown. Furthermore, algal growth and eutrophication may be accelerated due to increases in carbon sources within water systems effected by livestock effluent, rendering the water unsafe for consumption [42,43].

3.3. Need for Implementing TOC Standards for Swine Wastewater Management

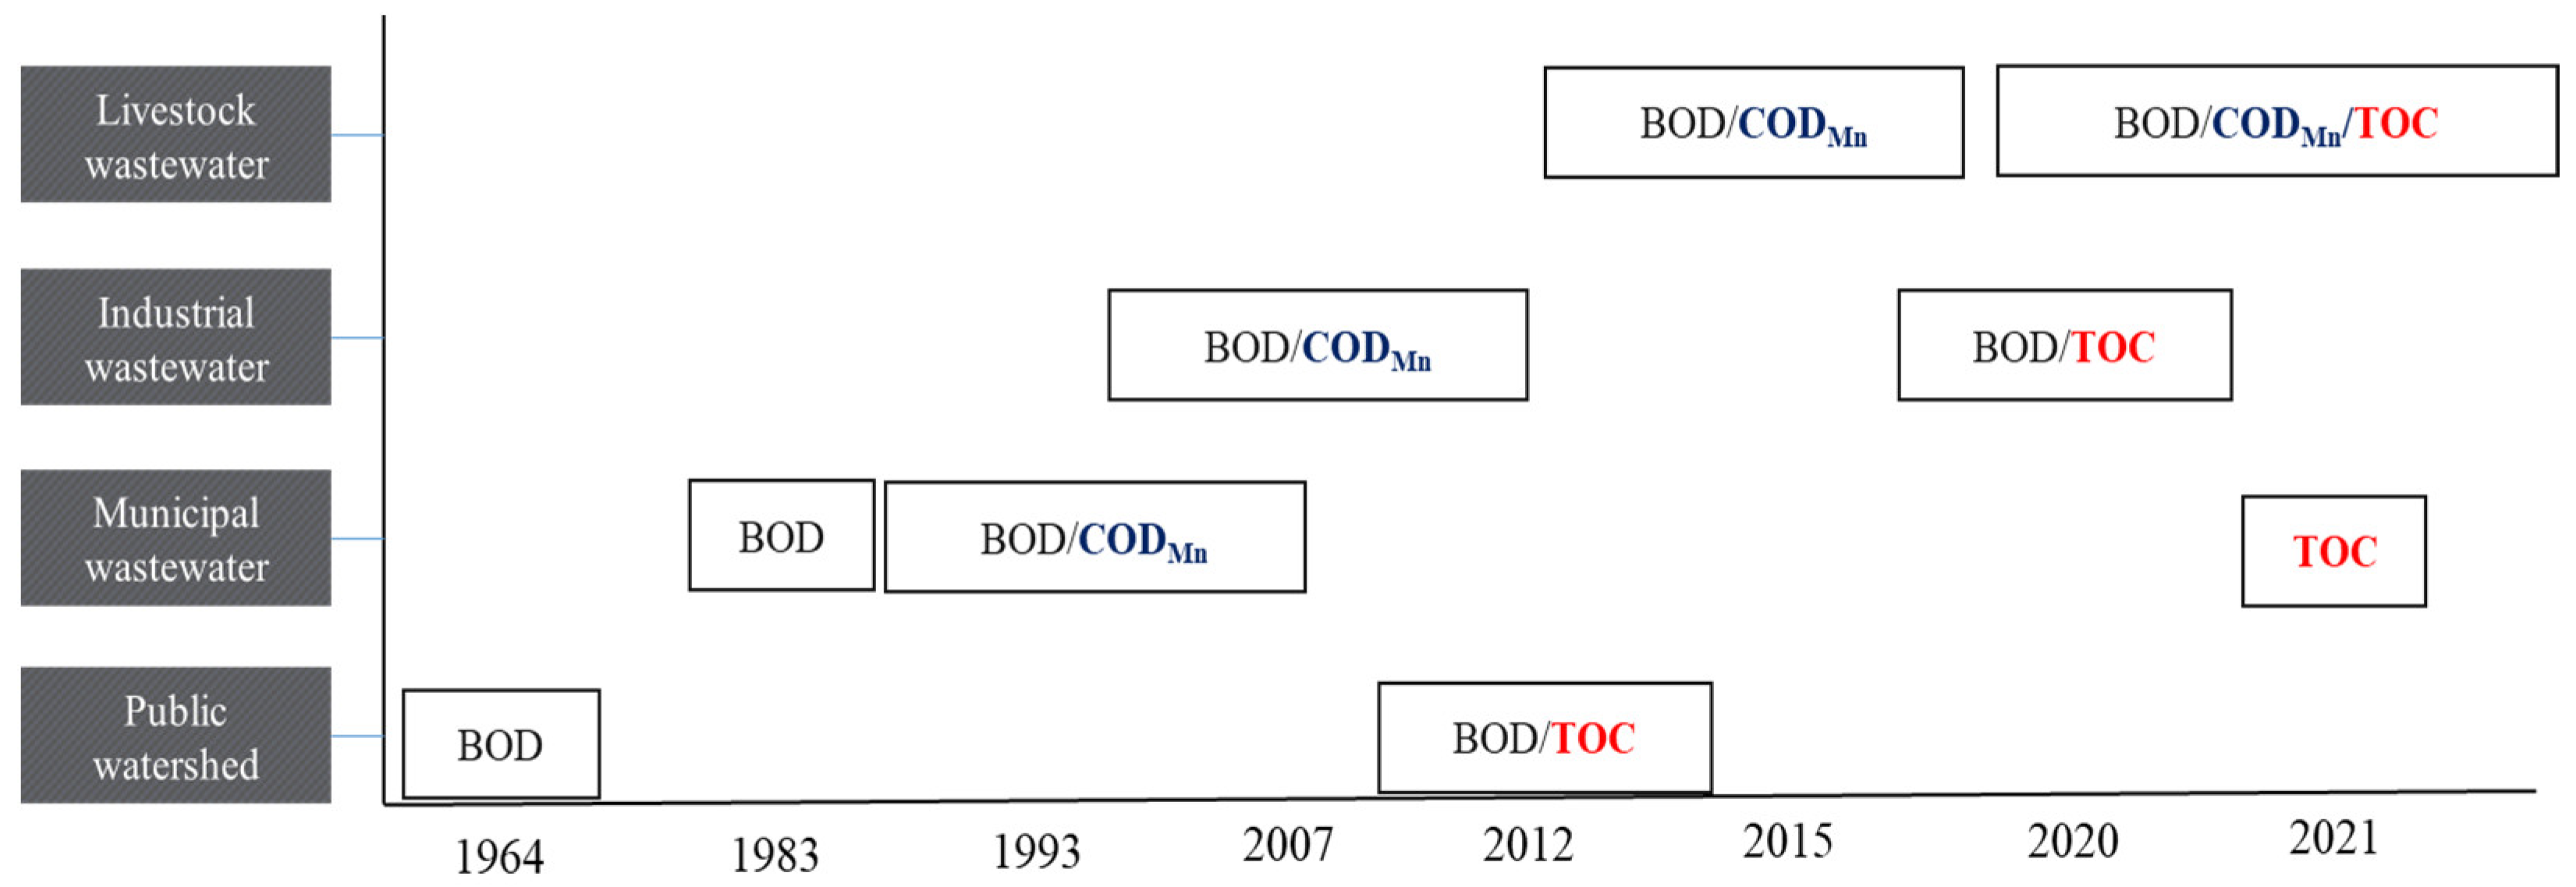
3.3.1. Changes in Major Policies and Water Quality Parameters for Managing OM

In 2009, the NIER presented directions for efficiently analyzing and managing OM in pollution sources and public waters and policies for reestablishing indicators through a comparative review of analytical methods for converting indicators of OM from CODMn to CODCr or TOC, comparative analyses of domestic and overseas OM management cases, and diagnosing current OM management conditions [20]. The NIER also presented problems and alternatives for investigating discharge facilities in 2012 through a survey of domestic and overseas cases in which proposed TOC effluent and wastewater discharge standards were set, conducted a pilot survey on TOC generation and discharge from public and individual discharge facilities, and proposed methods for setting TOC effluent and wastewater discharge standards in Korea [20]. The Ministry of Environment selected TOC as an indicator for managing organic pollutants in public waters and prepared management standards in 2012, while promoting policies that would reflect emissions standards (for effluent, wastewater, and total amounts of organic pollutants) after 2015. Total organic carbon discharge standards for sewage and wastewater were set in 2019 and implementation began in 2021 [20]. Figure 3 shows the changes in OM indicators and related policies according to relevant studies in each field in Korea. With the increasing need for ROM management in public waters, TOC was added to conventional BOD as an indicator of OM and the contributions of TOC to public waters from industrial wastewater, sewage treatment plants, and livestock manure have been measured. Through the conversion of OM indicators to TOC, the limitations of CODMn, which had been controversial for more than 40 years, can be resolved, providing a turning point for improving the efficiency of water quality management.

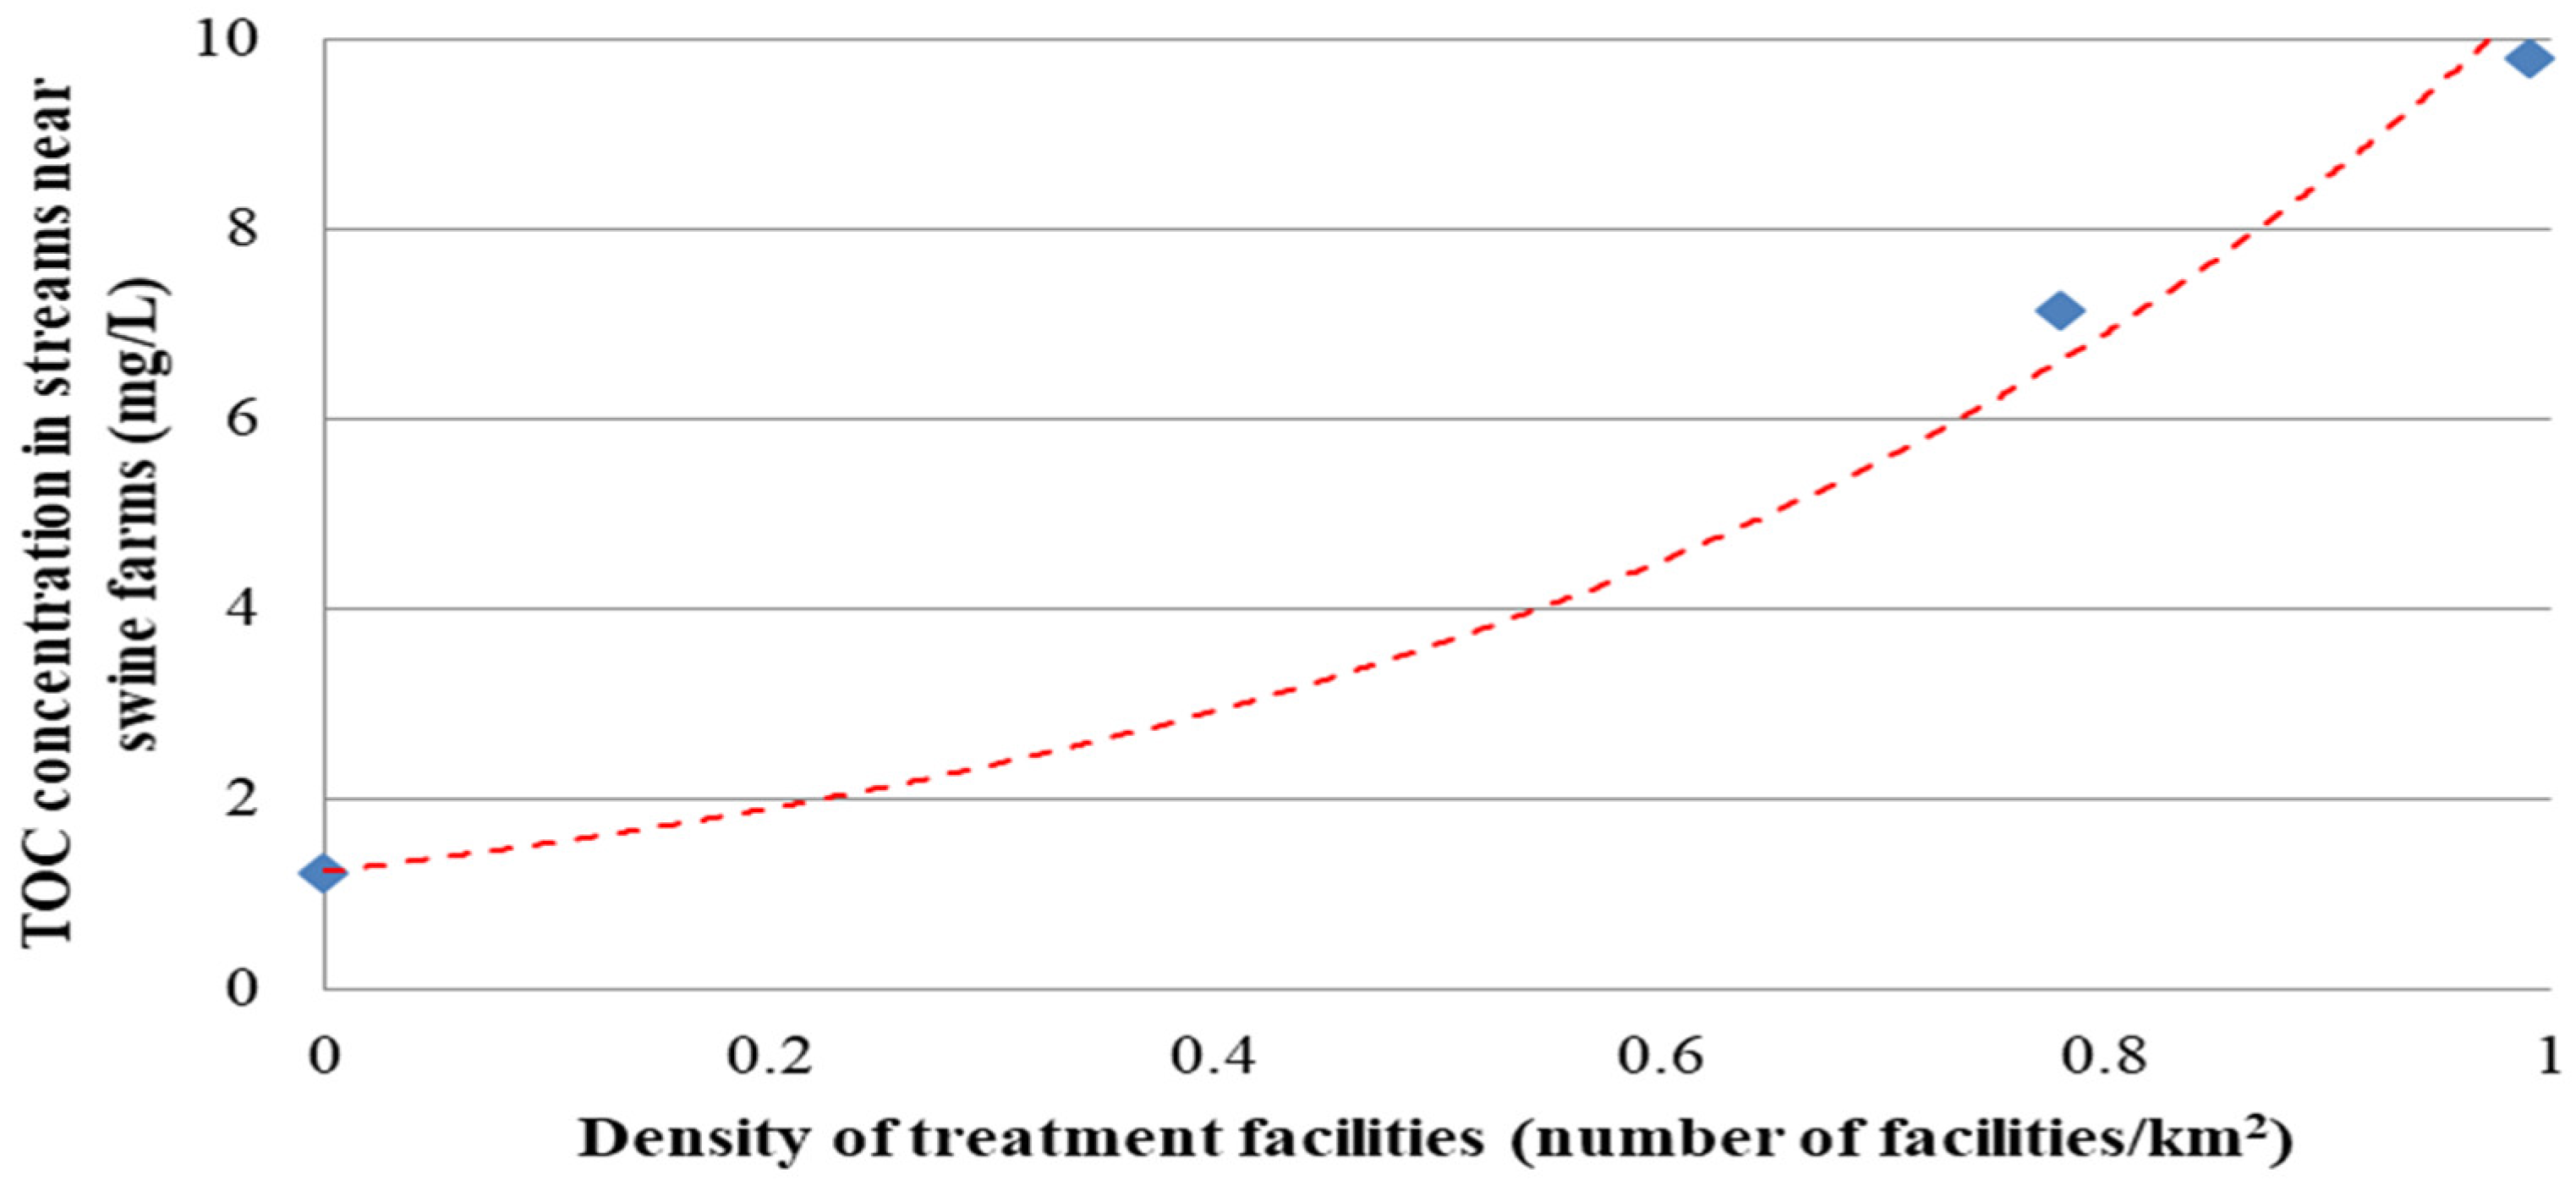
3.3.2. Increased ROM in Rivers near Areas Densely Populated with Swine Farms

Trends in the BOD and COD of rivers close to areas densely populated with swine farms highlight the importance of managing swine wastewater. Figure 4 shows the water quality measurements of a river close to an area densely populated with livestock farms (GC2; 0.99 facilities/km2) at Site A watershed, which was classified as a grade I (dangerous) area based on a survey of candidate sites. Survey results for BOD and COD trends over the past three years (2019–2021) show that BOD has continued to decrease, while COD has increased, indicating that the concentration of ROM has continued to increase. Similar cases are expected to occur frequently in areas densely populated by swine farms.
As shown in Figure 5, TOC concentrations in nearby rivers increased rapidly with increases in the density of swine wastewater treatment facilities (GC2: 0.99 facilities/km2 > GC3: 0.78 facilities/km2 > GC1: 0.0 facilities/km2). Therefore, it is necessary to introduce TOC management parameters for on-site treatment facilities at individual farms and nearby rivers and to set optimum water quality standards for managing the discharge of ROM from swine farms. We must also determine whether or not appropriate management can be achieved by continuously monitoring TOC fluctuations in rivers close to swine farms.
Korea, Japan, and Taiwan treat swine wastewater by purification at public and/or private facilities. In Japan and Taiwan, only nitrogen is regulated and standards are applied to municipal wastewater alone. In Japan, OM is managed by applying CODCr and BOD standards for 10,000 heads of swine (50 tons/day). However, with the emergence of ROM-associated problems caused by swine wastewater, it is necessary to introduce TOC standards and manage TOC accordingly. Moreover, mitigating pollution from the source is essential since livestock farms are separated from residential areas and located upstream in areas with few sources of pollution.

3.4. Setting TOC Standards in Swine-Wastewater Treatment Facilities for ROM Management

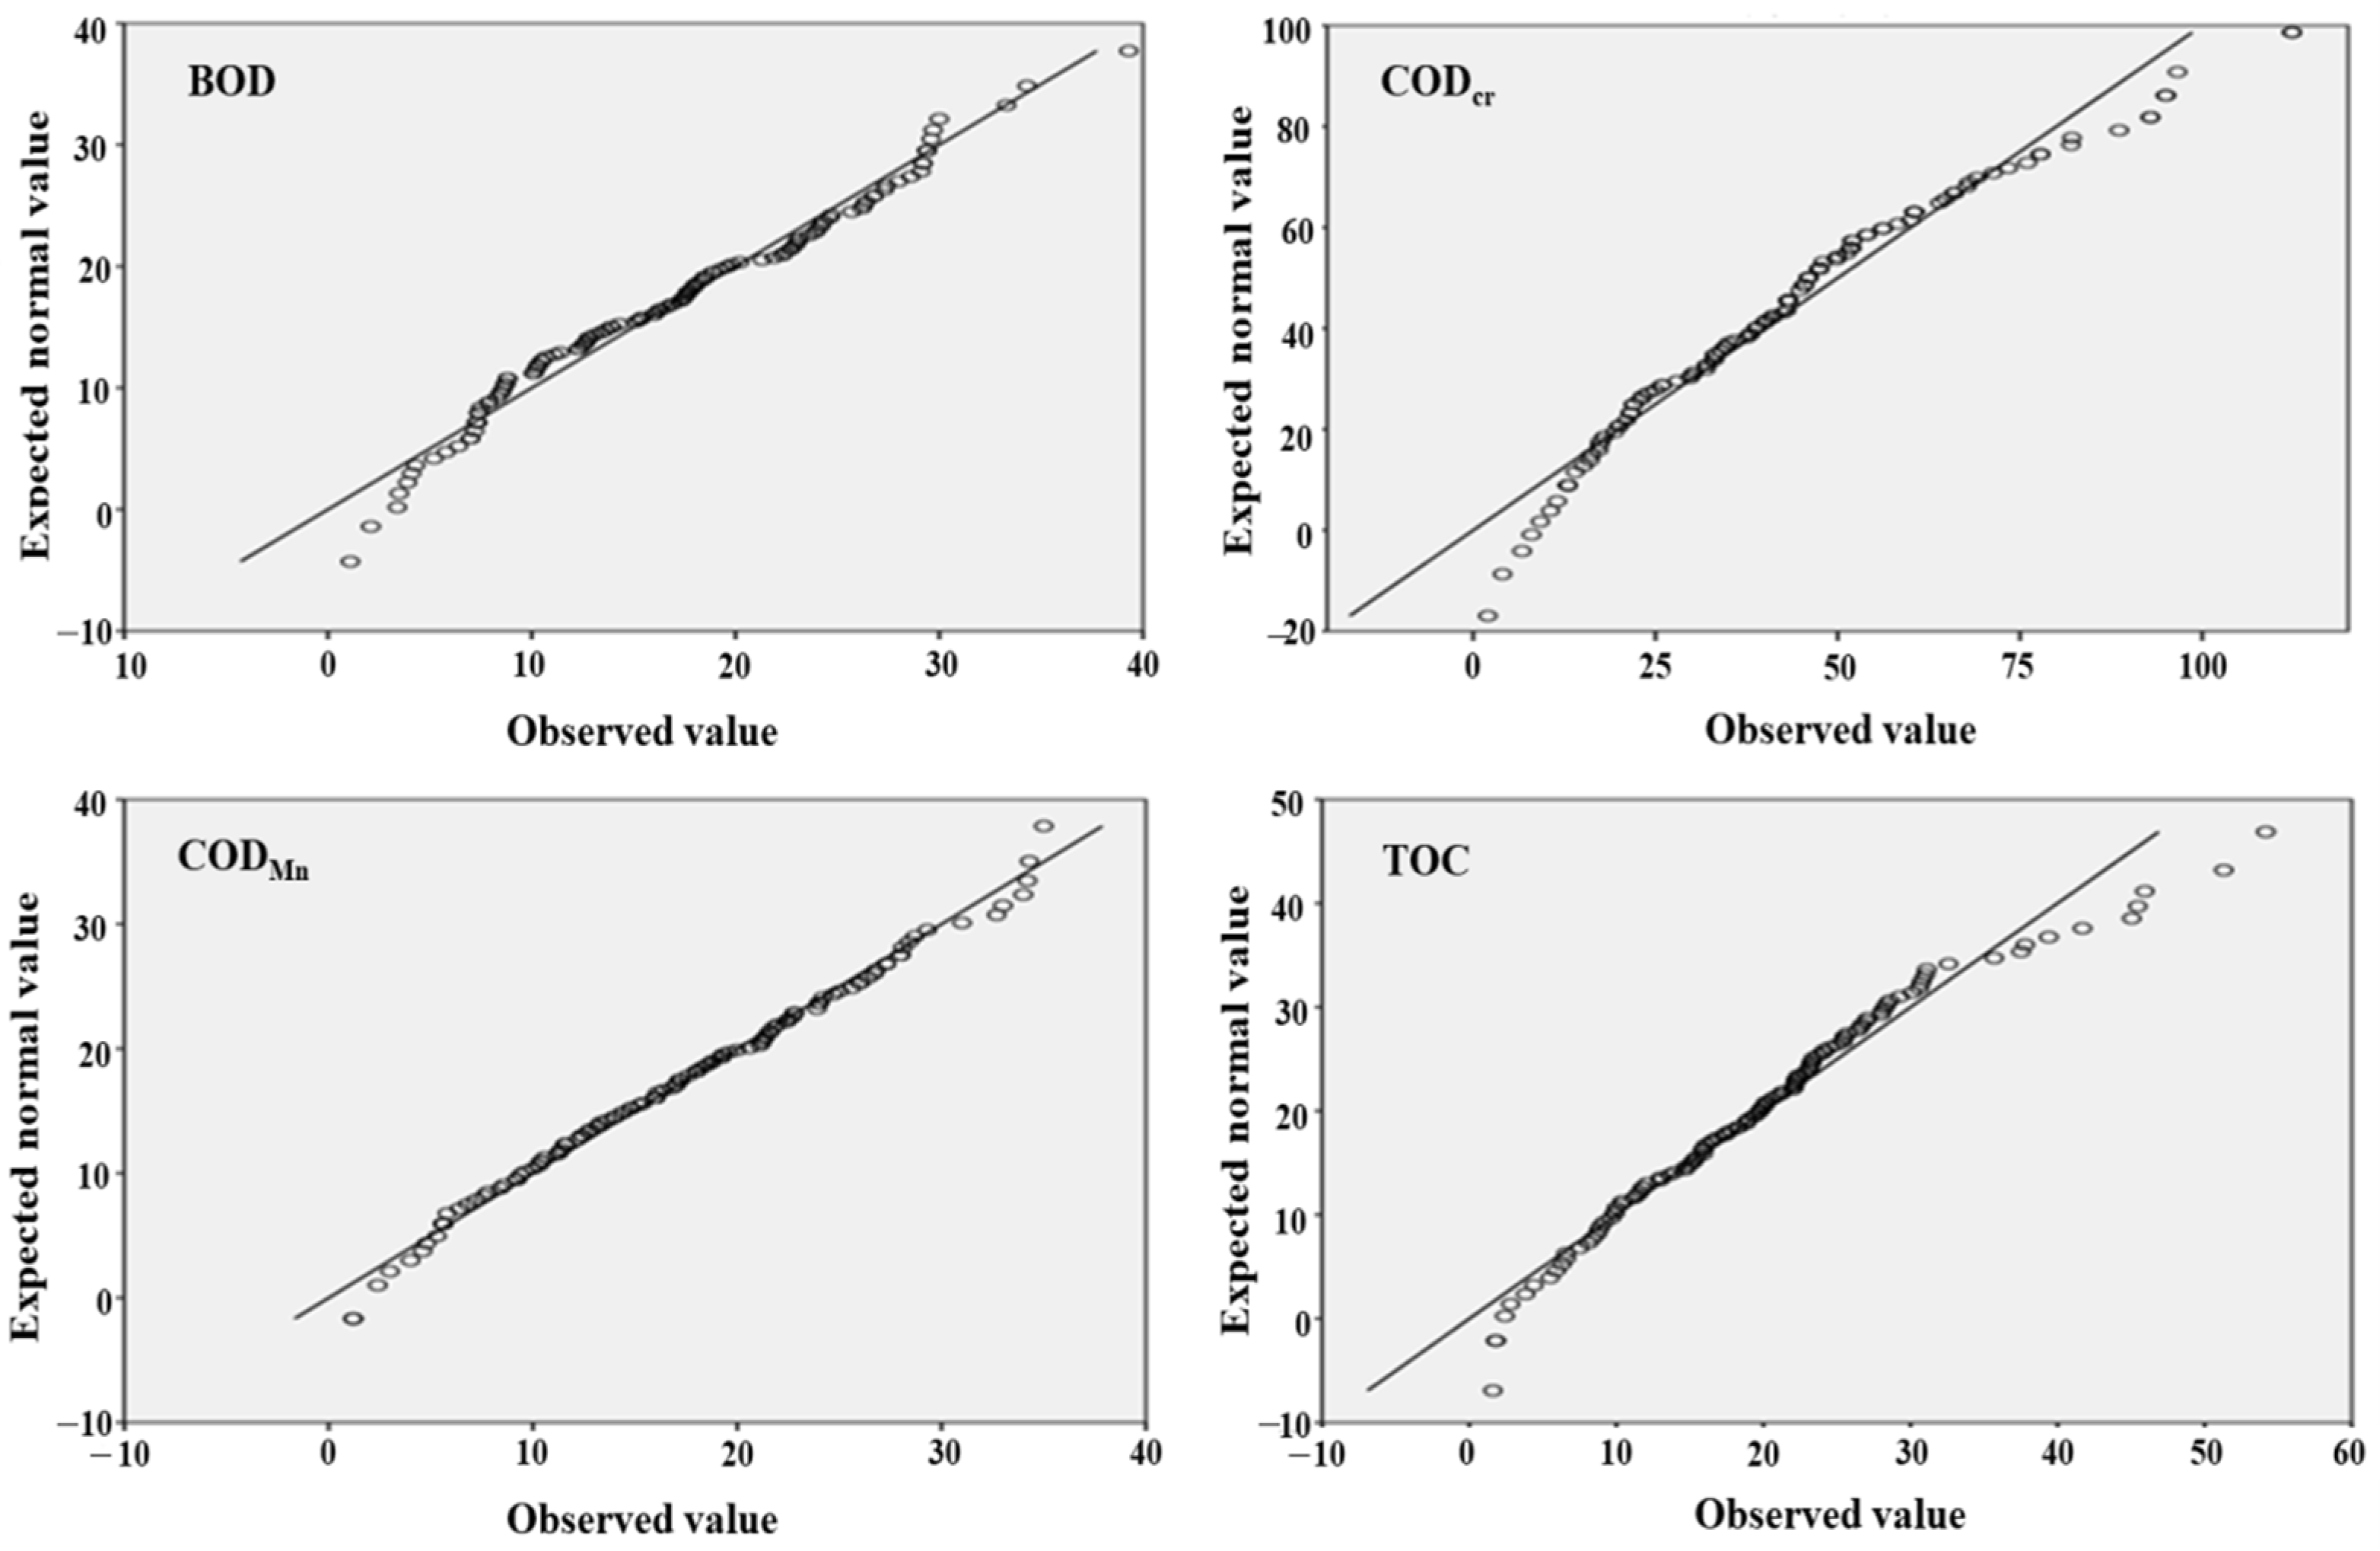
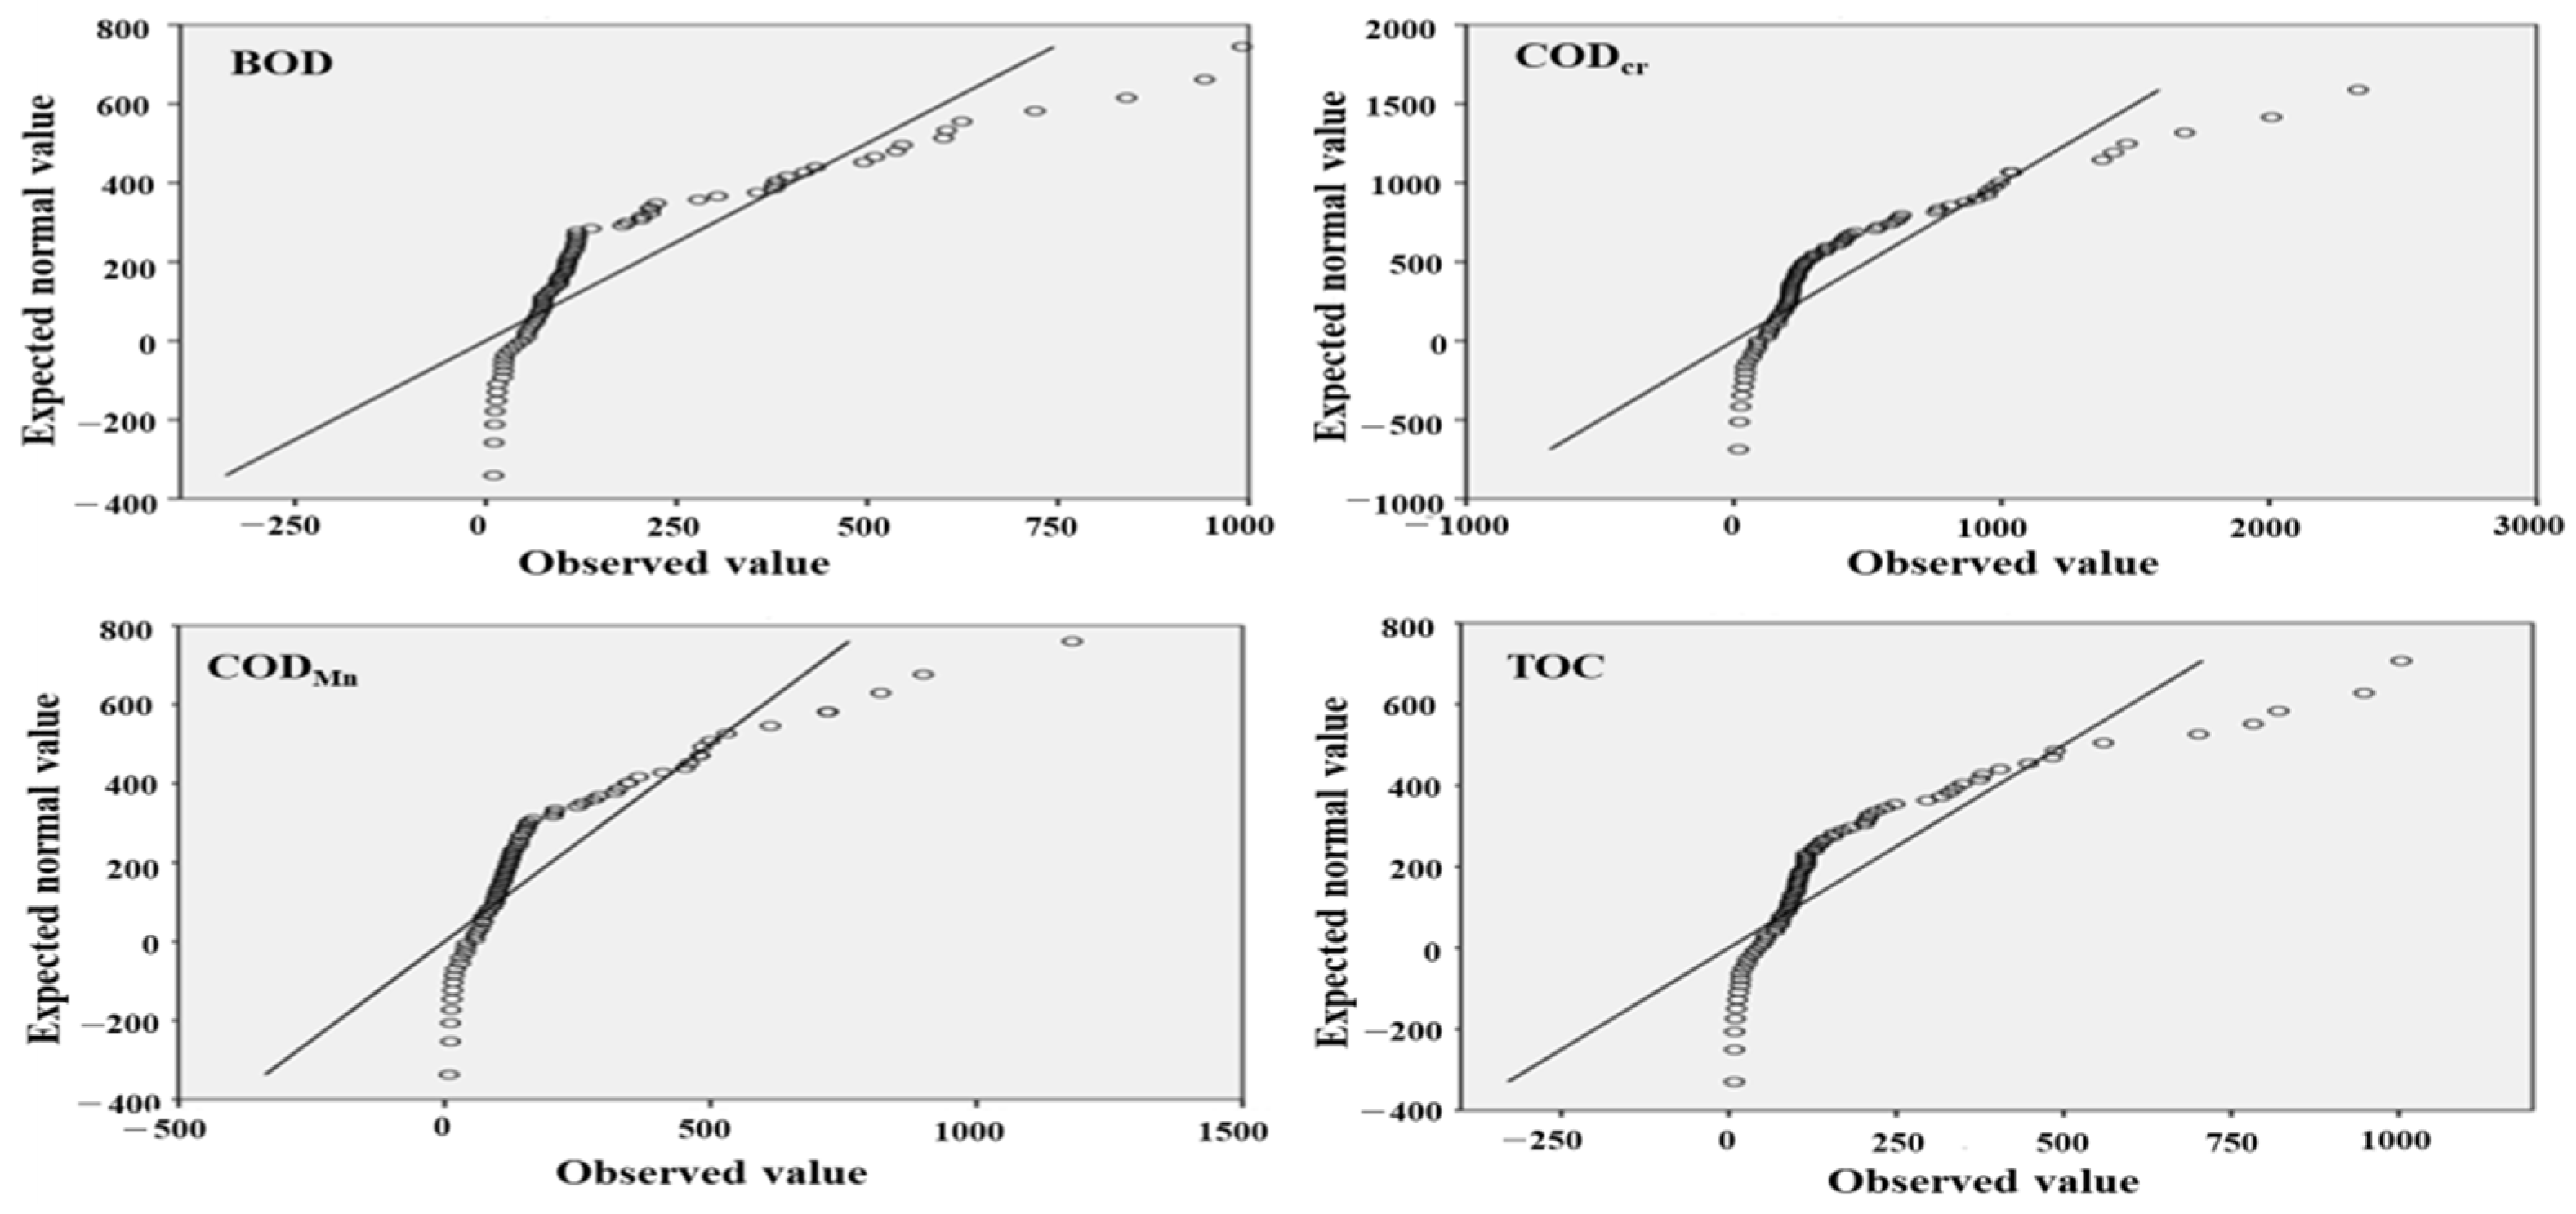
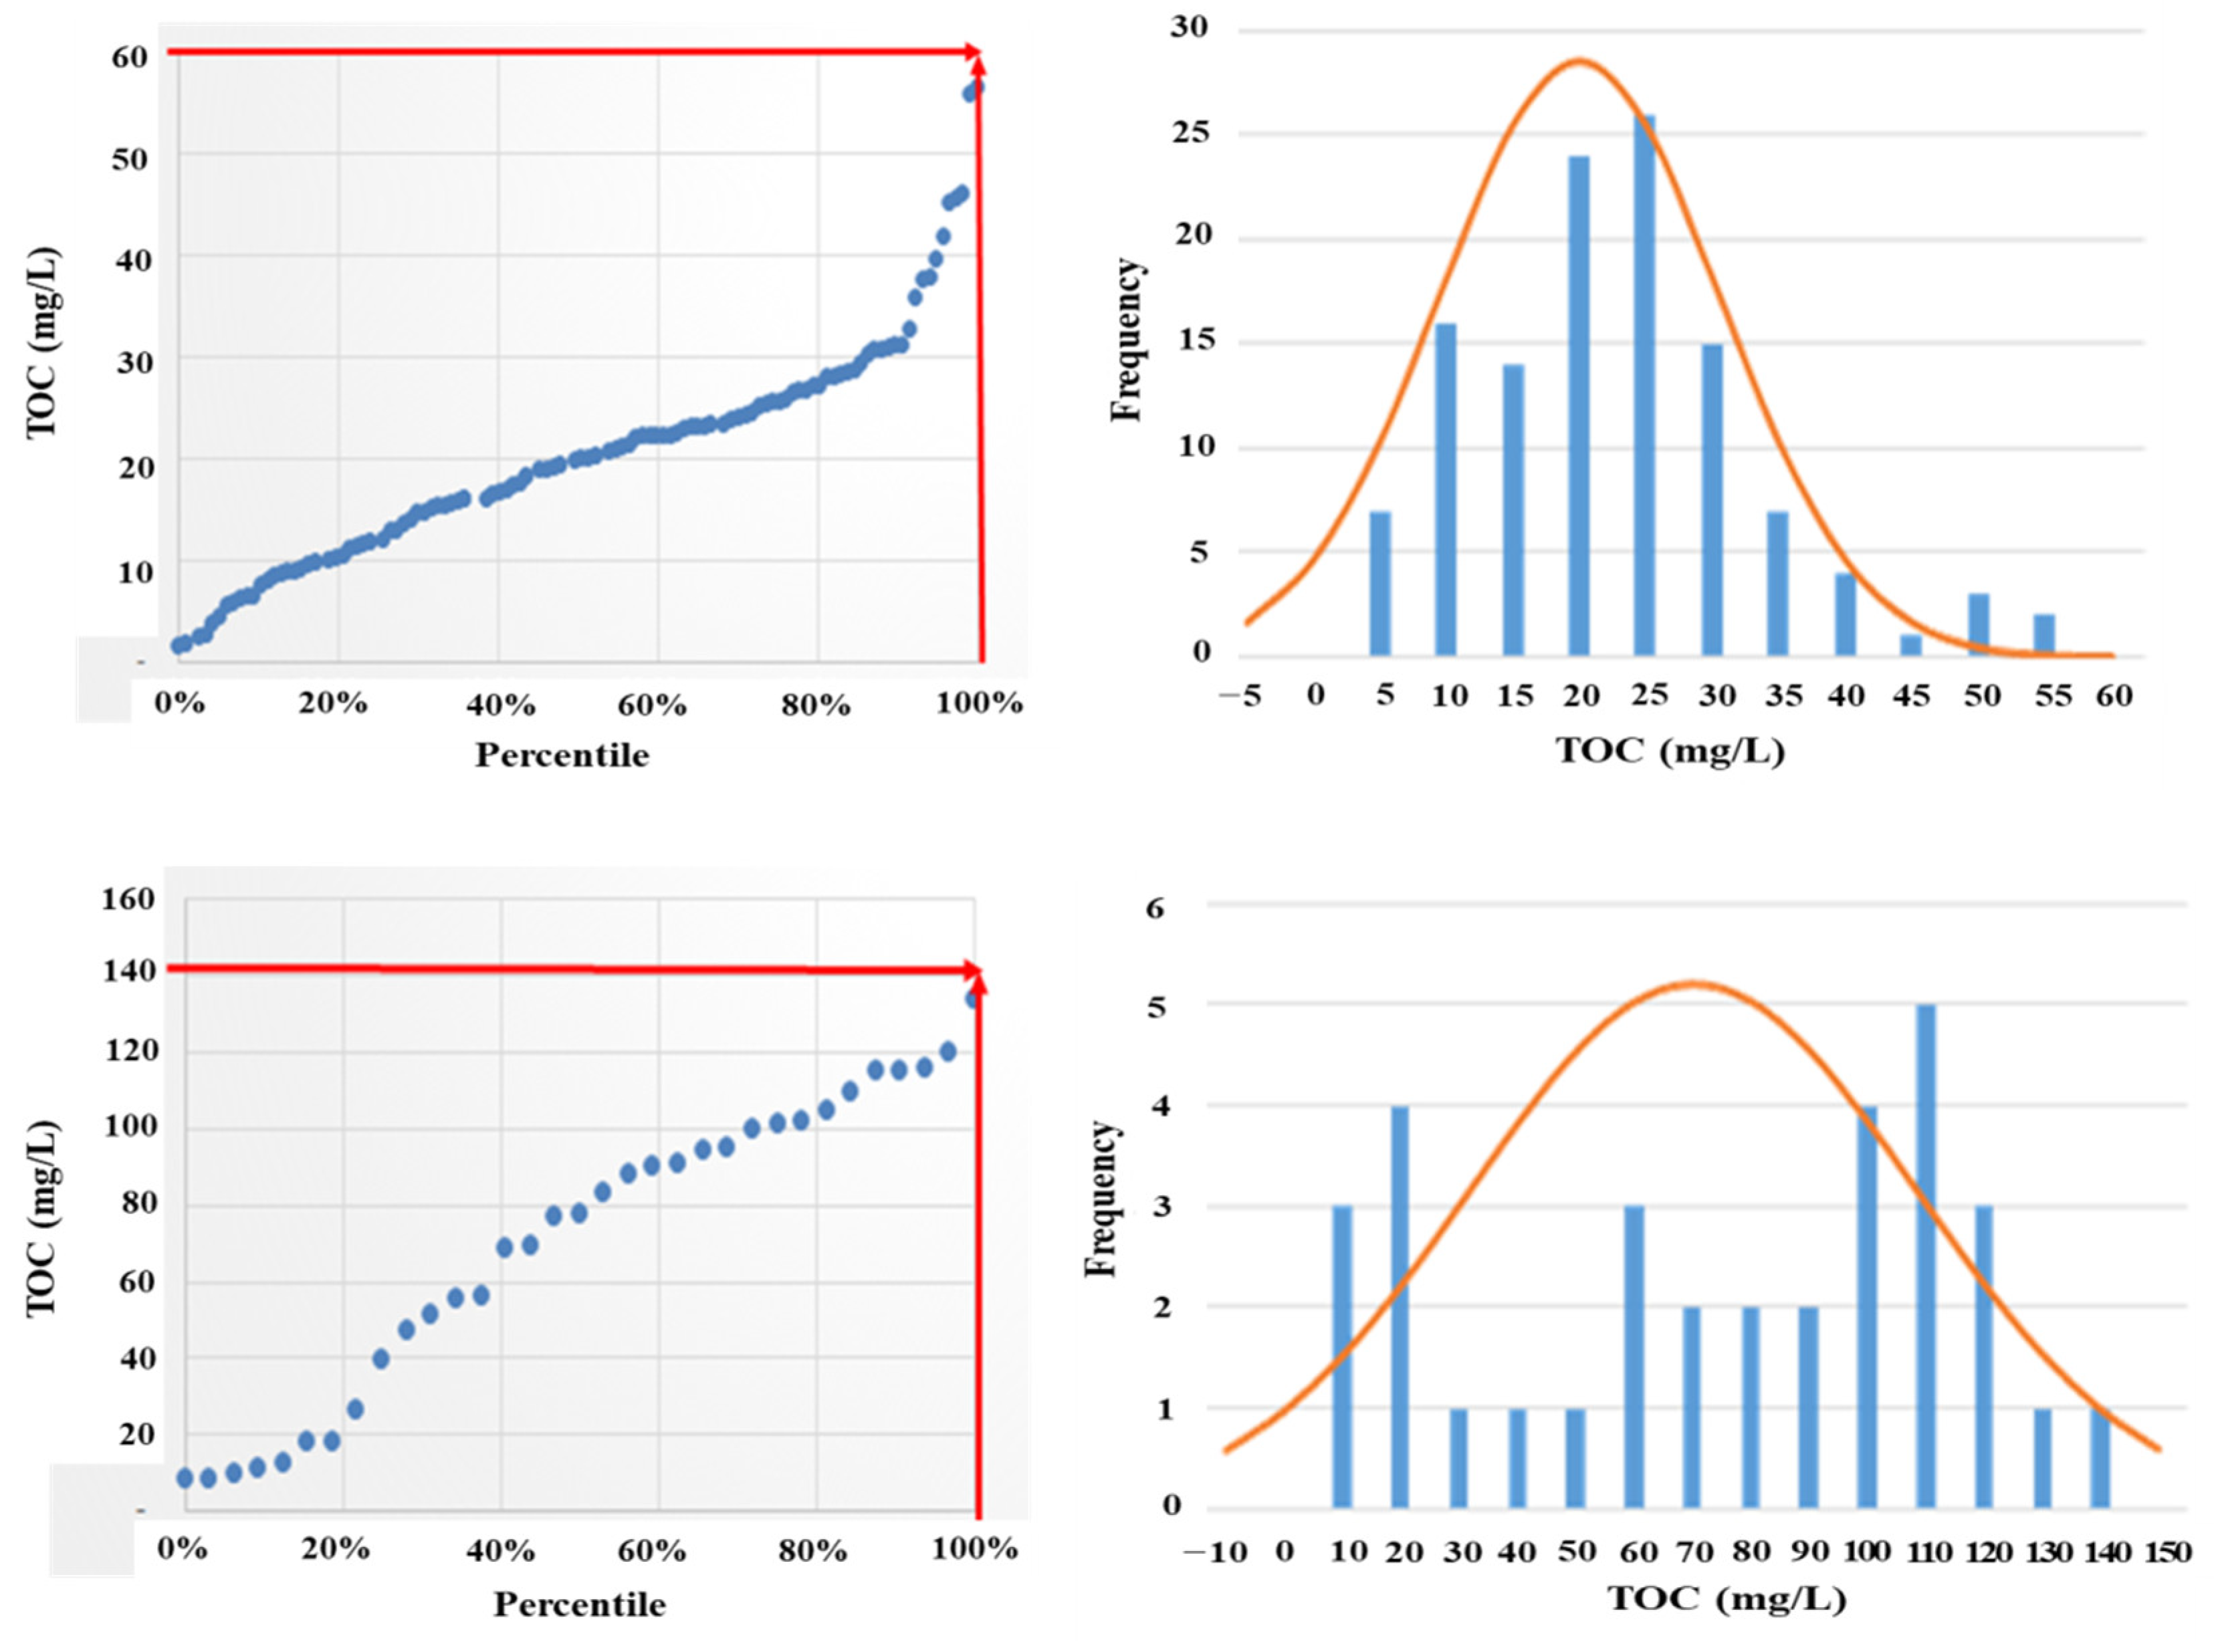
3.4.1. Statistical TOC Standards

Regression between TOC and OM Parameters

Regression analyses were performed to identify the scale and causal relationships between TOC and parameters of OM. The results of multiple regression for public and on-site swine-wastewater treatment facilities (Table 7) showed that all OM parameters (BOD, CODCr, and CODMn) were highly correlated with TOC. For influent, the highest correlation was observed between CODCr vs. TOC, followed by BOD and then CODMn vs. TOC in both public and on-site swine facilities, with similar results between them. For effluent, the correlations between the OM parameters and TOC at on-site treatment facilities were especially high (R = 0.959–0.965), whereas they were slightly lower (R = 0.898–0.949) at public facilities. The strongest correlation at public facilities was between CODCr vs. TOC, followed by CODMn and BOD vs. TOC, while for on-site facilities, the strongest correlations were between CODMn vs. TOC, followed by BOD and CODCr vs. TOC. The correlations of OM parameters for effluent were similar for on-site treatment facilities, but differed slightly among public treatment facilities.

Correlation by Treatment Facility Type and Effluent Parameter

To determine whether or not the data for effluent from each swine-wastewater treatment facility were normally distributed, Q–Q plots were constructed (Figure 6 and Figure 7) and correlation analyses were conducted for each treatment facility based on these plots. Linearity in the data indicated a normal distribution, whereas nonlinearity indicated a non-normal distribution. As shown in the Q–Q plots, the measured OM parameters from public treatment facilities appeared nearly linear, with the data for CODMn exhibiting the highest degree of linearity, followed by that for TOC, BOD, and CODCr. In contrast, the OM parameters measured at on-site treatment facilities were nonlinear. Accordingly, it was determined that public treatment facilities followed a normal distribution, while on-site facilities did not.
Based on the normal distribution of the data, the parametric Pearson’s correlation analysis was applied to the data from public treatment facilities. Moreover, due to the non-normality of the data collected from on-site facilities, non-parametric Spearman rank correlation analysis was employed because the probability distribution of the statistics used for analysis was not affected by the target population. This method is widely used to analyze correlations between non-normally distributed variables.

Correlations between TOC and Water Quality Parameters

We used SPSS Grad Pack 22.0 (IBM Corp., USA) to analyze the correlations between water quality parameters. Table 8 shows our results according to the type of swine-wastewater treatment facility. When the Pearson’s correlation coefficient (r) for effluent from public treatment facilities was analyzed, DOC and CODCr showed a strong positive linear relationship (0.7 ≤ r ≤ 1.0, Table 8), indicating a very high correlation with TOC. Furthermore, CODMn and BOD also showed a clearly positive linear relationship (0.3 ≤ r ≤ 0.7), based on which, it was concluded that all OM parameters were correlated with TOC.
Correlations between the OM parameters and TOC of effluent from on-site treatment facilities were analyzed according to their Spearman correlation coefficients (ρ), which are derived by rank rather than data values when data are ordinal. Spearman correlation coefficients have a value between −1 and +1, wherein +1 indicates that the rank of two variables is identical and −1 indicates that they are completely opposite. The results shown in Table 8 reveal that all OM parameters of effluent from on-site treatment facilities were highly correlated with TOC, as in the case of public facilities. Dissolved organic carbon showed the strongest correlation with TOC, followed by BOD, CODCr, and CODMn.

3.4.2. Technology-Based TOC Standards

We calculated the mean, standard deviation (SD), maximum (max), minimum (min), and percentiles of effluent water quality by swine-wastewater treatment facility, as shown in Table 9. The results showed that all public treatment facilities satisfied the effluent water quality standards for CODMn (≤50 mg/L), whereas the standards for BOD were satisfied at the 95th percentile. Because water quality standards for CODMn have not been established for on-site treatment facilities, the water quality standards for BOD (120 mg/L) were examined. We found that on-site treatment facilities satisfied the water quality standards for BOD at the 60th percentile despite having higher levels than public treatment facilities, which indicates that many on-site treatment facilities do not satisfy effluent water quality standards. The reasons for such results could be attributed to the facts that most on-site treatment facilities are operated by farm owners, who are not environmental professionals, and that these facilities often use dissolved air flotation as a post-treatment process, which makes it more difficult to remove SS and total N.
All currently employed swine wastewater treatment processes aim to satisfy the water quality standards for OM (BOD and CODMn); thus, they are operated using the best practicable technology (BPT) available and the BAT that is economically achievable. When such processes are employed, the application of 5th percentile values can be assumed to represent the BAT, taking into consideration the error inherent to the data for each parameter. However, 5th percentile values could place a substantial burden on livestock farmers, as they correspond to very low levels of discharge. As most on-site treatment facilities are operated by people without environmental expertise, it is unlikely that 5th percentile values, if accepted as standard, could be realized, which would result in non-compliance. Therefore, we applied the same 50th percentile TOC standard used for industrial wastewater to swine wastewater.
The same technology-based equation applied to set the TOC standards for effluent from sewage treatment facilities was used to derive a variability factor (VF) in this study. Here, VF was calculated as the ratio between the 99th percentile and the mean TOC (Equation (1)); the TOC calculated for public treatment facilities was 53.5 mg/L, while that for on-site facilities was 159.5 mg/L (Equation (2)) (Table 10).
VF = TOC 99 th   percentile TOC mean
TOC standard = 50 th   percentile   ×   VF ,
where TOCstandard is the standard for swine wastewater effluent (mg/L) according to the VF and 50th percentile of effluent water quality from treatment facilities (mg/L).

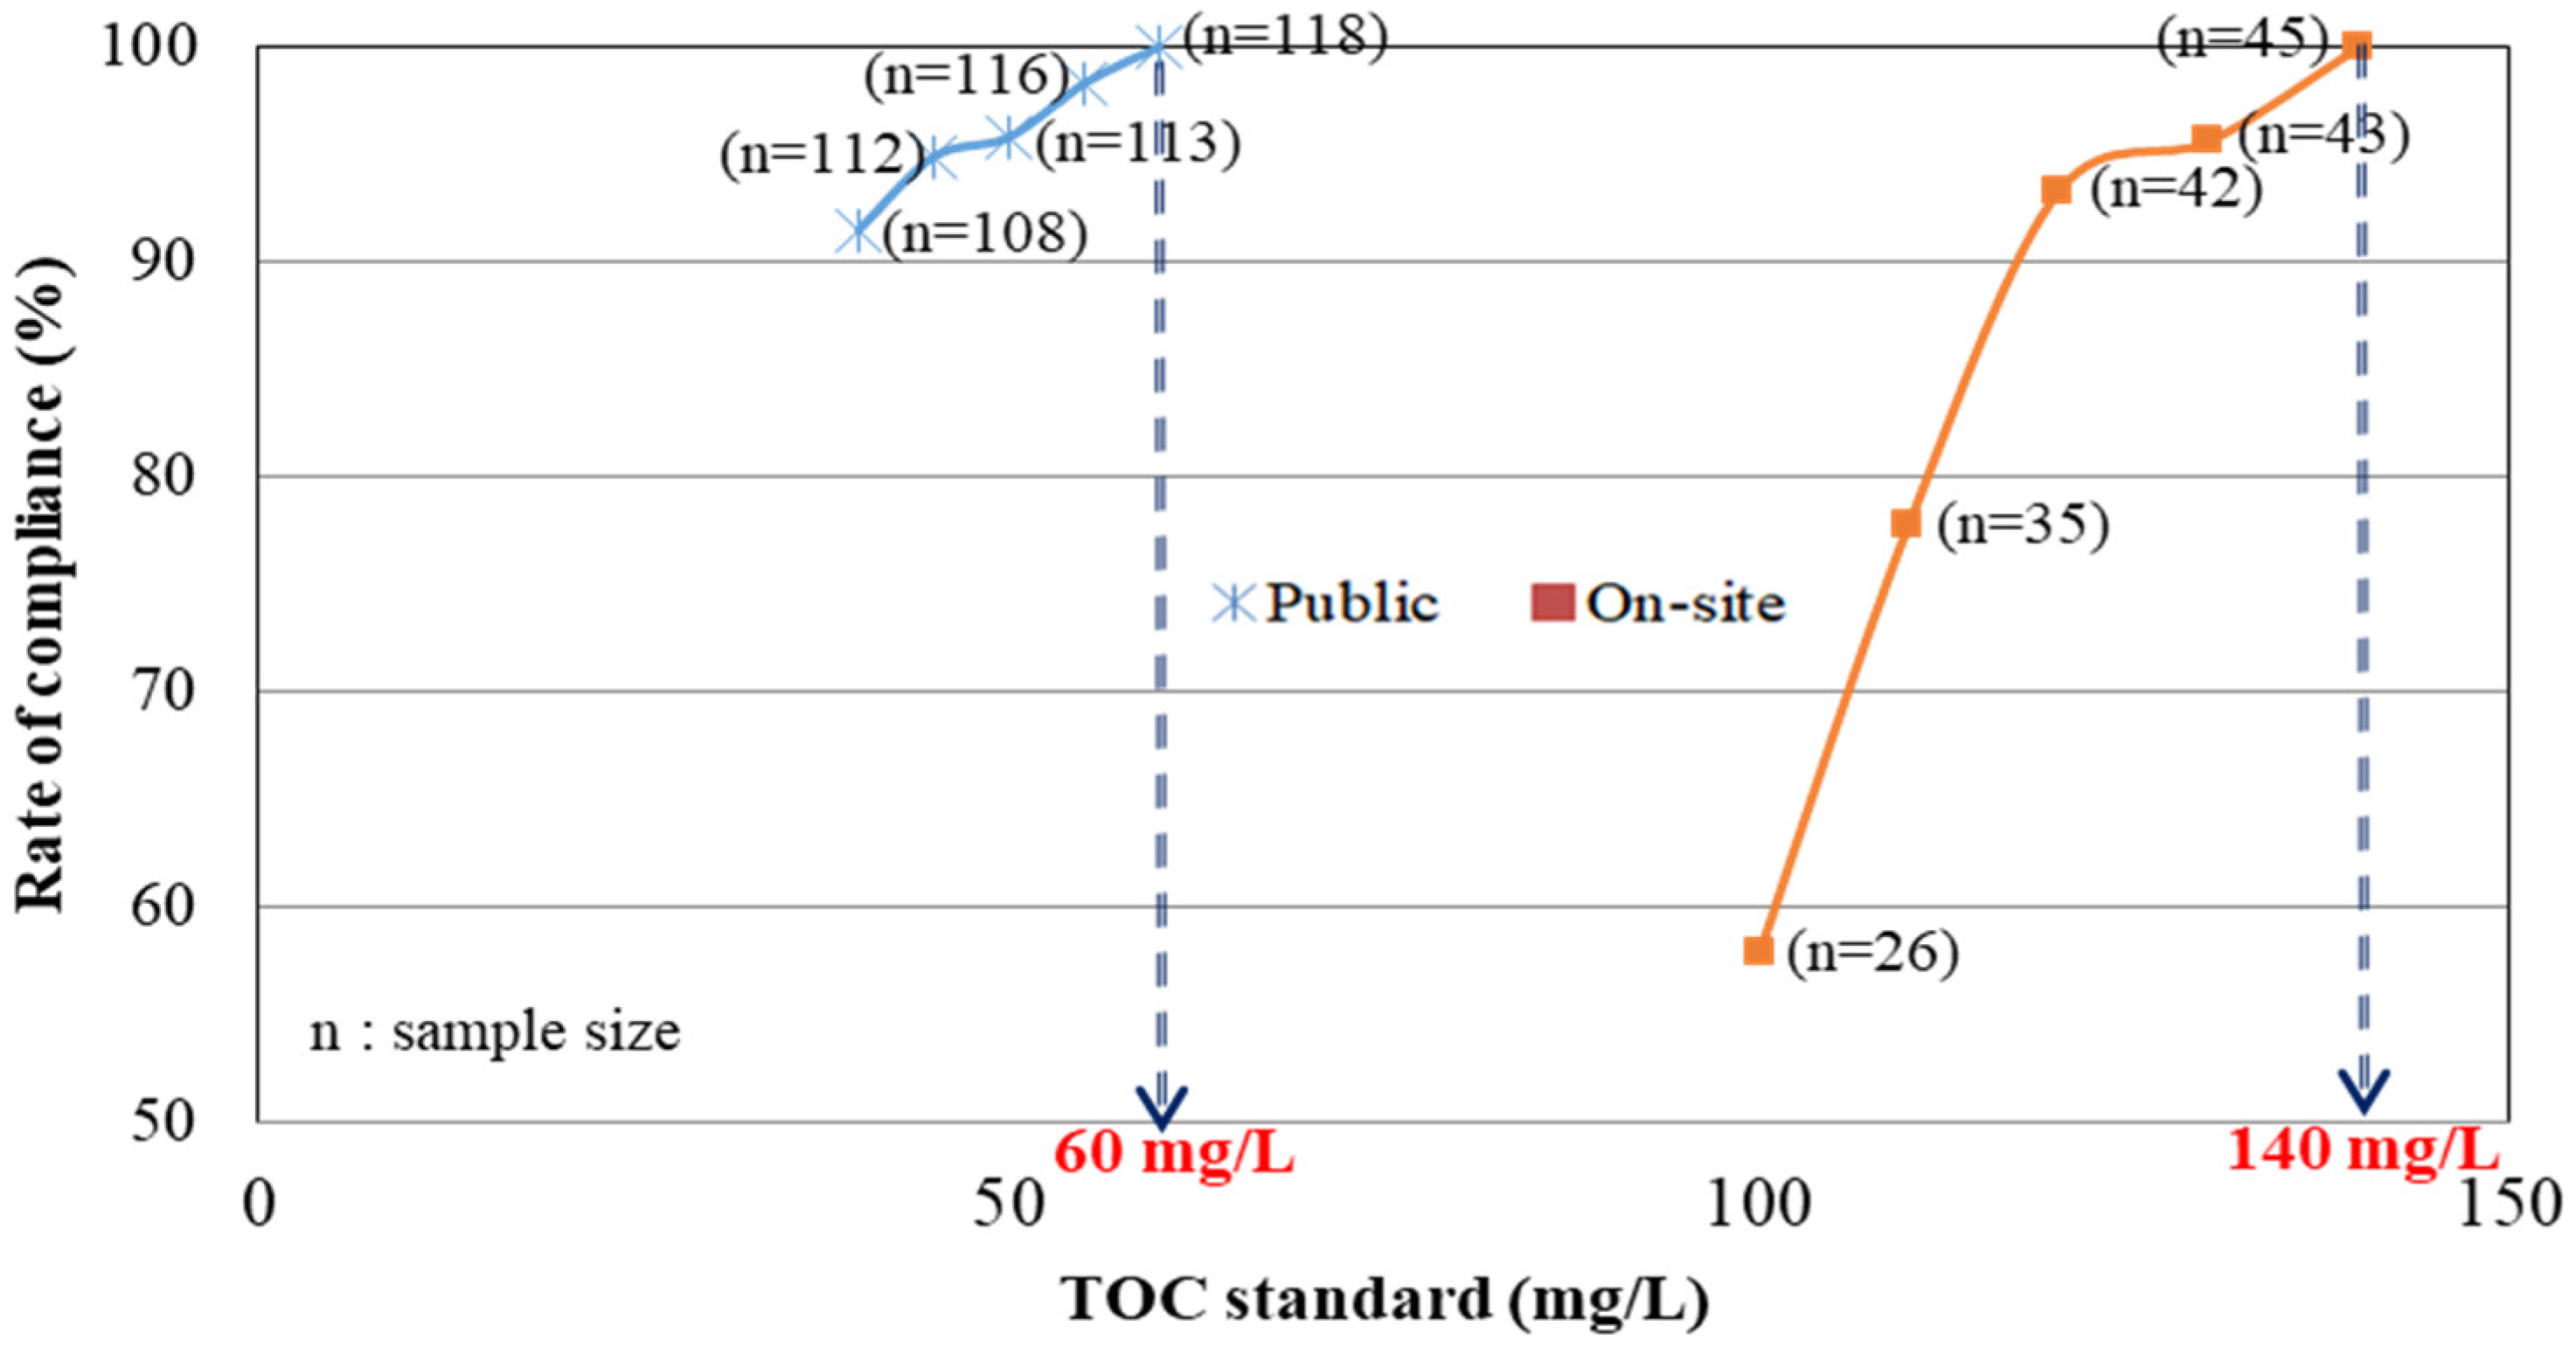
3.4.3. Empirical TOC Standards

A review of the statistical and technology-based TOC standards revealed that there were no significant correlations among the OM parameters and that the technology-based standards were too strict. Accordingly, TOC values that could satisfy current OM standards (BOD and CODMn) were calculated (Figure 8). An empirical TOC standard-setting method was used to set the standard value within a certain percentile range. Typically, the standards for water quality parameters range from the 75th to the 90th percentile [45]. In Korea, the BOD standard has been set the lowest (70th percentile), while that for CODMn has been set at the 99th percentile [45]. The value representing the 99th percentile is used for public facilities to ensure that they can satisfy both the current OM and TOC standards, whereas the 100th percentile is applied to on-site treatment facilities, which may have difficulty removing refractory substances due to the absence of CODMn standards. If the difference between the 99th and 100th percentile values is large, there is a possibility of overestimation. However, our results showed that there was almost no difference between these values, and thus that no overestimation would occur even if 100th percentile values were used.

3.4.4. Proposed TOC Standards for Effluent Water Quality in Swine-Wastewater Treatment Facilities

Table 11 shows a summary of the optimum ranges of the statistical, technology-based, and empirical TOC standards for effluent water quality in swine-wastewater treatment facilities. For public treatment facilities, the order in terms of standard strictness, was as follows: empirical (99th percentile) > technology-based > statistical > empirical (95th percentile) values. For on-site treatment facilities, the order was as follows: technology-based > empirical (99th percentile) > empirical (95th percentile) > statistical values. Further, the applicable range for the empirical values can be used to set the minimum standard for TOC.
It is necessary to set a tentative TOC value from the results of the three methodologies considered thus far. The values ranged from 40–55 mg/L for public treatment facilities and from 120–160 mg/L for on-site facilities. The best way to determine the optimum standards is to evaluate their practical applicability, as the inability of individual farmers to comply with standards that have been set too high will result in the loss of the intended functions of said standards. One means of addressing this issue is to assess the rate of compliance so that standards may be set in order to achieve complete compliance without upgrading facilities; this can also facilitate standard-setting in the future. Figure 9 shows the rate of compliance for the tentative TOC standards calculated using each methodology. Assuming that swine-wastewater treatment facilities currently in operation are used as they are without further improvements, a TOC standard of 60 mg/L would be required for public facilities and 140 mg/L would be required for on-site facilities to satisfy the proposed TOC standards.
No separate standards exist for regulating ROM levels (e.g., CODMn) at on-site swine-wastewater treatment facilities in Korea. If the empirical optimum range of the 95th percentile is applied, then a TOC concentration of 119.6 mg/L will be achieved and the compliance rate will be 93.3%. The remaining 6.7% of facilities require upgrades to satisfy the TOC standards, which places a financial burden on the swine farms. Therefore, when establishing new TOC standards, they should be set so that they can be satisfied without additional installations or upgrading of (existing) facilities.

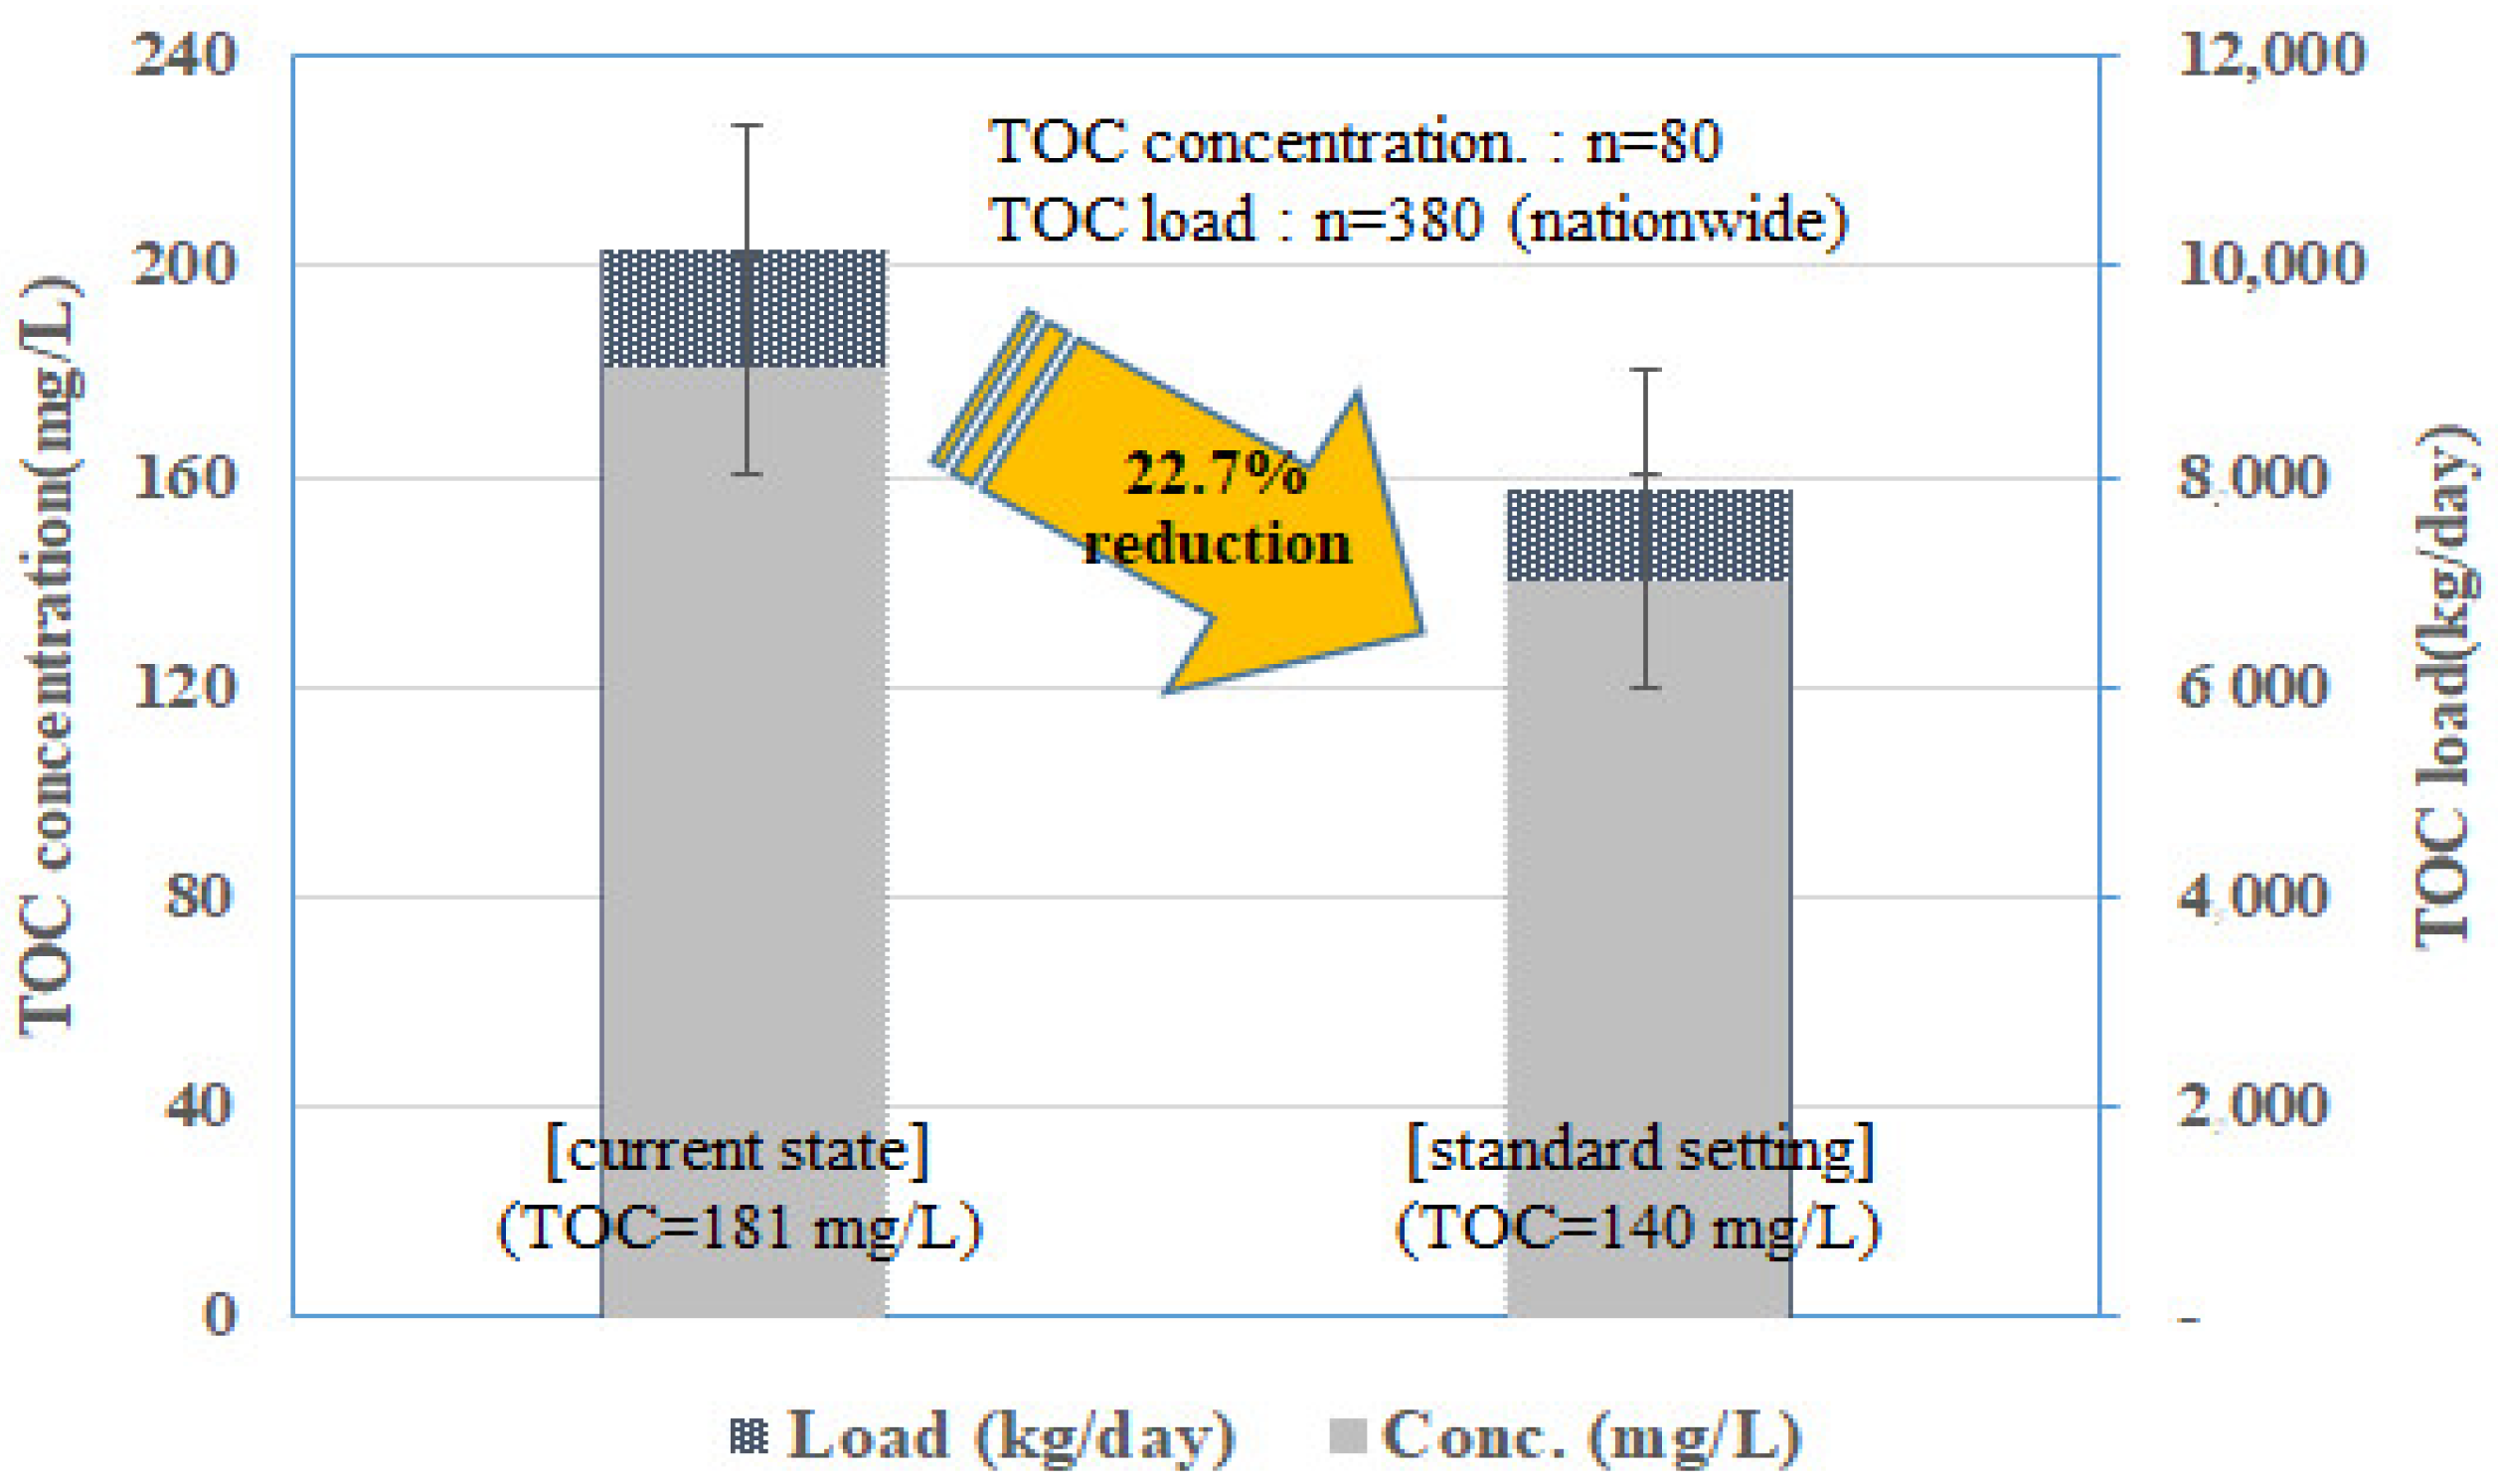
3.5. Expected Improvements to Water Quality Based on the New TOC Standards

Limitations persist in predicting the degree to which water quality may be improved by setting TOC standards for swine-wastewater treatment facilities. Whether or not the facilities are operating stably can be evaluated through regular supervision and inspection and improvements to water quality can be determined via continuous monitoring of nearby rivers after setting the standards. Nevertheless, considering the concentration and flow rate of TOC discharged from swine-wastewater treatment facilities currently in operation and the TOC standards (assuming 140 mg/L) to be implemented in the future, a 22.7% reduction in TOC may be expected (Figure 10). A survey of 20 currently operating treatment facilities across four seasons showed that the mean amount of TOC discharged from on-site facilities was ~181 mg/L; assuming that the TOC standard will be set to 140 mg/L in the future, we found that the load would decrease by 2311 kg/day. While the impact of the calculated TOC reduction on the water quality of nearby rivers can be evaluated via monitoring, simply reducing the discharge of TOC from treatment facilities (by ~25% of the current level) alone may ultimately have a positive impact on river water quality.

4. Conclusions

Continuous management of livestock wastewater is necessary to prevent water pollution. Swine are responsible for ~43% of the livestock wastewater generated, and their population has consistently increased in recent years. While many swine farms have wastewater treatment facilities, there remain limitations in terms of their number, operation, and management. Furthermore, swine wastewater contains high ROM content, and its discharge volume tends to increase in areas that are more densely populated with swine farms. Discharge of swine wastewater containing highly concentrated ROM into public waters can degrade the water quality in nearby rivers, making their use as water sources difficult. Thus, it is essential to manage ROM in wastewater. As TOC is used as an indicator of ROM in public waters, sewage treatment plants, and industrial wastewater, it is necessary to implement TOC standards to manage ROM in swine wastewater.
While the methods discussed here could be applied, either alone or in combination, for livestock wastewater management, determining which method has the broadest applicability requires the comprehensive consideration of livestock management policies, regional conditions, and burdens on stakeholders. Water quality improvements achieved by setting TOC standards for swine farms should be assessed through continuous monitoring of nearby rivers. Additionally, if no significant reduction in TOC levels is achieved despite compliance with the effluent standards by the swine wastewater treatment facilities, additional measures for gradual strengthening of the effluent water quality via education, monitoring, upgrading and new equipment installation may be needed.

Author Contributions

Conceptualization, J.-H.P., E.-G.C., H.-D.R. and S.-W.O.; methodology, J.-H.P. and E.-G.C.; data curation, J.-H.P. and S.-W.O.; writing—original draft preparation, J.-H.P.; writing—review and editing, J.-H.P., E.-G.C. and H.-D.R.; visualization, S.-W.O.; supervision, E.-G.C. and Y.-S.K. All authors have read and agreed to the published version of the manuscript.

Funding

This research was funded by the National Institute of Environmental Research (grant nos. 1100-1133-306-210 and NIER-2018-04-02-012).

Institutional Review Board Statement

Not applicable.

Informed Consent Statement

Not applicable.

Data Availability Statement

All the data used in the study have been provided in the manuscript.

Acknowledgments

The authors thank the participating researchers from Woosong University for conducting a survey to prepare a draft of the TOC standards for effluent from swine-wastewater treatment facilities, as well as Deok-woo Kim, Seon-jeong Kim, Woon-il Baek, and Do-young Lim from the Watershed and Total Load Management Research Division, National Institute of Environmental Research (NIER) for conducting the field survey.

Conflicts of Interest

The authors declare no conflict of interest.

References

  1. Gollehon, N.; Caswell, M.; Ribaudi, M.; Kellogg, R.; Lander, C.; Letson, D. Confined animal production and manure nutrients. Agric. Inf. Bull. 2001, 771, 120868. [Google Scholar]
  2. Ministry of the Environment; National Institute of Environmental Research. A Study on the Preparation of Long-Term Planning (draft) for Livestock Manure Status Survey. Unpublished work. 2015. [Google Scholar]
  3. National Institute of Environmental Research. Survey and Analysis of Advanced Cases for Livestock Manure Management System Improvement. 2017. Available online: https://ecolibrary.me.go.kr/nier/#/search/detail/5682451 (accessed on 22 January 2022).
  4. Jeong, H.-S. A Study on Policy Measures for Constructing Integrated Environmental Management System (I); Ministry of the Environment. 2006. Available online: https://ecolibrary.me.go.kr/nier/#/search/detail/187628 (accessed on 20 January 2022).
  5. European Commission, Joint Research Centre; Giner Santonja, G.; Georgitzikis, K.; Scalet, B.M.; Montobbio, P.; Roudier, S.; Delgado Sancho, L. Best Available Techniques (BAT) Reference Document for the Intensive Rearing of Poultry or Pigs: Industrial Emissions Directive 2010/75/EU (Integrated Pollution Prevention and Control); Publications office. 2017. Available online: https://op.europa.eu/en/publication-detail/-/publication/f673b352-62c0-11e7-b2f2-01aa75ed71a1/language-en (accessed on 20 January 2022).
  6. National Institute of Environmental Research. Integrated Pollution Prevention and Control Reference Document on Best Available Techniques for Intensive Rearing of Poultry and Swines. 2020. Available online: https://ieps.nier.go.kr/web/board/5/885/?page=1&pMENUMST_ID=95 (accessed on 25 January 2022).
  7. United States Environmental Protection Agency. Writers’ Manual for Concentrated Animal Feeding Operations. 2012. Available online: https://www.epa.gov/sites/default/files/2015-10/documents/cafo_permitmanual_entire.pdf (accessed on 22 January 2022).
  8. Parry, R. Agricultural Phosphorus and Water Quality: A U.S. Environmental Protection Agency Perspective. J. Environ. Qual. 1998, 27, 258–261. [Google Scholar] [CrossRef]
  9. Kellogg, R.L.; Lander, C.H.; Moffitt, D.C.; Gollehon, N. Manure Nutrients Relative to the Capacity of Cropland and Pastureland to Assimilate Nutrients: Spatial and Temporal Trends of the United States; nps00-0579; USDA: Washington, DC, USA, 2000. [Google Scholar]
  10. Chhetri, T.; Cunningham, G.; Suresh, D.; Shanks, B.; Kannan, R.; Upendran, A.; Afrasiabi, Z. Wastewater Treatment Using Novel Magnetic Nanosponges. Water 2022, 14, 505. [Google Scholar] [CrossRef]
  11. Ministry of the Environment. Status Survey and Improvement Plan Preparation for Expanding Livestock Manure Bioenergy Systems. 2020. Available online: https://ecolibrary.me.go.kr/nier/#/search/detail/5717806 (accessed on 25 January 2022).
  12. Ministry of the Environment. Environmental Statistics Yearbook 2020. 2020. Available online: https://library.me.go.kr/#/search/detail/5716726?offset=1 (accessed on 24 January 2022).
  13. National Institute of Environmental Research. A Study on Master Plan for the Introduction of TOC Standards. Unpublished work. 2012. [Google Scholar]
  14. National Institute of Environmental Research. A Study on Environmental Standards Index Conversion and Management Policy Direction for Organic Matter in Public Waters. Unpublished work. 2011. [Google Scholar]
  15. Ministry of the Environment. A Study on TOC Standards Setting Method for Industrial Wastewater. 2015. Available online: https://ecolibrary.me.go.kr/nier/#/search/detail/5622547 (accessed on 21 January 2022).
  16. National Institute of Environmental Research. A Study on the Evaluation of Treatment Technology for TOC in Industrial Wastewater. 2015. Available online: https://ecolibrary.me.go.kr/nier/#/search/detail/5611217 (accessed on 20 January 2022).
  17. Ongley, E.D. Control of Water Pollution from Agriculture; Food and Agriculture Organization: Rome, Italy, 1996. [Google Scholar]
  18. Michael, I.; Rizzo, L.; McArdell, C.S.; Manaia, C.M.; Merlin, C.; Schwartz, T.; Dagot, C.; Fatta-Kassinos, D. Urban wastewater treatment plants as hotspots for the release of antibiotics in the environment: A review. Water Res. 2013, 47, 957–995. [Google Scholar] [CrossRef] [PubMed]
  19. Sgroi, M.; Roccaro, P.; Korshin, G.V.; Greco, V.; Sciuto, S.; Anumol, T.; Snyder, S.A.; Vagliasindi, F.G.A. Use of fluorescence EEM to monitor the removal of emerging contaminants in full scale wastewater treatment plants. J. Hazard. Mater. 2016, 323, 367–376. [Google Scholar] [CrossRef] [PubMed]
  20. National Institute of Environmental Research. A Study on the Preparation of TOC Standards for Effluent from Livestock Manure Purification Facilities. 2018. Available online: http://viewer.nl.go.kr:8080/main.wviewer (accessed on 25 January 2022).
  21. National Institute of Environmental Research. National Pollution Source Survey System. 2021. Available online: https://wems.nier.go.kr/ (accessed on 19 January 2022).
  22. National Institute of Environmental Research. Detailed Plan for Survey on the Status of Livestock Manure. Unpublished work. 2016. [Google Scholar]
  23. National Institute of Environmental Research. Water Pollution Process Test Method. 2021. Available online: https://www.law.go.kr/admRulSc.do?menuId=5&subMenuId=41&tabMenuId=183&eventGubun=060115#liBgcolor0 (accessed on 25 January 2022).
  24. United States Environmental Protection Agency. NPDES Permit Writers’ Manual (EPA-833-K-10-001); United States Environmental Protection Agency Office of Wastewater Management, Water Permit Division State and Regional Branch. 2010. Available online: https://www.epa.gov/sites/default/files/2015-09/documents/pwm_2010.pdf (accessed on 29 January 2022).
  25. Ministry of the Environment. National Pollution Source Survey Report. 2022. Available online: https://wems.nier.go.kr/board/viewMpReferenceInfo.do?seq=143 (accessed on 25 January 2022).
  26. Ministry of the Environment. Enforcement Regulations of the Act on the Management and Use of Livestock Excreta. 2022. Available online: https://www.law.go.kr/lsBylInfoP.do?bylSeq=10440059&lsiSeq=214717&efYd=20200220 (accessed on 18 January 2022).
  27. Ministry of the Environment. Sustainable Livestock Manure Management Measures. Unpublished work. 2018. [Google Scholar]
  28. National Institute of Environmental Research. A Study on the Preparation of TOC Standards for Effluent from Livestock Manure Treatment Facilities. 2019. Available online: https://ecolibrary.me.go.kr/nier/#/search/detail/5702718 (accessed on 25 January 2022).
  29. National Institute of Environmental Research. A Study of Environmental Pollution Sources Due to Livestock Excreta in Rural Area (Ⅴ). 2020. Available online: https://dl.nanet.go.kr/search/searchInnerList.do (accessed on 25 January 2022).
  30. Manahan, S.E. Environmental Chemistry, 7th ed.; Lewis Publisher: Boca Raton, FL, USA, 1991. [Google Scholar]
  31. Yang, W.J. Water Chemistry; Sinkwangmunhwasa: Seoul, Korea, 1995. [Google Scholar]
  32. Schoenell, E.K.; Otto, N.; Rodrigues, M.A.S.; Metzger, J.W. Removal of organic micropollutants from treated municipal wastewater by O3/UV/H2O2 in a UVA-LED reactor. Ozone Sci. Eng. 2021, 43, 1900716. [Google Scholar] [CrossRef]
  33. Sgroi, M.; Anumol, T.; Vagliasindi, F.G.A.; Snyder, S.A.; Roccaro, P. Comparison of the new Cl2/O3/UV process with different ozone-and-UV-based AOPs for wastewater treatment at pilot scale: Removal of pharmaceuticals and changes in fluorescing organic matter. Sci. Total Environ. 2021, 765, 142720. [Google Scholar] [CrossRef] [PubMed]
  34. Guillossou, R.; Roux, L.J.; Brosillon, S.; Mailler, R.; Vulliet, E.; Morlay, C.; Nauleau, F.; Rocher, V.; Gasperi, J. Benefits of ozonation before activated carbon adsorption for the removal of organic micropollutants from wastewater effluents. Chemosphere 2020, 245, 125530. [Google Scholar] [CrossRef] [PubMed]
  35. Roccaro, P.; Sgroi, M.; Vagliasindi, F.G.A. Removal of xenobiotic compounds from wastewater for environment protection: Treatment process and costs. Chem. Eng. Trans. 2013, 32, 505–510. [Google Scholar] [CrossRef]
  36. Roccaro, P. Treatment processes for municipal wastewater reclamation: The challenges of emerging contaminants and direct potable reuse. Curr. Opin. Environ. Sci. Health 2018, 2, 46–54. [Google Scholar] [CrossRef]
  37. Villarin, M.C.; Merel, S. Assessment of current challenges and paradigm shifts in wastewater management. J. Hazard. Mater. 2020, 390, 122139. [Google Scholar] [CrossRef] [PubMed]
  38. Glaze, W.H. Drinking-water treatment with ozone. Environ. Sci. Technol. 1987, 21, 224–230. [Google Scholar] [CrossRef] [PubMed]
  39. Choi, E.S. Sewage—1st treatment. In Water and Wastewater Engineering, 2nd ed.; Cheongmungak: Seoul, Korea, 2000. [Google Scholar]
  40. Lee, Y.S.; Kim, S.W.; Lee, T.W.; Yoon, J.H. Application of thermophilic aerobic digestion process for piggery wastewater treatment. In Proceedings of the Technology and Policy Symposium for Solving Livestock Wastewater Problems; Korea Federation of Environmental Societies; Korea University National Environment Lab: Seoul, Korea, 2001. [Google Scholar]
  41. Oa, S.W. Presentation on Setting TOC Standards (draft) for Effluent from Livestock Manure Treatment Facilities. Unpublished work. 2019. [Google Scholar]
  42. Ministry of the Environment. A Study on Evaluation and Management Policy Direction for Organic Matter in Public Waters. 2008. Available online: https://ecolibrary.me.go.kr/nier/#/search/detail/188846 (accessed on 25 January 2022).
  43. National Institute of Environmental Research. A Study on the Effective TMDL Management System Implementation (Ⅲ)—Revision of TMDL Technical Guideline for TOC Management. 2020. Available online: https://ecolibrary.me.go.kr/nier/#/search/detail/5703277 (accessed on 25 January 2022).
  44. Richardson, S.D.; Ternes, T.A. Water analysis: Emerging contaminants and current issues. Anal. Chem. 2018, 90, 398–428. [Google Scholar] [CrossRef] [PubMed]
  45. Jeong, D.H.; Cho, Y.S.; Ahn, K.H.; Chung, H.M.; Park, H.W.; Shin, H.S.; Hur, J.; Han, D.H. A study on the determination method of TOC effluent limitation for public sewage treatment plants. J. Korean Soc. Water Wastewater 2016, 30, 241–251. [Google Scholar] [CrossRef]
Figure 1. Surveyed livestock manure treatment facilities.
Sustainability 14 10092 g001
Figure 2. Procedure used to set TOC effluent standards for swine wastewater treatment facilities.
Sustainability 14 10092 g002
Figure 3. Changes in OM indicators from public watersheds and livestock, industrial, and municipal wastewater in Korea.
Sustainability 14 10092 g003
Figure 4. Trends of OM in a river close to an area densely populated with livestock farms.
Sustainability 14 10092 g004
Figure 5. Concentrations of TOC in nearby streams according to the density of swine farms.
Sustainability 14 10092 g005
Figure 6. Q–Q plots by effluent parameter for public treatment facilities.
Sustainability 14 10092 g006
Figure 7. Q–Q plots by effluent parameter for on-site treatment facilities.
Sustainability 14 10092 g007
Figure 8. Empirical TOC standards for public (upper) and on-site (lower) treatment facilities, showing the percentiles (left) and frequencies (right) by TOC standard.
Sustainability 14 10092 g008
Figure 9. Calculated rate of compliance with the proposed TOC standards.
Sustainability 14 10092 g009
Figure 10. Expected reduction in TOC after setting TOC standards for on-site swine-wastewater treatment facilities.
Sustainability 14 10092 g010
Table 1. Livestock manure treatment status in Korea.
LivestockOn-Site Treatment by Individual Farms (m3/day)Subcontracted, Off-Site Treatment (m3/day)Total
CompostLiquid FertilizerPurificationPublic TreatmentRecycling CompaniesLivestock Manure Treatment Companies
Total96,564.94724.95031.910,546.114,709.9531.3132,109.1
Swine26,230.84321.54879.010,082.310,352.8362.456,228.8
Korean cattle37,772.493.211.646.61395.174.439,393.3
Dairy cattle14,024.3310.0132.5359.5701.434.315,562.0
Chicken15,704.900.214.92046.257.817,824.0
Others2832.50.28.642.8214.42.43100.9
Table 2. Effluent water quality standards for livestock manure treatment facilities.
Facility TypeBOD (mg/L)COD (mg/L)SS (mg/L)Coliform (CFUs/mL)Total N (mg/L)Total P (mg/L)
Public≤30≤50≤30≤3000≤60≤8
Consignment≤30≤50≤30≤3000≤60≤8
On-site
(specific area)
Approved≤40-≤40-≤120≤40
Declared≤120-≤120-≤250≤100
On-site
(general area)
Approved≤120-≤120-≤250≤100
Declared≤150-≤150-≤400≤100
Table 3. Flow rate and BOD load by pollution source (as of 2019).
Pollution SourceGenerated Flow Rate (m3/day)Discharged Flow Rate (m3/day)BOD Generated (kg/day)BOD Discharged (kg/day)
Total20,721,28125,648,24511,315,6841,609,832
Soils-1,619,882841,578831,362
Livestock195,259227,3474,756,877411,137
Households15,742,87219,431,9153,782,075297,328
Aquaculture--48,10648,106
Industry4,753,4174,341,3001,850,49821,751
Landfills29,73327,80026,550148
Table 4. Trend in the number of livestock animals.
LivestockAnimals (1000 Heads)Increase (%)
1990200020052010201520162017
Chicken + duck74,463102,547109,628163,597173,903178,256178,081139
Swine452882148962988110,18710,36710,514132
Korean cattle162215901819292229092963299759 *
Dairy cattle504544479429428418409
Total81,207112,895120,893176,839187,442192,020192,018136
* Sum of Korean cattle and dairy cattle.
Table 5. On-site treatment facilities by Korean livestock type (as of 2016).
LivestockScaleNo. of Facilities Actually InstalledTotal Capacity of Installed Facilities (tons/day)
SwineDeclared948420
Approved28723,826.7
Korean cattleDeclared828030
Approved10980
Dairy cattleDeclared20016,580
Approved12310,870
DuckDeclared101000
GoatDeclared1100
DeerDeclared1100
HorseDeclared3260
Approved5500
ChickenDeclared5500
DogDeclared10990
Total 83172,156.7
Table 6. Comparison of TOC/OM content between livestock manure and other wastewater.
Sewage Treatment FacilitiesManure Treatment FacilitiesIndustrial Wastewater Treatment FacilitiesSwine Manure Treatment Facilities
PublicOn-Site
CODMn/TOC1.21.41.81.01.2
BOD/TOC0.80.70.71.01.1
Table 7. Multiple regression analysis of influent and effluent for public and on-site swine- wastewater treatment facilities.
Influent/Effluent by Facility TypeOM ParametersMultiple Correlation Coefficient (R)Coefficient of
Determination (R2)
Relationship
PublicInfluentBOD0.9210.848y = 1.223x
CODCr0.9390.883y = 2.743x
CODMn0.9120.833y = 1.149x
EffluentBOD0.8980.807y = 0.741x
CODCr0.9490.900y = 2.073x
CODMn0.9230.852y = 0.778x
On-siteInfluentBOD0.9130.833y = 1.134x
CODCr0.9420.887y = 2.713x
CODMn0.8600.739y = 0.929x
EffluentBOD0.9600.921y = 0.999x
CODCr0.9590.921y = 2.178x
CODMn0.9650.932y = 1.032x
Table 8. Correlations between the OM parameters of effluent by treatment facility, where n is the number of samples.
OM ParameterOn-Site Treatment Facilities
(ρ)
Public Treatment Facilities
(r)
BODCODCrCODMnDOCTOCBODCODCrCODMnDOCTOC
BOD1 10.594
(n = 120)
0.83
(n = 120)
0.566
(n = 120)
0.501
(n = 120)
CODCr0.982
(n = 80)
1 10.683
(n = 120)
0.722
(n = 120)
0.769
(n = 120)
CODMn0.984
(n = 80)
0.975
(n = 80)
1 10.635
(n = 120)
0.611
(n = 120)
DOC0.960
(n = 80)
0.957
(n = 80)
0.947
(n = 80)
1 10.944
(n = 120)
TOC0.960
(n = 80)
0.955
(n = 80)
0.944
(n = 80)
0.991
(n = 80)
1 1
Table 9. Descriptive statistics for effluent from public (A) and on-site (B) treatment facilities.
BOD (mg/L)CODCr (mg/L)CODMn (mg/L)DOC (mg/L)TOC (mg/L)
ABABABABAB
n1208012080120801208012080
Mean16.7204.443.3455.117.2213.217.8163.120.0181.1
Median16.8109.042.8252.717.1125.918.0101.719.8111.6
SD8.2222.723.4466.68.0224.99.2168.810.6193.9
Min1.110.32.018.01.28.41.06.31.68.2
Max39.3991.3112.32332.835.01180.045.2816.656.41004.0
Percentile5th4.314.111.535.34.813.94.09.34.411.3
15th7.530.819.289.18.639.78.231.29.237.9
50th16.8109.042.8252.717.1125.918.0101.719.8111.6
60th18.3119.345.6346.619.2147.219.8122.422.1127.1
70th22.3215.951.8521.621.6214.821.9154.923.8173.5
80th24.2378.260.5774.824.0345.025.2244.627.0286.4
90th28.1538.876.21036.828.0486.530.2382.931.0409.2
99th34.1952.7109.32076.834.3958.837.7752.953.8859.2
Table 10. Technology-based effluent water quality standards.
Facility TypeTOC (mg/L)
99th PercentileMean50th PercentileVFTOC
Public54.020.119.82.753.5
On-site136.275.388.21.82159.5
Table 11. Various effluent water quality standards for TOC proposed in this study.
Facility TypeTOC Review Value (mg/L)
Statistical ValueTechnology-Based ValueEmpirical Optimum RangeTentative Range
95th Percentile99th Percentile
Public52.553.539.754.040 to 55
On-site116.5159.5119.6136.2120 to 160
Publisher’s Note: MDPI stays neutral with regard to jurisdictional claims in published maps and institutional affiliations.

