Article

Mining Subsidence Prediction Model and Parameters Inversion in Mountainous Areas

1
College of Geoscience and Surveying Engineering, China University of Mining & Technology, Beijing 100083, China
2
School of Geography, Geomatics and Planning, Jiangsu Normal University, Xuzhou 221116, China
*
Author to whom correspondence should be addressed.
Sustainability 2022, 14(15), 9445; https://doi.org/10.3390/su14159445
Submission received: 24 June 2022 / Revised: 20 July 2022 / Accepted: 28 July 2022 / Published: 1 August 2022

Abstract

:
Coal mining in mountainous areas is general in China, especially in Shanxi Province. Under the influence of topography in mountainous areas, surface collapses and landslides caused by underground mining happen at a certain frequency and threaten human lives and assets. Accurate prediction of the movement and deformation of mining subsidence in mountainous areas facilitates the prevention and control of geological disasters. The probability integral method is an official prediction method for mining subsidence prediction in China, while it is lacking in the prediction accuracy in mountainous areas due to the inherent topography. Therefore, a practical prediction model based on slopes slip combined parameters optimization was proposed in this study. The slip subsidence and slip horizontal movement were deduced based on the probability integral method considering the topography (slope angle α < 30°) and geological conditions (loess covered) to build the prediction model. The dynamic step fruit fly optimization algorithm (DSFOA) was applied for parameters inversion about the probability integral method in the proposed prediction model, while the other parameters in the proposed model were determined by mechanics analysis based on the nature of losses. The determination of parameters is more efficient, objective and reasonable, so that the prediction accuracy can be improved. The measured data of the working panel 22,101 located in Taiyuan, Shanxi Province was verified by this practical model, and the result shows that the mean square error of subsidence and the horizontal movement was decreased to 71 mm and 276 mm, respectively, hence, the applicability of the proposed mining subsidence prediction model in mountainous areas is verified. This work will contribute to a comprehensive understanding on the law of surface movement and provide theoretical guidance for surface damage prevention and control in mountainous mining areas.

1. Introduction

China is the second largest economy and the largest developing country in the world, and consumes a huge amount of energy. As a non-renewable resource, coal provides an important energy carrier for industrial production and social life in China. Even though the demand ratio of coal decreases due to the gradual use of the green energy, it still plays an important role in the structure of world energy [1]. According to the China Renewable Energy and Sustainable Energy Development Report, the proportion of coal will not fall below 50% by 2050. In China, the distribution of coal resources in the west such as Shanxi, Shaanxi, and Inner Mongolia is greater than that in the east. What’s more, the coal in the east is being gradually depleted, making the amount of mining in the west increase.
Coal mining has effectiveness in gaining energy for economic construction, but it would threaten human safety and social stability by causing surface collapse, landslides, destruction of agricultural cultivated land, ecological damage [2,3], especially in the west of China due to the fragile ecological environment [4,5,
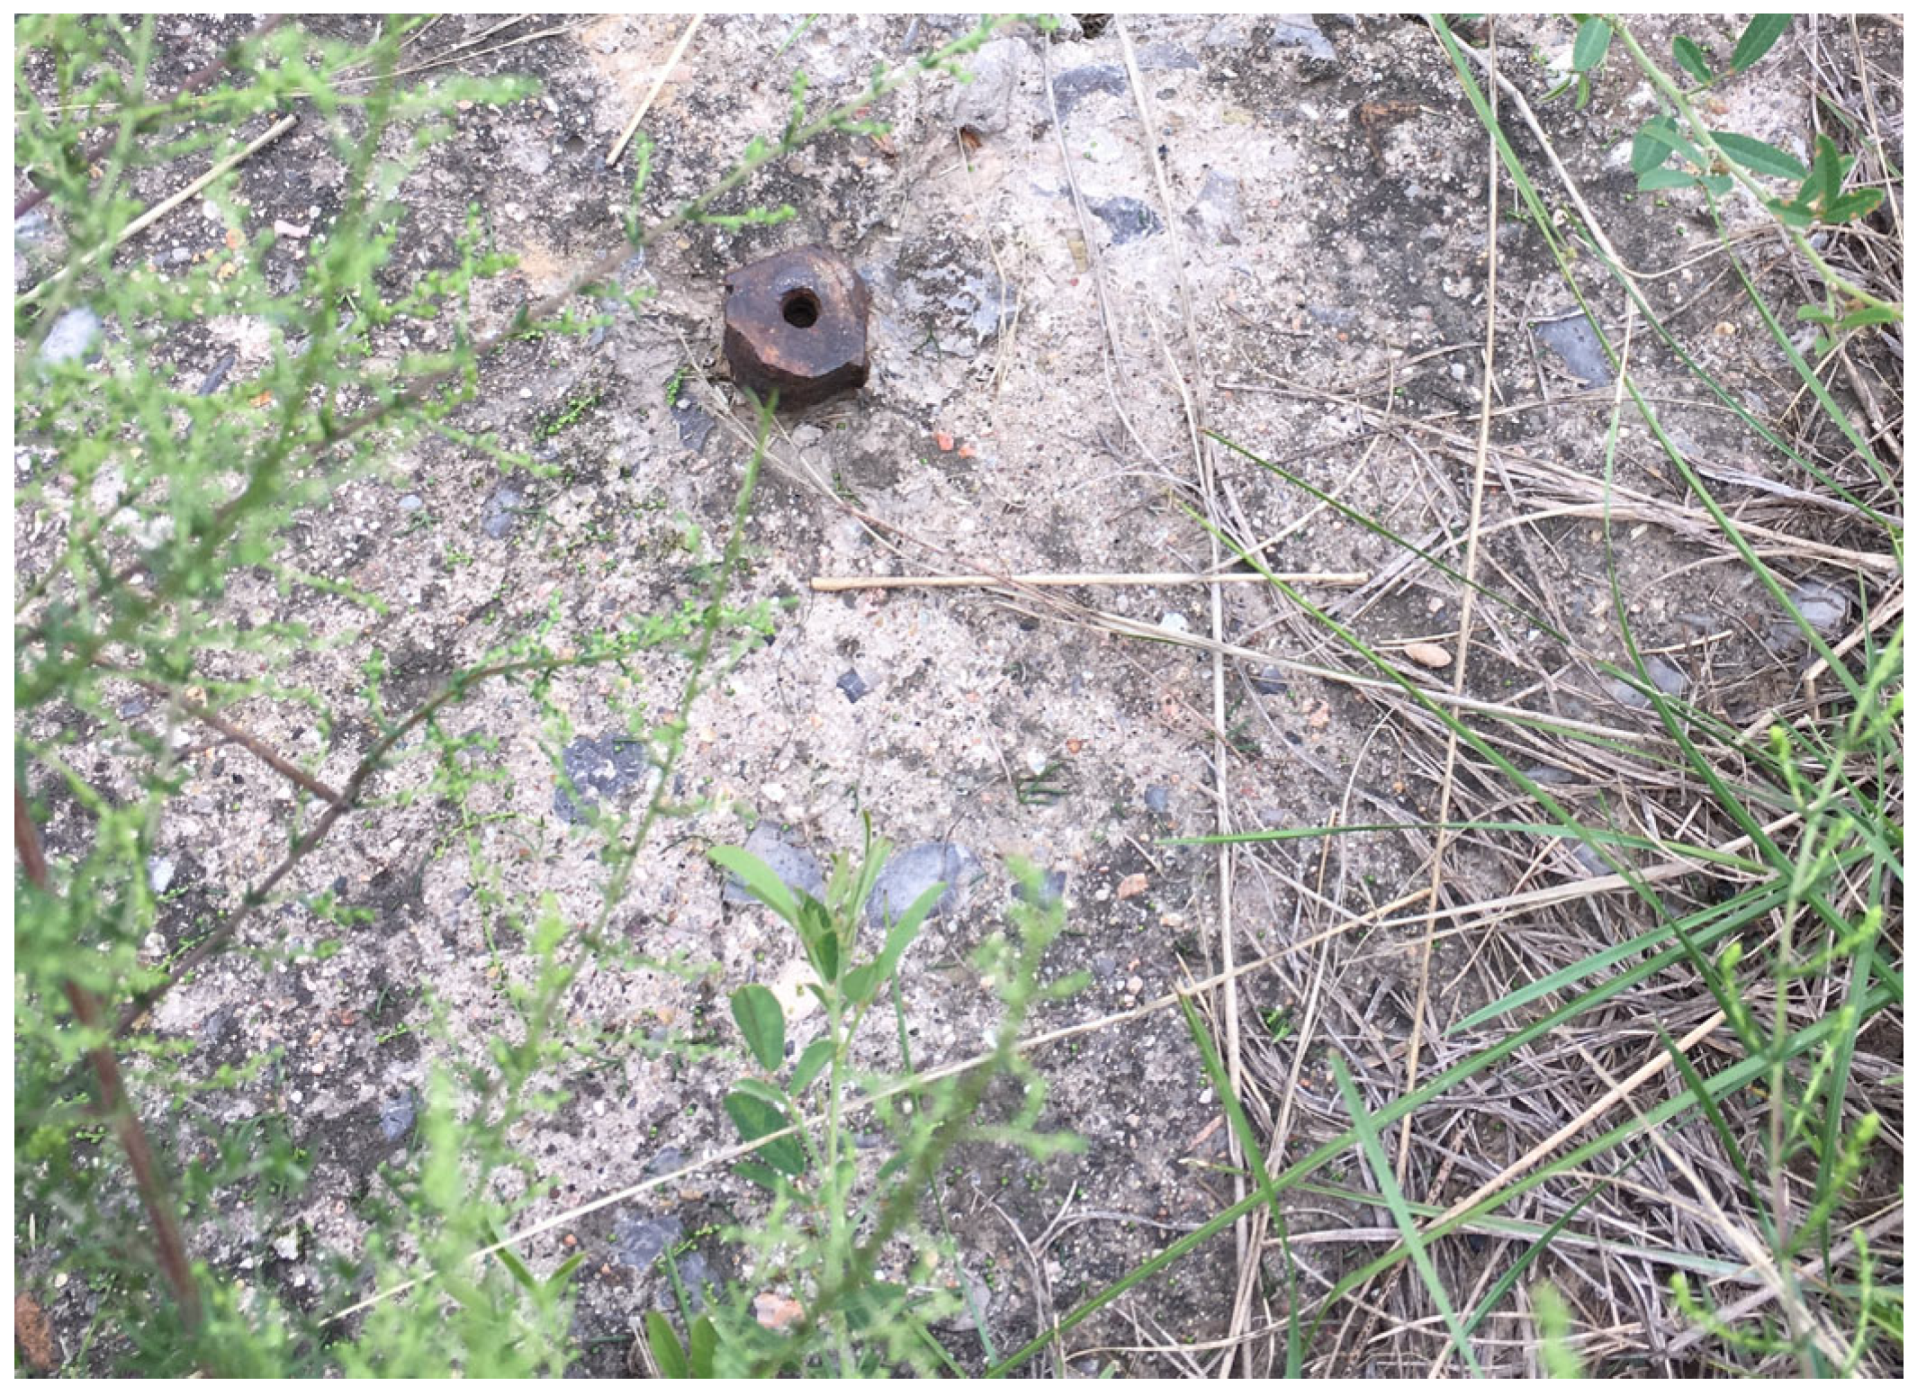
6], surface damage under the influence of mining is mainly characterized by mining-induced fractures, as shown in Figure 1. For surface cracks caused by coal mining, Yang found that the ground cracks were formed ahead of the working face and developed rapidly during the period of the breakage of the immediate roof by field monitoring methods [7]. By means of field measurement and similar material simulation experiments, Zhou found that ground cracks are caused by strata deformation, but the formation of ground cracks can promote the deformation of strata. They also found that the horizontal tension deformation is the most stable factor for predicting ground cracks regardless of excavation speed [8]. By means of unmanned aerial vehicles, ground penetrating radar, and real-time kinematic and manual measurements, He and Zhao found that ultra large mining height longwall panel extraction causes a greater ground subsidence and horizontal deformation than those of the conventions, resulting in more severe damage in the permanent margin area [9]. Lian used field investigation, theoretical analysis and the particle flow code 2D numerical simulation method to study the movement of overburdened and discontinuous ground deformation of mining areas with a thick loess layer and a thin bedrock [10]. These adverse effects are closely related with the surface movements and discontinuous deformation caused by underground mining in mountainous areas. Therefore, it is important to study the law of surface movement in mountainous mining areas according to the mining subsidence theory [11], so that some necessary actions can be taken to protect the environment based on the precise movement laws.
Mining subsidence prediction is the core of mining subsidence theory, and includes theoretical methods, empirical methods, and experimental methods. The theoretical methods are elastoplastic theory, stochastic medium theory and the numerical calculation method, which have complex formulas and too many parameters related to the nature of rock strata which are not practical for engineering. The empirical methods need too much measured data and the method is useful for a typical mine; they do not have generality. The experimental methods mainly include similar material simulation experiments which are expensive and time-consuming. Compared with the methods above, the probability integral method is an official prediction method in China for its simpler mathematical expressions and clear-meaning parameters. It was first introduced to the strata movement research by the Polish scholar J. Litwiniszyn in the 1950s. Later, it was developed by Chinese scholars Liu Baochen and Liao Guohua. The probability integral method is based on the characteristics of horizontal and homogeneous media. It is accurate to predict coal mining whose coal seam dip angle is less than 5° in plain areas [12,13].
Due to the inherent landforms of mountainous areas, the surface movement and deformation caused by underground coal mining includes continuous deformation such as cracks and landslides, causing the situation to be very complicated [14,15]. The probability integral method is lacking in the prediction accuracy in mountainous areas. In this regard, further research on the prediction model of surface movement in mountainous mining areas is essential.
In the past decades, considerable research efforts have been devoted to the research on the prediction model of mining subsidence in mountainous areas. He and Kang analyzed the measured data of multiple ground movement observation lines in the mountainous areas represented by the Yangquan mining area in Shanxi, China. They compared data with the data in the plain areas and concluded that movement and deformation of the surface are related to the inclination direction of the surface and the nature of the topsoil [16,17]; then, the movement of the mountainous surface is considered to be the superposition of the mining influence component and the mining slip component from the perspective of the vector [18]. The “slide influence function method” and “stress-strain” model is established for predicting the surface movement in mountainous areas; mathematical analysis and mechanical derivation were then conducted to build the relationship between movement, deformation and topographic features caused by the mining slips. Finally, they proposed a mathematical model for predicting surface movement and deformation in mountainous areas that it is suitable for horizontal or near-horizontal coal seam mining with the average slope angle of surface less than 30° [19]. However, the existing mining subsidence prediction model in mountainous areas still has some shortcomings, and surface cracks caused by mining mean that the predicted results have a large discrepancy with the measured data, as the mechanism for the influence of topography on the laws of surface movement and deformation in mountainous areas have not been studied clearly.
At the same time, there are a lot of parameters in a prediction model, and the accuracy of prediction results also depends on the rationality of the prediction parameters. For the acquisition of parameters in a model, conventional methods are susceptible to problems such as parameter divergence and local optimization. The problem of obtaining the expected parameters is still to be solved. A typology of the parameters inversion methods about the probability integral method is commonly summarized as two sets of algorithms, the traditional one and the intelligent optimization method. The tradition methods include the linear least square and pattern search method, which have good accuracy for the linear model. However, when facing the nonlinear model like the probability integral method studied in this paper, there are problems such as high initial value requirements, divergence during the solution, and easy to be in the local optimal solution mainly because of the correlation between parameters. The intelligent optimization methods, including genetic algorithm, particle swarm optimization (PSO), and simulated annealing algorithm (SAA) provide effective solutions in the non-linear model since they partially overcome the weakness of traditional methods in divergence. Zha and Li demonstrated these advantages of the GA by comparing with the performance of the least square and pattern search method in parameters inversion in the probability integral method under complex conditions [20,21]. These advantages were also verified with other intelligent methods, including PSO [22], SAA [23], quantum annealing [24,25,26], and the fireworks algorithm [27], The invasive weed optimization [28].
Considering that problems still exist in the classic intelligent optimization algorithms, such as slow convergence speed, a large amount of calculation, and easy to fall into local optimum, it is necessary to innovate a new method in parameter inversion. The fruit fly optimization algorithm (FOA), as one of the effective population-based metaheuristic approaches proposed by Pan [29,30,31], has been successfully applied in many regions such as stochastic multi-objective integrated disassembly-reprocessing reassembly scheduling [32], forecasting and optimizing agrobacterium-mediated genetic transformation [33], solving the multi-functional heterogeneous UAV cooperative mission planning problem [34], and short-term traffic flow prediction [35], while fewer scholars connect the FOA with the parameters inversion in mining subsidence.
To improve the performance of the FOA associated with the initial fruit fly swarm location, the population size, step length. In order to increase the universality of the FOA, scholars have proposed many improved methods to make the algorithm improve in terms of the computational complexity, stability and accuracy [30,36,37,38,39,40]. For the step length, if it is large, the global optimization performance is improved, the local optimization performance is declined, and vice versa. The constant step length makes the FOA unable to converge to an optimal solution rapidly. In this paper, a dynamic step is proposed based on the FOA to improve the performance of the algorithm. The search step in each iteration is related to the ratio of the best smell concentration value of the current and previous generations.
Accurate prediction of the movement and deformation of mining subsidence in mountainous areas facilitates the prevention and control of geological disasters, therefore, it is necessary to build a mining subsidence prediction model in mountainous areas based on the probability integral method, taking the mountain topography (slope angle α < 30°) and geological conditions (loess covered) into account. Simultaneously, it is important to select an effective parameters inversion method of the probability integral method; the prediction accuracy of mining subsidence prediction model in mountainous areas can be enhanced with the two aspects above. In this study, a practical prediction model in mountainous areas is proposed, and the probability integral method and slopes slip analysis are combined in the proposed model. The intelligent optimization algorithm and mechanics analysis are applied for the determination of parameters in the proposed model, the acquisition of parameters is more efficient, and the values of parameters are more objective and reasonable. The contributions of this study can be summarized as follows: (1) the theoretical model considering slopes slip (slip subsidence ΔW, slip horizontal movement ΔU) in mountainous areas based on the probability integral method is established, the effect of the influence of topography is considered in this model combined with the slope angle and nature of topsoil; (2) The more accurate parameters of the probability integral method in the proposed model are obtained by the algorithm of parameters inversion which is the dynamic step fruit fly optimization algorithm (DSFOA); and (3) The other parameters about slopes slip are determined by mechanics analysis based on the nature of soil, which is more objective and reasonable.

2. Methodology

2.1. Probability Integral Method

The probability integral method is based on the stochastic medium theory, which was first introduced to strata movement research by the Polish scholar J. Litwiniszyn in the 1950s. Later, it was developed by Chinese scholars Liu Baochen and Liao Guohua et al. into a probability integral method [41].
The movement law of the stochastic medium theory can be abstracted into the theoretical model shown in Figure 2. The granular medium can be comprehended as a small and uniform ball, assuming that the first layer of ball C is taken away, then the probability of the second layer of two balls A and B falling into the space is 1/2 separately, and so on the probability of the movement of balls in each layer. The probability distribution fitting a curve can be seen to be close to the standard normal distribution probability density curve.
Referring to Figure 3a, considering the two-dimensional condition, surface subsidence caused by underground unit mining We(x) is shown in Equation (1):
W e ( x ) = 1 r e π x 2 r 2
Considering that the assumption of the volume is constant, shown in Equation (2), surface horizontal movement caused by underground unit mining Ue(x) is shown is shown in Equation (3):
e = ε x + ε z = U e ( x , z ) x + ( W e ( x , z ) z ) = 0
U e ( x ) = B d W e ( x ) d x = b r i ( x )
where εx is the linear strain along the x direction, εz is the linear strain along the z direction. Minus “−” represents the w-axis is opposite to the Z-axis. B = b·r, b is the horizontal movement coefficient, r is the major influence radius(m), i(x) is the inclination.
As shown in Figure 3b, assuming that the coal seam is inclined, the calculation formula of subsidence value of surface point A(x,y) caused by mining unit B(s,t) is shown in Equation (4):
W e ( x , y ) = 1 r 2 e π ( x s ) 2 + ( y t + H cot θ 0 ) 2 r 2
where r is the major influence radius (m); θ0 is the mining influence propagation angle (°); H is the average mining depth (m).
According to the superposition principle, the subsidence of a point A caused by the whole mining area is:
W ( x , y ) = w 0 R W e ( x , y ) d s d t
where w0 = mqcosγ is the maximum surface subsidence value under the critical extraction, m is the thickness of coal seam (m), q is the subsidence coefficient, and γ is the average dip angle of coal seam (°), R represents the mining region.
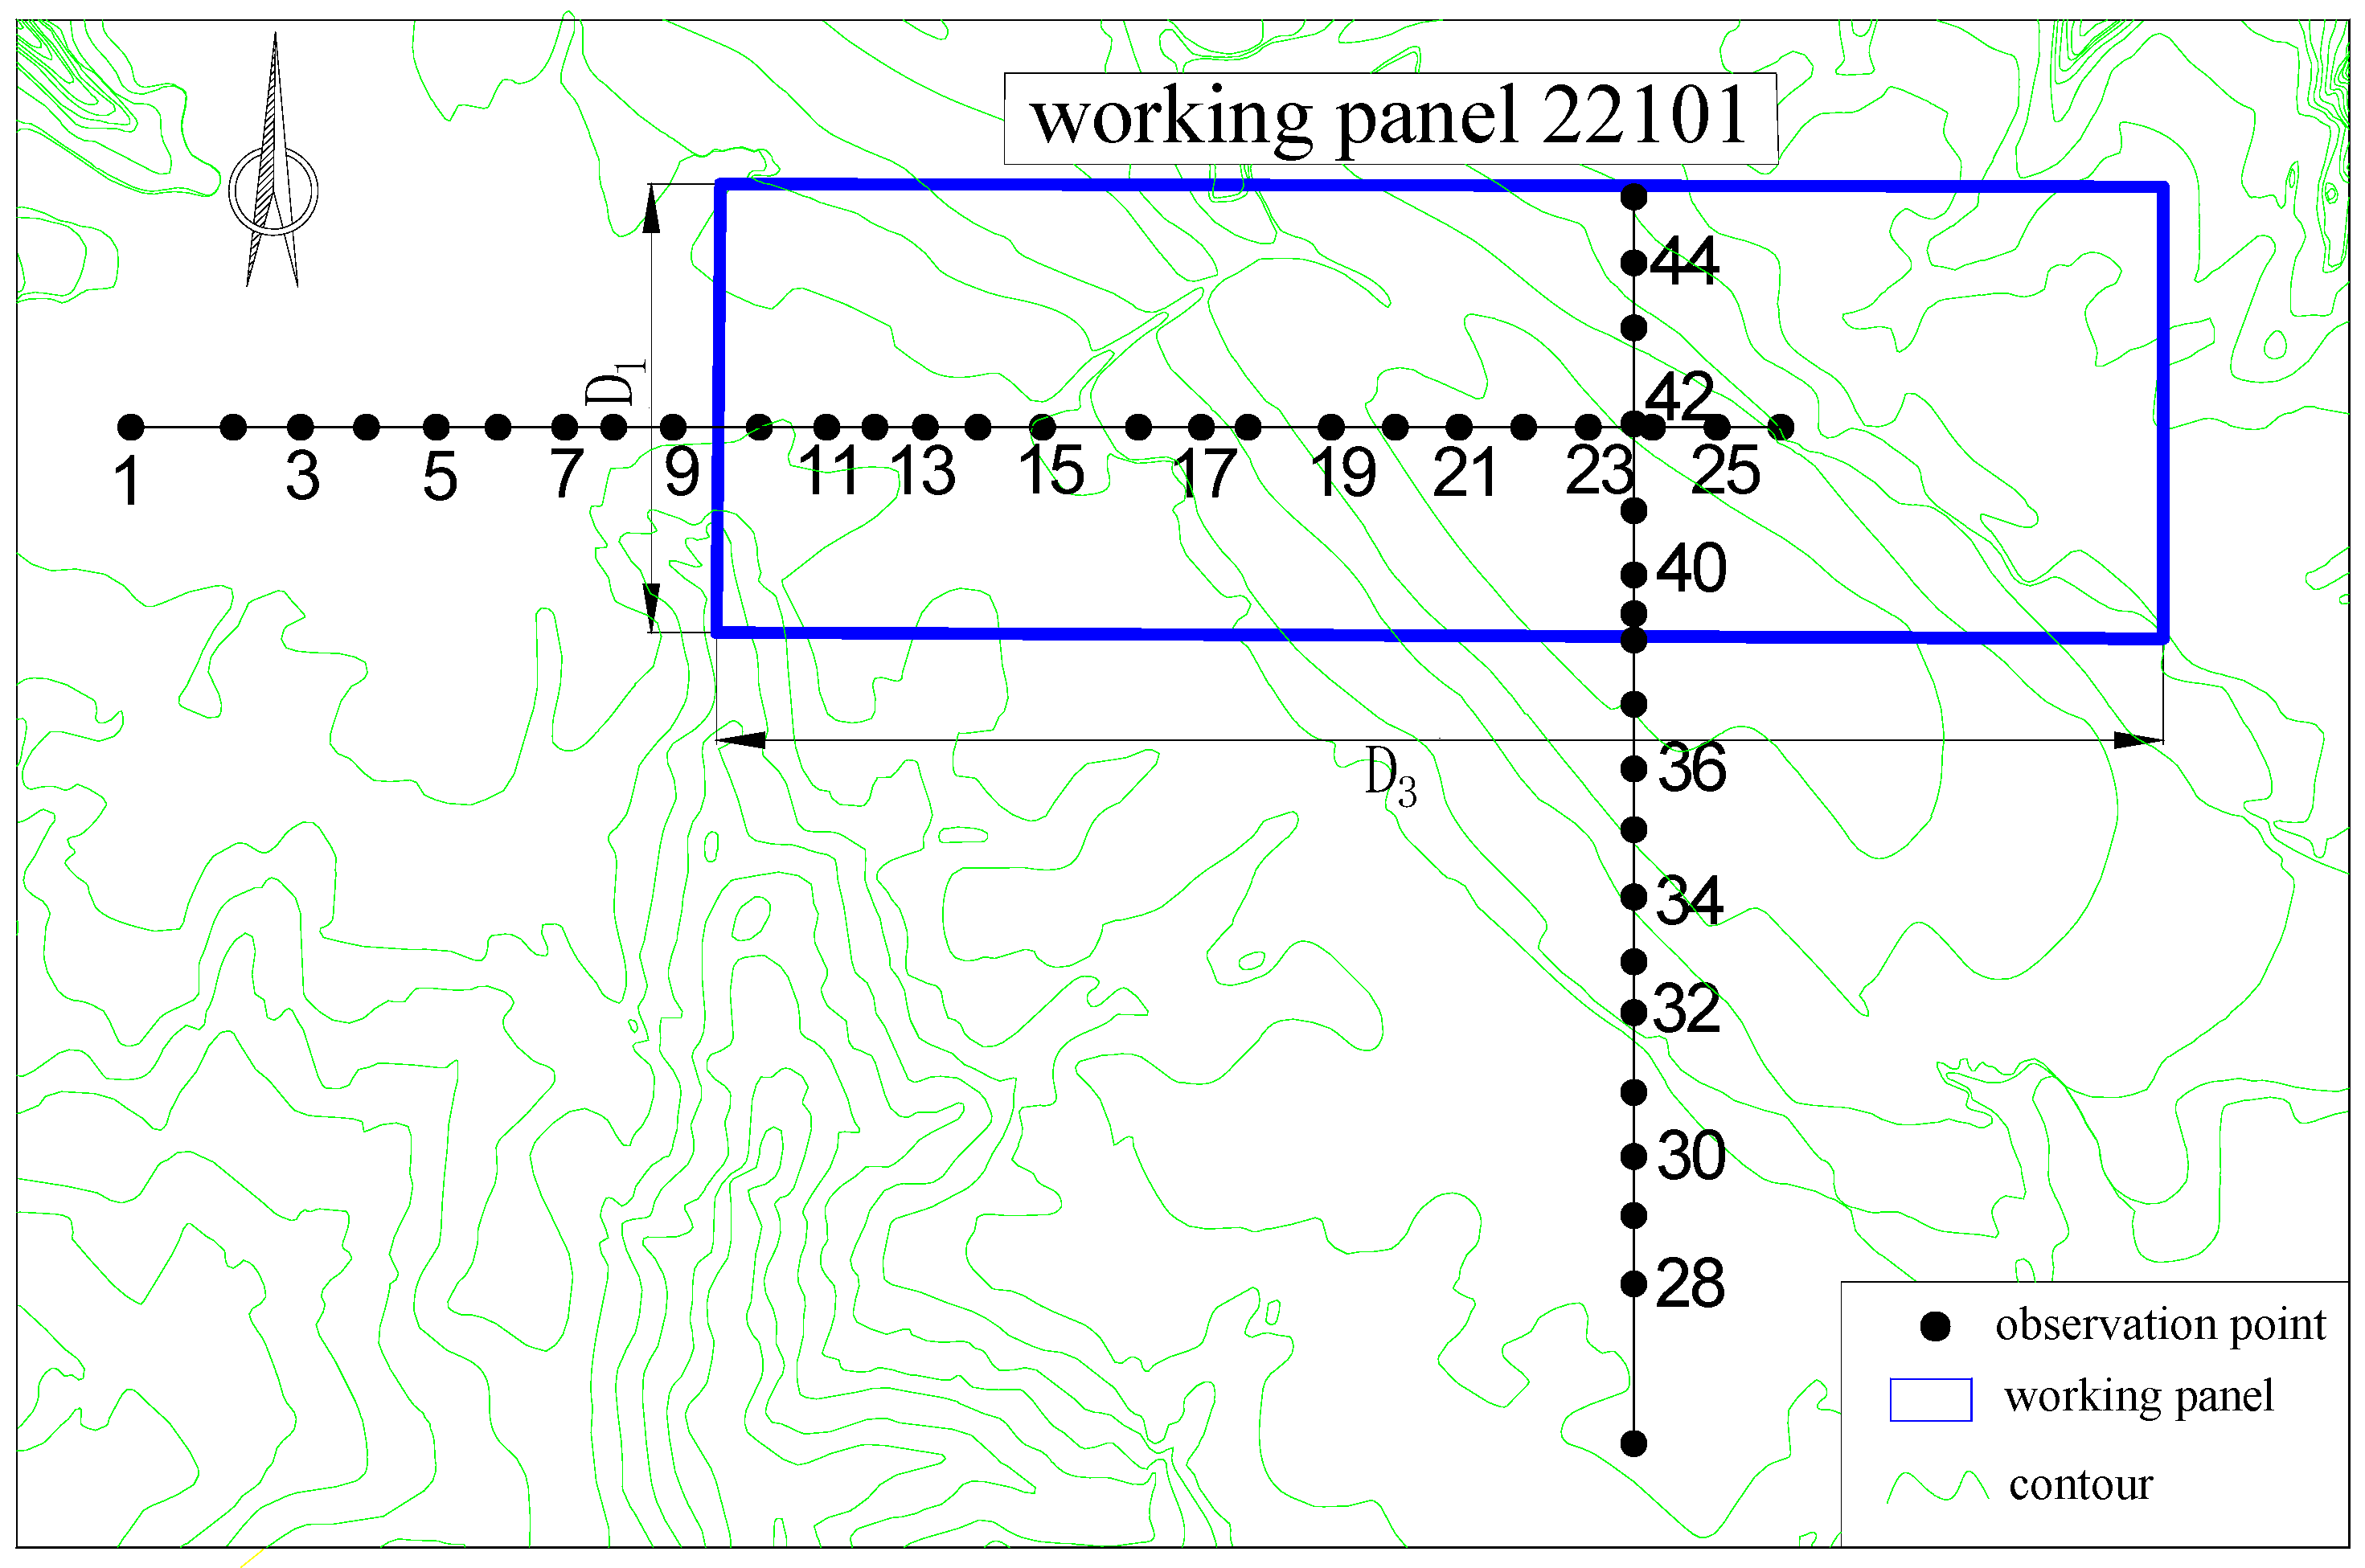
For the rectangular working panel, the surface subsidence W(x,y) is:
W ( x , y ) = w 0 0 D 3 0 D 1 W e ( x , y ) d s d t = 1 w 0 w 0 ( x ) w 0 ( y )
w 0 ( x ) = w 0 2 { e r f ( π tan β H x ) - e r f [ π tan β H ( x l ) ] }
w 0 ( y ) = w 0 2 { e r f ( π tan β H y ) - e r f [ π tan β H ( y L ) ] }
l = D 3 s 3 s 4
L = ( D 1 s 1 s 2 ) sin ( θ 0 + α ) sin θ 0
r = H tan β
where D1 and D3 are the inclination and strike lengths of the working panel; s1, s2, s3, and s4 are the inflection point offsets of downhill, uphill, left, and right borders; tanβ is the main influence tangent.
The inclination i(x,y,φ) of a point A(x,y) on the surface in φ direction (the angle that the positive x-axis counterclockwise to the specified direction, in Figure 3b is as follows:
i ( x , y , φ ) = W ( x , y ) x cos φ + W ( x , y ) y sin φ
For the horizontal movement U(x,y,φ), the curvature K(x,y,φ) and horizontal deformation ε(x,y,φ) of a point A(x,y) in φ direction can be obtained by Equations (13)–(15).
U ( x , y , φ ) = b r i ( x , y , φ )
K ( x , y , φ ) = i ( x , y , φ ) x cos φ + i ( x , y , φ ) y sin φ
ε ( x , y , φ ) = b r K ( x , y , φ )

2.2. Fruit Fly Optimization Algorithm

The fruit fly optimization algorithm (FOA) is a new swarm intelligent optimization algorithm proposed by professor Pan Wen-Tsao based on the cooperative and competitive behavior of fruit flies in the food finding process.
The fruit fly itself is superior to other species in sensing and perception, especially in osphresis and vision. According to the process of fruit flies foraging through the senses, the basic principle of the fruit fly optimization algorithm [30] follows by two steps:
First is the rough positioning stage by osphresis: they judge the approximate position of the food based on scents floating in the air and fly towards the target.
Second is the precise positioning stage by vision: when fruit flies fly around the food and are able to visualize within the search range, they can accurately determine the specific location of the food, and they finally fly to the food.
The detail processes are considered as follows:
Step 1: Initialize parameters. First, the initial fruit fly swarm location (X-axis, Y-axis), the maximum iteration number (maxgen), the population size (sizepop), the random direction rand( ) and step length k should be considered.
{ X i = X a x i s + 2 k r a n d ( ) k Y i = Y a x i s + 2 k r a n d ( ) k
Step 2: Evolution starting. The generation = 0, the random flight path and the route for food finding of a single fruit fly are considered.
Step 3: Preliminary computations. The specific direction of the food is determined by calculating the distance Disti of the individual fruit fly from the initial position. Subsequently, smell concentration judgment value Si is determined. Then, the fitness function value (also called the smell concentration Smelli) is calculated.
{ D i s t i = ( X i X a x i s ) 2 + ( Y i Y a x i s ) 2 S i = 1 / D i s t i
S m e l l i = F u n c t i o n ( S i )
Step 4: Record the optimal individual and the location. Compare the smell concentration values of fruit flies in the current population and mark the fruit fly individual with the highest (or lowest) smell concentration as the optimal fruit fly individual. Record and keep the best smell concentration value bestSmell and the coordinates position (X, Y) of the optimal fruit fly individual. The fruit fly swarm will use vision to fly towards that position:
[ b e s t S m e l l , b e s t I n d e x ] = min / max ( S m e l l i )
S m e l l b e s t = b e s t S m e l l X a x i s = X ( b e s t I n d e x ) Y a x i s = Y ( b e s t I n d e x )
Step 5: Iteration stops. Consider generation = generation + 1, the fitness function value is determined again. Judge if the smell concentration is superior to the previous iterative smell concentration. When the generation attains the maximum iteration number, and the optimized parameter value of the specific model can be reached. Otherwise, the optimization process should go back to Step 2.

2.3. Dynamic Step Fruit Fly Optimization Algorithm

The performance of the FOA is associated with the initial fruit fly swarm location, the population size, and step length. In order to increase the universality of the FOA, scholars have proposed many improved methods to make the algorithm improve in terms of computational complexity, stability and accuracy [31,37,38,39,40,41]. For the step length, if it is large, the global optimization performance is improved, the local optimization performance is declined, and vice versa. The constant step length makes the FOA unable to converge to an optimal solution rapidly. In this paper, the dynamic step fruit fly optimization algorithm (DSFOA) was applied for parameters inversion in the proposed prediction model to improve the performance of the algorithm. The search step in each iteration is related to the ratio of the best smell concentration value of the current and previous generations. The improved search step of the FOA is as follows (take the minimum smell concentration as an example).
Let g be the number of iterations, kg be the search step length of the gth iteration, Sg be the optimal smell concentration value of the gth iteration, Δ = |S′gS′g−1|;
When g = 1, k1, S′1 is calculated;
When g ≥ 2, if S′g < S′g−1, it indicates that the current optimal smell concentration value is better than the previous generation optimal smell concentration value, the step should be shorted to improve the optimization accuracy, then
k g + 1 = k g ( 1 S g S g 1 )
if SgSg−1, it indicates that the optimal smell concentration value of the previous generation is better than or equal to the current optimal smell concentration value. The step should be enlarged to increase the search range and improve the global search ability.
k g + 1 = k g ( 1 + S g 1 S g )
The horizontal movement U is mainly affected by topography in mountainous areas, the distribution law of the horizontal movement is relatively complicated, the law of subsidence is relatively simple and clear due to its unvaried vertical downward direction. The prediction parameters q, tanβ, θ0, si (i = 1, 2, 3, 4) related to the subsidence values were inversed first, and the horizontal movement coefficient b related to the horizontal movement U was obtained separately.
Set p = [q tanβ θ0 s1 s2 s3 s4], P is the search space of vector p (the value range of the prediction parameters), and the optimization principle which is used as the fitness function(fp) is the minimum mean square error (MSE) between fitting values of the probability integral method whose parameters are obtained by DSFOA and the measured data of the corresponding n points. fp is shown in Equation (23):
min f p = i = 1 n ( W i w i ) 2 n
where Wi is the measured subsidence values, wi is the fitting subsidence values, and n is the number of observation points.
Set the search range and step length of the parameter vector p. The procedure of prediction parameters inversion of the probability integral method based on the subsidence values is as follows:
(1)
Set the parameters such as the initial populations number and the maximum iteration number, and generate the initial population according to the range of the probability integral method parameter vector p. The position of initialization population is the initial solution of the N-dimensional vector, and N is the number of parameters optimized (N = 7).
(2)
Calculate the fitness function value, combine the information of the working panel to the mining subsidence of the probability integral method and update the step.
(3)
In each iteration process, judge and select the population with the optimal fitness value, and loop until the optimal solution is found.
Then, the horizontal movement coefficient b is inversed, and the fitness function(fp) as in Equation (24):
min f p = i = 1 n ( U i u i ) 2 n
where Ui is the measured horizontal movement values, ui is the fitting horizontal movement values, and n is the number of observation points.

2.4. Prediction Model of Mining Subsidence in Mountainous Areas Considering Slopes Slip

The surface of the mountainous areas affected by mining will produce discontinuous deformation, especially ground fissures. During the development of the surface movement, slopes slip can occur easily, which has an obvious impact on the law of surface movement and deformation in mountainous areas.
The formation mechanism of tensile mining fissures and slopes slip are combined to analyze a prediction model of mining subsidence in mountainous areas considering that slopes slip is established in this section.

2.4.1. Expression of Movement Vector and Slopes Slip Vector

The reason why the law of surface movement and deformation in mountainous areas is different from that of plain areas is mainly due to the effect of the additional slopes slip caused by topography. In order to explore the law of mining subsidence in mountainous areas, the movement vector is introduced, as shown in the right of Figure 4.
The movement vector Ri(x,y) at a point Pi on the mountainous surfaces under the influence of coal mining can be regarded as the sum of the movement vector Ri(x,y) produced by mining in the plain areas and slopes slip vector ΔRi(x,y) on the mountainous surface. It can be expressed as the superposition principle shown in Equation (25):
R ( x , y ) = R ( x , y ) + Δ R ( x , y )
where:
R ( x , y ) = W ( x , y ) + U ( x , y )
Δ R ( x , y ) = Δ W ( x , y ) + Δ U ( x , y )
In the left part of Figure 4, W′(x,y) and U′(x,y) represent the measured subsidences and horizontal movements, W(x,y) and U(x,y) represent the subsidence and horizontal movements of plain areas under similar geological and mining conditions which can be evaluated with the probability integral method, ΔW(x,y) and ΔU(x,y) represent the slip subsidence and slip horizontal movement affected by mountain topography, which are deduced in Section 2.4.2.

2.4.2. Establishment of the Mining Subsidence Prediction Model

In this section, the slip subsidence ΔW(x,y) and the slip horizontal movement ΔU (x,y) are deduced based on the subsidence W(x,y), the horizontal movement U(x,y),the inclination i(x,y,φ) and horizontal deformation ε(x,y,φ) in the probability integral method, then the mining subsidence prediction model in mountainous areas is established based on the W(x,y), U(x,y), ΔW(x,y) and ΔU(x,y). According to Equation (29):
R ( x , y ) = W 2 ( x , y ) + U 2 ( x , y )
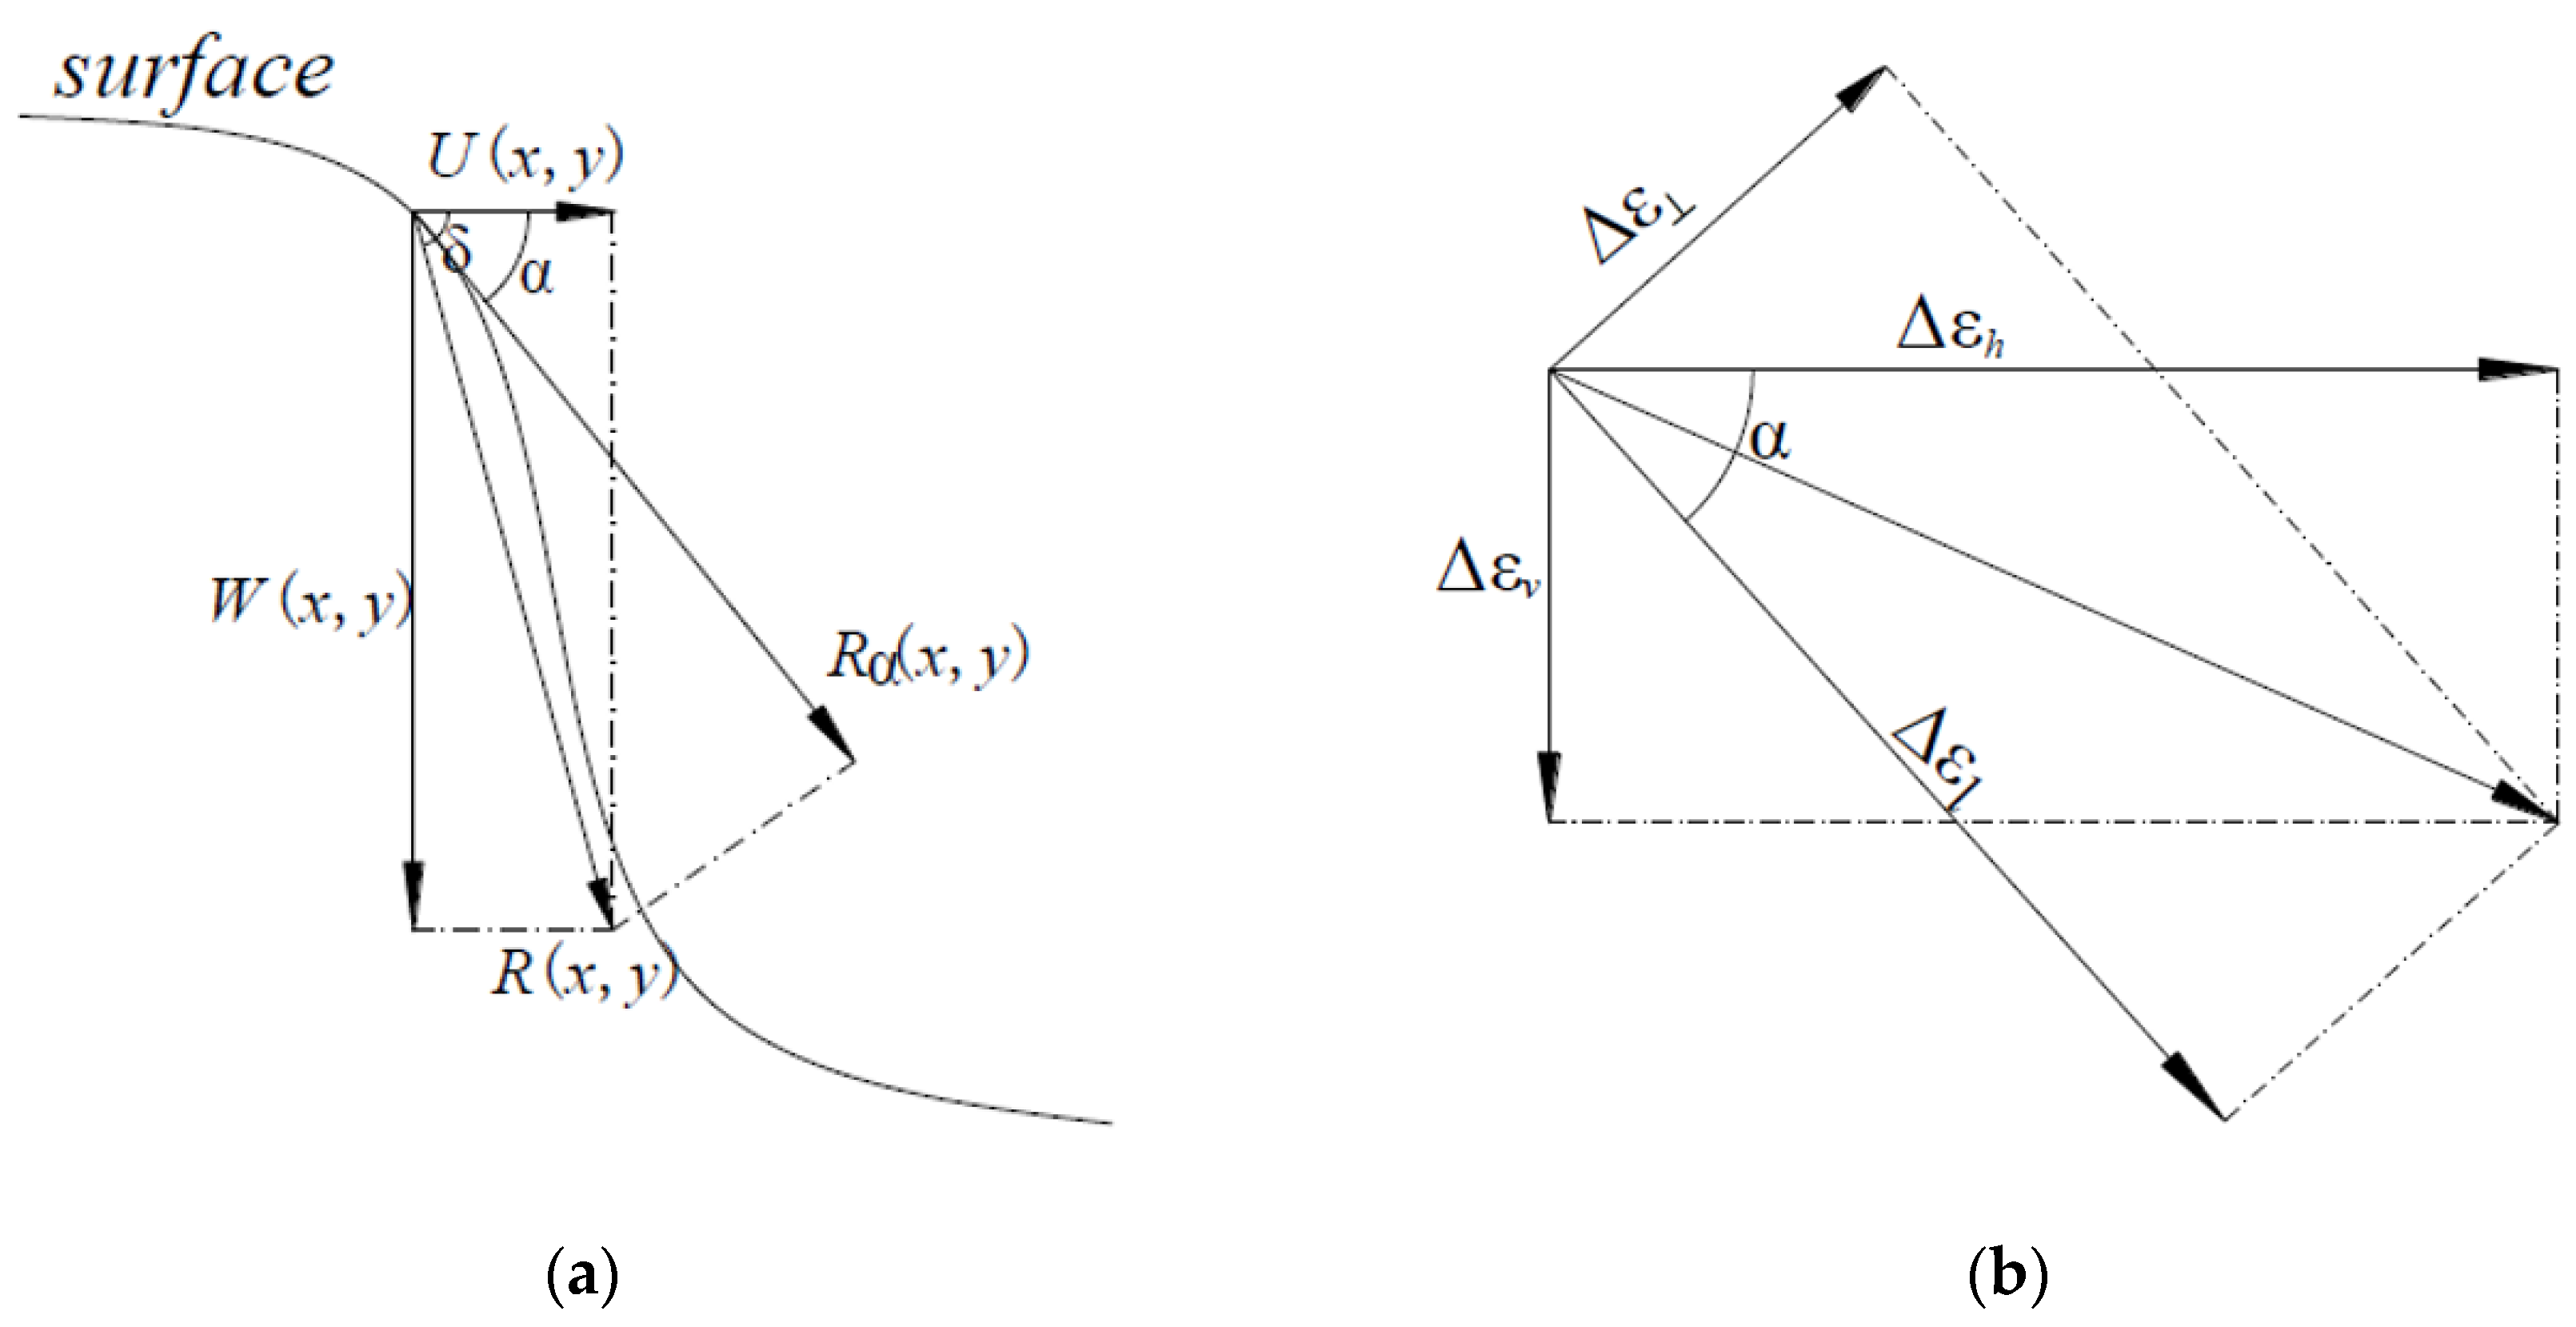
Since the slip vector ΔR(x,y) is the additional slip caused by the mining vector R(x,y), the component of the mining vector Rα(x,y) along the inclination direction of the surface slope determines the magnitude of the slip vector ΔR(x,y) (Figure 5a).
From Figure 5a, we can deduce:
Δ R ( x , y ) = K S R α ( x , y ) = K S R ( x , y ) cos ( δ α )
where Ks is the surface characteristic coefficient, which is related to the topography and surface soil properties, δ is the angle between the mining vector R(x,y)and the horizontal movement component U(x,y), and its value is
δ = tan−1 (W(x,y)/U(x,y)), α is the slope angle of the surface.
Square both sides of the equation and make the partial derivatives of l on both sides:
Δ R ( x , y ) Δ R ( x , y ) l = K S 2 cos 2 ( δ α ) R ( x , y ) R ( x , y ) l
where l is the length along the inclination direction of the slope.
As ∂l = ∂x/cosα, from Equations (30) and (31), we have:
Δ R ( x , y ) l = K S cos ( δ α ) cos α R ( x , y ) x
Square both sides of the Equation (29) and make the partial derivative of x:
R ( x , y ) x = W ( x , y ) R ( x , y ) W x + U ( x , y ) φ R ( x , y ) U x
According to the probability integral method, ∂W/∂x = i(x,y)x, ∂U/∂x = ε(x,y)x, φ = 0°.
R x = W ( x , y ) R ( x , y ) i ( x , y ) x + U ( x , y ) φ R ( x , y ) ε ( x , y ) x
For W(x,y)/R(x, y) = sin δ, U(x,y)/R(x,y) = cos δ, we have:
Δ R l = K S cos ( δ α ) cos α [ sin δ i ( x , y ) x + cos δ ε ( x , y ) x ]
We suppose Δεl = ∂ΔR/∂l, it is the deformation of the slip vector along the l direction.
According to the concept of the Poisson’s ratio, the deformation along the direction perpendicular to the slope direction is:
Δ ε = μ Δ ε l
where µ is Poisson’s ratio for the topsoil.
In Figure 5b, we have Equations (37) and (38):
Δ ε h = Δ ε l cos α + Δ ε sin α = Δ ε l ( cos α + μ sin α )
Δ ε v = Δ ε l sin α Δ ε cos α = Δ ε l ( sin α μ cos α )
Considering Equations (37) and (38), slip horizontal movement ΔU and slip subsidence ΔW are shown below:
Δ U = Δ ε h d x = K S cos ( δ α ) cos α [ sin δ W ( x , y ) + cos δ U ( x , y ) φ ] ( cos α + μ sin α )
Δ W = Δ ε v d x = K S cos ( δ α ) cos α [ sin δ W ( x , y ) + cos δ U ( x , y ) φ ] ( sin α μ cos α )

2.4.3. Calculation of the Values of the Parameters in the Mining Subsidence Model

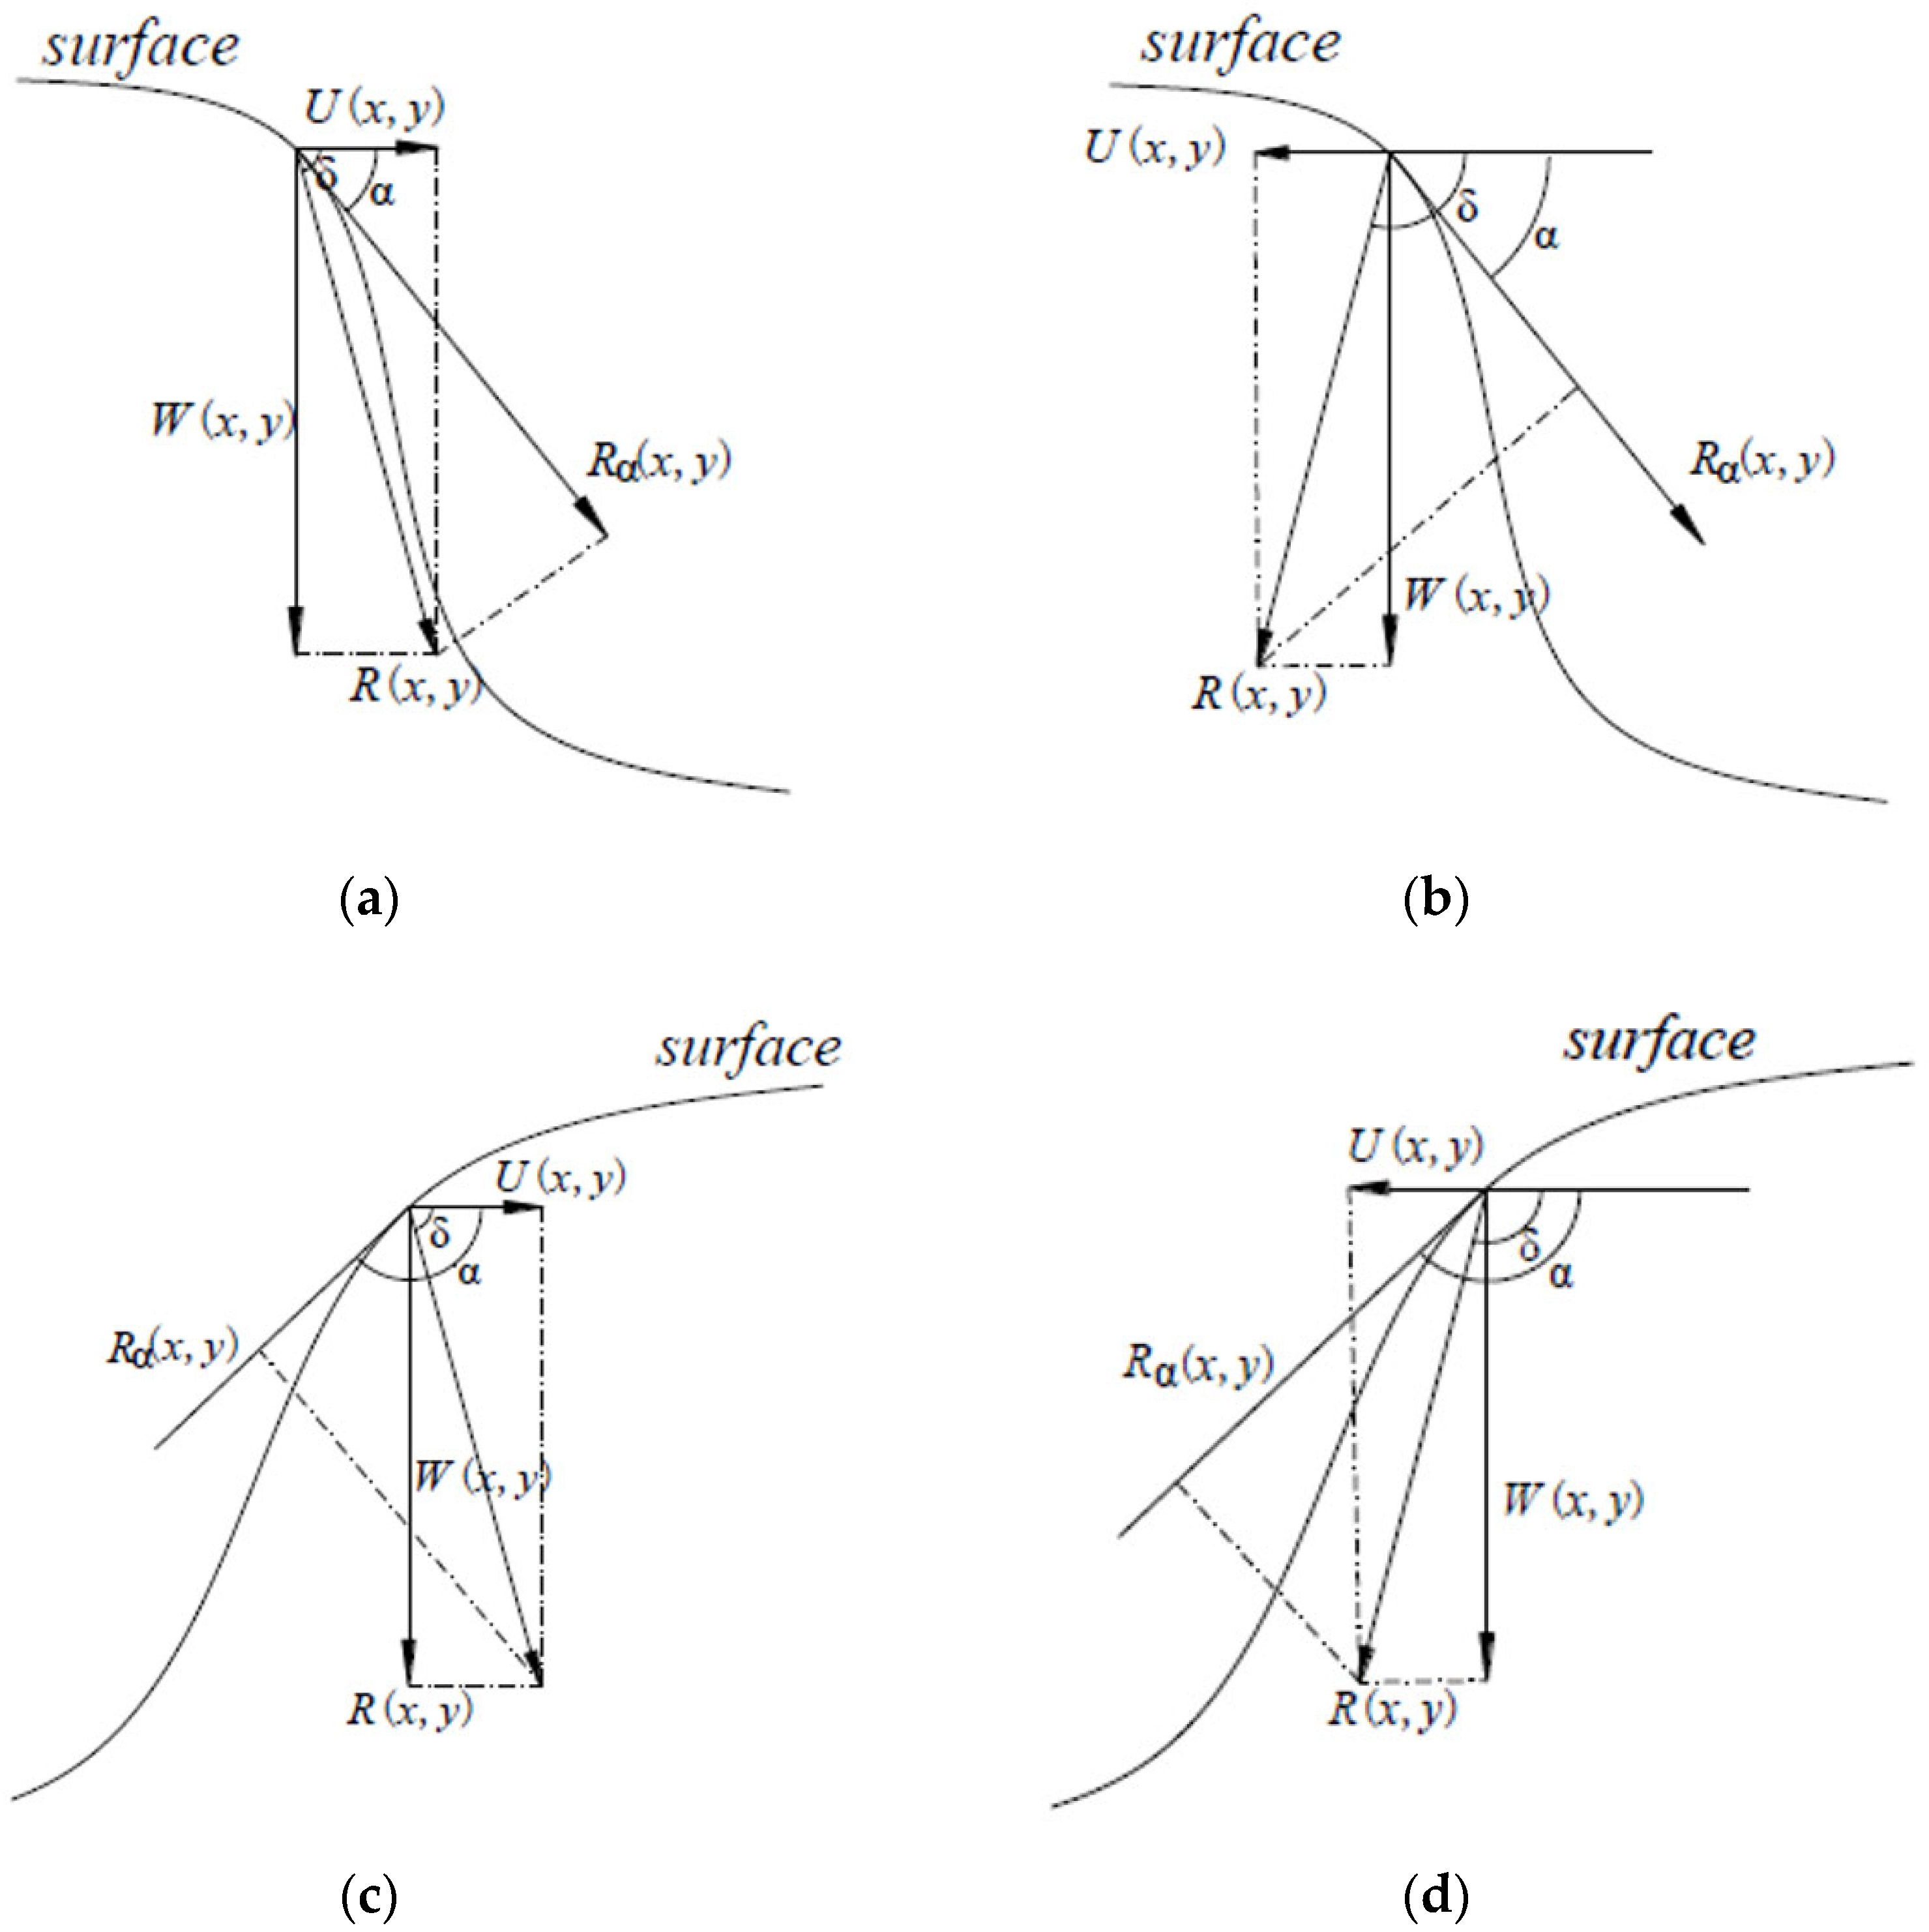
In Equations (39) and (40), parameters δ and Ks should be determined, as they are strongly associated with the geological and mining conditions and the nature of the topsoil. Parameters δ and Ks are important in the proposed mining subsidence model in mountainous areas, and they are discussed in this section.
Values about δ:
When the slope is shown in Figure 6a,c, δ = tan−1 (W(x,y)/U(x,y)); when the slope is shown in Figure 6b,d, δ = 180° + tan−1 (W(x,y)/U(x,y)).
If the direction of W(x,y) is downward, W(x,y) > 0; if the direction of U(x,y) is directed to the goaf, U(x,y) > 0, vice versa.
Values about surface characteristic coefficient Ks:
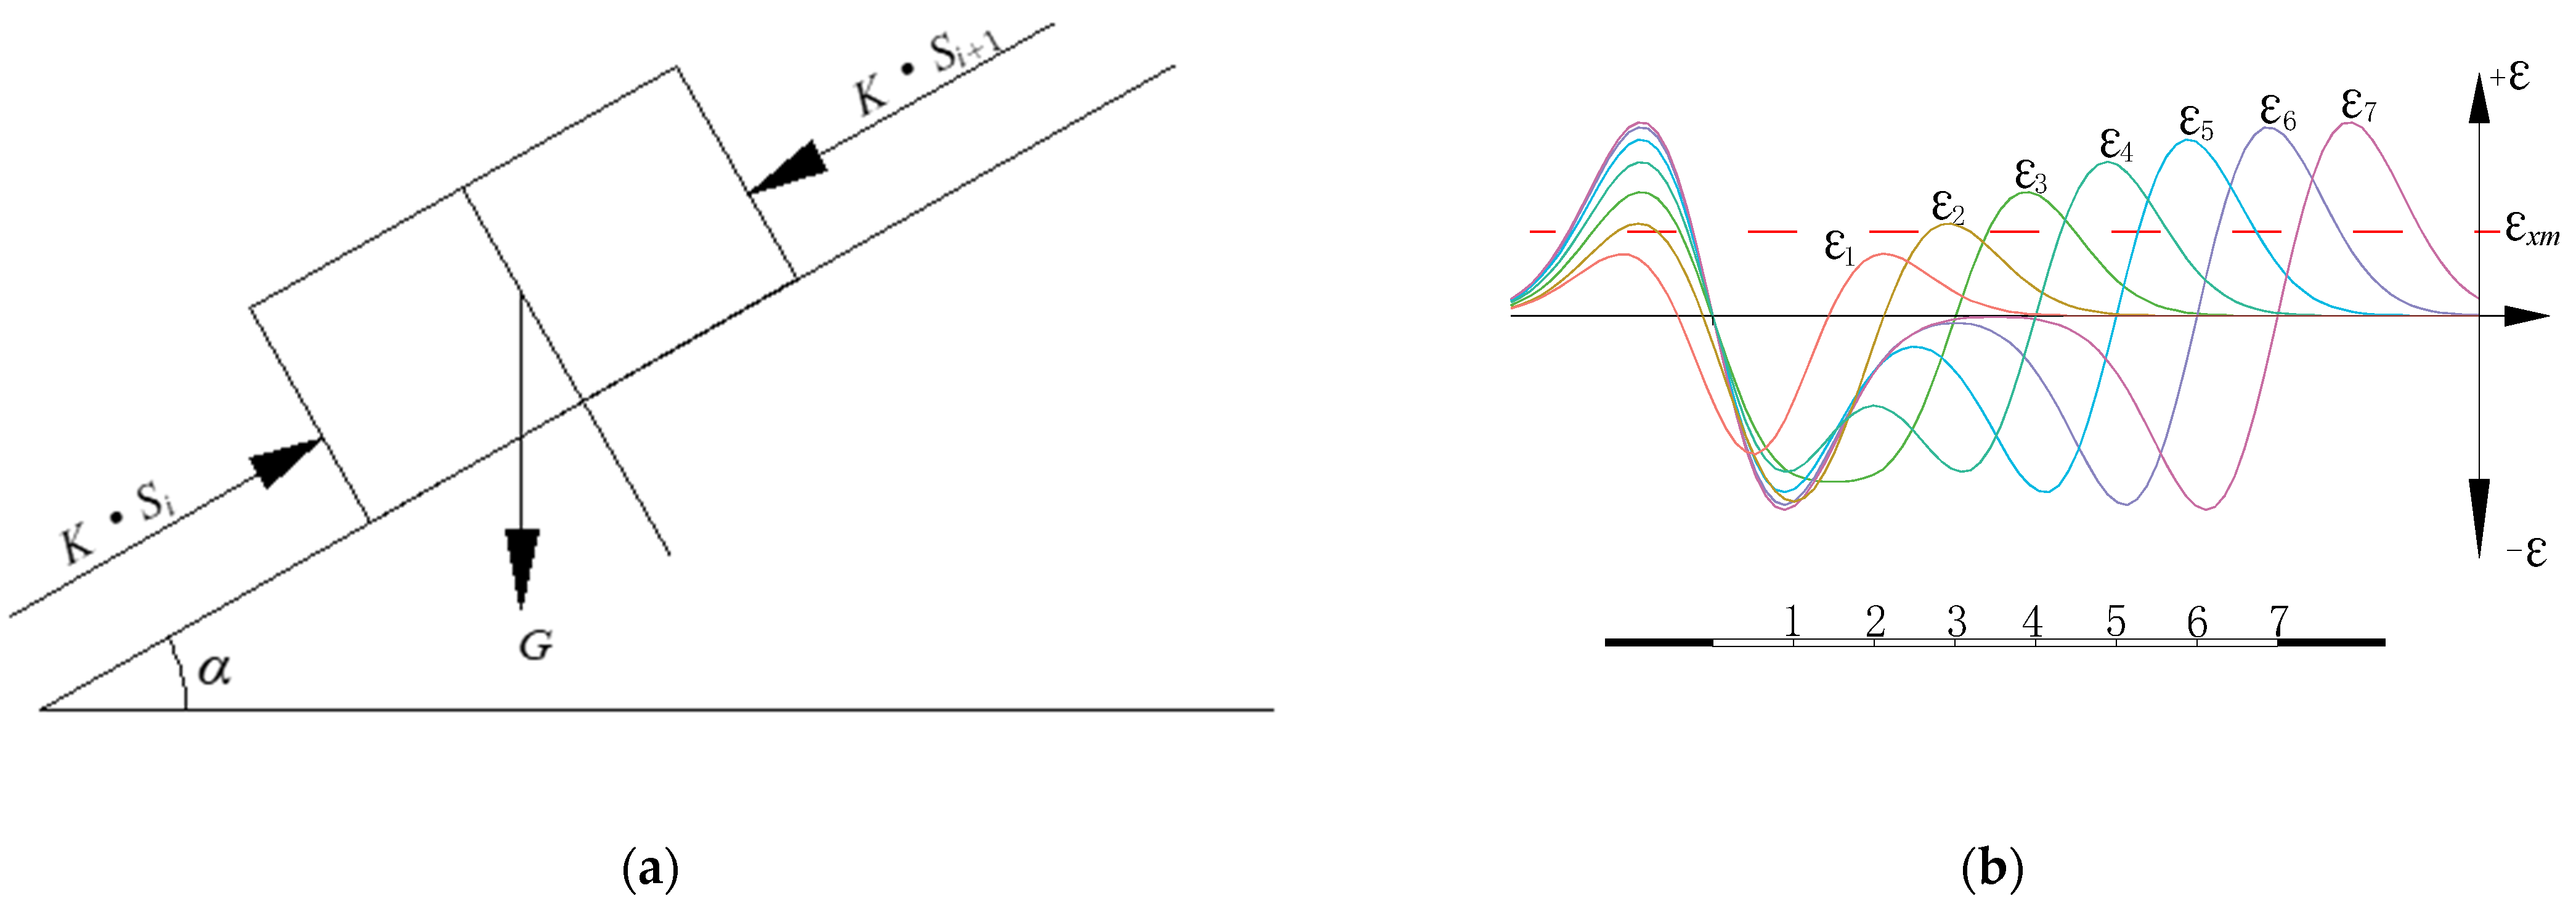
The surface soil cannot withstand tensile stress, therefore, when a small tensile stress is generated on the mountain surface under the influence of mining, then the cracked surface slope block will slip.
As shown in Figure 7a, the slip amount of the slope is analyzed.
The surface characteristic coefficient KS reveals the influence degree of the topography on the amount of slip, which is mainly related to the topography and the nature of the soil.
Select a unit block i, the length along the slope direction is Δl, the height along the slope normal direction is Δh, the slip amount of the ith block is Si, Suppose that ith block undergoes resistance from the (i − 1)th block below itself when it slips and the resistance is proportional to the amount of ith block slips, which refers KSi, and it also bears the force generated by the slip of the upper (i + 1)th block, namely Ksi+1. The block tends to balance after it slips:
G sin α + K S i + 1 Δ h G cos α tan φ K S i Δ h = 0
In Equation (41), K is the compressive modulus of the topsoil, φ is the internal friction angle of the soil, G is the weight of the unit block, G = ρg·Δl·Δh, ρ is the natural density of the topsoil, g is the gravitational acceleration.
Let ΔS = Si+1Si:
Δ ε l = Δ S Δ l = ρ g ( cos α tan φ sin α ) K
Consider Equation (42):
K S = ρ g ( cos α tan φ sin α ) K cos ( δ α ) cos α [ sin δ i ( x , y ) x + cos δ ε ( x , y ) x ]
The value of ε(x,y)x in Equation (43) is the critical horizontal deformation value when the slope starts slipping, shown in Equation (44) [42].
ε x m = 2 C E tan ( 45 ° φ 2 )
During the process of the coal mining, if the tensile deformation of a point does not exceed εxm or the horizontal deformation is always compression deformation, the maximum of the horizontal deformation is selected, as shown in Figure 7b.
According to the probability integral method, from Figure 7b, when the coal unit 1 is mined, the curve of horizontal deformation is shown in ε1, when the coal unit 1 and the coal unit 2 are mined, the curve of horizontal deformation is shown in ε2, and the other coal units are similar. When the horizontal deformation of a point on the surface exceeds εxm for the first time during the process of coal mining, the slip subsidence ΔW(x, y) and the slip horizontal movement ΔU(x,y) are calculated. When ε(x,y)x is determined, i(x,y)x is also determined.

3. Case Study

3.1. Study Area

The study coal mine working panel 22,101 is located in Taiyuan, Shanxi Province, China, the location of which is shown in Figure 8.
The surface above the working panel is high in the west and low in the east, with the elevation from +1290 to +1305 m. The terrain is relatively open, with a southwest dip angle of about 4°. The working panel adopted comprehensive mechanized mining and an all collapse method to manage the roofs. Its geological mining conditions were designed by a length along the strike D3 = 440 m, and a length along the inclination D1 = 140 m, the mining height m = 3.18 m, the dip angle γ = 1~3°, and the average mining depth H = 220 m. Two observation lines were laid along the strike of the main section and the inclination of the main section, respectively. Forty-five monitoring points were laid along the two observation lines shown in Figure 9, the image of a point is shown in Figure 10. Each monitoring point was filled with concrete and buried with prefabricated piles in the soil pit. The kind of data at these 45 points includes the plane position of each point (x,y) and the elevation of each point (h), traverse measurement was carried out according to the accuracy requirement of 5, “and triangulation elevation traverse was measured at the same time. The Leica T402 total station instrument was used for the measurement of the 45 points. The nominal accuracy of angle measurement is 2“, and the distance measurement accuracy is 3 mm + 2 ppm.
In order to study the law of surface movement and deformation in mountainous areas according to the contours of the study area, the surface elevations along two observation lines are extracted based on the AutoCAD software. The ground surface section planes of two observation lines are shown in Figure 11.

3.2. Information of Topsoil

The upper layer of the working panel 22,101 is the Quaternary Loess of Malan. It is gray yellow sub clay, with large sand content, small tensile strength, with good water permeability. The parameters of geotechnical physical and mechanical experiments are shown in Table 1. The critical horizontal deformation value εxm is 3.2 mm/m.

3.3. Analysis of the Results

3.3.1. Inversion Results of Prediction Parameters Based on DSFOA

The parameter ranges of the probability integral method about the study area are set as follows: the subsidence coefficient q is 0.3∼1, the main influence tangent tanβ is 1∼3, the mining influence propagation angle θ0 is 80∼90°, the inflection point offsets s1, s2, s3, s4 are −30~30 m.
The initialization parameters of DSFOA are set as the population size sizepop 5, 10, and 20, the number of cycles is 50, 100, and 500. The step length of the subsidence coefficient q is 0.1, 0.2, the step length of the main influence angle tangent tanβ is 0.2, 0.3, the step length of the mining influence propagation angle θ0 is 5, 8, and the inflection point offset s is 10, 20, 30. The value range of the horizontal movement coefficient b is given from 0.1 to 0.5, the population size sizepop is 5, 10, and 20, and the number of iterations is 50, 100, and 500. The step length is 0.1 and 0.2.
The prediction parameters of 22,101 working panel based on DSFOA are shown in Table 2. The prediction parameters inverted by traditional methods in Table 2 are obtained based on the empirical formulas offered by the mine company. Subsidence coefficient q = 0.79 ± 0.1, main influence angle tangent tanβ = 2.4, mining influence propagation angle θ0 = 90°-k0γ (k0 is the constant), the inflection point offsets s1 = s2 = 0.05 H, s3 = s4 = 0.1 H, b = 0.35.
The comparison between the fitting subsidence values and the measured subsidence value is shown in Figure 12.
After the parameters inversion of DSFOA, b is 0.42. The comparison between the fitting horizontal movement values and the measured horizontal movement values is shown in Figure 13.
The fitting mean square error of the horizontal movement for the traditional method is 397 mm, and for the fitting mean square error of DSFOA it is 386 mm.
When the mean square error of subsidence MSE1 ≤ (0.05~0.1) Wmax is satisfied, the mean square error of horizontal movement MSE2 ≤ (0.1~0.3) Umax is satisfied, and it means that the distribution law of the movement and deformation revealed by the method is reliable and feasible [41]. According to the measured data, the maximum subsidence value is 1898 mm at No. 18 point, and the maximum horizontal movement value is 1324 mm at No. 40 point, (0.05~0.1). Wmax ranges from 94.9 mm to 189.8 mm. (0.1~0.3) Umax ranges from 132.4 mm to 397.2 mm, and it indicates that the prediction parameters of the probability integral method inversed by DSFOA are reliable and effective.

3.3.2. Prediction Results of the Proposed Model

According to the prediction model of mining subsidence in mountainous areas considering slopes slip based on the MATLAB program, first, the predictive subsidence W and the predictive horizontal movements U of 45 points are calculated, then the slip subsidence ΔW and slip horizontal movements ΔU of 45 points are evaluated (W + ΔW) and (U + ΔU) compared with the measured data W′ and U,′ respectively, as shown in Figure 14 and Figure 15.
The mean square error of the subsidence decreased from 122 mm to 71 mm, and the mean square error of the horizontal movement decreased from 386 mm to 276 mm. The applicability of the prediction model of mining subsidence in mountainous areas considering slopes slip is verified.
The effect of the subsidence prediction is perfect; for the horizontal movement prediction, the effect is improved, the effect of the horizontal movements on the strike line is superior to the horizontal movements on the tendency line, and we think the reason is the difference in the mining sufficiency degree of the two lines. For points from No. 7 point to No. 9 point, points from No. 30 point to No. 35 point, especially points from No. 43 point to No. 45 point, the effect of these points are not satisfied more or less, we consider for points from No. 7 point to No. 9 point and points from No. 43 point to No. 45 point, they are above the boundary of the gob, while for points from No. 30 point to No. 35 point, they are at the vicinity of surface movement boundary. The predicted values of horizontal movement are not accurate enough at the boundary due to the boundary effect of goaf.

4. Discussion

4.1. Prediction Results of the Existing Model in Mountainous Areas

According to Section 2.4, the reason that the law of the surface movements in mountainous mining areas is different from that in the flat areas is the superposed influences of the underground mining and the topography. Accurately predicting the surface subsidence can decrease the harmful effects of mining. In China, the existing prediction model widely used in mountainous regions was provided by He and Kang [14], as expressed in Equations (45) and (46).
W s ( x , y ) = W ( x , y ) + D x , y { P [ x ] cos 2 φ + P [ y ] sin 2 ϕ + P [ x ] P [ y ] sin 2 φ cos 2 φ tan 2 α x , y } W ( x , y ) tan 2 α x , y
U s ( x , y ) ψ = U ( x , y ) + | D x , y | W ( x , y ) { P [ x ] cos ψ cos φ + P [ y ] sin ψ sin φ } t g α x , y
where W(x,y) and U(x,y) are the subsidence and horizontal movement of plain areas under similar geological and mining conditions which can be evaluated with the probability integral method. Dx,y is a coefficient reflecting the surface feature, the value of which can be obtained from Table 3. φ is the prediction direction for surface displacement, it is the angle that the positive x-axis counterclockwise to the specified direction shown in Figure 1, αx,y is the slope angle, ψ is the angle between the slope direction of the ground surface and the main section, P[x] and P[y] are the mining landslide influence functions, as expressed in Equations (47) and (48).
P [ x ] = 1 + A [ e 1 2 ( x r + P ) 2 + e 1 2 ( l - x r + P ) 2 ] + W m [ e t ( x r + P ) 2 + e t ( l x r + P ) 2 ]
P [ y ] = 1 + A [ e 1 2 ( y r + P ) 2 + e 1 2 ( L - y r + P ) 2 ] + W m [ e t ( y r + P ) 2 + e t ( L y r + P ) 2 ]
where Wm is the max value of surface subsidence. A, P and t are the coefficients of landslide effect, with reference values of 2π, 2 and π, respectively. The other parameters are the same as the parameters in the probability integral method.

4.2. Comparison of the Proposed Model and the Existing Model

The results of the prediction model of mining subsidence in mountainous areas considering slopes slip proposed in this paper and the existing model are shown in Figure 16 and Figure 17. The mean square error of the subsidence for the existing model is 110 mm, and the mean square error of the horizontal movement for the existing model is 343 mm. While for the proposed model, the mean square error of the predictive subsidence is 71 mm, the mean square error of the predictive horizontal movement is 276 mm, and the applicability of the proposed model is verified again.
Considering the relative position between the monitoring points and the working panel, we consider the points from No. 1 to No. 10, points from No. 11 to No. 26, points from No. 27 to No. 38, and points from No. 39 to No. 45.
For the points above the goaf, the predictive effect of the proposed model is superior to that of the existing model. For the values of the mining landslide influence functions, P[x] and P[y] are relatively small or even equal to 0 in the mining area center, so the predictive results of the existing model are similar to the results of the probability integral method. However, for the proposed model, the predictive effect is more superior, the main reason being that the points above the goaf are completely affected by the coal mining, when the horizontal deformation of these points can reach to the critical horizontal deformation εxm, then the slip subsidence ΔW and the slip horizontal movement ΔU can be calculated accurately. At the border of the pillar, the predictive effect of subsidence is good for both models, while the predictive effect of horizontal movement is relatively poor for both models; this is because the prediction accuracy of the horizontal movement for the probability integral method is imperfect at the boundary of the coal pillar due to the deficiency in principle. We can make a further improvement for the probability integral method.
In summary, the proposed model and the existing model were evaluated based on the measured data, and the proposed model achieved better performance than the existing model, which verified its effectiveness and superiority. Overall, the existing model is lacking in prediction accuracy due to the deficiency of its the mining landslide influence functions, and the determination of parameters in the mining landslide influence functions has relatively strong subjectivity. Furthermore, the existing model is lacking in mechanical analysis. However, the proposed model in this paper considers the slope slip caused by tensile deformation of soil under the influence of mining, the mechanical analysis is combined in the model, the parameters of probability integral method in the proposed model are optimized based on DSFOA, and the determination of the other parameters in the proposed model are more objective and the meaning of the parameters are clear. The proposed model can help to make a comprehensive understanding of the surface movement in mountainous mining areas and make a better prediction of the mining subsidence in mountainous areas so that it can help to evaluate geological hazards in order to prevent and control geological disasters.

5. Conclusions

Understanding the law of surface movement in mountainous mining areas is important for sustainable development and geological hazard assessment. In this study, the relevant issues of mining subsidence in mountainous areas were systematically analyzed. A new practical prediction model of mining subsidence in mountainous areas considering slopes slip is proposed. The prediction formula of slip subsidence ΔW and slip horizontal movement ΔU is deduced considering movement and deformation values (W, U, i, ε) in the probability integral method. Aiming at the contradiction between the step length and global optimal solution of the FOA, the dynamic step fruit fly optimization algorithm (DSFOA) is proposed to conduct the parameter inversion of the practical model so that the performance of parameter optimization for the FOA is improved. For the determination of parameters in the model, the acquisition of parameters of the probability integral method is more efficient and accurate; the determination of the other parameters about slopes slip in the proposed model are more objective and the meaning of the parameters are clear, while for the existing model it shows relatively strong subjectivity. It would make the large discrepancy between the predictive values and measured values.
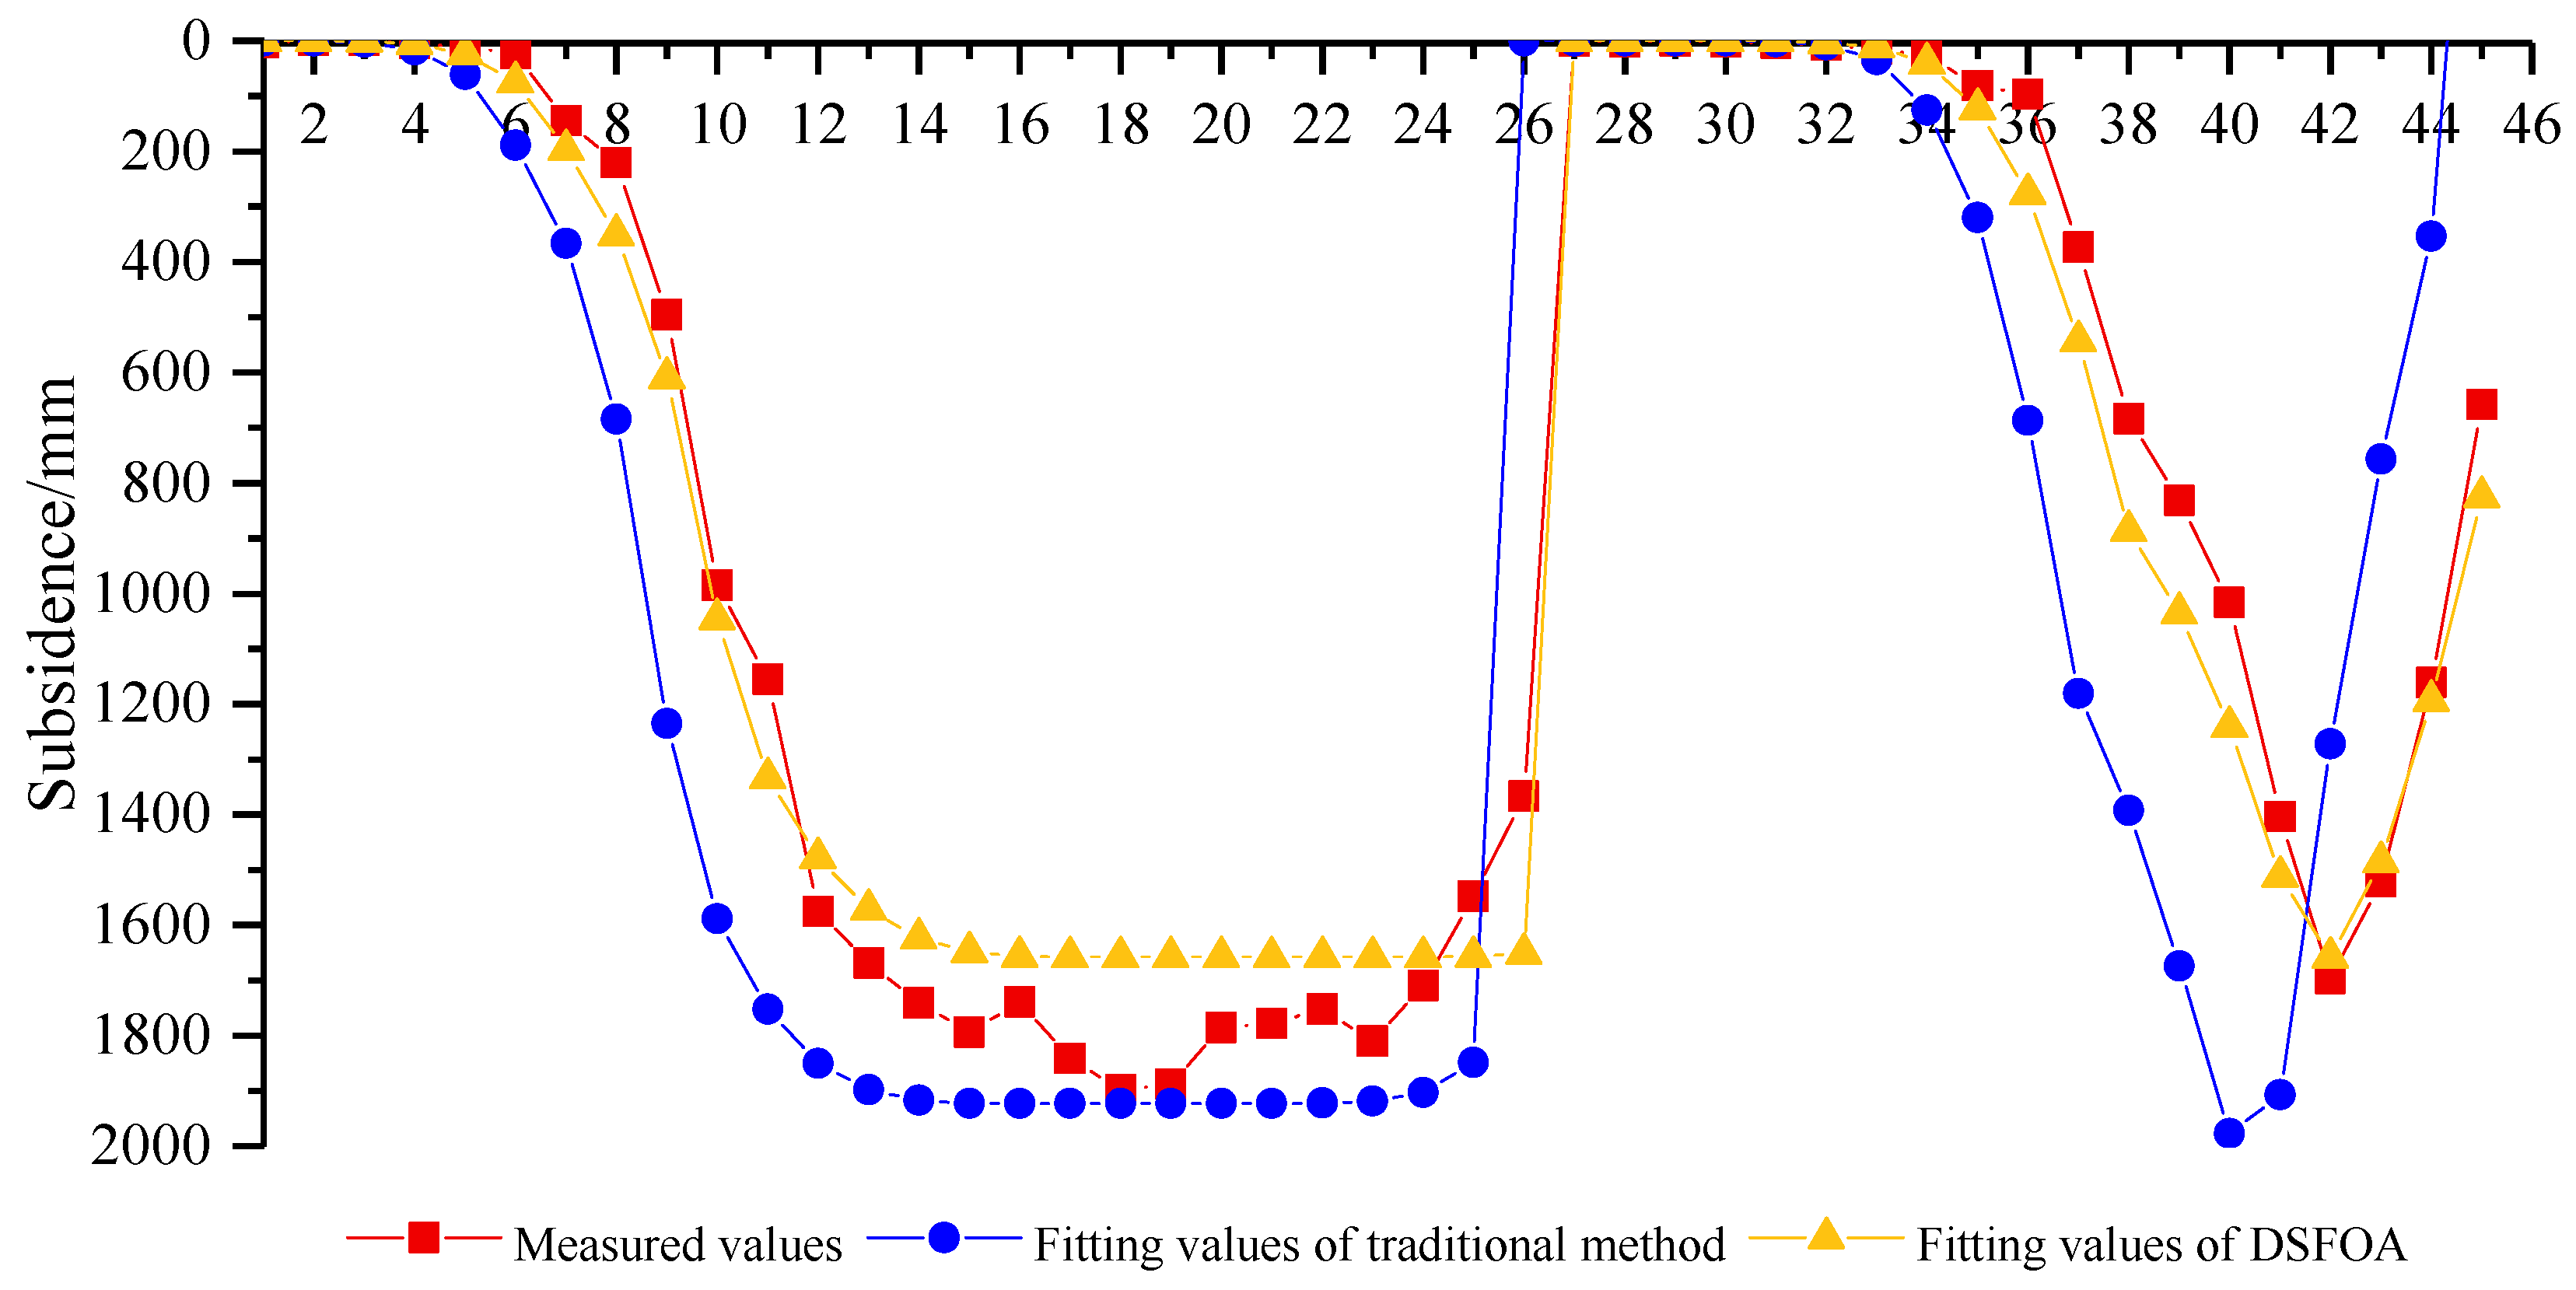
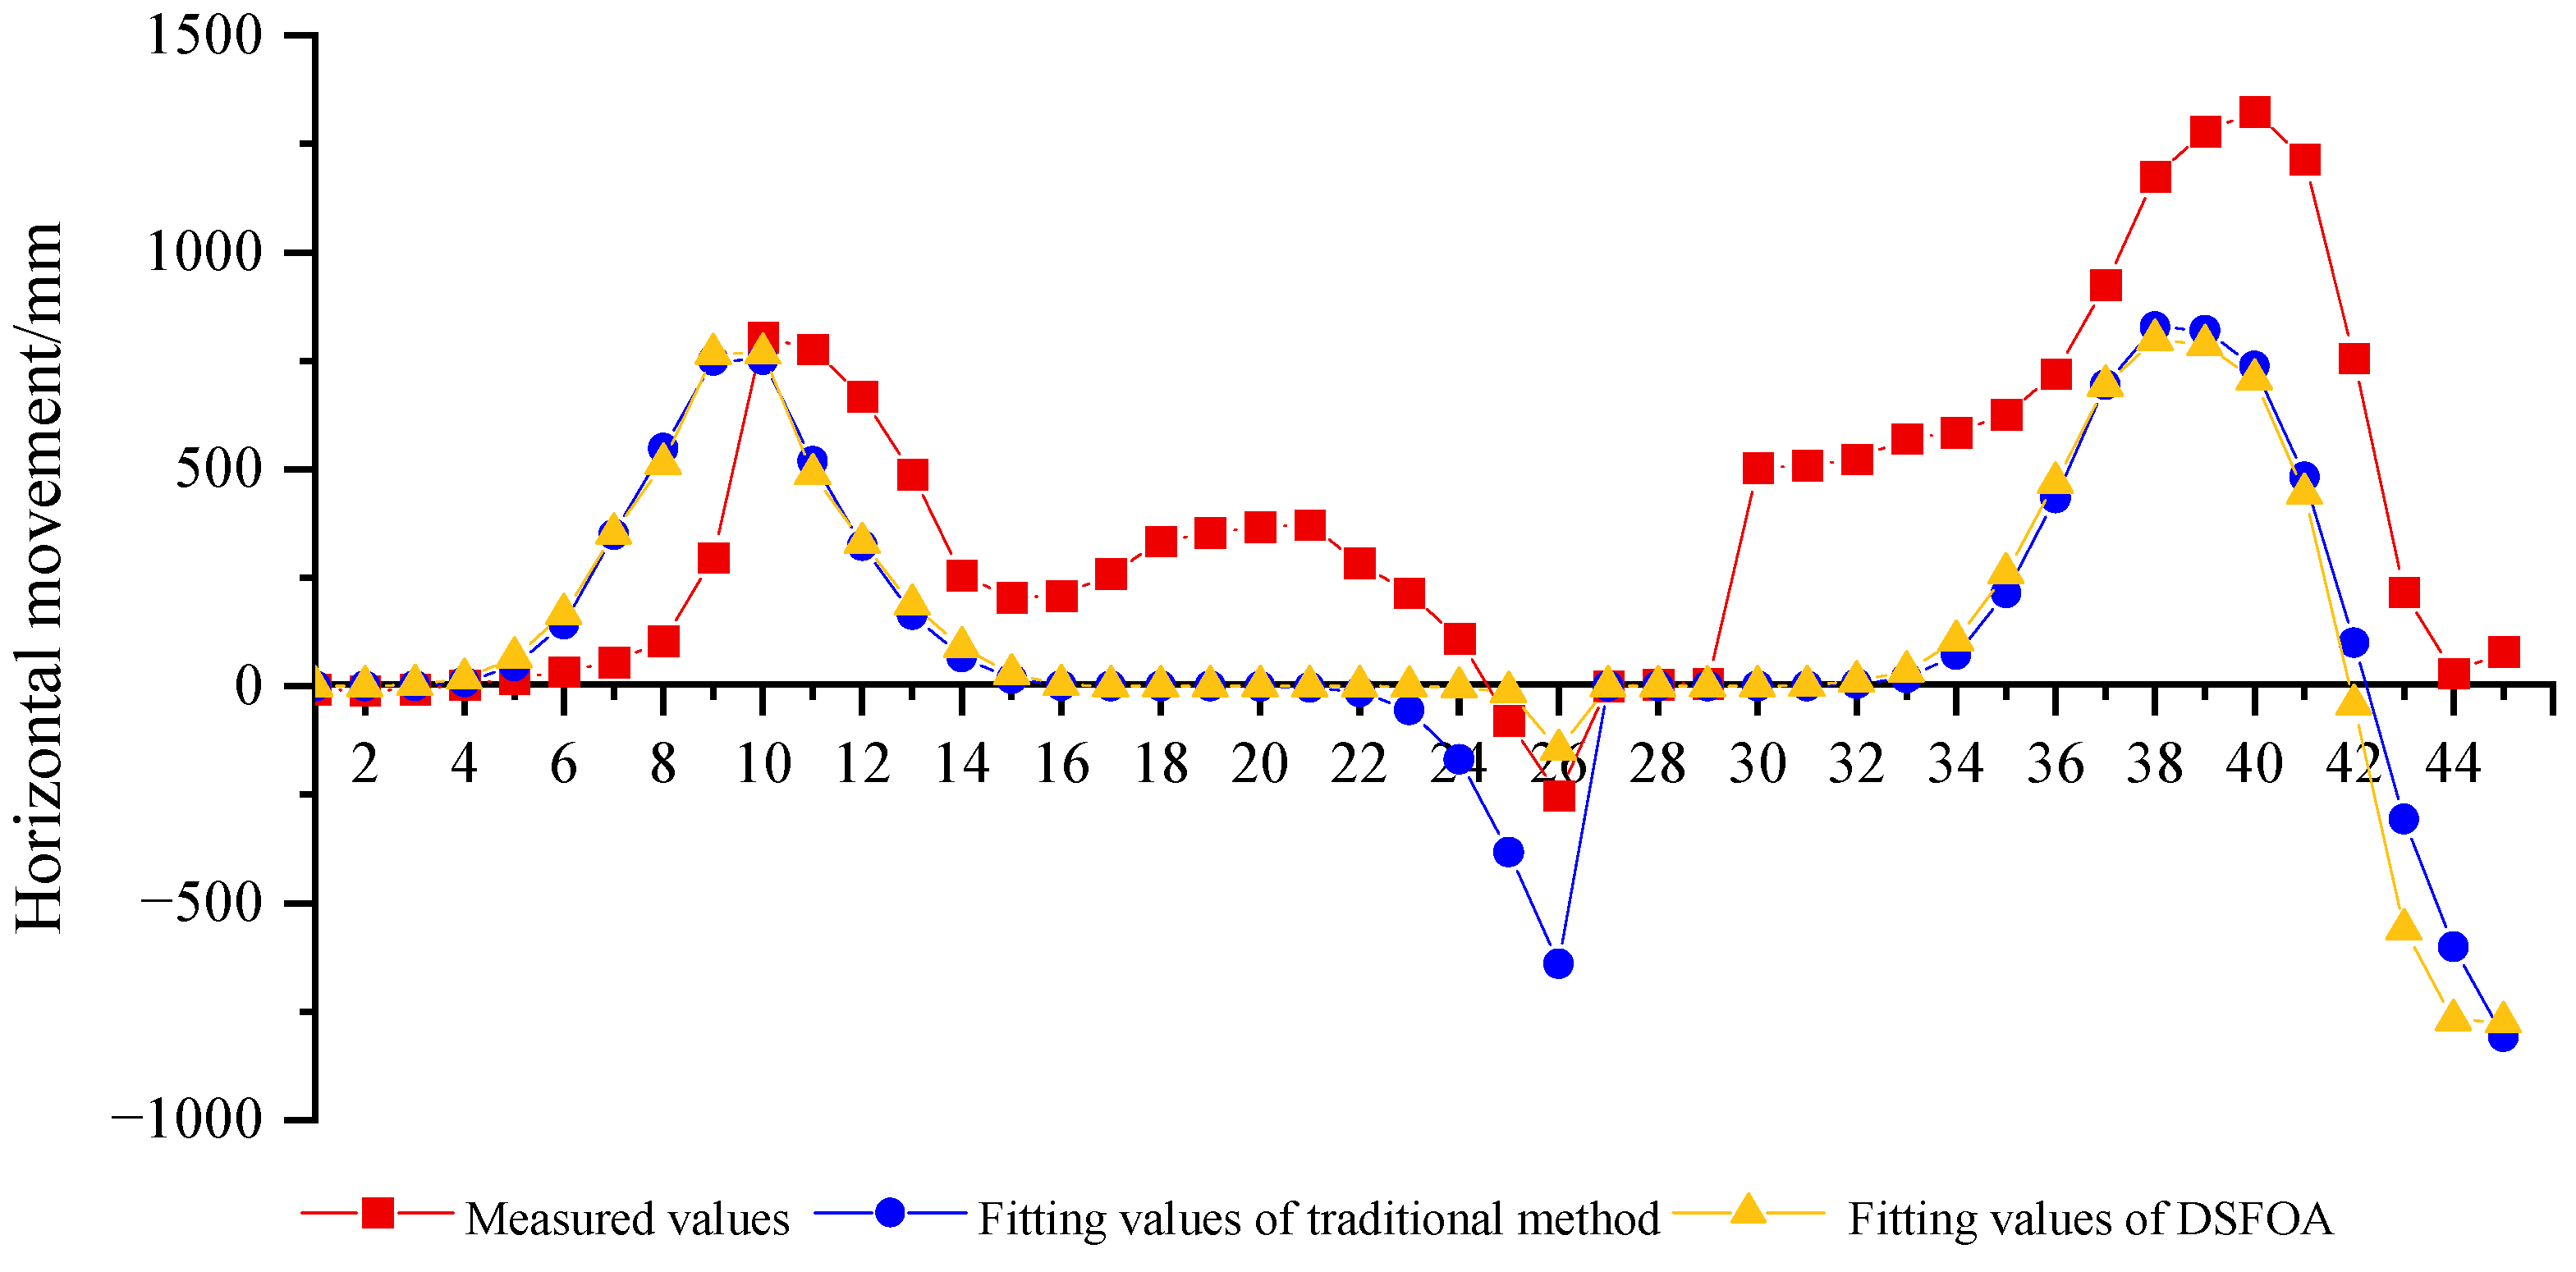
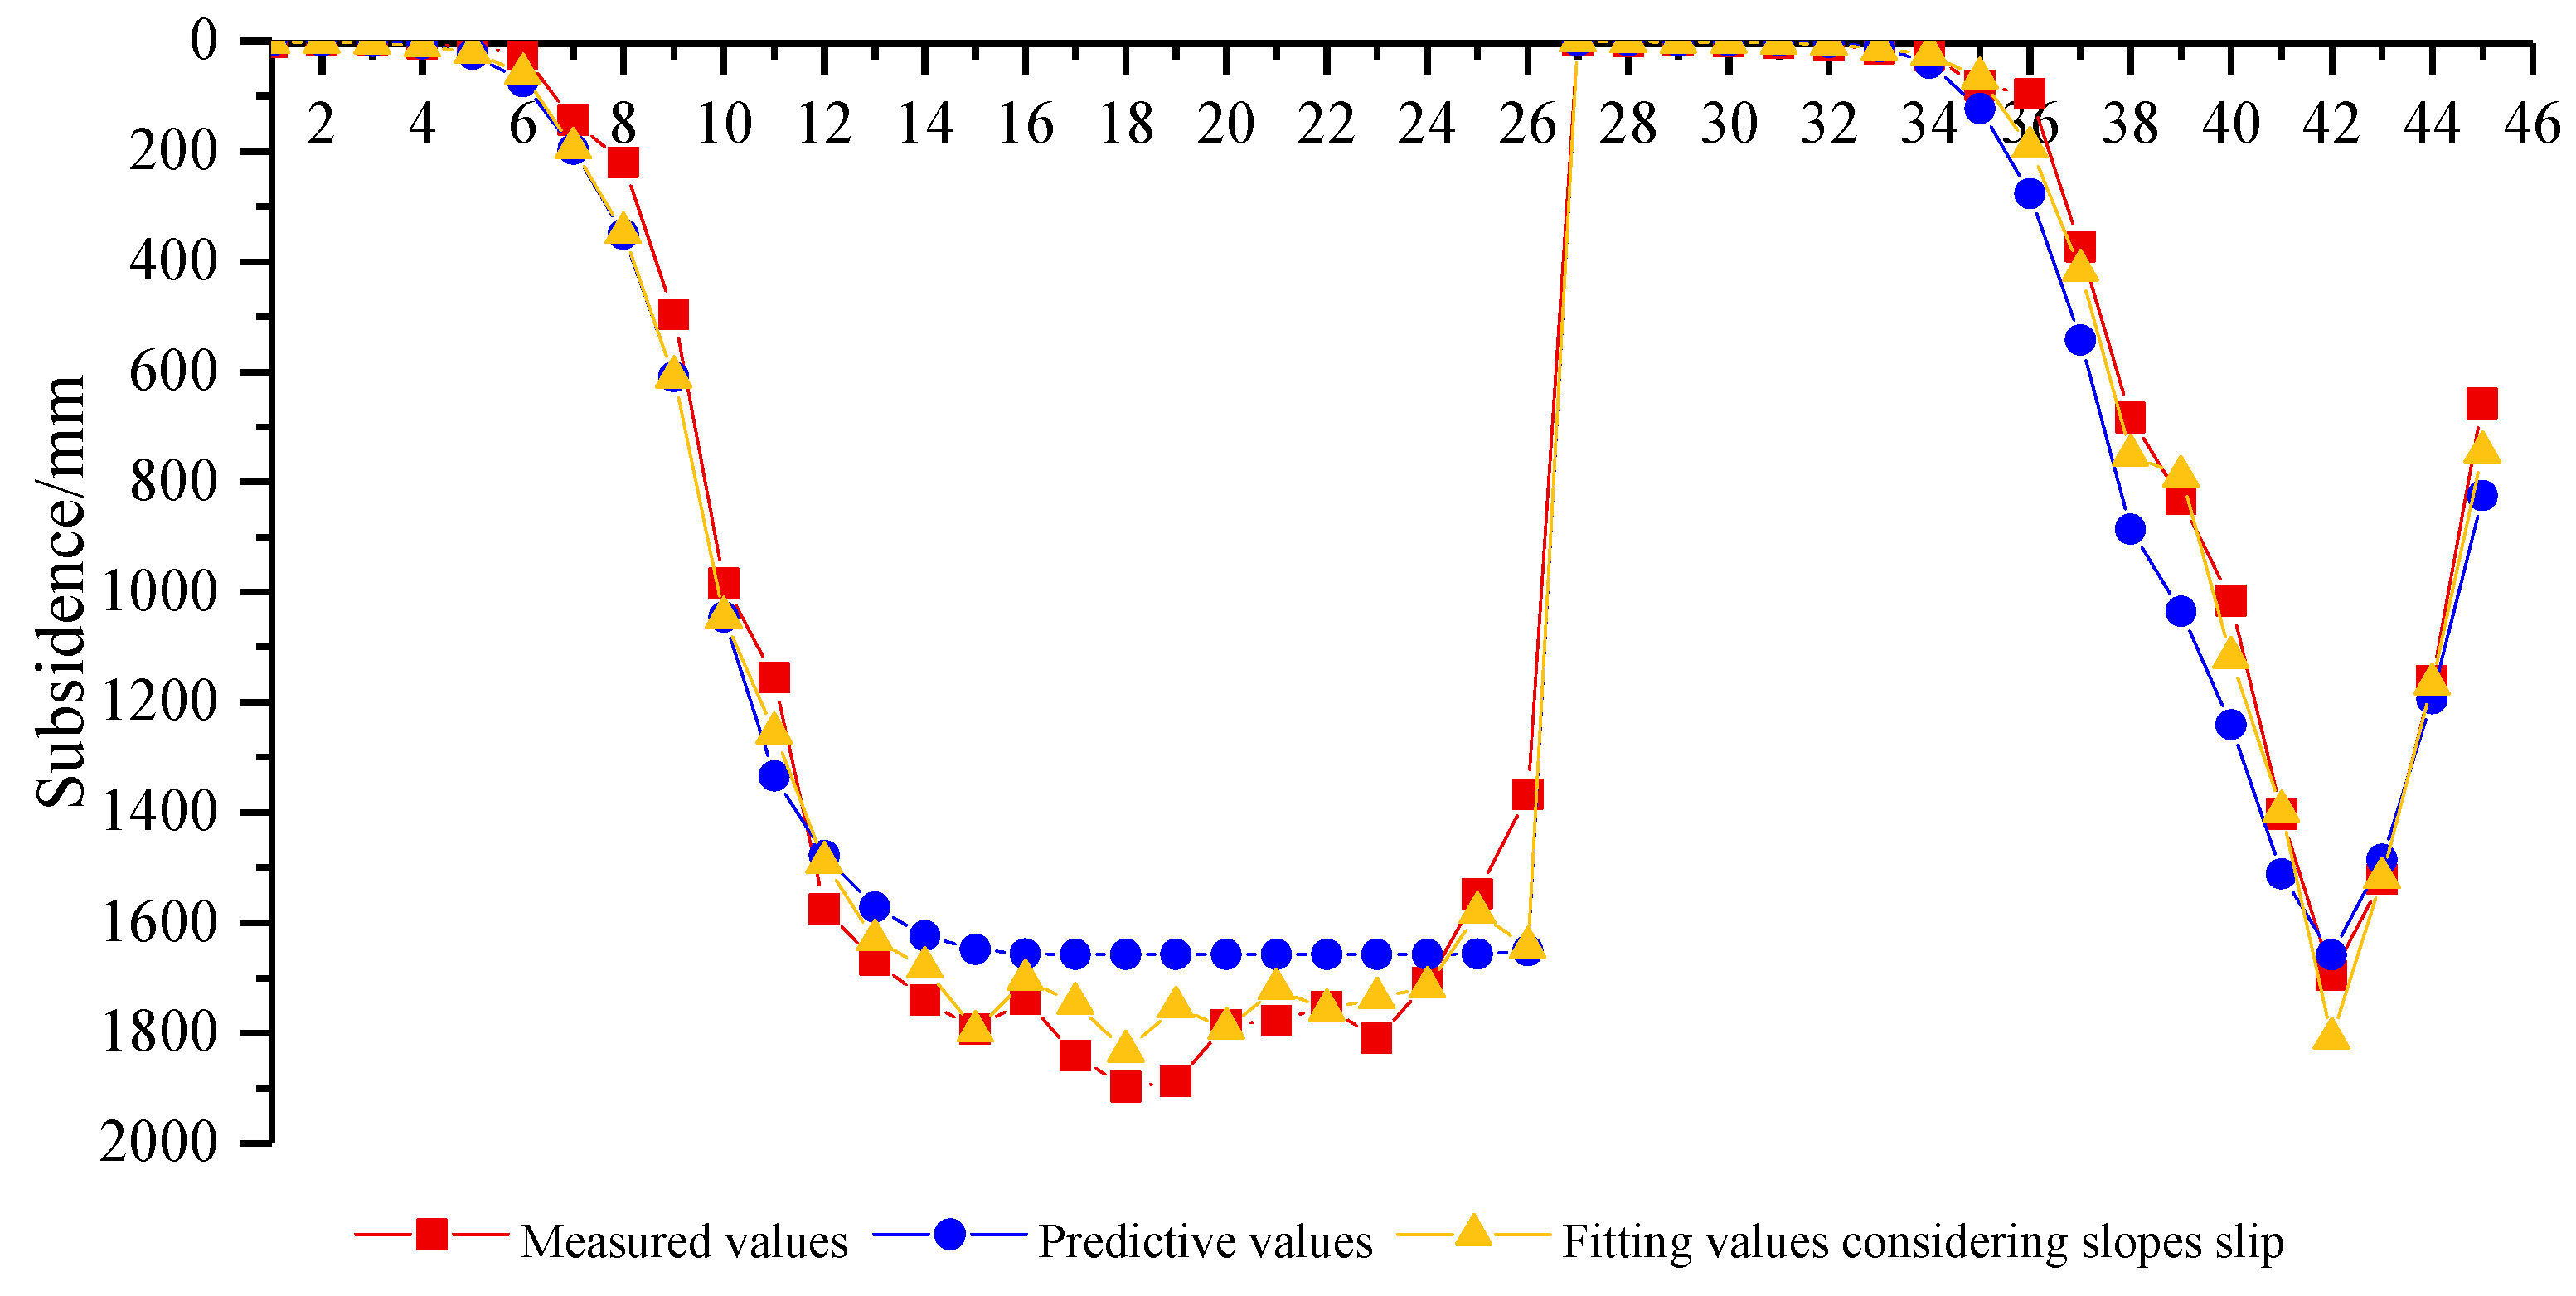
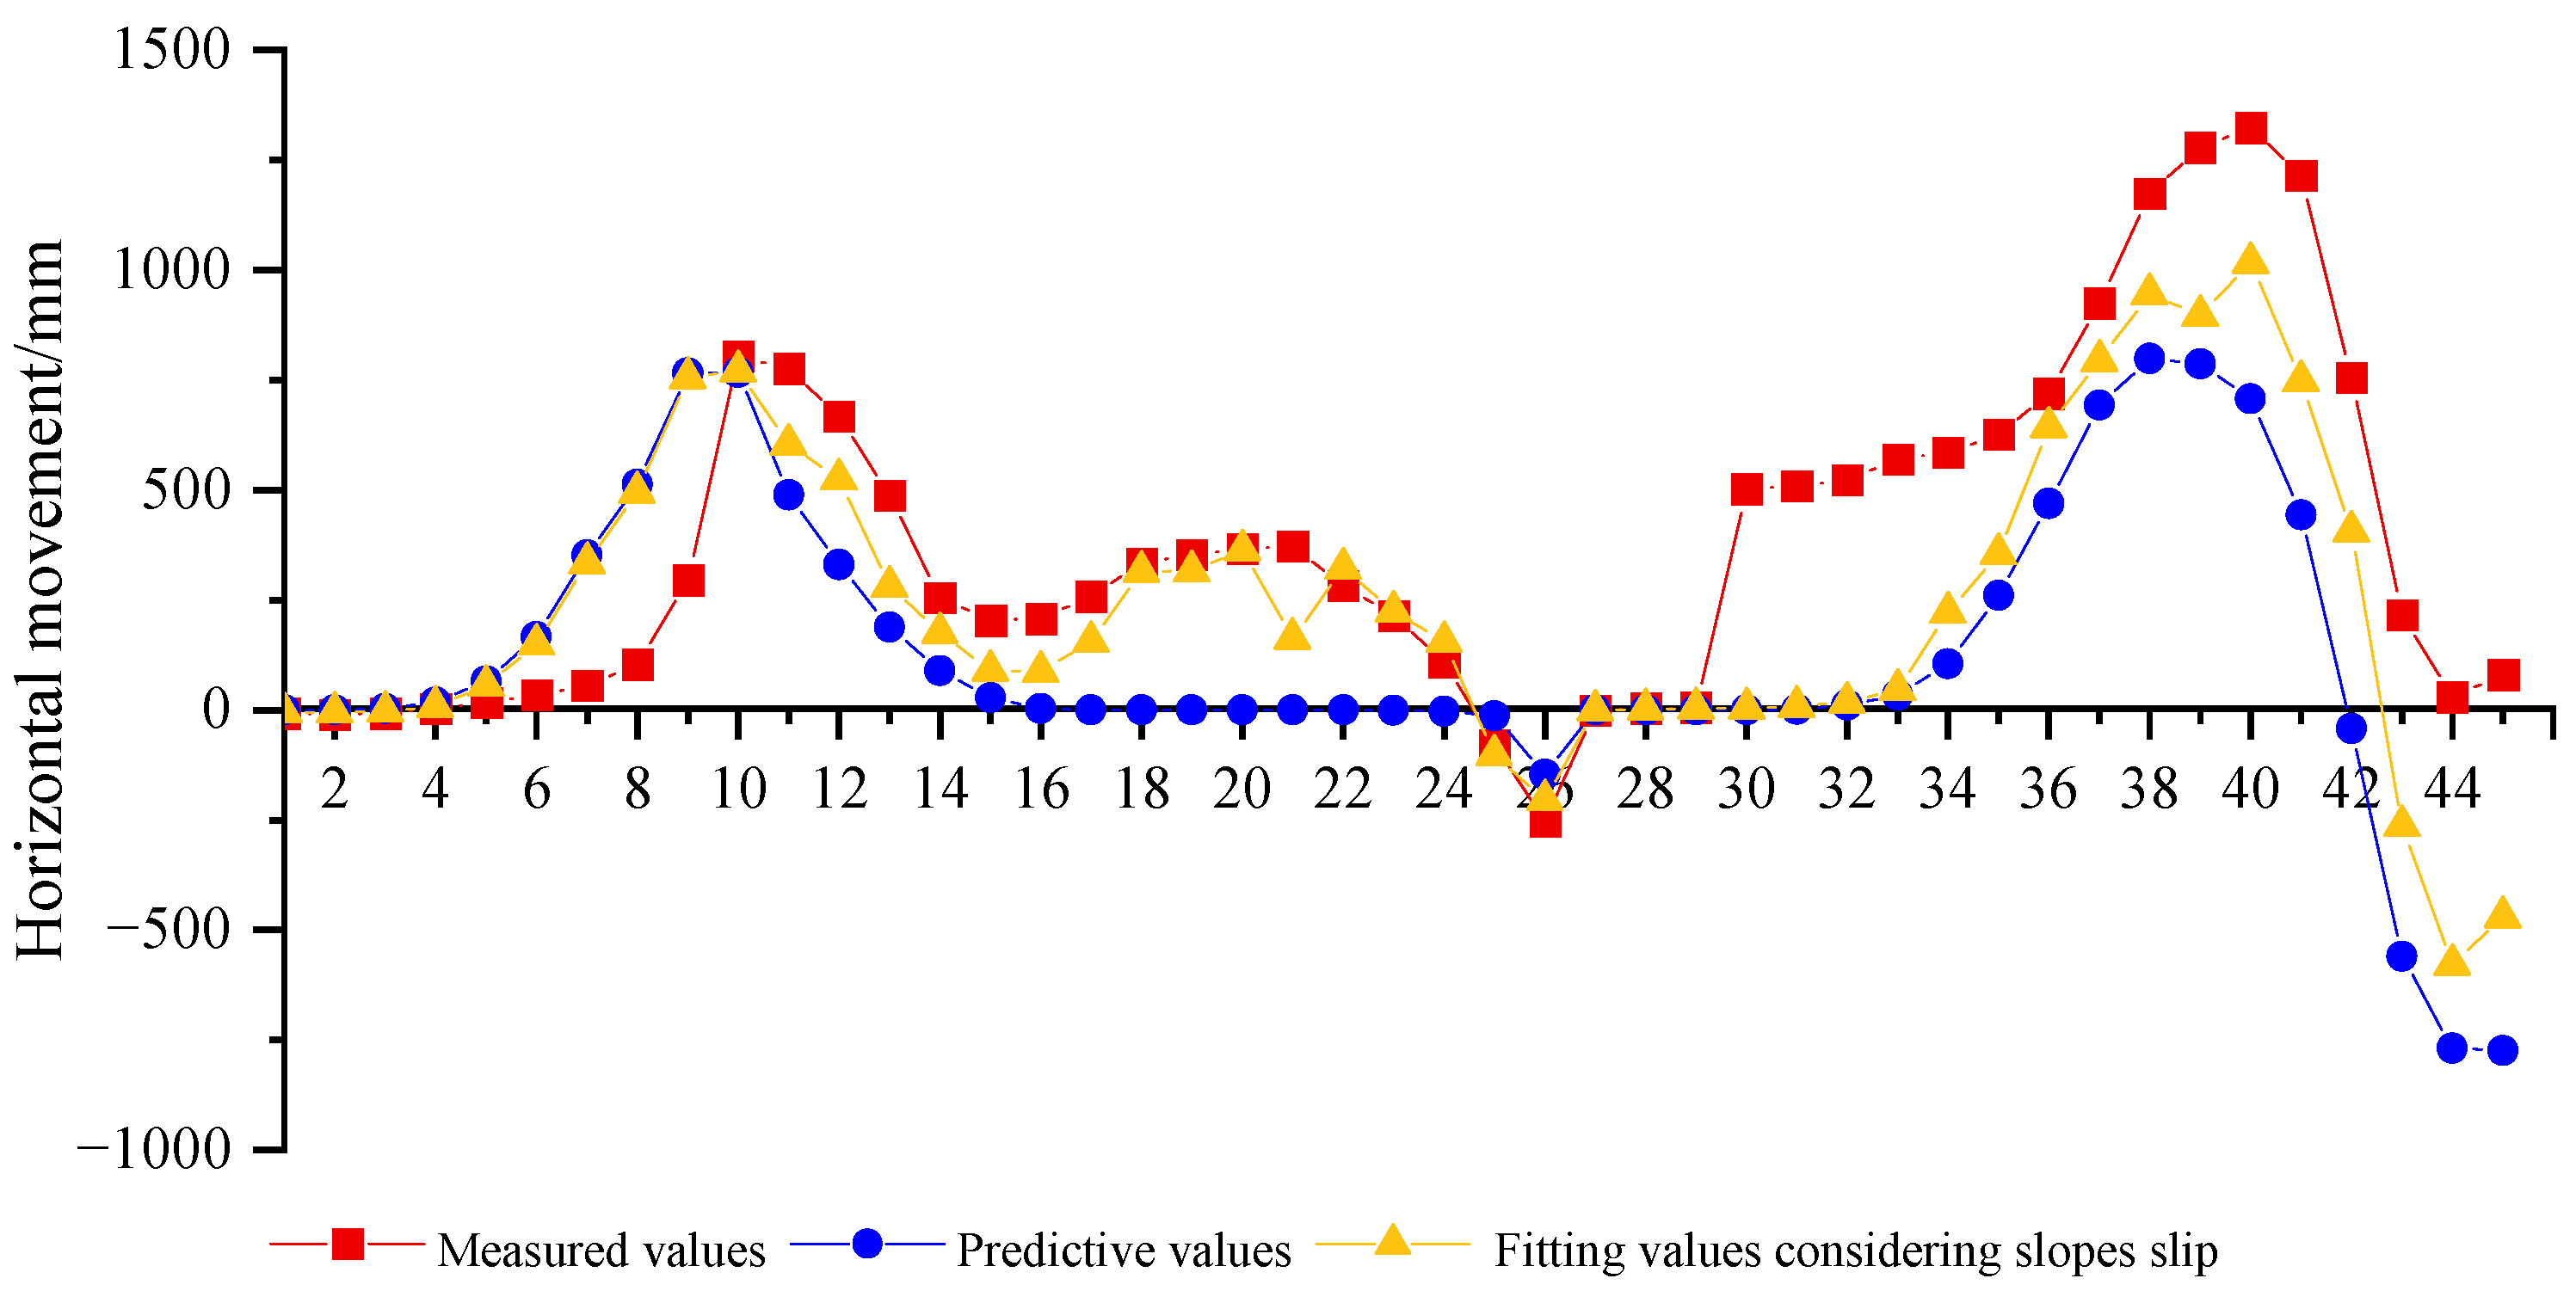
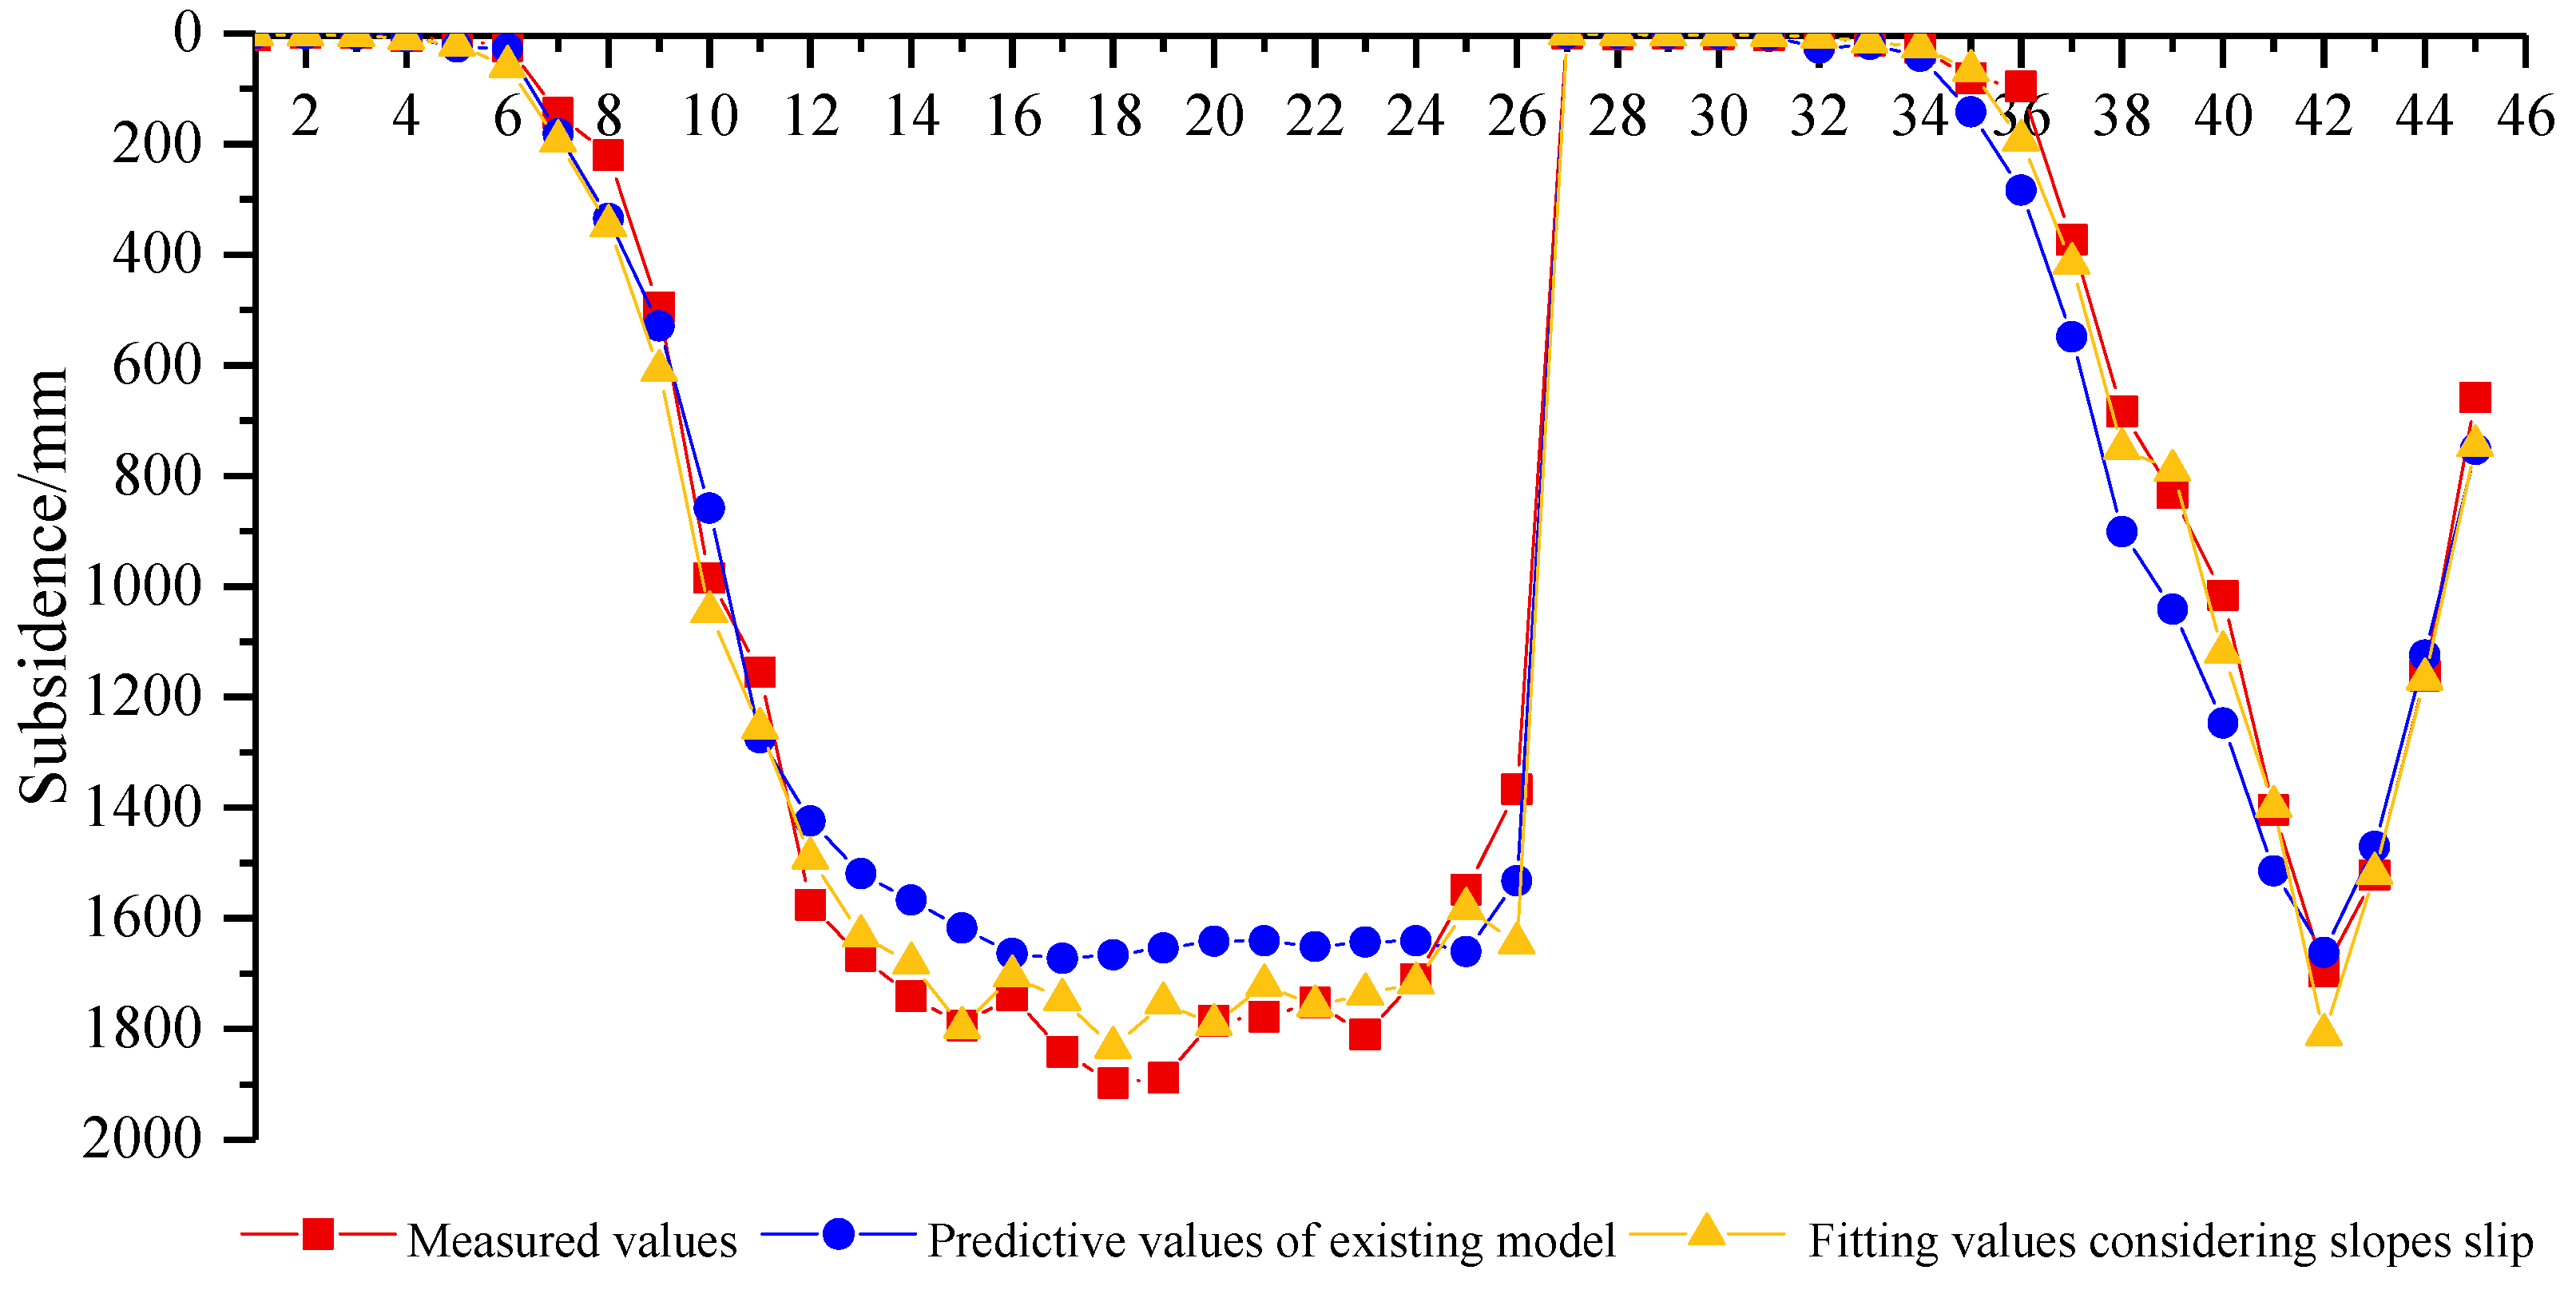
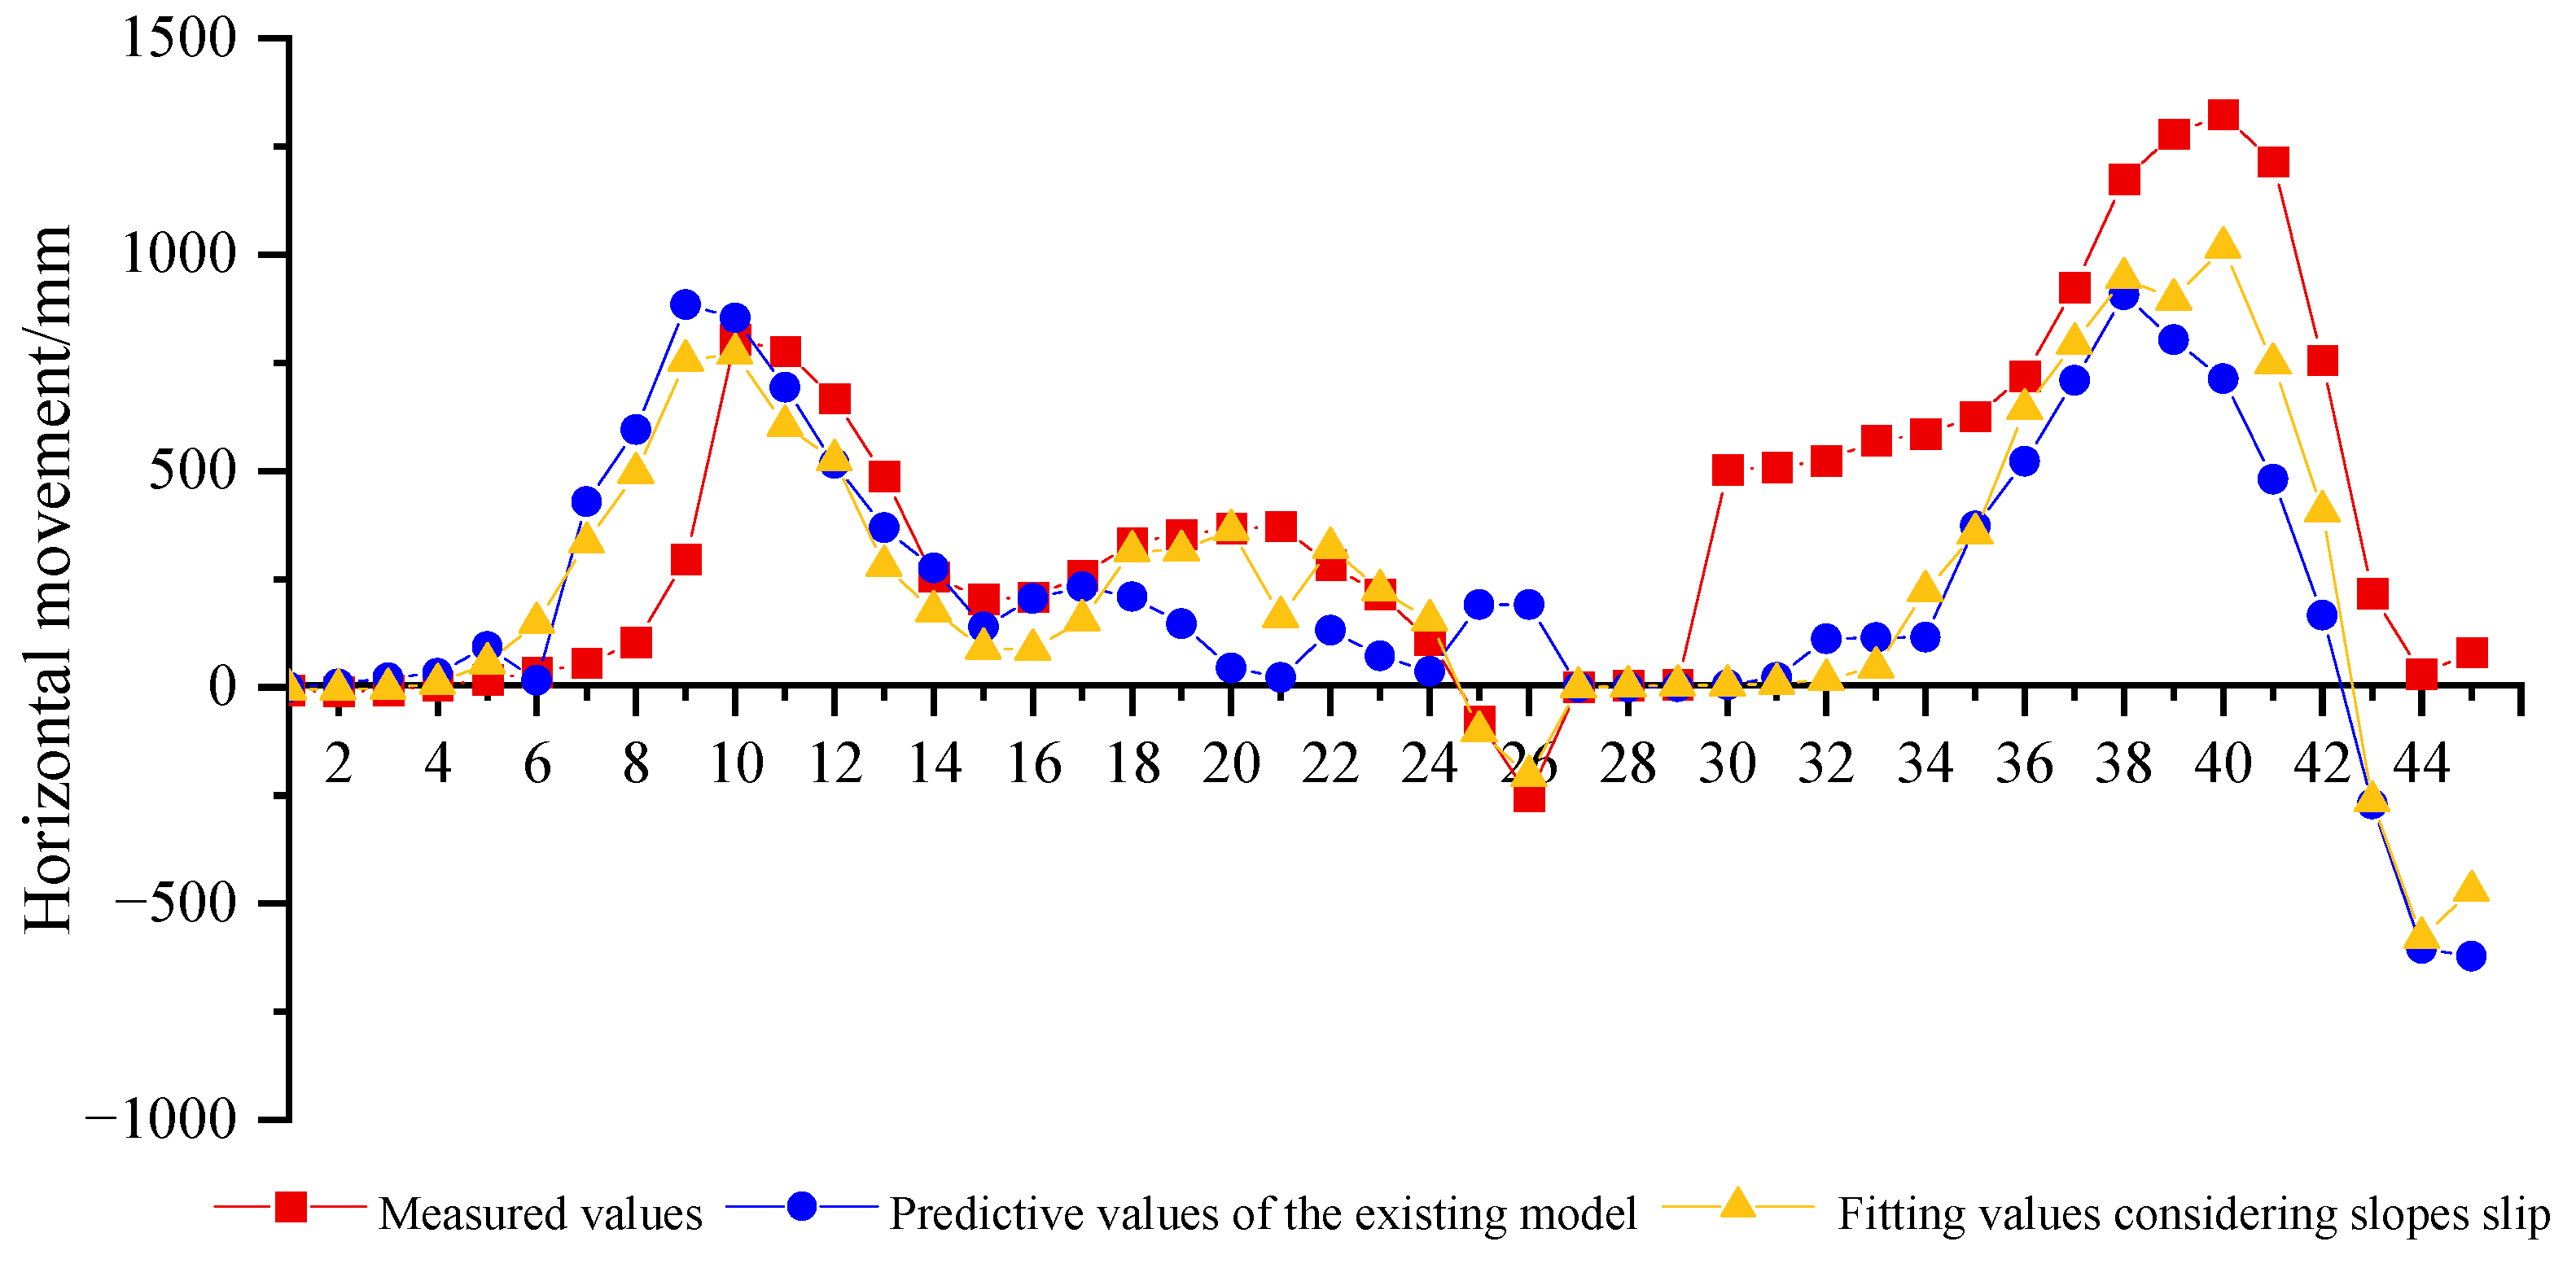
Taking the measured data of the 22,101 working panel as a validation, the mean square error of subsidence value fitting is reduced from 248 mm to 122 mm, and the mean square error of horizontal movement is reduced from 397 mm to 386 mm. The slip subsidence ΔW and slip horizontal movement ΔU are calculated by using the predictive parameters obtained from the parameters inversion, and the slip fitting values are compared with the predicted value of probability integral method and the measured value. The mean square error of subsidence further decreased from 122 mm to 71 mm, and the mean square error of horizontal movement decreased from 386 mm to 276 mm. Compared with the existing model, the mean square error of subsidence further decreased from 110 mm to 71 mm, and the mean square error of horizontal movement decreased from 343 mm to 276 mm. It shows again the practicability of the mining subsidence prediction model considering slope slip in mountainous areas. The proposed model can help with the comprehensive understanding of the surface movement in mountainous mining areas and evaluate geological hazards so that prevention and control of geological disasters can be taken further.

Author Contributions

Conceptualization, J.K.; methodology, J.K.; software, Y.Y.; validation, B.Z.; formal analysis, H.D.; investigation, X.X.; resources, Z.P.; data curation, B.Z.; writing—original draft preparation, B.Z. and J.K.; writing—review and editing, Y.Y.; visualization, X.X.; supervision, H.D.; project administration, Y.Y.; funding acquisition, Y.Y. All authors have read and agreed to the published version of the manuscript.

Funding

This research was funded by the National Natural Science Foundation of China grant number [51574242], the Fundamental Research Funds for the Central Universities grant number [2022YJSDC19, 2022YJSDC20]. The APC was funded by [2022YJSDC19].

Institutional Review Board Statement

Not applicable.

Informed Consent Statement

Not applicable.

Data Availability Statement

Not applicable.

Conflicts of Interest

The authors declare that they have no conflict of interest.

References

  1. Yuan, L. Scientific conception of precision coal mining. J. China Coal Soc. 2017, 42, 1–7. [Google Scholar] [CrossRef]
  2. Zhang, C.; Zhao, Y.; Han, P.; Bai, Q. Coal pillar failure analysis and instability evaluation methods: A short review and prospect. Eng. Fail. Anal. 2022, 138, 106344. [Google Scholar] [CrossRef]
  3. Zhang, J.; Zhang, Q.; Sun, Q.; Gao, R.; Germain, D.; Abro, S. Surface subsidence control theory and application to backfill coal mining technology. Environ. Earth Sci. 2015, 74, 1439–1448. [Google Scholar] [CrossRef]
  4. Yang, Y.; Erskine, P.D.; Zhang, S.; Wang, Y.; Bian, Z.; Lei, S. Effects of underground mining on vegetation and environmental patterns in a semi-arid watershed with implications for resilience management. Environ. Earth Sci. 2018, 77, 605. [Google Scholar] [CrossRef]
  5. Yang, Z.; Li, W.; Pei, Y.; Qiao, W.; Wu, Y. Classification of the type of eco-geological environment of a coal mine district: A case study of an ecologically fragile region in Western China. J. Clean Prod. 2018, 174, 1513–1526. [Google Scholar] [CrossRef]
  6. Bai, E.; Guo, W.; Tan, Y. Negative externalities of high-intensity mining and disaster prevention technology in China. Bull. Eng. Geol. Environ. 2019, 78, 5219–5235. [Google Scholar] [CrossRef]
  7. Yang, X.; Wen, G.; Dai, L. Ground Subsidence and Surface Cracks Evolution from Shallow-Buried Close-Distance Multi-seam Mining: A Case Study in Bulianta Coal Mine. Rock Mech. Rock Eng. 2019, 52, 2835–2852. [Google Scholar] [CrossRef]
  8. Zhou, D.; Wu, K.; Bai, Z. Formation and development mechanism of ground crack caused by coal mining: Effects of overlying key strata. Bull. Eng. Geol. Environ. 2019, 78, 1025–1044. [Google Scholar] [CrossRef]
  9. He, X.; Zhao, Y.; Yang, K. Development and formation of ground fissures induced by an ultra large mining height longwall panel in Shendong mining area. Bull. Eng. Geol. Environ. 2021, 80, 7879–7898. [Google Scholar] [CrossRef]
  10. Lian, X.; Zhang, Y.; Yuan, H. Law of Movement of Discontinuous Deformation of Strata and Ground with a Thick Loess Layer and Thin Bedrock in Long Wall Mining. Appl. Sci. 2020, 10, 2874. [Google Scholar] [CrossRef] [Green Version]
  11. Yan, W.; Chen, J.; Yang, W. On-Site Measurement on Surface Disturbance Law of Repeated Mining with High Relief Terrain. Sustainability 2022, 14, 3166. [Google Scholar] [CrossRef]
  12. Liu, B.; Dai, H. Research Development and Origin of Probability integral method. Coal Min. Technol. 2016, 21, 1–3. [Google Scholar] [CrossRef]
  13. Cui, X.; Deng, K. Research review of predicting theory and method for coal mining subsidence. Coal Sci. Tech. 2017, 45, 160–169. [Google Scholar] [CrossRef]
  14. Jianjun, Z.; Xun, W.; Yanbing, S.; Jiangbo, W.; Lee, M.L.; Xue, Y. Deformation Behavior of Mining beneath Flat and Sloping Terrains in Mountainous Areas. Geofluids 2021, 2021, 6689966. [Google Scholar] [CrossRef]
  15. Zhang, C.; Mitra, R.; Hebblewhite, B. Evaluation of valley closure subsidence effects under irregular topographic conditions. Min. Technol. 2013, 122, 172–183. [Google Scholar] [CrossRef]
  16. He, W. Mountains surface movement under the influence of the mining. Coal Sci. Tech. 1981, 9, 23–29+62. [Google Scholar] [CrossRef]
  17. He, W. Mountain surface movement and deformation prediction caused by mining. Coal Sci. Tech. 1983, 11, 46–52+60. [Google Scholar] [CrossRef]
  18. He, W.; Kong, Z.; Kang, J. Mechanism and vector analysis of surface mining slip in mountainous areas. Min. Surv. 1991, 21–25. [Google Scholar]
  19. Wanlong, H.; Jianrong, K. Research on the laws of mountain surface movement and deformation. J. China Coal Soc. 1992, 9, 79–89. [Google Scholar]
  20. Zha, J.; Feng, W.; Zhu, X. Research on Parameters Inversion in Probability integral method by Genetic Algorithm. J. Min. Saf. Eng. 2011, 28, 655–659. [Google Scholar] [CrossRef]
  21. Li, P.; Peng, D.; Tan, Z.; Deng, K. Study of probability integration method parameter inversion by the genetic algorithm. Int. J. Min. Sci. Technol. 2017, 27, 1073–1079. [Google Scholar] [CrossRef]
  22. Xu, M.; Zha, J.; Li, H. Parameters Inversion in Probability integral method by Particle Swarm Optimization. Coal Eng. 2015, 47, 117–119, 123. [Google Scholar] [CrossRef]
  23. Wang, L.; Li, N.; Zhang, X.; Wei, T.; Chen, Y.; Zha, J. Full parameters inversion model for mining subsidence prediction using simulated annealing based on single line of sight D-InSAR. Environ. Earth Sci. 2018, 77, 161. [Google Scholar] [CrossRef]
  24. Wei, T.; Guo, G.; Li, H. Fusing Minimal Unit Probability Integration Method and Optimized Quantum Annealing for Spatial Location of Coal Goafs. KSCE J. Civ. Eng. 2022, 26, 2381–2391. [Google Scholar] [CrossRef]
  25. Wei, T.; Wang, L.; Jiang, K.; Wang, Y.; Yang, X. One spatial geometric characteristic identification method of a coal mine working face based on ground movement and deformation monitoring data. Energy Sources Part A Recovery Util. Environ. Eff. 2021, 26, 1–15. [Google Scholar] [CrossRef]
  26. Wang, L.; Jiang, K.; Wei, T.; Jiang, C.; Zha, J.; Chi, S. Estimation of parameters of probability integral method model based on improved fireworks algorithm. Surv. Rev. 2020, 53, 366–382. [Google Scholar] [CrossRef]
  27. Wang, L.; Jiang, K.; Wei, T. Development of a new inversion method for detecting spatiotemporal characteristics of coal mines based on earth observation technology. Int. J. Appl. Earth Obs. Geoinf. 2021, 26, 102346. [Google Scholar] [CrossRef]
  28. Yang, J.; Liu, C.; Chen, T.; Zhang, Y. The invasive weed optimization–based inversion of parameters in probability integral model. Arab. J. Geosci. 2019, 12, 424. [Google Scholar] [CrossRef]
  29. Pan, W.-T. A new Fruit Fly Optimization Algorithm: Taking the financial distress model as an example. Knowl. Based Syst. 2012, 26, 69–74. [Google Scholar] [CrossRef]
  30. Pan, W.-T.; Zhu, W.-Z.; Ma, F.-X.; Zhong, Z.-C.; Yuan, X.-F. Modified fruit fly optimization algorithm of logistics storage selection. Int. J. Adv. Manuf. Technol. 2017, 93, 547–558. [Google Scholar] [CrossRef]
  31. Zhang, Y.; Cui, G.; Wu, J.; Pan, W.-T.; He, Q. A novel multi-scale cooperative mutation Fruit Fly Optimization Algorithm. Knowl. Based Syst. 2016, 114, 24–35. [Google Scholar] [CrossRef]
  32. Fu, Y.; Zhou, M.; Guo, X.; Qi, L. Stochastic multi-objective integrated disassembly-reprocessing-reassembly scheduling via fruit fly optimization algorithm. J. Clean Prod. 2021, 278, 123364. [Google Scholar] [CrossRef]
  33. Hesami, M.; Alizadeh, M.; Naderi, R.; Tohidfar, M. Forecasting and optimizing Agrobacterium-mediated genetic transformation via ensemble model- fruit fly optimization algorithm: A data mining approach using chrysanthemum databases. PLoS ONE 2020, 15, e0239901. [Google Scholar] [CrossRef]
  34. Luo, R.; Zheng, H.; Guo, J. Solving the Multi-Functional Heterogeneous UAV Cooperative Mission Planning Problem Using Multi-Swarm Fruit Fly Optimization Algorithm. Sensors 2020, 20, 5026. [Google Scholar] [CrossRef] [PubMed]
  35. Yan, H.; Zhang, T.; Qi, Y.; Yu, D.-J. Short-term traffic flow prediction based on a hybrid optimization algorithm. Appl. Math. Modell. 2022, 102, 385–404. [Google Scholar] [CrossRef]
  36. Li, Y.; Xu, F. Acoustic emission sources localization of laser cladding metallic panels using improved fruit fly optimization algorithm-based independent variational mode decomposition. Mech. Syst. Signal Process. 2022, 166, 108514. [Google Scholar] [CrossRef]
  37. Qisong, Q.; Gening, X.; Xiaoning, F.; Jun, W. A new type bionic global optimization: Construction and application of modified fruit fly optimization algorithm. Proc. Inst. Mech. Eng. Part B J. Eng. Manuf. 2014, 229, 1614–1621. [Google Scholar] [CrossRef]
  38. Sang, H.-Y.; Pan, Q.-K.; Duan, P.-Y. Self-adaptive fruit fly optimizer for global optimization. Nat. Comput. 2017, 18, 785–813. [Google Scholar] [CrossRef]
  39. Pan, Q.-K.; Sang, H.-Y.; Duan, J.-H.; Gao, L. An improved fruit fly optimization algorithm for continuous function optimization problems. Knowl. Based Syst. 2014, 62, 69–83. [Google Scholar] [CrossRef]
  40. Hou, Y.; Li, J.; Yu, H.; Li, Z. BIFFOA: A Novel Binary Improved Fruit Fly Algorithm for Feature Selection. IEEE Access 2019, 7, 81177–81194. [Google Scholar] [CrossRef]
  41. He, G.Q.; Yang, L. Mining Subsidence; China University of Mining and Technology Press: Xuzhou, China, 1991; pp. 188–195. [Google Scholar]
  42. Gao, C.; Xu, N. Research on surface crack depth and crack width caused by coal mining. Coal Eng. 2016, 48, 81–83+87. [Google Scholar] [CrossRef]
Figure 1. Mining subsidence surface damage: (a) Step crack; (b) Collapse pit.
Sustainability 14 09445 g001
Figure 2. Principle of the probability integral model.
Sustainability 14 09445 g002
Figure 3. (a) Unit mining subsidence and unit horizontal movement; (b) Three-dimensional coordinate system.
Sustainability 14 09445 g003
Figure 4. Movement vector and slopes slip vector.
Sustainability 14 09445 g004
Figure 5. (a) Slopes slip vector analysis; (b) Deformation of the slip vector along the l direction.
Sustainability 14 09445 g005
Figure 6. The computational diagram of different Slope directions.
Sustainability 14 09445 g006
Figure 7. (a) Analysis of a unit block slips; (b) Variation of horizontal deformation.
Sustainability 14 09445 g007
Figure 8. Location of the working panel 22,101.
Sustainability 14 09445 g008
Figure 9. The Layout of working panel 22,101 and surface monitoring points.
Sustainability 14 09445 g009
Figure 10. A monitoring point of the study area.
Sustainability 14 09445 g010
Figure 11. Ground surface section planes of two observation lines: (a) The strike line, (b) The inclination line.
Sustainability 14 09445 g011
Figure 12. Comparison of the subsidence fitting values and measured values.
Sustainability 14 09445 g012
Figure 13. Comparison of the horizontal movement fitting values and measured values.
Sustainability 14 09445 g013
Figure 14. Comparison of the subsidence fitting values and measured values considering slopes slip.
Sustainability 14 09445 g014
Figure 15. Comparison of the horizontal movements fitting values and measured values considering slopes slip.
Sustainability 14 09445 g015
Figure 16. Comparison of the horizontal movements fitting values and measured values considering slopes slip.
Sustainability 14 09445 g016
Figure 17. Comparison of the horizontal movements fitting values and measured values considering slopes slip.
Sustainability 14 09445 g017
Table 1. Parameters of geotechnical physical mechanics of topsoil.
NameNatural
Density(Kg/m3)
Cohesion
(KPa)
Poisson’s
Ratio
Elasticity
Modulus (MPa)
Compression
Modulus (MPa)
Internal Friction Angle (°)
Loess of Malan1420430.417.5724
Table 2. Comparison of the parameters inversion result.
Algorithmqtanβθ0s1s2s3s4MSE/mm
traditional method0.792.488−12−12−22−22248.40
DSFOA0.592.1983.19−2.43−2.437.577.57122.27
Table 3. Surface feature coefficient Dx,y in the mountain areas.
Features of the Topsoil and Ground VegetationFeature Coefficient Dx,y
Concave
Landforms
Convex
Landforms
Sandy clay slope of <2 m thickness, with dense bushes or trees−0.1~−0.2+0.2~+0.3
Sandy clay slope of 2–5 m thickness, with bushes and open forest−0.2~−0.3+0.3~+0.6
Loess slope with >5 m thickness, with the plough and orchard−0.3~−0.4+0.6~+1.0
Collapsible loess slope with vertical joints and >5 m thickness, and growing of the plough−0.4~−0.5+1.0~+1.5
Publisher’s Note: MDPI stays neutral with regard to jurisdictional claims in published maps and institutional affiliations.

