Article

Quantitative Evaluation of High-Tech Industry Policies Based on the PMC-Index Model: A Case Study of China’s Beijing-Tianjin-Hebei Region

1
School of Management, Tianjin University of Technology, Tianjin 300384, China
2
College of Management and Economics, Tianjin University, Tianjin 300072, China
*
Author to whom correspondence should be addressed.
Sustainability 2022, 14(15), 9338; https://doi.org/10.3390/su14159338
Submission received: 24 June 2022 / Revised: 12 July 2022 / Accepted: 28 July 2022 / Published: 29 July 2022
(This article belongs to the Section Sustainable Transportation)

Abstract

:
High-tech industrial agglomeration plays a significant role in regional sustainable development. Local governments have issued many industrial policies to accelerate the development of high-tech industries in China. Evaluating high-tech industry policies from the perspective of regional industrial synergy can prevent problems in policy implementation and promote the industrial synergy in a region. For this purpose, taking China’s Beijing-Tianjin-Hebei (BTH) region as a case, we evaluate seven policies governing the high-tech industry in this region by using the approach which integrates the policy modeling consistency index (PMC-Index) model and text mining. We propose an evaluation system with consideration of regional industrial synergy, which is based on the PMC-Index model. The results show that the lowest PMC-Index value of the seven policies is 5.30, the highest is 8.17, and the average is 6.67. Among the policies, four are of excellent or perfect grade and relatively comprehensive; three are of acceptable grade and relatively insufficient. The overall designs of the high-tech industrial policies are reasonable but there is still much room for improvement. According to the average scores of the main indicators, the policies function relatively poorly in terms of policy release agency, policy timeliness, policy type and policy receptor. The optimizations for the shortcomings of each policy are also suggested. This study may not only provide some enlightenment to policymakers, but also provide a supplement for the policy evaluation field.

1. Introduction

The high-tech industry has the advantages of high technology, high efficiency, low energy consumption and low emission [1]. If high-tech industrial agglomeration is formed in a region, it will give play to a knowledge spillover effect, reduce the technology acquisition cost of enterprises, and accordingly, improve the level of low-carbon technology [2,3,4]. In China, the high-tech industry refers to the industry with relatively high research and development (R&D) investment intensity in national economy sectors, mainly including the manufacture of aircrafts, computer, electronic and communication, and medicines [5]. Nowadays, the development of most other industries has become inseparable from the support of high-tech industries [6]. In particular, the wide application of new-generation technologies including the internet of things (IoT), artificial intelligence (AI) and cloud computing has had a profound impact on industries with greater pollution, such as transportation, logistics and manufacturing [7,8,9]. Production efficiency has been greatly improved, and the damage to the environment has also been controlled [10]. Technological upgrading and industrial transformation promote the sustainable development of various industries in a region [11]. Therefore, the high-tech industry has attracted the attention of local governments in China. The governments are actively attracting more high-tech enterprises to gather and are also trying to promote the growth of high-tech industries in the region [12]. Industrial policy is a government behavior for protecting, supporting, and adjusting the industrial environment for economic development [13]. This can ameliorate market failure caused by ineffective resource allocation and ultimately optimize the industrial structure [14,15,16,17]. Consequently, governments have attached great importance to the policies governing the high-tech industry in many regions of China [18,19].
With the acceleration of China’s urban development process, individual cities have increasingly come to rely on combinations of infrastructure, transportation, and information networks to form urban agglomerations [20,21]. The urban agglomeration has become the new carrier for high-tech innovation and economic growth, and the construction of urban agglomeration with regional economic integration as the core has become a general trend [22]. However, the inter-city development of high-tech industry is yet extremely imbalanced in many regions [23,24]. There is a huge difference between actual effects and stated goals of the policies [25,26]. Scientific evaluation of high-tech industry policies can ensure the scientific deployment and maintenance of policies and the timeliness of policy adjustment for the long-term and sustainable development of high-tech industries [27]. In order to better promote the development of the high-tech industry in a region, it is necessary to evaluate and optimize high-tech industry policies from the perspective of regional coordination.
Previous studies on high-tech industry policies have focused on the impact of a certain type of policy or the descriptive analysis of a policy text’s content at a macro level, lacking a systematic evaluation of single policy texts and an evaluation from the perspective of regional coordination. To bridge the gap, this study selects the BTH urban agglomeration as a case and uses the PMC-Index model and text mining to implement an evaluation for high-tech industry policies issued in this region. The contributions of the present work mainly include the following points. Firstly, high-tech industry policies are analyzed according to text mining technology and the PMC-Index model, from the perspective of regionally-coordinated development. Secondly, an evaluation indicator system of high-tech industry policies is proposed based on the PMC-Index model. Finally, seven high-tech industrial policies of the BTH region are isolated as samples for evaluating their respective advantages and disadvantages, and the suggestions for improvement are given.
The remainder of this paper is structured as follows. Section 2 is a literature review. Section 3 introduces the study case, policy samples, and methodology. Section 4 presents and analyses the research results. Section 5 concludes the paper and summarizes the limitations.

2. Literature Review

The literature on the evaluation of high-tech industry policies mainly involves two streams of literature: the impact of policies and the policies themselves.
Scholars have mostly studied the impact of policies on different fields and used a variety of econometric methods for estimating impact assessments with the help of quasi-natural experiment designs. The common methods have included propensity score matching (PSM), difference in differences (DID) and regression discontinuity (RD) [28]. Bruhn and McKenzie [29] investigated the impacts of the In-Tech program in Poland on science–industry collaboration, research and innovation, and product commercialization using the RD method. Xu and Liu [30] discussed the impact of the high-tech identification policy on corporate innovation by applying the PSM approach. Liu, et al. [31] used the Heckman two-step method and the PSM-DID method to study the influence of the high-tech enterprise certification policy on firm innovation in China. Evaluating the impact of policies is beneficial to the formulation and improvement of policies. It is equally important to evaluate the scientificity and rationality of policies themselves.
Early research related to the evaluation of policy text content has focused on qualitative analysis. Most of these policy evaluations have involved text interpretation [32]. With the deepening of public policy research, policy evaluation has become increasingly comprehensive in scope and gradually focused on the combination of qualitative and quantitative research [33]. The mainstream paradigm is based on the policy instruments theory proposed by Rothwell and Zegveld [34], dividing policy instruments into supply type, environment type and demand type, and combining them with text mining and bibliometrics methods, such as policy coding, quantitative scale tables, complex network and co-word analysis. Based on Chinese central government documents, Zhou, et al. [27] used the methods of co-word analysis and social network analysis to study the high-tech industry policy in four dimensions: themes, objects, key process along industry chain, and measures. Zhi, et al. [35] investigated the evolution of China’s PV industry policy from the perspective of policy instruments, and their results show that the policies had a tendency from supply-side to demand-side. Yang, et al. [36] built a research framework based on bibliometrics for exploring Chinese information technology policy. However, the literature has mostly discussed high-tech industry policies from a macro perspective, and lacks a systematic evaluation of the single policy for high-tech industry policies. In addition, previous research methods have mostly relied more on qualitative analysis and human judgment, with strong subjectivity.
In 2010, scholars began to adopt the PMC-Index model proposed by Ruiz Estrada [37], which offered a quantitative evaluation method for the single policy text. At present, this method has been mainly applied in cultivated land protection policy [38], pork industry policy [39], green development policy [40], waste separation management policy [41] and employment promotion policy [42]. There is no big difference in the methodology of these studies, and most have applied the PMC-Index model with integration of text mining methods. In view of the application in these policy fields, this study introduces the PMC-Index model into the field of high-tech industrial policy to fill the gap. The PMC-Index model has two main advantages [37,38,39]: (1) it can quantitatively evaluate each single policy from multiple dimensions and distinguish the internal consistency of the specific policies in a relatively objective way; and (2) the strengths or weaknesses of a policy text can also be directly observed through the PMC-Index and PMC-Surface. Furthermore, this study establishes an evaluation index system for high-tech industrial policies and brings the measurement of regional industry synergy into the policy evaluation model.

3. Materials and Methods

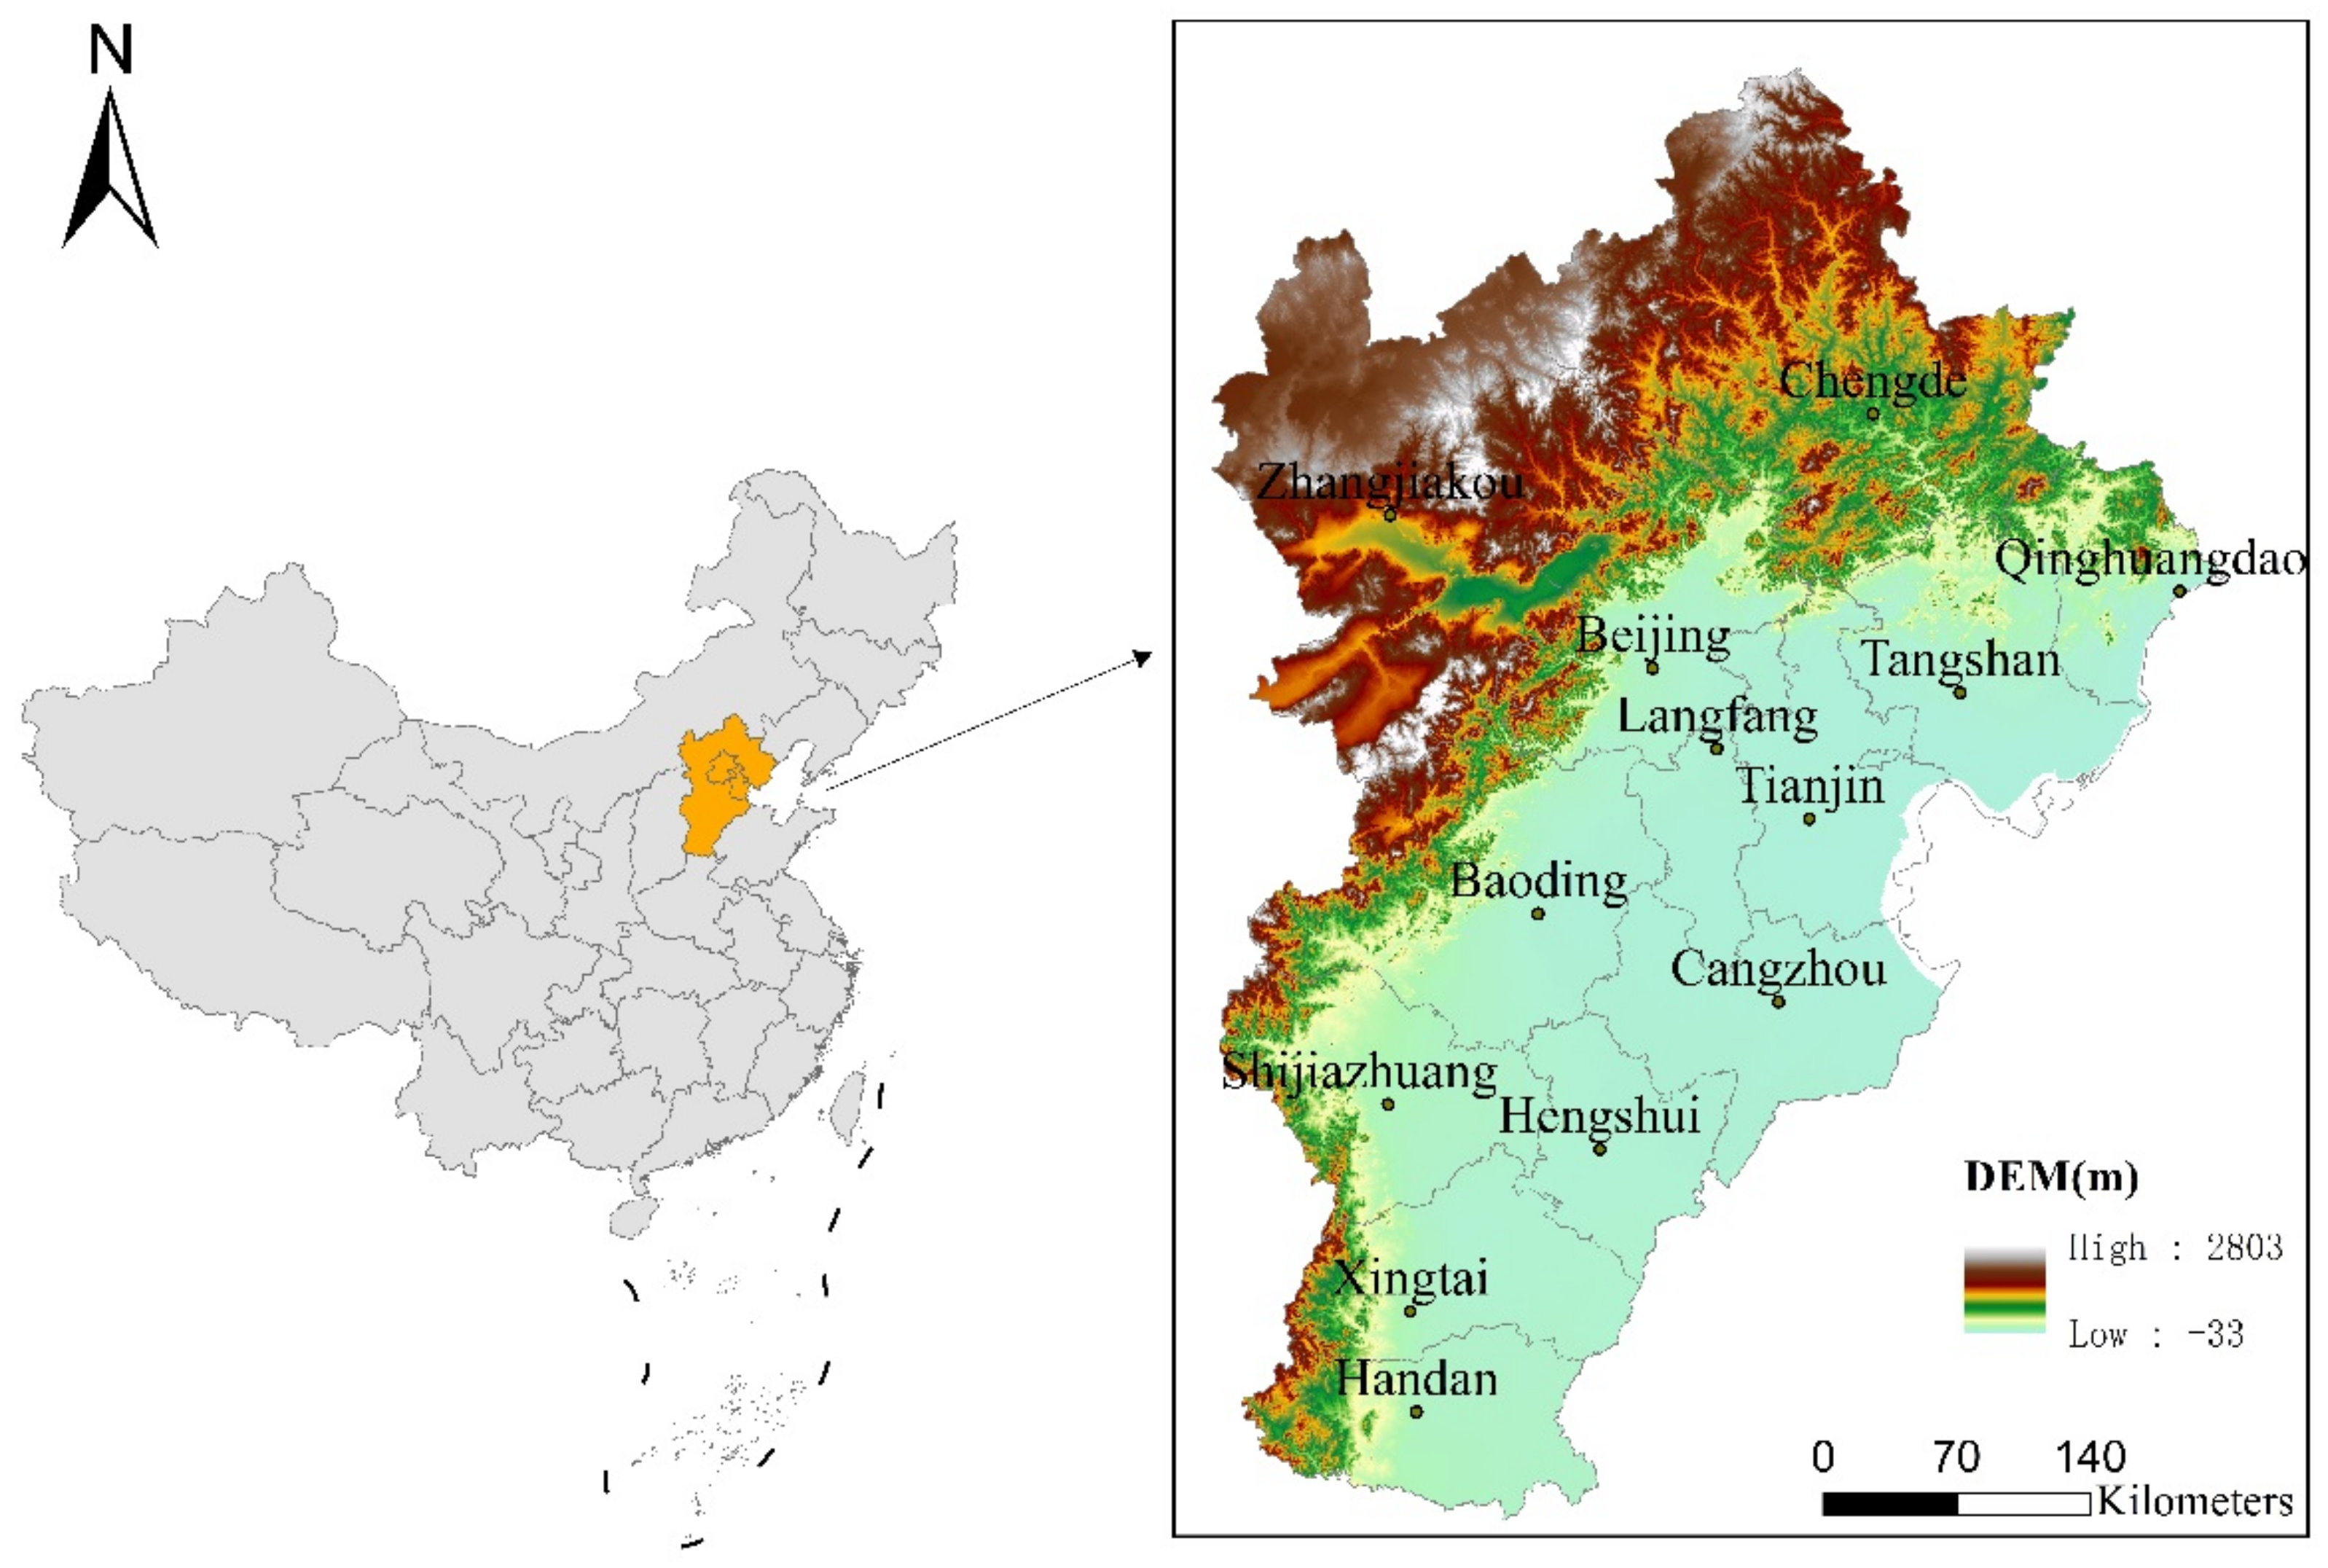
3.1. Case Description

The Beijing-Tianjin-Hebei (BTH) region is an urban agglomeration and also one of the most dynamic and advanced regions in China [43]. It includes two provincial municipalities (Beijing, Tianjin) and 11 cities in Hebei Province (Figure 1). According to the raw data of the China Statistical Yearbook, the following is calculated regarding this region. It covers an area of about 216,000 square kilometers, accounting for 2.3% of China’s total. By the end of 2019, there were 110 million permanent residents in the region, accounting for 8.1% of China’s total, and the region’s GDP was 8.5 trillion-yuan, accounting for 8.6% of China’s total. The BTH region is located in the northeastern part of the North China Great Plain, bordering on the Bohai Sea. The terrain of this area inclines from the Northwest to Southeast, including various types of landforms.
Promoting the coordinated development of the BTH is a major national strategy in China, and its core is to orderly relieve “Beijing’s non-capital functions”. Accelerating the collaborative innovation and the synergy of high-tech industries is an important task of regional coordinated development [44,45]. Unfortunately, the development of high-tech industry in the three places is unbalanced, and the level of Beijing is much higher than that of Tianjin, with Hebei reaching the lowest level [46]. The Chinese “Fourteenth Five-Year Plan”, issued in 2021, was proposed to “accelerate the coordinated development of the BTH” and “promote the deep integration of the BTH industry and innovation chains”. Due to a lack of effective transformation and docking mechanisms for innovation, Beijing’s technological output often flows across Tianjin and Hebei to China’s southeast coastal areas [47]. The BTH region should form an effective industry chain layout around key regional industries.

3.2. Policy Samples

The high-tech industry policies were all issued by the local governments in the BTH region, and the policy texts can be retrieved in the database “PKULAW” (PKULAW is the earliest and largest database of laws and regulations in China, including a large number of published official laws and regulations since the founding of the People’s Republic of China). To ensure that the policies were effective, the texts were screened one by one according to the following criteria: (1) the title, document number, printing time and other relevant information are clear and complete; (2) areas intersecting with high-tech industries (e.g., technology-based small- and medium-sized enterprises and strategic emerging industries) are removed for the sake of clarity; (3) although some policy texts are not marked “high-tech industry”, they are included as their contents are sufficiently relevant; (4) policy types are considered to include local planning, opinions, notices, and other guidance and normative documents; and (5) policies are taken covering the period from 2010 to 2020. Mainly considering the process of coordinated development in the BTH region and the evolution characteristics of regional high-tech industrial policies, 2010 was selected as the starting year and the year 2020, before the beginning of this study, was selected as the end time. Finally, seven policies were found suitable according to these criteria and selected as the evaluation objectives (Table 1).

3.3. Establishment of the PMC-Index Model

Ruiz Estrada proposed the PMC-Index model, which is supplied with data from text mining technology and uses a binary system to balance the effects of various influencing factors [37]. Balanced variables facilitate linear data fusion for various indicators to enhance accuracy and prevent subjective judgment. It is a policy measurement model that facilitates scientific and quantitative evaluations. Ruiz Estrada asserts that such modeling is an empirical endeavor supported by a variety of theories and quantitative or qualitative elements related to the causes and effects of social policies [37]. The PMC-Index model is based on an “Omnia Mobilis” assumption, where every entity on the globe is moving and interrelated [37]. All relevant variables should be incorporated into the model to the greatest extent possible under this assumption, and no relevant variables can be deleted [38]. This assumption is contrary to the idea that certain conditions or variables are static or interchangeable with others. The PMC-Index and PMC-Surface can show the internal consistency of policies and reveal the advantages and disadvantages of any policy [39,40]. The PMC-Index model can be implemented in four steps (Figure 2).

3.3.1. Variable Selection

Variable selection facilitates the deep processing of intelligent data as a fundamental step in the policy evaluation using the PMC-Index model. With the use of ROSTCM (a software for content mining and analysis), the content of the policy text samples was segmented and the vocabulary was sorted in descending order of frequency. After eliminating redundant and interferential phrasing such as “nation”, “society”, “high-tech”, “development” and “promote”, the 60 most frequent and relevant words were selected for further analysis and reference. (Table 2).
Furthermore, a semantic network graph of the high-frequency theme words was constructed with the help of Gephi (a software for complex network analysis), as shown in Figure 3. The thickness of the line in the figure indicates the strength of the connection between words. The thicker the line is, the stronger the correlation is. In the network graph, the high-frequency theme words in the high-tech industry policy are combined in the form of network, and the structural relationship between the words is intuitively reflected in the form of image, which will provide an important reference for the variable setting in the construction of the PMC-Index model. According to the position of words in the network, the words can be divided into four groups, and the words in the central position have denser connections with the other words. As the first group, “Enterprise” is at the center of the network, and this word has the highest density of connection with the other words, indicating that it is the core theme word of the policy texts. “Innovation”, “Management”, “Organization”, “Technology”, “College”, and “Agglomeration” are close to the central position, composing the second group, and they have strong correlations with the first group, which indicates that the high-tech industrial policies emphasize the technology innovation of enterprises, organization and management of enterprises, cooperation between enterprises and colleges, and enterprise agglomeration. “Property rights”, “Government”, “Tax revenue”, “Service”, “Project”, “Advance”, “Platform”, “Research and development”, “Investment”, “Cultivation”, and “Industry park”. According to the connections between the third and the above groups, it is indicated that the policy texts also pay attention to enterprise technology investment, enterprise property, the construction of industrial parks and government tax preferences. The remaining words belong to the fourth group, which is at the edge of the network, and it is indicated that talent introduction, capital investment, industry chain management and innovation environment are relatively important in the high-tech industrial policies.
The evaluation system was established according to the classical framework of the PMC-Index model. Firstly, nine main-variables need to be selected., the following main-variables policy type (X1), policy timeliness (X2), incentive measures (X3), policy function (X4), implementation mechanism (X5), policy operability (X6), policy release agency (X8), and policy receptor (X9) were selected with reference to the universal standard variables of the related research as listed in Table 3, and the one main variable regional industry synergy (X7) was selected according to the characteristics of the BTH’s coordinated development. Secondly, the high-tech industrial policy also has specific measures with different dimensions under each main-variable. Hence, each main variable is further decomposed into several sub-variables according to the text mining. For example, incentive measures (X3) involve talent introduction and training (X3:1), capital investment (X3:2), tax preference (X3:3), construction of industrial park (X3:4), intellectual property protection (X3:5), financial measures (X3:6), and public service (X3:7). Meanwhile, some of the sub-variables are appropriately improved according to the literature (Table 3). Finally, a PMC-Index model evaluation indicator system is constructed of nine main variables and 40 sub-variables (Table 3). The main variables are encoded by X1 to X9 and the sub-variables are encoded by X1:1 to X9:5.
Table 4 shows the specific evaluation standard for the sub-variables. The content of each policy text is analyzed according to the sub-variable evaluation standard. If positive, the value is “1”; otherwise, the value is “0”.

3.3.2. Building a Multi-Input-Output Table

As shown in Table 5, a multi-input-output table is established to quantify the values of the main variables and provide a data analysis framework for the following specific calculation of the PMC-Index model. Based on the “Omnia Mobilis” assumption described above, the influence of every variable is balanced as much as possible by setting each main variable or sub-variable with the same weight [37].

3.3.3. PMC-Index Measurement

The values of sub-variables are set according to Formulas (1) and (2), and the values of the main variables are calculated by Formula (3). The PMC-Index is calculated by Formula (4).
X ~ N 0 , 1
X = X R : 0 ~ 1
X t = j = 1 n x t j T x t j
PMC Index = t = 1 m X t
where, t is the ordinal number of main variables, t = 1, 2, 3, …, m. j is the ordinal number of sub-variables, j = 1, 2, 3, …, n. T is the number of the total sub-variables under the corresponding main-variable in analysis.
According to the existing research [37,38,39,48], each of the policies is graded from “Unacceptable” to “Perfect” based on the PMC-Index (Table 6).

3.3.4. PMC-Surface Construction

A PMC-Surface shows the value of PMC-Index in the form of a graph, which can display the advantages and disadvantages of the high-tech industrial policy more intuitively. The main variable is introduced into the PMC-matrix based on the variable score; the PMC-Surface is then calculated according to Formula (5).
PMC Surface = X 1 X 2 X 3 X 4 X 5 X 6 X 7 X 8 X 9

4. Results and Analysis

4.1. The PMC-Index of the Policies

A multi-input-output table of the seven policies was established (Appendix A, Table A1), and the PMC-Index values and grades were calculated, with the results shown in Table 7. On the whole, the high-tech industry policies in the BTH region are excellent on average, because the mean value of the PMC-Index is 6.67. The ranking of the seven policies based on the PMC-Index is P4 > P1 > P3 > P5 > P2 > P7 > P6. According to the grade division, among the seven policies, one is perfect and three are excellent and three are acceptable.

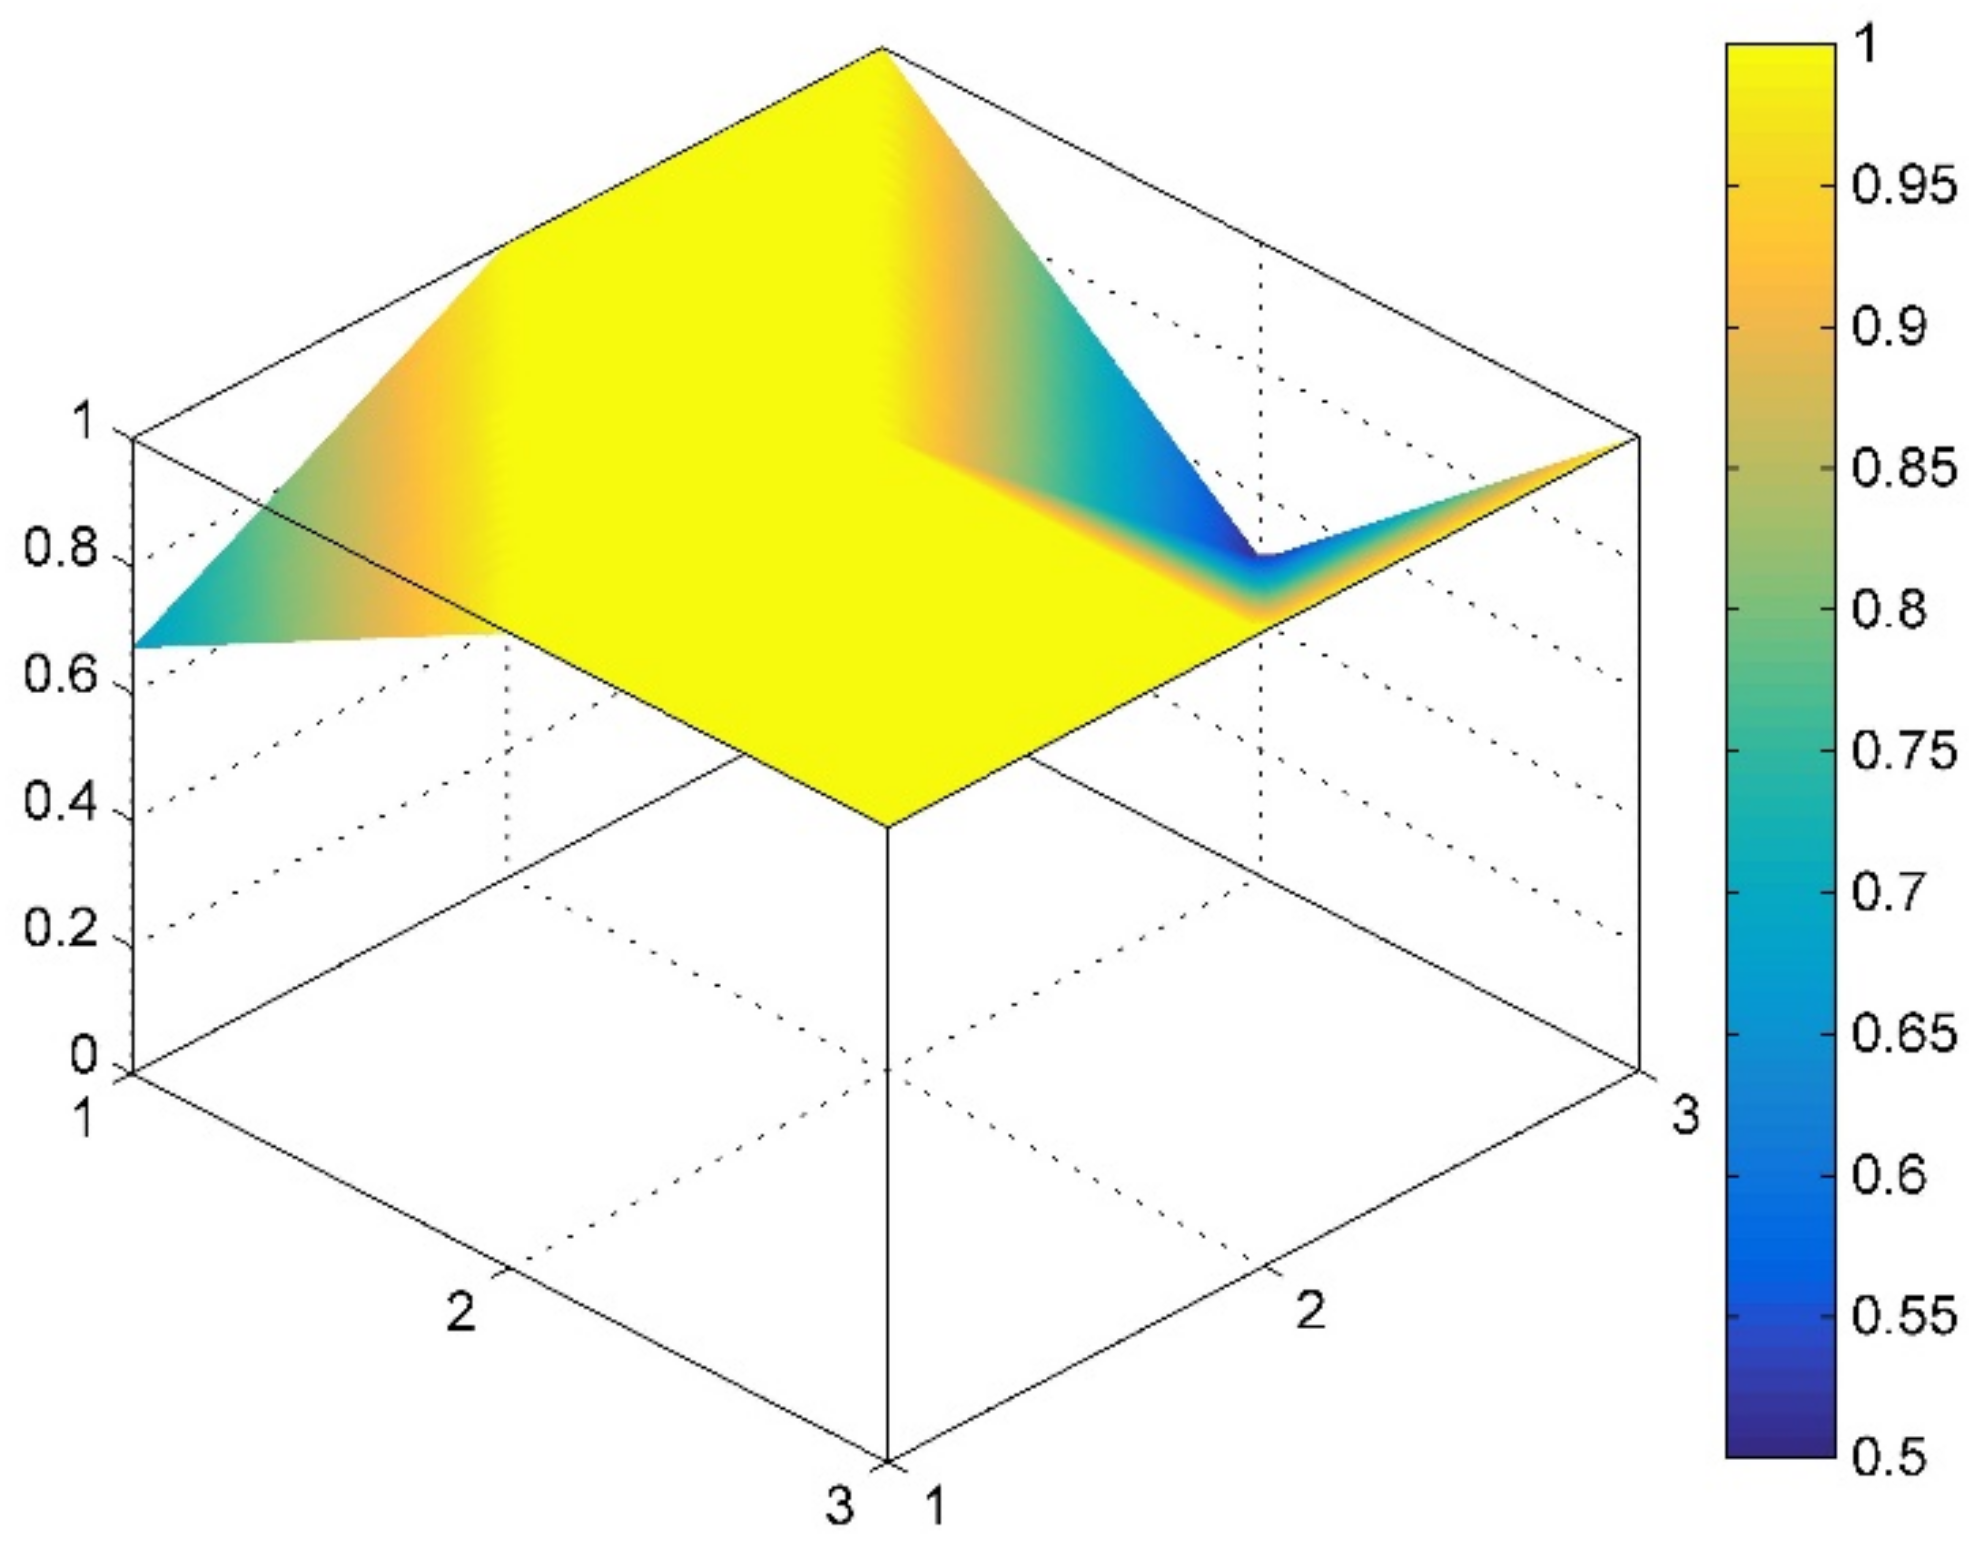
4.2. The PMC-Surface of the Policies

The PMC-Surface displays the quantitative evaluation results of the PMC-Index in a three-dimensional and intuitive way. In the curve graph, the convex or forward part indicates that the score of the corresponding variable is relatively high, while the concave or backward part indicates that the score of the corresponding variable is low. We established the PMC-Matrix and the PMC-Surface graphs and selected P4 with the highest PMC-Index and P6 with the lowest PMC-Index as examples for analysis in this paper, as shown in Figure 4 and Figure 5. The surface of P4 is relatively smooth, compared with P6, and is in the high score range according to color. Therefore, P4 is judged to have a strong performance, with its performance in various indicators more balanced, while P6 has a great weakness.

4.3. Analysis for Each of the Seven Policies

In this study, the evaluations of each policy can be analyzed in detail and the order of policy improvement can be judged according to the following two principles [48]: (1) the first priority is given to the main variable whose value is lower than the mean and the variable with the larger difference has priority; and (2) the second priority is given to the main variable whose value is lower than the full mark but higher than the mean and the variable with the larger difference has priority. A larger difference in the priority indicates poorer policy performance (and thus a priority for optimization). Certainly, the approach is not absolute, but can be adjusted according to the specific situation.
P4 gains the first ranking with a PMC-Index value of 8.17, and its grade is perfect. Among the nine main-variables, except for X1 (policy type) and X8 (policy issuing agency), the other variables get the full score, and only X1 scores lower than average, which indicates that this policy design is relatively reasonable and scientific, and that policy dimensions have been considered comprehensively. As a policy jointly issued by Tianjin Science and Technology Bureau and Binhai New Area government, P4 is the only one jointly issued by two publishing agencies among the seven and thus has a higher score than the others. The optimization of X8 and X1 across the order X8–X1 (from X8 to X1) would enhance the effectiveness of this policy.
P1 gains the second ranking with a PMC-Index value of 7.42, and its grade is excellent. P1 has a loss of scores in the variables of X2 (policy timeliness), X5 (implementation mechanism), X6 (policy operability) and X8 (policy release agency), among which the scores of X5, X6 and X8 are lower than the average. In particular, because of the lack of inter-departmental collaboration and clear working mechanism, the scores of X5 and X6 are 0.14 and 0.18 lower than the average, respectively, and the difference value is much higher than that of X8. Therefore, we can focus on the improvement of P1 from the two indicators X5 and X6 and the optimization path of the policy is X6–X5–X8–X2.
P3 gains the third ranking with a PMC-Index value of 7.05, and its grade is excellent. Seven main variables are higher than or equal to the mean. The variable value of X5 (implementation mechanism) is 0.14 lower than average, while the value of X8 (policy release agency) is 0.04 lower than average. However, among the seven main-variables, the difference values of X1 (policy type), X2 (policy timeliness), and X9 (policy receptor) are 0.17, 0.25, and 0.20 respectively. Thus, the optimization path of this policy is X5–X8–X2–X9–X1.
P5 gains the fourth ranking with a PMC-Index value of 6.82, and its grade is excellent. The scores of X1 (policy type), X2 (policy timeliness), X4 (policy function), and X8 (policy release agency) are lower than the average with the differences of 0.05, 0.43, 0.06, and 0.04, respectively. Among them, the difference between the X2 value and the mean is the largest, and the X2 value of P5 is also the lowest among the seven policies. X3 (incentive measures) also needs to be improved because it is not full score. The improvement path for P5 is X2–X4–X1–X8–X3.
P2 gains the fifth ranking with a PMC-Index value of 5.90, and its grade is acceptable. The values of X3 (incentive measures), X4 (policy function), X7 (regional industry synergy), X8 (policy release agency), and X9 (policy receptor) are below average and the differences from the average are 0.27, 0.26, 0.29, 0.04, and 0.37, respectively. P2 has a low value of X9 (policy receptor) because it only covers the government and enterprises. X1 (policy type) and X2 (policy effectiveness) are 0.17 and 0.25 lower than the full score respectively. Thus, the optimization path of the policy is X9–X3–X4–X7–X8–X2–X1.
P7 gains the sixth ranking with a PMC-Index value of 5.76, and its grade is acceptable. The scores of X1 (policy type), X4 (policy function), X6 (policy operability), X7 (regional industry synergy), X8 (policy release agency), and X9 (policy receptor) are below average with differences of 0.21, 0.06, 0.18, 0.79, 0.04, and 0.17, respectively. The policy does not involve the content of the BTH regional industry synergy, so it is the only policy with X7 score of 0. The best performance of the policy lies in X2 (policy timeliness) and X5 (implementation mechanism), which get the full score. The improvement path for P7 is X7–X1–X6–X9–X4–X8–X3.
P6 gains the last ranking with a PMC-Index value of 5.30, and its grade is acceptable. X6 (policy operability) and X7 (regional industry synergy) get full score and only the two variables are not lower than the mean. X5 (implementation mechanism) has a value of 0.33, and it is the variable with the largest difference (0.48) between its score and the mean value among all main-variables. In term of the implementation mechanism, P6 only involves the leading organization of policy implementation while failing to include the working mechanism and interdepartmental collaboration. The differences between the other main-variables and their mean value are 0.21, 0.43, 0.27, 0.06, 0.04, and 0.17, respectively. Therefore, the improvement path of P6 is X5–X2–X3–X1–X9–X4–X8.

4.4. Comparative Analysis

The characteristics and problems of high-tech industry policies in the BTH region are further clearly expressed in this study by performing a horizontal comparative analysis of the seven policies based on the multi-input-output table (Table 7).
X1 (policy type) has a mean value of 0.71, ranking seventh among the nine main-variables. This variable average is low, so that it is an area that needs to be especially strengthened. The policy type determines whether a policy has features such as predicting, proposal, describing, supervision, diagnosis, and guidance. Except for P1, which is relatively comprehensive, the other policies are somewhat deficient, mainly because of the lack of diagnosis and describing content.
X2 (policy timelines) has a mean value of 0.68 with ranking eighth of all the main variables. Therefore, it is also a deficiency that needs to be urgently improved. Policy timelines mainly involve the combination of long-term, medium-term, short-term, and current year objectives. Except for P4 and P7, which score full marks in this variable and are comprehensively involved in goal setting, the other policies lose points mainly due to the lack of long-term goals.
The mean value of X3 (incentive measures) is 0.84, ranking third among the nine main-variables. To promote the implementation of policy objectives, a series of incentive measures should be usually formulated in the content when policies are introduced [40]. The incentive measures of the high-tech industry policy mainly include the following categories: talent introduction and training, capital investment, tax preference, construction of industrial park, intellectual property protection and financial measures. Among these policies, P1, P3, and P4 all involve the above incentive measures. The other policies generally lack one or two types of incentive measures and need to supplement public service and financial measures.
The mean value of X4 (policy function) is 0.86, ranking second of the nine main variables. Policy function is the inherent attribute of policy, which refers to the role and expected effect that the policy can play in the implementation process [40]. High-tech industrial policies mainly involve technological innovation, government procurement, achievement transformation and institutional constraints and normative guidance. Only P1, P3, and P4 contain the above functions, and the other policies do not involve government procurement or achievement transformation.
X5 (implementation mechanism) has a mean value of 0.81, ranking fourth in the main variables. The implementation mechanism is very important for one policy, and the high-tech industrial policy is no exception. It mainly involves organizational leadership, working mechanism and departmental collaboration [39]. P1, P3, and P6 policies do not earn full marks on X5, with the main reason for point loss being that none of the three policies involved department collaboration.
X6 (policy operability) has a mean value of 0.93, ranking first of the nine main variables, which shows that the high-tech industrial policies of the BTH region are relatively comprehensive in terms of sufficient basis, clear objective, scientific plan, and clear responsibility. Except for P1 and P7, which lack clear responsibility, the other policies gain full marks on X6.
The mean value of X7 (regional industry synergy) was 0.79, ranking fifth among the main variables. As a system of regional economic development, urban agglomeration constitutes a region under the current innovation network [19]. Policymakers face the challenge of promoting deep coordination in the industry chain and innovation chain in the BTH region [44]. P2 and P7 scored below average while the other policies earned full marks, which indicates that policymakers pay attention to the coordination of regional industrial chain or innovation chain in the BTH region.
X8 (policy release agency) is the main variable with the worst performance, and its mean value is only 0.29. P4 earned 0.5, and the other policies all earned only 0.25. Generally speaking, the joint issuance of policies by multiple departments is conducive to the comprehensiveness of a policy [49]. P2, P3, P5, and P6 are issued by the government, P1 and P7 are issued by the government functional department, but P4 is jointly issued by the government and the government functional department.
The average value of X9 (policy receptor) is 0.77, ranking sixth among the main variables. P1, P4, and P5 all get full marks, and P1, P3, P4, and P5 score higher than the average, indicating that the orientation of these policy receptors is relatively clear. P2, P6, and P7 score lower than the average, and P2 earns the lowest value, which is only 0.4. The receivers of high-tech industrial policies generally include local government, industry park, enterprise, college or university and scientific research unit. However, some policies for high-tech industry in the BTH region need to supplement these receivers.

5. Conclusions and Discussion

In this study, with the BTH urban agglomeration as a case, a combination of the PMC-Index model and text mining was introduced to implement an evaluation for the high-tech industry policies based on the policy texts. It is found that the policies in the case are generally reasonable but there is still much room for improvement, and the shortcomings of each policy were analyzed and improved according to the multi-input-output table. The consistency and completeness of policy texts is a significant factor influencing the degree of achievement of policy objectives [38]. However, the existing literature focuses on the policy impact [30,31], and few scholars have comprehensively evaluated different policy texts in the field of high-tech industry policies. This study suggests the advantages of the PMC-Index model on evaluating this aspect of high-tech industry policies, though the PMC-Index model has been maturely used in other public policy areas [38,39,40,41,42]. Furthermore, the BTH region, similar to other urban agglomerations around China, faces the challenge of promoting the regionally-coordinated development and low carbon development at present [50,51]. In this view, it is also important to evaluate the consistency of high-tech industry policies in a region.
The main conclusions can be summarized as follows. Firstly, the design of high-tech industry policies in the BTH region is reasonable in general. The PMC-Index values of the seven policies range from 5.30 to 8.17 with an average of 6.67. Secondly, the high-tech industry policy levels of Beijing, Tianjin, and Hebei are relatively balanced. Among the two policies in Beijing, one is excellent and the other is acceptable; among the two policies of Tianjin, one is perfect and the other is acceptable; and among the three policies of Hebei, two are excellent and one is acceptable. Thirdly, the overall performance of these polices on regional industry synergy (X7) is good, because all policies except for P2 and P7 have full scores, which shows that the BTH region attaches importance to the coordinated development of the high-tech industries. Fourthly, there is still much room for improvement in the high-tech industry policies of the BTH region and the performances of the policies in terms of policy release agency, policy timeliness, policy type and policy receiver are comparatively weak. Specific improvements can be made with reference to the evaluation standards and the multi-input-output table. The values of these variables may provide a workable foundation for policy improvements.
Because it is difficult to effectively measure or quantify the policy, high-tech industry policy evaluation is a complex work in the field of economics and management. This study develops the evaluation method and index system from the perspective of policy text evaluation and regional collaborative development. At the same time, this research provides a theoretical reference for policymakers to formulate or improve high-tech industrial policies. However, with the change of policy environment, some original evaluation standards might not adapt to the new environment. Hence, the policy cannot be simply evaluated according to this method, and stakeholders also need to take comprehensive factors into consideration including different backgrounds, times and social needs. In addition, there are still some limitations in this study. The limitations of this study are mainly reflected in the choice of variables. In terms of variable setting, some universal standard variables are not only referred to, but some non-standard variables are also set according to this research problem and the characteristics of specific policy texts, which is subjective to some extent. To reduce the subjectivity, future researchers can comprehensively use a variety of text analysis techniques to mine the characteristics of policy texts. Although the data of this study are only from the BTH region, the research method is also applicable to other regions. In addition, regionally-coordinated development is advocated by many regions. Therefore, the high-tech industrial policies of different regions can be selected for comparison in the future.

Author Contributions

Conceptualization, J.L. and Y.X.; methodology, Y.L.; data curation, Y.X.; formal analysis, J.L.; resources, Y.L.; writing—original draft preparation, Y.X.; writing—review and editing, Y.L. and J.L.; project administration, Y.X. All authors have read and agreed to the published version of the manuscript.

Funding

This research was supported by the National Social Science Foundation of China [NO.20VYJ026].

Institutional Review Board Statement

Not applicable.

Informed Consent Statement

Not applicable.

Data Availability Statement

Publicly available datasets were analyzed in this study. This data can be found here: http://www.pkulaw.cn/ accessed on 23 June 2022.

Acknowledgments

The authors would like to acknowledge the professionals who collaborated during this study. We would also like to thank the editor and the anonymous referees at the journal for their insightful comments.

Conflicts of Interest

The authors declare no conflict of interest.

Appendix A

Table A1. Multi-input-output of seven high-tech industrial policies of the BTH region.
P1P2P3P4P5P6P7
X1X1:11011100
X1:21111111
X1:31110000
X1:41111111
X1:51100000
X1:61111111
X2X2:10011001
X2:21111101
X2:31111001
X2:41101011
X3X3:11111101
X3:21111111
X3:31111111
X3:41011101
X3:51111111
X3:61011110
X3:71011001
X4X4:11111111
X4:21011001
X4:31011110
X4:41111111
X4:51111111
X5X5:11111111
X5:21111101
X5:30101101
X6X6:11111111
X6:21111111
X6:31111111
X6:40111110
X7X7:11011110
X7:21111110
X8X8:10000000
X8:20111110
X8:31000000
X8:40001001
X9X9:11111111
X9:21001101
X9:31111111
X9:41011100
X9:51011110

References

  1. Gu, W.; Liu, D.; Wang, C.; Dai, S.; Zhang, D. Direct and indirect impacts of high-tech industry development on CO2 emissions: Empirical evidence from China. Environ. Sci. Pollut. Res. 2020, 27, 27093–27110. [Google Scholar] [CrossRef] [PubMed]
  2. Zheng, Y.; Cheng, Y.; Li, L. Factors affecting regional economic synergy in China–Based on research on high-tech industry. IEEE Access 2020, 8, 14123–14133. [Google Scholar] [CrossRef]
  3. Chen, W.; Lu, W.; Yanbo, X.; Ruiqi, L. Revealing spatial spillover effect in high-tech industry agglomeration from a high-skilled labor flow network perspective. J. Syst. Sci. Complex. 2022, 35, 839–859. [Google Scholar]
  4. Yang, N.; Liu, Q.; Chen, Y. Does industrial agglomeration promote regional innovation convergence in China? Evidence from high-tech industries. IEEE T Eng. Manag. 2021, 1–14. [Google Scholar] [CrossRef]
  5. National Bureau of Statistics of China (NBSC). China Statistics Yearbook on High Technology Industry; China Statistics Press: Beijing, China, 2018. (In Chinese) [Google Scholar]
  6. Pan, W.; Xie, T.; Wang, Z.; Ma, L. Digital economy: An innovation driver for total factor productivity. J. Bus. Res. 2022, 139, 303–311. [Google Scholar] [CrossRef]
  7. Zhang, T.; Sun, B.; Li, W.; Zhou, H. Information communication technology and manufacturing decentralisation in China. Pap. Reg. Sci. 2022, 101, 619–637. [Google Scholar] [CrossRef]
  8. Wu, B.; Yang, W. Empirical test of the impact of the digital economy on China’s employment structure. Financ. Res. Lett. 2022, 49, 103047. [Google Scholar] [CrossRef]
  9. Li, T.; Wang, X. Digital economy empowers China’s “dual cycle” strategy–Internal logic and practice path. Economist 2021, 5, 102–109. (In Chinese) [Google Scholar]
  10. Chen, X.; Liu, X.; Zhu, Q. Comparative analysis of total factor productivity in China’s high-tech industries. Technol. Forecast. Soc. Change 2022, 175, 121332. [Google Scholar] [CrossRef]
  11. Huang, S.; Shi, Y.; Chen, Q.; Li, X. The growth path of high-tech industries: Statistical laws and evolution demands. Phys. A Stat. Mech. Appl. 2022, 603, 127719. [Google Scholar] [CrossRef]
  12. Li, H.; Sheng, Y.; Ding, Y. Research on the institutional influence on the development of the high-tech industry. IEEE Access 2020, 8, 90895–90906. [Google Scholar] [CrossRef]
  13. Rodrik, D. Where are we in the economics of industrial policies? Front. Econ. China 2019, 14, 329–335. [Google Scholar] [CrossRef]
  14. Hong, J.; Feng, B.; Wu, Y.; Wang, L. Do government grants promote innovation efficiency in China’s high-tech industries? Technovation 2016, 57–58, 4–13. [Google Scholar] [CrossRef]
  15. Lin, J.Y.; Wang, W.; Xu, V.Z. Catch-up industrial policy and economic transition in China. World Econ. 2020, 44, 602–632. [Google Scholar] [CrossRef]
  16. Cai, J.; Harrison, A. Industrial policy in China: Some intended or unintended consequences? ILR Rev. 2019, 74, 163–198. [Google Scholar] [CrossRef]
  17. Tseng, M.L.; Negash, Y.T.; Nagypal, N.C.; Iranmanesh, M.; Tan, R.R. A causal eco-industrial park hierarchical transition model with qualitative information: Policy and regulatory framework leads to collaboration among firms. J Env. Manag. 2021, 292, 112735. [Google Scholar] [CrossRef] [PubMed]
  18. Lin, S.; Lin, R.; Sun, J.; Wang, F.; Wu, W. Dynamically evaluating technological innovation efficiency of high-tech industry in China: Provincial, regional and industrial perspective. Socio-Econ. Plan. Sci. 2020, 74, 100939. [Google Scholar] [CrossRef]
  19. Wang, Z.; Wang, Y. Evaluation of the provincial competitiveness of the Chinese high-tech industry using an improved TOPSIS method. Expert Syst. Appl. 2014, 41, 2824–2831. [Google Scholar] [CrossRef]
  20. Zhang, D.; Huang, Q.; He, C.; Wu, J. Impacts of urban expansion on ecosystem services in the Beijing-Tianjin-Hebei urban agglomeration, China: A scenario analysis based on the Shared Socioeconomic Pathways. Resour. Conserv. Recycl. 2017, 125, 115–130. [Google Scholar] [CrossRef]
  21. Li, Y.; Wang, J.; Xian, D.; Zhang, Y.; Yu, X. Regional consumption, material flows, and their driving forces: A case study of China’s Beijing–Tianjin–Hebei (Jing–Jin–Ji) urban agglomeration. J. Ind. Ecol. 2020, 25, 751–764. [Google Scholar] [CrossRef]
  22. Hao, L.; Chen, X.; Min, C. The impact of urban sprawl and smart city construction on regional coordination. Sci. Program. 2021, 2021, 5589571. [Google Scholar] [CrossRef]
  23. Zhang, Y.; Zheng, H.; Yang, Z.; Li, Y.; Liu, G.; Su, M.; Yin, X. Urban energy flow processes in the Beijing–Tianjin–Hebei (Jing-Jin-Ji) urban agglomeration: Combining multi-regional input–output tables with ecological network analysis. J. Clean Prod. 2016, 114, 243–256. [Google Scholar] [CrossRef]
  24. Li, L.; Liu, B.; Liu, W.; Chiu, Y. Efficiency evaluation of the regional high-tech industry in China: A new framework based on meta-frontier dynamic DEA analysis. Socio-Econ. Plan. Sci. 2017, 60, 24–33. [Google Scholar] [CrossRef]
  25. Xiao, Z.; Du, X.; Fei, F. Convergence in China’s high-tech industry development performance: A spatial panel model. Appl. Econ. 2017, 49, 5296–5308. [Google Scholar] [CrossRef]
  26. Chen, H.; He, P.; Zhang, C.-X.; Liu, Q. Efficiency of technological innovation in China’s high-tech industry based on DEA method. J. Interdiscip. Math. 2017, 20, 1493–1496. [Google Scholar] [CrossRef]
  27. Zhou, N.; Wu, Q.; Hu, X. Research on the policy evolution of china’s new energy vehicles industry. Sustainability 2020, 12, 3629. [Google Scholar] [CrossRef]
  28. Imbens, G.W.; Wooldridge, J.M. Recent Developments in the Econometrics of Program Evaluation. J. Econ. Lit. 2009, 47, 5–86. [Google Scholar] [CrossRef] [Green Version]
  29. Bruhn, M.; McKenzie, D. Can grants to consortia spur innovation and science-industry collaboration? regression- discontinuity evidence from Poland. World Bank Econ. Rev. 2017, 33, 690–716. [Google Scholar] [CrossRef] [Green Version]
  30. Xu, J.; Liu, L. Innovation additionality effect and action mechanism of high-tech enterprises’ identification policy. Sci. Res. Manag. 2020, 41, 135–141. (In Chinese) [Google Scholar]
  31. Liu, H.L.; Xing, F.; Li, B.; Yakshtas, K. Does the high-tech enterprise certification policy promote innovation in China? Sci. Public Policy 2020, 47, 678–688. [Google Scholar] [CrossRef]
  32. Jenkins-Smith, H.; Krutz, J.; Carlson, N.; Weible, C. The 2019 Public Policy Yearbook: Tracking a decade of trends in public policy research. Policy Stud. J. 2019, 47, S6–S16. [Google Scholar] [CrossRef] [Green Version]
  33. Prior, L.; Hughes, D.; Peckham, S. The discursive turn in policy analysis and the validation of policy stories. J. Soc. Policy 2012, 41, 271–289. [Google Scholar] [CrossRef] [Green Version]
  34. Rothwell, R.; Zegveld, W. Reindustrialization and Technology; Longman Group Limited: London, UK, 1985; p. 282. [Google Scholar]
  35. Zhi, Q.; Sun, H.; Li, Y.; Xu, Y.; Su, J. China’s solar photovoltaic policy: An analysis based on policy instruments. Appl. Energy 2014, 129, 308–319. [Google Scholar] [CrossRef]
  36. Yang, C.; Huang, C.; Su, J. A bibliometrics-based research framework for exploring policy evolution: A case study of China’s information technology policies. Technol. Forecast. Soc. Change 2020, 157, 120116. [Google Scholar] [CrossRef]
  37. Ruiz Estrada, M.A. Policy modeling: Definition, classification and evaluation. J. Policy Modeling 2011, 33, 523–536. [Google Scholar] [CrossRef]
  38. Kuang, B.; Han, J.; Lu, X.; Zhang, X.; Fan, X. Quantitative evaluation of China’s cultivated land protection policies based on the PMC-Index model. Land Use Policy 2020, 99, 105062. [Google Scholar] [CrossRef]
  39. He, R.; Liu, J.; Li, C.; Xiong, J. Quantitative evaluation of China’s pork industry policy: A PMC index model approach. Agriculture 2021, 11, 86. [Google Scholar] [CrossRef]
  40. Dai, S.; Zhang, W.; Zong, J.; Wang, Y.; Wang, G. How effective is the green development policy of China’s yangtze river economic belt? A quantitative evaluation based on the PMC-Index Model. Int. J. Env. Res. Public Health 2021, 18, 7676. [Google Scholar] [CrossRef] [PubMed]
  41. Liu, F.; Liu, Z. Quantitative evaluation of waste separation management policies in the Yangtze River Delta based on the PMC Index Model. Int. J. Env. Res Public Health 2022, 19, 3815. [Google Scholar] [CrossRef] [PubMed]
  42. Chen, T.; Rong, J.; Peng, L.; Yang, J.; Cong, G.; Fang, J. Analysis of social effects on employment promotion policies for college graduates based on data mining for online use review in China during the COVID-19 pandemic. Healthcare 2021, 9, 846. [Google Scholar] [CrossRef] [PubMed]
  43. Hao, Y.; Zhang, M.; Zhang, Y.; Fu, C.; Lu, Z. Multi-scale analysis of the energy metabolic processes in the Beijing–Tianjin–Hebei (Jing-Jin-Ji) urban agglomeration. Ecol. Model. 2018, 369, 66–76. [Google Scholar] [CrossRef]
  44. Zhao, T.; Song, Z.; Li, T. Effect of innovation capacity, production capacity and vertical specialization on innovation performance in China’s electronic manufacturing: Analysis from the supply and demand sides. PLoS ONE 2018, 13, e0200642. [Google Scholar] [CrossRef] [PubMed] [Green Version]
  45. Cao, X.; Chen, B.; Si, Y.; Hu, S.; Zeng, G. Spatio-temporal evolution and mechanism of regional innovation efficiency: Evidence from Yangtze River Delta Urban Agglomeration of China. PLoS ONE 2021, 16, e0253598. [Google Scholar] [CrossRef]
  46. Ding, S. A novel discrete grey multivariable model and its application in forecasting the output value of China’s high-tech industries. Comput. Ind. Eng. 2019, 127, 749–760. [Google Scholar] [CrossRef]
  47. Liu, Z.; Wang, T.; Sonn, J.W.; Chen, W. The structure and evolution of trade relations between countries along the Belt and Road. J. Geogr. Sci. 2018, 28, 1233–1248. [Google Scholar] [CrossRef] [Green Version]
  48. Yang, T.; Chen, X.; Li, X. Evaluation and analysis of new-energy vehicle industry policies in the context of technical innovation in China. J. Clean Prod. 2021, 281, 125126. [Google Scholar] [CrossRef]
  49. Wu, W.; Sheng, L.; Tang, F.; Zhang, A. Quantitative evaluation of manufacturing innovation policy based on feature analysis. Stud. Sci. Sci. 2020, 38, 2246–2257. (In Chinese) [Google Scholar]
  50. Ma, W.; Tian, W.; Zhou, Q.; Miao, Q.; Zhang, W. Analysis on the temporal and spatial heterogeneity of factors affecting urbanization development based on the GTWR Model: Evidence from the Yangtze River Economic Belt. Complexity 2021, 2021, 7557346. [Google Scholar] [CrossRef]
  51. Chen, X.; Liu, Z.; Zhu, Q. Performance evaluation of China’s high-tech innovation process: Analysis based on the innovation value chain. Technovation 2018, 94–95, 74–75. [Google Scholar] [CrossRef]
Figure 1. The location and cities of China’s BTH region.
Sustainability 14 09338 g001
Figure 2. Steps in the implementation of the PMC-Index model.
Sustainability 14 09338 g002
Figure 3. Network graph of the high-frequency theme words.
Sustainability 14 09338 g003
Figure 4. The PMC-Surface of P4.
Sustainability 14 09338 g004
Figure 5. The PMC-Surface of P6.
Sustainability 14 09338 g005
Table 1. Policy samples for the PMC-Index model.
LabelPolicy NameRelease AgencyRelease Time
P1Notice of Beijing Municipal Commission of Development and Reform on printing and distributing “Beijing high-tech industry development plan during the 13th Five-Year Plan Period”Beijing Municipal Commission of Development and Reform15 November 2016
P2Implementation opinions of the General Office of Tianjin Municipal People’s Government on accelerating the development of high-tech enterprises in TianjinGeneral Office of Tianjin Municipal People’s Government10 July 2015
P3Implementation opinions of the General Office of Hebei Provincial People’s Government on accelerating the cultivation and development of high-tech service industryGeneral Office of Hebei Provincial People’s Government27 July 2012
P4Notice of Tianjin Science and Technology Bureau and Binhai New Area Government on printing and distributing specific measures to promote high quality development of Tianjin Binhai High-tech Industrial Development ZoneTianjin Science and Technology Bureau and Binhai New Area Government4 September 2020
P5Opinions of the General Office of Cangzhou Municipal People’s Government on promoting healthy and rapid development of pharmaceutical industry in our cityGeneral office of Cangzhou Municipal People’s Government, Hebei Province30 November 2017
P6Xingtai high-tech enterprises cultivation planXingtai Science and Technology Bureau14 March 2020
P7Opinions on promoting the development of Zhongguancun’s high-tech enterprisesZhongguancun Science Park Management Committee27 March 2010
Table 2. Statistical frequency of effective words from the policy texts.
VocabularyFrequencyVocabularyFrequencyVocabularyFrequency
Enterprise119Talent16Financing8
Management113Conversion15Loan8
Technology92Resources15Patent7
Innovation60Start a business15Agglomeration7
Service55Research15Demonstration area7
Capital39Cultivation15Launch a pilot project7
Science and technology35Application14Administration7
Research and development30Market14Planning7
Mechanism27Subsidy13Strategy6
Industrialization26Approval11Opinion6
Investment21Government10Research institute6
Organization21Introduction10Industry chain6
Achievements20Basics9Tax revenue6
Affirmation18Area for development9Incubator project6
Advance18Environment9Public6
Property rights18Regulations9Declare6
Knowledge18College8Scientific research6
Platform18Project8Finance6
Engineering17Exemption8Personnel5
Encourage17Insurance8Industry park5
Table 3. Variable selection of the PMC-Index model evaluation.
Main-VariablesSub-VariablesReference
Policy type (X1)Predicting (X1:1); Proposal (X1:2); Describing (X1:3); Supervision (X1:4); Diagnosis (X1:5); Guidance (X1:6)Yang et al. [48]
Policy timeliness (X2)Long-term (X2:1); Medium-term (X2:2); Short-term (X2:3); Current year (X2:4)Kuang et al. [38]
Incentive measures (X3)Talent introduction and training (X3:1); Capital investment (X3:2); Tax preference (X3:3); Construction of industrial park (X3:4); Intellectual property protection (X3:5); Financial measures (X3:6); Public service (X3:7)Dai et al. [40]
Policy function (X4)Technological innovation (X4:1); Government procurement (X4:2); Achievement transformation (X4:3); Institutional constraints (X4:4); Normative guidance (X4:5)Dai et al. [40]
Implementation mechanism (X5)Organizational leadership (X5:1); Working mechanism (X5:2); Department collaboration (X5:3)Li et al. [39]
Policy operability (X6)Sufficient basis (X6:1); Clear objective (X6:2); Scientific plan (X6:3); Clear responsibility (X6:4)Yang et al. [48]
Regional industry synergy (X7)Industry chain (X7:1); Innovation chain (X7:2)Cao et al. [45]
Policy release agency (X8)Party committee 1 (X8:1); Government (X8:2); Development and reform commission 2 (X8:3); Government functional department (X8:4)Wu et al. [49]
Policy receptor (X9)Local government (X9:1); Industry park (X9:2); Enterprise (X9:3); College or university (X9:4); Scientific research unit (X9:5)Yang et al. [48]
1 This refers to the local committees at all levels and grassroots committees of the Communist Party of China. 2 This is a government department responsible for overall planning and coordinating national economic and social development, and comprehensively coordinating economic restructuring.
Table 4. Evaluation standards for the sub-variables.
VariablesEvaluation Standards
X1X1:1Whether there is a pre-judgment on the direction and prospect of the industry in the policy
X1:2Whether there are countermeasures for industrial development in the policy
X1:3Whether there is a description of the current situation of industrial development in the policy
X1:4Whether there is supervision over the process of industrial development in the policy
X1:5Whether there is a diagnosis of the problems in industrial development in the policy
X1:6Whether there is a guiding goal for industrial development in the policy
X2X2:1Whether a 7 year or longer plan is involved in the policy
X2:2Whether a 4–6-year plan is involved in the policy
X2:3Whether a 2–3-year plan is involved in the policy
X2:4Whether a current year plan is involved in the policy
X3X3:1Whether it involves incentive measures for talent introduction and training
X3:2Whether it involves incentive measures for capital investment
X3:3Whether it involves incentive measures for tax preference
X3:4Whether it involves incentive measures for the construction of an industrial park
X3:5Whether it involves incentive measures for intellectual property protection
X3:6Whether it involves incentive measures for finance
X3:7Whether it involves incentive measures for public service
X4X4:1Whether the policy function involves the technological innovation
X4:2Whether the policy function involves the government procurement
X4:3Whether the policy function involves the achievement transformation
X4:4Whether the policy function involves the institutional constraints
X4:5Whether the policy function involves the normative guidance
X5X5:1Whether there is a leading organization for the policy implementation mechanism
X5:2Whether there is a working mechanism for the policy implementation
X5:3Whether it involves the negotiation and communication between departments and between superiors and subordinates
X6X6:1Whether the policy basis is sufficient
X6:2Whether the policy objective is clear
X6:3Whether the policy plan is scientific
X6:4Whether the division of responsibilities of relevant departments is clear
X7X7:1Whether it involves the construction of a regional industry chain
X7:2Whether it involves the construction of a regional innovation chain
X8X8:1Whether the policy release agencies involve the local party committee
X8:2Whether the policy release agencies involve the local government
X8:3Whether the policy release agencies involve the Development and Reform Commission
X8:4Whether the policy release agencies involve the government functional department
X9X9:1Whether the policy receptors involve local governments
X9:2Whether the policy receptors involve industry parks
X9:3Whether the policy receptors involve enterprises
X9:4Whether the policy receptors involve the college or university
X9:5Whether the policy receptors involve the scientific research unit
Table 5. Multi-input-output of each high-tech industrial policy.
Main-VariablesX1X2X3X4X5X6X7X8X9
Sub-variablesX1:1X2:1X3:1X4:1X5:1X6:1X7:1X8:1X9:1
X1:2X2:2X3:2X4:2X5:2X6:2X7:2X8:2X9:2
X1:3X2:3X3:3X4:3X5:3X6:3 X8:3X9:3
X1:4X2:4X3:4X4:4 X6:4 X8:4X9:4
X1:5 X3:5X4:5 X9:5
X1:6 X3:6
X3:7
Table 6. Evaluation grade for policies based on the PMC-Index.
PMC-Index9~87.99~65.99~43.99~0
Evaluation gradesPerfectExcellentAcceptableUnacceptable
Table 7. PMC-Index values and grades of seven high-tech industrial policies of the BTH region.
P1P2P3P4P5P6P7Mean
X11.000.830.830.670.670.500.500.71
X20.750.750.501.000.250.251.000.68
X31.000.571.001.000.860.570.860.84
X41.000.601.001.000.800.800.800.86
X50.671.000.671.001.000.331.000.81
X60.751.001.001.001.001.000.750.93
X71.000.501.001.001.001.000.000.79
X80.250.250.250.500.250.250.250.29
X91.000.400.801.001.000.600.600.77
PMC-Index7.425.907.058.176.825.305.766.67
Evaluation gradesExcellentAcceptableExcellentPerfectExcellentAcceptableAcceptableExcellent
Publisher’s Note: MDPI stays neutral with regard to jurisdictional claims in published maps and institutional affiliations.

