Article

Identifying the Importance of Disaster Resilience Dimensions across Different Countries Using the Delphi Method

by
Carlotta Rodriquez
1,2,*,
José Manuel Mendes
3,4 and
Xavier Romão
5
1
Faculty of Resilience, Rabdan Academy, Abu Dhabi 114646, United Arab Emirates
2
University School for Advanced Studies (IUSS), 27100 Pavia, Italy
3
Centre for Social Studies, University of Coimbra, Colégio de S. Jerónimo, 3000-995 Coimbra, Portugal
4
Faculty of Economics, University of Coimbra, 3004-512 Coimbra, Portugal
5
CONSTRUCT-LESE, Faculty of Engineering, University of Porto, 4200-465 Porto, Portugal
*
Author to whom correspondence should be addressed.
Sustainability 2022, 14(15), 9162; https://doi.org/10.3390/su14159162
Submission received: 21 February 2022 / Revised: 21 July 2022 / Accepted: 22 July 2022 / Published: 26 July 2022

Abstract

:
The article proposes a framework establishing a disaster resilience index applicable worldwide that accounts for differences between countries in terms of development and in terms of the relevance of several resilience dimensions. To achieve this index, countries were clustered using an indicator that reflected their performance according to the Sustainable Development Goals. For each cluster of countries, a Delphi process was used to obtain scores for every resilience dimension and sub-dimension that were then transformed into weights that varied from cluster to cluster to reflect differences in sustainable development. The article discusses the methodology that led to the quantification of the weights according to the Delphi process, as well as its results. The results highlighted the anticipated differences between different groups of countries, but also reflected cluster-specific features that should be accounted for when analyzing disaster resilience. The article also discusses different applications and possible improvements of the proposed framework based on comments collected during the Delphi process.

1. Introduction

Resilience is one of the most widely used and yet debated terms in disaster research [1,2]. A generally agreed-upon definition of resilience has been provided by an intergovernmental expert working group from the United Nations Office for Disaster Risk Reduction [3], but this definition does not describe what countries or communities should do to become resilient. In this context, many different frameworks were developed to understand what factors contribute to resilience in different locations and cultural contexts, most of which tailored to specific geographic areas and/or to different scales [4,5,6]. On the one hand, these specific approaches are necessary so that practitioners can implement local measures to enhance resilience [7,8,9]. On the other hand, this variety of approaches makes it difficult for researchers to make a comparison across countries using the same tools.
Resilience can be seen to reflect the choices of societies to address disaster risk across a wide range of influential factors. However, the importance of resilience goes beyond its connection with disaster risk, as it has been recognized to be a common element of existing international frameworks for disaster risk reduction, sustainable development, and climate change [10,11]. Resilience is thus seen as the key parameter that can ensure the coherence between these frameworks [12]. In light of this, efforts are being currently dedicated to identify more clearly these connections and ensure the referred coherence, namely in terms of their indicators. For the particular case of sustainable development, an increasing body of research has been targeting these issues [13,14], discussing the connection of resilience with economic development [15,16], environmental sustainability [17,18], and social development [19,20], thus laying the groundwork to achieve a sustainable development agenda that is resilient to current and future risks.
Despite many attempts to quantify resilience, its operationalization still remains unclear [21]. This issue can be connected to the continuous evolution of the concept of resilience in the risk and disaster management fields, e.g., see the recent discussion in [22] and references therein. Furthermore, some of this evolution can also be connected to the analysis of resilience at different geographic scales. Still, the extent of research dedicated to these different geographic scales has not been the same. While a significant amount of research has been dedicated to examining community-level disaster resilience, e.g., see [6,22] and references therein, research addressing the development of larger-scale and globally applicable disaster resilience assessment methods is scarcer. For example, the generalized applicability to other countries of the approaches that were used to analyze disaster resilience in countries such as the United States [23,24], Indonesia [25], Korea [26,27], China [28,29,30], Hong Kong [31], Zimbabwe [32], Australia [33], and Italy [34] is not straightforward, namely when the objective is to make adequate country-level comparisons and policy development prioritizations. Recent examples that attempted to address these limitations are the disaster resilience index proposed in [35] for risk-informed sustainable development, or the Global Resilience Index Initiative [36]. Still, there is currently little information about the latter to understand the methodology that will be employed, and the approach proposed in the former lacks some external validation (e.g., by external experts) despite its comprehensiveness.
Some of these operationalization challenges have also been addressed by the research developed in connection with the spatial resilience framework, which focuses on the capability of territorial systems to bounce back after unexpected shocks/disturbances and achieve the desired functions while simultaneously evolving towards a new organization of that system [27,37]. The broad perspective of spatial resilience, which has evolved beyond its narrow introduction in the analysis of ecological systems [38], lays the ground for studying the ability of territorial systems to preserve their identity and functions due to the influence of internal and external factors [39,40]. Interesting applications of the concepts involved in this framework have been presented when analyzing disaster recovery [41] and in the development of a city-level resilient place assessment conceptual model [42]. Some operationalization attempts have also been developed for certain components of spatial resilience, namely an innovative proposal for measuring the vulnerability of spatial systems [43] or a methodology to measure the long-term impact of disasters on development opportunities and socioeconomic resilience [44].
Given there are still challenges that require further research to address the operationalization of the spatial resilience framework [45,46], indicator-based approaches remain popular methodologies for measuring resilience at the country level [47], and a useful analysis of the current state of resilience measurement using these approaches was presented in [48]. However, one of their drawbacks is the difficulty of defining a threshold for each indicator, or aggregation of indicators, to establish if a country is performing well or poorly. In the absence of natural thresholds for which a given indicator already sets clear targets (e.g., the proportion of population below the international poverty line), analysts often scale the indicators within a range represented by the best- and worst-performing countries. On a global scale, this could lead to thresholds that may not be achievable by a certain country under consideration, given its level of development. Alternatively, it may be more useful to define these thresholds based on the characteristics of the country that reflect its relevant means, resources, skills, and capabilities to achieve a level of resilience that allows it to adapt and recover more successfully when faced with a disaster. A generalization of this line of reasoning suggests the hypothesis that each dimension of resilience can have a different importance according to the context of a given country. The significance of this proposition lies in the fact that identifying these differences would provide a sharper focus on the resilience dimensions that should be prioritized for improvements. Furthermore, it would also avoid performing comparisons with unrealistic resilience targets that are incompatible with the country’s socioeconomic characteristics, thus providing a significant step toward guiding the prioritization of policy development and investments related to disaster resilience.
To address these issues and show the validity of the referred hypothesis, the present research proposes the use of development indicators as a measure to distinguish different countries in terms of their socioeconomic structures that are relevant to disaster resilience. As such, the research proposes a framework that establishes a general disaster resilience index applicable worldwide that accounts for differences between countries in terms of development and in terms of the relevance of several resilience dimensions. The purpose of this framework is to identify groups of countries that share similar sustainable development characteristics related to disaster resilience and, for each group, identify the resilience dimensions that are more relevant. This identification will then provide the ability to make a more rational comparison of disaster resilience levels between countries while supporting the previously referred prioritization of policy developments and investments related with disaster resilience. Given the characteristics of the proposed framework, it can be seen to sit between a global level resilience assessment, which is normally used to compare countries but might overlook some specific aspects of local resilience, and a community-based resilience assessment, which in turn focuses on the local characteristics of resilience, sometimes precluding the possibility to compare results across countries or even across different regions of the same country.
To account for different development levels, countries were clustered using an indicator that reflects their performance according to the Sustainable Development Goals (SDGs) [49]. By using this approach, countries can be ranked and compared within a given cluster, and meaningful thresholds can be set for each indicator. For each cluster of countries, a Delphi process [50] was then used to ask a series of experts to score the importance of each resilience dimension and sub-dimension of the proposed resilience index. These scores were transformed into weights that varied from cluster to cluster in order to reflect differences in sustainable development. By using this approach, the index can account for the relative importance of each dimension and sub-dimension of resilience within a given cluster and provide a unique methodology that can be applied worldwide. In addition to presenting the framework for the disaster resilience index, the proposed study discusses the methodology that led to the quantification of the weights for each resilience dimension and sub-dimension for each cluster of countries according to the referred Delphi process, and analyses the results that were obtained. Globally, the results highlighted the anticipated differences between different groups of countries, but also reflected cluster-specific features that should be accounted for when analyzing disaster resilience. The article also analyses the validity of using the SDGs as a baseline to cluster countries, and provides a general overview of how countries are performing. Following that, it also discusses different applications and possible improvements of the proposed framework in the future, specifically based on the comments collected during the Delphi process.

2. Methodology

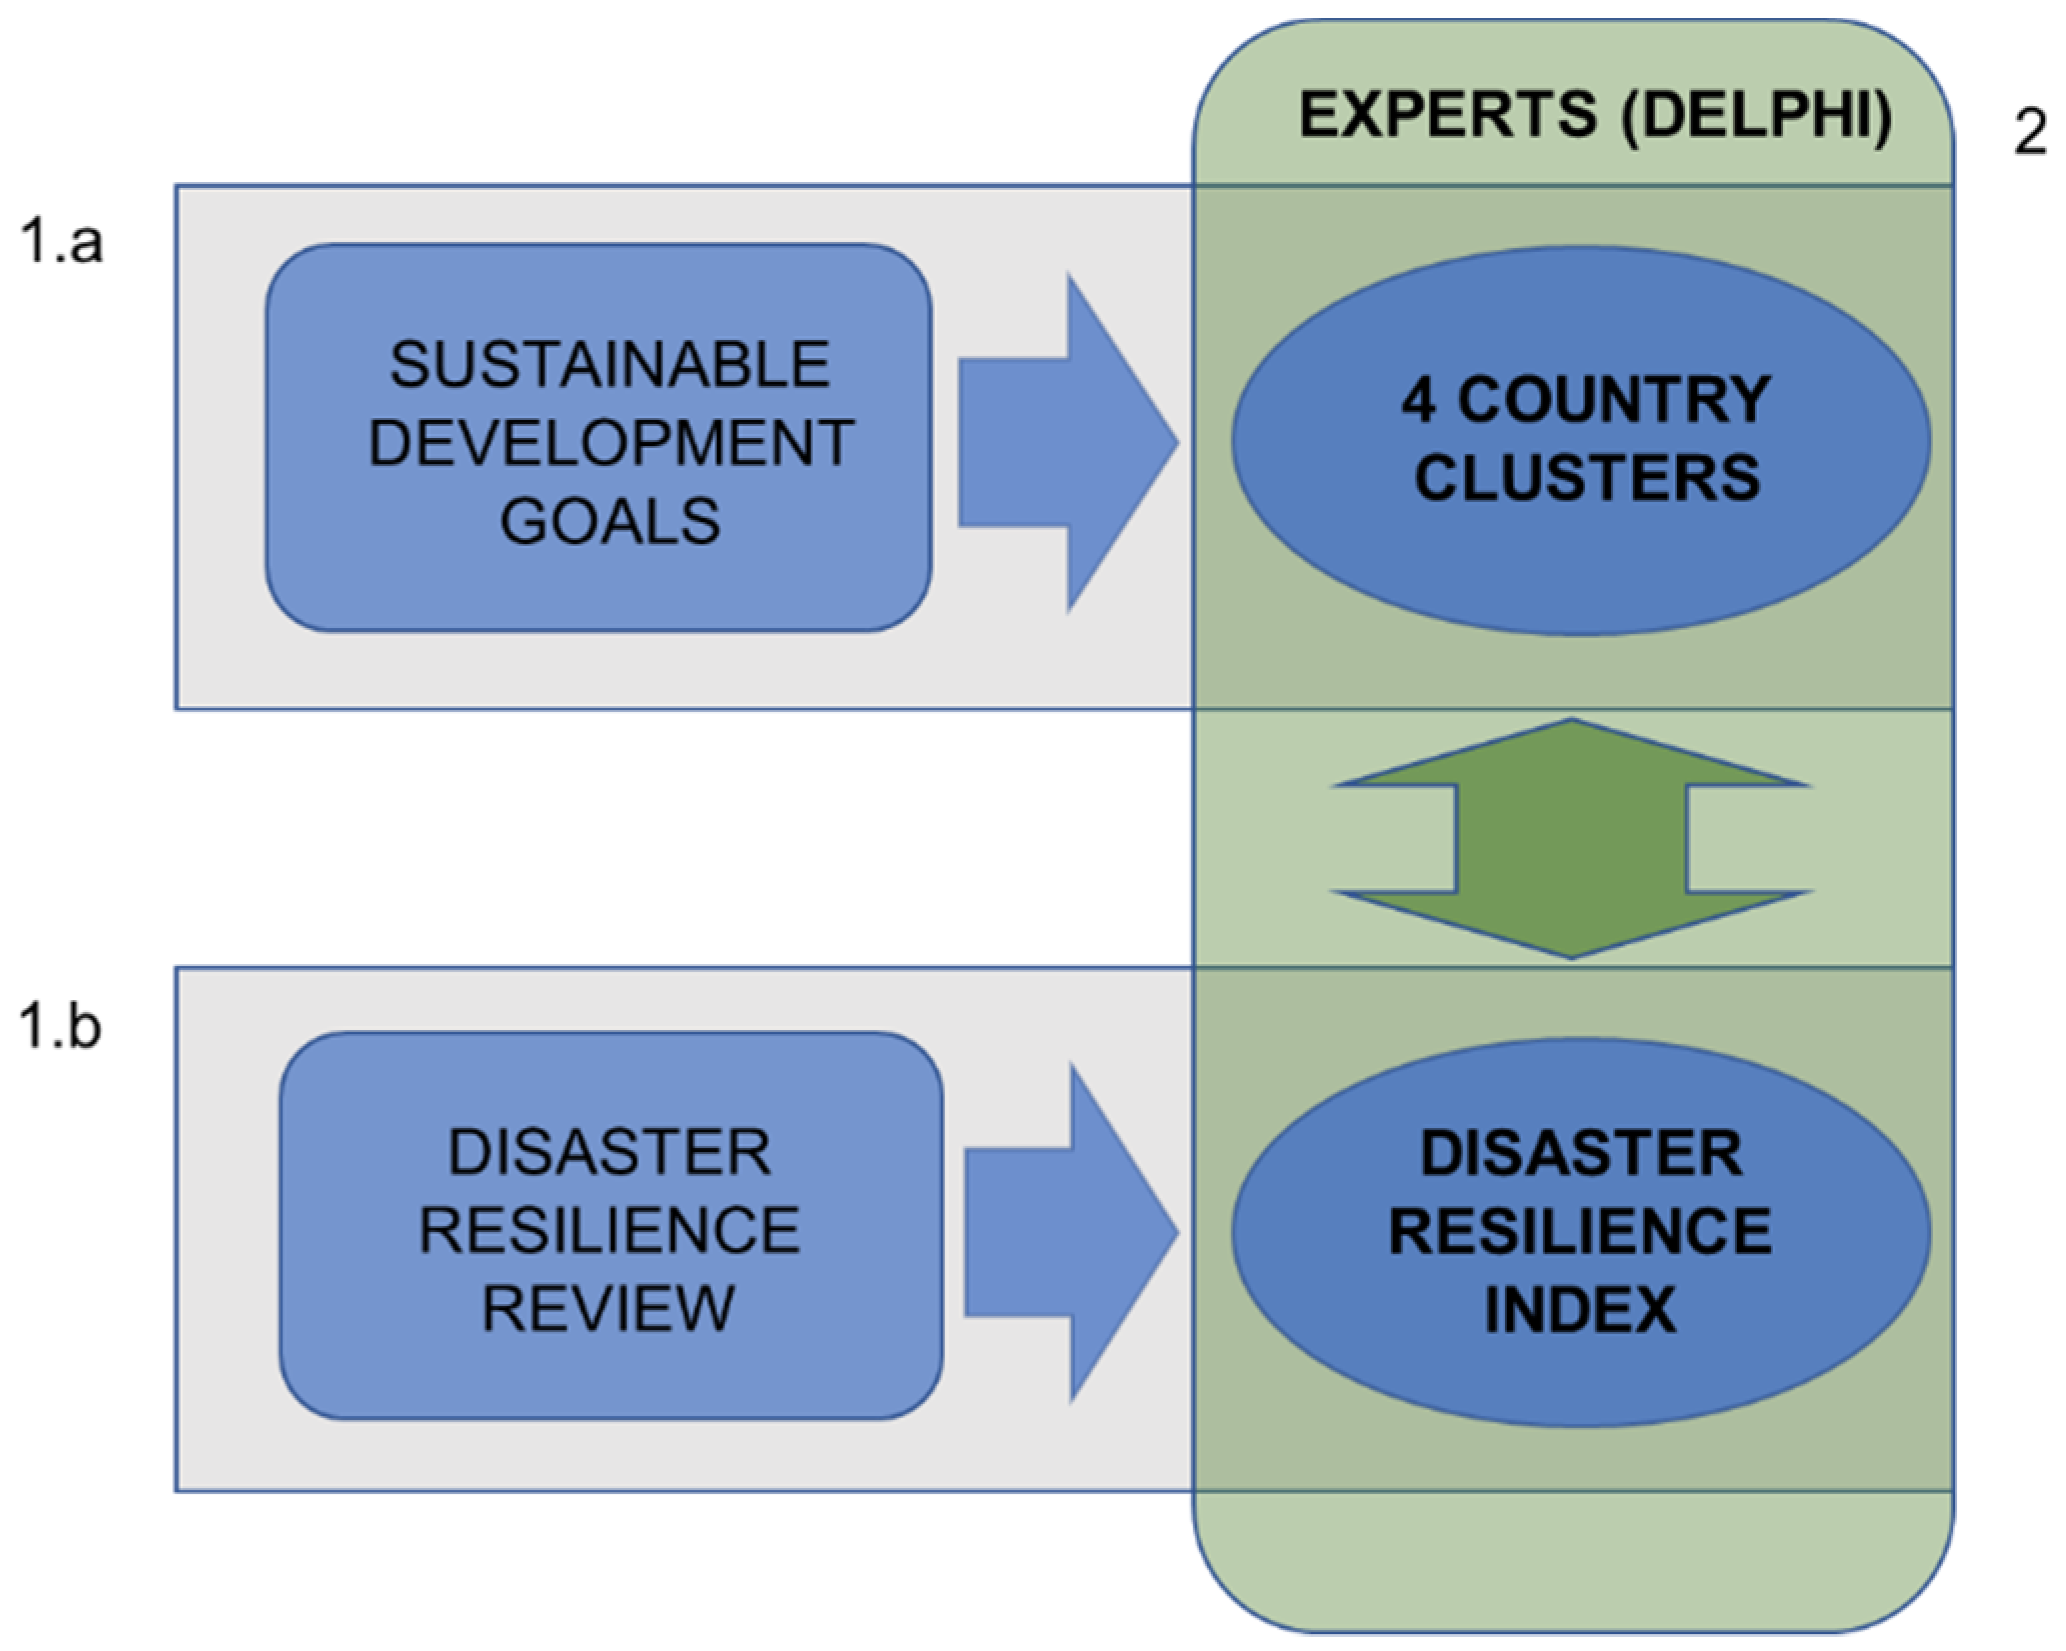
2.1. General Overview

The proposed research was developed according to the workflow presented in Figure 1 and was structured as follows. In order to develop a resilience framework that is applicable at a global scale and meaningful to inform local policies, the world’s countries were first divided into clusters according to their level of sustainable development (see step 1.a in Figure 1). Simultaneously, a disaster resilience index (DRI) was created, based on a thorough literature review, that suggested indicators that could be used to reflect relevant dimensions and sub-dimensions of resilience. A weighted combination of indicators reflecting these dimensions and sub-dimensions was then formulated to establish the index. The innovative aspect of the proposed index is that the weights were defined by cluster in order to reflect the different importance of the referred dimensions and sub-dimensions for a group of countries with similar development characteristics (see step 1.b in Figure 1). To establish these weights, an expert evaluation approach based on the Delphi method [50] was adopted, in which several researchers, practitioners and policy makers were asked to rate the importance of each resilience dimension and sub-dimension for a given cluster of countries (see step 2 in Figure 1). Further details about each of the referred steps are presented in the following sections.

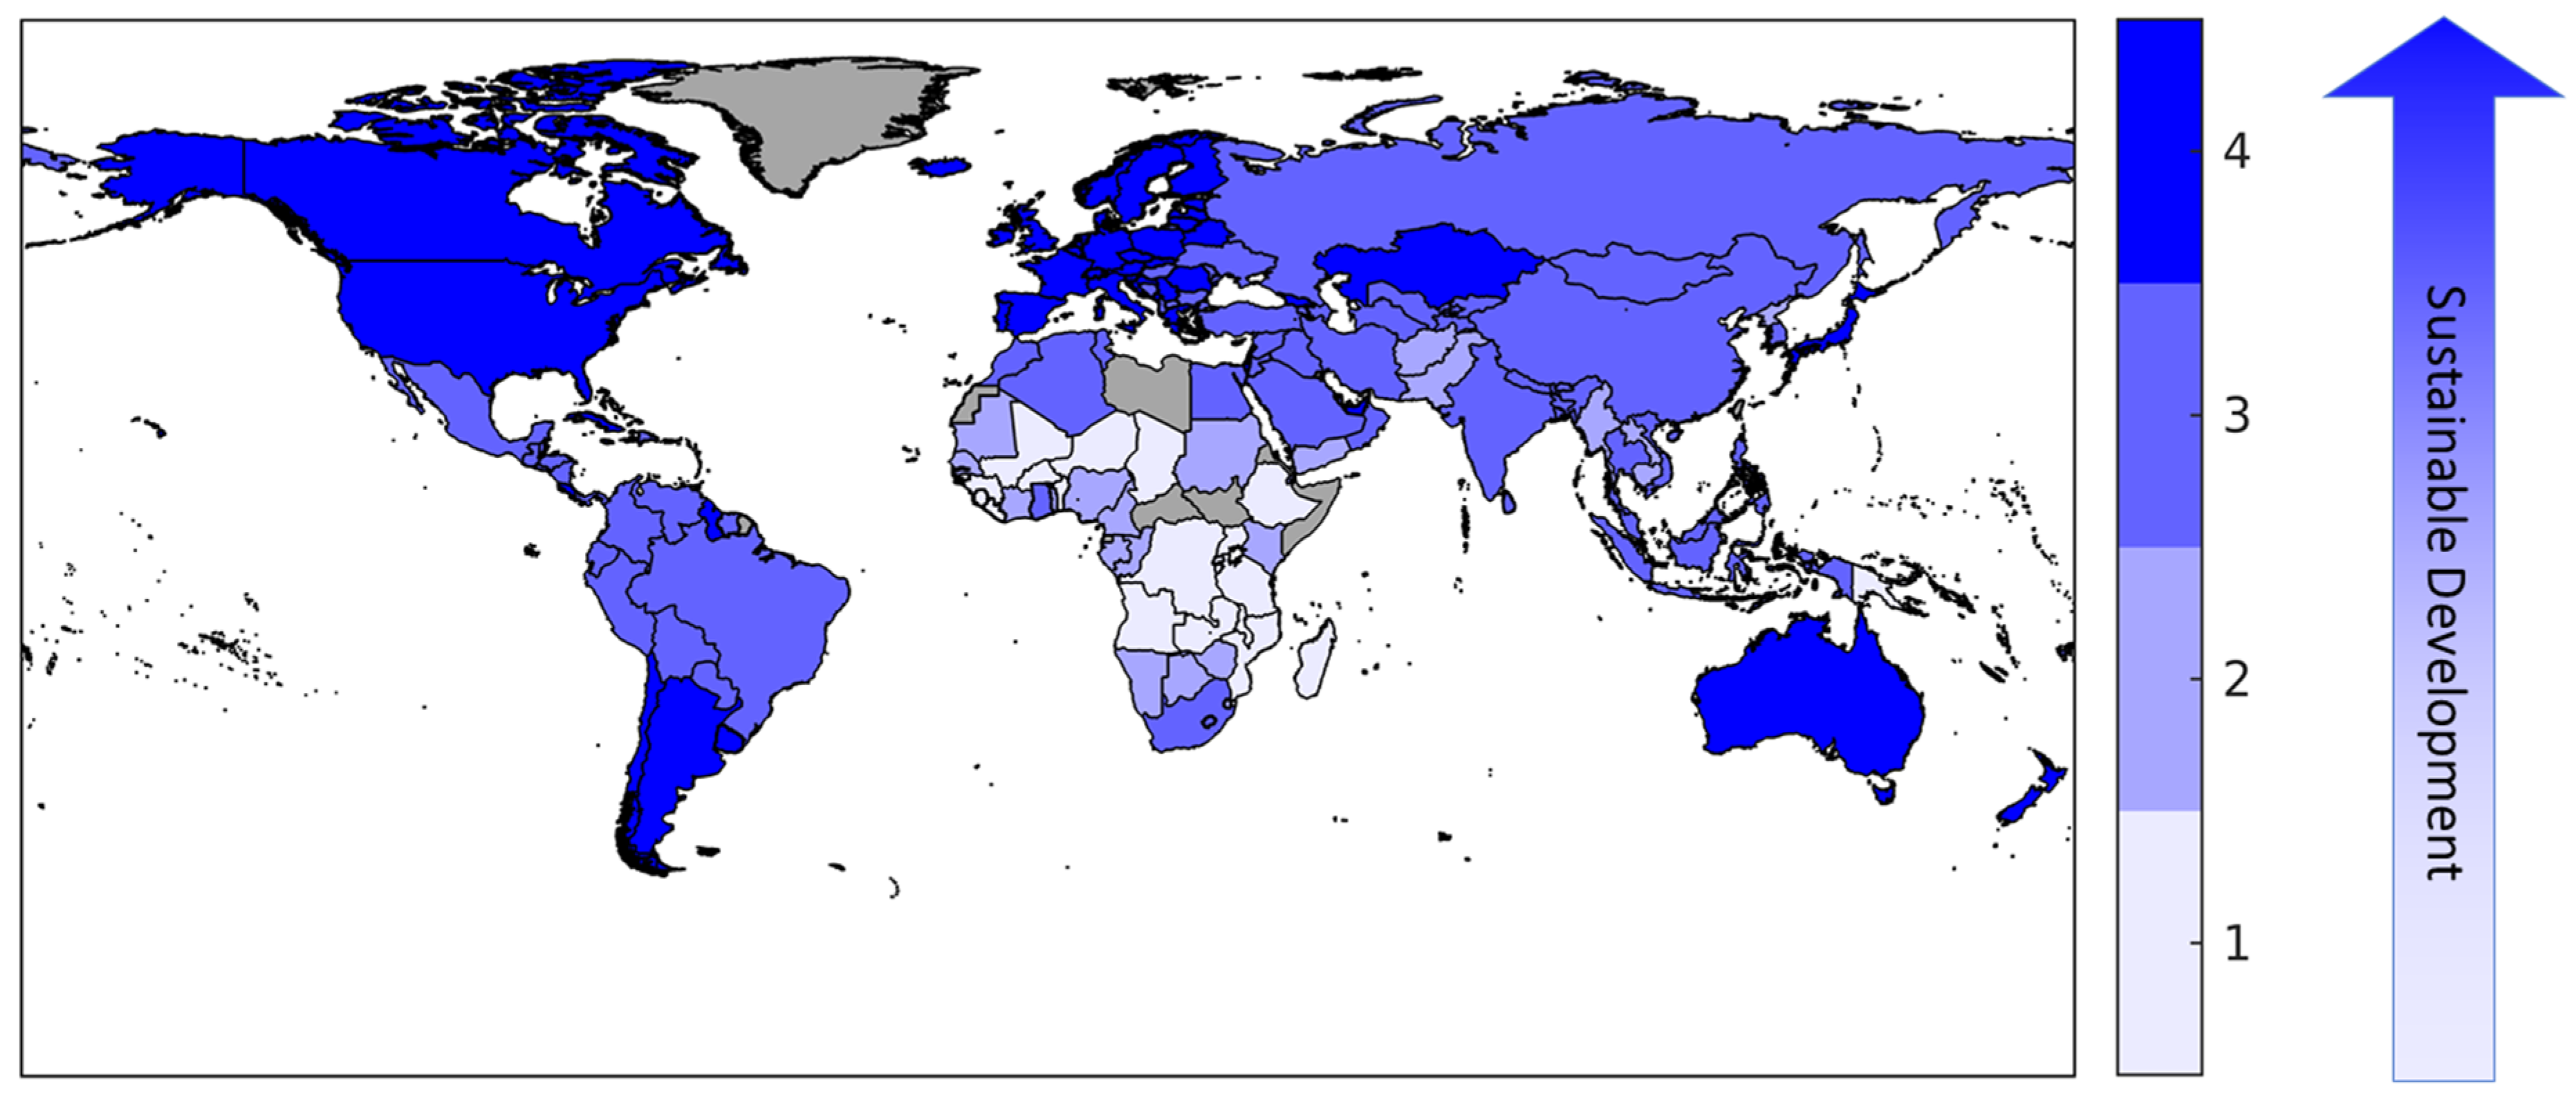
2.2. Clustering of Countries Based on Sustainable Development

The clusters of countries were identified using indicators that reflected groups of countries with similar levels of sustainable development. These indicators were defined using the SDG framework [49]. By using this approach, it was expected that homogeneous groups of countries exhibiting similar sustainable development levels would be able to achieve resilience through the same means. As such, within a given cluster, the performance of countries in achieving resilience could be compared. The SDGs were represented using a group of 17 indicators, and their selection was based on three factors:
(1)
The ratio between the dimensions of sustainable development adopted by the SDG framework: since this framework considers 7 economic goals, 5 social goals, and 5 environmental goals, the relation 7:5:5 was kept when selecting the indicators.
(2)
Data availability: indicators were selected in order to have the highest number of countries with no missing values and to limit the need for data imputation.
(3)
A connection to the field of disaster risk reduction (DRR): given that DRR is considered to be a cross-cutting issue by the SDG framework, indicators were selected in order to have a larger relevance to this field when possible.
With respect to the first factor, it was noted that when an indicator was not available for one of the goals, it was substituted with one belonging to the same dimension but connected to different goals. As such, indicators for Goal 14 (Life below water) and Goal 17 (Partnership for the goals) were replaced by indicators associated with Goal 11 (Make cities and human settlements inclusive, safe, resilient, and sustainable) and Goal 16 (Peace, justice, and strong institutions), respectively. The final list of indicators is presented in Table 1, along with information regarding the data sources and the time range of the data for each indicator. In terms of data availability, not many countries were seen to have full coverage of data; those that did were mostly developed countries. Countries that lacked sufficient or any data were mostly small nations, islands, or war-torn areas, and thus were not considered in subsequent stages of the study. In all, a total of 174 countries were selected (a full list is presented in Table S1 of the Supplementary Materials), most of which (98.8%) had a maximum of two missing values, while 83.2% had no missing values. Still, given that the referred cluster analysis required a complete dataset, a strategy was defined to impute these missing values. Among the different available imputation methods [51], the “nearest neighbor” method was seen to perform well when the correlation among data samples was significant (each sample corresponded to the indicator data of a given country). After performing a Pearson’s correlation analysis, the corresponding results showed that correlation coefficients among certain countries was large, thus supporting the use of the “nearest neighbor” method to complete the dataset. By using this method, the missing value of a certain indicator of a given (target) country was replaced by the value of the same indicator of the (candidate) country that showed the highest correlation with the (target) country exhibiting the missing value. When different candidate countries were found to have similarly high correlation values with the target country, the missing value was selected from one the countries based on a meaningfulness indicator defined mostly based on geographical proximity. In cases in which, despite the meaningfulness indicator, there were still multiple candidate countries for the missing value, the average of the indicator data from the several countries was used. Further details on the data imputation strategy are provided in Table S2 of the Supplementary Materials.
Before determining the sustainable development score of each country, the data for each indicator was normalized using the min–max method [51], and some indicators were reverse ordered to ensure the unidirectionality of all indicators (i.e., small values representing a better performance and larger values representing a worse performance). The sustainable development score of each country was then defined using a compensatory method represented by the mean of the indicator values while considering equal weighing among the indicators, given that all goals are seen to be equally important for the 2030 Agenda [49]. Furthermore, since there was a different number of indicators for each dimension, assigning equal weights to each indicator maintained the relative importance between the economic, social, and economic dimensions.
The clusters of countries were identified by performing a cluster analysis on the complete dataset. A cluster analysis is a multivariate analysis methodology used in many research fields to identify patterns in a set of observations [52,53]. Formally, a cluster represents a collection of observations that are similar to each other and dissimilar from another group of observations. The cluster analysis was performed using the non-hierarchical k-means clustering approach, which minimizes within-cluster variances, and considering distances between observations determined by the Euclidean distance [52,53]. The number of clusters was established based on preliminary analyses that examined the evolution of several internal cluster validity indices for a number of clusters between two and ten. The selected indices were the Silhouette index (which represents an average measure of how similar an observation is to its own cluster), the Elbow index (which represents the within-cluster variation), the gap index (which represents a measure of changes in the within-cluster variation), the Calinski–Harabasz index (which represents the ratio of between-cluster and within-cluster variations), and the Davies–Bouldin index (which represents the ratio of within-cluster and between-cluster distances) [52,53]). Plots of the evolution of the referred indices are presented in Figure S1 in the Supplementary Materials; these indicated that a number of clusters of 3, 4, 5, or 6 could be selected. In order to examine the differences in the results obtained by selecting a different number of clusters, the cluster analysis was performed for these four cases. The results of each cluster analysis are presented in Tables S3–S6 in the Supplementary Materials. In order to discuss these results, the notation Cx#y is used to refer to the yth cluster of countries that was obtained when performing a cluster analysis with x clusters.
When examining the results for 3 clusters (Table S3), the analysis was seen to divide the world into developed, developing, and non-developed countries. When selecting 4 clusters (Table S4), the results indicated that cluster C3#1 was essentially divided in two: clusters C4#1 and C4#2. Cluster C4#1 had 23 countries from C3#1 that included the least-developed African countries along with Haiti, while cluster C4#2 had 29 countries (26 from C3#1 and 3 from C3#2) that included African and Asian countries. Cluster C4#3 had 69 countries (all from C3#2 except 4 that were from C3#3) that included developing countries from various continents, but mainly from South America and Asia. Cluster C4#4 had 53 countries (all from C3#3) that included the best-performing countries from Europe, as well as other rich and developed countries from several continents (e.g., Australia, Canada, Chile, Israel, Japan, New Zealand, and the USA). When increasing the number of clusters to 5 (Table S5), the result that stood out the most was the creation of a cluster (C5#3) with only 4 countries (3 Gulf countries and Bangladesh). The remaining clusters involved smaller changes with respect to the analysis that considered 4 clusters. As can be seen in Table S5, cluster C5#1 had 26 countries that were all in cluster C4#2 except one, cluster C5#2 had 65 countries that were all in cluster C4#3, cluster C5#4 had 26 countries that were all in cluster C4#1 except 4, and cluster C5#5 had 52 countries that were all in cluster C4#4 except 6. Increasing the number of clusters to 6 led to much fewer variations. As can be seen in Table S6, 3 clusters were identical to those obtained when considering 5 clusters: the countries in clusters C6#2, C6#3, and C6#4 matched those in clusters C5#4, C5#1, and C5#3, respectively. With respect to the remaining 3 clusters, it can be seen that cluster C6#1 had 47 countries that were all in C5#5, and that clusters C6#5 and C6#6, with 40 and 31 countries, respectively, were the result of dividing cluster C5#2 in two, with the addition of 5 countries from cluster C5#5.
Based on the results obtained from the different cluster analyses, 4 clusters were considered for the current study. Although it could be argued that having a larger number of clusters might have been better to ensure that countries in each cluster were more similar, the fact that the number of countries across the clusters was significantly unbalanced when considering 5 or 6 clusters (due to the 4-country cluster) undermined the selection of these options. To further illustrate the 4-cluster results, a map identifying the countries in each cluster is shown in Figure 2.

2.3. Resilience Assessment Framework

In the last three decades, a significant amount of research focused on disaster resilience [54]. Over the years, the general framework used to describe resilience expanded and encompassed many additional components compared to the models that were published during the periods of the Yokohama Strategy and Plan of Action for a Safer World [55] and the Hyogo Framework for Action 2005–2015 [56], shifting the focus from the definition and quantification of resilience [57,58,59] to the implementation of policies to foster it, while reducing disaster risk [60,61,62,63,64]. Unfortunately, despite these efforts, all the contributions coming from different research fields and diverse backgrounds (academics, practitioners, policy makers) rarely converged. As such, the DRI proposed herein considered these different contributions as one framework and was able to account for local variations in resilience without losing track of its general structure. Therefore, the development of the proposed DRI was based on the analysis of a considerable number of resilience indices/frameworks available in the literature, including academic publications, handbooks, and guidelines for practitioners. The literature review covered academic research outputs [48,63,65,66,67] and grey literature written in the context of practical field experience [7] and community-based capacity building [68], international frameworks for policy makers [69,70], and technical guidelines on assessment and recovery [8,9], covering not only disaster practice, but also development, climate change, sociology, psychology, and anthropology [23,71].
Based on this review, a list of dimensions, sub-dimensions, and indicators was compiled to define a comprehensive DRI. The structure of the index was developed in order to be articulated enough to encompass all the relevant aspects of resilience, while simultaneously remaining simple enough to be shared with the highest possible number of participants during the subsequent Delphi process. It is noted that, during the development of the DRI, sub-dimensions of a given dimension whose definitions were not significantly different, or that were represented by highly correlated or identical indicators, were aggregated. As a result, the first iteration of the structure of the proposed DRI involved a total of 37 sub-dimensions, divided according to 6 dimensions, as presented in Table S4 of the Supplementary Materials. In order to test the practical applicability of this first structure, a trial version of the subsequent Delphi process was performed with the help of a few experts that did not participate in the final version of the Delphi process. The main outcomes of this test indicated that the number of sub-dimensions was too high, and that some of them could be aggregated. As a result, a new aggregation was performed for sub-dimensions with indicators that could be seen as similar, as well as for those whose scores (i.e., the weights) were similar during the test, in order to achieve a maximum of 5 sub-dimensions per dimension. Following this review, the final structure of the proposed DRI involved a total of 6 dimensions and 23 sub-dimensions. Table 2 lists the dimensions and the sub-dimensions of the proposed DRI, which is then followed by a short description of the sub-dimensions in each dimension.

2.3.1. Dimension 1: Social

This dimension encompasses all the characteristics of the population that enable it to cope with an external event and recover from it, and includes the following sub-dimensions:
  • Social fabric—this represents the composition of the population. It can also help to define the potential post-disaster needs. This sub-dimension reflects indicators related to household size, number of female-headed households, number of children per woman, population growth, migration rate, crime rate, social disparity index, quality of life, and educational level.
  • Awareness and preparedness—this illustrates all the characteristics specifically related to knowledge about risk, attitude towards risk and disaster preparedness, and risk reduction measures taken at the household/community level. This sub-dimension reflects indicators related to knowledge and perception of risk, risk aversion, and previous disaster-related experience.
  • Social capital—this describes all the characteristics that make a community feel like one. This sub-dimension reflects indicators related to attachment to place, sense of community, trust in the community, participation in community activities, common beliefs, and social networks.
  • Social capacity—this defines all the qualities and skills that make communities able to withstand adversities, but do not specifically target disaster preparedness. This sub-dimension reflects indicators related to adaptive capacity, problem-solving skills, leadership, capacity building, labor power, and access to resources such as financial resources, tools, materials, and food stocks.
  • Social support—this represents a household’s access to support from institutions at different levels (community, municipality, region, and country levels). This sub-dimension reflects indicators related to social security, financial support, counselling services, social assistance and general social services, and entitlement to rights.

2.3.2. Dimension 2: Economic

This dimension encompasses all the available economic resources of the population at the household and the country levels that enable it to cope with an external event and recover from it, and includes the following sub-dimensions:
  • Economic level—this represents the amount and source of economic resources on which the population can rely. This sub-dimension reflects indicators related to the level of income, diversification of income, and sources of income.
  • Wealth distribution—this describes how wealth is distributed across the population and among genders. This sub-dimension reflects indicators such as the GINI index or the ratio of high income among women/men.
  • Pre-disaster financial services—this describes the amount of financial services that are available before a disaster. This sub-dimension reflects indicators such as the number of insurance policies, the number of banks, the number of mortgages, and savings.
  • Post-disaster financial services—It describes the amount of financial services that can be provided after the occurrence of a disaster. This sub-dimension reflects indicators related to loans and donations.
  • Resources—this defines all the basic resources that are necessary to face a crisis and meet the response and recovery needs. This sub-dimension reflects indicators related to food production, availability of building materials, and manufacturing.

2.3.3. Dimension 3: Environmental

This dimension accounts for the available natural resources and their use, and includes the following sub-dimensions:
  • Natural resources—this represents the amount and diversity of natural resources. This sub-dimension reflects indicators related to land cover classification, available natural resources, and available biomass.
  • Land use—this describes how natural resources are exploited and preserved. This sub-dimension reflects indicators related to air quality, water quality, erosion rate, inappropriate land use, deforestation, habitat loss, and biodiversity.

2.3.4. Dimension 4: Habitat

This dimension accounts for the relevant characteristics of the built environment, and includes the following sub-dimensions:
  • Settlements—this describes how the population is spatially distributed in the area and the type of entitlement/ownership. This sub-dimension reflects indicators such as population density, percentage of slums/informal settlements, ratio of urban/rural areas, percentage of owners/renters/squatters, and type of ownership.
  • Homes—this describes the type and quality of single housing units. This sub-dimension reflects indicators related to housing density, building techniques, year of construction, quality of the housing, and number of mobile homes.
  • Regulations and planning—this represents the existence and implementation of regulations connected to the built environment. This sub-dimension reflects indicators related to the presence and implementation of building codes, the availability of housing regeneration plans and urban development plans, and the degree of law enforcement related to the built environment.

2.3.5. Dimension 5: Infrastructure

This dimension covers the infrastructures that can be disrupted by a disaster and may require assistance in case of an emergency, and includes the following sub-dimensions:
  • Health—this quantifies the capacity of the health infrastructure to treat patients when faced with a disaster. This sub-dimension reflects indicators such as the number of people covered by health insurance and the number of physicians, beds, hospitals, prehospital services, and health centers, as well as their spatial concentration and accessibility.
  • WaSH (Water, Sanitation, and Hygiene), electricity, waste treatment—this quantifies the capacity of the water, electrical power, sewage, and waste-treatment infrastructures. This sub-dimension reflects indicators such as the number of power plants, the number of households with electricity and water, the existence of alternative power sources, and the number of people with access to water sanitation and hygiene services.
  • Telecommunications—this describes the availability of telecommunication facilities. This sub-dimension reflects indicators such as the number of radio transmitters, the number of households with a fixed telephone, the number of subscriptions to mobile phones, or the number of subscriptions to broadband communications.
  • Transportation—this describes the quality and spatial distribution of transportation networks. This sub-dimension reflects indicators such as the capacity of the public transportation network; the number of airports, bus terminals, and ferry facilities; the density of the road network; or the number of paved roads.
  • Local services—this quantifies all the local facilities that can be useful in case of an emergency for shelter or to fulfil other primary needs. This sub-dimension reflects indicators such as the number of pharmacies, grocery stores, fire stations, police stations, cars, hotels, or shops.

2.3.6. Dimension 6: Institutional

This dimension describes the institutional attitude/behavior toward disaster risk and regarding the implementation of disaster risk reduction, as well as post-disaster response and recovery, and includes the following sub-dimensions:
  • Trust in government—this quantifies the population’s level of trust in the local and national governmental institutions in case of a disaster. This sub-dimension reflects indicators such as abstention rate, corruption index, high election turnouts, or the number of past or ongoing conflicts.
  • Disaster preparedness and mitigation—this defines the engagement of local and national governmental institutions in the identification of risk, the implementation of mitigation measures, and the ability to produce and engage the population in preparedness campaigns. This sub-dimension reflects indicators such as the capacity for data collection, the availability of risk maps, the capacity for contingency planning, and the number of emergency drills, early warning systems, and disaster risk-related information campaigns.
  • Disaster response and recovery—this describes the capacity of local and national governmental institutions to help the population during an emergency in an effective and timely fashion, and to provide the means to support a fast recovery. This sub-dimension reflects indicators such as the type of civil protection systems that are in place, the availability of emergency funds and emergency shelters, and multisector coordination.
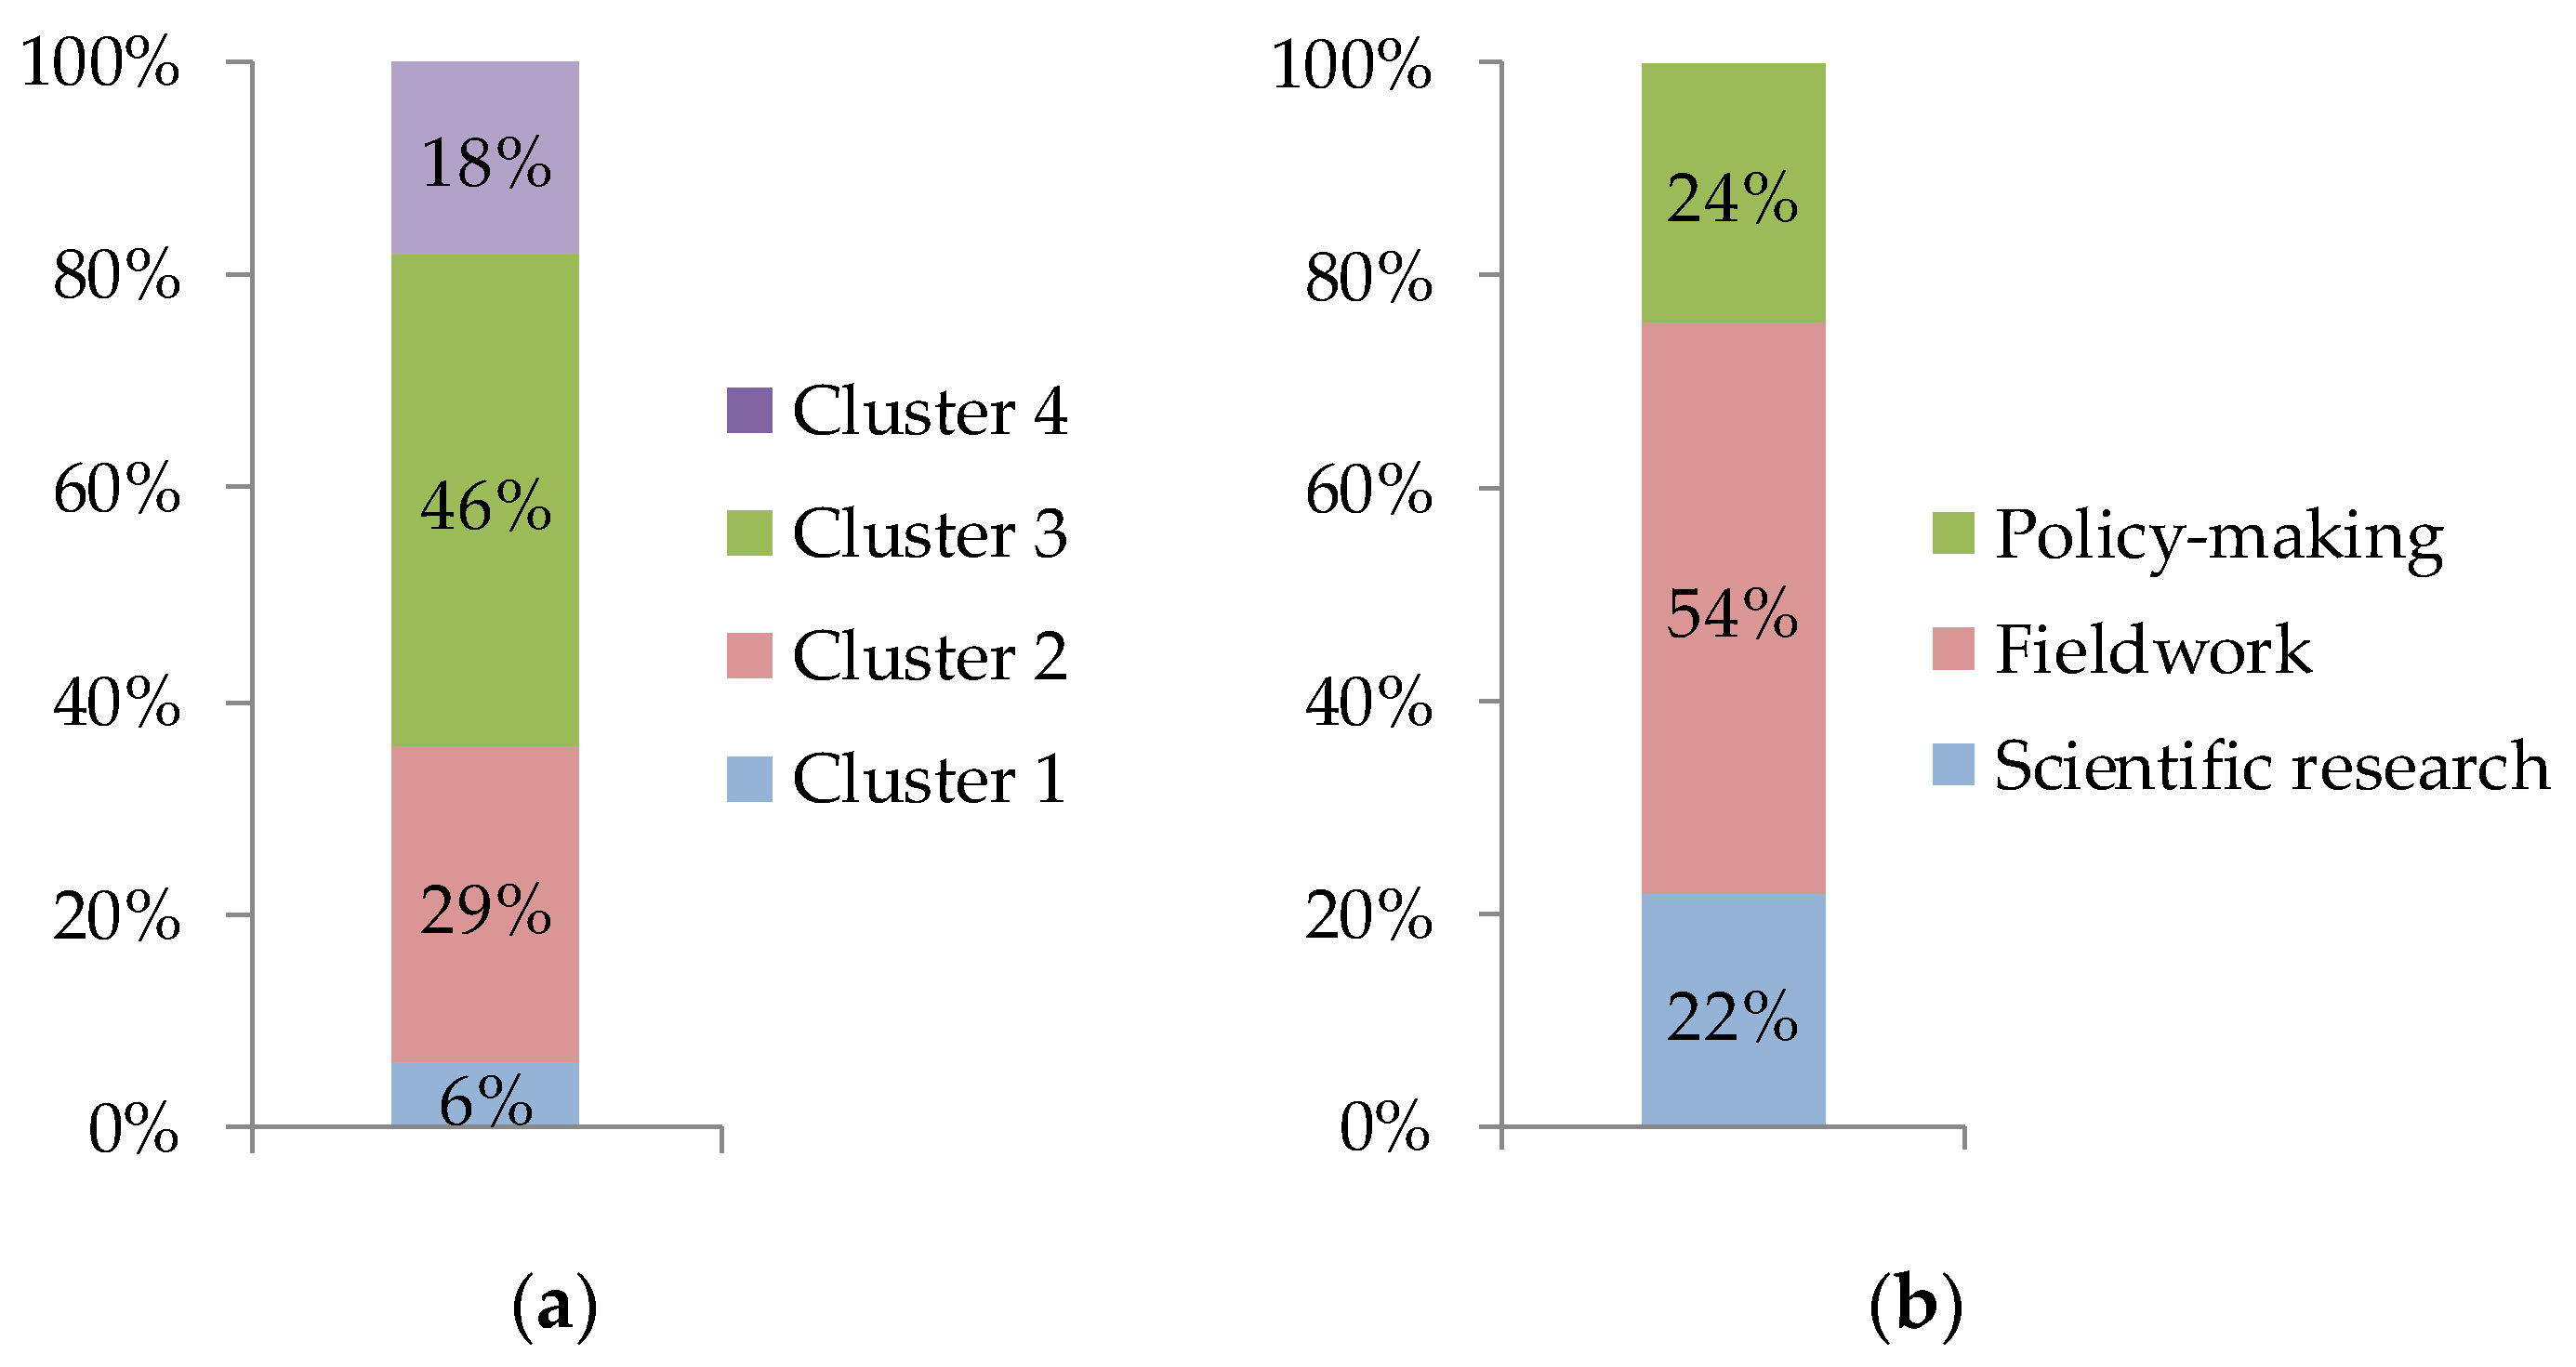
2.4. Delphi Process

In order to statistically support the hypothesis that each component of resilience might have a different importance according to the context, a correlation analysis could be performed between the dimensions of resilience and indicators related to disaster response and recovery. However, in order to do so, extensive data would need to be collected across the world for decades, ex ante and ex post, to assess how each of these components influenced response and recovery [72,73]. Even though the recent release of international frameworks for disaster risk reduction and sustainable development [74,75] and the increasing focus on climate change adaptation solutions [76] are encouraging data collection, we are still far from reaching the level where this analysis could be done solely based on data [77,78,79,80]. In order to overcome this limitation and still be able to extract meaningful insights, the Delphi method was used to conduct further analyses.
The Delphi method began to be developed in the 1940s by the RAND Corporation (from Santa Monica, CA, USA) and was introduced to the general public in the 1960s [81] as a group technique that aimed to derive consensus on a given topic by consulting a group of experts with relevant professional backgrounds using questionnaires with controlled opinion feedback. Despite some of the weaknesses related to this method identified in certain fields, (e.g., see [82] for a thorough discussion), it continues to be widely used and is considered to be a valid instrument for reaching consensus and supporting decision making, including in disaster- and resilience-related research fields [83,84,85]. The main features of the Delphi method [50,86,87,88] are that:
  • It guarantees the anonymity of the experts involved, which, among other advantages, avoids the negative influence that the personality and/or status of the experts could have on certain individual answers.
  • It uses repetition to strengthen the results. This means that the experts must be consulted at least twice on the same question/topic, which gives them the ability to reconsider their answers based on the information they are provided with regarding the opinions of the overall experts.
  • It includes controlled feedback, which means that the exchange of information between the experts is only carried out by means of a group coordinator.
  • It allows the statistical analysis of the experts’ responses. This means the questions need to be formulated in a way that allows the later quantitative and statistical processing of the corresponding responses.
In the current research, the Delphi process not only provided an answer to the specific question about the importance of each dimension of resilience, but it also generated a debate about existing resilience assessment methods, the concept of resilience, the separation between academic research and fieldwork, and the differential implementation of disaster risk reduction worldwide. Some of these outcomes are discussed in the following sections. Globally, the Delphi process that was carried out aimed at answering the following three questions:
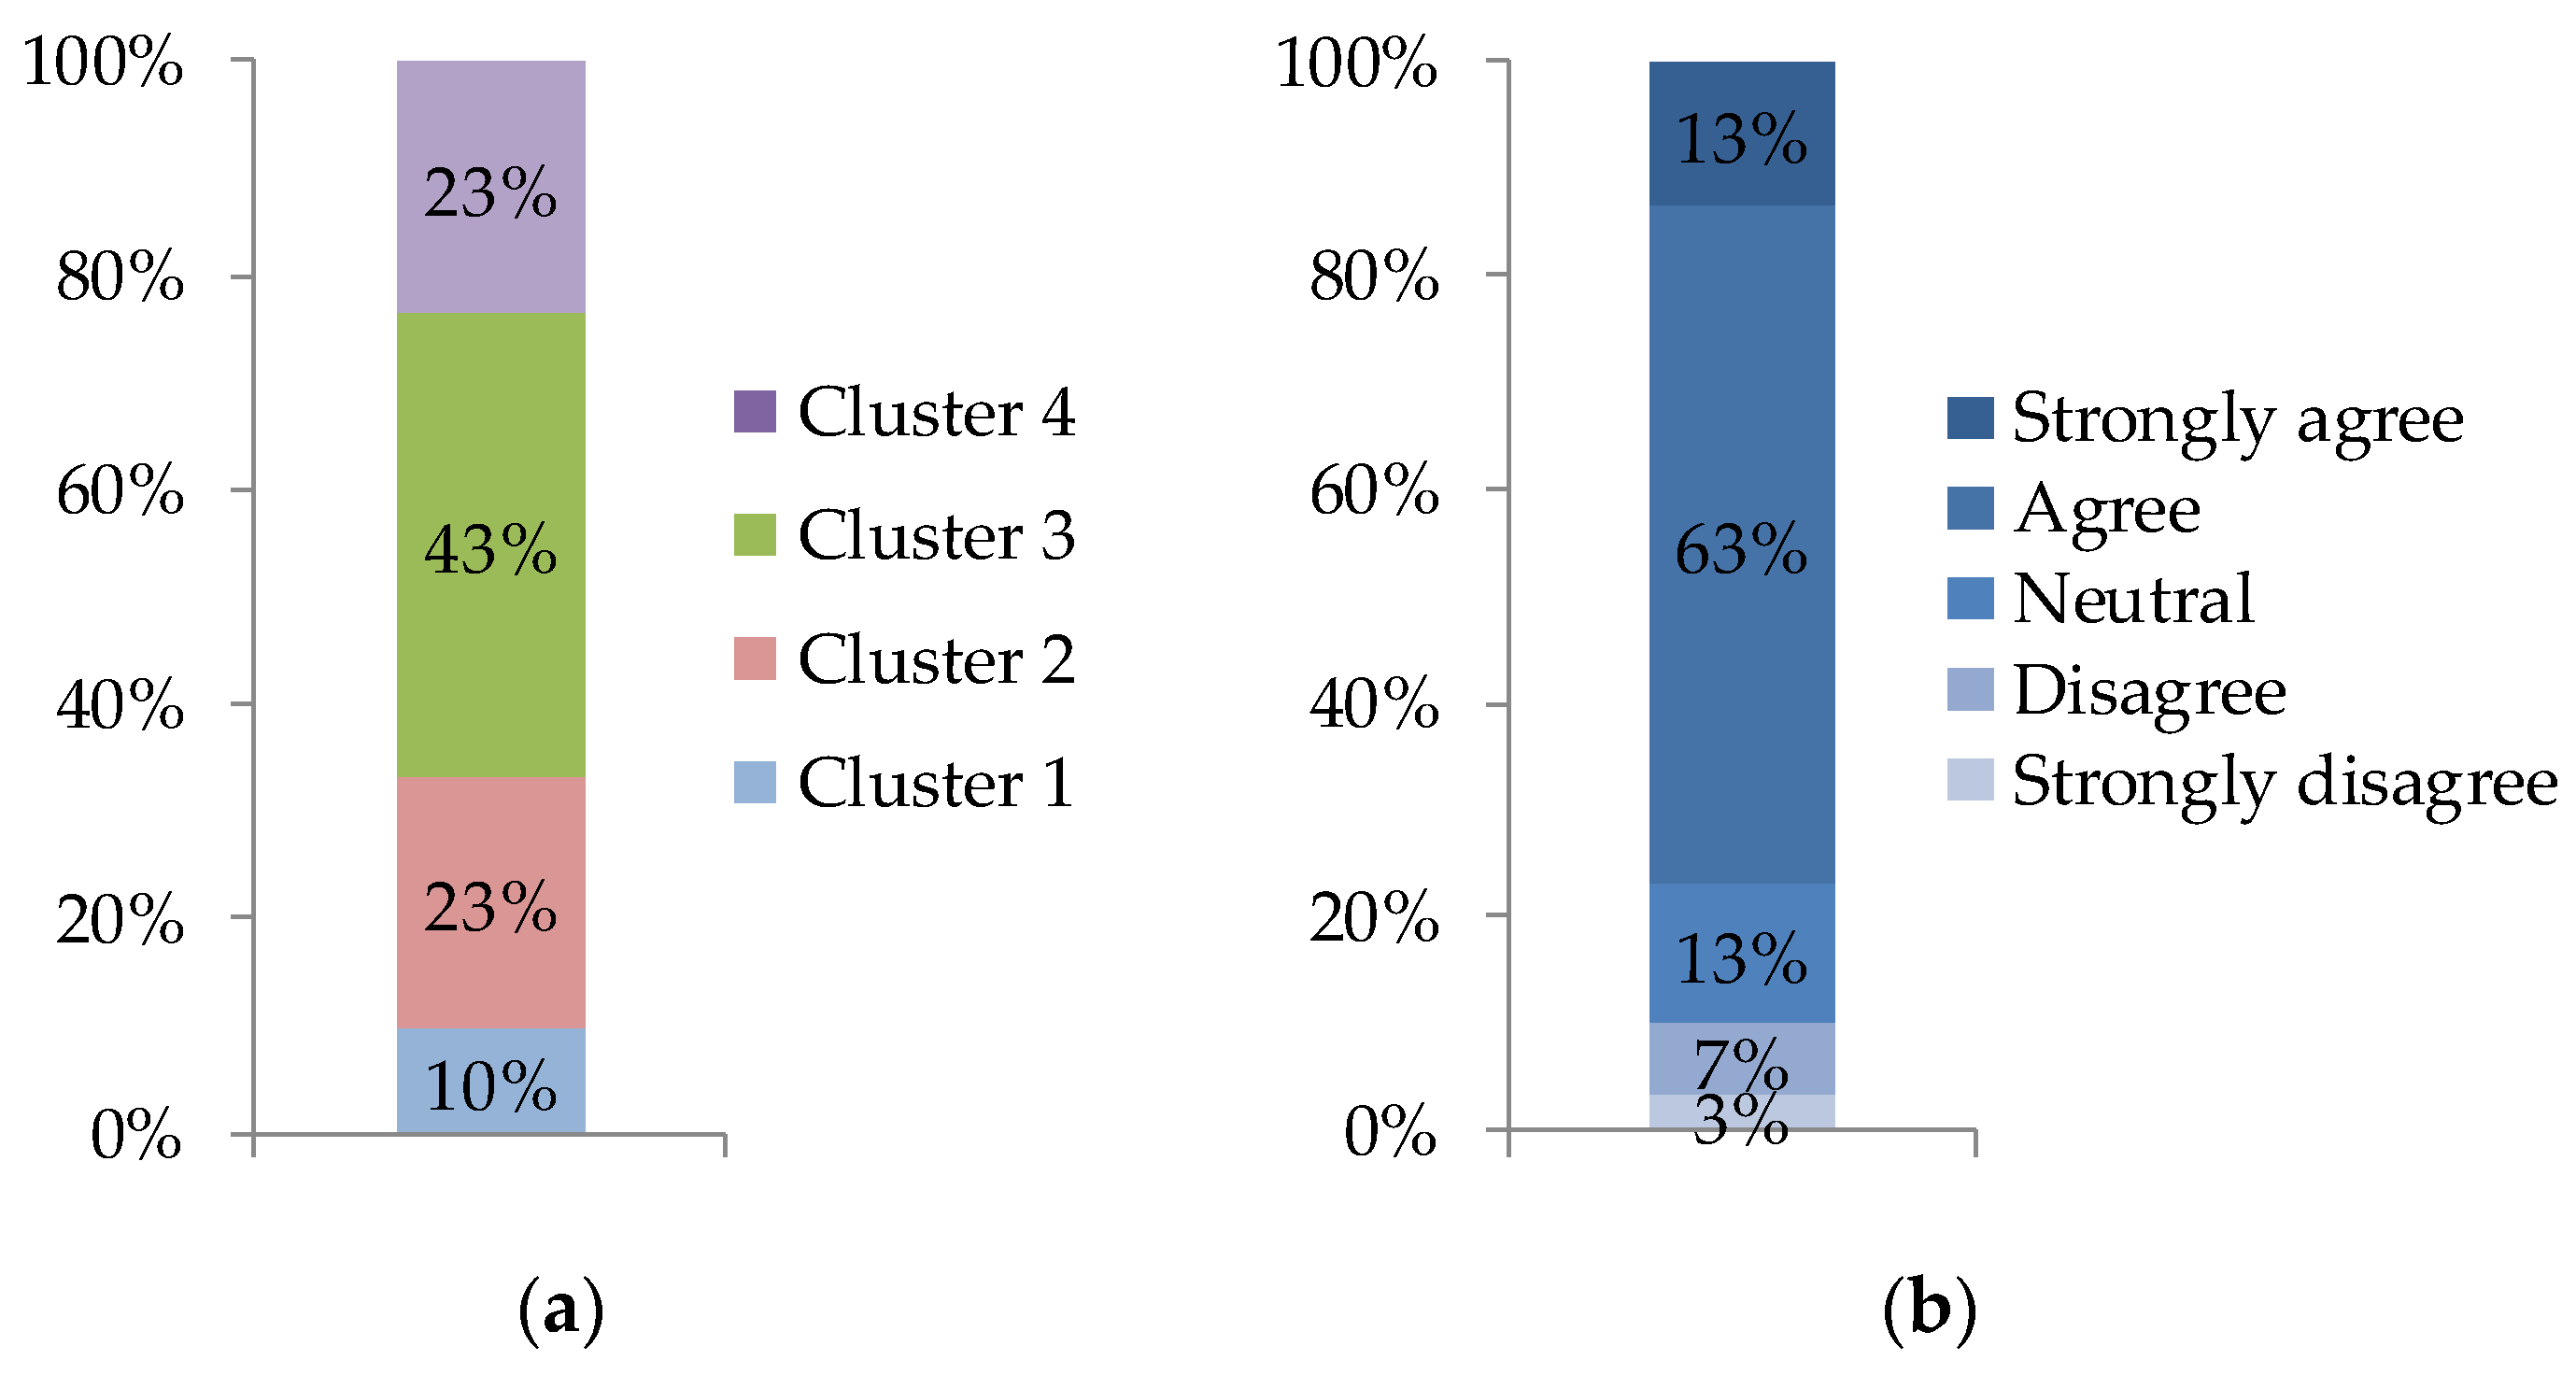
  • Do academics, practitioners, and policy makers agree on the proposed conceptual framework for disaster resilience assessment?
  • Is the methodology of tailoring the disaster resilience assessment framework to groups of countries useful and viable?
  • For each cluster of countries, what is the importance of each dimension of the disaster resilience assessment framework for achieving disaster resilience?
As mentioned previously, the Delphi process aims at exploring options and reaching consensus through a series of questionnaires collected in different rounds, without participants meeting or interacting. The first round explains the assumptions and the hypothesis the researcher wants to analyze or the possibilities he/she wants to explore. Usually, during this round, all the participants position themselves vis-à-vis the research question. In the following round(s), after the results of the first round are made public, participants have a clear understanding of their position with respect to that of the whole group. This method was found to be appropriate for the purposes of the current research, since the objective was to involve a large number of experts from different fields of expertise and geographic areas, without physically gathering them together to avoid interactions and any mutual influence. Furthermore, this method was also chosen due to its ability to provide an open forum for discussion that might generate relevant suggestions for future developments on the topic of resilience assessment.
Implementing the Delphi process requires several methodological options to be considered, such as the number of rounds/iterations, the threshold for defining consensus, and the selection of the experts. The available literature does not provide an objective answer regarding the optimal number of iterations. Some authors indicated two [89], three [90], or four [50] iterations, but the common practice is to stop when a consensus is reached [91]. Still, the acceptable level of consensus is also difficult to define [92], particularly since it might also change when adding iterations [91]. Many options are available to define the acceptable level of consensus, both quantitative and qualitative [93], depending on the number of participants and on the target of the Delphi process. For the purpose of the presented research, two rounds were adopted, as they were seen to be sufficient to achieve consensus. Consensus was considered to be achieved when the answers of at least 51% of the respondents regarding the scores of each resilience dimension and sub-dimension fell into categories 4 and 5 (i.e., “agree” or “strongly agree”) [93,94].
Regarding the number of experts, no agreement was also found in the available literature. The number of experts is often selected as a function of the available time to perform the Delphi process, the scope of the consultation, or the availability of experts in that field [95]. Furthermore, the selected number of experts also needs to account for the fact that, from one round to another, the number experts willing to participate can drop significantly [91]. Certain authors recommended the number of experts to be lower than 50 [96], while others considered larger values [85]. In the present research, the rationale underlying the selection of experts was based on their geographic distribution and on the heterogeneity of the overall group of experts in terms of domains of expertise. Globally, the objective was to involve a number of experts providing an adequate geographic coverage of the four clusters of countries that were defined (see Section 2.2). Simultaneously, the selected group of experts also needed to exhibit a balanced distribution with respect to the three fields of expertise related to disaster management that were considered: scientific research, fieldwork, and policy making. Considering this rationale, a first list of more than 500 specialists was selected based on the literature review and personal recommendations/word of mouth. Following an initial contact, not all the experts agreed or were able to participate in the Delphi process. The first round involved the participation of 95 experts from 31 countries; Figure 3a shows their distribution (in percentage) across the clusters of countries. For completeness, Figure 3b presents the percentage of experts that participated from each of the three fields of expertise.
As mentioned previously, the structure of the Delphi process was defined following an initial discussion with a group of experts (who did not participate in the final version of the Delphi process) and a pilot study involving two research groups. These initial tests were carried out before contacting the final group of experts in order to ensure the survey was clear and easy to fill. During this stage, the adequacy of several options for the structure of the questions was examined, such as budget allocation, pairwise comparison, ranking, and discrete attribution [51]. The first round of the Delphi process was then conducted using the online survey tool Jotform, whereas a simpler form developed in MS Word was used for the second round. The experts were contacted by e-mail, through social media (LinkedIn), or in person, and were informed about the anonymity of the results, the approximate duration of the survey (20 min), and the possibility of the Delphi process having two or more rounds during which they could adjust their answers of the first round.
In the first round, the experts were asked to assign uncorrelated importance scores (from 1 to 10) to each dimension and sub-dimension of the resilience assessment framework presented in Section 2.3. They were asked to define the scores for the clusters of countries for which they had more experience and according to their knowledge regarding the current importance of these dimensions and sub-dimensions to describe disaster resilience. Furthermore, experts were also asked to provide additional background and justifications for their selections, as well as feedback on the general resilience assessment framework. The complete survey that was used in the Delphi process is presented in the Supplementary Materials (SM5), and the corresponding results are discussed in Section 3. For the second round, after sharing the results of the first round with the experts, they were then asked to rate their agreement (on a scale of 1 to 5) with the results obtained for each resilience dimension and sub-dimension and for the cluster(s) they contributed for in the first round. Experts were also given the opportunity to revise the answers provided in the first round and add further comments and suggestions. Although a more detailed scale was used to score the options during the first round, a scale from 1 to 5 was found to be appropriate enough to establish whether a consensus was reached during the second round [87,93].
The first round was carried out between August and October 2019, while the second round was conducted in November 2019. The number of participants of the second round was 30, mostly due to the shorter timespan for which the results needed to be obtained. A decrease in the number of participants between rounds is considered normal, and there is no threshold to establish whether the number of respondents is sufficient or not. However, 30 experts seemed to be a reasonable number to establish a consensus [85,91]. Figure 4a shows the distribution of experts for the second round (in percentage) across the clusters of countries, while Figure 4b shows the percentage of experts who agreed or strongly agreed with the scores obtained for all dimensions and sub-dimensions. As can be seen, this percentage summed up to 76%, and it was thus considered sufficient to conclude the Delphi process.

3. Results

The results obtained from the Delphi process are presented in the following, and are divided into two sections. Section 3.1 discusses the scores and weights obtained for each dimension, while Section 3.2 analyses the results obtained for each sub-dimension in more detail, focusing essentially on the weights of each sub-dimension. All the weights were determined based on the scores using the methodology outlined in Section 3.1. Clusters 1 to 4 are also termed C1 to C4 hereafter for simplicity. Further insights and implications of these results and additional suggestions obtained from the Delphi process are discussed in Section 4.

3.1. Results Obtained for Each Dimension

The average value of the scores (SC) obtained through the Delphi process for each resilience dimension and for each of the four clusters of countries are presented in Table 3. In addition, for each cluster, the normalized weights (W) of each dimension are also represented in percentage. The results indicated that, on average, the scores obtained for each dimension were high, ranging between 7.2 (for the Environmental dimension in C1) and 8.9 (for the Social dimension in C4). Globally, the results showed that the highest scores were obtained for C4 (with an average of 8.7), while C1 exhibited the lowest scores (with an average of 7.7). This indicated that, in general, countries exhibiting a higher level of development tended to assign higher scores to the components of resilience. Furthermore, by analyzing the scores obtained for all the clusters, it could be seen that, overall, the dimensions found to be more important to achieve resilience were the Social and the Institutional dimensions, with average scores of 8.45 and 8.42, respectively. On the other hand, the Environmental and Habitat dimensions were those found to be the least important, with average scores of 8.0 and 8.07, respectively.
The weights were obtained by first transforming all the scores to a range between 0.1 (to ensure that all weights were non-zero) and 1.0 using the min–max method according to the following expression [51]:
x i = 0.1   +   ( x i m i n ( x ) ) ( 1 0.1 ) m a x ( x ) m i n ( x )
where x is a vector with all the scores; m i n ( x ) and m a x ( x ) are the minimum and maximum scores, respectively; x i is the ith score value; and x i is the transformed ith score value. The transformed scores of each cluster were then normalized to obtain the corresponding weights. It was noted that weights obtained by this process reflected the distribution of scores among the dimensions of a given cluster, but did not reflect the differences in the scores from cluster to cluster. For example, although C1 and C3 had the same score for the Social dimension, the corresponding weights were 27.4% and 13.6%, as can be seen in Table 3.
For a better visual comparison, the weights obtained for each dimension of each cluster are also shown in Figure 5. When analyzing these weights, it was interesting to note that C1 exhibited the highest and the lowest weights among all the clusters. This cluster included some of the poorest countries in the world, mostly from Africa, and its weights reflected a large asymmetry between the contribution of each dimension to achieve resilience. According to the experts, one of the more important resilience dimensions for this cluster was the Social dimension (W = 27.4%), reflecting the fact that the population is usually the first, and often the only, actor in disaster recovery. The economic dimension was another equally important resilience dimension for this cluster (W = 27.4%), as a lack of economic means seemed to be the main issue in disaster response, which very often relies on massive international aid. On the other hand, the weights obtained for the Environmental and Infrastructure dimensions (4.4% and 9.0%, respectively) indicated that they were seen as the least-relevant ones. With respect to C2, its results were seen to be similar to those of C1, which was expected, given that both included some of the least-developed countries of the world. For countries in C2, the Social dimension was still the most relevant one (W = 23.7%), closely followed by the Institutional (W = 22.0%), and the Economic (W = 20.8%) dimensions. According to the answers of the experts, these countries can be seen to rely more on the support of the institutions, both before and after a disaster. Among all the clusters, C2 had the highest weight for the Institutional component.
When analyzing the results for C3, this cluster was seen to be the one with the smallest range of weights across the six dimensions (6.5%), which meant that, for these countries, all the dimensions were expected to have similar contributions to achieve resilience. According to additional comments provided by the experts of the Delphi process, this happens because, in the countries of C3, there seemed to be a form of compensation between all the dimensions, and none of them was actually essential alone to manage the entire disaster cycle. Finally, regarding C4, which included the most developed countries of the world, most of the dimensions had high weights. According to the results, the Social, Infrastructure, and Institutional dimensions were the key dimensions of resilience, followed by the Habitat and the Economic dimensions, while the Environmental dimension was the least-important one.
To complement these results, Table 4 shows the ranks of each dimension for each cluster (based on their weights for each cluster), as well as the overall rank of each dimension among all clusters (based on the average weights W ¯ of each dimension). As can be seen, the global ranks indicated that the Social dimension ( W ¯ = 21.3%) was the most important one, followed by the Economic ( W ¯ = 20.2%), Institutional ( W ¯ = 19.7%), Infrastructure ( W ¯ = 14.4%), Habitat ( W ¯ = 14.3%) and Environmental ( W ¯ = 10.1%) dimensions. While the top three dimensions were seen to have very close average contributions, it should be noted that the Institutional dimension had the most stable contribution across the four clusters. These results highlighted the importance of the governmental bodies and the population for DRR, both before and after an event occurs. As mentioned by one of the experts, “without a robust emergency management system, a community cannot recover” and “a community that does not implement DRR or trust its authorities and institutions will not be able to mitigate a disaster’s impact due to the lack of preparedness measures in place such as exercising, pre-positioning of goods, inter-agency coordination mechanisms, etc., and a weak, corrupt government will prevent the affected community from rebuilding such as in Port-au-Prince, Haiti”. Although there is general agreement regarding the idea that the population is the first and most important respondent in case of a disaster, if institutions do not function properly, it will be difficult for a disaster-affected region to fully recover. Furthermore, as another expert noted, if institutions function properly, they will also act as facilitators for achieving a more resilient population. On the contrary, “if institutions do not work properly, …, in the end, it is all on the people”, as highlighted by another expert.

3.2. Results Obtained for Each Sub-Dimension

3.2.1. Dimension 1: Social

The weights obtained for the several sub-dimensions across the four clusters are presented in Figure 6, while Table S6 of the Supplementary Materials presents all the sub-dimension scores and weights. By analyzing the weights of the sub-dimensions across the four clusters globally, Social Capacity appeared to be the most relevant sub-dimension (with an average weight of 22.7%), followed by Social Support (with an average weight of 20.3%) and Social Capital (with an average weight of 20.2%). On the other hand, the least important sub-dimension was Social Fabric (with an average weight of 17.8%), which, according to several comments from the experts, seemed to be more relevant to vulnerability analysis rather than a key component of disaster resilience. Nevertheless, there was no agreement across the clusters as to which was the most relevant sub-dimension. For C1 and C2, it was Social Capacity; for C3, it was Social Support; whereas for C4, it was Awareness and Preparedness. The results found for C1 and C2 reflected the fact that these countries seem to rely more on the capacity of the population to manage the disaster recovery on its own, and often do not provide the population with adequate support for such recovery. As noted by one of the experts, “Social cohesion enables the people to immediately respond to any disaster. Following the 2005 earthquake in Pakistan, we saw that the local community supported the disaster victims”. Regarding C3 and C4, the results reflected the increasing importance of the Awareness and Preparedness sub-dimension, which seemed to come from the fact that these countries are shifting the focus of disaster risk management from response to prevention as a way to achieve resilience.
By analyzing the weights obtained for the several sub-dimensions across the individual clusters, the relative importance of the five sub-dimensions were seen to be relatively uniform for C2, C3, and C4. For C4, the range of the weights was only 2.0%, while for C3 and C2, it was 4.9% and 5.6%, respectively. Generally speaking, these results indicated that the more developed a country was, the more similar the weights were across the sub-dimensions. However, some of the experts noted that this uniformity did not exactly reflect the current situation; instead, it reflected what is expected to happen over the next few years, which is why they accepted these results in the second round. On the other hand, for C1, the range was much higher (17.1%) due to the Social Capacity sub-dimension weight of 28.5% (the largest weight among all the clusters) and the Awareness and Preparedness sub-dimension weight of 11.5% (the smallest weight among all the clusters). These weights were consistent with comments from experts, who highlighted that populations of countries in this cluster are so poor they often do not have means to invest in preparedness. As noted by one of the experts, “Communities are the first responder of any emergency or extreme event. Due to a lack of a functional local government and given the limited and delayed support from provincial/national governments, the social component becomes more important than in developed countries”. Furthermore, such populations are also often disengaged from the disaster resilience discourse, given that they are struggling with other issues.

3.2.2. Dimension 2: Economic

The weights obtained for the several Economic sub-dimensions across the four clusters are presented in Figure 7, while Table S7 of the Supplementary Materials presents all the sub-dimension scores and weights. The global analysis of the sub-dimension weights across the clusters indicated that Resources was the most relevant sub-dimension (with an average weight of 24.3%), followed by Pre-disaster Financial Services (with an average weight of 19.9%) and Post-disaster Financial Services (with an average weight of 19.5%). On the other hand, Wealth Distribution was considered to be the least important sub-dimension (with an average weight of 17.3%). Regarding this result, some of the experts stressed that, given that poor communities in countries with unequal wealth distribution tend to suffer greater losses, the low probability of having a truly equal society downplays its overall importance.
When analyzing the weights obtained for the several sub-dimensions across the individual clusters, several aspects could be highlighted. Unlike that of the Social dimension, the range of the weights was seen to be relatively uniform across the clusters in this case. Furthermore, with the exception of C1, the distribution of weights among the sub-dimensions followed a certain pattern. The weights reflected the existence of one sub-dimension with the largest weight (which was always Resources—related to primary needs such as food, shelter, and livelihood—and had a weight of 23% or larger), of one sub-dimension with the smallest weight (this sub-dimension varied depending on the cluster, but its weight was around 15%), and three sub-dimensions with similar weights (around 20% on average). On the contrary, for C1, the weight distribution pattern was different. In this case, there were two sub-dimensions that were equally the most important ones (Resources and Pre-Disaster Financial Services, with a weight of 24%) and two sub-dimensions that were equally the least important ones (Economic Level and Post-Disaster Financial Services, with a weight of 16%). These results reflected the fact that the population of more developed countries usually has access to post-disaster financial support or emergency funds, whereas that of poor countries usually relies on their own savings. This conclusion was also highlighted by experts, who noted that “communities have to face the aftermath of an event with limited external support, while wealthier households have more options to mitigate or prevent the impacts of external events, and have better living and safer housing conditions”.

3.2.3. Dimension 3: Environmental

The weights obtained for the several Environmental sub-dimensions across the four clusters are presented in Figure 8, while Table S8 of the Supplementary Materials presents the sub-dimension scores and weights. The Environmental dimension had only two sub-dimensions that described the availability of natural resources and how they are managed. As noted before, globally, this was the least-important dimension. According to the experts, this reflected the fact natural resources may not be a deciding factor to enhance resilience, given that several countries with limited resources exhibited highly resilient societies and economies. The distribution of weights for these two sub-dimensions was similar across the clusters and indicated that the way resources are managed is more important than the existence of the actual resources. This conclusion reflected multiple factors connected to the importance of having a more rational and conscious management of land use, which will then enhance the resilience of communities against disaster impacts, e.g., see [97,98,99]. As an example of this situation, one of the experts noted that “the rivers flowing through Panama City flood regularly during the rainy season because people throw garbage in them; this garbage clogs the waterways and ultimately leads to flooding”.

3.2.4. Dimension 4: Habitat

The weights obtained for the several Habitat sub-dimensions across the four clusters are presented in Figure 9, while Table S9 of the Supplementary Materials presents the sub-dimension scores and weights. When analyzing the weights obtained for the several sub-dimensions across the individual clusters, a clear difference between the developed and less-developed countries could be observed. For C1 and C2, the most important sub-dimension was Settlement (with a weight of 35% and 34% for C1 and C2, respectively), whereas for the more developed countries of C3 and C4, the most relevant sub-dimension was Regulations and Planning (with a weight of 38% and 36% for C3 and C4, respectively). Furthermore, when looking at the least-important sub-dimensions, the roles of the previously referred sub-dimensions were basically reversed. These results essentially reflected the fact that in less-developed countries (C1 and C2), regulations are usually less enforced and informal settlements are more common, while developed countries (C3 and C4) trust the enforcement of regulations to achieve resilience. Furthermore, this was also supported by the comments of several experts, who highlighted that “countries that allow unregulated building and sprawl tend to be more seriously impacted by disasters and lack resilience”, “inadequate materials can also worsen the effects of a disaster”, and “the increase of uncontrolled urbanization due population growth is a key component of disaster resilience given that highly dense (often poor) urban settlements are more vulnerable, and it is very hard to have effective planning for disaster reduction in such areas”.

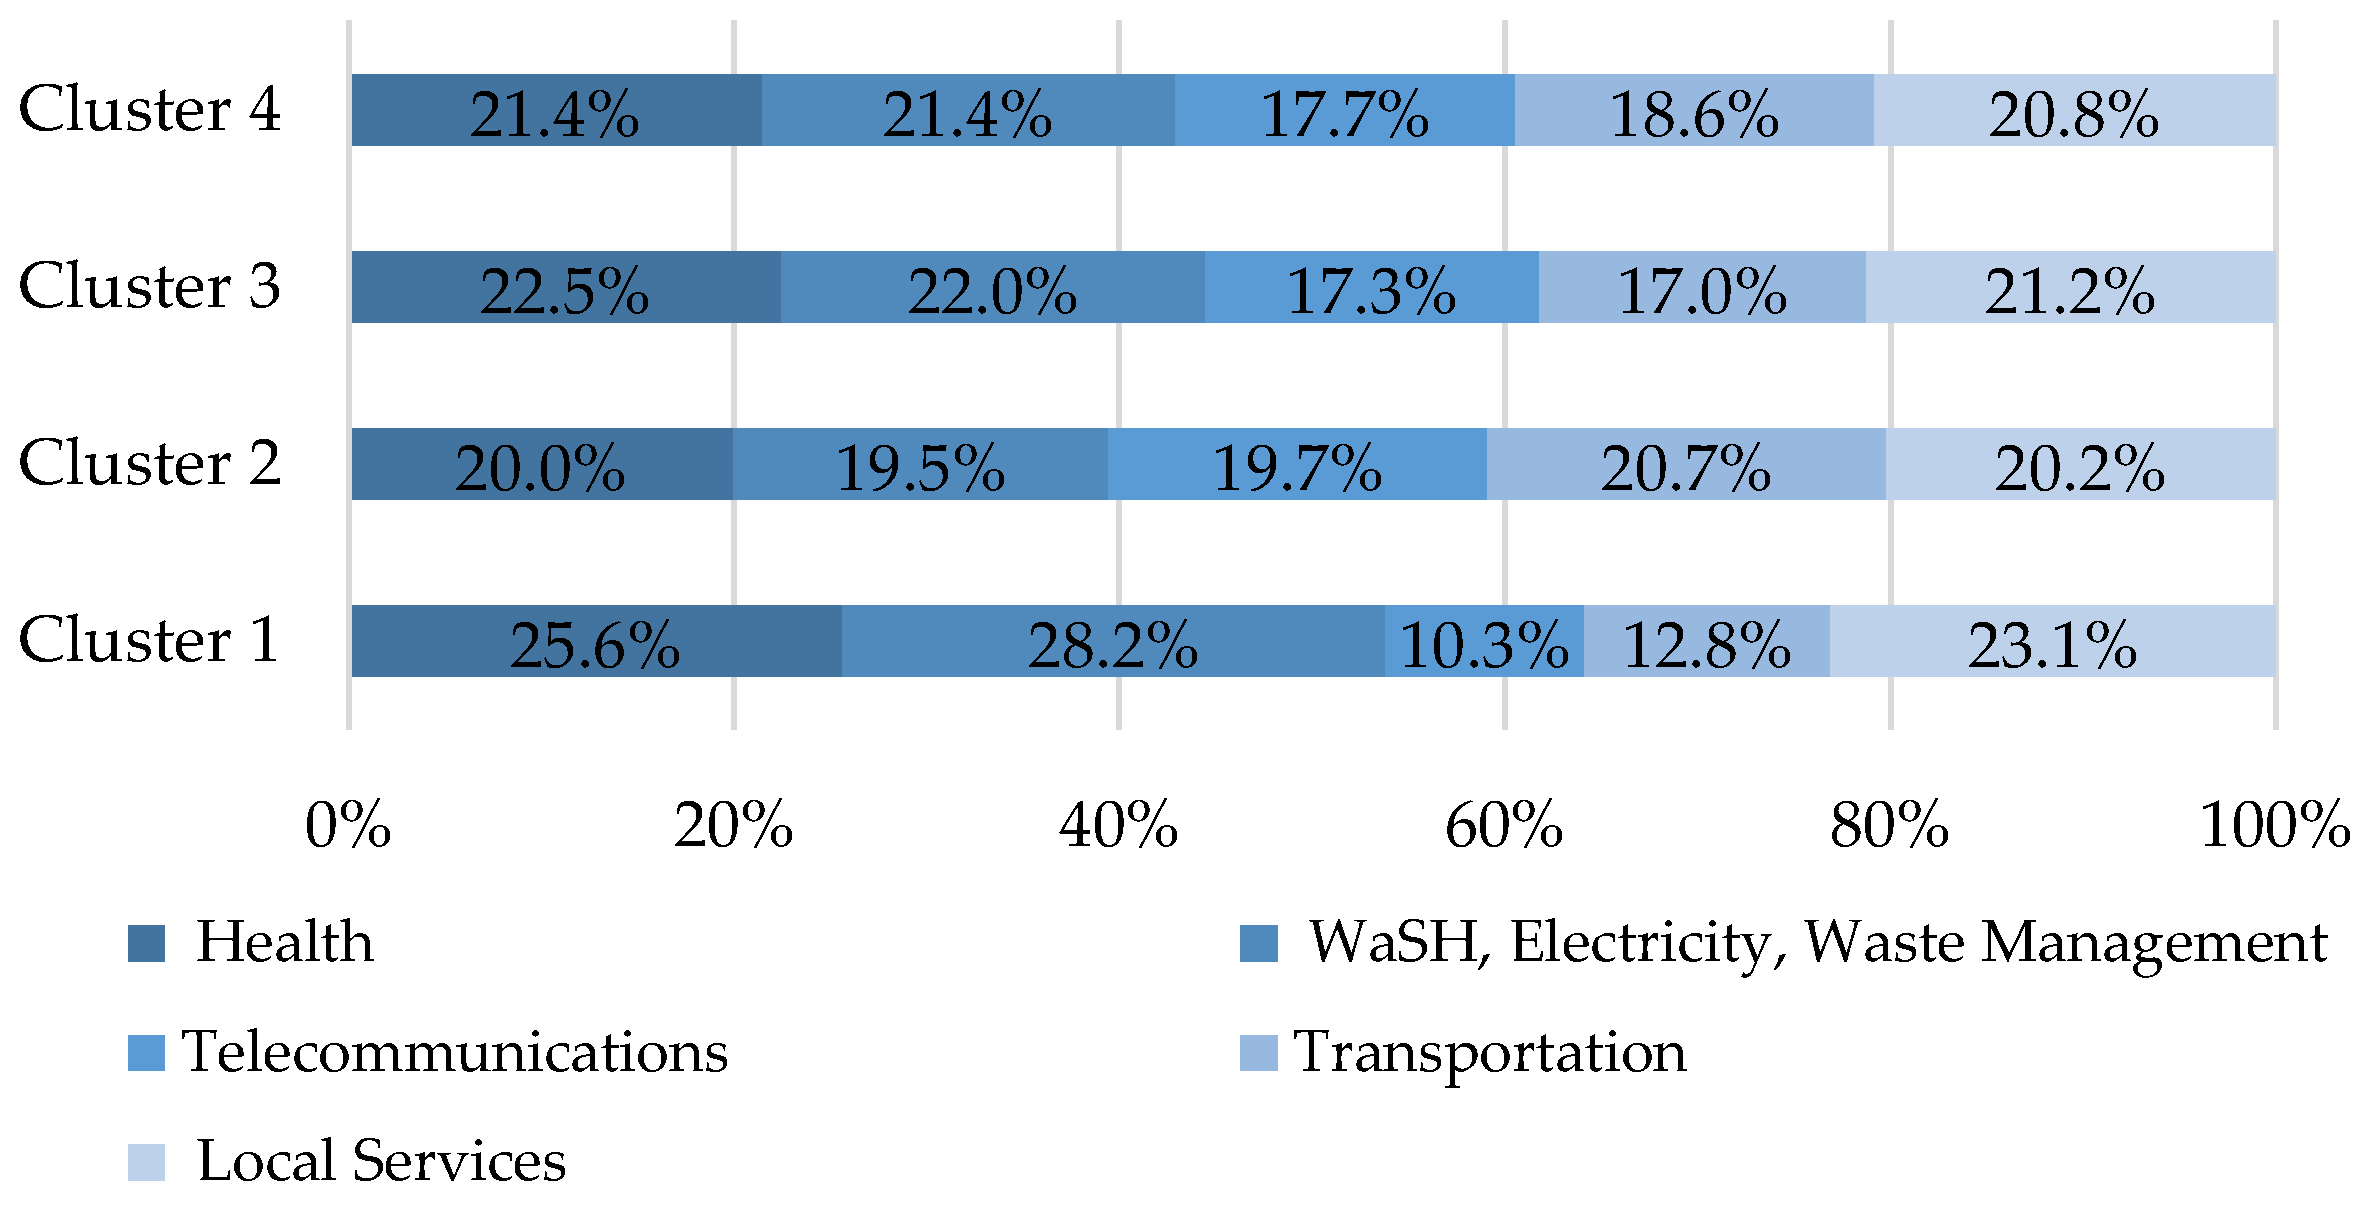
3.2.5. Dimension 5: Infrastructure

The weights obtained for the several Infrastructure sub-dimensions across the four clusters are presented in Figure 10, while Table S10 of the Supplementary Materials presents the sub-dimension scores and weights. As for the Habitat sub-dimensions, the weights that were obtained for the several Infrastructure sub-dimensions also reflected some differences between developed and less-developed countries. By analyzing the weights of the sub-dimensions across the four clusters globally, WaSH, Electricity and Waste Management, and Health appeared to be the most relevant sub-dimensions (with average weights of 22.8% and 22.4%, respectively), closely followed by Local Services (with an average weight of 21.3%). On the other hand, Telecommunications was clearly the least important sub-dimension (with an average weight of 16.3%).
When analyzing the weights obtained for the several sub-dimensions across the individual clusters, the relative importance of the five sub-dimensions were seen to be relatively uniform for C2, C3, and C4. On the other hand, for C1, the range was much higher (17.9%) due to the WaSH, Electricity and Waste Management sub-dimension weight of 28.2% (the largest weight among all the clusters) and the Telecommunications sub-dimension weight of 10.3% (the smallest weight among all the clusters). Despite this range, it was noted that for C1, the relevant pattern among the weights of the sub-dimensions was related to the fact that WaSH, Electricity and Waste Management, Health, and Local Services had much larger weights than Telecommunications and Transportation. This result might be explained by the fact that, for countries in this cluster, infrastructures related to these two sub-dimensions cannot be relied upon, even in pre-disaster conditions.

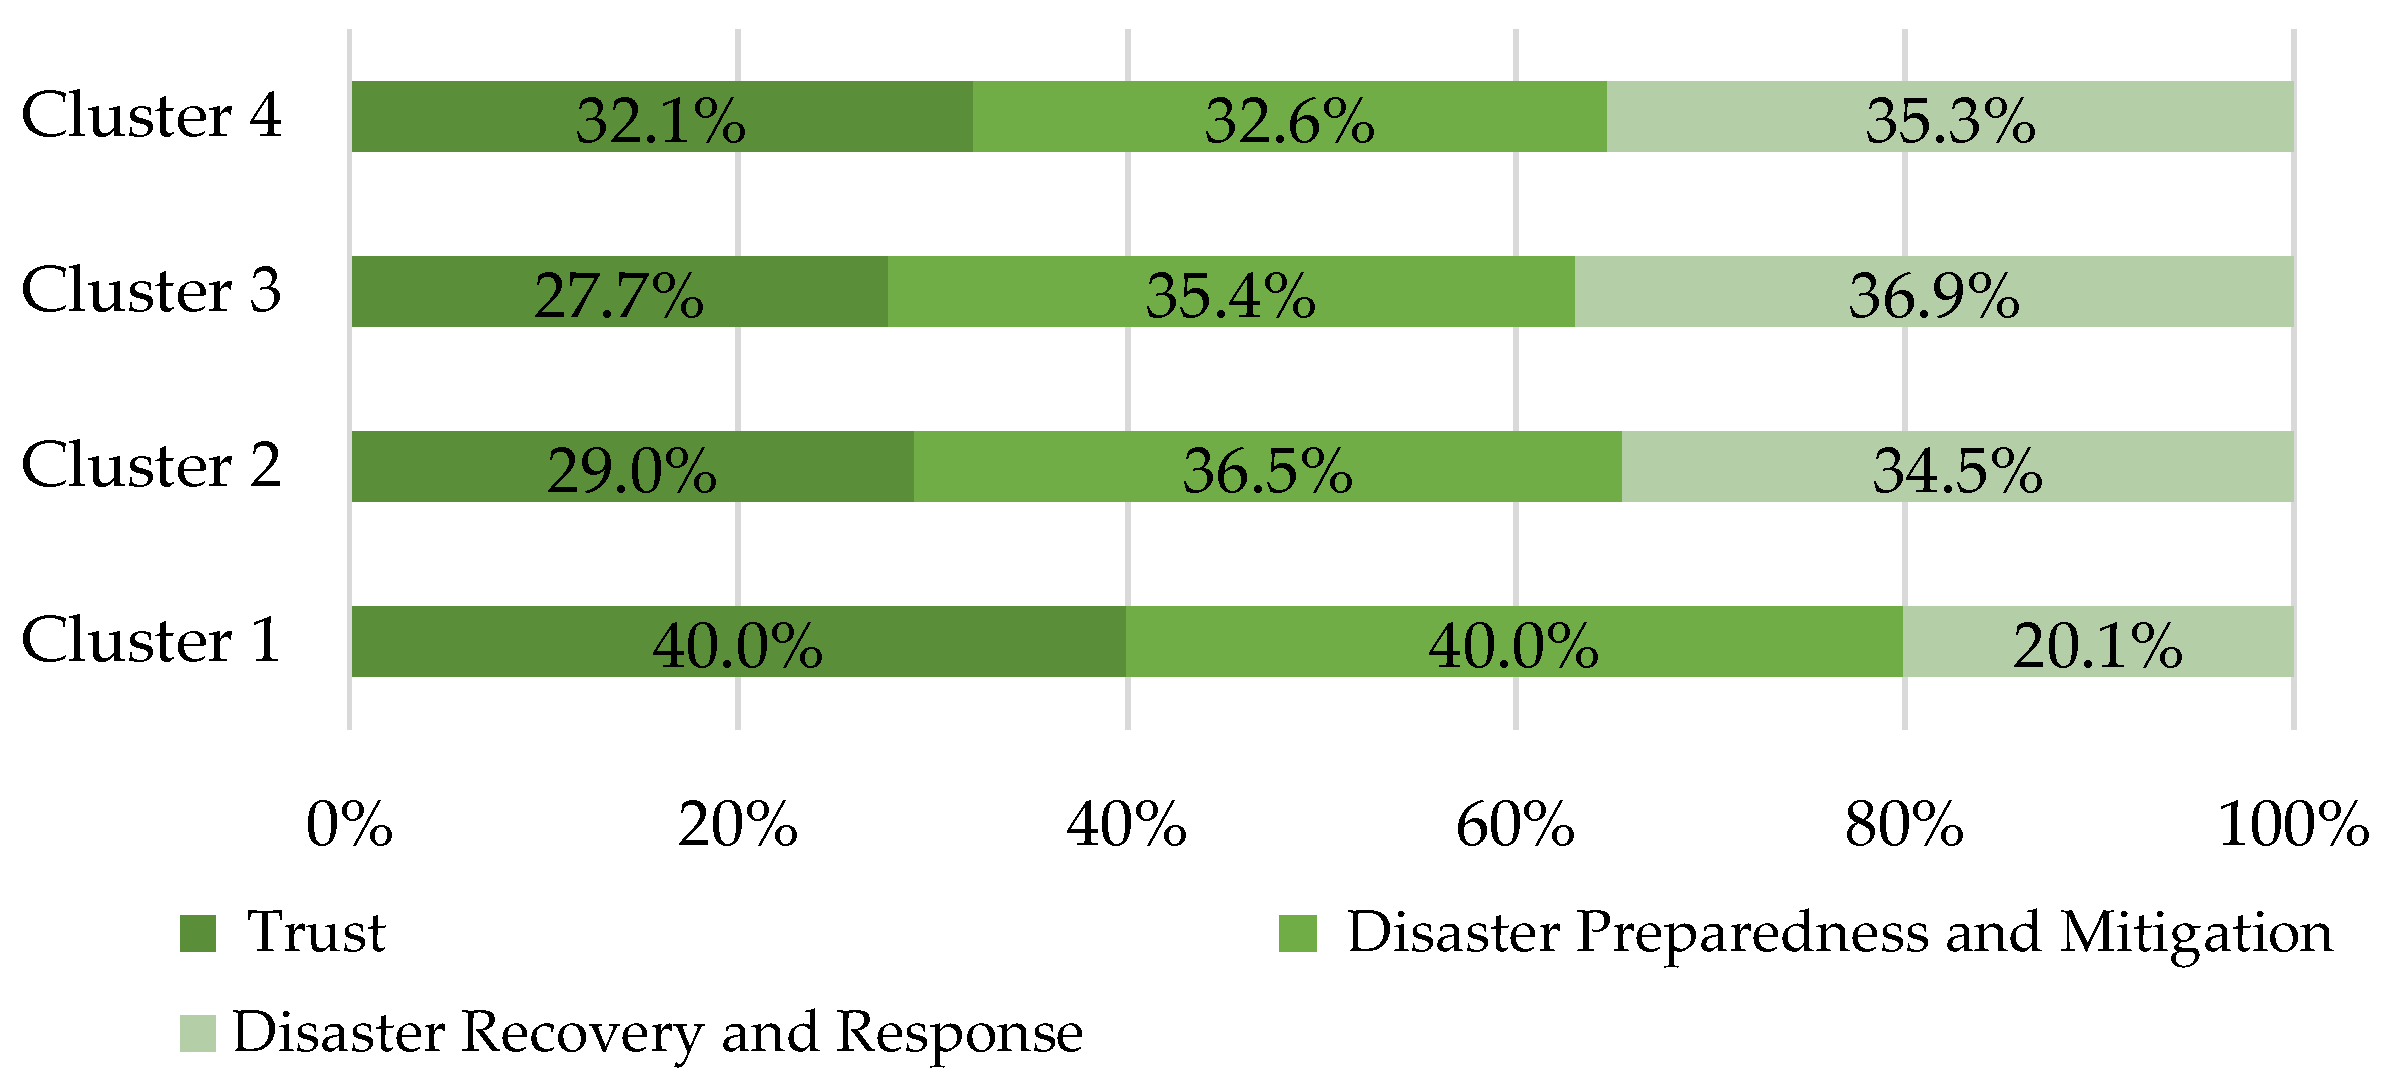
3.2.6. Dimension 6: Institutional

The weights obtained for the several Institutional sub-dimensions across the four clusters are presented in Figure 11, while Table S11 of the Supplementary Materials presents the sub-dimension scores and weights. In terms of sub-components, for C3 and C4, post-disaster measures seemed to be more relevant than disaster preparedness and mitigation. This result was explained by one of the experts for C4 as being related to the fact that “in developed countries, the culture of civil protection is still based on a strong response from the institutions, however these countries are trying to shift the focus to pre-disaster measures that could avoid the need of such a huge deployment of institutional resources in the aftermath of an event”. On the contrary, for C1, Disaster Response and Recovery were significantly less relevant than the other sub-dimensions. This indicated that, in this case, communities are not likely to be able to rely much on institutional support in the aftermath of a disaster.

4. Discussion

Aside from the contributions for determining the weights of the resilience dimensions and sub-dimensions presented in the previous section, the experts also shared their opinions on the proposed theoretical framework and the cluster-based approach as a way to achieve a more targeted resilience assessment. In addition, the experts provided further insights regarding potential improvements of the methodology. A brief discussion of these issues is presented in the following.
Regarding the theoretical framework, all the experts agreed that it could be adopted as proposed. Given that the panel of experts included academics, practitioners, and policy makers from multiple countries, this consensus indicated the potential of the proposed framework to be applied at different stages of disaster risk management by various stakeholders. Furthermore, several experts also suggested that the framework could also be applied in the individual analysis of specific dimensions. This was mostly proposed by practitioners, based on the fact that non-governmental organizations and other field organizations usually focus on one dimension according to their sector of intervention. The role of policy makers would then be to synergize contributions from each dimension and, with the support of this framework, prioritize actions in the areas that are more relevant to the country to achieve resilience. The idea of focusing on specific dimensions before addressing the overall resilience was also suggested by experts, who argued that different dimensions were only likely to interact with each other after they individually reached a certain level of resilience. As an example, it was pointed out that it is difficult to achieve resilience in the Habitat dimension if the Economic one does not achieve a certain threshold, given that poor people tend to live in denser and, usually, more vulnerable and hazard-exposed settlements [100]. Furthermore, a similar reasoning should be applied to the sub-dimensions. For example, scoring high in the Economic dimension was not likely to significantly benefit resilience if some of its sub-dimensions scored very low; e.g., if wealth distribution was particularly unequal across the population, the poor would inherently become poorer, more vulnerable, and less resilient [101].
The results that were obtained for the scores of the sub-dimensions were sometimes more evenly distributed than what was understood from the comments of the experts. This occurred because, in some cases, the respondents did not attribute the scores based on the current relative importance of the sub-dimensions, but on their expected or desired importance, which ideally gave more similar weights to each different sub-dimension. This was also one of the reasons why the results for developed countries showed higher and more evenly distributed scores: the minimum level is reached in each component and their relative importance becomes more similar. According to some respondents in C4, this effect also occurred because developed countries show a sort of compensatory approach, across dimensions and within them, where the shortcomings of one dimension can be compensated by the higher performance of another. Still, this will only happen, as mentioned before, once each dimension has reached a certain minimum level of performance. Until this goal is achieved, dimensions need to be prioritized, and a non-compensatory approach needs to be adopted. Given that the minimum level of performance that activates a shift in the focus on each specific dimension still needs to be understood, this issue should be the subject of future research. Nevertheless, the outcomes of the Delphi process clearly indicated that the dimension and sub-dimension scores and weights would change according to how a given country develops, which was consistent with the cluster-specific approach that was proposed herein. Furthermore, it was also noted that, if needed, it would also be possible to determine dimension and sub-dimension scores and weights tailored to assess resilience for a specific hazard. In this case, the Delphi process would have to involve experts with a specific background connected to the desired hazard.
Aside from being able to establish the minimum level of performance, after which the dimensions and sub-dimensions can begin mutually compensating each other, further research should also address the definition of target levels of resilience relevant to different clusters. Currently, given that there is no clear definition of the specific target resilience that needs to be achieved, existing approaches assessing the resilience of countries are only able to use these assessments to compare scores among countries or with the world’s best-performing country. Being able to define such a target would provide a more objective measure to achieve resilience. However, despite continuous efforts addressing this issue (e.g., see [102] and references therein), further research is still needed. Nevertheless, the proposed framework is an alternative approach to the current state of the art, given that it introduces the possibility of comparing the resilience performance of a given country with others in a cluster of countries with similar characteristics. By using this approach, policy makers will be less likely to make comparisons involving less realistic targets, and can focus on advancing the development of certain dimensions individually. In this context, the proposed resilience assessment framework can be used not only for the initial analysis, but also as a tool to monitor improvements related to achieving specific targets. Furthermore, it can also be useful as an instrument to prioritize policy lines after understanding which dimension is not contributing or preventing others from effectively contributing to the overall resilience.
Regarding the cluster-based approach, the experts found the idea of tailoring the assessment framework to different groups of countries to be sound and adequate. In terms of the actual clusters that were considered in the research, the experts agreed with their definition. Still, a few experts that scored C3 noted that assigning the scores was challenging due to the large size of this cluster. To overcome this difficulty, the experts suggested to either recluster C3 into at least two sub-groups or examine the possibility of using a larger number of indicators for the global cluster analysis. The first suggestion could not be implemented simply by performing a global cluster analysis involving more clusters, as seen in Section 2.2. Therefore, different clustering methods might be tested, and different approaches for measuring the distance between clusters should also be analyzed in future research. On the other hand, the second option suggested that involving more indicators might make the size of the clusters more uniform, which is not the most likely effect of involving more indicators. Two experts also proposed an adaptation of the framework by dividing the assessment into rural and urban regions. It is believed that this could be applicable at the country level, but in order to do so, it would require a significant number of indicators collected at the scale of urban/rural settlements. Lastly, it was noted that the results of the cluster analysis should be seen as a dynamic output that can change as a function of multiple factors. On the one hand, these changes can be connected to an increase in data availability or to updates in the values of the indicators. On the other hand, these changes can also stem from factors related to the impacts of large-scale disrupting events (e.g., disasters caused by natural hazards, climate change, pandemics, or wars). As such, the cluster analysis should be seen as a tool that should be repeatedly implemented over time to capture these changes.

5. Conclusions

The presented research analyzed the feasibility and relevance of developing a resilience assessment framework that could be applied worldwide, while being simultaneously tailored to clusters of similar countries. By using this approach, cluster-specific weights could be defined for each dimension and sub-dimension of the proposed resilience assessment methodology, and a more consistent comparison of countries was achieved. The results of the Delphi process that was carried out to determine the cluster-specific weights for the proposed framework supported this rationale and provided feedback and suggestions for further developments. Therefore, the proposed framework was seen to be a relevant instrument to identify the strengths and weaknesses of a given country in issues related to disaster risk reduction and sustainable development, and to guide the prioritization of policy development and investment on these topics. Furthermore, the proposed framework provided a tool for comparing the resilience performance of a given country with others in a cluster of countries with similar characteristics. This type of analysis is important to avoid comparisons that involve unrealistic resilience targets, given a country’s current level of development, and provides a sharper focus on the resilience dimensions that need to be prioritized for improvements. The regular implementation of the proposed framework can also be used to monitor changes in the development and resilience of a country or to reflect the impacts of a large-scale disrupting event, such as a disaster caused by a natural hazard, climate change, a pandemic, or a war. To illustrate the potential of the proposed framework, the following summarizes some of the more relevant outcomes that were established based on the results of the Delphi process:
  • The proposed cluster-specific approach for analyzing and achieving disaster resilience was supported by the fact that the scores and weights of the resilience dimensions and sub-dimensions changed according to the level of development of the countries in each cluster. Therefore, to assess the level of disaster resilience in a given country, the proposed framework should be used, and the resilience dimensions and sub-dimensions weights that were determined for the cluster of that country should be considered.
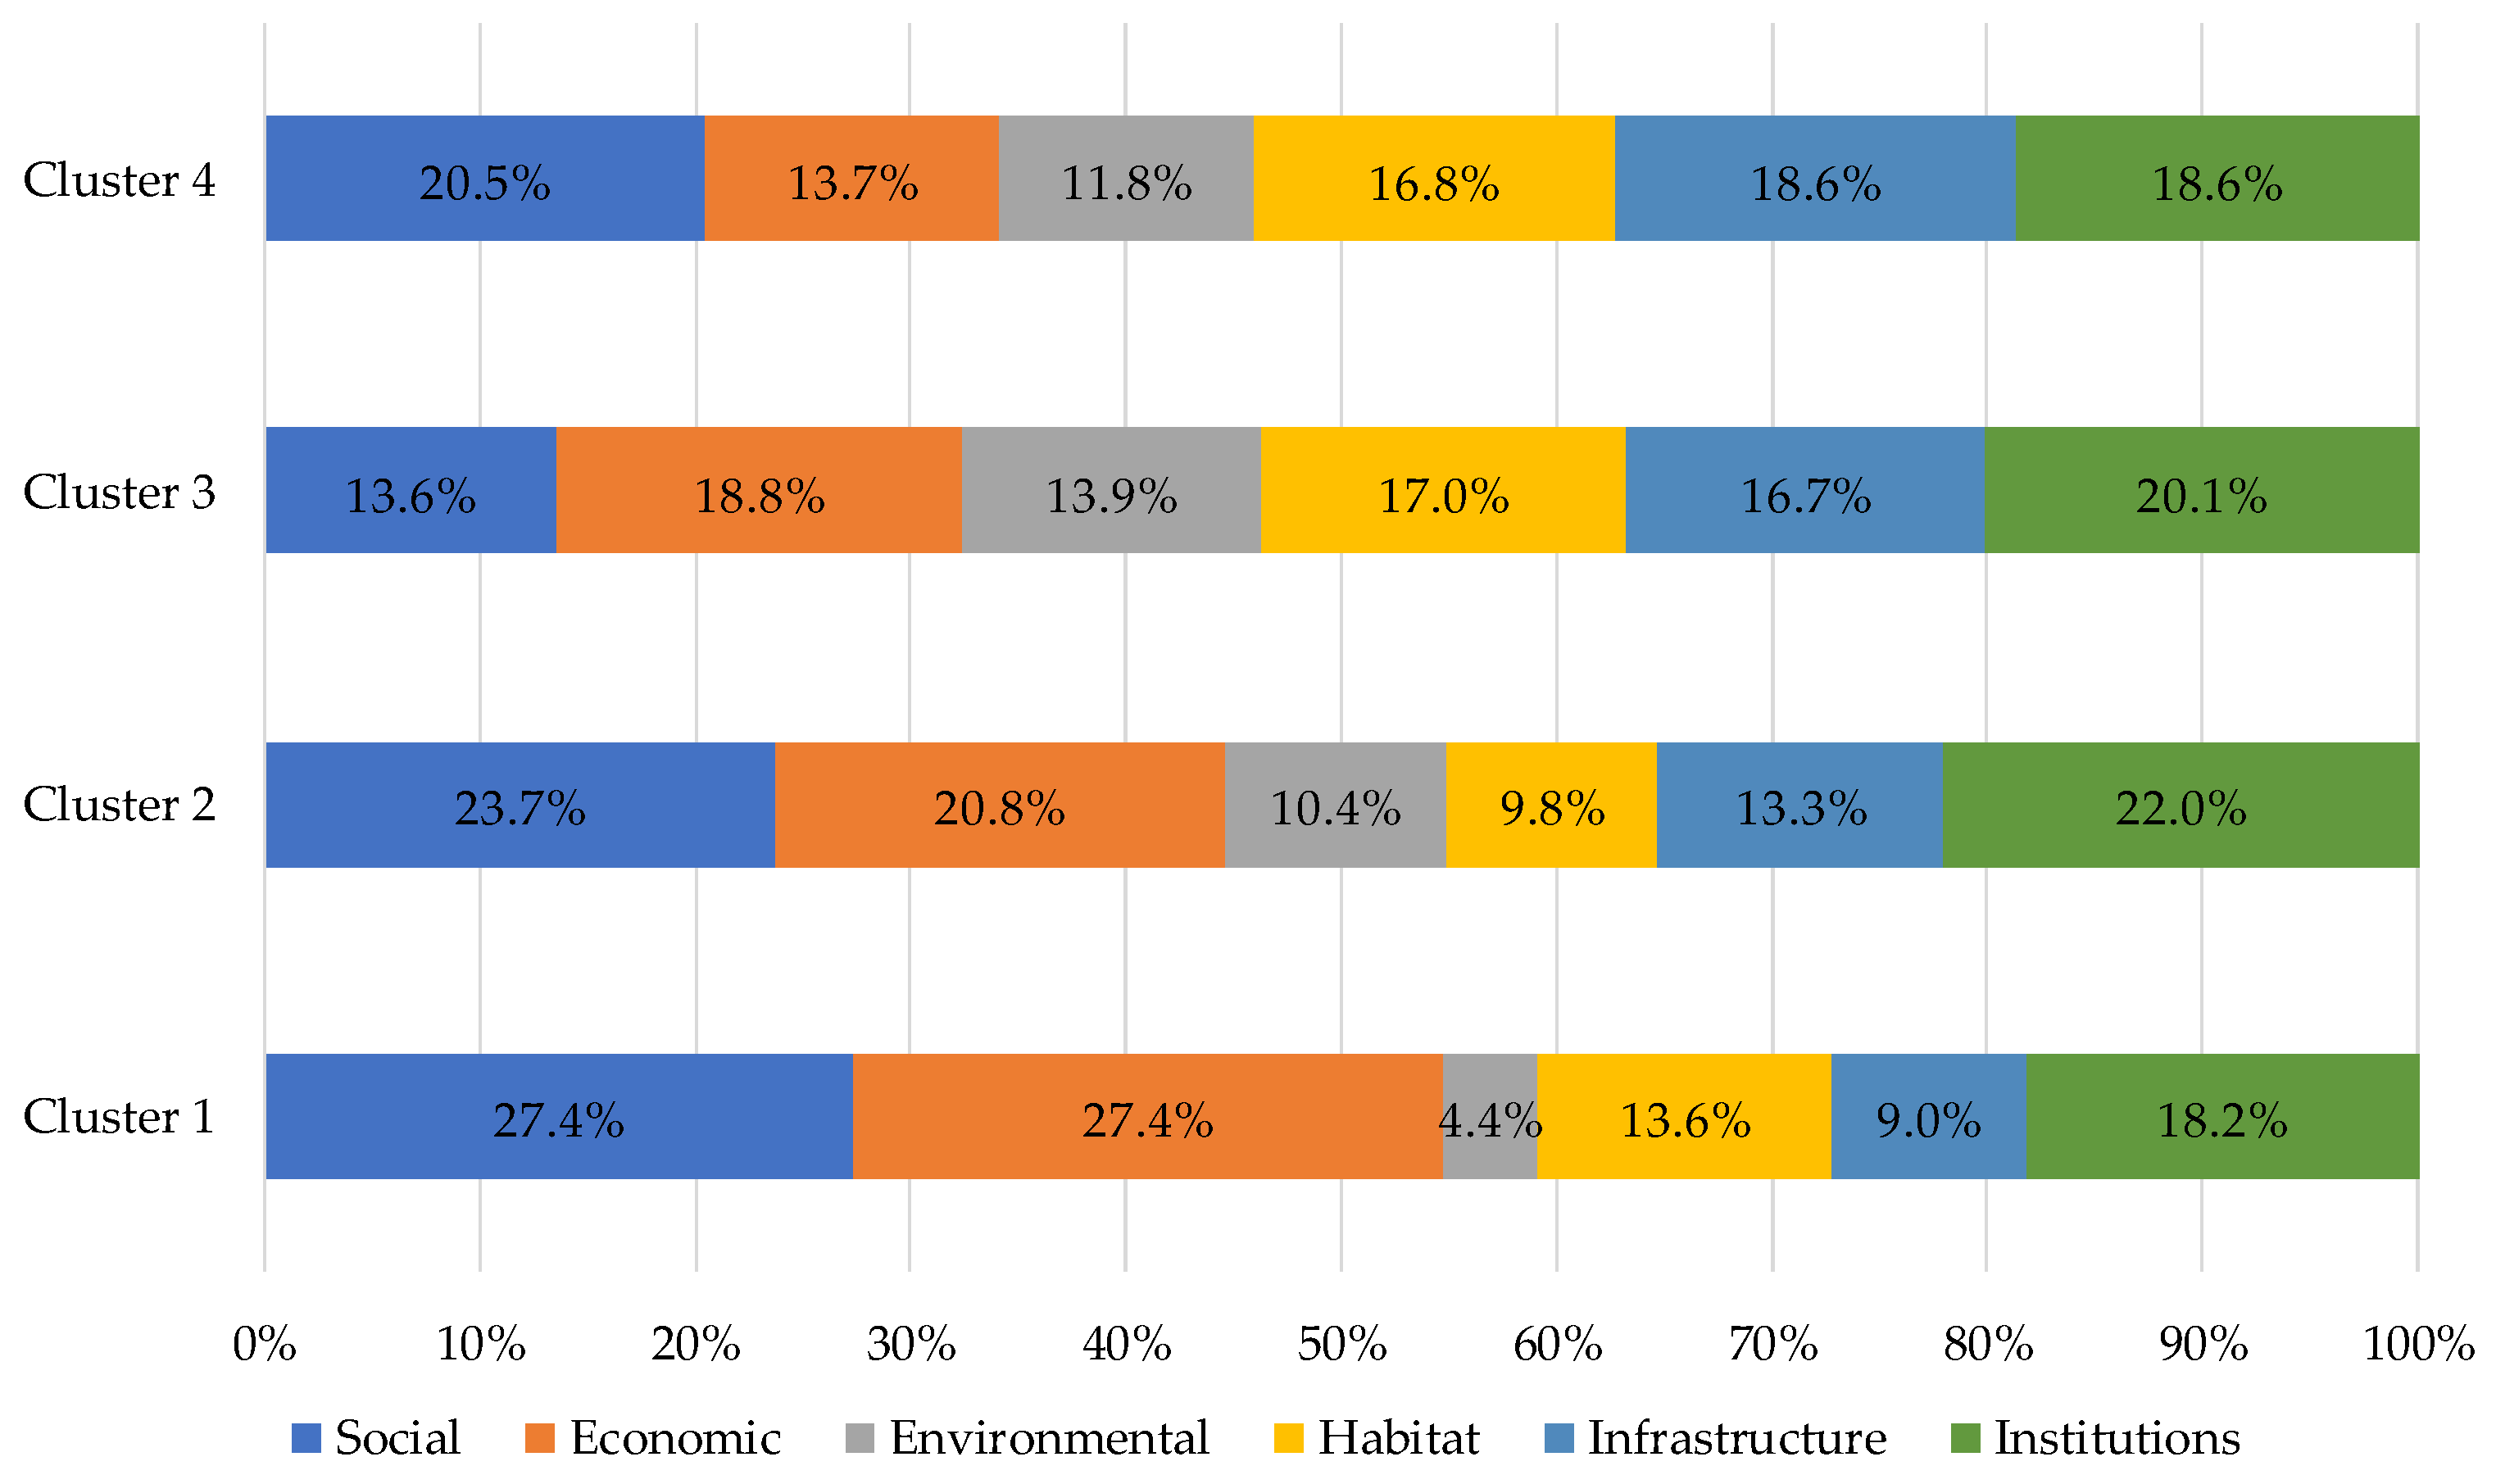
  • Among the six dimensions of resilience that were considered, the Social and the Economic dimensions were those that were given more weight to achieve resilience across the four clusters, while the Habitat and Environmental dimensions were those that were given less weight. The Institutional dimension had the third-highest weight, and was the one with the most stable contribution across the four clusters.
  • In clusters involving the least-developed countries, the dimension weights were seen to reflect a large asymmetry in the contribution of each dimension to achieve resilience. This indicated that certain resilience dimensions need to be prioritized for improvements.
  • In clusters involving more developed countries, the dimension weights were more evenly distributed. This indicated that each dimension was likely to have achieved a minimum level of contribution to resilience. Still, the characteristics of this minimum level are not understood yet and should be the focus of further research.
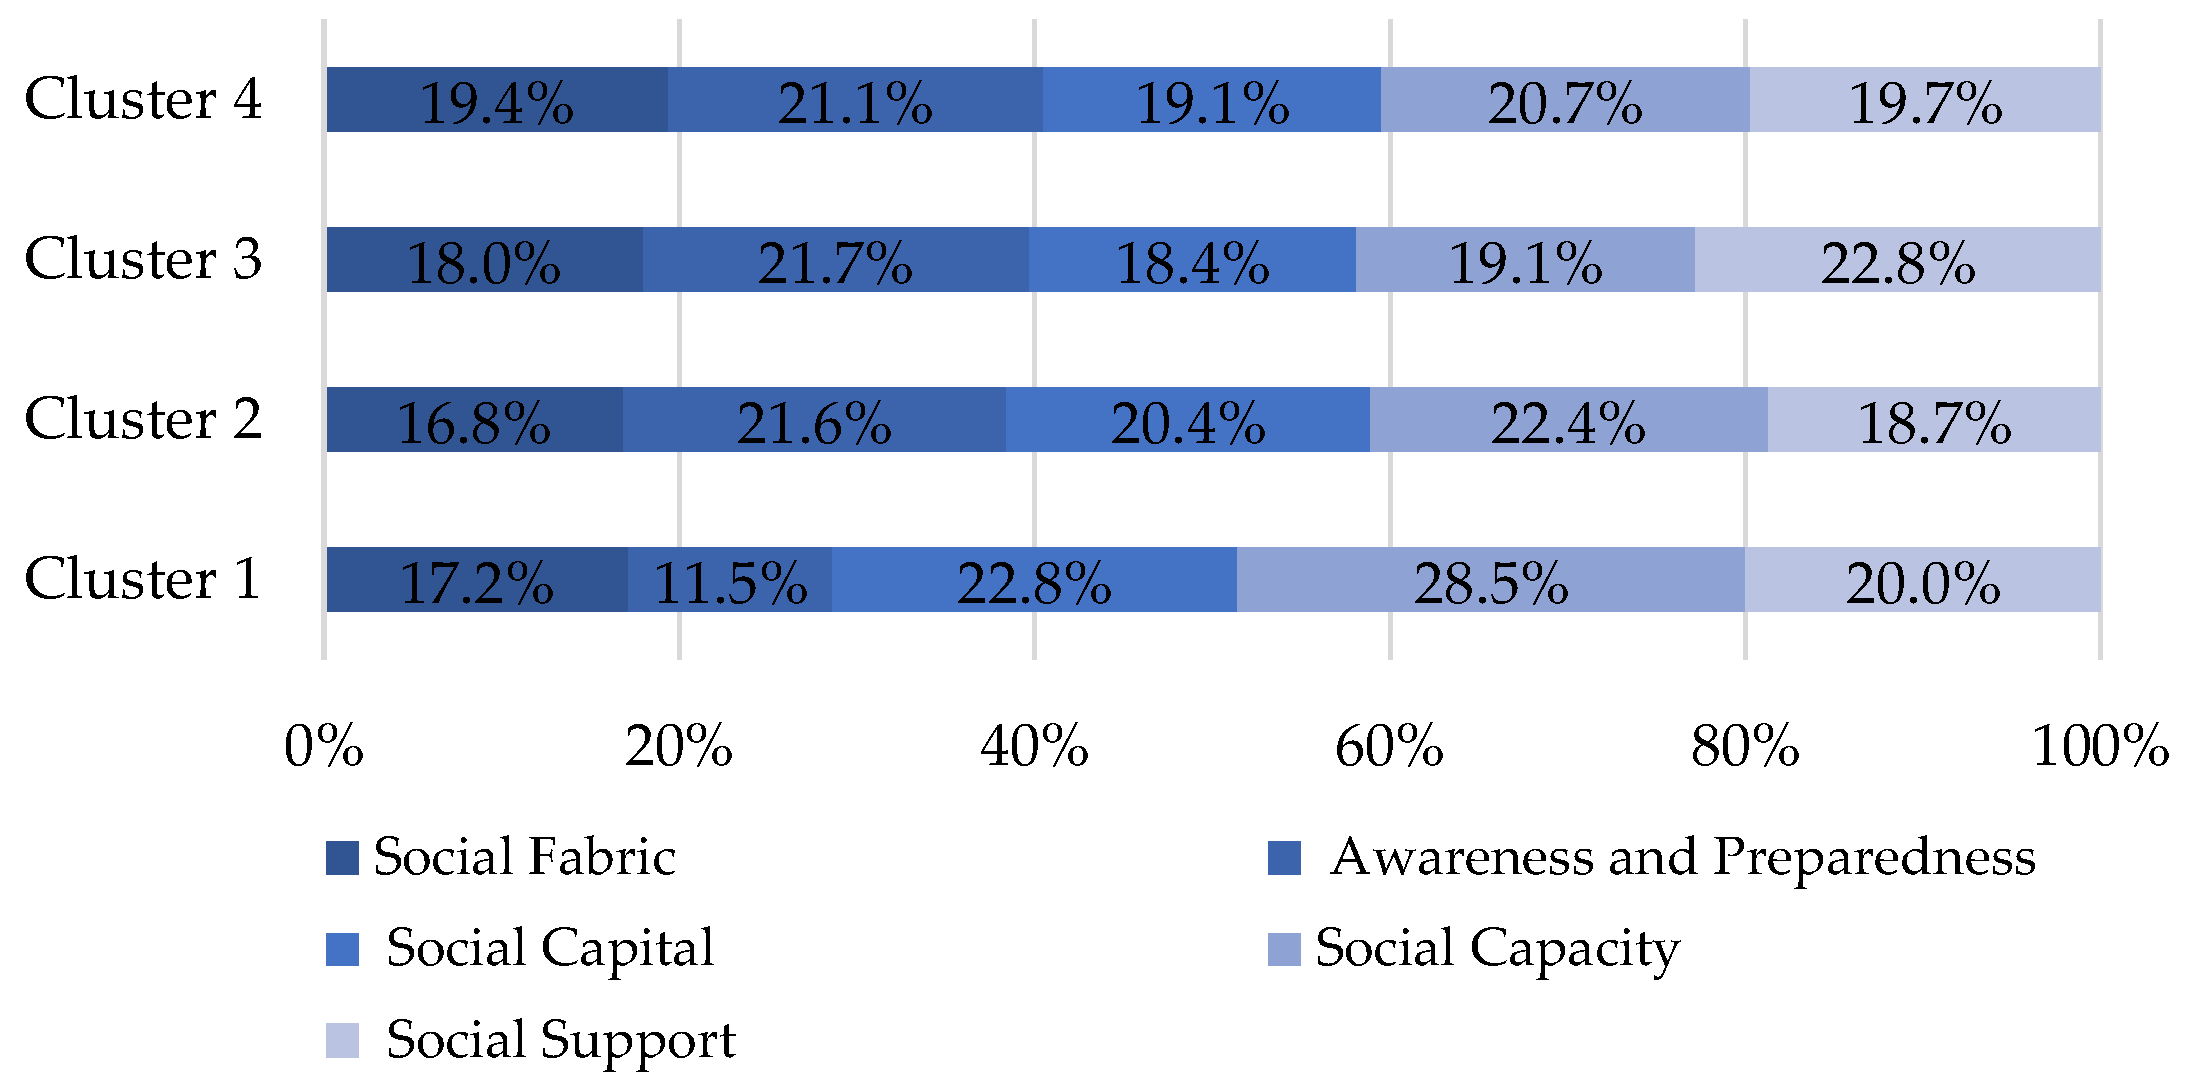
  • When analyzing the sub-dimensions of the Social dimension, it was seen that, for the cluster involving the least-developed countries (C1), Social Capacity was given a much larger weight than the other sub-dimensions. On the contrary, the weights of the sub-dimensions were more uniform for the other three clusters.
  • When analyzing the sub-dimensions of the Economic dimension, the Resources sub-dimension was seen to be the most relevant across the four clusters.
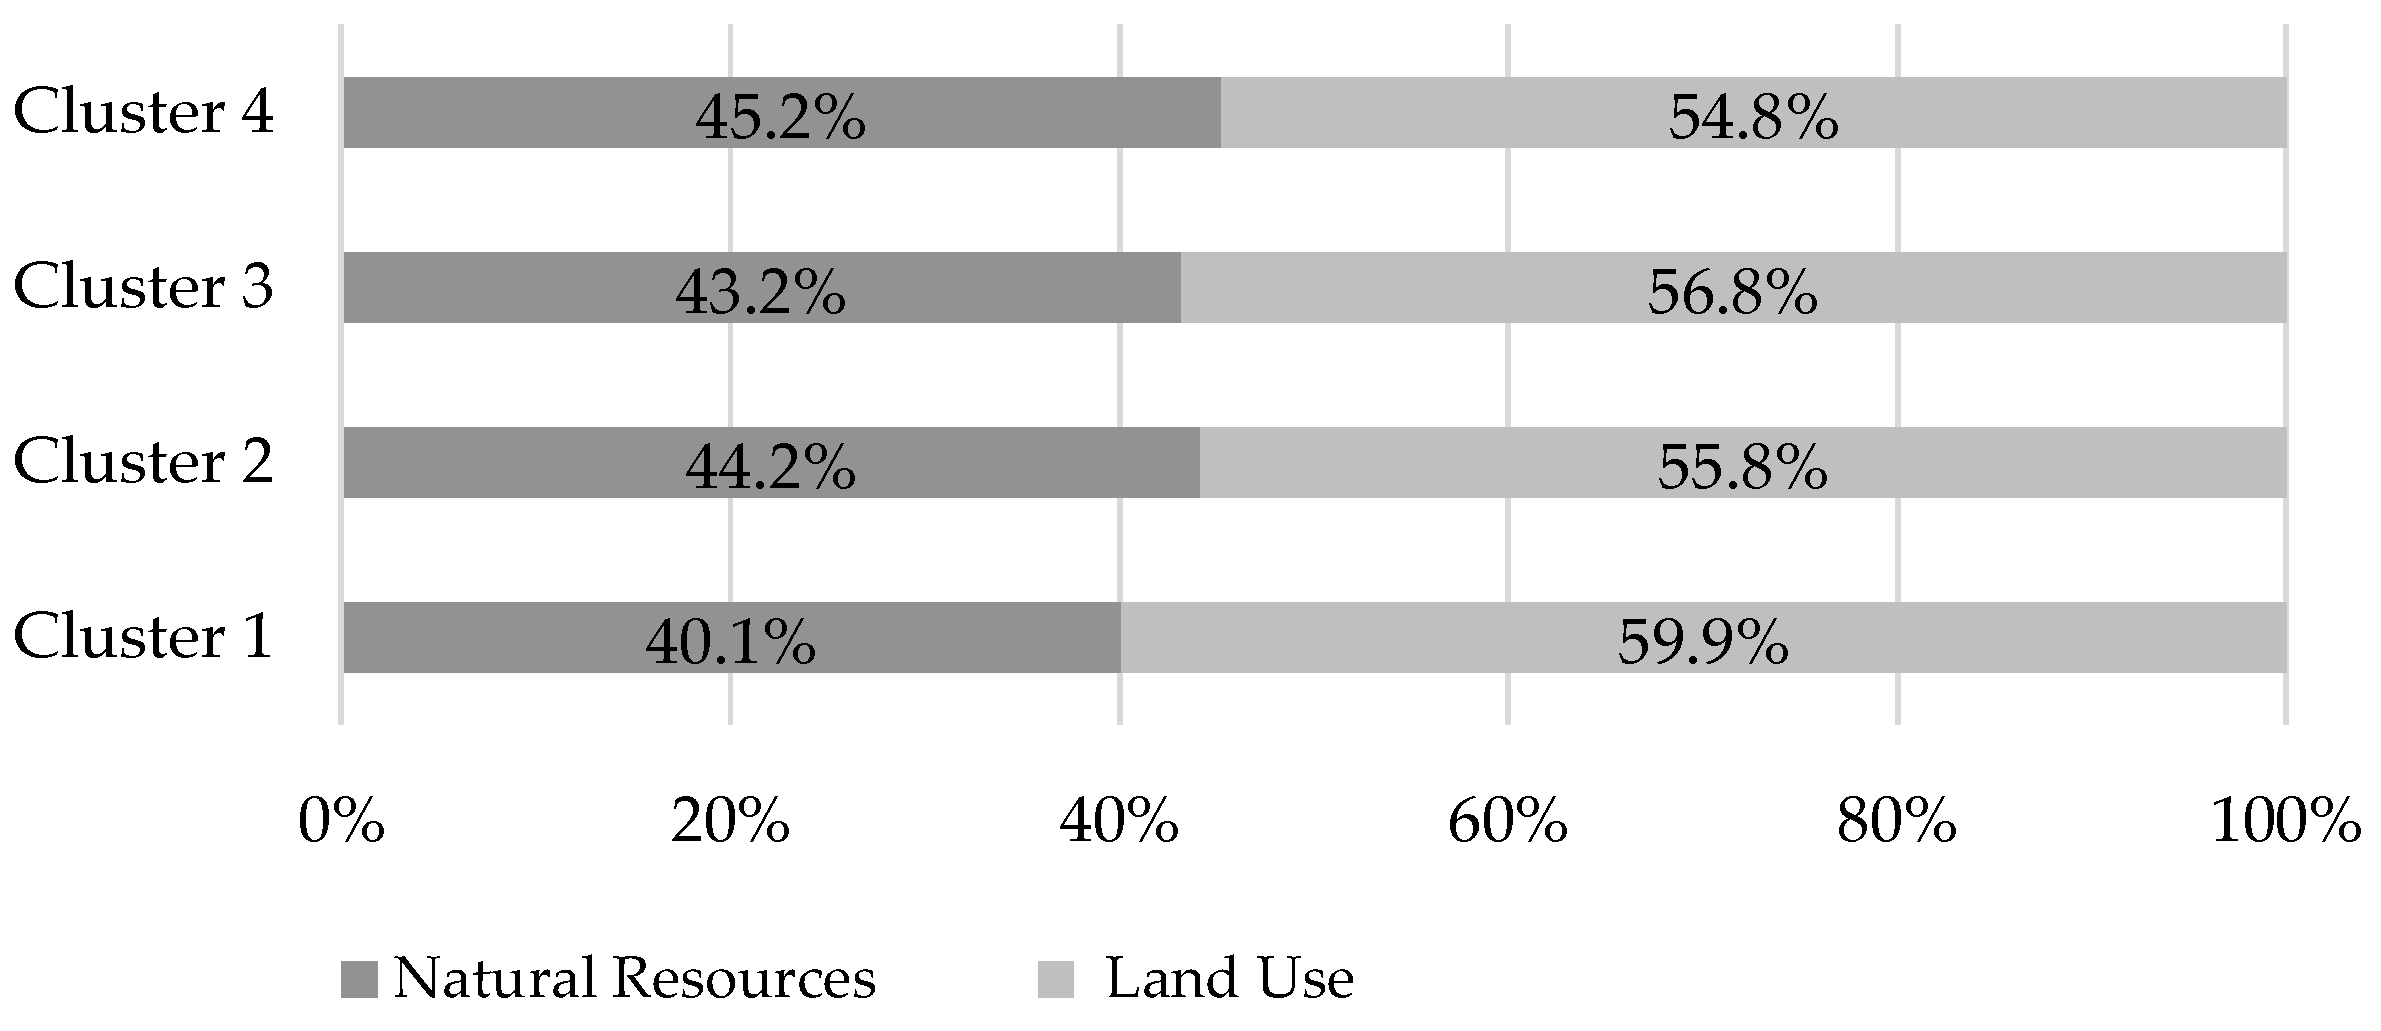
  • When analyzing the two sub-dimensions of the Environmental dimension, their weights were seen to be similar across the clusters, and indicated that the way resources are managed is more important than the existence of the actual resources.
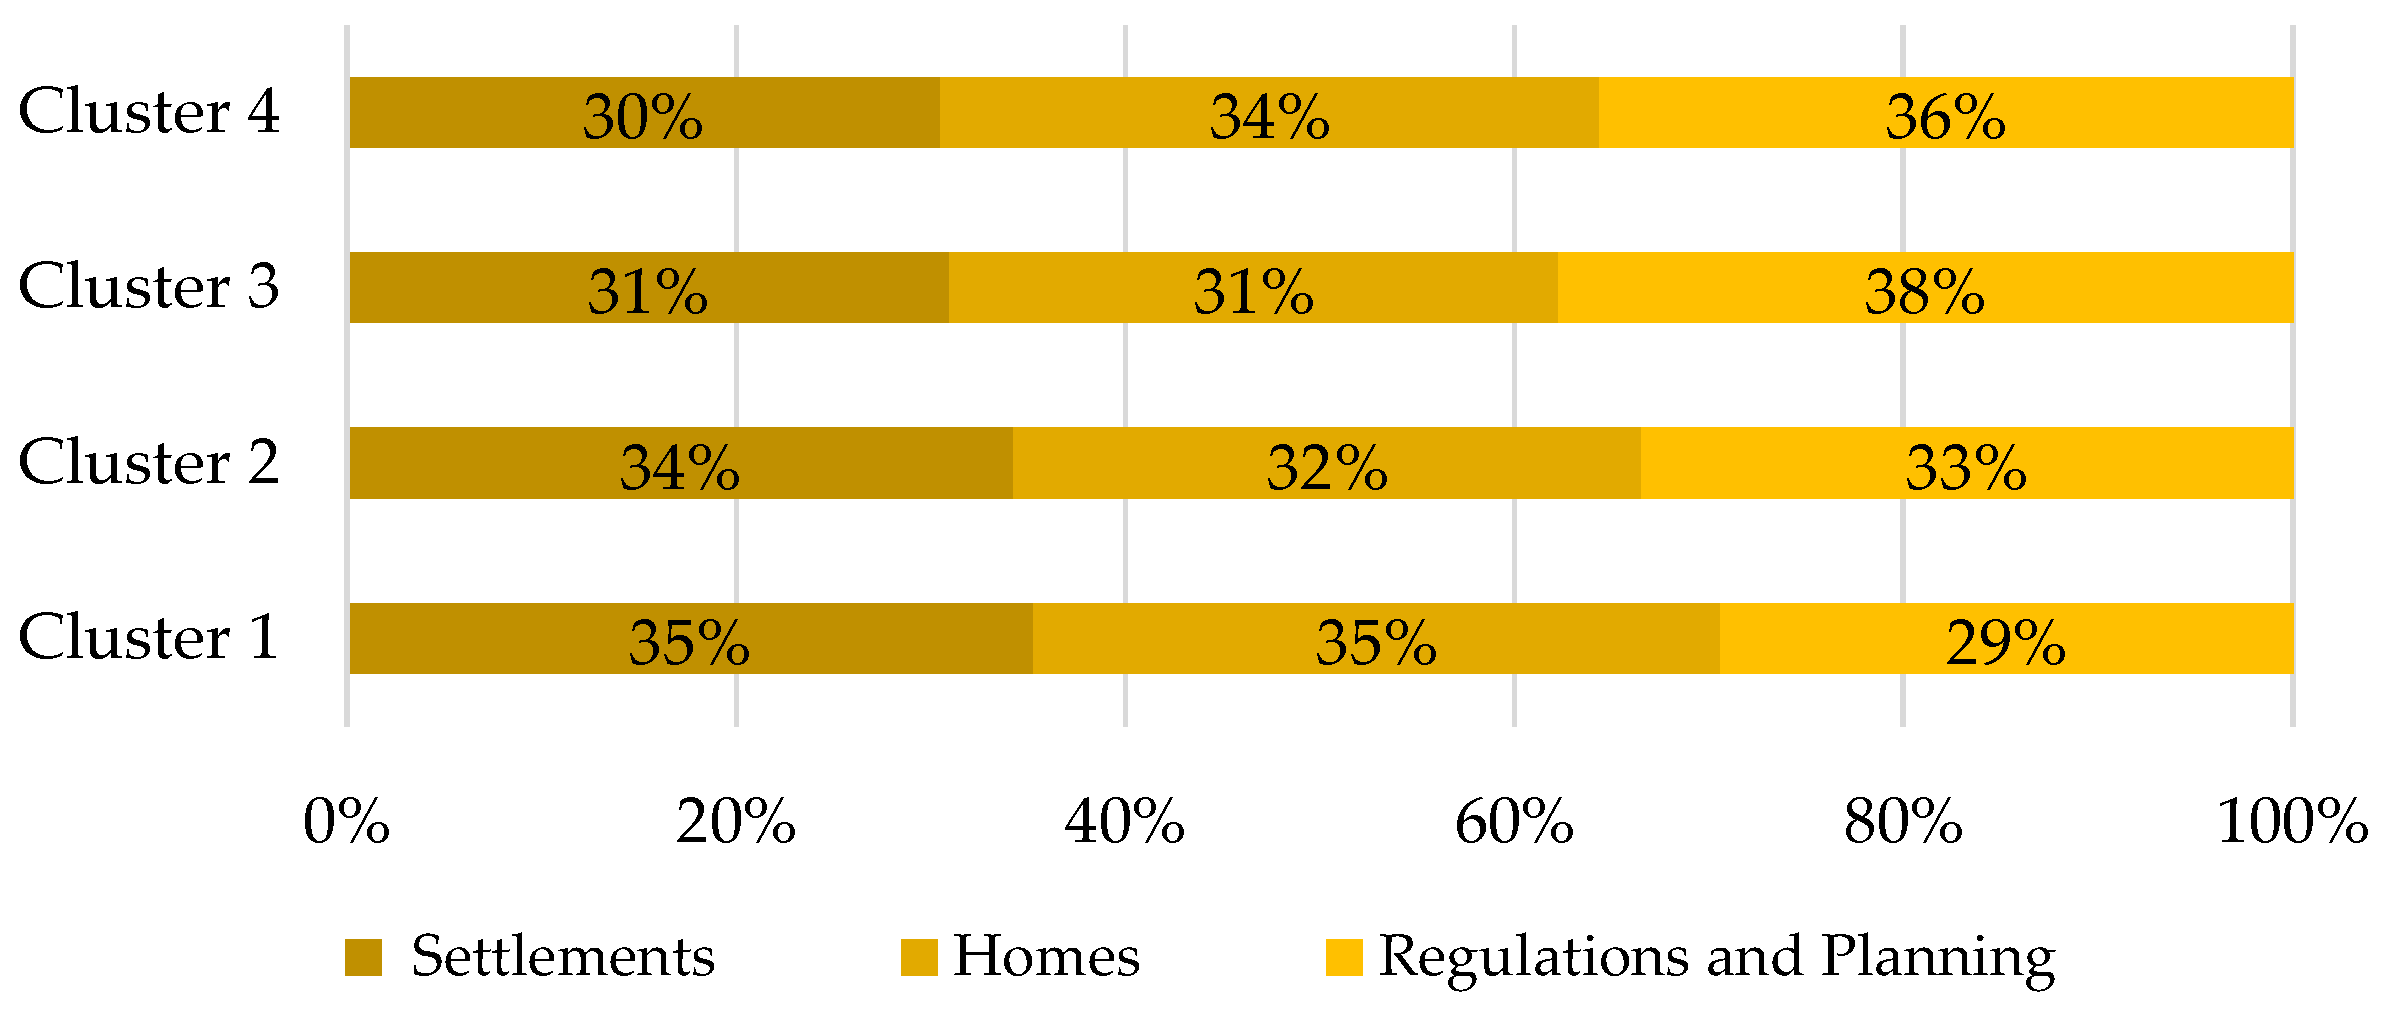
  • When analyzing the sub-dimensions of the Habitat dimension, the weights obtained for the several sub-dimensions across the individual clusters showed a clear difference between developed and less developed countries. For the latter, Settlement was the most important sub-dimension, while for the former, the Regulations and Planning sub-dimension was the most relevant one. This indicated that in less developed countries (C1 and C2), regulations are usually less enforced and informal settlements are more common, while developed countries (C3 and C4) trust the enforcement of regulations to achieve resilience.
  • When analyzing the sub-dimensions of the Infrastructure dimension, WaSH, Electricity and Waste Management, and Health were seen to be the most relevant sub-dimensions across the four clusters, particularly in the least developed countries (C1).
  • When analyzing the sub-dimensions of the Institutional dimension, Disaster Response and Recovery was seen to be significantly less relevant for the least developed countries (C1). This indicated that communities might be unable to rely on institutional support in the aftermath of a disaster.
Despite the encouraging results that were obtained with the proposed framework, some of its features should be analyzed in further research to determine their impacts on the results and identify potential limitations. One of these features was related to the initial cluster analysis of the countries. This analysis was constrained by the availability of data for the selected indicators, and further analyses should be carried out in the future involving more indicators as the corresponding data for the SDG framework become more available. In addition, instead of clustering countries based solely on their sustainable development score, the possibility of using a combination of this score with available country-level hazard exposure indices (e.g., similar to those available in [103]) should also be analyzed in order to enhance the connection with disaster risk. Furthermore, alternative clustering approaches (i.e., in terms of clustering method and number of clusters) should also be tested to understand the effects of different options. These different options may also influence the implementation of the Delphi process since, for example, if a larger number of clusters is selected, a larger number of experts may also be required. While engaging more experts may be seen as a challenge, involving a larger number of clusters may be beneficial for the experts, since providing survey responses that are applicable to smaller groups of countries may be easier. Regarding the Delphi method itself, there are also aspects that could be further analyzed. For example, strategies to increase participation retention between rounds should be pursued, and using alternative hybrid Delphi approaches that combine a Delphi process with other techniques such as the nominal group technique or focus groups should also be explored (e.g., see [104]). Further research directions related to the proposed framework should also target the selection of indicators for the selected resilience dimensions and sub-dimensions (e.g., see [48] as a starting point) and establish a methodology (similar to that in [105]) that could measure/validate the prediction capacity of the proposed framework. The empirical data needed for this methodology can be based on the damage and loss indicator data collected within the scope of the Sendai Framework for Disaster Risk Reduction [106] and other sources (e.g., see the approach followed in [107]).

Supplementary Materials

The following are available online at https://www.mdpi.com/article/10.3390/su14159162/s1, Figure S1: Results of the internal cluster validity indices, S8: Survey used in the Delphi process, Table S1: Countries selected in the research, Table S2: Imputation of missing values: identification of the nearest neighbors, geographical meaningfulness, and availability of data, Table S3: Clusters of countries considering 3 clusters, Table S4: Clusters of countries considering 4 clusters, Table S5. Clusters of countries considering 5 clusters, Table S6: Clusters of countries considering 6 clusters, Table S7: First structure of the proposed DRI, Table S8: Average scores (sc) and normalized weights (w) of the Social sub-dimensions by cluster, Table S9: Average scores (sc) and normalized weights (w) of the Economic sub-dimensions by cluster, Table S10: Average scores (sc) and normalized weights (w) of the Environmental sub-dimensions by cluster, Table S11: Average scores (sc) and normalized weights (w) of the Habitat sub-dimensions by cluster, Table S12: Average scores (sc) and normalized weights (w) of the Infrastructure sub-dimensions by cluster, Table S13: Average scores (sc) and normalized weights (w) of the Institutional sub-dimensions by cluster.

Author Contributions

Conceptualization, C.R., J.M.M. and X.R.; methodology, C.R., J.M.M. and X.R.; investigation, C.R.; writing—original draft preparation, C.R. and X.R.; writing—review and editing, C.R., J.M.M. and X.R.; visualization, C.R. and X.R. All authors have read and agreed to the published version of the manuscript.

Funding

This research was partially supported by a Ph.D. scholarship awarded to the first author from the Ph.D. program Understanding and Managing Extremes—XXXII cycle, curriculum Risk and Emergency Management, of the Scuola Universitaria Superiore IUSS—Pavia. In addition, the research was also partially supported by the Base Funding—UIDB/04708/2020 of CONSTRUCT—Instituto de I&D em Estruturas e Construções, funded by national funds through FCT/MCTES (PIDDAC).

Informed Consent Statement

Informed consent of the participants was waived according to a Statement from the Ethics Committee of the Centre for Social Studies (CE-CES).

Conflicts of Interest

The authors declare no conflict of interest.

References

  1. Norris, F.H.; Stevens, S.P.; Pfefferbaum, B.; Wyche, K.F.; Pfefferbaum, R.L. Community Resilience as a Metaphor, Theory, Set of Capacities, and Strategy for Disaster Readiness. Am. J. Community Psychol. 2008, 41, 127–150. [Google Scholar] [CrossRef]
  2. Füssel, H.-M. Review and Quantitative Analysis of Indices of Climate Change Exposure, Adaptive Capacity, Sensitivity, and Impacts; The World Bank: Washington, DC, USA, 2010. [Google Scholar]
  3. Report of the Open-Ended Intergovernmental Expert Working Group on Indicators and Terminology Relating to Disaster Risk Reduction; United Nations General Assembly: New York, NY, USA, 2016.
  4. Vincent, K. Creating an Index of Social Vulnerability to Climate Change for Africa; Tyndall Centre Working Paper No. 56; University of East Anglia: Norwich, UK, 2004; pp. 1–50. [Google Scholar]
  5. Fekete, A. Validation of a Social Vulnerability Index in Context to River-Floods in Germany. Nat. Hazards 2009, 9, 393–403. [Google Scholar] [CrossRef] [Green Version]
  6. Tariq, H. Measuring community disaster resilience at local levels: An adaptable resilience framework. Int. J. Disaster Risk Reduct. 2021, 62, 102358. [Google Scholar] [CrossRef]
  7. Heijmans, E.P.M. Reaching Resilience: Handbook Resilience 2.0 for Aid Practitioners and Policymakers in Disaster Risk Reduction, Climate Change Adaptation and Poverty Reduction; CARE, Groupe Urgence—Réhabilitation—Développement, Wageningen University: Wageningen, The Netherlands, 2014. [Google Scholar]
  8. IFRC Framework for Community Resilience; International Federation of Red Cross and Red Crescent Societies: Geneva, Switzerland, 2014.
  9. Caimi, A.; Adikpon, B.; Adrian, J.C.; Alsayed, A.; Angermaier, A.; Rozado, C.A.; Ashmore, J.; Aurouet, C.; Belinga, C.; Bello, A.; et al. Assessing Local Building Cultures for Resilience & Development: A Practical Guide for Community-Based Assessment; CRAterre: Villefontaine, France, 2015. [Google Scholar]
  10. Kelman, I. Linking Disaster Risk Reduction, Climate Change, and the Sustainable Development Goals. Disaster Prev. Manag. 2017, 26, 254–258. [Google Scholar] [CrossRef] [Green Version]
  11. Wamsler, C.; Johannessen, Å. Meeting at the crossroads? Developing national strategies for disaster risk reduction and resilience: Relevance, scope for, and challenges to, integration. Int. J. Disaster Risk Reduct. 2020, 45, 101452. [Google Scholar] [CrossRef]
  12. Le Tissier, M.; Whyte, H. Why does making connections through resilience indicators matter? In Creating Resilient Futures; Palgrave Macmillan: Cham, Switzerland, 2022; pp. 23–44. [Google Scholar]
  13. Schipper, E.L.F.; Langston, L. A Comparative Overview of Resilience Measurement Frameworks: Analyzing Indicators and Approaches; Overseas Development Institute: London, UK, 2015. [Google Scholar]
  14. Michel, J. Beyond Aid: The Integration of Sustainable Development in A Coherent International Agenda; Rowman & Littlefield: Lanham, MD, USA, 2016. [Google Scholar]
  15. Hallegatte, S.; Vogt-Schilb, A.; Rozenberg, J.; Bangalore, M.; Beaudet, C. From poverty to disaster and back: A review of the literature. Econ. Disasters Clim. Chang. 2020, 4, 223–247. [Google Scholar] [CrossRef] [Green Version]
  16. Winsemius, H.; Jongman, B.; Veldkamp, T.; Hallegatte, S.; Bangalore, M.; Ward, P. Disaster risk, climate change, and poverty: Assessing the global exposure of poor people to floods and droughts. Environ. Dev. Econ. 2018, 23, 328–348. [Google Scholar] [CrossRef] [Green Version]
  17. Matthews, E.C.; Friedland, C.J.; Orooji, F. Integrated environmental sustainability and resilience assessment model for coastal flood hazards. J. Build. Eng. 2016, 8, 141–151. [Google Scholar] [CrossRef]
  18. Marchese, D.; Reynolds, E.; Bates, M.E.; Morgan, H.; Clark, S.S.; Linkov, I. Resilience and sustainability: Similarities and differences in environmental management applications. Sci. Total Environ. 2018, 613, 1275–1283. [Google Scholar] [CrossRef]
  19. Imperiale, A.J.; Vanclay, F. Using social impact assessment to strengthen community resilience in sustainable rural development in mountain areas. Mt. Res. Dev. 2016, 36, 431–442. [Google Scholar] [CrossRef] [Green Version]
  20. Constas, M.A.; Mattioli, L.; Russo, L. What does resilience imply for development practice? Tools for more coherent programming and evaluation of resilience. Dev. Policy Rev. 2021, 39, 588–603. [Google Scholar] [CrossRef]
  21. Levine, S. Assessing Resilience: Why Quantification Misses the Point; Humanitarian Policy Group (ODI) Working Paper; Overseas Development Institute: London, UK, 2014. [Google Scholar]
  22. Graveline, M.H.; Germain, D. Disaster Risk Resilience: Conceptual Evolution, Key Issues, and Opportunities. Int. J. Disaster Risk Sci. 2022, 13, 330–341. [Google Scholar] [CrossRef]
  23. Sherrieb, K.; Norris, F.H.; Galea, S. Measuring capacities for community resilience. Soc. Indic. Res. 2010, 99, 227–247. [Google Scholar] [CrossRef]
  24. Rifat, S.A.A.; Liu, W. Measuring community disaster resilience in the conterminous coastal United States. Int. J. Geo-Inf. 2020, 9, 469. [Google Scholar] [CrossRef]
  25. Kusumastuti, R.D.; Husodo, Z.A.; Suardi, L.; Danarsari, D.N. Developing a resilience index towards natural disasters in Indonesia. Int. J. Disaster Risk Reduc. 2014, 10, 327–340. [Google Scholar] [CrossRef]
  26. Shim, J.H.; Kim, C. Measuring resilience to natural hazards: Towards sustainable hazard mitigation. Sustainability 2015, 7, 14153–14185. [Google Scholar] [CrossRef] [Green Version]
  27. Yoon, D.K.; Kang, J.E.; Brody, S.D. A measurement of community disaster resilience in Korea. J. Environ. Plan. Manag. 2015, 59, 436–460. [Google Scholar] [CrossRef]
  28. Li, X.; Wang, L.; Liu, S. Geographical analysis of community resilience to seismic hazard in Southwest China. Int. J. Disaster Risk Sci. 2016, 7, 257–276. [Google Scholar] [CrossRef] [Green Version]
  29. Wu, Y.; Que, W.; Liu, Y.G.; Cao, L.; Liu, S.B.; Zhang, J. Is resilience capacity index of Chinese region performing well? Evidence from 26 provinces. Ecol. Indicat. 2020, 112, 106088. [Google Scholar] [CrossRef]
  30. Liu, X.; Li, S.; Xu, X.; Luo, J. Integrated natural disasters urban resilience evaluation: The case of China. Nat. Hazards 2021, 107, 2105–2122. [Google Scholar] [CrossRef]
  31. Ji, T.; Wei, H.H.; Sim, T.; Yang, L.E.; Scheffran, J. Disaggregated validation of disaster-resilience indicators using household survey data: A case study of Hong Kong. Sustain. Cities Soc. 2021, 67, 102726. [Google Scholar] [CrossRef]
  32. Mavhura, E.; Manyangadze, T.; Aryal, K.R. A composite inherent resilience index for Zimbabwe: An adaptation of the disaster resilience of place model. Int. J. Disaster Risk Reduc. 2021, 57, 102152. [Google Scholar] [CrossRef]
  33. Parsons, M.; Reeve, I.; McGregor, J.; Hastings, P.; Marshall, G.R.; McNeill, J.; Stayner, R.; Glavac, S. Disaster resilience in Australia: A geographic assessment using an index of coping and adaptive capacity. Int. J. Disaster Risk Reduc. 2021, 62, 102422. [Google Scholar] [CrossRef]
  34. Marasco, S.; Kammouh, O.; Cimellaro, G.P. Disaster resilience quantifcation of communities: A risk-based approach. Int. J. Disaster Risk Reduc. 2022, 70, 102778. [Google Scholar] [CrossRef]
  35. Iqbal Khan, M.T.; Anwar, S.; Sarkodie, S.A.; Yaseen, M.R.; Nadeem, A.M.; Ali, Q. Comprehensive disaster resilience index: Pathway towards risk-informed sustainable development. J. Clean. Prod. 2022, 366, 132937. [Google Scholar] [CrossRef]
  36. Global Resilience Index Initiative. UK Centre for Greening Finance and Investment, Smith School of Enterprise and the Environment, University of Oxford. 2021. Available online: https://www.cgfi.ac.uk/global-resilience-index-initiative/ (accessed on 21 July 2022).
  37. Brunetta, G.; Caldarice, O. Spatial Resilience in Planning: Meanings, Challenges, and Perspectives for Urban Transition. In Sustainable Cities and Communities; Filho, W.L., Azul, A.M., Brandli, L., Özuyar, P.G., Wall, T., Eds.; Springer: Cham, Switzerland, 2020; pp. 628–640. [Google Scholar]
  38. Nystrom, M.; Folke, C. Spatial resilience of coral reefs. Ecosystems 2001, 4, 406–417. [Google Scholar] [CrossRef]
  39. Cumming, G.S. Spatial Resilience in Social-Ecological Systems; Springer: London, UK, 2011. [Google Scholar]
  40. Cumming, G.S. Spatial resilience: Integrating landscape ecology, resilience, and sustainability. Landsc. Ecol. 2011, 26, 899–909. [Google Scholar] [CrossRef]
  41. Contreras, D.; Blaschke, T.; Hodgson, M.E. Lack of spatial resilience in a recovery process: Case L’Aquila, Italy. Technol. Forecast. Soc. Chang. 2017, 121, 76–88. [Google Scholar] [CrossRef]
  42. Shafiei Dastjerdi, M.; Lak, A.; Ghaffari, A.; Sharifi, A. A conceptual framework for resilient place assessment based on spatial resilience approach: An integrative review. Urban Clim. 2021, 36, 100794. [Google Scholar] [CrossRef]
  43. Brunetta, G.; Salata, S. Mapping Urban Resilience for Spatial Planning—A First Attempt to Measure the Vulnerability of the System. Sustainability 2019, 11, 2331. [Google Scholar] [CrossRef] [Green Version]
  44. Bănică, A.; Kourtit, K.; Nijkamp, P. Natural disasters as a development opportunity: A spatial economic resilience interpretation. Rev. Reg. Stud. 2020, 40, 223–249. [Google Scholar] [CrossRef]
  45. Brunetta, G.; Ceravolo, R.; Barbieri, C.A.; Borghini, A.; de Carlo, F.; Mela, A.; Beltramo, S.; Longhi, A.; De Lucia, G.; Ferraris, S.; et al. Territorial resilience: Toward a proactive meaning for spatial planning. Sustainability 2019, 11, 2286. [Google Scholar] [CrossRef] [Green Version]
  46. Pascariu, G.C.; Banica, A.; Nijkamp, P. A Meta-Overview and Bibliometric Analysis of Resilience in Spatial Planning—The Relevance of Place-Based Approaches. In Applied Spatial Analysis and Policy; Springer: Cham, Switzerland, 2022; pp. 1–31. [Google Scholar] [CrossRef]
  47. Cutter, S.L.; Barnes, L.; Berry, M.; Burton, C.; Evans, E.; Tate, E.; Webb, J. A place-based model for understanding community resilience to natural disasters. Glob. Environ. Chang. 2008, 18, 598–606. [Google Scholar] [CrossRef]
  48. Cai, H.; Lam, N.S.; Qiang, Y.; Zou, L.; Correll, R.M.; Mihunov, V.V. A synthesis of disaster resilience measurement methods and indices. I. J. Disaster Risk Reduct. 2018, 31, 844–855. [Google Scholar] [CrossRef]
  49. Sachs, J.; Schmidt-Traub, G.; Kroll, C.; Lafortune, G.; Fuller, G. SDG Index and Dashboards Report 2018: Global Responsibilities Implementing the Goals; Sustainable Development Solutions Network (SDSN): Paris, France, 2018. [Google Scholar]
  50. Hsu, C.C.; Sandford, B.A. The Delphi Technique: Making Sense of Consensus. Pract. Assess. Res. Eval. 2007, 12, 1–8. [Google Scholar]
  51. Handbook on Constructing Composite Indicators: Methodology and User Guide; Joint Research Centre, European Commission: Brussels, Belgium; Organisation for Economic Co-Operation and Development Publishing: Paris, France, 2008.
  52. Kassambara, A. Practical Guide to Cluster Analysis in R: Unsupervised Machine Learning. Statistical Tools for High-Throughput Data Analysis. STHDA (Statistical Tools for High-Throughput Data Analysis). 2017. Available online: http://www.sthda.com/english/ (accessed on 21 July 2022).
  53. Gan, G.; Ma, C.; Wu, J. Data Clustering: Theory, Algorithms, and Applications; Society for Industrial and Applied Mathematics: Ottawa, ON, Canada, 2007; Volume 20. [Google Scholar]
  54. Saja, A.A.; Goonetilleke, A.; Teo, M.; Ziyath, A.M. A critical review of social resilience assessment frameworks in disaster management. Int. J. Disaster Risk Reduct. 2019, 35, 101096. [Google Scholar] [CrossRef]
  55. Yokohama Strategy and Plan of Action for A Safer World: Guidelines for Natural Disaster Prevention, Preparedness and Mitigation. International Decade for Natural Disaster Reduction 1990–2000. 1994. Available online: http://www.unisdr.org/files/8241_doc6841contenido1.pdf (accessed on 6 January 2022).
  56. Hyogo Framework for Action 2005–2015: Building the Resilience of Nations and Communities to Disasters. Geneva: United Nations International Strategy for Disaster Reduction. 2005. Available online: https://www.undrr.org/publication/hyogo-framework-action-2005-2015-building-resilience-nations-and-communities-disasters (accessed on 6 January 2022).
  57. Hoogeveen, J.; Tesliuc, E.; Vakis, V.; Dercon, S. A Guide to the Analysis of Risk, Vulnerability and Vulnerable Groups; Social Protection Unit, Human Development Network, The World Bank: Washington, DC, USA, 2009. [Google Scholar]
  58. Tapsell, S.M.; Tunstall, S.M.; Green, C.; Fernandez-Bilbao, A. Social Indicator Set; FLOODsite Report T11–07-01; Flood Hazard Research Centre: Enfield, UK, 2005. [Google Scholar]
  59. Birkmann, J.; Bach, C.; Vollmer, M. Tools for resilience building and adaptive spatial governance. Raumforsch. Raumordn. 2012, 70, 293–308. [Google Scholar] [CrossRef]
  60. Gaillard, J.C. Vulnerability, capacity and resilience: Perspectives for climate and development policy. J. Int. Dev. 2010, 22, 218–232. [Google Scholar] [CrossRef]
  61. Hinkel, J. Indicators of vulnerability and adaptive capacity: Towards a clarification of science-policy interface. Glob. Environ. Chang. 2011, 21, 198–208. [Google Scholar] [CrossRef]
  62. Wenger, C. The oak or the reed: How resilience theories are translated into disaster management policies. Ecol. Soc. 2017, 22, 1–18. [Google Scholar] [CrossRef] [Green Version]
  63. Tiernan, A.; Drennan, L.; Nalau, J.; Onyango, E.; Morrissey, L.; Mackey, B. A review of themes in disaster resilience literature and international practice since 2012. Policy Des. Pract. 2019, 2, 53–74. [Google Scholar] [CrossRef] [Green Version]
  64. Hernantes, J.; Maraña, P.; Gimenez, R.; Sarriegi, J.M.; Labaka, L. Towards resilient cities: A maturity model for operationalizing resilience. Cities 2019, 84, 96–103. [Google Scholar] [CrossRef]
  65. Cutter, S.L.; Burton, C.G.; Emrich, C.T. Disaster resilience indicators for benchmarking baseline conditions. J. Homel. Secur. Emerg. Manag. 2010, 7, 51. [Google Scholar] [CrossRef]
  66. Cimellaro, G.P.; Reinhorn, A.M.; Bruneau, M. Framework for analytical quantification of disaster resilience. Eng. Struct. 2010, 32, 3639–3649. [Google Scholar] [CrossRef]
  67. Parsons, M.; Glavac, S.; Hastings, P.; Marshall, G.; McGregor, J.; McNeill, J.; Morley, P.; Reeve, I.; Stayner, R. Top-down assessment of disaster resilience: A conceptual framework using coping and adaptive capacities. Int. J. Disaster Risk Reduct. 2016, 19, 1–11. [Google Scholar] [CrossRef] [Green Version]
  68. De Silva, S.; Burton, C. Building Resilient Communities: Risk Management and Response to Natural Disasters through Social Funds and Community-Driven Development Operations (English); The World Bank: Washington, DC, USA, 2008. [Google Scholar]
  69. City Resilience Framework; Rockefeller Foundation; Arup International Development: London, UK, 2014.
  70. Moraci, F.; Errigo, M.F.; Fazia, C.; Burgio, G.; Foresta, S. Making less vulnerable cities: Resilience as a new paradigm of smart planning. Sustainability 2018, 10, 755. [Google Scholar] [CrossRef] [Green Version]
  71. Pfefferbaum, R.L.; Pfefferbaum, B.; Van Horn, R.L.; Klomp, R.W.; Norris, F.H.; Reissman, D.B. The Communities Advancing Resilience Toolkit (CART): An Intervention to Build Community Resilience to Disasters. J. Public Health Manag. Pract. 2013, 19, 250–258. [Google Scholar] [CrossRef]
  72. Raymond, N.; Al Achkar, Z. Data Preparedness: Connecting Data, and Humanitarian Response. In Signal Program Standards and Ethics Series—Issue 1; Harvard University: Cambridge, MA, USA, 2016. [Google Scholar]
  73. Li, T.; Xie, N.; Zeng, C.; Zhou, W.; Zheng, L.; Jiang, Y.; Yang, Y.; Ha, H.Y.; Xue, W.; Huang, Y.; et al. Data-Driven Techniques in Disaster Information Management. ACM Comput. Surv. 2017, 50, 1–45. [Google Scholar] [CrossRef]
  74. Sendai Framework for Disaster Risk Reduction 2015–2030; United Nations Office for Disaster Risk Reduction: Geneva, Switzerland, 2015.
  75. Transforming Our World: The 2030 Agenda for Sustainable Development; Resolution A/RES/70/1; United Nations General Assembly: New York, NY, USA, 2015.
  76. Bours, D.; McGinn, C.; Pringle, P. Monitoring & Evaluation for Climate Change Adaptation: A Synthesis of Tools, Frameworks and Approaches; SEA Change CoP: Phnom Penh, Cambodia; UKCIP: Oxford, UK, 2013. [Google Scholar]
  77. Clarke, M.L.; Blanchard, M.K.; Maini, R.; Radu, A.; Eltinay, N.; Zaidi, Z.; Murray, V. Knowing what we know–reflections on the development of technical guidance for loss data for the Sendai framework for disaster risk reduction. PLoS Curr. 2018, 10. [Google Scholar] [CrossRef]
  78. Berrang-Ford, L.; Biesbroek, R.; Ford, J.D.; Lesnikowski, A.; Tanabe, A.; Wang, F.M.; Chen, C.; Hsu, A.; Hellmann, J.J.; Pringle, P.; et al. Tracking global climate change adaptation among governments. Nat. Clim. Chang. 2019, 9, 440–449. [Google Scholar] [CrossRef]
  79. Izzo, M.F.; Ciaburri, M.; Tiscini, R. The challenge of sustainable development goal reporting: The first evidence from Italian listed companies. Sustainability 2020, 12, 3494. [Google Scholar] [CrossRef] [Green Version]
  80. Wu, B.; Tian, F.; Zhang, M.; Zeng, H.; Zeng, Y. Cloud services with big data provide a solution for monitoring and tracking sustainable development goals. Geogr. Sustain. 2020, 1, 25–32. [Google Scholar] [CrossRef]
  81. Dalkey, N.; Helmer, O. An experimental application of the Delphi method to the use of experts. Manag. Sci. 1963, 9, 458–467. [Google Scholar] [CrossRef]
  82. Landeta, J. Current validity of the Delphi method in social sciences. Technol. Forecast. Soc. Chang. 2006, 73, 467–482. [Google Scholar]
  83. Jordan, E.; Javernick-Will, A. Indicators of community recovery: Content analysis and Delphi approach. Nat. Hazards Rev. 2013, 14, 21–28. [Google Scholar] [CrossRef]
  84. Pei, J.; Liu, W.; Han, L. Research on Evaluation Index System of Chinese City Safety Resilience Based on Delphi Method and Cloud Model. Int. J. Environ. Res. Public Health 2019, 16, 3802. [Google Scholar] [CrossRef] [Green Version]
  85. Alshehri, S.A.; Rezgui, Y.; Li, H. Delphi-based consensus study into a framework of community resilience to disaster. Nat. Hazards 2015, 75, 2221–2245. [Google Scholar] [CrossRef]
  86. Delbecq, A.; Van de Ven, A.H.; Gustafson, D.H. Group Techniques for Program Planning: A Guide to Nominal Group and Delphi Processes; Scott Foresman: Glenview, IL, USA, 1975. [Google Scholar]
  87. Murphy, M.K.; Black, N.A.; Lamping, D.L.; McKee, C.M.; Sanderson, C.F.; Askham, J.; Marteau, T. Consensus development methods, and their use in clinical guideline development. Health Technol. Assess. 1998, 2, 1–88. [Google Scholar] [CrossRef] [Green Version]
  88. Ludwig, B. Predicting the future: Have you considered using the Delphi methodology? J. Ext. 1997, 35, 1–4. [Google Scholar]
  89. Dalkey, N. An Experimental Study of Group Opinion: The Delphi Method. Futures 1969, 1, 408–426. [Google Scholar] [CrossRef]
  90. Cyphert, F.; Grant, W. The Delphi Technique: A Case Study. Phi Delta Kappan 1971, 42, 272–273. [Google Scholar]
  91. Cerè, G.; Rezgui, Y.; Zhao, W. Urban-scale framework for assessing the resilience of buildings informed by a Delphi expert consultation. Int. J. Disaster Risk Reduct. 2019, 36, 101079. [Google Scholar] [CrossRef]
  92. Von der Gracht, H.A. Consensus Measurement in Delphi Studies: Review and Implications for Future Quality Assurance. Technol. Forecast. Soc. Chang. 2012, 79, 1525–1536. [Google Scholar] [CrossRef]
  93. Rayens, M.K.; Hahn, E.J. Building Consensus Using the Policy Delphi Method. Policy Politics Nurs. Pract. 2000, 1, 308–315. [Google Scholar] [CrossRef]
  94. McKenna, H.P. The Delphi Technique: A Worthwhile Research Approach for Nursing? J. Adv. Nurs. 1994, 19, 1221–1225. [Google Scholar] [CrossRef]
  95. Williams, P.L.; Webb, C. The Delphi Technique: A Methodological Discussion. J. Adv. Nurs. 1994, 19, 180–186. [Google Scholar] [CrossRef] [PubMed]
  96. Witkin, B.R.; Altschuld, J.W. Planning and Conducting Needs Assessment: A Practical Guide; Sage Publications, Inc.: Thousand Oaks, CA, USA, 1995. [Google Scholar]
  97. Burby, R.; Deyle, R.; Godschalk, D.; Olshanky, R. Creating Hazard Resilient Communities through Land-Use Planning. Nat. Hazards Rev. 2000, 1, 99–106. [Google Scholar] [CrossRef] [Green Version]
  98. Assefa, E.; Hans-Rudolf, B. Indigenous resource management practices in the Gamo Highland of Ethiopia: Challenges and prospects for sustainable resource management. Sustain. Sci. 2017, 12, 695–709. [Google Scholar] [CrossRef]
  99. Han, J.; Ge, W.; Hei, Z.; Cong, C.; Ma, C.; Xie, M.; Liu, B.; Feng, W.; Wang, F.; Jiao, J. Agricultural land use and management weaken the soil erosion induced by extreme rainstorms. Agric. Ecosyst. Environ. 2020, 301, 107047. [Google Scholar] [CrossRef]
  100. Martine, G.; Guzman, J.M. Population, poverty, and vulnerability: Mitigating the effects of natural disasters. In ECSP Report 8; Wilson Center: Washington, DC, USA, 2002; pp. 45–68. [Google Scholar]
  101. Hallegatte, S.; Vogt-Schilb, A.; Bangalore, M.; Rozenberg, J. Unbreakable: Building the Resilience of the Poor in the Face of Natural Disasters; World Bank: Washington, DC, USA, 2017. [Google Scholar]
  102. Zobel, C.W.; MacKenzie, C.A.; Baghersad, M.; Li, Y. Establishing a frame of reference for measuring disaster resilience. Decis. Support Syst. 2021, 140, 113406. [Google Scholar] [CrossRef]
  103. De Groeve, T.; Poljansek, K.; Vernaccini, L. Index for Risk Management—INFORM; Report EUR 26528 EN; Joint Research Centre, European Commission: Brussels, Belgium, 2014. [Google Scholar]
  104. Landeta, J.; Barrutia, J.; Lertxundi, A. Hybrid Delphi: A methodology to facilitate contribution from experts in professional contexts. Technol. Forecast. Soc. Chang. 2011, 78, 1629–1641. [Google Scholar] [CrossRef]
  105. Bakkensen, L.A.; Fox-Lent, C.; Read, L.K.; Linkov, I. Validating resilience and vulnerability indices in the context of natural disasters. Risk Anal. 2017, 37, 982–1004. [Google Scholar] [CrossRef] [PubMed] [Green Version]
  106. United Nations Office for Disaster Risk Reduction. Technical Guidance for Monitoring and Reporting on Progress in Achieving the Global Targets of the Sendai Framework for Disaster Risk Reduction. 2018. Available online: https://www.preventionweb.net/publications/view/54970 (accessed on 21 July 2022).
  107. Feldmeyer, D.; Nowak, W.; Jamshed, A.; Birkmann, J. An open resilience index: Crowdsourced indicators empirically developed from natural hazard and climatic event data. Sci. Total Environ. 2021, 774, 145734. [Google Scholar] [CrossRef]
Figure 1. Workflow of the proposed research.
Sustainability 14 09162 g001
Figure 2. Division of the world countries in 4 clusters.
Sustainability 14 09162 g002
Figure 3. (a) Distribution of experts that participated in the first round of the Delphi process for each cluster of countries; (b) distribution of experts by field of expertise.
Sustainability 14 09162 g003
Figure 4. (a) Distribution of experts that participated in the second round of the Delphi process for each cluster of countries; (b) level of agreement reached by the experts in the second round of the Delphi process.
Sustainability 14 09162 g004
Figure 5. Weights obtained for each resilience dimension by cluster.
Sustainability 14 09162 g005
Figure 6. Weights obtained for each Social sub-dimension by cluster.
Sustainability 14 09162 g006
Figure 7. Weights obtained for each Economic sub-dimension by cluster.
Sustainability 14 09162 g007
Figure 8. Weights obtained for each Environmental sub-dimension by cluster.
Sustainability 14 09162 g008
Figure 9. Weights obtained for each Habitat sub-dimension by cluster.
Sustainability 14 09162 g009
Figure 10. Weights obtained for each Infrastructure sub-dimension by cluster.
Sustainability 14 09162 g010
Figure 11. Weights obtained for each Institutional sub-dimension by cluster.
Sustainability 14 09162 g011
Table 1. Indicators selected from the SDG framework.
DimensionGoalIndicator (Unit)SourceYears
EconomicG1I1Proportion of population below USD 1.25 per day—poverty line (%)World Bank 12008–2018
EconomicG2I2Proportion of population below minimum level of dietary energy consumption—prevalence of undernourishment (%)Food and Agriculture Organization 22014–2016
EconomicG3I3Neonatal, infant, and under-5 mortality rate (number of deaths)World Bank 32016
SocialG4I4Percentage of girls and boys who achieve proficiency across a broad range of learning outcomes, including in literacy and in mathematics by end of lower secondary schooling cycle (based on credibly established national benchmarks) (%)UNESCO 42009–2017
SocialG5I5Percentage of seats held by women in national parliament and/or subnational elected office according to their respective share of the population (%)Inter-Parliamentary Union 52017
EconomicG6I6Level of water stress: freshwater withdrawal as a proportion of available freshwater resource (%)United Nations Statistics Division 62014
EconomicG7I7Proportion of population with access to electricity (%)United Nations Statistics Division 62014
EconomicG8I8Growth rate of GDP per person employed (annual % per capita)United Nations Statistics Division—Analysis of Main Aggregates 72015
EconomicG9I9Employment in industry (% of total employment)International Labour Organization 82000–2016
SocialG10I10Gini Index (0 to 100)World Bank 92012–2015
EnvironmentalG11I11Mean urban air pollution of particulate matter (PM10 and PM2.5) (mcg/m3)United Nations Statistics Division 62014
EnvironmentalG11
(replaces G14)
I12Losses from natural disasters, by climate and non-climate-related events (number of lives lost)EM-DAT: the international disaster database 102008–2018
EnvironmentalG12I13Material footprint per capita (ton per capita)United Nations Environment Programme 112010
EnvironmentalG13I14CO2 emissions per capita (ton per capita)World Bank 122014
EnvironmentalG15I15Red List Index (0 to 1)United Nations Statistics Division 62017
SocialG16I16Number of victims of intentional homicide (number per 100,000)United Nations Statistics Division 62012–2015
SocialG16 (replaces G17)I17Perception of public sector corruption—Corruption Perception Index (0 to 100)Transparency International 132017
Table 2. Final structure of the proposed DRI.
DimensionSub-Dimension
Social (5)Social fabric
Awareness and preparedness
Social capital
Social capacity
Social support
Economic (5)Economic level
Wealth distribution
Pre-disaster financial services
Post-disaster financial services
Resources
Environmental (2)Natural resources
Land use
Habitat (3)Type of settlement
Homes
Regulations and planning
Infrastructure (5)Health
WaSH (Water, Sanitation, and Hygiene), electricity, waste treatment
Telecommunications
Transportation
Local services
Institutional (3)Trust in government
Disaster preparedness and mitigation
Disaster response and recovery
Table 3. Average scores (SC) and normalized weights (W) of the resilience dimensions by cluster.
SocialEconomicEnvironm.HabitatInfrastruct.Institutional
SCWSCWSCWSCWSCWSCW
Cluster 18.227.4%8.227.4%7.24.4%7.613.6%7.49.0%7.818.2%
Cluster 28.523.7%8.320.8%7.610.4%7.69.8%7.813.3%8.422.0%
Cluster 38.213.6%8.618.8%8.213.9%8.517.0%8.516.7%8.820.1%
Cluster 48.920.5%8.313.7%8.111.8%8.616.8%8.818.6%8.818.6%
Table 4. Ranking of the dimensions based on their relative importance for each cluster.
Cluster 1Cluster 2Cluster 3Cluster 4Global
Social11611
Economic13252
Environmental65566
Habitat46345
Infrastructure54424
Institutional32123
Publisher’s Note: MDPI stays neutral with regard to jurisdictional claims in published maps and institutional affiliations.

