Article

Electrical Energy Dilemma and CO2 Emission in Pakistan: Decomposing the Positive and Negative Shocks by Using an Asymmetric Technique

by
Abdul Rehman
1,*,
Laura Mariana Cismas
2 and
Maria Daniela Otil
2,*
1
College of Economics and Management, Henan Agricultural University, Zhengzhou 450002, China
2
Faculty of Economics and Business Administration, West University of Timisoara, 300006 Timisoara, Romania
*
Authors to whom correspondence should be addressed.
Sustainability 2022, 14(14), 8957; https://doi.org/10.3390/su14148957
Submission received: 28 May 2022 / Revised: 7 July 2022 / Accepted: 20 July 2022 / Published: 21 July 2022
(This article belongs to the Special Issue Energy and Environment: Policy, Economics and Modeling)

Abstract

:
The key aim of the current analysis was to examine the impact of electricity production from various sources (oil, nuclear, natural gas and coal) on CO2 emission in Pakistan by utilizing the annual data series varies from 1975–2020. The study employed the two unit root tests for the purpose of stationarity, while an asymmetric Nonlinear Autoregressive Distributed Lag (NARDL) technique was applied to expose the influence of electrical energy on CO2 emission via long-run and short-run dynamics. Findings show that via long-run and short-run the variable electricity production from oil and coal sources has a positive impact on CO2 emission in Pakistan via positive and negative shocks. Electricity production from nuclear sources exposed the adverse impact on CO2 emissions. Similarly, electricity production from natural gas demonstrates the positive and adversative linkage with CO2 emission through positive and negative shocks. There is no doubt that Pakistan is still dealing with an electricity deficit because of poor energy generation in the country, but this has contributed to an increase in CO2 emissions. To avoid additional environmental damage, the government should pursue new and major CO2 emission reduction measures.

1. Introduction

There is no global economy or economic development without the energy industry. The utilization of electricity as a valuable source of energy may benefit every area of the economy. Due to the country’s erroneous energy policy over the previous decades, Pakistan’s economic progress has been impeded by a lack of power. The eastern region of the country sometimes experiences energy problems that have a direct influence on the national power system [1]. Pakistan’s reliance on imported energy is partly owing to a lack of investment in indigenous resources such as hydropower, natural gas, and coal. Biomass is the world’s primary energy source. Due to environmental concerns, the government has decided to prevent the construction of new coal-fired power stations. The privatization of state oil and gas enterprises is being considered due to a range of reasons. Because of the massive increase in demand, both state-run and privately owned power plants are constantly generating electricity. However, growing energy prices have made fiscal sustainability a challenge. The country’s fuel mix switched two decades ago, relying more on imported furnace oil than hydropower to generate electricity, and resulting in a major energy shortage. The current energy problem began to arise in late 2007, and because of persistent power shortages, there is too much built capacity but not enough finance to run it. The second method leads to the revolving debt problem. In Pakistan’s energy supply chain, revolving debt particularly refers to a lack of cash flow in the electricity industry as a consequence of late or non-payment of obligations by users, distribution firms, and the government [2].
The seriousness of the threat posed by man-made global warming has long been recognized, and reducing energy consumption is being used as a strategy in some countries to reduce carbon dioxide emissions. Economic development may suffer as a result of reduced energy consumption, but modern economies and civilizations rely heavily on energy. Long-term approaches to energy are required if we are to ensure reliable energy supplies and economic development. Both sustainable development and environmental protection rely on a steady supply of energy, and promoting economic well-being is a critical first step towards long-term sustainable development. Economic growth in emerging economies is frequently interrupted; developed countries need fossil fuels to meet the increasing demand for electricity to generate more goods, which is made feasible by infrastructural failures. These areas are growing increasingly polluted as a result of slow economic growth, increased emissions of dangerous gases, an overreliance on coal and oil, and poor environmental conditions. The world’s population consumes energy from both renewable and nonrenewable sources [3,4,5]. Many early theoretical ideas acknowledged that energy had a substantial influence on income levels, and according to neoclassical economic theory, energy is the principal channel through which a country’s economy flows. According to environmental theory, energy is the most significant and fundamental component affecting development. Smooth manufacturing processes are crucial to the expansion of industry and the contemporary economy, which take advantage of technological advances. Energy use and generation are critical factors in transforming economic success, not just for the primary use of the product, but also for its influence on industry. A consistent and appropriate supply of energy is seen as a critical basis for economic growth and industrial development in both developed and undeveloped economies [6,7].
Environmental degradation is a problem in developing countries such as Pakistan. It is impossible to ignore the consequences of environmental degradation if humans continue to rely on nonrenewable energy sources as compared to renewable sources [8]. Economic growth and well-being in Pakistan are directly linked to the availability of electricity, which is critical to Pakistani society. All sectors of Pakistan’s economy have been directly and indirectly impacted by a severe energy crisis, particularly in relation to the country’s shifting energy mix. The country’s economy has also been harmed by energy constraints in the past. For energy services to be delivered smoothly, significant projects with favourable political optics were included, increasing a total capacity of 12,230 MW from 2013 to 2018 to alleviate congestion and obstacles [9]. Despite the additional capacity, there is still congestion and inefficiency on the transmission and distribution sides, prohibiting the continued supply of energy services. There was a 2.5% rise in installed capacity during the July–March 2019 fiscal year compared to the same time the previous year, when it was 33,433 MW. In spite of input availability and other constrictions, generation increased from 82,011 GWh to 84,680 GWh, a 2.1% increase during the time period under discussion [10]. Energy is an essential aspect of every country’s economy and plays a major influence in economic growth; it entails ensuring energy independence, growing the economy, and maintaining social harmony. As a primary source of energy for the whole economy, electricity has enormous importance [11]. Pakistan imports nearly one third of its energy in the form of oil, coal, and liquefied natural gas from other countries, but an energy policy focused on imports is unsustainable for Pakistan, which lacks long-term energy security. Renewable energy resources in Pakistan include wind, solar, hydropower, and biomass. These resources have the potential to significantly contribute to the country’s future energy production matrix, climate change mitigation efforts, and sustainable energy development. Pakistan should also look for measures to reduce its reliance on imported oil by reusing natural gas for other purposes rather than producing energy that may be obtained from other sources, such as wind power [12,13]. Over the previous few decades, policy failures in Pakistan’s energy industry have resulted in a significant power problem and poor economic performance. Power consumption is influenced by population growth as well as other factors such as electricity cost, population relocation towards cities, and weather. However, power shortages and crises in Pakistan are caused by theft, misuse, and excess electricity in the industrial sector and households, resulting in substantial line losses, corruption, mismanagement, institutional problems, and political controversy [14]. The availability of energy is critical to the development and expansion of the economy. Despite the fact that the country’s natural energy resources are enormous, Pakistan remains completely reliant on energy imports. In addition, Pakistan is one of the growing economies with the lowest energy use. The current analysis has a unique contribution to the existing literature regarding electricity consumption and production, CO2 emissions and environmental sustainability in Pakistan. We have used the time series data for the variable electricity production from key sources (oil, nuclear, natural gas, coal) and CO2 emissions to uncover the influence by employing the asymmetric technique with the assessment of long-run and short-run analysis.

2. Literature Review

In the last four decades, politicians and scholars have increasingly focused on energy efficiency as a topic of discussion. Energy, economic, social, and environmental security concerns of all countries are affected by efficiency in energy usage. Reducing energy consumption and increasing energy efficiency have recently become worldwide priorities in the context of the green economy and sustainable development. There is still much debate in academic and politic circles regarding what causes fluctuations in energy efficiency. Determining the drivers of policy toolboxes and tracking overall performance are crucial for building policy toolkits and assessing their efficiency for regions and sectors [15,16]. Future generations are at risk because of environmental pollution, which causes global warming, water pollution, deforestation, and other significant environmental issues. As a result, environmental degradation harms society in the form of increased health care costs and a decrease in productivity. The primary causes of environmental pollution are the production and consumption of fossil fuels. As a result, as described in the scientific literature, a great group of experts have investigated the long-term relationship between energy use and pollution. Many academics believe that environmental degradation is not just a result of rising energy use, but rather a result of a variety of socioeconomic variables [17,18,19]. The environment is deteriorating because of the dynamic interaction of socioeconomic, organizational, and technological activity. Many factors can contribute to environmental change in Pakistan, including economic development, population growth, urbanization, agricultural intensification, increased energy usage, and transportation. Furthermore, gender, age, income, education, and internet exposure were projected to establish if there was a relationship between customer desire to adopt e-commerce and these factors [20,21].
Residents of emerging economies are increasingly questioning the ecological implications of fast economic expansion due to increased air pollution, climate change, and environmental degradation. As a result, governments throughout the world are working together to reduce greenhouse gas emissions from industry and human activities. For the most part, home energy usage and carbon dioxide emissions consist of both direct and indirect elements. Examples of direct CO2 emissions include things like burning food, heating a home, and transportation, whereas indirect CO2 emissions include things like the energy used to produce, transport, and sell items. CO2 emissions from industrial output are the primary source of CO2 emissions in most industrialised countries [22,23]. Climate change, global warming, deforestation, water scarcity, and pollution are all serious threats to sustainable development since they are worsened by environmental pollution, which has become a major issue in recent years. For more than 50 years, governments have been concerned about human-caused environmental risks. In this domain, a number of policy initiatives have focused on climate change mitigation. It has become a global phenomenon, which is a must for human life, to reach a more sustainable future. Global warming and its attendant catastrophic weather events have elevated climate change to the top of humanity’s priority list, bringing it to the forefront of public debate. Global economic development rates that ensure sustainable resource usage and waste are still inadequate. Increased demand for resources and energy raises basic concerns about the sustainability of such a growth path, and the environmental consequences. Academics and politicians are discussing the connection between energy, economic development, and the environment in light of these environmental concerns [24,25,26,27].
The use of fossil fuels is causing environmental harm owing to global warming and the production of greenhouse gases. Renewable energy sources have the principal aims of to reducing CO2 emissions and preserving the environment [28]. According to this concept, fossil fuels may recombine in the long term, but they are condemned to extinction in the short term. Renewable energy consumption has evolved into an energy source that may solve concerns about greenhouse gas emissions and high costs, as well as a country’s reliance on foreign energy supply and the geopolitics of fossil resources in some regions. Global warming, geopolitical tensions, and the recent nuclear catastrophe, have fuelled increased concern about energy security and the environmental impact of energy production and use. As a result, numerous governments are proposing big alternative energy programs and considerable energy-saving measures. As a consequence of this, it is critical to assess these policies’ chances of success as well as their possible impact on economic development. In this context, fuel substitution is one option for enhancing energy policy sustainability. To prevent global warming, many economies are turning to oil, gas, or renewable energy sources to replace coal, which has the greatest detrimental impact on the environment [29,30,31,32]. Long-term expansion and development are the core goals of both established and growing economies, but before we can do this we must first overcome a number of obstacles. In order to achieve sustainable development, it is essential to recognize the delicate link that exists between economic growth and environmental degradation, which is becoming more severe as a consequence of human-caused greenhouse gas emissions, particularly CO2 emission [33].
Humans rely on energy, and the Industrial Revolution would not have been possible without it. The absence of a stable, inexpensive, and conveniently accessible energy supply significantly hampers sustainable communities and the benefits they provide to the economy. Furthermore, energy is essential to a country’s long-term economic survival. Balancing environmental sustainability with economic growth has been a prominent policy problem in recent years. Policies should not affect economic growth rates in order to reduce reliance on nonrenewable energy sources, relieve poverty, and provide energy security. Energy consumption, on the other hand, is a factor in both economic growth and environmental health. Carbon dioxide emissions, energy use, and economic progress have all been linked. The amount of CO2 emissions released into the atmosphere rises as the economy grows. Since energy use and CO2 emissions go hand in hand, it is no surprise that researchers have found a relationship between these two [34,35,36,37]. Environmental degradation is becoming an increasingly serious issue that is attracting the attention of governments all over the world due to its influence on global warming and the potential for disruption of the global carbon cycle. The most important problem we confront now is global warming: extreme weather conditions, animal extinctions, and food shortages are all likely in the future as a consequence of global warming induced by greenhouse gas emissions (GHGs), notably carbon dioxide emission. The most prevalent human activity that contributes to CO2 emission is the use of fossil fuels (coal and natural gas) for energy and transportation. Climate change and global warming have the potential to have a wide range of health, physical, and ecological effects, including changes in climate, sea level rise, and water system disruption, as well as stunted plant growth due to CO2 emissions from some production activities and land use transformation [38,39,40].
Researchers, ecologists, politicians, and economists have been focusing on environmental pollution and quality challenges for the last several decades. A growing population coupled with an increasing demand for natural resources puts enormous strain on ecosystems, which leads to a slew of negative consequences for the environment. As a result of the unchecked human use of natural resources, the world’s long-term economic and social development objectives are being badly affected. Ecosystems and the economy are intertwined, and increased waste and pollution issues, as well as the exploitation of natural resources, are threatening economies. Carbon dioxide emissions at this stage of development may contribute to environmental challenges such as biodiversity loss, global warming, and climate change [41,42,43]. Climate change, environmental degradation, ecological imbalances, and climatic disturbance have been fiercely disputed issues in both developed and developing economies. The environment has been exposed to increasing waste and residue as a result of the increased use of natural resources and conventional energy sources as a result of fast industrialization and economic growth. Carbon dioxide emissions are regarded as the principal source of this damage and have a considerable impact on environmental quality. Carbon dioxide emissions cause increased air pollution, which harms human health as well as natural resources, arable land, and infrastructure [44,45,46].

3. Methods and Data

The study evaluates the influence of electricity production from various sources (oil, nuclear, natural gas, and coal) on CO2 emission in Pakistan using data from the World Bank’s World Development Indicators from 1975 to 2020. Table 1 explains all of these variables in detail, while Figure 1 shows the yearly variations in variable trends from 1975 to 2020.

Model for the Study Variables

In this study, we evaluated the direction of the following model in order to validate the link between CO2 emissions and electricity production from oil, nuclear, natural gas, and coal sources, as follows:
CO 2 e t = f ( EPO t ,   EPN t , EPG t , EPC t )
Equation (1) may be rewritten as follows:
CO 2 e t = θ 0 + θ 1 EPO t + θ 2 EPN t + θ 3 EPG t + θ 4 EPC t + ε t
In Equation (2), CO 2 e t specifies carbon dioxide emission, EPO t signifies electricity production from the oil sources, EPN t indicates electricity production from nuclear sources, EPG t signifies electricity production from natural gas, and EPC t represents the electricity production from coal sources. The model coefficients are θ 1 θ 4 , where time is calculated through t. For the purpose of discovering connections between variables, we will first define the autoregressive distributed lag (ARDL) approach created by Pesaran et al. (2001) [47] using both long-run and short-run to encounter links amid variables in the investigation. In the direction of encountering relationships for variables, the specification of an ARDL model may be characterized as follows:
Δ CO 2 e t = π 0 + k = 1 u ψ k Δ CO 2 e t k + k = 0 u ϑ k Δ EPO t k + k = 0 u λ k Δ EPN t k + k = 0 u τ k Δ EPG t k + k = 0 u γ k Δ EPC t k + ξ 1 CO 2 e t 1 + ξ 2 EPO t 1 + ξ 3 EPN t 1 + ξ 4 EPG t 1 + ξ 5 EPC t 1 + ε t
Equation (3) provides a dynamic link for the specified variable when using this technique. Furthermore, this approach provides substantial improvements in assessing some crucial parameters in a smaller sample than most standard methods, and it had a beneficial impact on the participants. In cases when particular impacts of long-term parameter combinations are predicted, as defined by Pesaran et al. (2001) [47], the F-test may be used to verify predictions over extended periods of time, according to Pesaran et al. When verifying cointegration, the long-term elasticity is computed using ξ 2 ξ 5 and then regularised using ξ 1 after the cointegration is validated. The approach of Shin et al. (2014) [48] will be used to decompose the variables as electricity production from the sources (oil, nuclear, natural gas, coal) with positive and negative shocks ( EPO + r ; EPN + r ; EPG + r ; EPC + r ) ; ( EPO r ; EPN r ; EPG r ; EPC r ) being taken into consideration. It may be shown as follows:
EPO + r = x = 1 r Δ EPO + r = x = 1 r max   ( Δ EPO + r ,   0 )
EPO r = x = 1 r Δ EPO r = x = 1 r min   ( Δ EPO r ,   0 )
EPN + r = x = 1 r Δ EPN + r = x = 1 r max   ( Δ EPN + r ,   0 )
EPN r = x = 1 r Δ EPN r = x = 1 r min   ( Δ EPN r ,   0 )
EPG + r = x = 1 r Δ EPG + r = x = 1 r max   ( Δ EPG + r ,   0 )
EPG r = x = 1 r Δ EPG r = x = 1 r min   ( Δ EPG r ,   0 )
EPC + r = x = 1 r Δ EPC + r = x = 1 r max   ( Δ EPC + r ,   0 )  
EPC r = x = 1 r Δ EPC r = x = 1 r min   ( Δ EPC r ,   0 )
Equations (4)–(11) are used to validate the positive and negative shocks of the variables, and the asymmetric technique is given as follows:
Δ CO 2 e t = ξ 0 + w = 1 G γ w Δ CO 2 e t w + w = 0 G λ w Δ EPO + t w + w = 0 G ϑ w Δ EPO t w + w = 0 G τ w Δ EPN + t w + w = 0 G ψ w Δ EPN + t w + w = 0 G φ w Δ EPG + t w + w = 0 G ω w Δ EPG t w + w = 0 G β w Δ EPC + t w + w = 0 G θ w Δ EPC t w + η 1 CO 2 e i 1 + η 2 EPO + i 1 + η 3 EPO i 1 + η 4 EPN + i 1 + η 5 EPN i 1 + η 6 EPG + i 1 + η 7 EPG i 1 + η 8 EPC + i 1 + η 9 EPC i 1 + ε t
The representation of the error correction model (ECM) in the same way, is as follows:
Δ CO 2 e t = ξ 0 + w = 1 G γ w Δ CO 2 e t w + w = 0 G λ w Δ EPO + t w + w = 0 G ϑ w Δ EPO t w + w = 0 G τ w Δ EPN + t w + w = 0 G ψ w Δ EPN t w + w = 0 G φ w Δ EPG + t w + w = 0 G ω w Δ EPG t w + w = 0 G β w Δ EPC + t w + w = 0 G θ w Δ EPC t w + η 1 CO 2 e i 1 + η 2 EPO + i 1 + η 3 EPO i 1 + η 4 EPN + i 1 + η 5 EPN i 1 + η 6 EPG + i 1 + η 7 EPG i 1 + η 8 EPC + i 1 + η 9 EPC i 1 + δ ECM t 1 + ε t
Equation (13) reflects the shocks between variables using error correction model.

4. Empirical Findings and Discussion

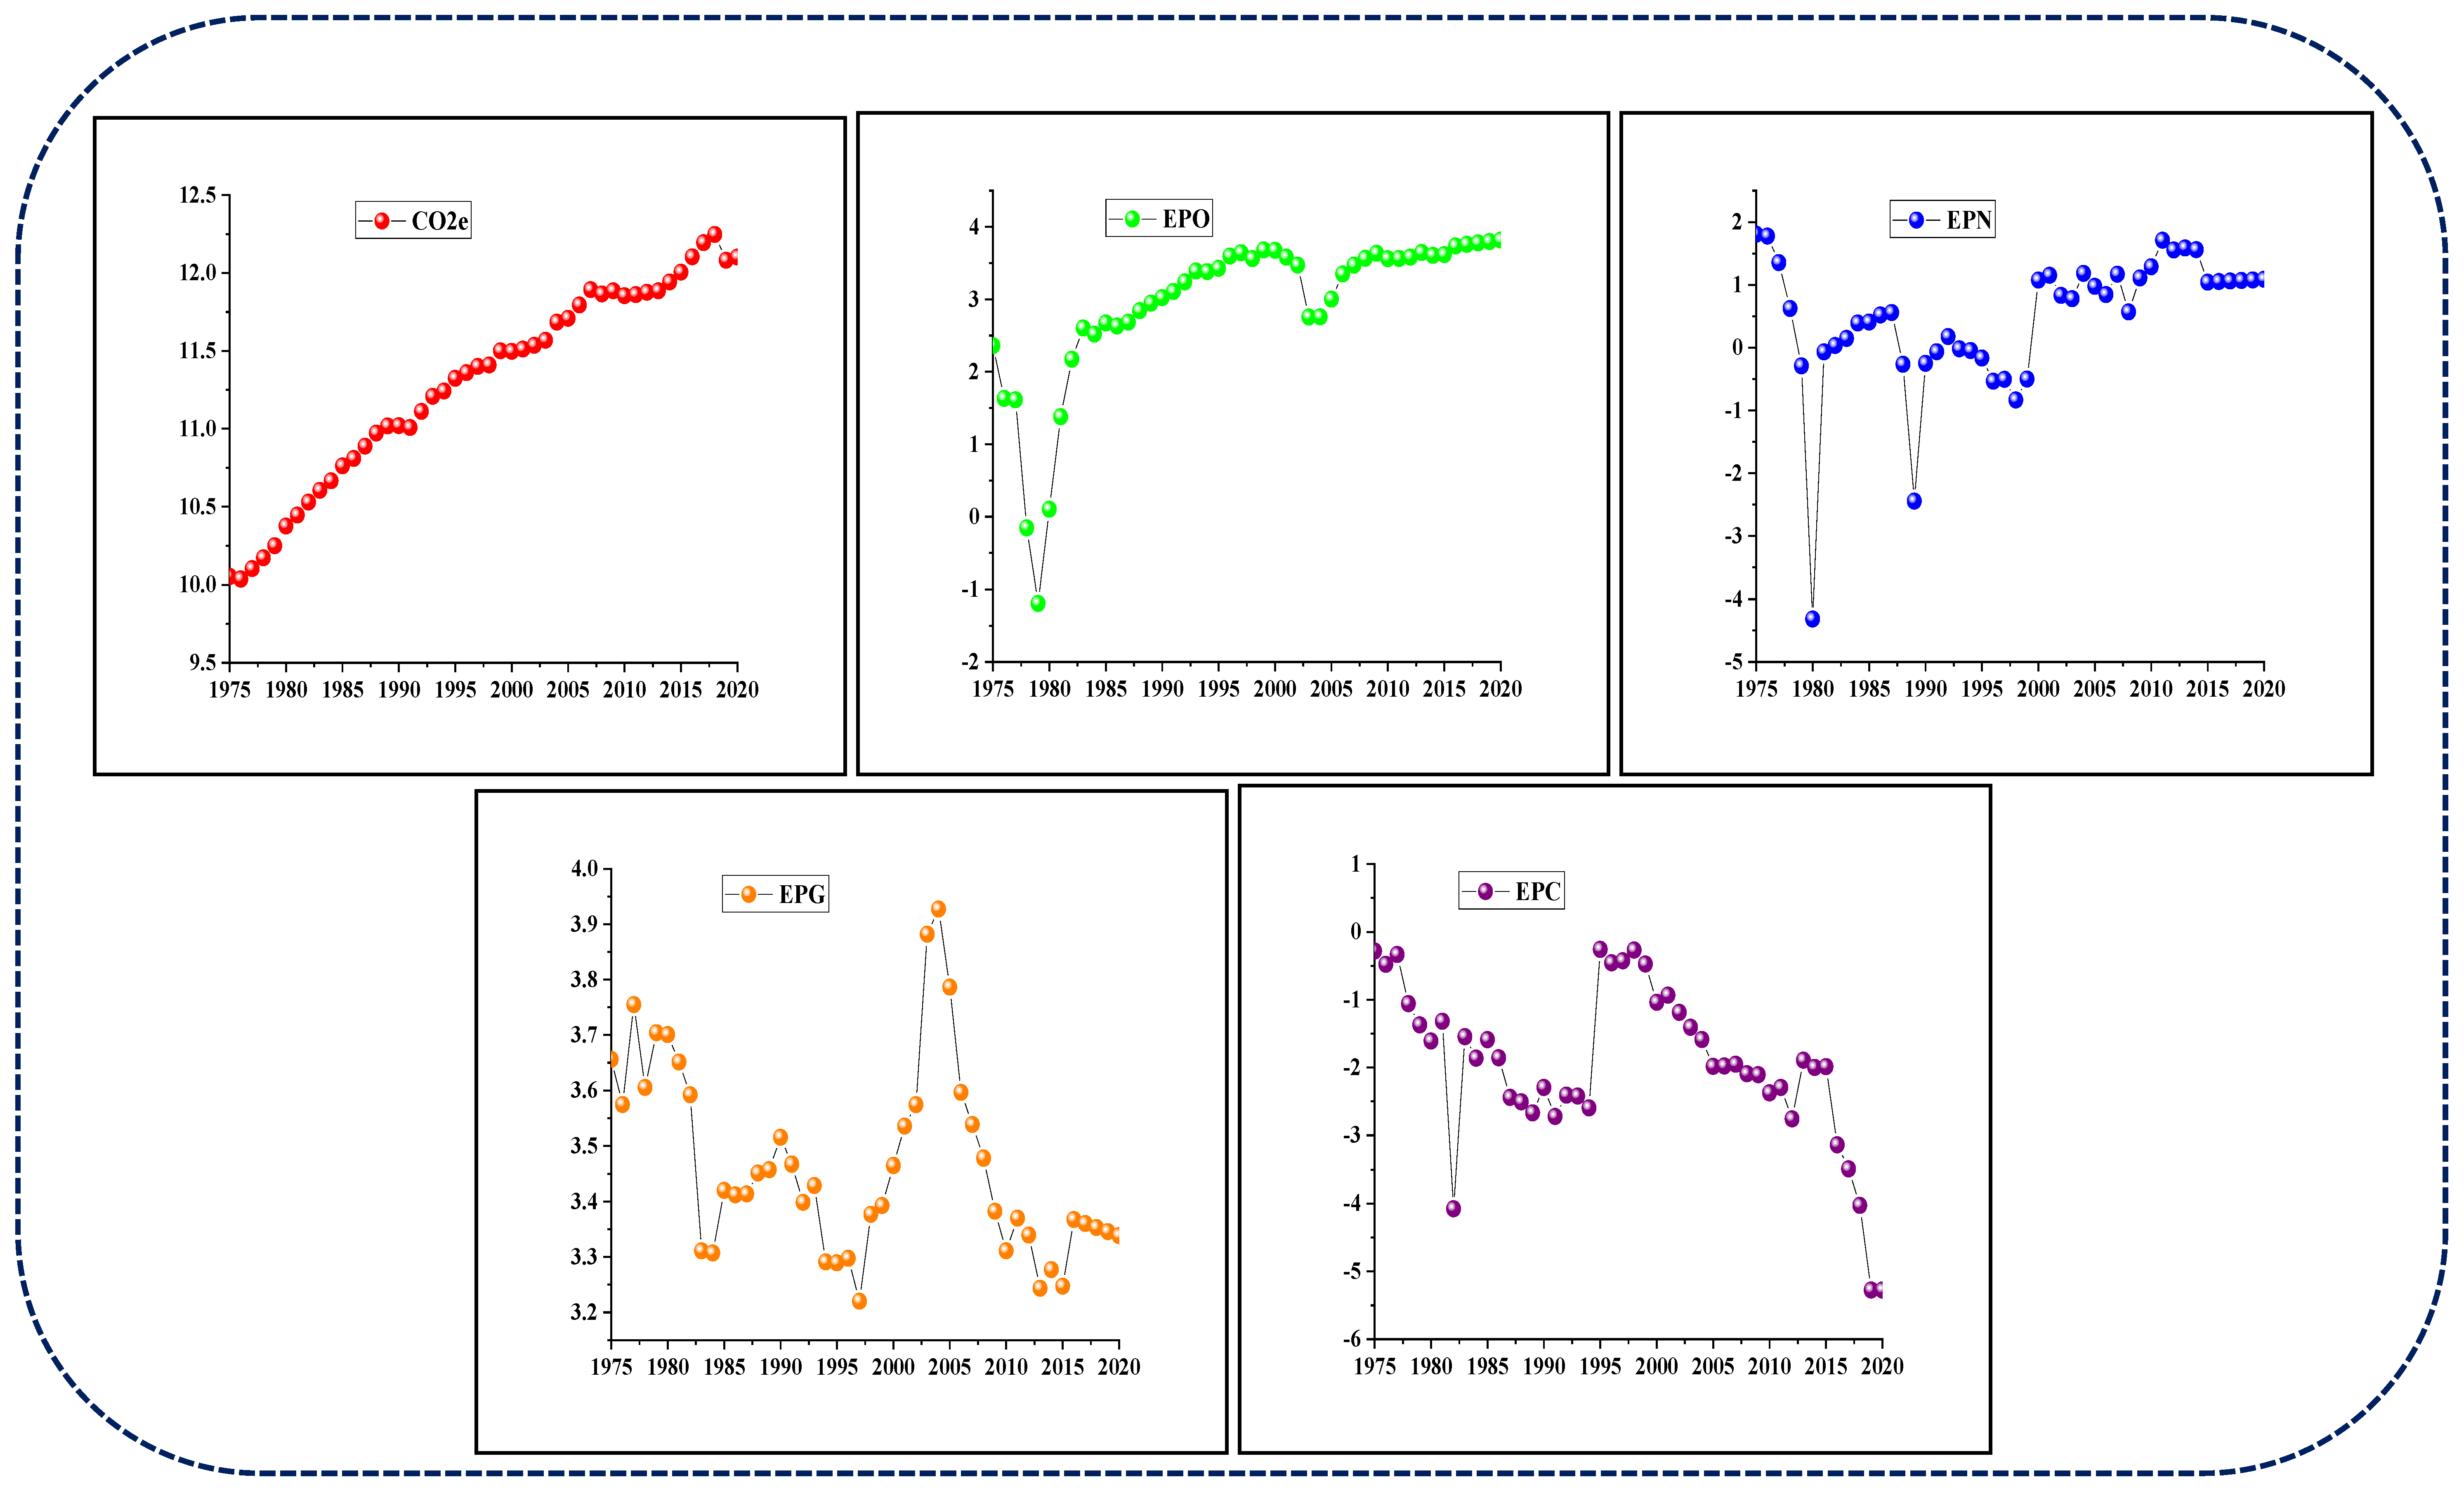
4.1. Summary and Correlation Analysis

Summary statistics and correlations are shown in Table 2 and Table 3, respectively. Furthermore, it was discovered that all the variables were equal. There is no semi-distribution problem in the series with distinct variables due to the obvious statistical importance of the Jarque–Bera statistic. It was also determined via the use of a correlation analysis that the response and explanatory components had a substantial link. Using Nonlinear Autoregressive Distributed Lag (NARDL) technique in the analysis it is possible when a model variable crosses levels or is integrated at the first difference; however, when a model variable is integrated at the second difference, this technique in the analysis is not possible.

4.2. Unit Root Testing
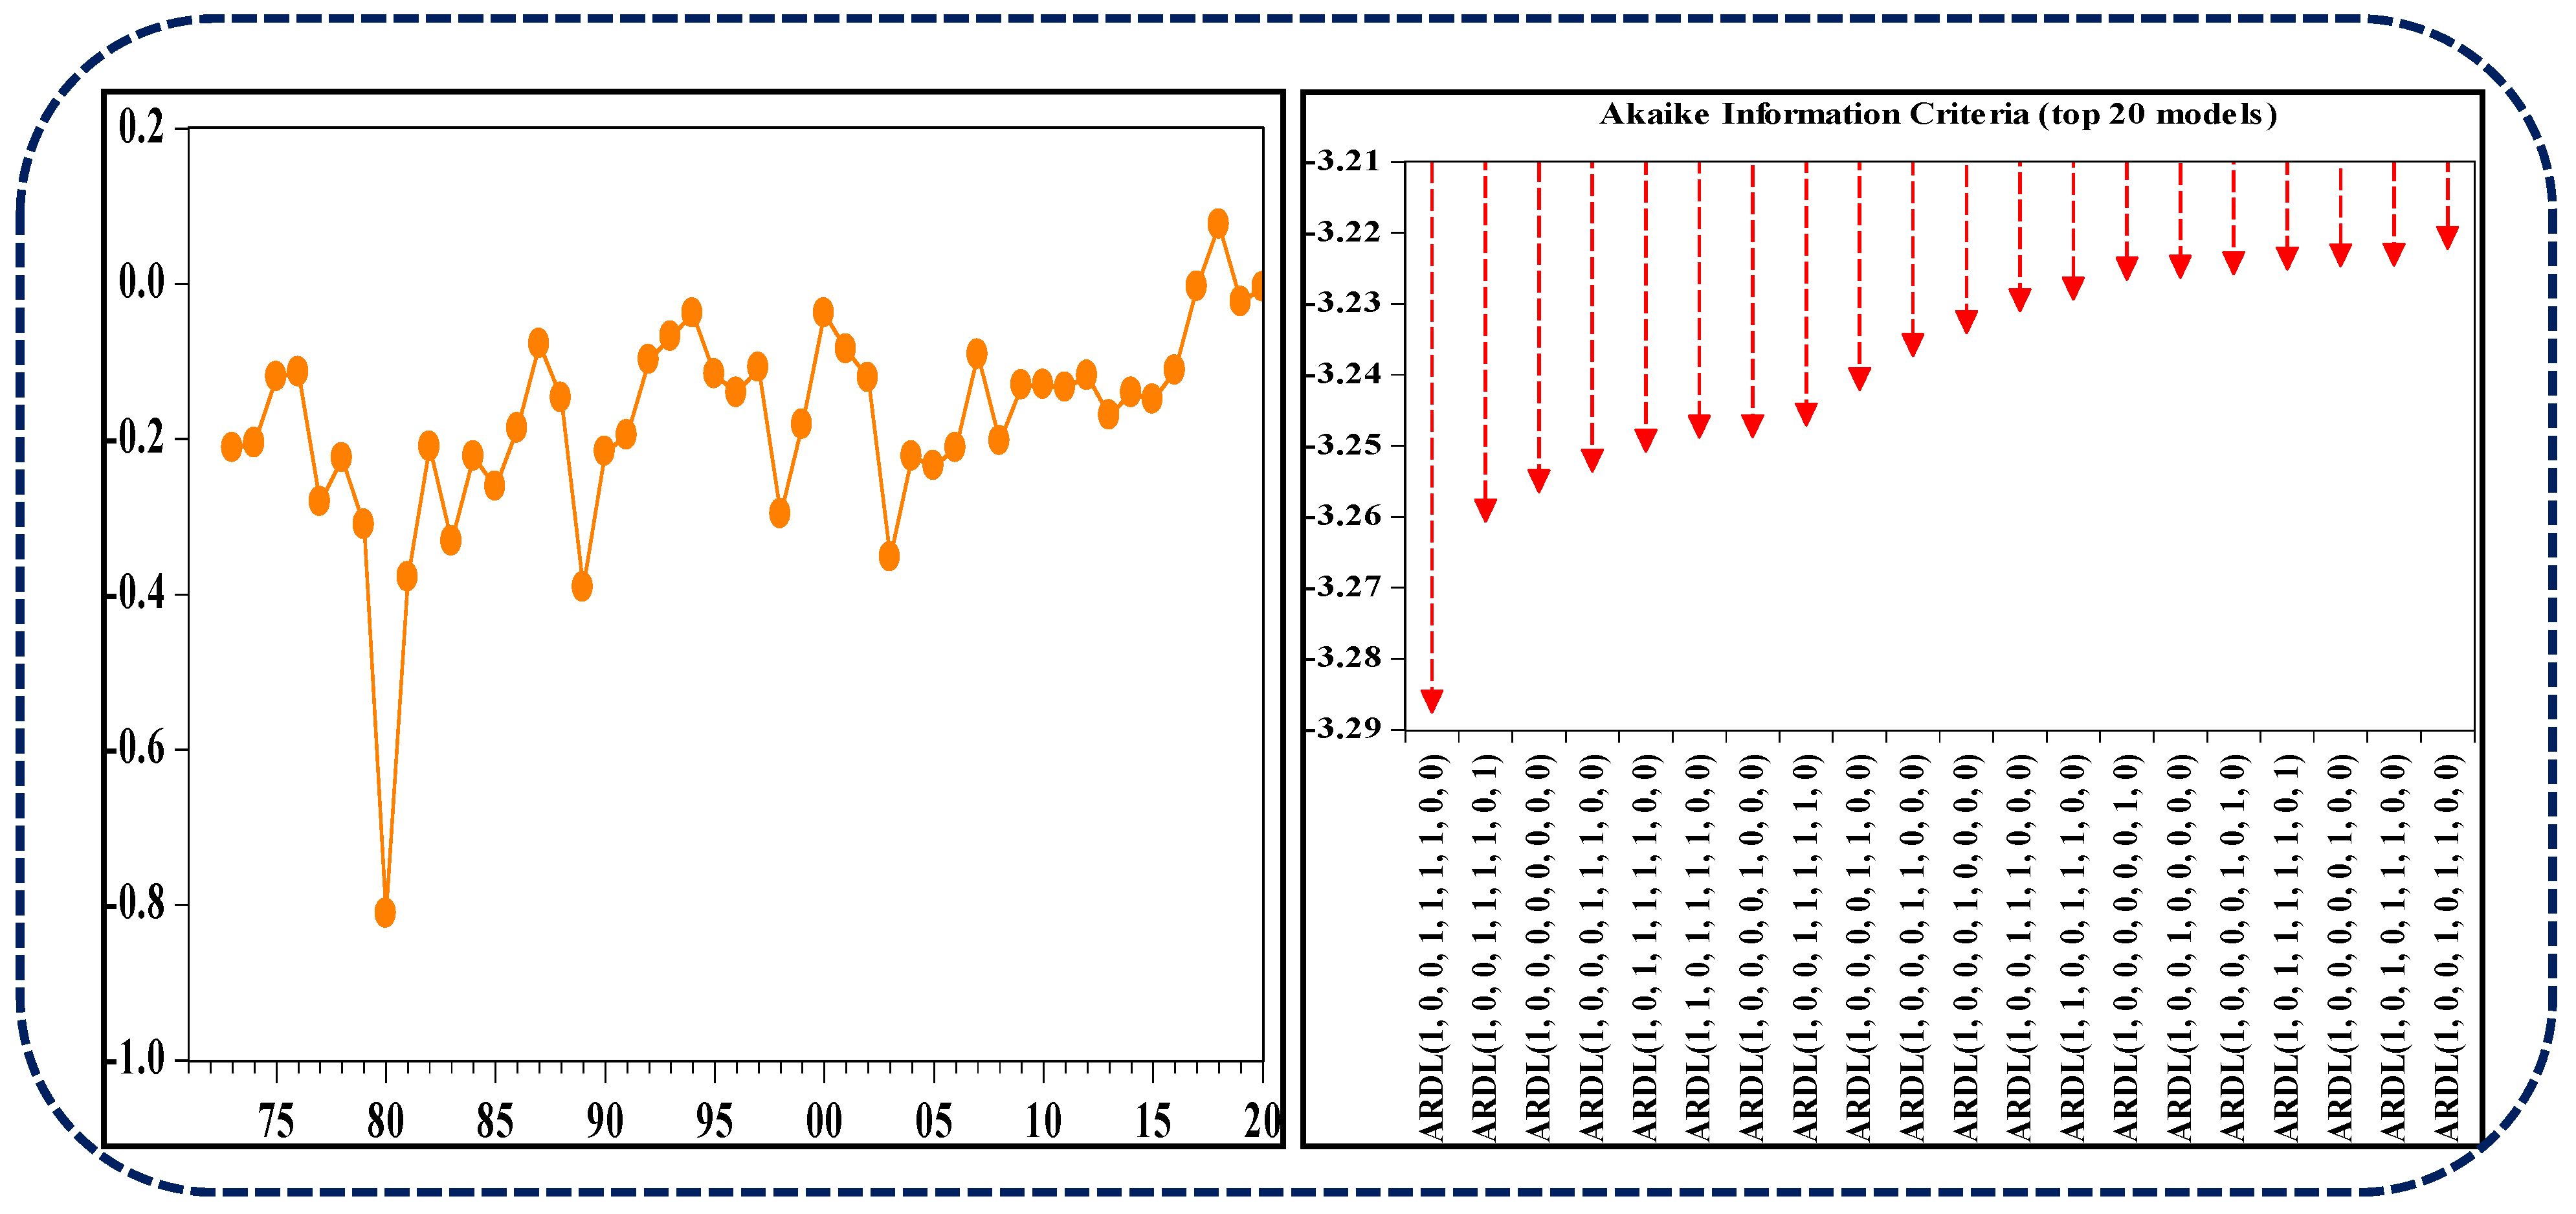
Unit root testing is used in this investigation to keep track the variables when they are in a stable stage. Two unit root techniques, Augmented Dickey Fuller (ADF) [49] and Phillips–Perron (P–P) [50], were used to study the integration order for each variable; we can see the results in Table 4. For the series under discussion, test statistics and probability values show that the trend is stationary. One step of the integral modification, which occurs at I(0) and I(1), leads the variables of the model to transition from non-stationary to stationary state. Variables must be stationary and cannot be removed sequentially according to a standard of measurement of stationarity (i.e., the null hypothesis).

4.3. Lag Selection

The lag duration should be as near to the model’s dynamic properties as practicable. Data analysis lag order is often assessed using the Akaike Information Criterion (AIC). It was determined that lag durations for variables included in the model should be determined using the Akaike Information Criterion (AIC). The findings of lag length are explored in the Table 5.

4.4. Bounds Tests for the Specification of Cointegration

The NARDL approach was utilized to investigate the relationship between dependent and independent variables. In order to complete the bounds test for the validation of cointegration, the F-statistic must be determined over an adequate amount of time according to the AIC (Akaike Information Criterion). Estimates based on the F statistic are statistically significant, as can be shown in Table 6.
For more robustness in the analysis to encounter the linkages, the study also utilized the Johansen cointegration test with test and max-Eigen value [51] presented in the Table 7.

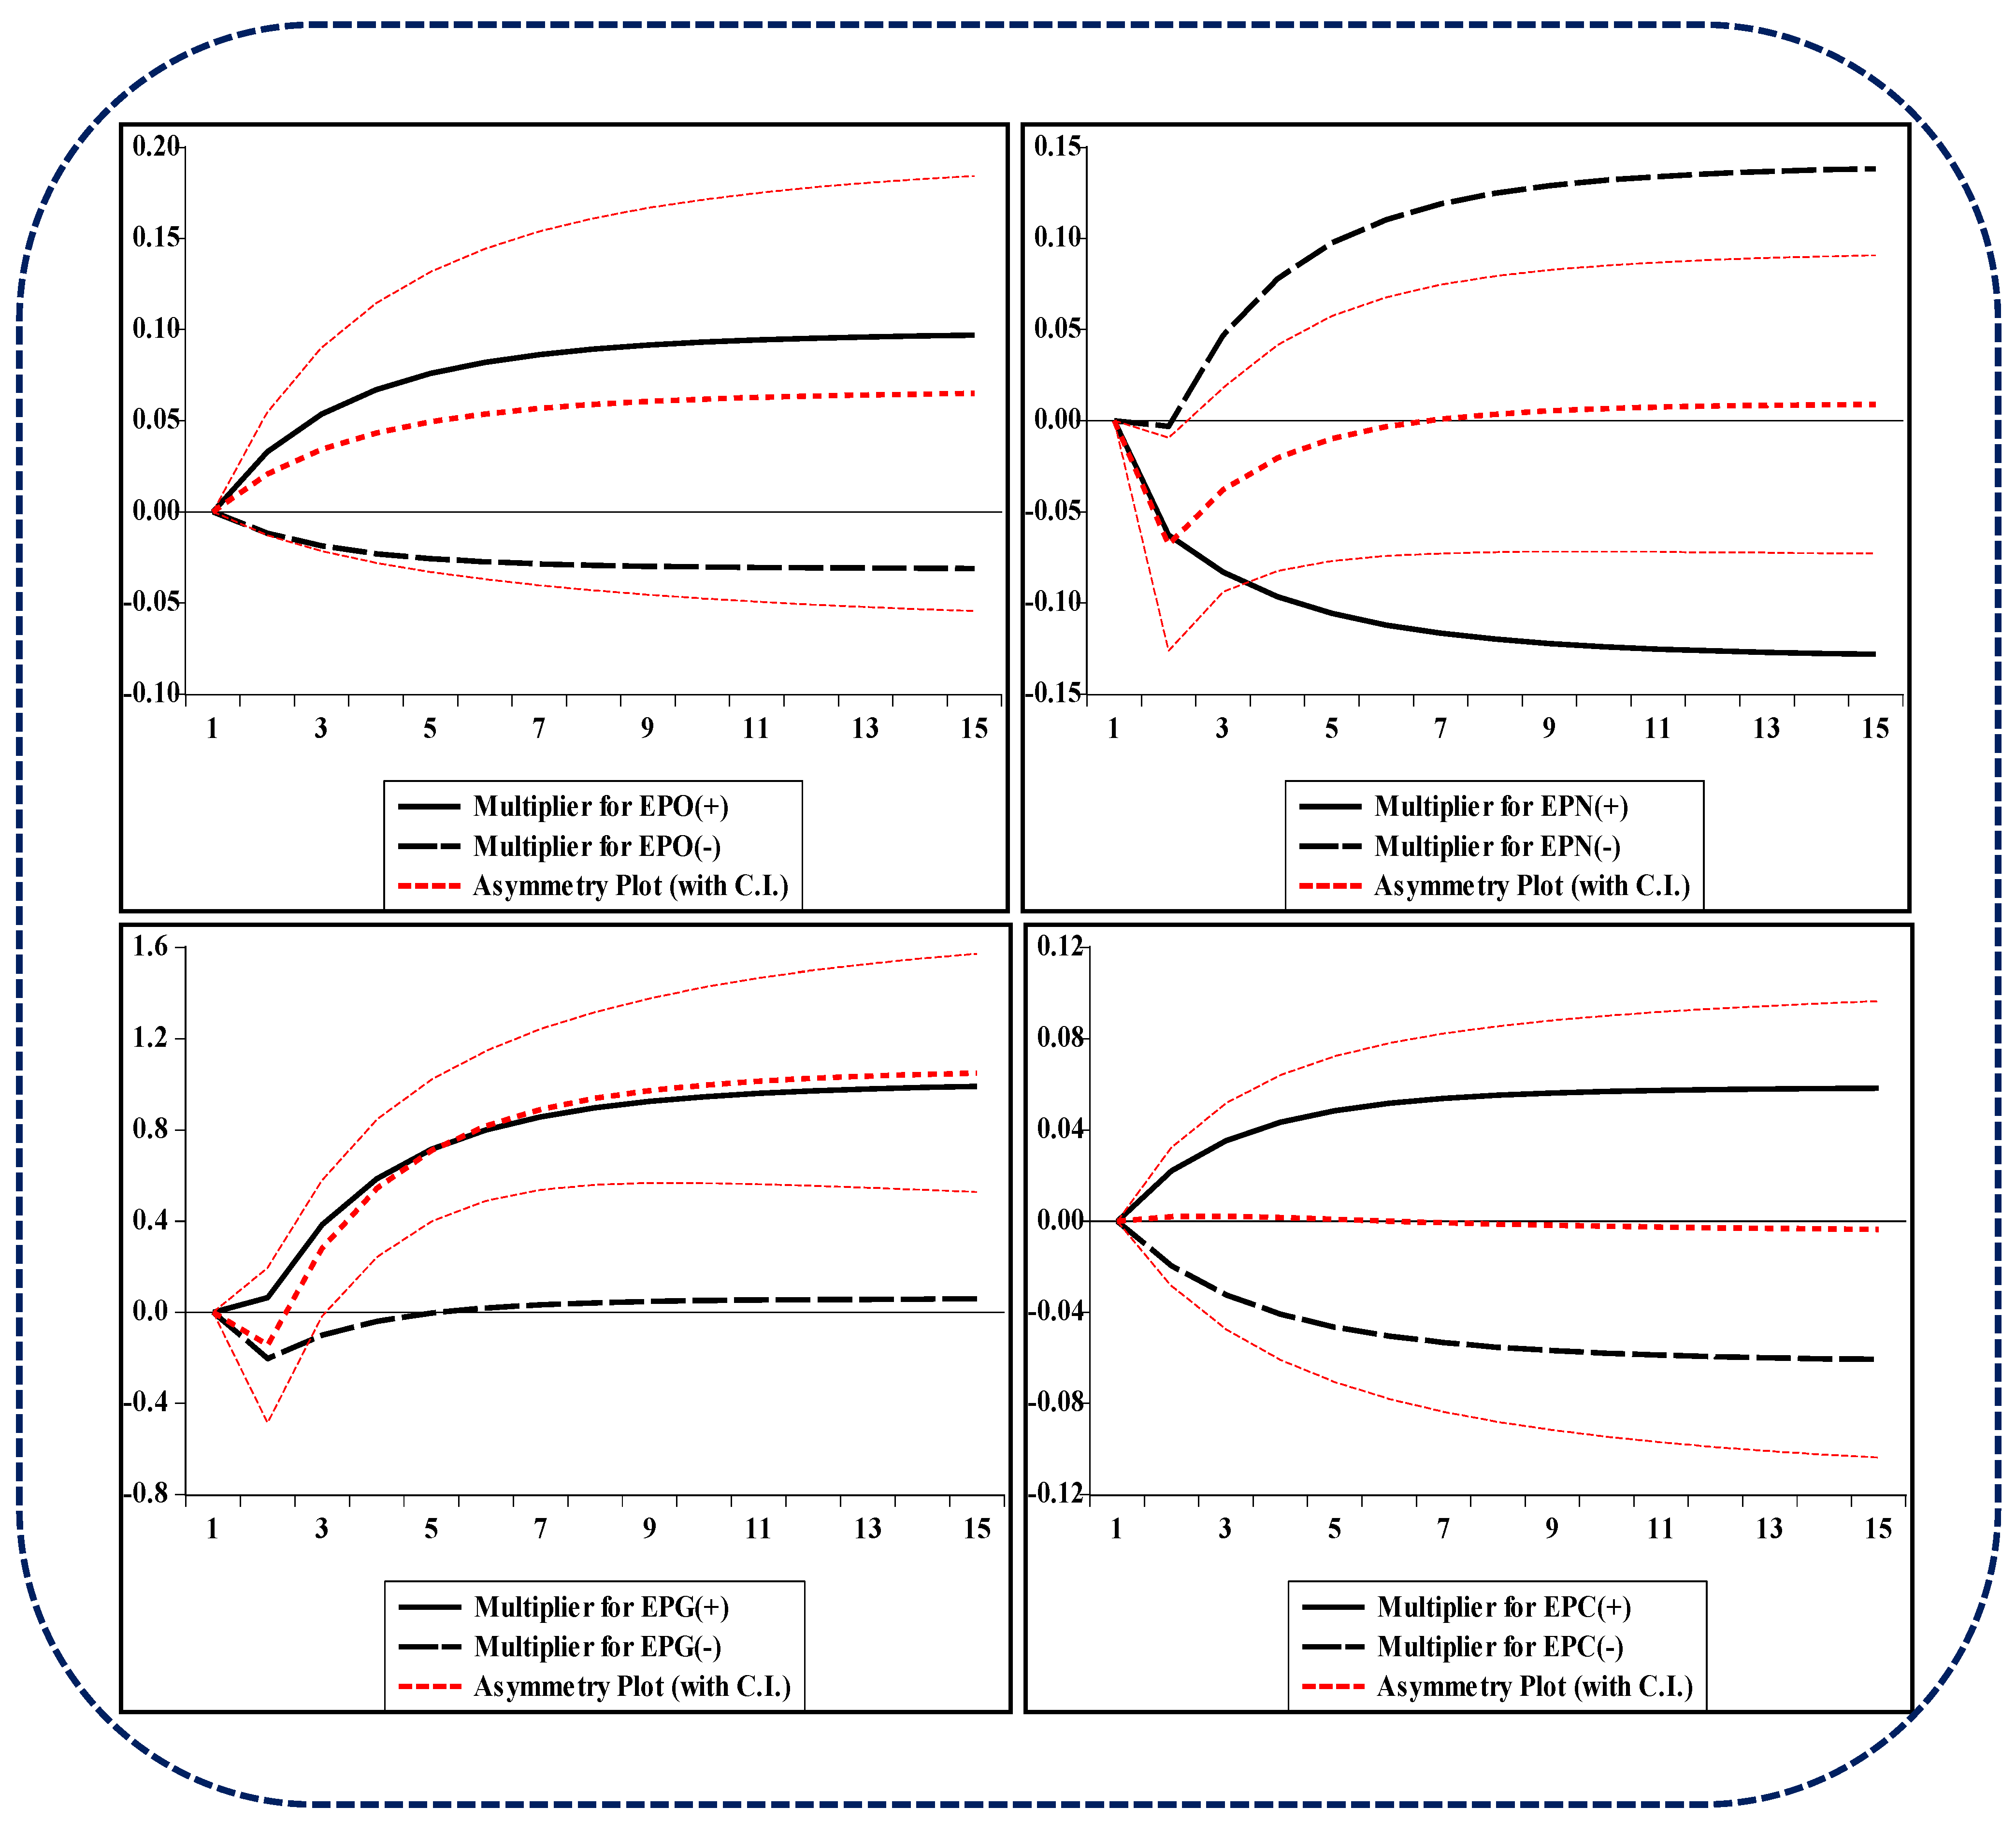
4.5. Asymmetric Technique Outcomes

The consequences of the asymmetric approach via long-run and short-run are explored in the Table 8. Short-run evidence shows that the electricity production from oil sources and electricity production from coal sources has positive coefficients (0.033), (0.011), (0.022), (0.019) with prob. values (0.142), (0.478), (0.073), (0.095) that uncover the positive impact on CO2 emission in Pakistan through positive and negative shocks. The variable electricity production from nuclear sources has negative coefficients (−0.043), (−0.048) with probability values (0.046), (0.017) demonstrating an adverse impact on the CO2 emission via positive and negative shocks. Furthermore, electricity production from natural gas sources shows the coefficients (0.349), (−0.026) with p-values (0.000), (0.651) showing a positive and negative impact on CO2 emission.
The findings of the long-run analysis demonstrate that the electricity production from both oil and coal sources has positive coefficients (0.089), (0.030), (0.060), (0.053) with prob. values (0.180), (0.460), (0.033), (0.178) that expose the positive impact on CO2 emission via positive and negative shocks. Furthermore, electricity production from nuclear sources has negative coefficients (−0.117), (−0.130) with prob. values (0.083), (0.021) exposed the adverse impact on CO2 emission in Pakistan. Similarly, electricity production from natural gas has coefficients (0.943), (−0.070) with prob. values (0.001), (0.640) that demonstrate the positive and adversative linkage with CO2 emission in Pakistan. The future sustainability of the earth is jeopardized due to an alarming increase in energy usage, because when fossil fuels are used to create electricity and heat, carbon dioxide (CO2) is released into the atmosphere. Reducing greenhouse gas emissions via energy conservation is critical for the long-term survival of the globe, and in this context conducting research that decreases or rationalizes energy usage is crucial [52]. Because of the lack of oil, there was a rippling effect on the economy. As a consequence of the recent restructuring of the energy industry, meeting the demand for power has grown increasingly challenging. In recent years, Pakistan’s reliance on imported fuels such as energy, coal, and regasified liquefied natural gas has declined. Natural gas is no longer Pakistan’s principal energy source, and the shift in the energy balance might be attributed to natural gas reserves and liquefied gas primers. There are several issues with Pakistan’s electricity industry, which is now in decline. Suppliers’ precarious financial situation and significant reliance on gas and oil have contributed little or nothing to the energy shortages. There are no substantial constraints. Pakistan’s rising reliance on thermal energy production has a negative impact on the energy production costs and may lead to increased energy constraints in the country, in addition to fluctuating global oil prices [53,54,55].
The effect of climate change on human well-being and environmental sustainability is being debated more extensively among energy, environmental, and scientific experts, and a number of scientists and politicians have emphasized the need to reduce greenhouse gas emissions in order to avoid the disastrous repercussions of global warming. Global carbon dioxide emissions have grown substantially with growing production and consumption rates, as well as governments’ efforts to rapidly develop their economies. Every year, more CO2 is released while governments continue to ignore the detrimental environmental repercussions of economic progress [56,57]. Economists, ecologists, politicians, and financiers have been focusing on environmental pollution and quality challenges for the last three decades. Ecosystems are stressed due to human demand for resources, which leads to a variety of environmental issues including biodiversity loss, global warming, soil degradation, and pollution. Unrestricted human use of natural resources is inflicting irreparable harm in the biosphere, which significantly affects the world’s long-term economic and social development objectives. Ecosystems and the economy are linked in a direct manner. Excessive exploitation and the use of natural resources and growing waste and pollution emissions harm global economies. Environmental issues such as biodiversity loss, global warming, and environmental degradation may be caused by CO2 emissions at this stage [58,59,60]. Because of increased urbanization and CO2 emissions in recent decades, the fast expansion of cities throughout the world poses a severe danger to the global ecosystem. Pakistan is another emerging country with a high pace of urbanization [61].
Global production and population growth have resulted in a huge increase in fossil fuel use, as economic growth, environmental sustainability, and health concerns all lead to increased usage of fossil fuels. Renewable energy production has grown more sustainable and ecologically benign due to the improvements described earlier. Renewable energy sources, as opposed to fossil fuels such as coal, oil, and natural gas, may be regenerated over time and have a reduced carbon impact. Countries have transitioned to producing renewable energy, despite major financial and technical investment [62,63,64]. Because of rising energy use, sustainable growth and development in the global economy are a big concern. It means that traditional energy sources are running out of fossil fuels, which is a dire prediction. Traditional energy sources, on the other hand, have a negative impact on our planet’s climate and ecology. As demand for energy increases, the cost of imported fossil fuels rises, and air pollution worsens, there is an urgent need to develop more cost-effective, efficient, and environmentally friendly energy solutions. As a result, the development of renewable energy has received worldwide attention in recent years. Economic growth and social well-being depend on energy, and renewable energy sources are essential if we are to avoid dangerous global warming. In every case, the energy location has a fixed output factor. Oil is not only vital for development, but it is also needed for sustainable economic growth [65,66,67]. The statistical values of R2, adjusted R2, AIC, and DW are (0.997), (0.996), (−3.285) and (1.912). Furthermore, Figure 2 exhibits the trends of the CUSUM and its squares for the studied variables at 5% significance.
Similarly, Figure 3 exposing the plots of the cointegration trends for the electricity production from oil, nuclear, natural gas, coal, and CO2 emission. Figure 3 also shows the criterion plot by following the Akaike Information Criteria (AIC), respectively.
Table 9 reports the findings of the stability tests for the study by employing Breusch–Godfrey Serial Correlation and Heteroskedasticity tests having F-Stat, R2 and p-values (0.199), (0.592), (0.743), (1.516), (17.620) and (0.000).
Furthermore, Figure 4 depicts the multiplier impact of electricity production from various sources (oil sources, nuclear sources, natural gas, and coal sources).

5. Concluding Remarks and Policy Directions

This study examined the impact of electricity production from various sources (oil, nuclear, natural gas, and coal) on CO2 emission in Pakistan by taking the annual data variations from 1975–2020. Two unit root tests were applied for the purpose of stationarity. The NARDL (Nonlinear Autoregressive Distributed Lag) technique was used to show the impact of electrical energy on CO2 emission via long-run and short-run dynamics. Outcomes show that via both long-run and short-run that variables electricity production from oil sources and electricity production from coal sources has a positive impact on CO2 emission in Pakistan via positive and negative shocks. Furthermore, electricity production from nuclear gas sources revealed an adverse influence on CO2 emissions. Similarly, electricity production from natural gas sources demonstrates the positive and adverse linkage with CO2 emission through positive and negative shocks.
It is noted that Pakistan’s role as a key member of the global community in addressing climate change is emphasized, even if its contribution to global greenhouse gas emissions is small. Furthermore, disaster preparedness, capacity building, institutional strengthening, technology transfer, including climate change issues in education systems, environmental compliance during development, addressing deforestation and the illegal timber trade, promoting the Clean Development Mechanism, and representing Pakistan’s climate change position in various international forums are all vital [68]. In order to prevent further environmental damage, the government must take new and significant steps to reduce CO2 emissions. The world’s energy supply continues to be dominated by fossil fuels, but the world’s demand for fossil fuels far outstrips the planet’s supply. Thus, oil reserves are depleting quickly, but the world’s energy requirements will still need to be met for the next three decades with the remaining coal and oil. Fossil energy pollution is also a significant threat to the ecosystem in the future, and in addition to harming the environment, global warming is wreaking havoc on the economy and society as a whole. Pakistan may benefit in future from renewable energy sources such as solar, biogas, geothermal, and hydropower.
It is critical to harness renewable energy resources in order to alleviate Pakistan’s current energy crisis and meet the country’s long-term energy needs. Although further investigation is required on the net energy and emergency benefits of using renewable energy, such research is currently on-going. It is also vital to investigate the new environment that these alternative energy sources will produce. The quantity of surplus that the renewable energy system can create is the most crucial problem for businesses. Carbon dioxide emissions were a concern prior to globalization, regardless of climate change. With the responsibility to reduce carbon emissions, new technologies must be developed to increase the output of the process while reducing global pollution. Human activities, not natural processes, are responsible for global warming, not the environment. Many of the greenhouse gases responsible for global warming are produced mostly by industrialization and agriculture. Action must be taken immediately to safeguard animals and people from these hazards. Renewable energy’s major goal is to reduce human influence on the environment; it is critical to phase out fossil fuels and invest more in renewable energy sources. Hydroelectricity and geothermal energy, both types of clean and renewable energy, are included in this category. There are no limitations to this study area, and further research may be done in the future to address the problem of carbonization and manage it in order to achieve environmental sustainability and long-term stability.

Author Contributions

Conceptualization A.R.; Data curation and Software: A.R. and L.M.C.; Analysis: A.R.; Writing the first draft: A.R. and M.D.O.; Reviewing: L.M.C. and M.D.O. All authors have read and agreed to the published version of the manuscript.

Funding

This research received no external funding.

Institutional Review Board Statement

Not applicable.

Informed Consent Statement

Not applicable.

Data Availability Statement

Not applicable.

Conflicts of Interest

The authors declare no conflict of interest.

References

  1. Rehman, A. The nexus of electricity access, population growth, economic growth in Pakistan and projection through 2040: An ARDL to co-integration approach. Int. J. Energy Sect. Manag. 2019, 13, 747–763. [Google Scholar] [CrossRef]
  2. GOP. Pakistan Economic Survey (2020–21). 2021. Available online: https://www.finance.gov.pk/survey/chapters_21/14-Energy.pdf (accessed on 2 April 2022).
  3. Rehman, A.; Ma, H.; Ozturk, I.; Radulescu, M. Revealing the dynamic effects of fossil fuel energy, nuclear energy, renewable energy, and carbon emissions on Pakistan’s economic growth. Environ. Sci. Pollut. Res. 2022, 29, 48784–48794. [Google Scholar] [CrossRef] [PubMed]
  4. Rehman, A.; Alam, M.M.; Radulescu, M.; Alvarado, R.; Mihai, D.; Brutu, M. A Novel Investigation to Explore the Impact of Renewable Energy, Urbanization, and Trade on Carbon Emission in Bhutan. Energies 2022, 15, 2984. [Google Scholar] [CrossRef]
  5. Luqman, M.; Ahmad, N.; Bakhsh, K. Nuclear energy, renewable energy and economic growth in Pakistan: Evidence from non-linear autoregressive distributed lag model. Renew. Energy 2019, 139, 1299–1309. [Google Scholar] [CrossRef]
  6. Ibrahim-Shwilima, A.J. Economic growth and nonrenewable resources: An empirical investigation. Asian J. Empir. Res. 2016, 6, 26–41. [Google Scholar]
  7. Saudi, M.H.M.; Sinaga, O.; Roespinoedji, D.; Razimi, M.S.A. The role of renewable, non-renewable electricity consumption and carbon emission in development in Indonesia: Evidence from Distributed Lag Tests. Int. J. Energy Econ. Policy 2019, 9, 46. [Google Scholar] [CrossRef]
  8. Aftab, S.; Ahmed, A.; Chandio, A.A.; Korankye, B.A.; Ali, A.; Fang, W. Modeling the nexus between carbon emissions, energy consumption, and economic progress in Pakistan: Evidence from cointegration and causality analysis. Energy Rep. 2021, 7, 4642–4658. [Google Scholar] [CrossRef]
  9. GOP. Pakistan Economic Survey (2019–20). 2020. Available online: https://www.finance.gov.pk/survey/chapter_20/14_Energy.pdf (accessed on 20 March 2022).
  10. GOP. Pakistan Economic Survey (2018–19). 2019. Available online: https://www.finance.gov.pk/survey/chapters_19/14-Energy.pdf (accessed on 10 March 2022).
  11. Rehman, A.; Deyuan, Z. Investigating the linkage between economic growth, electricity access, energy use, and population growth in Pakistan. Appl. Sci. 2018, 8, 2442. [Google Scholar] [CrossRef] [Green Version]
  12. Hu, X.; Imran, M.; Wu, M.; Moon, H.C.; Liu, X. Alternative to oil and gas: Review of economic benefits and potential of wind power in Pakistan. Math. Probl. Eng. 2020, 2020, 8884228. [Google Scholar] [CrossRef]
  13. Saghir, M.; Zafar, S.; Tahir, A.; Ouadi, M.; Siddique, B.; Hornung, A. Unlocking the potential of biomass energy in Pakistan. Front. Energy Res. 2019, 7, 24. [Google Scholar] [CrossRef]
  14. GOP. Pakistan Economic Survey (2015–16). 2016. Available online: https://www.finance.gov.pk/survey/chapters_16/14_Energy.pdf (accessed on 5 March 2022).
  15. Sineviciene, L.; Sotnyk, I.; Kubatko, O. Determinants of energy efficiency and energy consumption of Eastern Europe post-communist economies. Energy Environ. 2017, 28, 870–884. [Google Scholar] [CrossRef]
  16. Gao, M.; He, K.; Li, L.; Wang, Q.; Liu, C. A review on energy consumption, energy efficiency and energy saving of metal forming processes from different hierarchies. Processes 2019, 7, 357. [Google Scholar] [CrossRef] [Green Version]
  17. Qu, W.H.; Xu, L.; Qu, G.H.; Yan, Z.J.; Wang, J.X. The impact of energy consumption on environment and public health in China. Nat. Hazards 2017, 87, 675–697. [Google Scholar] [CrossRef]
  18. Mujtaba, A.; Jena, P.K.; Bekun, F.V.; Sahu, P.K. Symmetric and asymmetric impact of economic growth, capital formation, renewable and non-renewable energy consumption on environment in OECD countries. Renew. Sustain. Energy Rev. 2022, 160, 112300. [Google Scholar] [CrossRef]
  19. Holmberg, K.; Erdemir, A. Global impact of friction on energy consumption, economy and environment. FME Trans. 2015, 43, 181–185. [Google Scholar]
  20. Abbas, S.; Kousar, S.; Yaseen, M.; Mayo, Z.A.; Zainab, M.; Mahmood, M.J.; Raza, H. Impact assessment of socioeconomic factors on dimensions of environmental degradation in Pakistan. SN Appl. Sci. 2020, 2, 468. [Google Scholar] [CrossRef] [Green Version]
  21. Siyal, M.Y.; Chowdhry, B.S.; Rajput, A.Q. Socio-economic factors and their influence on the adoption of e-commerce by comsumers in Singapore. Int. J. Inf. Technol. Decis. Mak. 2006, 5, 317–329. [Google Scholar] [CrossRef]
  22. Zhu, Q.; Peng, X.; Wu, K. Calculation and decomposition of indirect carbon emissions from residential consumption in China based on the input–output model. Energy Policy 2012, 48, 618–626. [Google Scholar] [CrossRef]
  23. Wang, Z.; Liu, W.; Yin, J. Driving forces of indirect carbon emissions from household consumption in China: An input–output decomposition analysis. Nat. Hazards 2015, 75, 257–272. [Google Scholar] [CrossRef]
  24. Ozcan, B.; Tzeremes, P.; Dogan, E. Re-estimating the interconnectedness between the demand of energy consumption, income, and sustainability indices. Environ. Sci. Pollut. Res. 2019, 26, 26500–26516. [Google Scholar] [CrossRef]
  25. Ulucak, R.; Ozcan, B. Relationship between energy consumption and environmental sustainability in OECD countries: The role of natural resources rents. Resour. Policy 2020, 69, 101803. [Google Scholar] [CrossRef]
  26. Kang, S.H.; Islam, F.; Tiwari, A.K. The dynamic relationships among CO2 emissions, renewable and non-renewable energy sources, and economic growth in India: Evidence from time-varying Bayesian VAR model. Struct. Chang. Econ. Dyn. 2019, 50, 90–101. [Google Scholar] [CrossRef]
  27. Ulucak, R.; Apergis, N. Does convergence really matter for the environment? An application based on club convergence and on the ecological footprint concept for the EU countries. Environ. Sci. Policy 2018, 80, 21–27. [Google Scholar] [CrossRef] [Green Version]
  28. Rehman, A.; Ma, H.; Chishti, M.Z.; Ozturk, I.; Irfan, M.; Ahmad, M. Asymmetric investigation to track the effect of urbanization, energy utilization, fossil fuel energy and CO2 emission on economic efficiency in China: Another outlook. Environ. Sci. Pollut. Res. 2021, 28, 17319–17330. [Google Scholar] [CrossRef]
  29. Khoshnevis Yazdi, S.; Shakouri, B. Renewable energy, nonrenewable energy consumption, and economic growth. Energy Sources Part B Econ. Plan. Policy 2017, 12, 1038–1045. [Google Scholar] [CrossRef]
  30. Ahmed, M.; Azam, M. Causal nexus between energy consumption and economic growth for high, middle and low income countries using frequency domain analysis. Renew. Sustain. Energy Rev. 2016, 60, 653–678. [Google Scholar] [CrossRef]
  31. Khan, M.K.; Teng, J.Z.; Khan, M.I. Effect of energy consumption and economic growth on carbon dioxide emissions in Pakistan with dynamic ARDL simulations approach. Environ. Sci. Pollut. Res. 2019, 26, 23480–23490. [Google Scholar] [CrossRef]
  32. Nasreen, S.; Saidi, S.; Ozturk, I. Assessing links between energy consumption, freight transport, and economic growth: Evidence from dynamic simultaneous equation models. Environ. Sci. Pollut. Res. 2018, 25, 16825–16841. [Google Scholar] [CrossRef]
  33. Jamel, L.; Derbali, A. Do energy consumption and economic growth lead to environmental degradation? Evidence from Asian economies. Cogent Econ. Financ. 2016, 4, 1170653. [Google Scholar] [CrossRef] [Green Version]
  34. Rafindadi, A.A. Econometric prediction on the effects of financial development and trade openness on the German energy consumption: A startling revelation from the data set. Int. J. Energy Econ. Policy 2015, 5, 182–196. [Google Scholar]
  35. Michieka, N.M.; Fletcher, J.; Burnett, W. An empirical analysis of the role of China’s exports on CO2 emissions. Appl. Energy 2015, 104, 258–267. [Google Scholar] [CrossRef] [Green Version]
  36. Mirza, F.M.; Kanwal, A. Energy consumption, carbon emissions and economic growth in Pakistan: Dynamic causality analysis. Renew. Sustain. Energy Rev. 2017, 72, 1233–1240. [Google Scholar] [CrossRef]
  37. Pablo-Romero, M.D.P.; De Jesús, J. Economic growth and energy consumption: The energy-environmental Kuznets curve for Latin America and the Caribbean. Renew. Sustain. Energy Rev. 2016, 60, 1343–1350. [Google Scholar] [CrossRef]
  38. He, X.; Adebayo, T.S.; Kirikkaleli, D.; Umar, M. Analysis of dual adjustment approach: Consumption-based carbon emissions in Mexico. Sustain. Prod. Consum 2021, 27, 947–957. [Google Scholar] [CrossRef]
  39. Dong, K.; Hochman, G.; Zhang, Y.; Sun, R.; Li, H.; Liao, H. CO2 emissions, economic and population growth, and renewable energy: Empirical evidence across regions. Energy Econ. 2018, 75, 180–192. [Google Scholar] [CrossRef]
  40. Bekhet, H.A.; Matar, A.; Yasmin, T. CO2 emissions, energy consumption, economic growth, and financial development in GCC countries: Dynamic simultaneous equation models. Renew. Sustain. Energy Rev. 2017, 70, 117–132. [Google Scholar] [CrossRef]
  41. Shahbaz, M.; Solarin, S.A.; Hammoudeh, S.; Shahzad, S.J.H. Bounds testing approach to analyzing the environment Kuznets curve hypothesis with structural beaks: The role of biomass energy consumption in the United States. Energy Econ. 2017, 68, 548–565. [Google Scholar] [CrossRef] [Green Version]
  42. Neagu, O.; Teodoru, M.C. The relationship between economic complexity, energy consumption structure and greenhouse gas emission: Heterogeneous panel evidence from the EU countries. Sustainability 2019, 11, 497. [Google Scholar] [CrossRef] [Green Version]
  43. Rudolph, A.; Figge, L. Determinants of ecological footprints: What is the role of globalization? Ecol. Indic. 2017, 81, 348–361. [Google Scholar] [CrossRef]
  44. Usman, M.; Jahanger, A. Heterogeneous effects of remittances and institutional quality in reducing environmental deficit in the presence of EKC hypothesis: A global study with the application of panel quantile regression. Environ. Sci. Pollut. Res. 2021, 28, 37292–37310. [Google Scholar] [CrossRef]
  45. Shahbaz, M.; Tiwari, A.K.; Nasir, M. The effects of financial development, economic growth, coal consumption and trade openness on CO2 emissions in South Africa. Energy Policy 2013, 61, 1452–1459. [Google Scholar] [CrossRef] [Green Version]
  46. Kasman, A.; Duman, Y.S. CO2 emissions, economic growth, energy consumption, trade and urbanization in new EU member and candidate countries: A panel data analysis. Econ. Model. 2015, 44, 97–103. [Google Scholar] [CrossRef]
  47. Pesaran, M.H.; Shin, Y.; Smith, R.J. Bounds testing approaches to the analysis of level relationships. J. Appl. Econom. 2001, 16, 289–326. [Google Scholar] [CrossRef]
  48. Shin, Y.; Yu, B.; Greenwood-Nimmo, M. Modelling asymmetric cointegration and dynamic multipliers in a nonlinear ARDL framework. In Festschrift in Honor of Peter Schmidt; Springer: New York, NY, USA, 2014; pp. 281–314. [Google Scholar]
  49. Dickey, D.A.; Fuller, W.A. Distribution of the estimators for autoregressive time series with a unit root. J. Am. Stat. Assoc. 1979, 74, 427–431. [Google Scholar]
  50. Phillips, P.C.; Perron, P. Testing for a unit root in time series regression. Biometrika 1988, 75, 335–346. [Google Scholar] [CrossRef]
  51. Johansen, S.; Juselius, K. Maximum likelihood estimation and inference on cointegration—With appucations to the demand for money. Oxf. Bull. Econ. Stat. 1990, 52, 169–210. [Google Scholar] [CrossRef]
  52. Garcia, J.M.; Coelho LM, R. Energy efficiency strategies in refrigeration systems of large supermarkets. Int. J. Energy Environ. 2010, 4, 63–70. [Google Scholar]
  53. Javed, M.S.; Raza, R.; Hassan, I.; Saeed, R.; Shaheen, N.; Iqbal, J.; Shaukat, S.F. The energy crisis in Pakistan: A possible solution via biomass-based waste. J. Renew. Sustain. Energy 2016, 8, 043102. [Google Scholar] [CrossRef]
  54. GOP. Pakistan Economic Survey (2017–18). 2018. Available online: https://www.finance.gov.pk/survey/chapters_18/14-Energy.pdf (accessed on 2 March 2022).
  55. Rehman, A.; Ozcan, R.; Badshah, W.; Radulescu, M.; Ozturk, I. Symmetric and Asymmetric Impacts of Commercial Energy Distribution from Key Sources on Economic Progress in Pakistan. Sustainability 2021, 13, 12670. [Google Scholar] [CrossRef]
  56. Jaforullah, M.; King, A. Does the use of renewable energy sources mitigate CO2 emissions? A reassessment of the US evidence. Energy Econ. 2015, 49, 711–717. [Google Scholar] [CrossRef]
  57. Kirikkaleli, D.; Adebayo, T.S. Do renewable energy consumption and financial development matter for environmental sustainability? New global evidence. Sustain. Dev. 2021, 29, 583–594. [Google Scholar] [CrossRef]
  58. Ahmed, Z.; Wang, Z.; Mahmood, F.; Hafeez, M.; Ali, N. Does globalization increase the ecological footprint? Empirical evidence from Malaysia. Environ. Sci. Pollut. Res. 2019, 26, 18565–18582. [Google Scholar] [CrossRef] [PubMed]
  59. Pata, U.K. Renewable and non-renewable energy consumption, economic complexity, CO2 emissions, and ecological footprint in the USA: Testing the EKC hypothesis with a structural break. Environ. Sci. Pollut. Res. 2021, 28, 846–861. [Google Scholar] [CrossRef] [PubMed]
  60. Muhammad, B.; Khan, M.K.; Khan, M.I.; Khan, S. Impact of foreign direct investment, natural resources, renewable energy consumption, and economic growth on environmental degradation: Evidence from BRICS, developing, developed and global countries. Environ. Sci. Pollut. Res. 2021, 28, 21789–21798. [Google Scholar] [CrossRef] [PubMed]
  61. Ali, R.; Bakhsh, K.; Yasin, M.A. Impact of urbanization on CO2 emissions in emerging economy: Evidence from Pakistan. Sustain. Cities Soc. 2019, 48, 101553. [Google Scholar] [CrossRef]
  62. Bologna, S. Energy and Sustainable Economic Development. In Renewable Energy for Unleashing Sustainable Development; Springer: Cham, Switzerland, 2013; pp. 181–193. [Google Scholar]
  63. Ahmed, M.M.; Shimada, K. The effect of renewable energy consumption on sustainable economic development: Evidence from emerging and developing economies. Energies 2019, 12, 2954. [Google Scholar] [CrossRef] [Green Version]
  64. Bayar, Y.; Sasmaz, M.U.; Ozkaya, M.H. Impact of trade and financial globalization on renewable energy in EU transition economies: A bootstrap panel granger causality test. Energies 2020, 14, 19. [Google Scholar] [CrossRef]
  65. Wang, Z.; Zhang, B.; Wang, B. Renewable energy consumption, economic growth and human development index in Pakistan: Evidence form simultaneous equation model. J. Clean. Prod. 2018, 184, 1081–1090. [Google Scholar] [CrossRef]
  66. Mirza, I.A.; Khalil, M.S. Renewable energy in Pakistan: Opportunities and challenges. Sci. Vis. 2011, 16, 13–20. [Google Scholar]
  67. Rahman, M.M.; Velayutham, E. Renewable and non-renewable energy consumption-economic growth nexus: New evidence from South Asia. Renew. Energy 2020, 147, 399–408. [Google Scholar] [CrossRef]
  68. GOP. Government of Pakistan Ministry of Climate Change. 2012. Available online: http://www.gcisc.org.pk/National_Climate_Change_Policy_2012.pdf (accessed on 10 April 2022).
Figure 1. Trend of the variables varies from 1975–2020.
Sustainability 14 08957 g001
Figure 2. CUSUM and its squares plot.
Sustainability 14 08957 g002
Figure 3. Cointegration and criterion plot.
Sustainability 14 08957 g003
Figure 4. Multipliers plots of asymmetric shocks.
Sustainability 14 08957 g004
Table 1. Description of Study variables.
Variables for the AnalysisShort FormMeasurements (Units)Sources of DataWeb. Links
CO2 emissionCO2eIn kt (kiloton)WDIhttps://data.worldbank.org/country/Pakistan, (accessed on 15 April 2022)
Electricity production from oil sourcesEPOIn % of totalWDI
Electricity production from nuclear sourcesEPNIn % of totalWDI
Electricity production from natural gas sourcesEPGIn % of totalWDI
Electricity production from coal sourcesEPCIn % of totalWDI
Table 2. Summary analysis.
VariablesMeanMedianMaximumMinimumStd. Dev.SkewnessKurtosisJarque–BeraProbability
CO2e11.18211.34112.2479.8480.721−0.3791.8853.7830.150
EPO2.8123.2953.817−1.1921.117−1.6865.65038.3420.000
EPN0.4960.7011.805−4.3151.075−2.1439.894137.3010.000
EPG3.4883.4403.2203.2200.1820.6272.3984.0340.133
EPC−1.797−1.8760.194−5.2751.262−0.6903.6324.8090.090
Table 3. Variables correlation.
CO2eEPOEPNEPGEPC
CO2e1.0000.8100.228−0.518−0.564
EPO0.8101.0000.280−0.617−0.378
EPN0.2280.2801.000−0.011−0.056
EPG−0.518−0.617−0.0111.0000.376
EPC−0.564−0.378−0.0560.3761.000
Table 4. Unit root testing.
ADF at LevelADF at 1st Diff.P-P at LevelP-P at 1st Diff.
t-Statisticsp-Valuest-Statisticsp-Valuest-Statisticsp-Valuest-Statisticsp-Values
None
CO2e4.7141.000−2.5440.0124.7140.000−4.8100.000
EPO−0.3170.565−4.8240.0000.0920.926−4.8240.000
EPN−0.6490.429−1.8910.056−3.2800.001−9.0720.000
EPG−0.9280.308−3.4720.000−0.7870.435−6.5470.000
EPC0.9900.912−9.6950.0000.0430.965−9.6950.000
Intercept
CO2e−3.4230.0155−7.5640.000−1.0470.300−7.5640.000
EPO−2.2910.1788−4.8130.000−1.6070.114−4.8130.000
EPN−1.2210.6557−2.0720.256−3.7160.000−8.9780.000
EPG−2.6180.097−3.5580.010−2.2380.030−6.5370.000
EPC−0.5480.872−9.9440.000−1.5170.135−9.9440.000
Trend and Intercept
CO2e−0.9580.9403−4.4200.005−0.9580.342−8.1590.000
EPO−3.6040.0400−4.7650.001−2.2690.028−4.7650.000
EPN−1.6360.759−1.5510.793−3.9500.000−8.8820.000
EPG−3.0410.133−3.5540.046−2.3120.025−6.4930.000
EPC−1.1480.909−9.9190.000−2.2210.031−9.9190.000
Table 5. Outcomes of Lag selection criteria.
LagLogLLRFPEAICSCHQ
0−198.095NA0.0048.8309.0298.904
13.356350.3512.21 × 10−61.1582.351 *1.605
239.43854.907 *1.42 × 10−6 *0.676 *2.8631.495 *
362.03629.4751.75 × 10−60.7813.9611.972
475.35514.4773.59 × 10−61.2885.4622.852
* designates the criterion through lag order selection.
Table 6. Bounds testing outcomes.
F-Bounds TestN-Hypothesis: (No Levels Relationship)
T-Stat (Value)SignificanceAt I(0)At I(1)
F-stat (4.756)10%(1.85)(2.85)
K (8)5%(2.11)(3.15)
2.5%(2.33)(3.42)
1%(2.62)(3.77)
Table 7. Johansen’s technique of cointegration results.
Hypothesized
No. of CE(s)
E-ValueT-StatisticC-Value at (0.05)Prob.**E-ValueMax-E-StatisticC-Value at (0.05)Prob.**
None *0.55473.19469.8180.0260.55438.84733.8760.011
At most 10.27834.34647.8560.4830.27815.65827.5840.694
At most 20.19518.68829.7970.5150.19510.45821.1310.700
At most 30.1208.22915.4940.4410.1206.15214.2640.593
At most 40.0422.0763.8410.1490.0422.0763.8410.149
Note: * signifies the denial of hypothesis at (0.05) level; ** denotes the p-values of MacKinnon–Haug–Michelis (1999).
Table 8. Asymmetric long-run and short-run outcomes.
Short-Run Estimation
VariablesCoefficientsS-Errort-StatProb.
C3.8011.0573.5950.001
CO2e(−1)−0.3700.106−3.4810.001
EPO_POS0.0330.0221.4990.142
EPO_NEG0.0110.0150.7160.478
EPN_POS(−1)−0.0430.021−2.0680.046
EPN_NEG(−1)−0.0480.019−2.5070.017
EPG_POS(−1)0.3490.0933.7580.000
EPG_NEG(−1)−0.0260.057−0.4550.651
EPC_POS0.0220.0121.8450.073
EPC_NEG0.0190.0111.7170.095
D(EPN_POS)−0.0630.024−2.5450.015
D(EPN_NEG)0.0030.0140.2450.807
D(EPG_POS)0.0650.1260.5160.608
D(EPG_NEG)0.2050.1321.5490.130
CointEq(−1)−0.3700.047−7.7550.000
Long-Run Estimation
VariablesCoefficientsS-Errort-StatProb.
EPO_POS0.0890.0651.3670.180
EPO_NEG0.0300.0410.7460.460
EPN_POS−0.1170.065−1.7830.083
EPN_NEG−0.1300.053−2.4180.021
EPG_POS0.9430.2763.4150.001
EPG_NEG−0.0700.150−0.4700.640
EPC_POS0.0600.0272.2200.033
EPC_NEG0.0530.0381.3750.178
C10.2550.14471.0270.000
R2
(0.997)
Adj-R2
(0.996)
Log-likelihood
(92.858)
Akaike info criterion
(−3.285)
S-criterion
(−2.740)
H-Quinn criter.
(−3.079)
D-Watson stat
(1.912)
Table 9. Stability tests.
Breusch–Godfrey Serial Correlation LM TestHeteroskedasticity Test (Harvey)
F-statistic (0.199)F-statistic (1.516)
R-squared (0.592)R-squared (17.620)
Prob. (0.743)Prob. (0.000)
Publisher’s Note: MDPI stays neutral with regard to jurisdictional claims in published maps and institutional affiliations.

