Article

An Investigation of Compression Bearing Capacity of Concrete-Filled Rectangular Stainless Steel Tubular Columns under Axial Load and Eccentric Axial Load

College of Civil Engineering and Architecture, Anhui Polytechnic University, Wuhu 241000, China
*
Authors to whom correspondence should be addressed.
Sustainability 2022, 14(14), 8946; https://doi.org/10.3390/su14148946
Submission received: 19 June 2022 / Revised: 15 July 2022 / Accepted: 20 July 2022 / Published: 21 July 2022
(This article belongs to the Special Issue Sustainable Civil Engineering Structures and Construction Materials)

Abstract

:
In order to study the compression bearing capacity of concrete-filled rectangular stainless steel tubular columns, the influence of the stainless steel tube thickness, relative eccentricity, and slenderness ratio on the compression bearing capacity is analyzed, and then the calculation formula of compression bearing capacity is proposed. The results show that the finite element model can effectively simulate the compression bearing capacity, the mean of finite element calculations Nufem to the test Nuexp is 0.985, and the variance is 0.000621. The slenderness ratio and relative eccentricity have a great influence on the load–displacement curves. The thickness of the stainless steel tube has little influence on the load–displacement curves. With the increase in slenderness ratio and relative eccentricity, the compression bearing capacity decreases. With the increase in the slenderness ratio, the failure model of the specimen gradually changes from plastic failure to elastoplastic failure and then elastic failure. When the slenderness ratio is the same, if the relative eccentricity is larger, increasing the thickness of the stainless steel tube will be more effective in improving the compression bearing capacity. When the relative eccentricity is the same, if the slenderness ratio is smaller, increasing the thickness of the stainless steel tube will be more effective for improving the compression bearing capacity. The slenderness ratio and relative eccentricity have a great influence on the longitudinal stress distribution in the cross-section. When the slenderness ratio and relative eccentricity are greater, the longitudinal compressive stress in parts of the cross-section gradually becomes longitudinal tensile stress. The proposed formula can effectively predict the compression bearing capacity of concrete-filled rectangular stainless steel tubular columns. The mean of theoretical calculations to the test and the finite element is 1.054, and the variance is 0.0247.

1. Introduction

Concrete-filled steel tubes are widely used in engineering due to their full use of the strength of their two constituent materials, such as in high-rise buildings, large ocean platforms, and bridge construction. The steel tube of an ordinary concrete-filled steel tube is exposed to the air, and with the progression of time, it is prone to corrosion, especially in the Marine environment, so anti-corrosion treatment of the steel tube is required. Once steel tube corrosion occurs, it will have an adverse impact on its bearing capacity, can reduce the durability of the structure, and will produce high maintenance costs. In order to solve the problem of the corrosion of ordinary steel tubes, scholars at home and abroad have proposed concrete-filled stainless steel tubes. Due to the great difference in mechanical properties between stainless steel tubes and ordinary carbon steel tubes, scholars at home and abroad have carried out a series of studies on the mechanical properties of concrete-filled stainless steel tubular columns, including experiment, finite element method and numerical manifold method [1,2,3,4].
Lam et al. [5] mainly studied the compression bearing capacity of concrete-filled circular stainless steel tubular short columns, the influence of concrete strength on the compression bearing capacity was analyzed, and the continuous strength method, which is applicable for calculating the compression bearing capacity was proposed. Uy et al. [6] mainly studied the behavior of short and slender concrete-filled stainless steel tubular columns with tests, and their results show that all of the codes are somewhat conservative in predicting the load-carrying capacities of both short and slender columns. Ellobody et al. [7,8,9] mainly studied fiber reinforced concrete-filled stainless steel tubular columns through experimental investigation and finite element analysis, and their results show that Eurocode 4 was quite conservative for predicting the ultimate loads of the eccentrically loaded columns, the conservatism of the Eurocode 4 predictions is increased as the eccentricity increases. Tokgoz et al. [10] mainly studied the behavior of plain and steel fiber concrete-filled stainless steel tubular columns under biaxial bending, and axial compression through experimental investigation and the effects of concrete compressive strength, cross-section, load eccentricity, steel fiber material, and slenderness on the behavior of plain and steel fiber concrete-filled stainless steel tubular columns were examined. Hassanein M F et al. [11] mainly studied the flexural buckling of circular concrete-filled stainless steel tubular (CFSST) slender columns through finite element analysis, and the results show that the proposed design model is shown to predict the strengths of CFSST columns well. Refat et al. [12] mainly studied the compressive strengths of stiffened and unstiffened concrete-filled austenitic stainless steel tubular short columns through finite element analysis, and the results show that the Eurocode 4 predictions appear to be suitable for CFSST columns but conservative for concrete-filled stiffened stainless steel hollow tubular (CFSSST) columns. Al-Mekhlafi et al. [13] mainly studied the behavior of eccentrically loaded concrete-filled stainless steel tubular stub columns confined by carbon fiber reinforced polymer (CFRP) composites through experimental investigation and finite element analysis, and the results show that the CFRP wrapping effectively improves the ultimate strength of the CFRP-bonded CFSST stub columns and the analytical axial force-bending moment interaction model provided conservative predictions when compared to the experimental and FE results. Patel et al. [14] mainly studied the compression bearing capacity of concrete-filled circular stainless steel tubular short columns with a nonlinear analysis method, and the results show that the three-stage stress-strain relationship can simulate its axial load-strain behavior. He et al. [15] mainly studied the compression bearing capacity of concrete-filled circular stainless steel tubular short columns; the influence of concrete strength, stainless steel tube size, and compression area were analyzed, and the results show that the compression area and restraint effect coefficient are the key factors affecting its bearing capacity. Tang et al. [16] mainly studied the axial compression bearing capacity of concrete-filled circular stainless steel tubular short column and proposed the calculation formula. Duan et al. [17] mainly studied the axial compression bearing capacity of recycled concrete-filled circular stainless steel tubular short columns with the finite element analysis method, and the results show that the steel ratio has an obvious influence on its bearing capacity. Liao et al. [18] mainly studied the axial compression mechanical properties of concrete-filled circular stainless steel tubular short columns and concrete-filled square stainless steel tubular short columns, the influence of stainless steel tube thickness, section shape, and concrete type on the axial compression performance was analyzed, and the results show that stainless steel tubes have a strong constraint effect and that the calculation of axial compression bearing capacity is conservative. Ding et al. [19] mainly studied the constraint effect of concrete-filled square stainless steel tubular short columns, the results show that the constraint effect of the stainless steel tube on core concrete is stronger than that of an ordinary carbon steel tube, and the superposition method used to calculate its compression bearing capacity has high accuracy. Dai et al. [20] mainly studied the axial compression mechanical performance of concrete-filled square stainless steel tubular short columns, the influence of steel tube thickness and concrete strength on its axial compression mechanical performance was analyzed, and the results show that the steel tube thickness has a great influence on the axial compression bearing capacity and that the calculation methods of bearing capacity in the norm are safe. In addition to the above scholars, some scholars studied the axial compression and eccentrically compression mechanical performance of concrete-filled rectangular stainless steel tubular short columns and the axial compression mechanical performance of compound concrete-filled stainless steel tubular short columns [21,22,23,24].
From the above research, it can be seen that the research on the mechanical performance of concrete-filled rectangular stainless steel tubular columns is less common and mainly focuses on the mechanical properties of short columns and the axial compression performance. When a concrete-filled rectangular stainless steel tubular column is applied in practical engineering, in addition to the axial load, there is also the eccentric axial load. Thus, it is particularly important to study the axial compression and eccentric compression behavior of concrete-filled rectangular stainless steel tubular short and long columns. Based on the experimental research in [21], the compression bearing capacity of rectangular stainless steel tubular concrete columns is studied in depth. Firstly, the influence of stainless steel tube thickness, relative eccentricity, and slenderness ratio on the compression bearing capacity is analyzed. Then, the longitudinal stress distribution of the stainless steel tube and core concrete is further analyzed. Finally, based on the experimental and finite element calculations, the formula of compression bearing capacity considering the effect of slenderness ratio and relative eccentricity is proposed by using theoretical analysis.

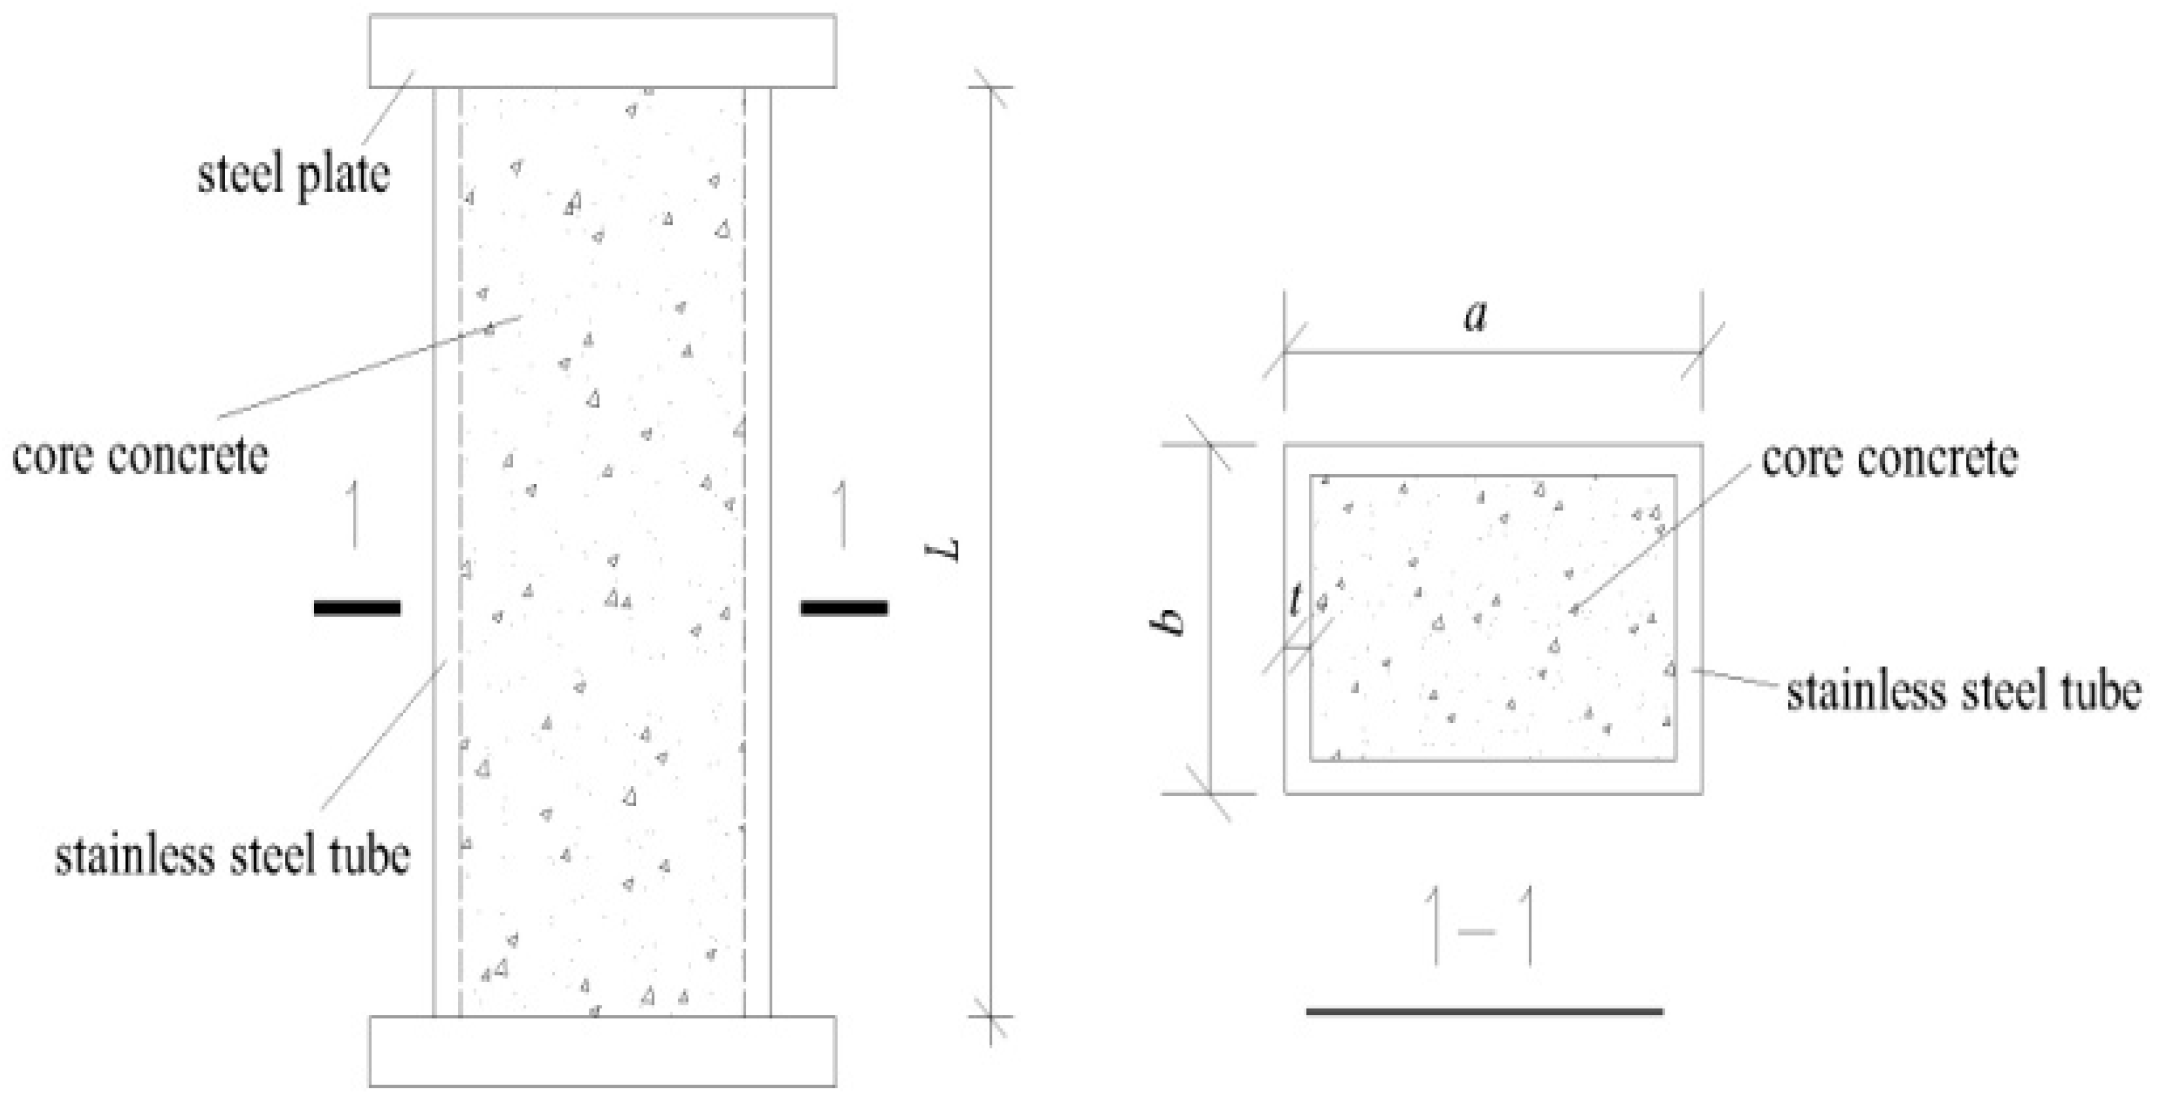
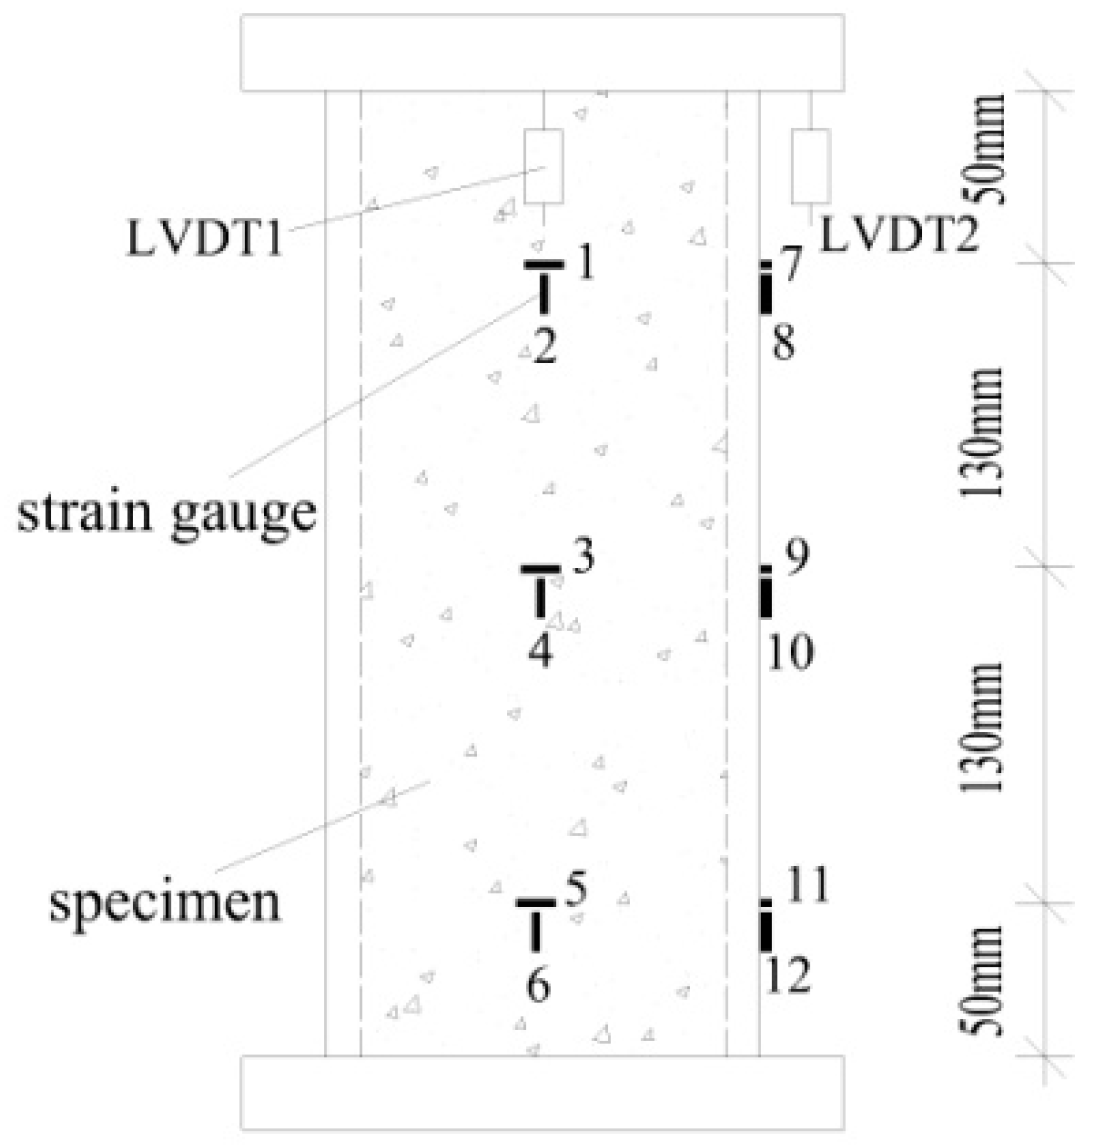
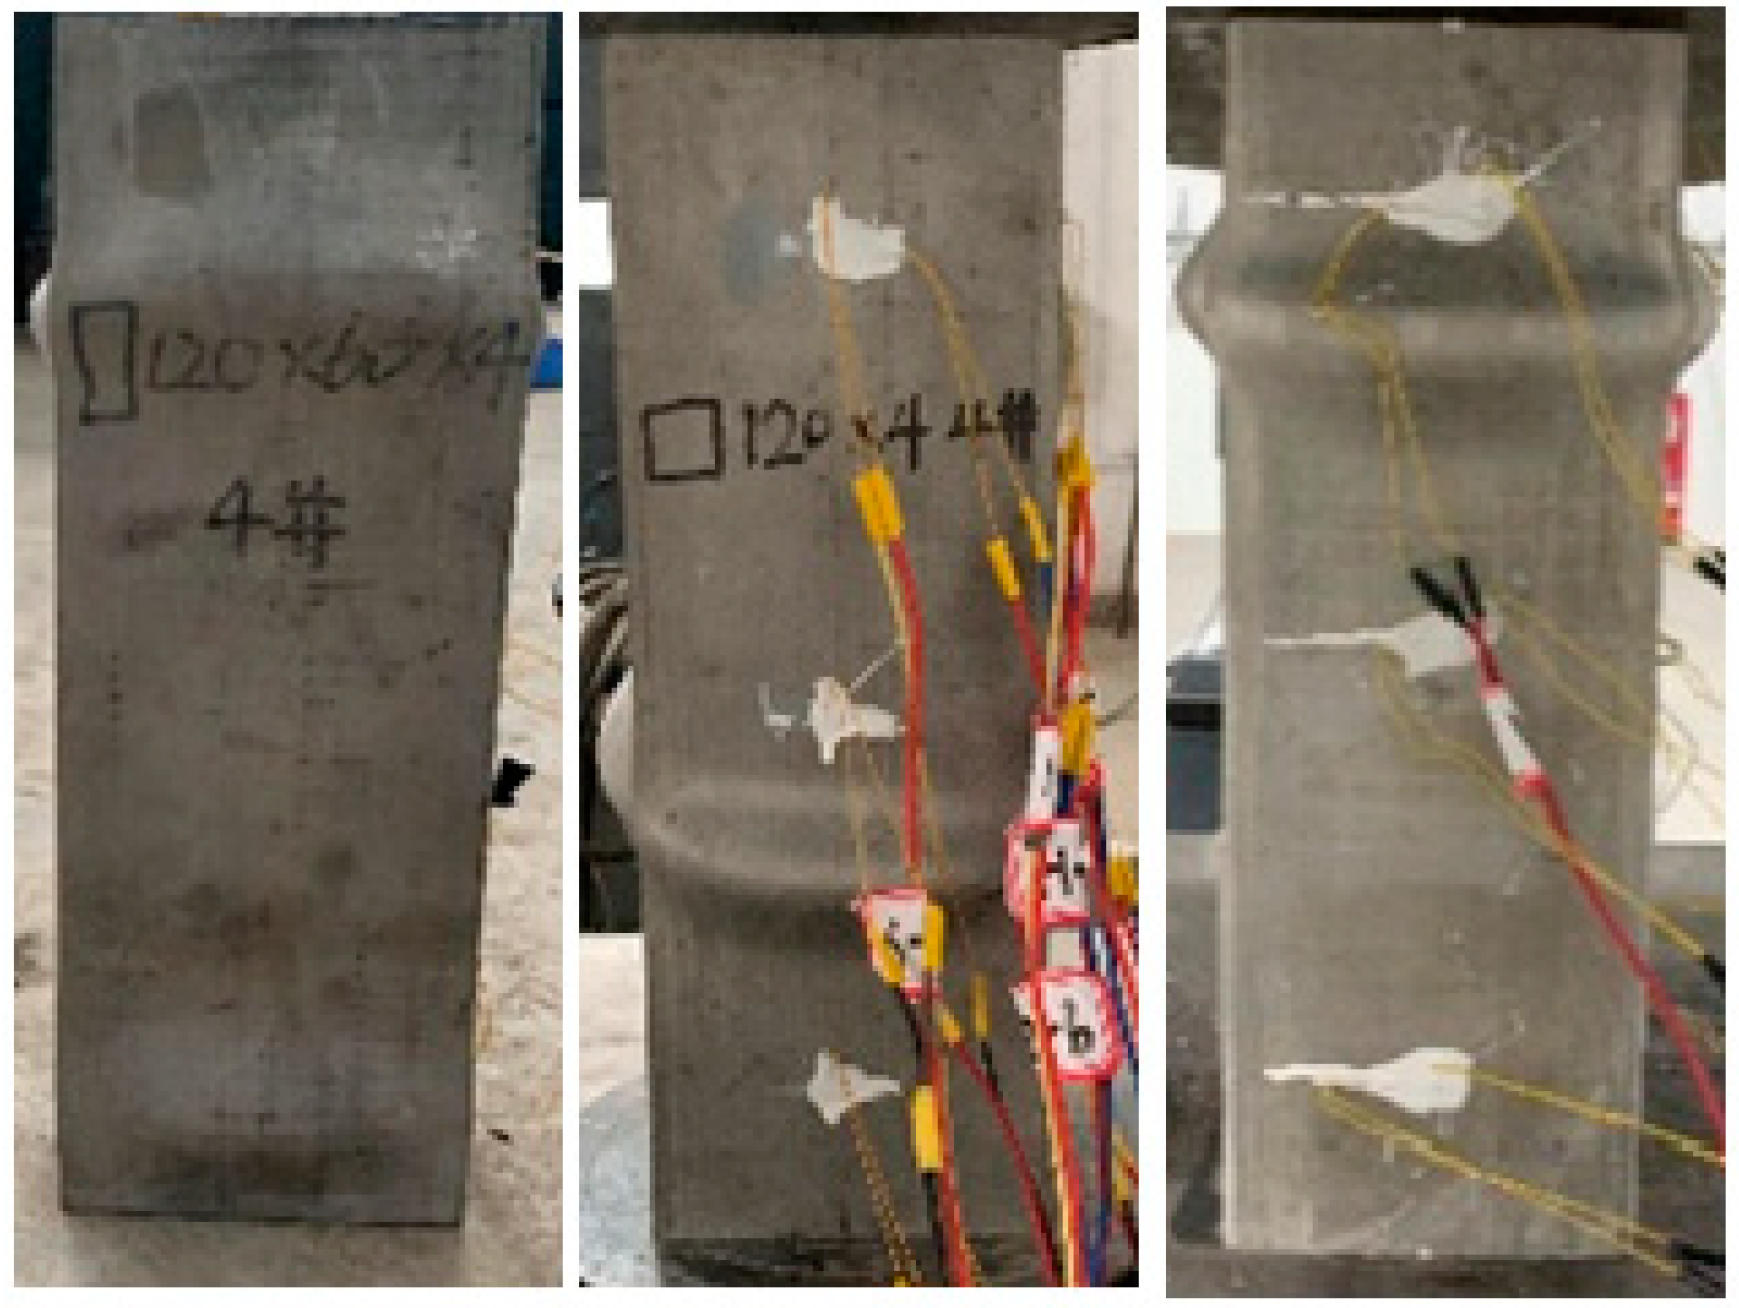
2. Experiment Overview

The specimens were designed to mainly consider the influence of section form and steel tube thickness, and a total of 7 specimens were examined [21]. The schematic diagram of a specimen is shown in Figure 1, and the parameters are shown in Table 1. The steel plates are welded with the outer stainless steel tube. The steel tubes of specimens were austenitic 304 seamless stainless steel tubes with thicknesses 4 mm, 5 mm, and 6 mm, and the average yield strength fy was 534.3 MPa, 572.3 MPa, and 598.0 MPa, respectively. The core concrete in specimens was C40, the average cubic compressive strength fcu was 43.96 MPa, and the axial compressive strength fc was 29.48 MPa. The Eurocode 4, Eurocode 3, and Chinese code [25,26,27,28,29,30] were followed.
The test used a 300-ton electrohydraulic servo-long-column press machine with a displacement-controlled loading rate of 0.01 mm/s. A total of 2 LVDT displacement meters were arranged on the top of the two adjacent sides of the specimen to measure the axial deformation of the specimen, and 12 strain gauges were arranged on the upper, middle, and lower parts of the two adjacent sides of the specimen to measure the longitudinal and hoop strain of the specimen. The arrangement of strain gauges and LVDT displacement meters is shown in Figure 2. The test was terminated if the load dropped to 75% of the peak load or the axial displacement of the specimen was 5% of the length of the specimen. The Eurocode 4 and Chinese code [25,31] was followed.
Through the test, the axial compression bearing capacity and the typical failure mode of specimens were obtained. The axial compression bearing capacity is shown in Table 1, and the typical failure mode is shown in Figure 3. It can be seen from Figure 3 that the typical failure mode of rectangular stainless steel tube concrete short column under axial load is localized outward buckling deformation of the specimens. The stainless steel tube was subjected to both vertical stress and hoop stress, and the hoop stress mainly came from the transverse deformation of core concrete.

3. Finite Element Analysis

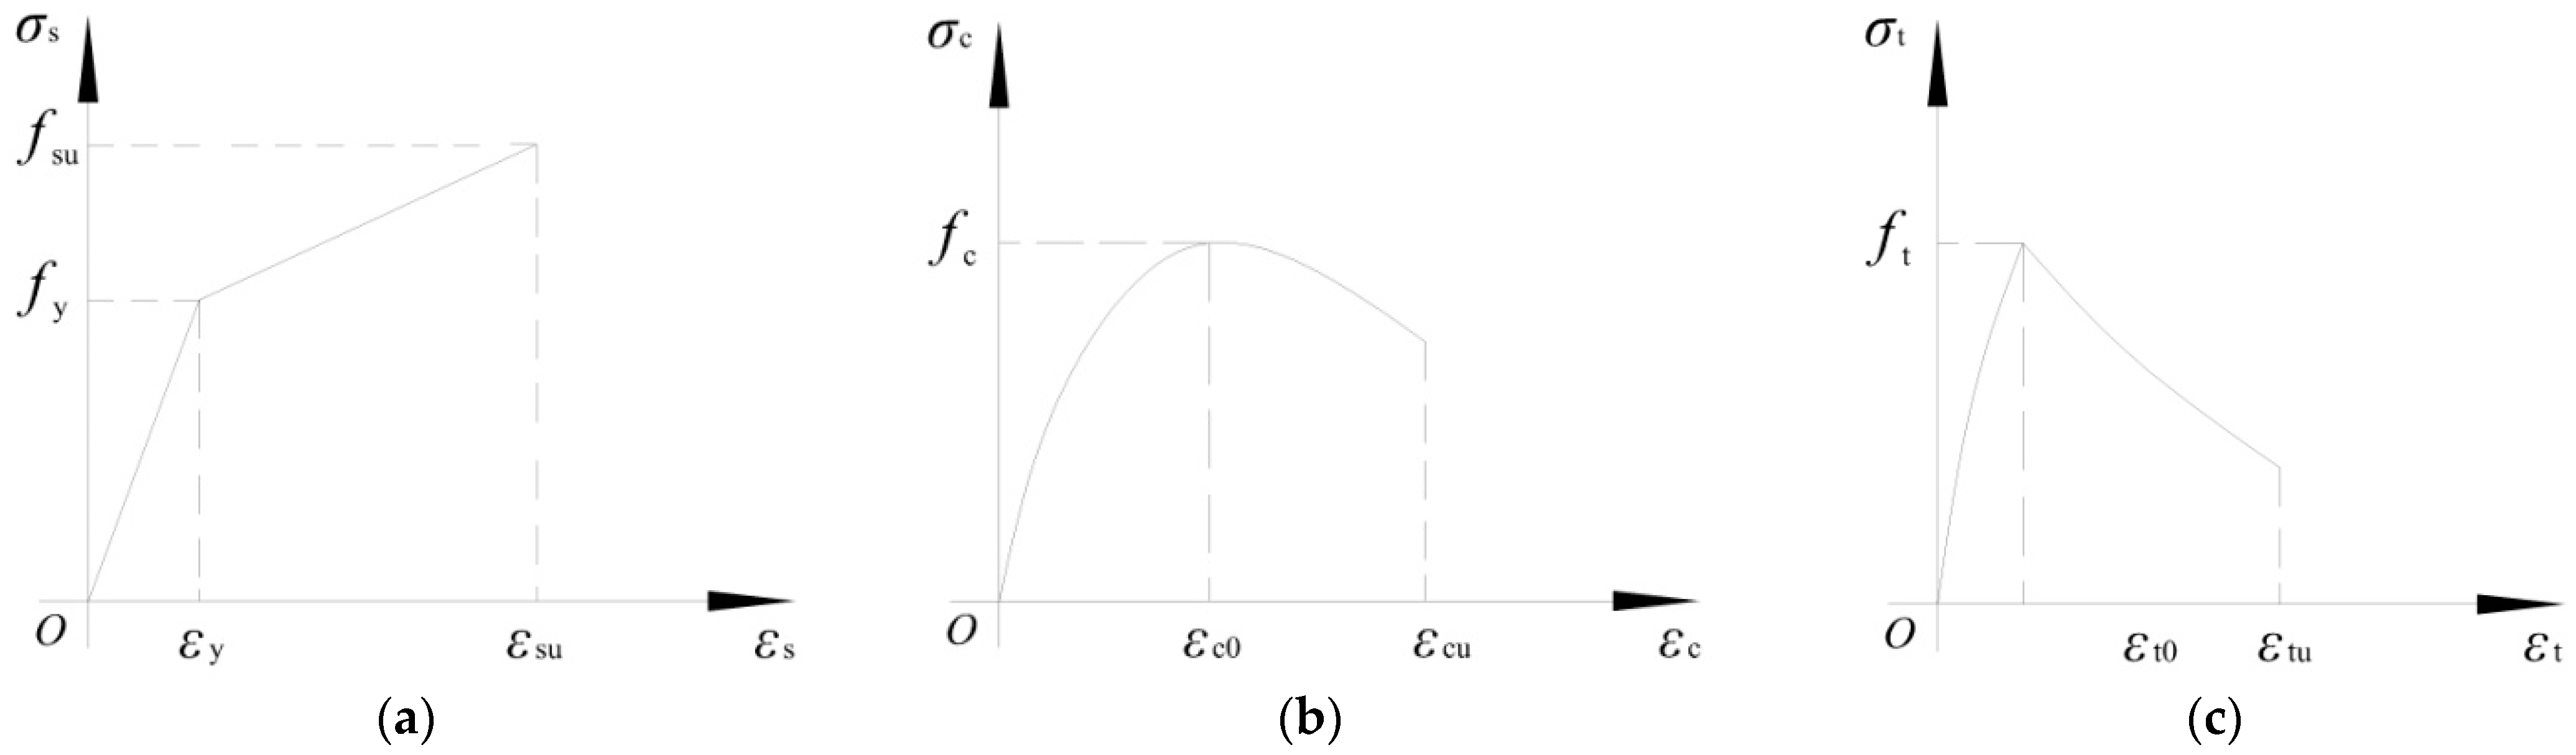
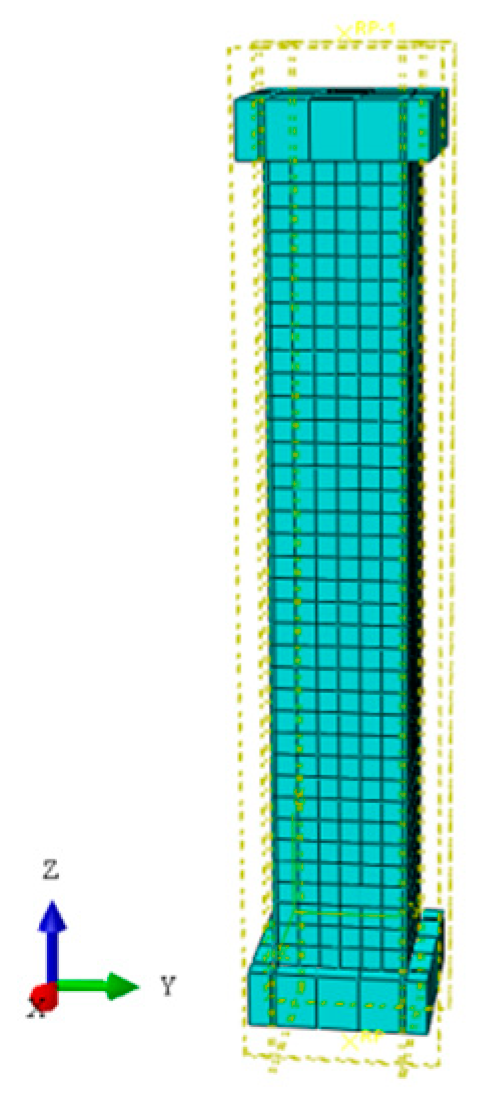
3.1. Finite Element Model

The finite element program ABAQUS was used to numerically simulate the specimens. The 3D solid element was used to simulate stainless steel tube, core concrete, and steel plate, and the type of element is C3D8I (An 8-node linear brick with incompatible modes). The plastic model was used to simulate the constitutive relation of the stainless steel tubes, and the stress-strain curve is a bi-fold line model. The concrete damage plasticity model is used to simulate the constitutive relation of the core concrete, and the compression and tensile stress-strain relation is a bi-curve model [32]. The constitutive models of stainless steel and core concrete are shown in Figure 4. The interactions between the steel plate and the main body were identified as “Tie”. Face–face interaction is used between the stainless steel tube and core concrete, and the friction coefficient is 0.25 [2]. The steel plate at each end of specimens was coupled to reference points RP1 and RP2, respectively. The freedom of longitudinal displacement was released at the reference point RP1 at the upper steel plate, and the freedoms in other directions were all constrained. All DOFs of the reference point RP2 at the lower steel plate were constrained and set to the fully constrained end. Displacement-controlled loading was used in finite element analysis. In order to ensure the calculation accuracy and reduce the computational time, the approximate mesh size of the stainless steel tube was 20 mm, and the core concrete was 15 mm. The initial imperfections and residual stress were ignored when using the finite element model to simulate the specimens [1]. The finite element model is shown in Figure 5, and the finite element model parameters are shown in Table 2.

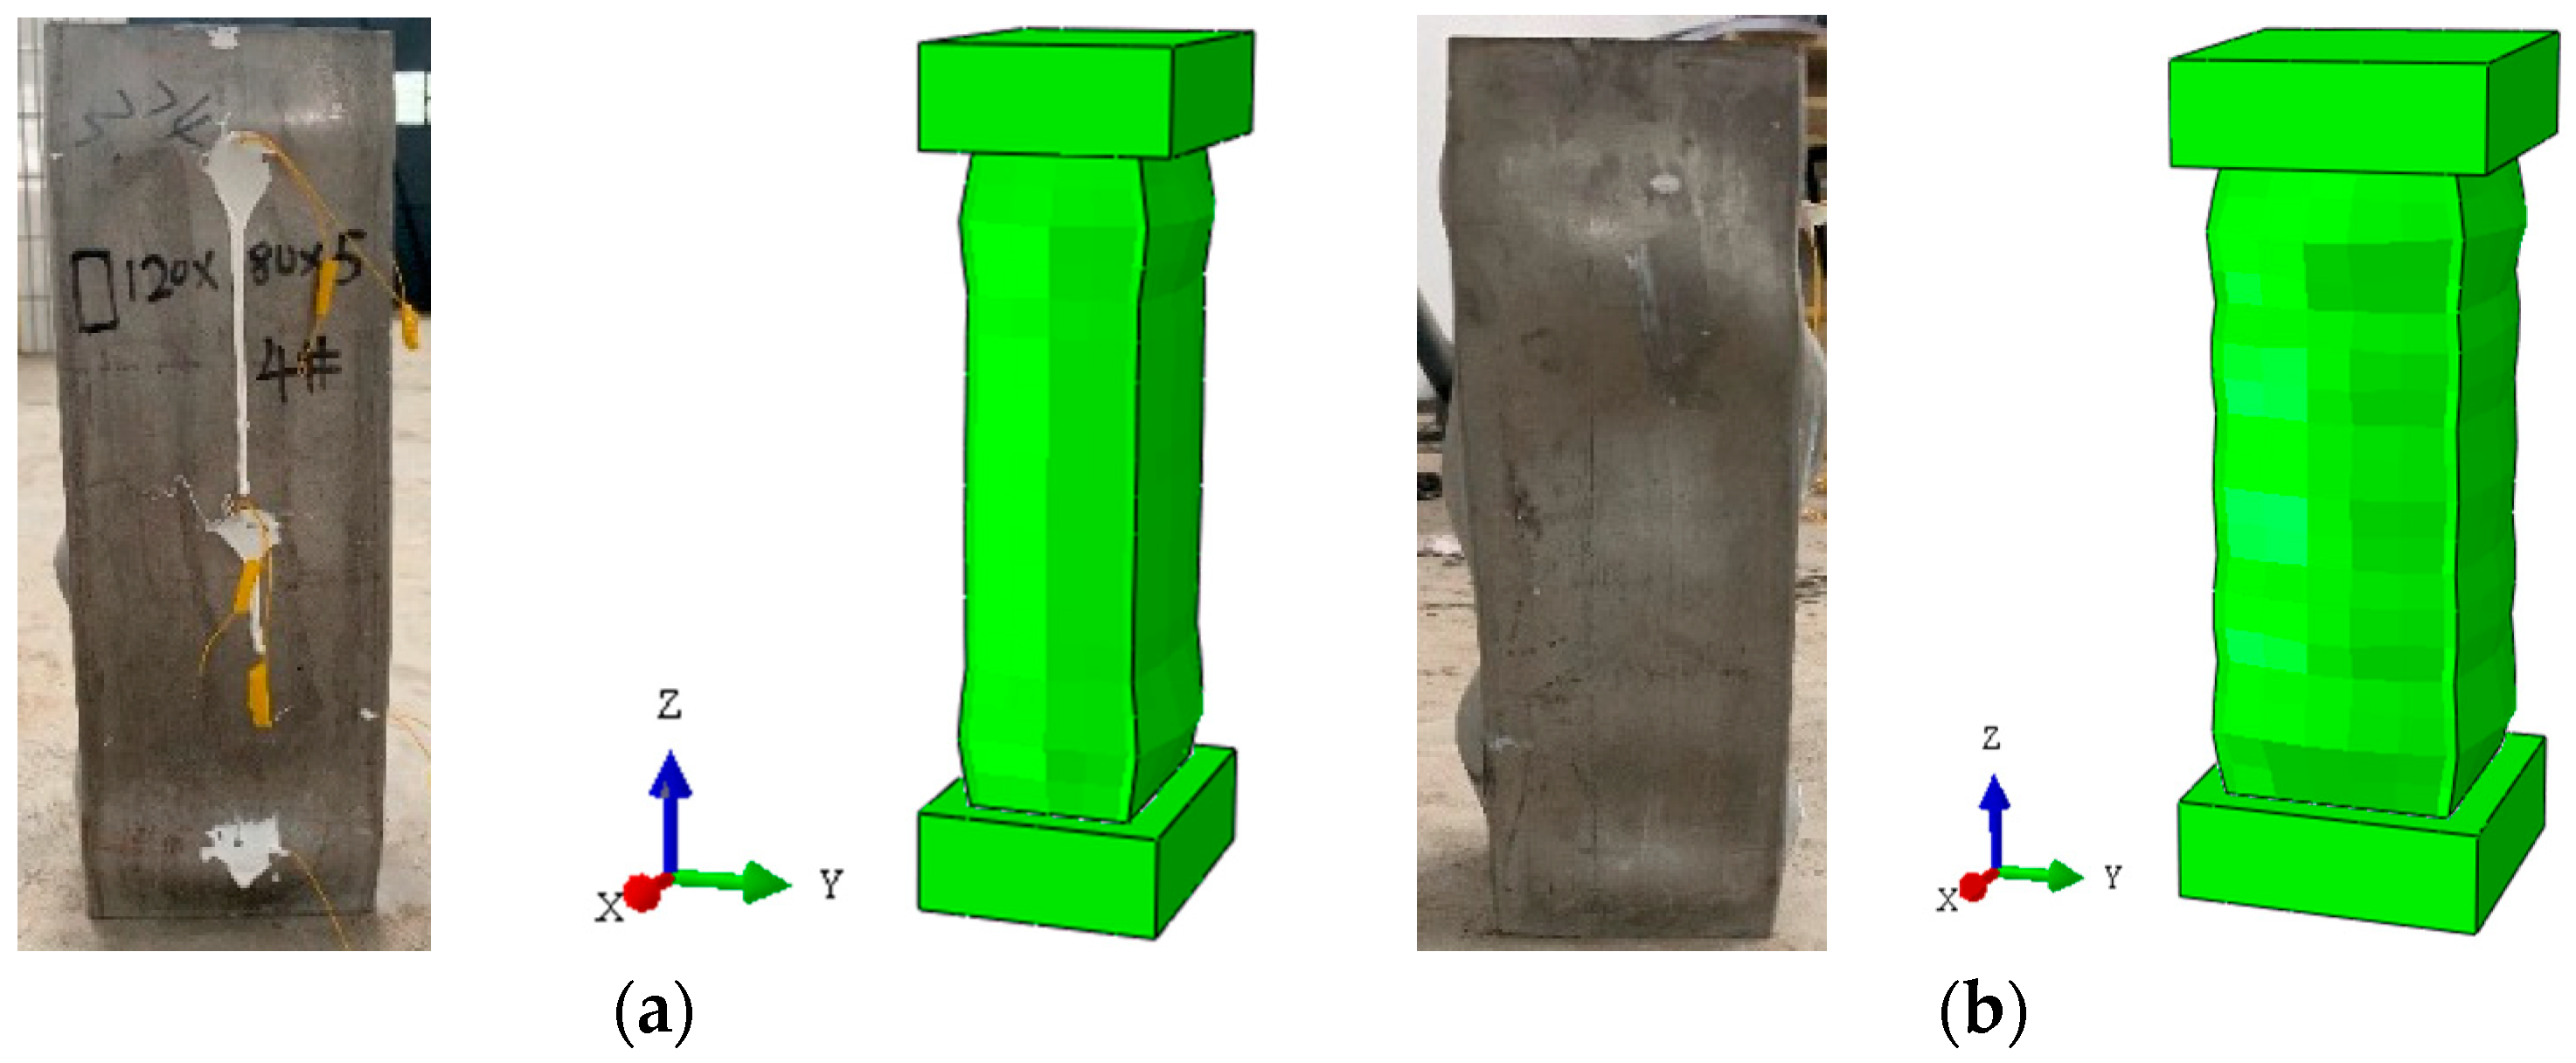
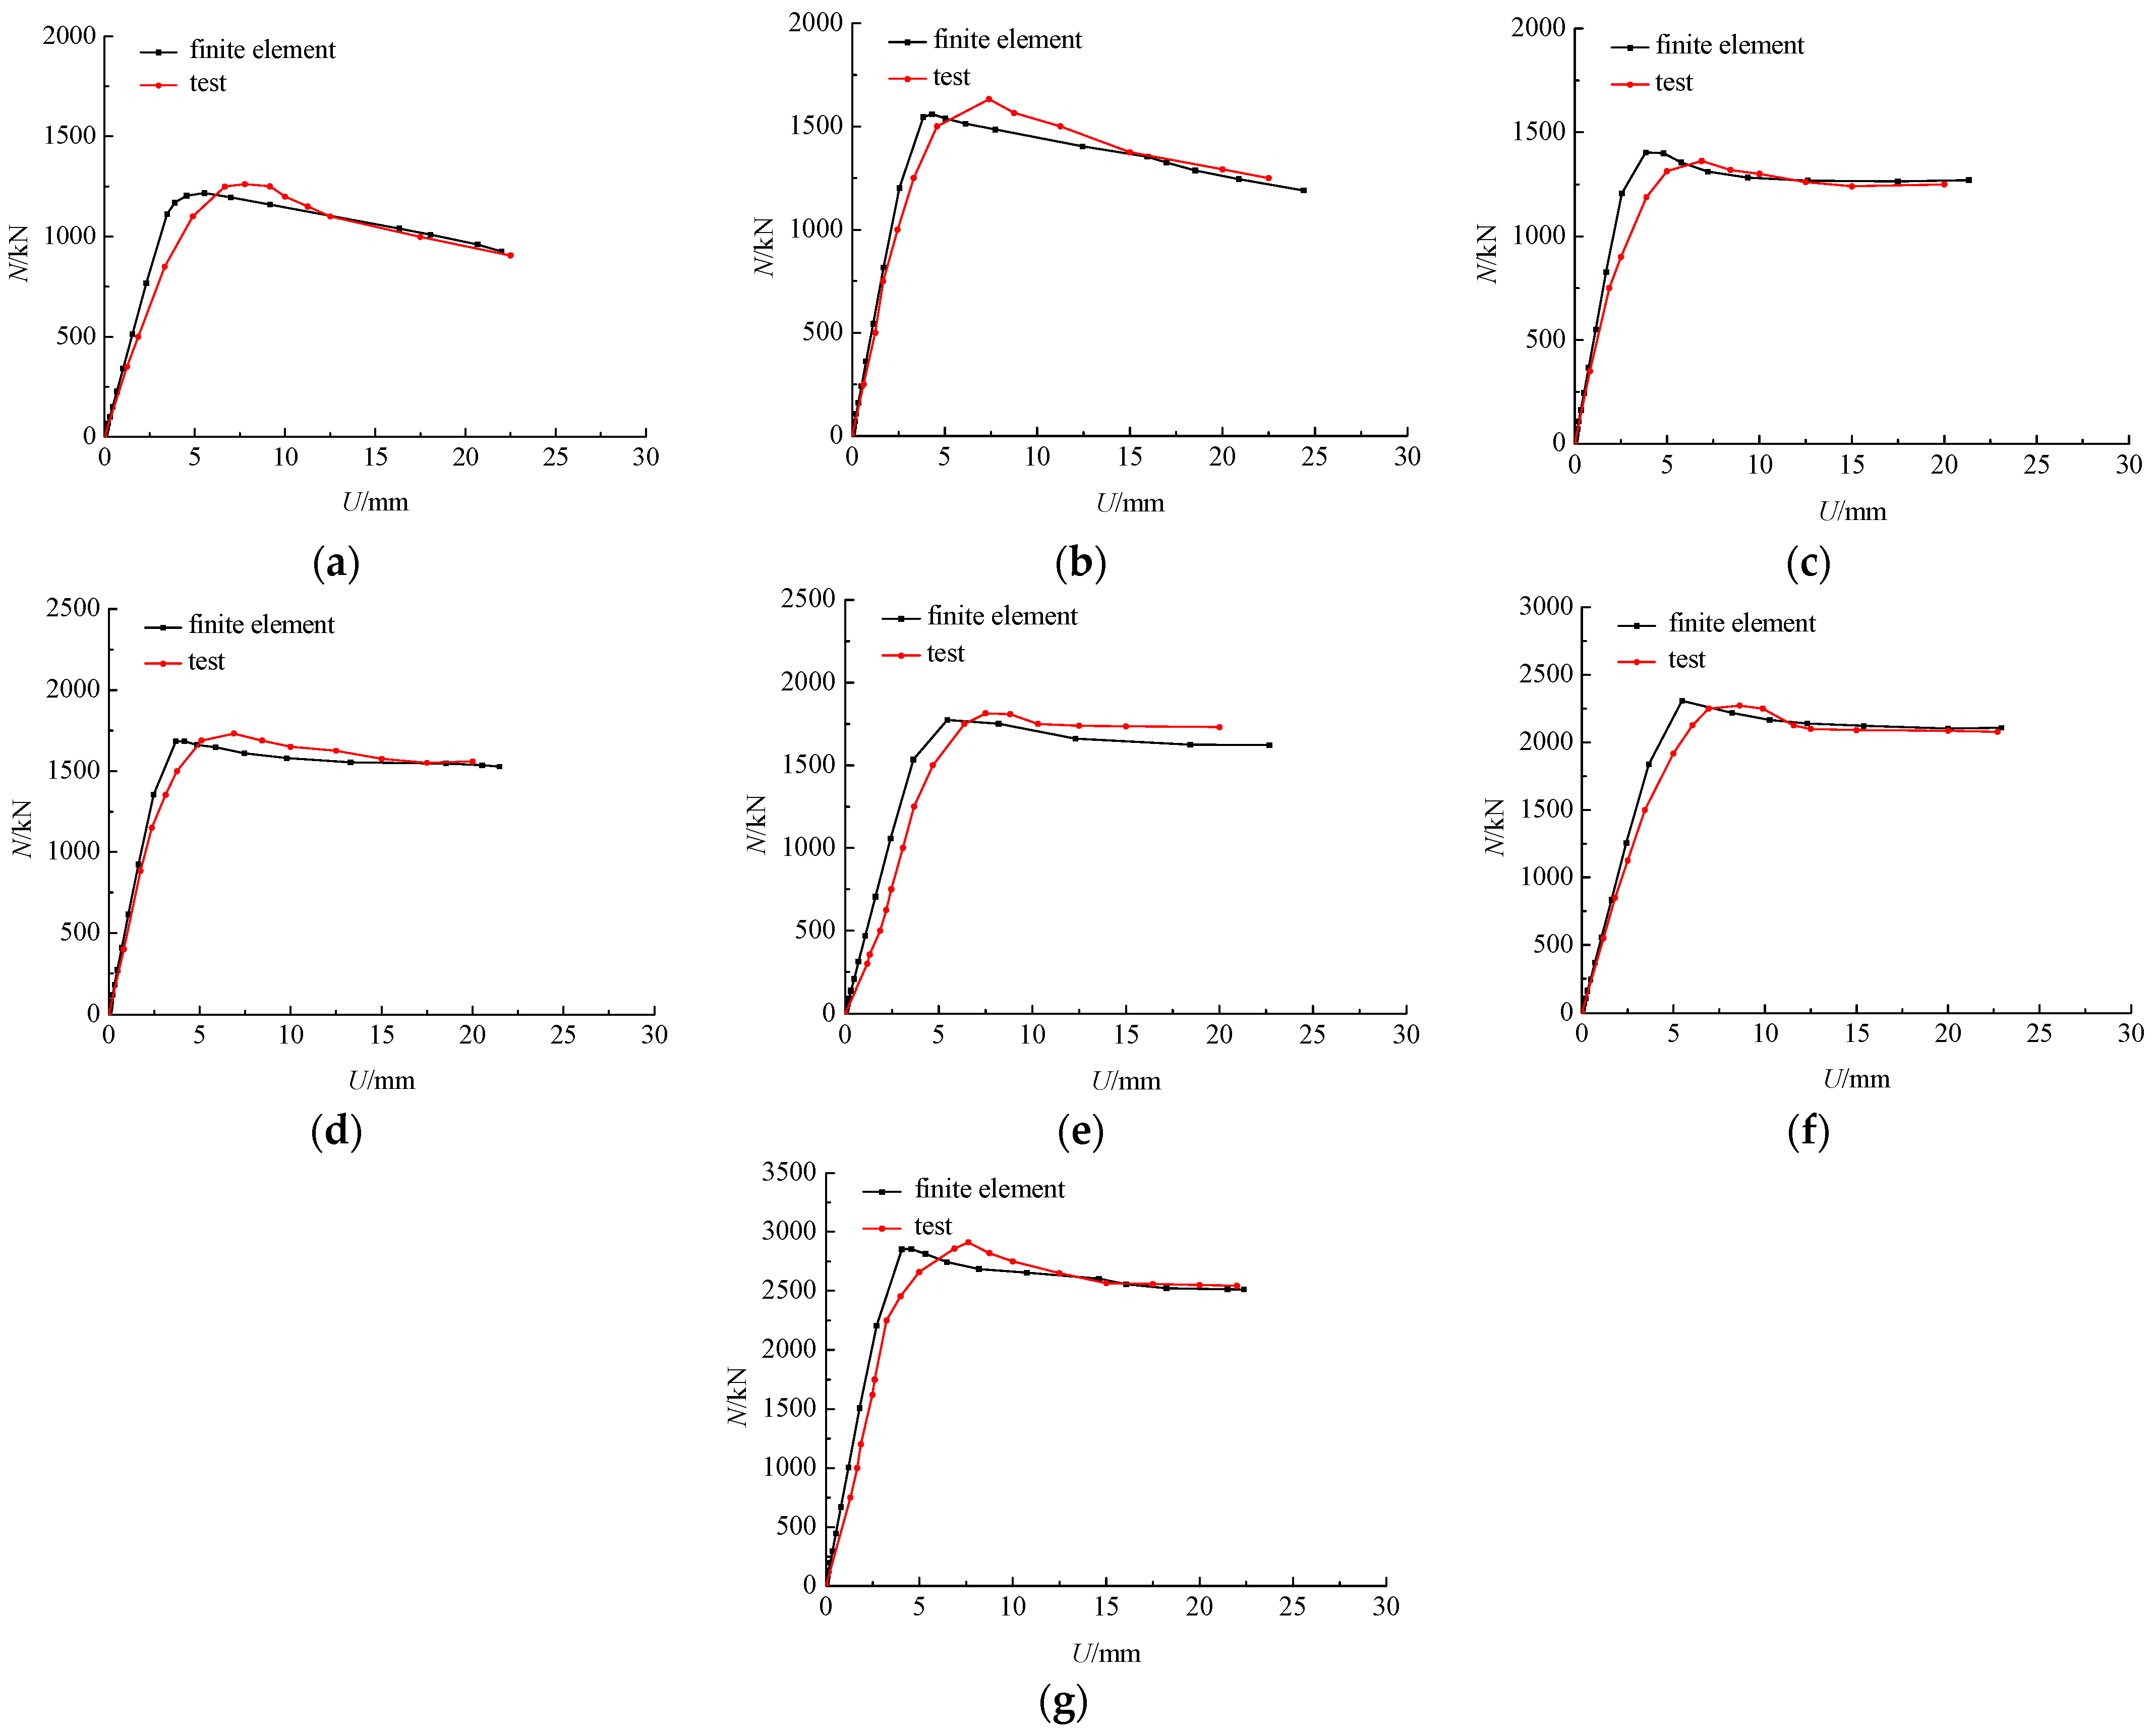
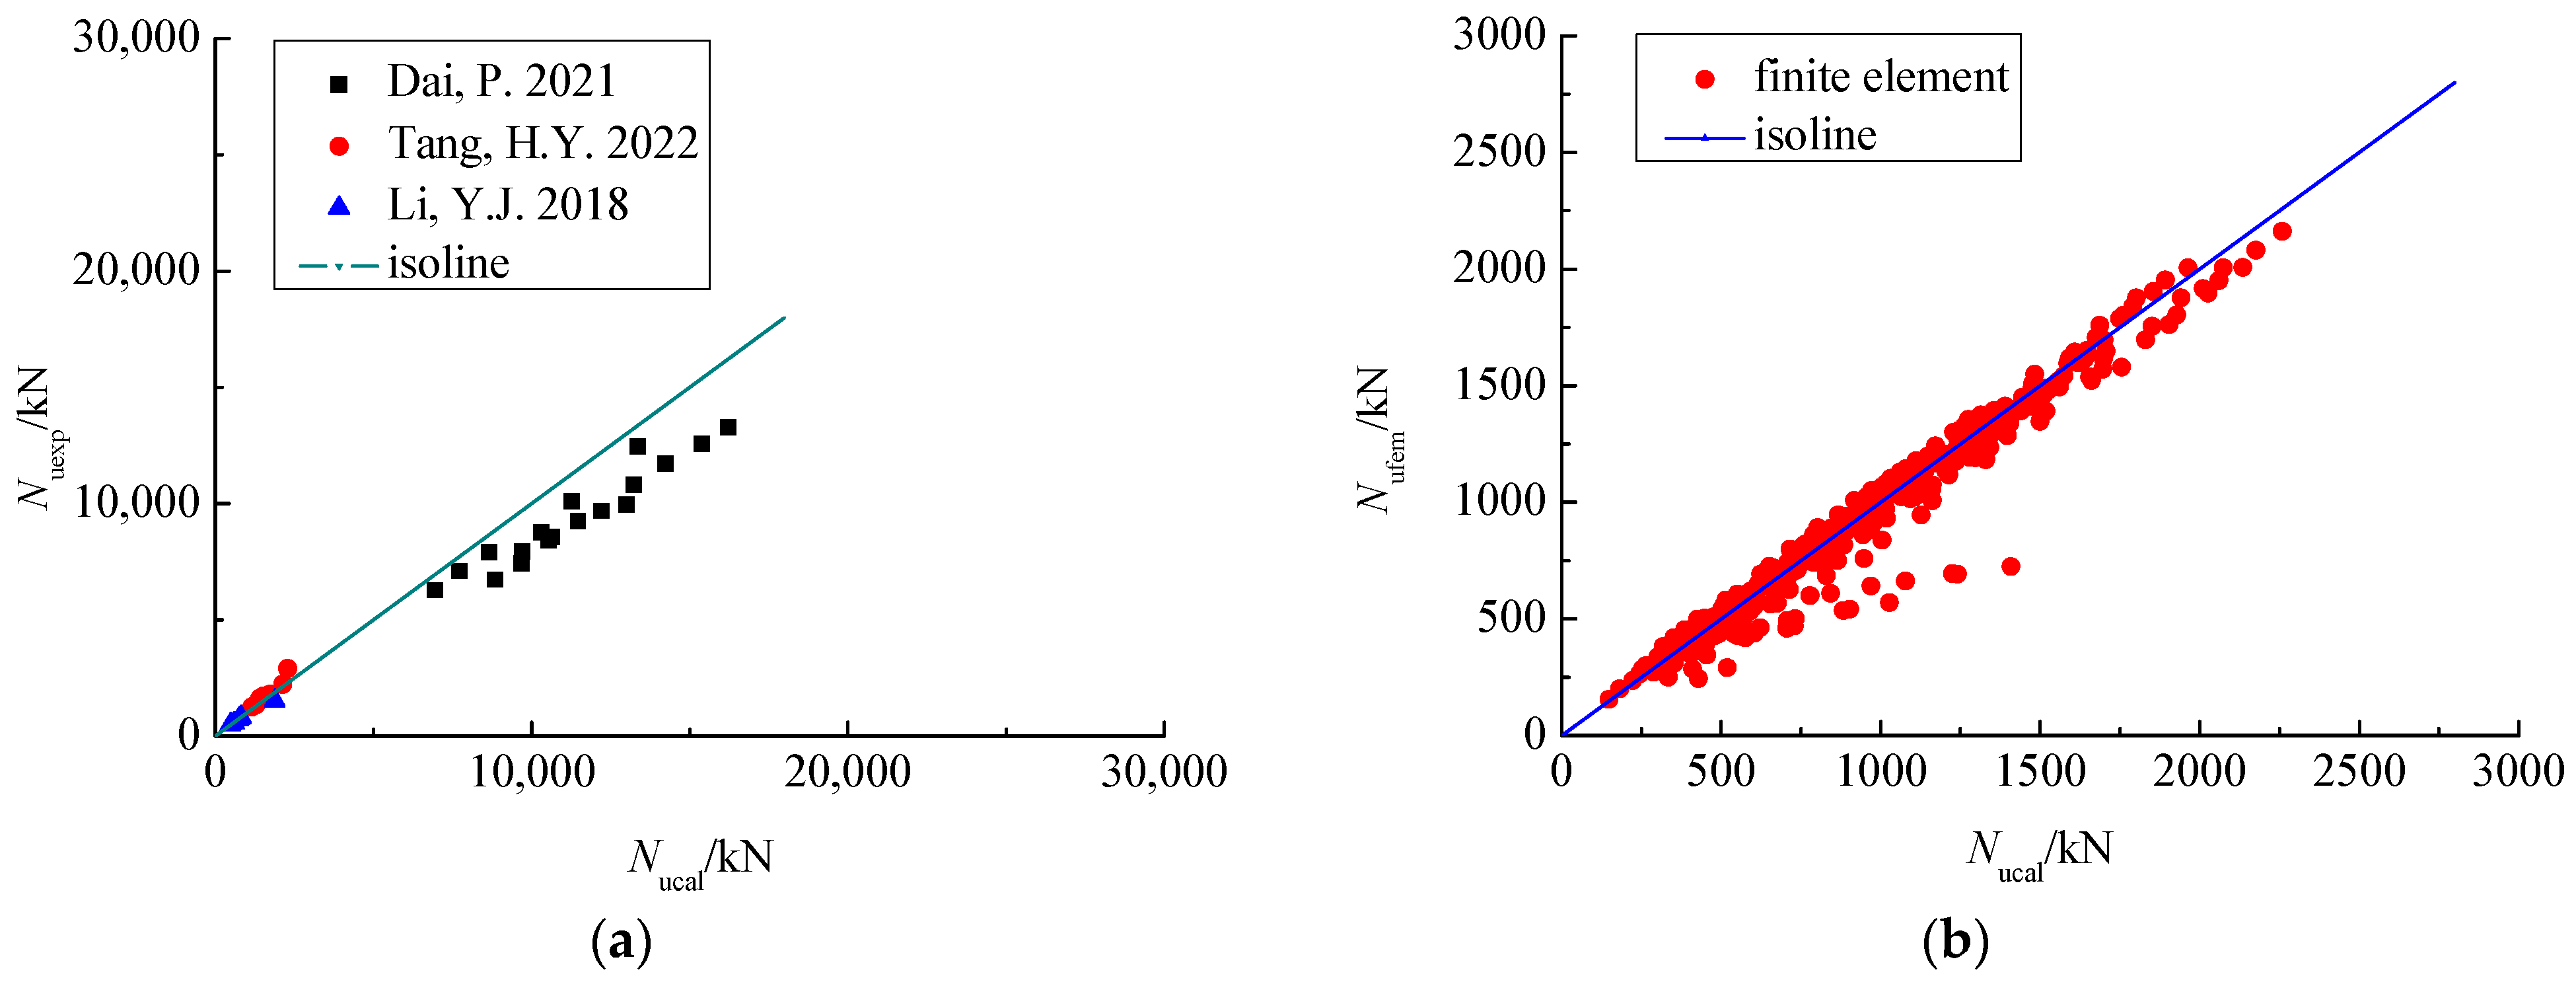
3.2. Finite Element Model Verification

In order to verify the FEM, seven test specimens in [21] were simulated, and the typical failure mode and load–displacement curves of FEM were compared with the test, which are shown in Figure 6 and Figure 7. It can be seen from Figure 6a that the ring drum appears at the upper and lower ends for rectangular specimens, which is similar to the test. It can be seen from Figure 6b that the ring drum occurs in the stainless steel tube along the length for square specimens, which is also similar to the test. It can be seen from Figure 7 that the load–displacement curves are mainly divided into a straight ascending segment, a curved ascending segment, and a curved descending segment, which are in good agreement with the test. The mean of finite element calculations Nufem to the test Nuexp is 0.985, and the variance is 0.000621. Then it also can be seen from Figure 7 that there is a variance between the displacements with peak load by the finite element method and the test, and in the straight ascending segment period, the load by FEM is always greater than the test. It is because the steel tube and concrete poured in the test specimen are uneven, the compactness of the concrete is less than that of the finite element model, and the stiffness of the finite element model is greater than that of the test specimen. Overall, it is effective to use the FEM to calculate the compression bearing capacity of concrete-filled rectangular stainless steel tubular columns.

3.3. Analysis of Finite Element Calculation

In view of the effectiveness of the above finite element model, more parameters of concrete-filled rectangular stainless steel tubular columns were considered, and 337 specimens were calculated. The main parameters are the thickness of the stainless steel tube, the relative eccentricity, and the slenderness ratio, among which the thickness of stainless steel tubes t is 4 mm~6 mm, the relative eccentricity e is 0~2.667, and the slenderness ratio λ is 3~96.

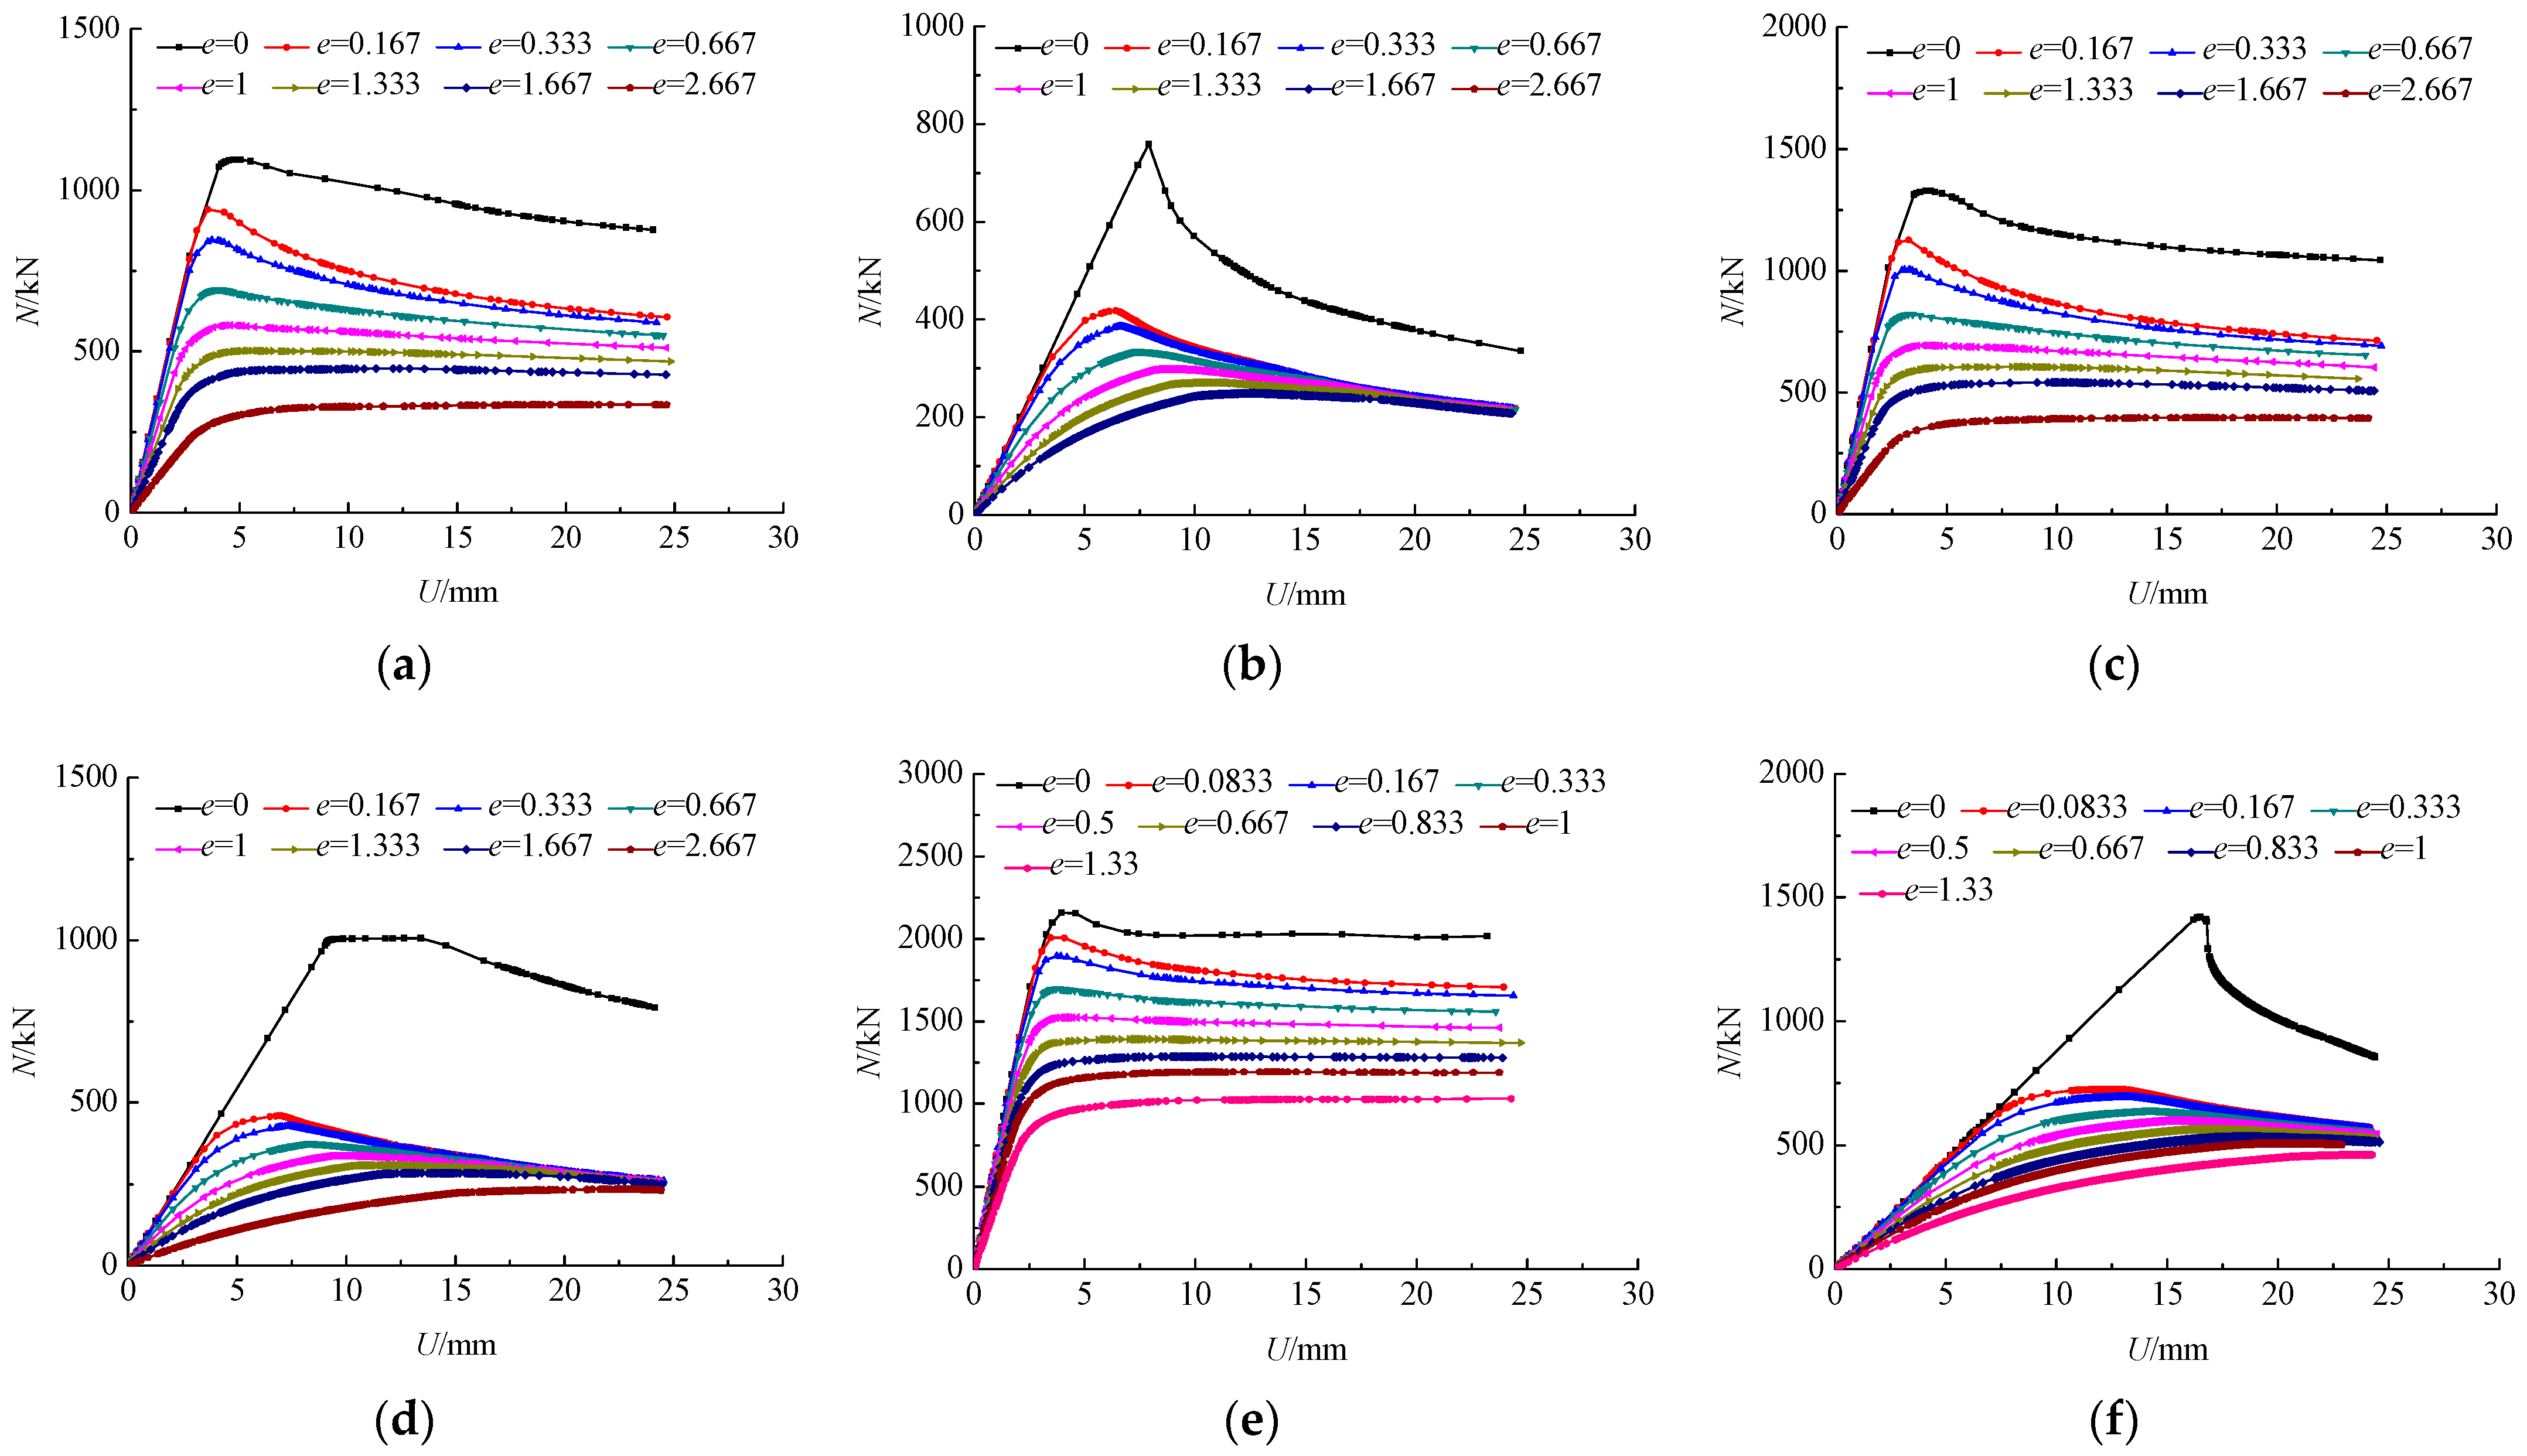
3.3.1. Analysis of Load–Displacement Curves

A comparison of the load–displacement curves subject to different parameters is shown in Figure 8, and 120604C40720 indicates that the length of the stainless steel tube a is 120 mm, the width of the stainless steel tube b is 60 mm, the thickness of steel tube t is 4 mm, the concrete strength is C40, and the length of the specimen L is 720 mm. The other parameters are similar and will not be repeated.
It can be seen from Figure 8 that when the thickness of the stainless steel tube and relative eccentricity of the specimen are the same, with an increase in the slenderness ratio, the slope of the ascending segment of the load–displacement curves gradually decreases after reaching the ultimate load, and the compression bearing capacity of specimens decreases more significantly. When the slenderness ratio is the same, with the increase in relative eccentricity, the load–displacement curves gradually change from ascending and descending segments to ascending and approximate horizontal segments. Meanwhile, with the increase in relative eccentricity, the slope of the ascending segment of the load–displacement curves is shallower. When the slenderness ratio and relative eccentricity are the same, the thickness of the stainless steel tube has little influence on the load–displacement curve. It also can be seen from Figure 8 that when the thickness of the steel tube is the same, with the increase in slenderness ratio, the displacement of the specimen is greater when the peak load is reached. When the thickness of the stainless steel tube and slenderness ratio is the same, with an increase in relative eccentricity, the displacement of the specimen is greater when the peak load is reached. When the slenderness ratio and relative eccentricity are the same, with the increase in stainless steel tube thickness, the displacement changes very little when the peak load is reached. This shows that the change in slenderness ratio and relative eccentricity have a greater influence on the change in load–displacement curves.

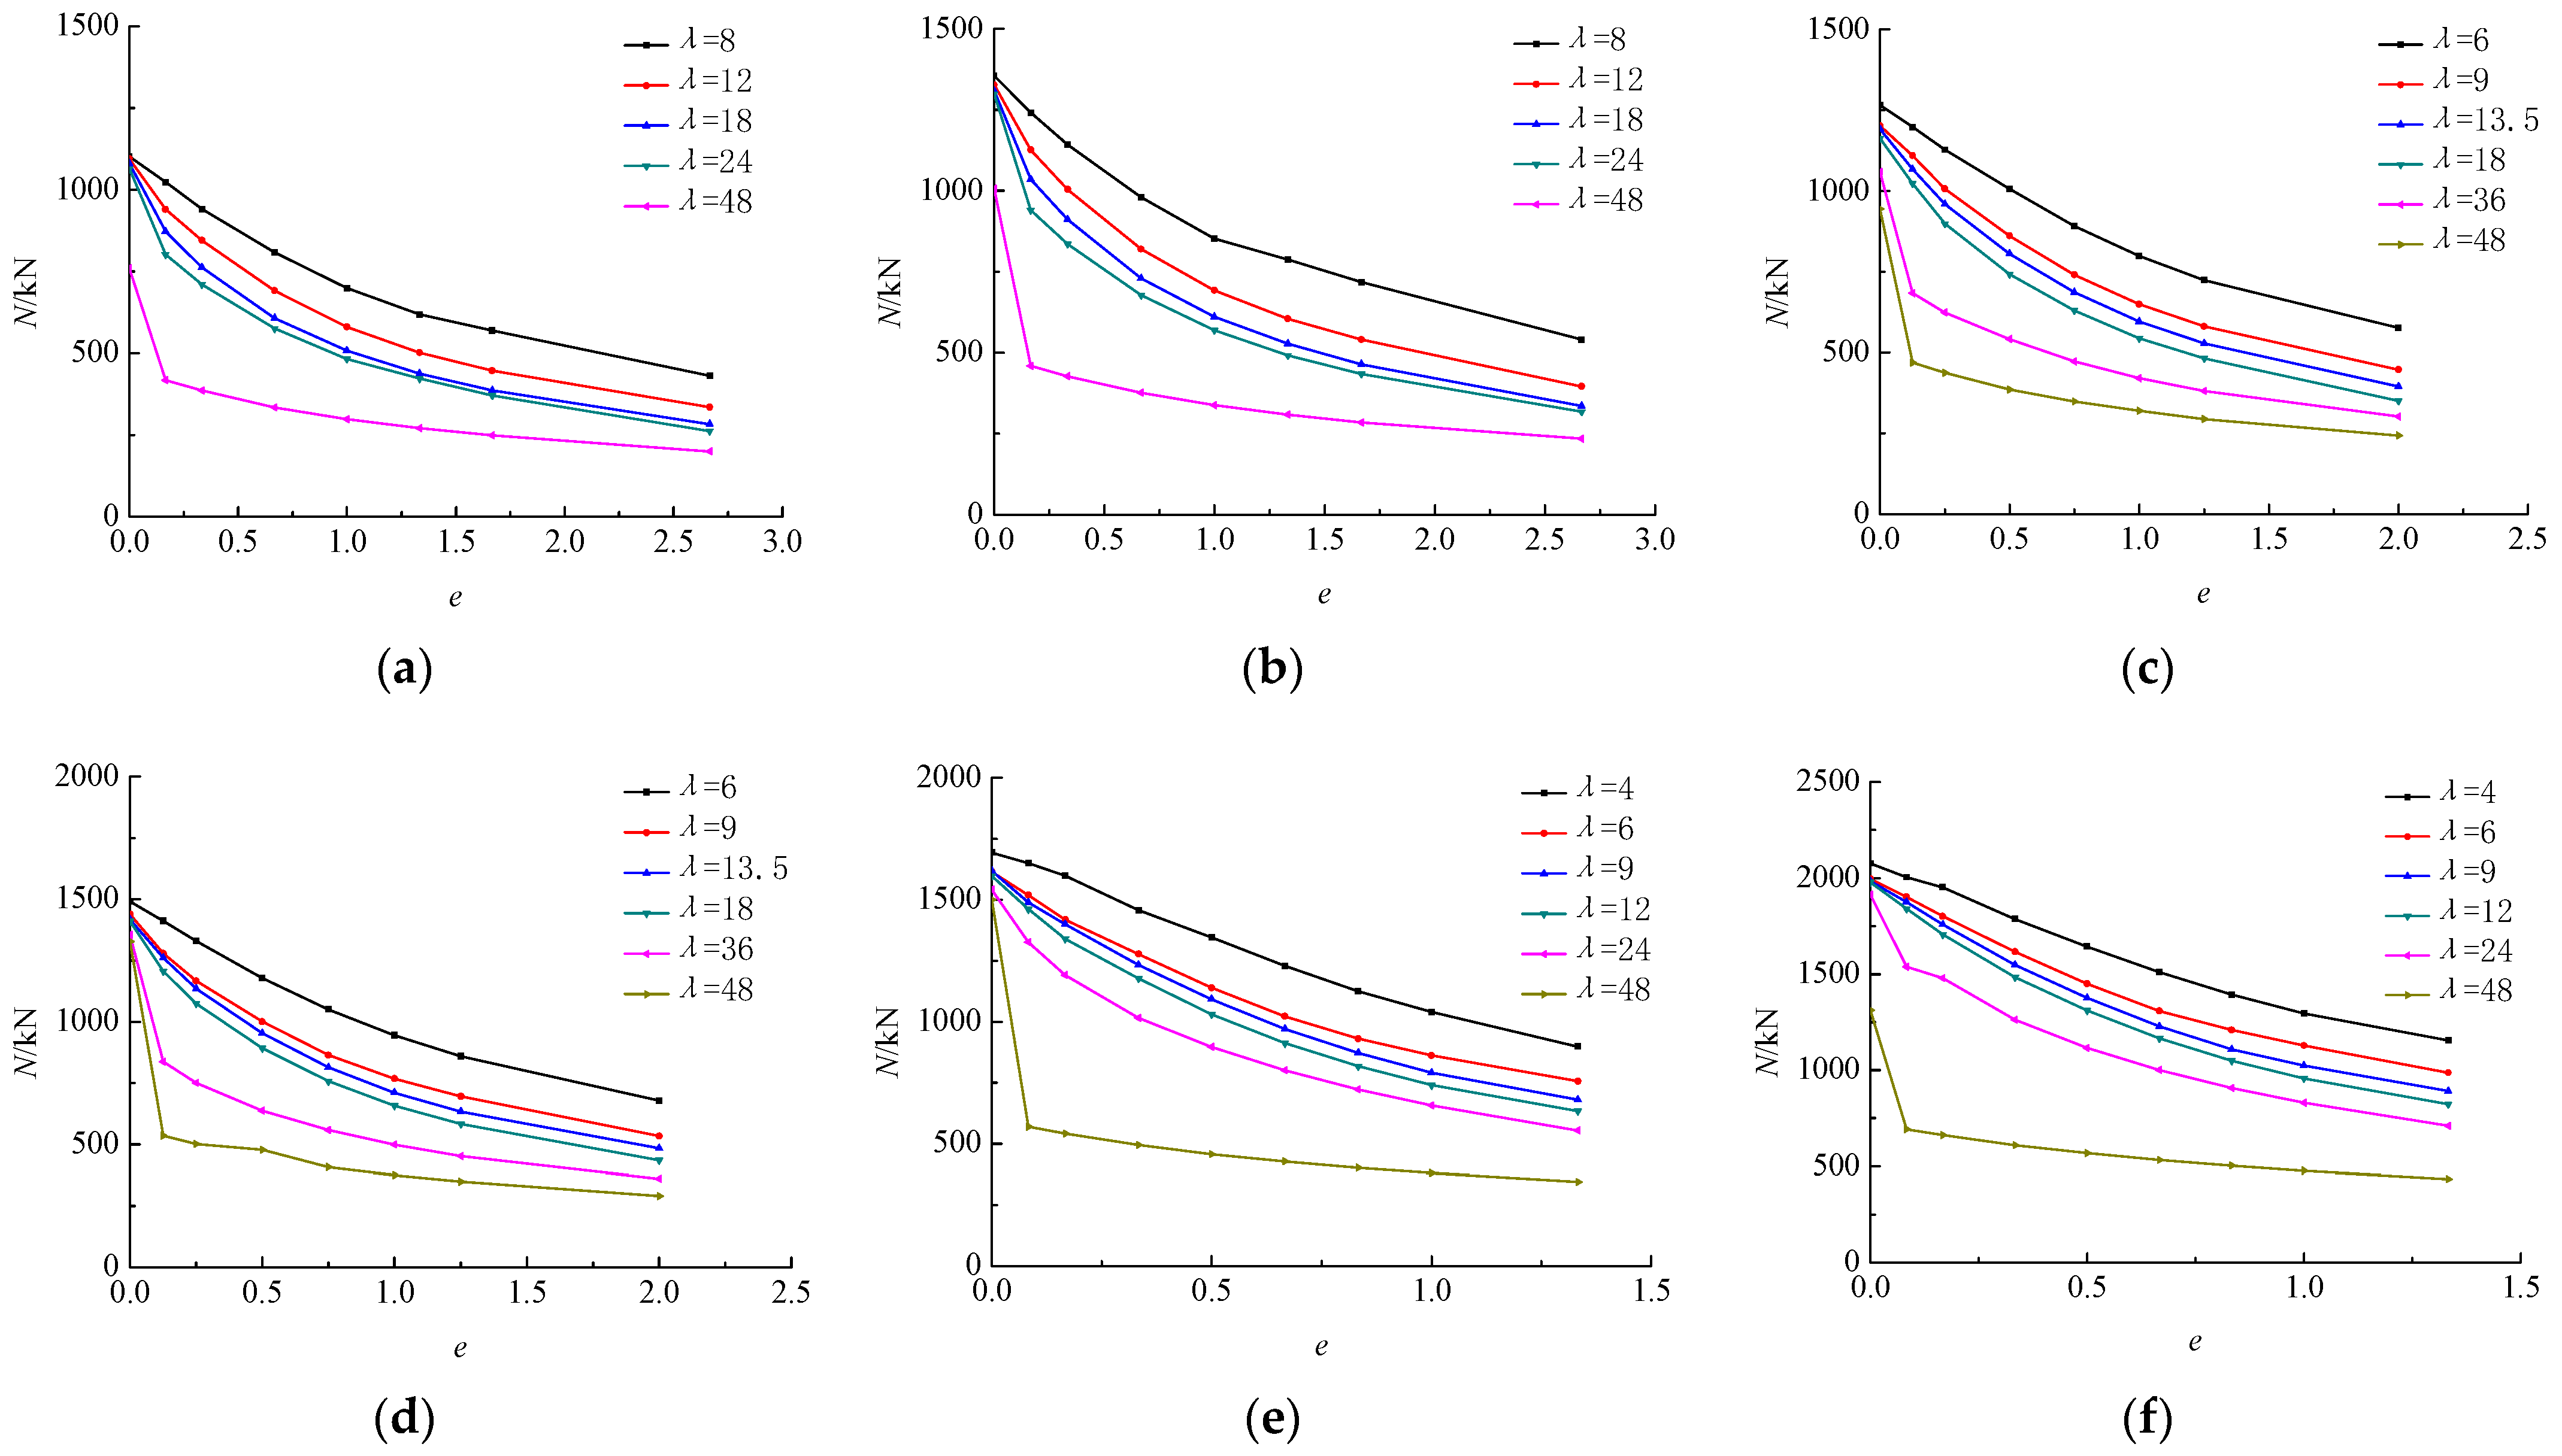
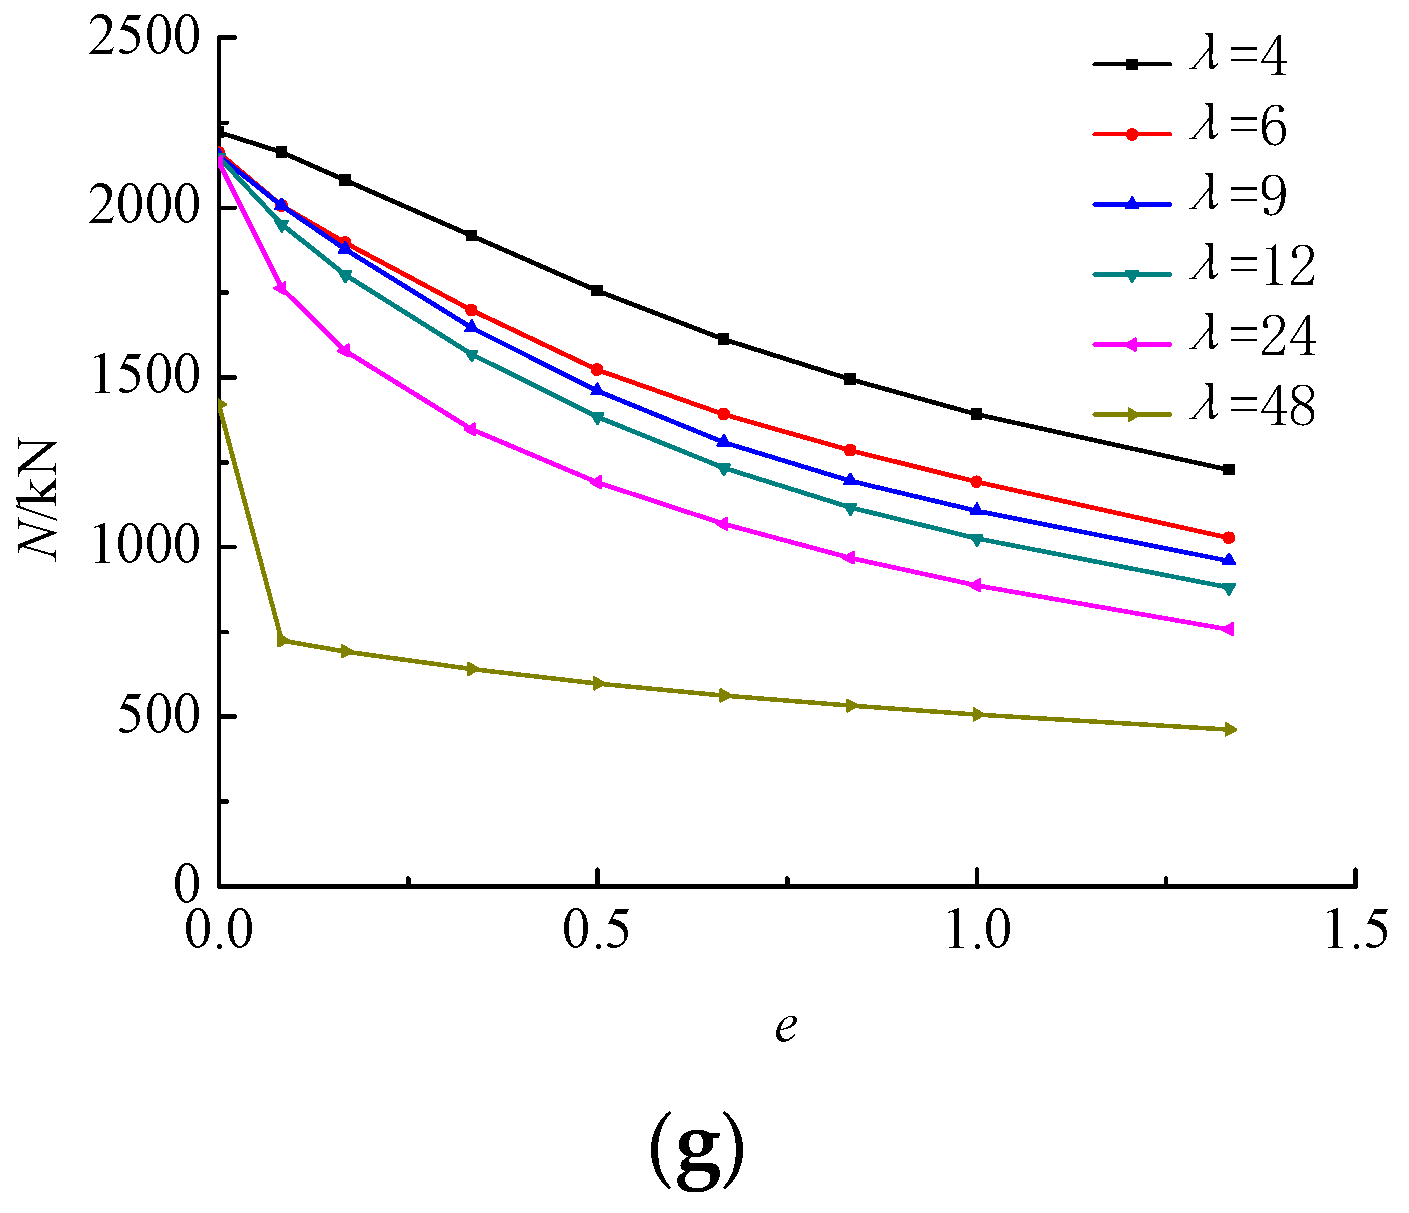
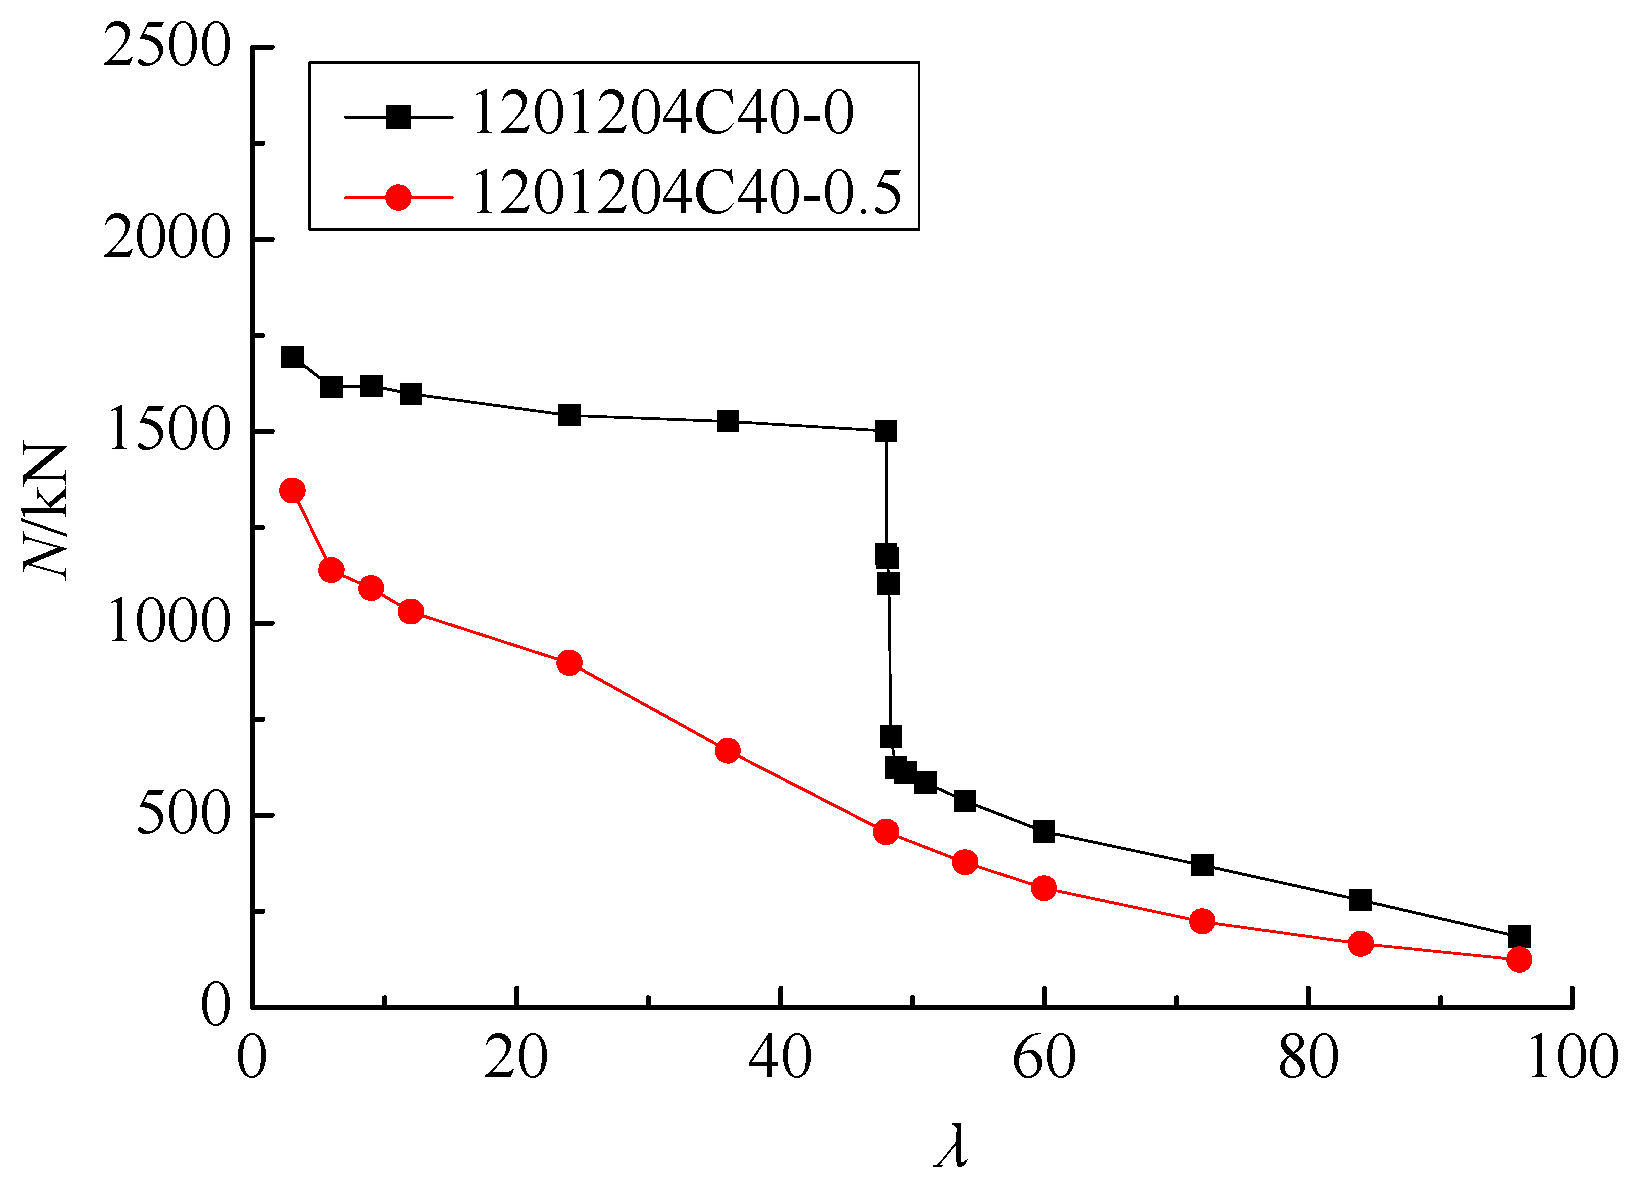
3.3.2. Analysis of Compression Bearing Capacity

A comparison of the variation of compression bearing capacity with relative eccentricity under different slenderness ratios is shown in Figure 9, and 120604C40 indicates that the length of the stainless steel tube a is 120 mm, the width of the stainless steel tube b is 60 mm, the thickness of the stainless steel tube t is 4 mm, the concrete strength is C40. The other parameters are similar and will not be repeated.
It can be seen from Figure 9a,b that when the specimen is subjected to an axial compression load, the slenderness ratio increases from 8 to 48, and the compression bearing capacity of the specimen decreases by 31.43% and 25.81%, respectively, which shows that, the greater the thickness of the stainless steel tube, the smaller the decrease in the compression bearing capacity. When the specimen is subjected to an eccentric compression load, with the increase in relative eccentricity, the compression bearing capacity shows a decreasing trend under the same slenderness ratio, and the trend is large to small. When the slenderness ratio is eight, the relative eccentricity increases from 0 to 2.67, and the compression bearing capacity decreases by 60.97% and 60.12%, respectively. When the slenderness ratio is 48, the relative eccentricity increases from 0 to 2.67, and the compression bearing capacity decreases by 73.64% and 76.69%, respectively. This indicates that the larger the slenderness ratio and the greater the relative eccentricity, the larger the decrease in the compression bearing capacity. When the relative eccentricity is the same, with the increase in the slenderness ratio, the compression bearing capacity also shows a decreasing trend gradually from large to small to large. For Figure 9a, when the relative eccentricity is one, the slenderness ratio gradually increases from 8 to 48, and the compression bearing capacity decreases by 16.95%, 12.49%, 4.99%and 38.31%, respectively. When the relative eccentricity is 0.167, 1, and 2.67, the slenderness ratio increases from 8 to 48, and the compression bearing capacity decreases by 59.16%, 57.40%, and 53.70%, respectively. For Figure 9b, when the relative eccentricity is one, the slenderness ratio gradually increases from 8 to 48, and the compression bearing capacity decreases by 18.69%, 11.80%, 6.79%, and 40.62%, respectively. When the relative eccentricity is 0.167, 1, and 2.67, the slenderness ratio increases from 8 to 48, and the compression bearing capacity decreases by 63.03%, 60.30%, and 56.63%, respectively.
Comparing Figure 9a,b, when the slenderness ratio is eight and the relative eccentricity is 0.167 and 2.67, respectively, the thickness of the stainless steel tube increases from 4 mm to 5 mm, and the compression bearing capacity increases by 21.29% and 25.11%, respectively. When the slenderness ratio is 48 and the relative eccentricity is 0.167 and 2.67, respectively, the thickness of the stainless steel tube increases from 4 mm to 5 mm, and the compression bearing capacity increases by 9.81% and 17.18%, respectively. This indicates that increasing the thickness of the stainless steel tube is more effective at improving the compression bearing capacity at a larger relative eccentricity. When the relative eccentricity is the same, the smaller the slenderness ratio, the more effective the increase in the thickness of the stainless steel tube is in improving the compression bearing capacity. The thickness of the stainless steel tube has little influence on the variation trend of compression bearing capacity with relative eccentricity under the same slenderness ratio.
It can be seen from Figure 9c,d that when the width of the stainless steel tube b is 80 mm, the variation of the compression bearing capacity with relative eccentricity under different slenderness ratios is similar to that in Figure 8a,b. When the slenderness ratio is six, the relative eccentricity increases from 0 to 2, and the compression bearing capacity decreases by 54.46% and 54.56%, respectively. When the slenderness ratio is 48, the relative eccentricity increases from 0 to 2, and the compression bearing capacity decreases by 74.25% and 78.15%, respectively. Comparing Figure 8c,d, when the slenderness ratio is six and the relative eccentricity is one, the thickness of the stainless steel tube increases from 4 mm to 5 mm, and the compression bearing capacity increases by 18.18%. When the slenderness ratio is 48 and the relative eccentricity is one, the thickness of the stainless steel tube increases from 4 mm to 5 mm, and the compression bearing capacity increases by 17.44%.
It can be seen from Figure 9e–g that when the width of the stainless steel tube b is 120 mm, the decreasing trend of the compression bearing capacity is reduced; the smaller the slenderness ratio, the smaller the decreasing trend, and the variation is similar to the above. When the slenderness ratio is four, the relative eccentricity increases from 0 to 1.33, and the compression bearing capacity decreases by 47.04%, 44.40%, and 44.78%, respectively. When the slenderness ratio is 48, the relative eccentricity increases from 0 to 1.33, and the compression bearing capacity decreases by 77.06%, 66.90%, and 67.47%, respectively. When the relative eccentricity is 0, the slenderness ratio increases from 4 to 48, and the compression bearing capacity decreases by 11.42%, 36.73%, and 36.08%, respectively. When the relative eccentricity is 1.33, the slenderness ratio increases from 4 to 48, and the compression bearing capacity decreases by 61.64%, 62.33%, and 62.34%, respectively. Comparing Figure 8e–g, when the slenderness ratio is four and the relative eccentricity is one, the thickness of the stainless steel tube increases from 4 mm to 5 mm and then from 5 mm to 6 mm, and the compression bearing capacity increases by 24.61% and 7.41%, respectively. When the slenderness ratio is 48 and the relative eccentricity is one, the thickness of the steel tube increases from 4 mm to 5 mm and then from 5 mm to 6 mm, and the compression bearing capacity increases by 25.56% and 6.05%, respectively.
The variation of compression bearing capacity with slenderness ratio under axial compression load and eccentric axial compression load is shown in Figure 10, and 1201204C40-0 indicates that the length of the stainless steel tube a is 120 mm, the width of the stainless steel tube b is 120 mm, the thickness of the stainless steel tube t is 4 mm, the concrete strength is C40, the relative eccentricity e is 0. It can be seen from Figure 10 that the variation of compression bearing capacity with the slenderness ratio under axial compression load is divided into three stages: a shallow slope descent, a steep slope (nearly vertical) descent, and moderate slope descent. When the slenderness ratio is lower than 48, with the increase in slenderness ratio, the compression bearing capacity is reduced to a certain extent, and the reduction trend is relatively gentle. When the slenderness ratio increases from 4 to 48, the compression bearing capacity decreases by 11.42%. When the slenderness ratio exceeds 48, with the increase in slenderness ratio, the compression bearing capacity is greatly reduced; when the slenderness ratio increases from 48 to 48.375, the reduction in the compression bearing capacity reaches 52.97%. When the slenderness ratio exceeds 48.375, with the increase in slenderness ratio, the decreasing trend of compression bearing capacity increases compared with the first stage, and the decreasing trend of the compression bearing capacity decreases significantly compared with the second stage. When the slenderness ratio increases from 48.375 to 96, the compression bearing capacity is reduced by 78.19%. It can also be seen from Figure 10 that the variation of compression bearing capacity with the slenderness ratio under eccentric compression load is obviously different from that under axial compression load. It has only one stage: moderate slope descent. Those show that, with the increase in the slenderness ratio, the failure model of the specimen gradually changes from plastic failure to elastoplastic failure and then elastic failure.

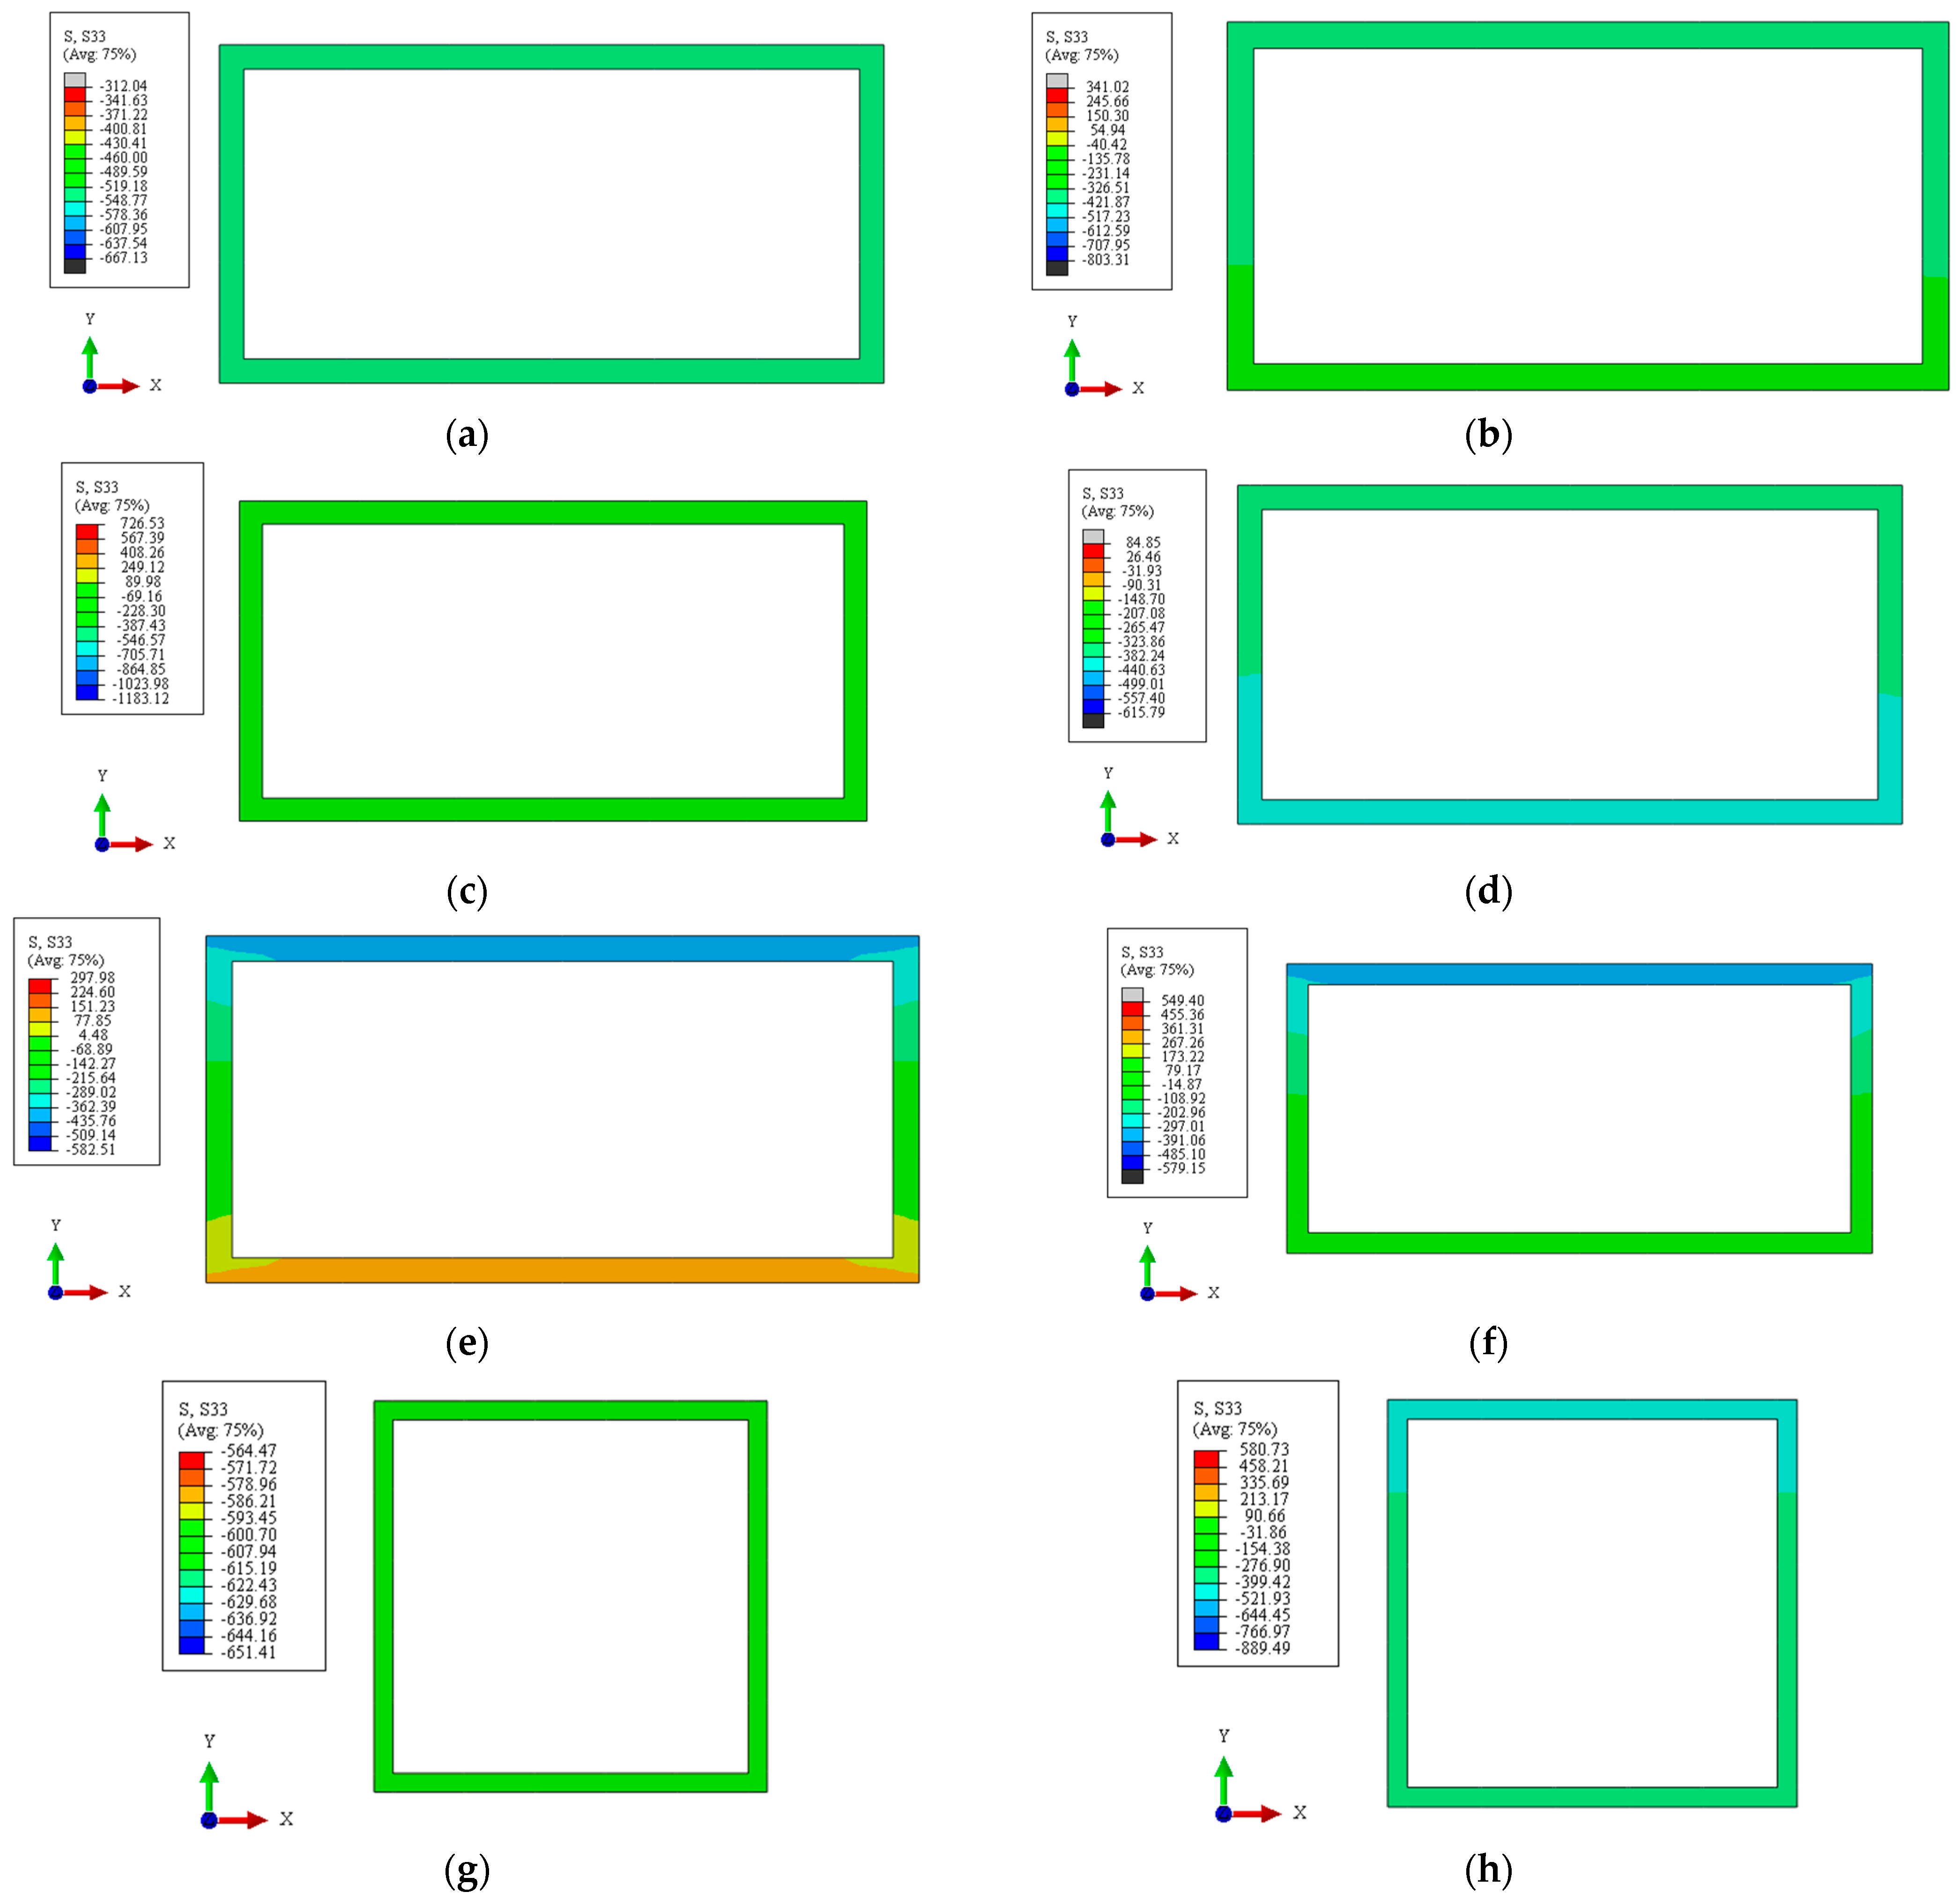
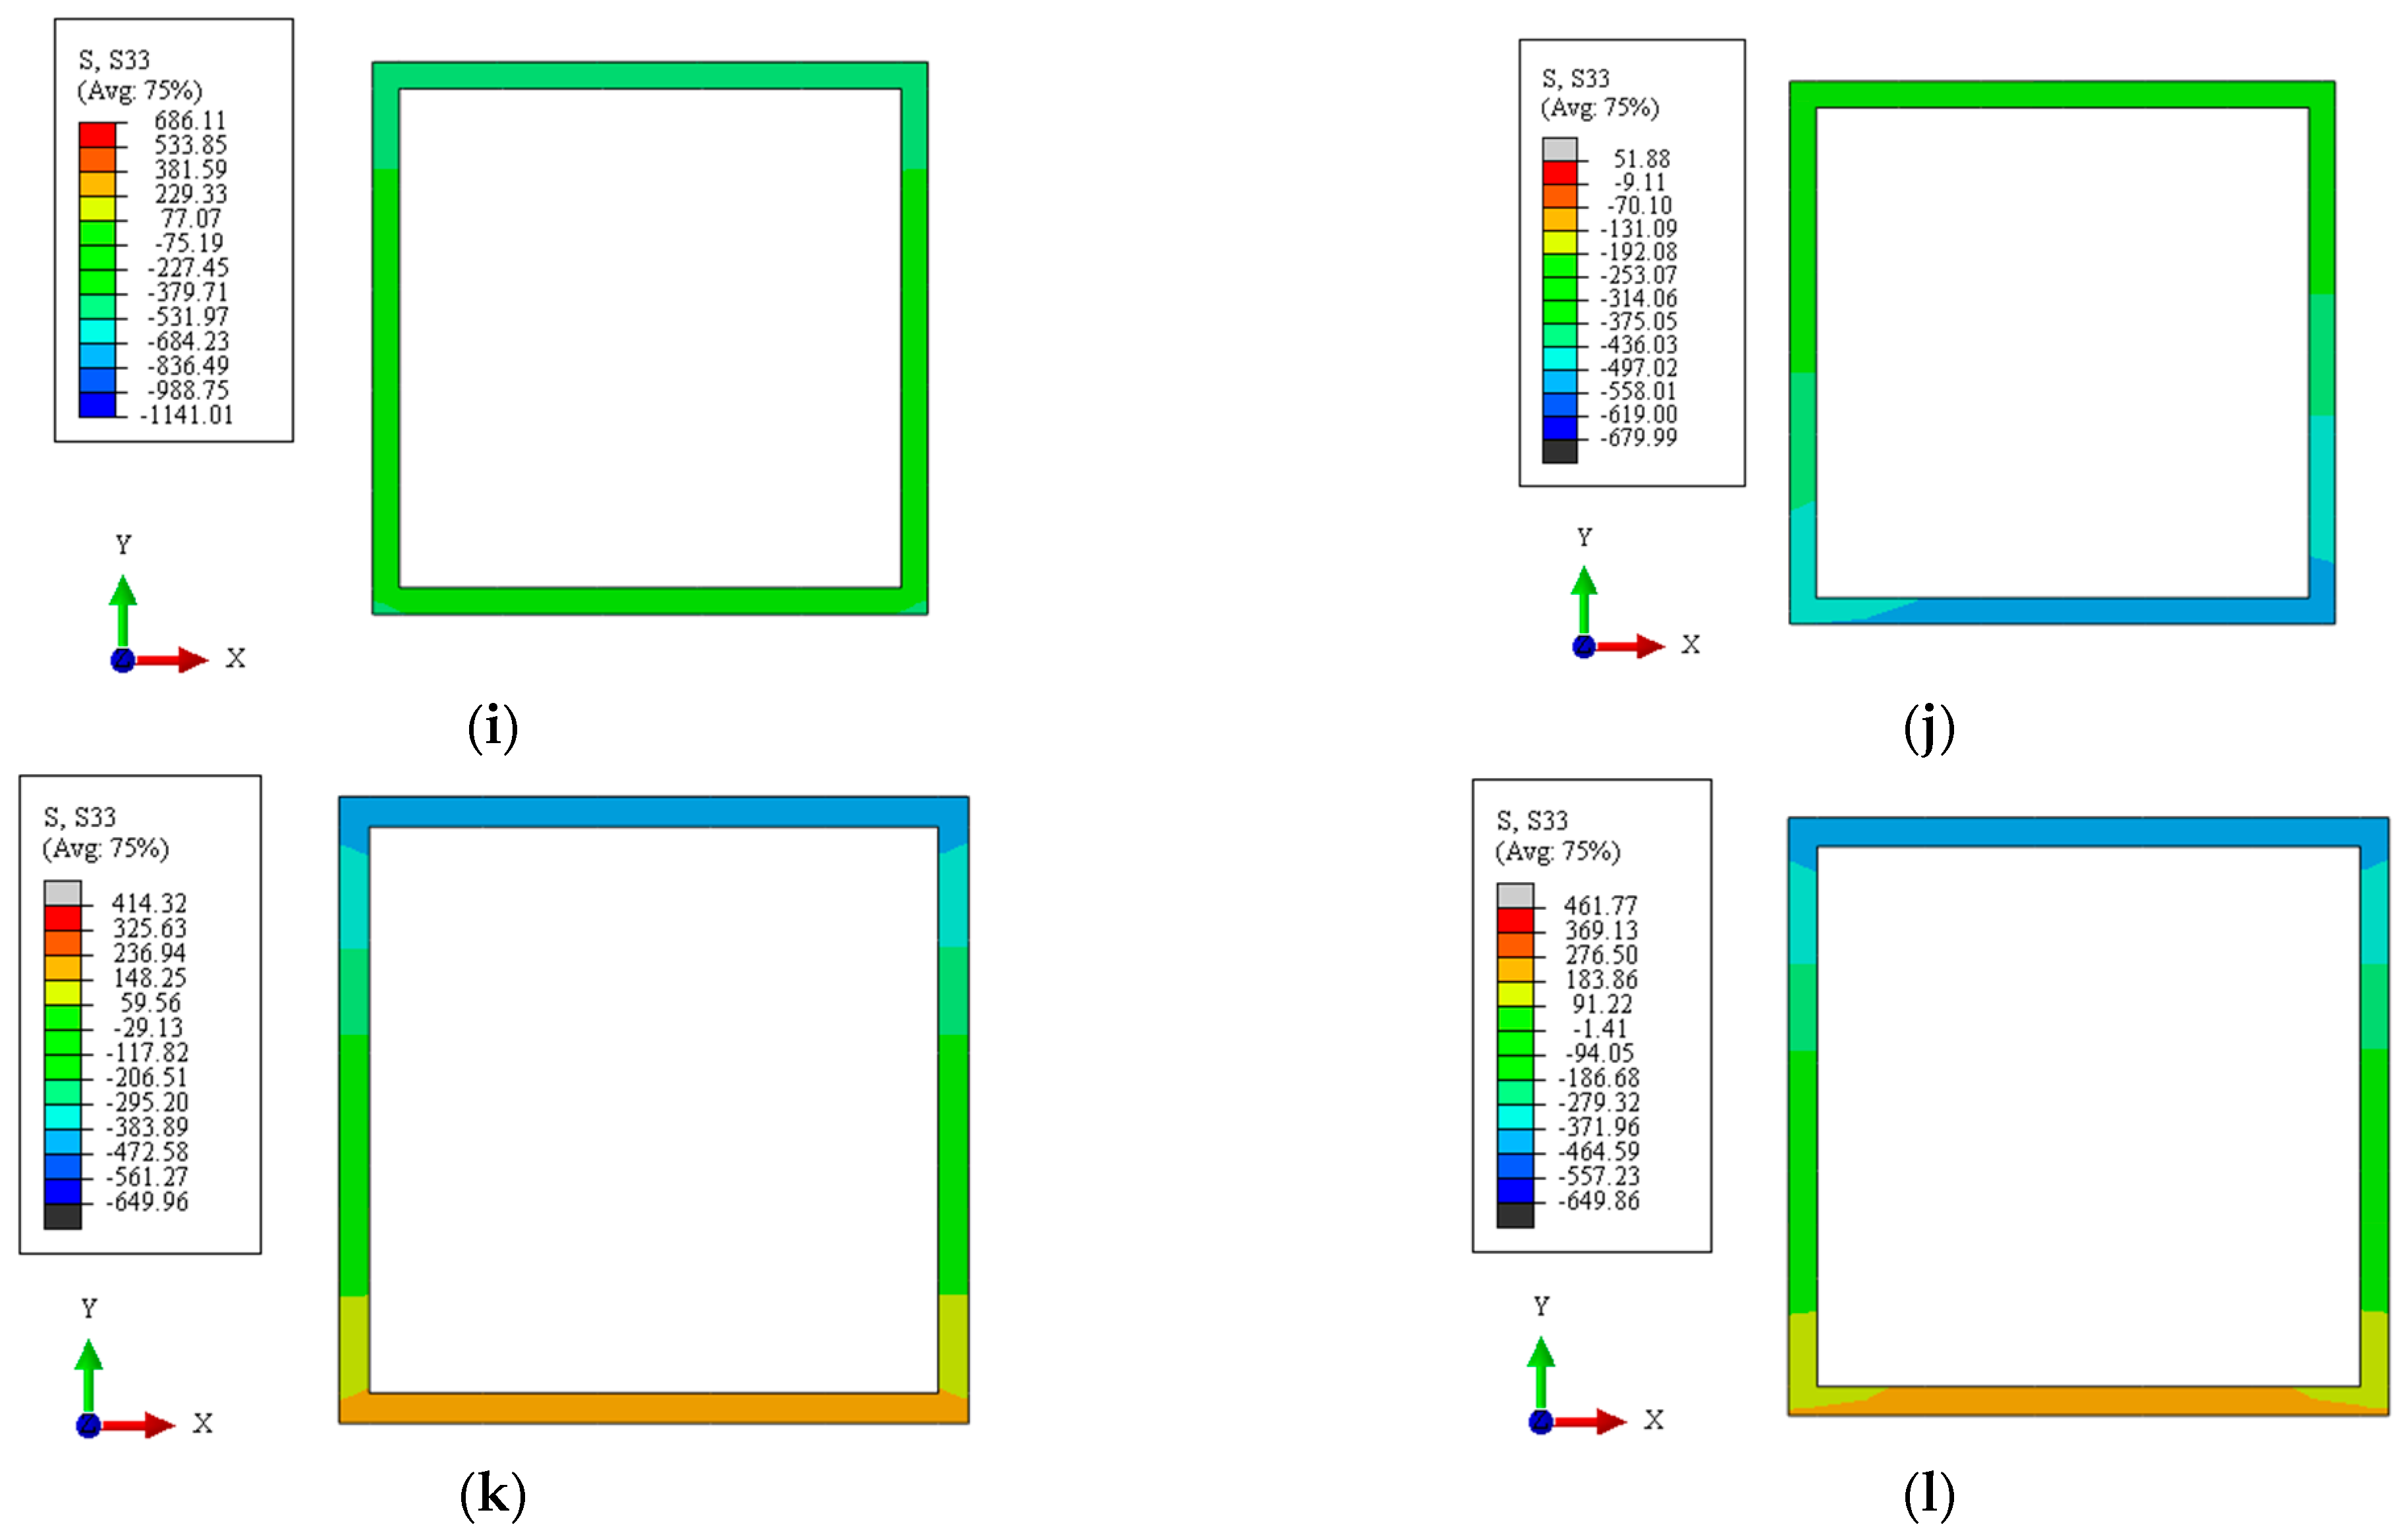
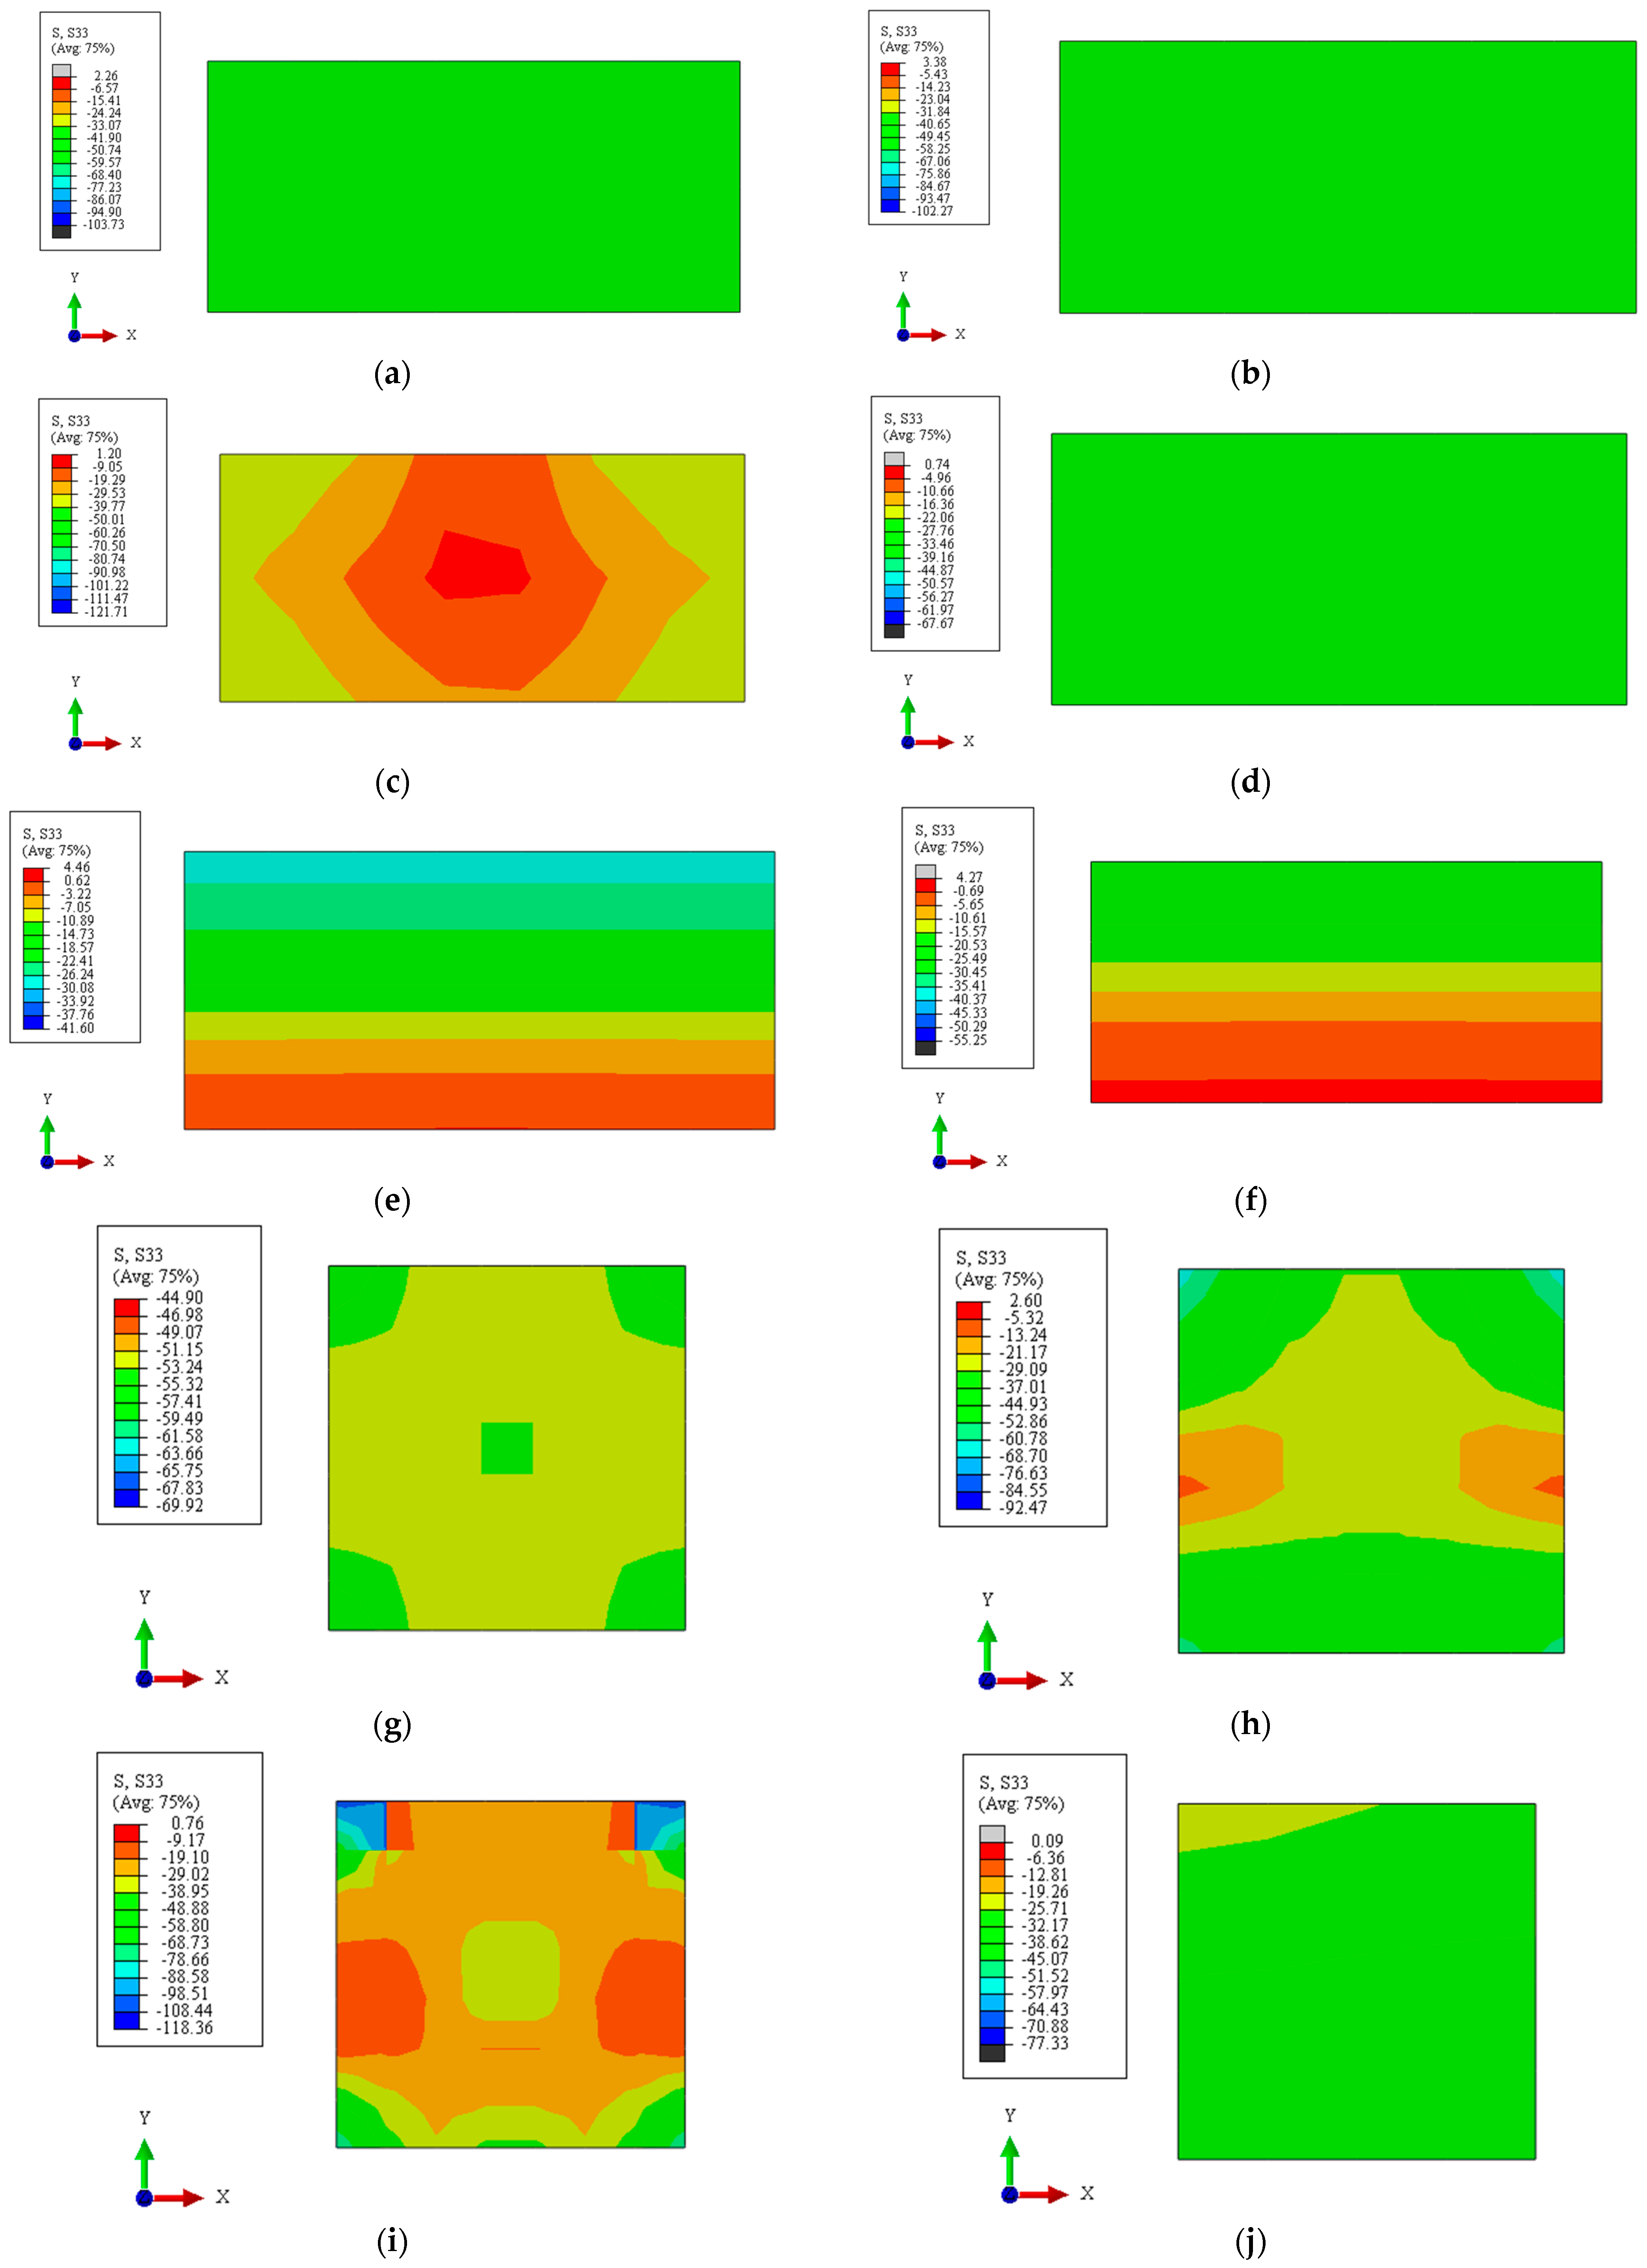
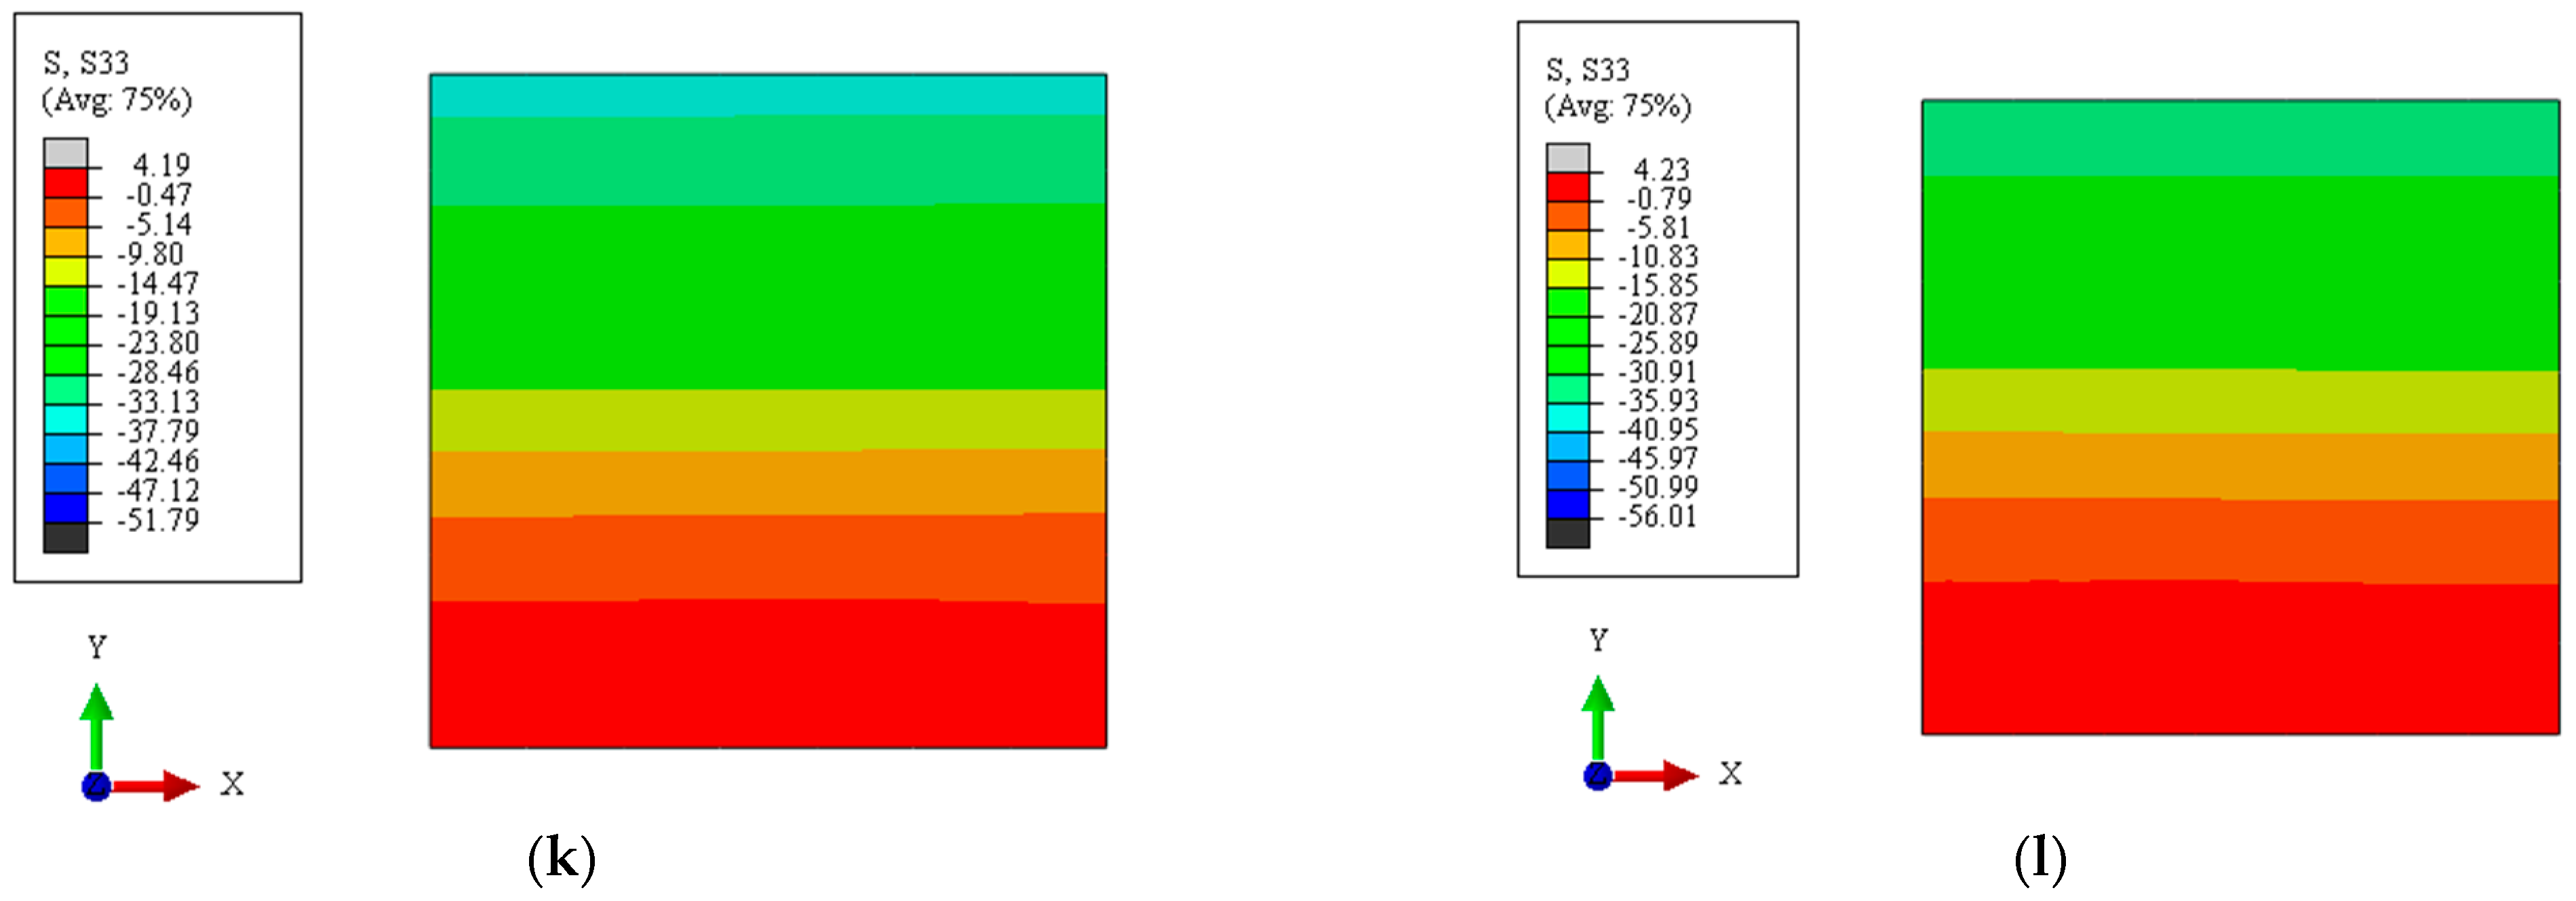
3.3.3. Analysis of Longitudinal Stress Distribution in the Central Cross-Section

  • Analysis of longitudinal stress distribution of the stainless steel tubes in the central cross-section
The longitudinal stress distribution of the stainless steel tube in the central cross-section when the ultimate bearing capacity is reached is shown in Figure 11, and 120604C40-0-8 indicates that the length of the stainless steel tube a is 120 mm, the width of the stainless steel tube b is 60 mm, the thickness of the stainless steel tube t is 4 mm, the concrete strength is C40, the relative eccentricity e is 0, the slenderness ratio λ is eight. The other parameters are similar and will not be repeated.
For rectangular specimens, we take specimen 120604C40 as an example. It can be seen from Figure 11a–c that when the specimen is under axial compression load and the slenderness ratio is eight, the longitudinal stress of the stainless steel tube has uniform distribution in the cross-section, and the longitudinal compressive stress exceeds the fy, which is the yield strength of the stainless steel tube, at up to 1.020 fy. When the specimen is under an eccentric compression load, the longitudinal stress of the stainless steel tube does not have a uniform distribution in the cross-section. When the relative eccentricity is one, the maximum longitudinal compressive stress and the minimum longitudinal compressive stress of the stainless steel tube are 0.961 fy and 0.430 fy, respectively. With the increase in relative eccentricity, the neutralization axis gradually moves upward along the y-axis, and the longitudinal stress in parts of the cross-section gradually changes from compressive stress to tensile stress. When the relative eccentricity is 2.67, the maximum longitudinal compressive stress and the maximum longitudinal tensile stress do not exceed fy, and the maximum longitudinal compressive stress and the maximum longitudinal tensile stress are 0.72 fy and 0.463 fy, respectively.
It can be seen from Figure 11d–f that when the slenderness ratio is 48, the longitudinal stress of the stainless steel tube is not uniformly distributed in the cross-section regardless of the axial compression state or eccentric compression state. With the increase in relative eccentricity, the neutralization axis gradually moves upward along the y-axis, and the upward displacement of the neutralization axis is significantly greater than that when the slenderness ratio is eight. Meanwhile, the tensile stress occurs in parts of the cross-section. When the relative eccentricity is 0, the maximum longitudinal compressive stress and minimum longitudinal compressive stress do not exceed fy and are 0.819 fy and 0.602 fy, respectively. When the relative eccentricity is one, the longitudinal stress of the stainless steel tube is divided into compressive stress and tensile stress on the cross-section, and the maximum longitudinal compressive stress and the maximum longitudinal tensile stress do not exceed fy, at 0.810 fy and 0.281 fy, respectively. When the relative eccentricity is 2.67, the maximum longitudinal compressive stress and the maximum longitudinal tensile stress of the stainless steel tube are 0.727 fy and 0.497 fy, respectively.
For square specimens, we take specimen 1201206C40 as an example. It can be seen from Figure 11g–i that when the specimen is under axial compression load, and the slenderness ratio is 4, the longitudinal stress of the stainless steel tube is relatively uniformly distributed in the cross-section, and the longitudinal compressive stress is 1.029 fy. When the specimen is under an eccentric compression load, the longitudinal stress of the stainless steel tube in the cross-section is not uniformly distributed. With the increase in relative eccentricity, the longitudinal stress in parts of the cross-section changes from compressive stress to tensile stress. When the relative eccentricity is one, the maximum longitudinal compressive stress and the minimum longitudinal compressive stress of the stainless steel tube are 1.078 fy and 0.258 fy, respectively. When the relative eccentricity is 1.33, the maximum longitudinal compressive stress and the maximum longitudinal tensile stress of the stainless steel tube are 0.890 fy and 0.129 fy, respectively.
It can be seen from Figure 11j–l that when the slenderness ratio is 48, the longitudinal stress of the stainless steel tube is not uniformly distributed in the cross-section. When the relative eccentricity is 0, the maximum longitudinal compressive stress and the minimum longitudinal compressive stress of the stainless steel tube are 0.831 fy and 0.321 fy, respectively. When the relative eccentricity is one, the maximum longitudinal compressive stress and the maximum longitudinal tensile stresses of the stainless steel tube are 0.642 fy and 0.496 fy, respectively. When the relative eccentricity is one, the maximum longitudinal compressive stress and the maximum longitudinal tensile stresses of the stainless steel tube are 0.622 fy and 0.462 fy, respectively.
2.
Analysis of longitudinal stress distribution of core concrete in the central cross-section
The longitudinal stress distribution of core concrete in the central cross-section when the ultimate bearing capacity is reached is shown in Figure 12. As can be seen from Figure 12a–c, when the specimen is under axial compression load and the slenderness ratio is eight, the longitudinal stress distribution of the core concrete also has a uniform distribution. However, with the increase in relative eccentricity, the longitudinal stress distribution is not uniformly distributed. When the relative eccentricity is 0, the maximum longitudinal stress of the core concrete obviously exceeds fc, which is the axial compressive strength of the core concrete, at up to 2.021 fc. When the relative eccentricity is one, the maximum longitudinal compressive stress and the minimum longitudinal compressive stress of the core concrete are 1.379 fc and 0.782 fc, respectively. When the relative eccentricity is 2.67, the maximum longitudinal compressive stress and the minimum longitudinal compressive stress of the core concrete are 1.349 fc and 0.307 fc, respectively.
It can be seen from Figure 12d–f that, when the slenderness ratio is 48, with the increase in relative eccentricity, the neutralization axis moves gradually upward along the y-axis, the core concrete experiences obvious tensile stress in the cross-section, and the tensile stress area increases significantly. When the relative eccentricity is 0, the maximum longitudinal compressive stress of core concrete is 1.328 fc. When the relative eccentricity is one, the maximum longitudinal compressive stress and the maximum longitudinal tensile stress of core concrete are 0.89 fc and 0.138 ft, respectively. When the relative eccentricity is 2.67, the maximum longitudinal compressive stress and the maximum longitudinal tensile stress of core concrete are 0.865 fc and 0.951 ft, respectively.
It can be seen from Figure 12g–i that when the specimen is under axial compression load and the slenderness ratio is four, the longitudinal stress of core concrete is symmetrically distributed in the cross-section. The longitudinal compressive stress in the central area and the corner area is larger, and the maximum longitudinal compressive stress is 2.017 fc. With the increase in relative eccentricity, the longitudinal stress distribution status also changes significantly. When the relative eccentricity is one, the maximum longitudinal compressive stress of the core concrete is 2.061 fc, and it is mainly located in the two corner areas. When the relative eccentricity is 1.33, the longitudinal stress in more areas of the cross-section of the core concrete is smaller. It can be seen from Figure 12j–l that when the slenderness ratio is 48, the longitudinal stress distribution of the core concrete in the cross-section is similar to that of the specimen 120604C40 under the same slenderness ratio. When the relative eccentricity is 0, the maximum longitudinal compressive stress and the minimum longitudinal compressive stress of the core concrete are 1.529 fc and 0.653 fc, respectively. When the relative eccentricity is one, the maximum longitudinal compressive stress and the maximum longitudinal tensile stress of the core concrete are 1.124 fc and 0.933 ft, respectively. When the relative eccentricity is 1.33, the maximum longitudinal compression stress and the maximum longitudinal tensile stress of the core concrete are 1.049 fc and 0.942 ft, respectively.

4. Calculation Formula of Compression Bearing Capacity

4.1. Failure Mode Analysis

According to the analysis in Section 3.3.3 and other model analysis results, the longitudinal stress distribution in the cross-section of the middle part of a specimen is obviously different when the ultimate bearing capacity is reached under different slenderness ratios and relative eccentricities, and the position of the neutralization axis is also obviously different. The failure mode is related to the tensile (compressive) failure of the stainless steel tube, the compressive (tensile) failure of core concrete, and the position of the neutralization axis, as shown in Table 3.

4.2. Calculation Method of Compression Bearing Capacity

4.2.1. Calculation Formula of Compression Bearing Capacity of Short Column under Axial Compression Load

For the short column under an axial compression load, the failure mode is mainly the failure mode one. The superposition method is used to calculate the compression bearing capacity of the cross-section, which is divided into the compression bearing capacity of the stainless steel tube and the compression bearing capacity of the core concrete. When considering the interaction influence of stainless steel tube and core concrete [33], the calculation formula is shown in Formulas (1)~(3).
N su = N ss + N cc = α f y A ss + β f c A cc
α = 0.00447 ξ + 1.00854 ( 0.65 ξ 6.06 )
β = 0.01944 ξ + 1.78799 ( 0.65 ξ 6.06 )
In Formulas (1)~(3), Nsu is the compression bearing capacity of the short column; Nss is the compression bearing capacity of the stainless steel tube; Ncc is the compression bearing capacity of the core concrete; α is the yield strength improvement coefficient of the stainless steel tube; β is the compression strength improvement coefficient of the core concrete; Ass is the cross-sectional area of the stainless steel tube; Acc is the cross-sectional area of the core concrete; ξ is the constraint effect coefficient, and the calculation method is shown in [34].

4.2.2. Calculation Formula of Compression Bearing Capacity of Long Column under Axial Compression Load

According to the analysis in Section 3.3.2, it is known that the slenderness ratio has a great influence on the compression bearing capacity of a long column, and the larger the slenderness ratio, the lower the compression bearing capacity. Therefore, on the basis of the compression bearing capacity of a short column, considering the influence of the slenderness ratio [33], the calculation formula is shown in Formulas (4) and (5).
N lsu = φ N su
φ = { 1 3 λ < 6 0.00213 λ + 0.97796 6 λ 48 1.05644 λ + 51.53573 48 < λ 48.375 0.00569 λ + 0.63387 48.375 < λ 96
In Formulas (4) and (5), Nlsu is the compression bearing capacity of the long column, and φ is the stability coefficient.

4.2.3. Calculation Formula of Compression Bearing Capacity of Eccentric Column

According to the analysis in Section 3.3.2, it is known that the relative eccentricity and slenderness ratio has a great influence on the compression bearing capacity of an eccentric column. The larger the relative eccentricity and slenderness ratio, the lower the compression bearing capacity. Meanwhile, the influence of the compression bearing capacity is different under different slenderness ratios when the relative eccentricity is changed, and the failure modes are mainly failure modes 2~7. The calculation method of compression bearing capacity of eccentric columns is generally expressed in the form of implicit axial force and moment equation, which is not conducive to direct engineering application. Therefore, in order to facilitate engineering application, considering the influence coefficient η of relative eccentricity, the explicit expression of compression bearing capacity of eccentric columns is used to analyze the compression bearing capacity [22,35]. The calculation formula is shown in Formula (6).
N psu = { η φ N su ( e x = 0 , e y 0 ; e x 0 , e y = 0 ) 0.5 min { e x , e y } max { e x , e y } [ 1.116 max { e x , e y } + 1.558 ] η φ N su ( e x 0 , e y 0 )
In Formula (6), Npsu is the compression bearing capacity of the eccentric column; ex is the relative eccentricity in the x-axis; ey is the relative eccentricity in the y-axis; η is the relative eccentricity influence coefficient’s correlation with the slenderness ratio, and the calculation formula is shown in Table 4, where e is the relative eccentricity.

4.2.4. Verification of the Proposed Formula of Compression Bearing Capacity

The compression bearing capacity of the 39 test specimens in [20,21,22] and the 337 finite element specimens in this paper were calculated using the proposed formula for compression bearing capacity, and the verification of the proposed formula for the compression bearing capacity is shown in Figure 13. The compression bearing capacity of the 39 test specimens in [20,21,22] is shown in Table 5. It can be seen from Figure 13 that- the theoretical calculations Nucal are in good agreement with the test Nuexp and finite element Nufem, and the mean of theoretical calculations to the test and the finite element is 1.054, while the variance is 0.0247. It is shown that the proposed formula of compression bearing capacity can effectively predict the compression bearing capacity of concrete-filled rectangular stainless steel tubular columns. The application range of the proposed formula for the compression bearing capacity is for concrete-filled rectangular stainless steel tubular columns, and the constraint effect coefficient ξ is from 0.65 to 6.06, the slenderness ratio λ is from 3 to 96, the relative eccentricity e is from 0 to 2.667.

5. Conclusions

Based on the experimental research in [21], the compression bearing capacity of concrete-filled rectangular stainless steel tubular columns is studied in depth by using finite element software and theoretical analysis in this paper. The main conclusions are as follows:
(1)
The finite element model can effectively simulate the compression bearing capacity; the mean of finite element calculations Nufem to the test Nuexp is 0.985, and the variance is 0.000621.
(2)
The slenderness ratio and relative eccentricity have a great influence on the load–displacement curves. The thickness of the stainless steel tube has little influence on the load–displacement curves. With the increase in slenderness ratio and relative eccentricity, the compression bearing capacity decreases.
(3)
With the increase in the slenderness ratio, the failure model of the specimen gradually changes from plastic failure to elastoplastic failure and then elastic failure.
(4)
When the slenderness ratio is the same, if the relative eccentricity is larger, increasing the thickness of the stainless steel tube will be more effective in improving the compression bearing capacity. When the relative eccentricity is the same, if the slenderness ratio is smaller, increasing the thickness of the stainless steel tube will be more effective in improving the compression bearing capacity.
(5)
The slenderness ratio and relative eccentricity have a great influence on the longitudinal stress distribution in the cross-section. When the slenderness ratio and relative eccentricity are larger, the longitudinal compressive stress in parts of the cross-section gradually becomes the longitudinal tensile stress.
(6)
The proposed formula can effectively predict the compression bearing capacity of concrete-filled rectangular stainless steel tubular columns. The mean of theoretical calculations to the test and the finite element is 1.054, and the variance is 0.0247.

Author Contributions

Conceptualization, B.C.; software, L.Z.; formal analysis, X.J.; data curation, C.W. All authors have read and agreed to the published version of the manuscript.

Funding

The author(s) disclosed receipt of the following financial support for the research, authorship, and/or publication of this article: This study is funded by Colleges and Universities in Anhui Province Project under Grant No. KJ2020A0366 and KJ2021A0504 and KJ2018A0118, Anhui Natural Science Fund Project under Grant No. 1708085QE121, National Natural Science Fund Pre Project of Anhui Polytechnic University under Grant No. 2019yyzr08, National Innovation and Entrepreneurship Training Program Project for College Students under Grant Nos. 202010363123 and 202110363122, Anhui Polytechnic University Research Project under Grant Nos. Xjky2020173 and Xjky2020170 and Xjky110201912 and 2021YQQ020.

Institutional Review Board Statement

Not applicable.

Informed Consent Statement

Not applicable.

Data Availability Statement

Not applicable.

Conflicts of Interest

The authors declare no conflict of interest.

References

  1. Xu, Y.; Tang, H.; Chen, J.; Jia, Y.; Liu, R. Numerical analysis of CFRP-confined concrete-filled stainless steel tubular stub columns under axial compression. J. Build. Eng. 2021, 37, 102130. [Google Scholar] [CrossRef]
  2. Chen, Z.; Xu, R.; Ning, F.; Liang, Y. Compression behaviour and bearing capacity calculation of concrete filled double skin square steel columns. J. Build. Eng. 2021, 42, 103022. [Google Scholar] [CrossRef]
  3. Guo, H.W.; Zheng, H. The linear analysis of thin shell problems using the numerical manifold method. Thin Walled Struct. 2018, 124, 366–383. [Google Scholar] [CrossRef]
  4. Guo, H.W.; Zheng, H.; Zhuang, X.Y. Numerical manifold method for vibration analysis of Kirchhoff’s plates of arbitrary geometry. Appl. Math. Model. 2019, 66, 695–727. [Google Scholar] [CrossRef]
  5. Lam, D.; Gardner, L. Structural design of stainless-steel concrete filled columns. J. Constr. Steel Res. 2008, 64, 1275–1282. [Google Scholar] [CrossRef]
  6. Uy, B.; Tao, Z.; Han, L.H. Behaviour of short and slender concrete-filled stainless steel tubular columns. J. Constr. Steel Res. 2010, 67, 360–378. [Google Scholar] [CrossRef]
  7. Ellobody, E.; Ghazy, M.F. Eperimental investigation of eccentrically loaded fibre reinforced concrete-filled stainless steel tubular columns. J. Constr. Steel Res. 2012, 76, 167–176. [Google Scholar] [CrossRef]
  8. Ellobody, E.; Ghazy, M.F. Numerical modelling of fibre reinforced concrete-filled stainless steel tubular columns. Thin Walled Struct. 2013, 63, 1–12. [Google Scholar] [CrossRef]
  9. Ellobody, E. Nonlinear behaviour of eccentrically loaded FR concrete-filled stainless steel tubular columns. J. Constr. Steel Res. 2013, 90, 1–12. [Google Scholar] [CrossRef]
  10. Tokgoz, S. Tests on plain and steel fiber concrete-filled stainless steel tubular columns. J. Constr. Steel Res. 2015, 114, 129–135. [Google Scholar] [CrossRef]
  11. Hassanein, M.F.; Shao, Y.B.; Elchalakani, M.; El Hadidy, A.M. Flexural buckling of circular concrete-filled stainless steel tubular columns. Mar. Struct. 2020, 71, 102722. [Google Scholar] [CrossRef]
  12. Elsisy, A.R.; Shao, Y.B.; Zhou, M.; Hassanein, M.F. A study on the compressive strengths of stiffened and unstiffened concrete-filled austenitic stainless steel tubular short columns. Ocean. Eng. 2022, 248, 110793. [Google Scholar] [CrossRef]
  13. Al-Mekhlafi, G.M.; Al-Osta, M.A.; Sharif, A.M. Behavior of eccentrically loaded concrete-filled stainless steel tubular stub columns confined by CFRP composites. Eng. Struct. 2020, 205, 110113. [Google Scholar] [CrossRef]
  14. Patel, V.I.; Liang, Q.Q.; Hadi, M.N.S. Nonlinear analysis of axially loaded circular concrete-filled stainless steel tubular short columns. J. Constr. Steel Res. 2014, 101, 9–18. [Google Scholar] [CrossRef] [Green Version]
  15. He, A.; Su, A.D.; Liang, Y.T.; Zhao, O. Experimental and numerical investigations of circular recycled aggregate concrete-filled stainless steel tube columns. J. Constr. Steel Res. 2021, 179, 106566. [Google Scholar] [CrossRef]
  16. Tang, H.Y.; Fang, L.Y.; Zhao, X. Bearing capacity model of circular concrete-filled stainless steel stub columns under uniaxial compression. Adv. Eng. Sci. 2020, 52, 10–20. [Google Scholar]
  17. Duan, W.F.; Zhao, L.; Leng, J. Finite element analysis of axial compressive bearing capacity of recycled concrete short columns with circular stainless steel tubes. J. Jilin Jianzhu Univ. 2017, 34, 9–12. [Google Scholar]
  18. Liao, F.Y.; Hou, C.; Zhang, W.J.; Ren, J. Experimental investigation on sea sand concrete-filled stainless steel tubular stub columns. J. Constr. Steel Res. 2019, 155, 46–61. [Google Scholar] [CrossRef]
  19. Ding, F.X.; Yin, Y.X.; Wang, L.P.; Yu, Y.; Luo, L.; Yu, Z.W. Confinement coefficient of concrete-filled square stainless steel tubular stub columns. Steel Compos. Struct. 2019, 30, 337–350. [Google Scholar]
  20. Dai, P.; Yang, L.; Wang, J.; Gang, Y.; Yang, S. Experimental study on bearing behavior of concrete-filled square stainless steel tubular stub columns under axial compression. J. Build. Struct. 2021, 42, 17–24. [Google Scholar]
  21. Tang, H.Y.; Li, Z.Z.; Fang, L.Y.; Hong, Y. Experimental investigation on behavior of rectangular concrete-filled stainless steel stub column under axial loading. J. Southwest Jiaotong Univ. 2022, 57, 855–864. [Google Scholar]
  22. Li, Y.J.; Liao, F.Y.; Huang, H.Q. Experimental study on the behavior of concrete filled rectangular stainless steel tubular columns under bi-axial eccentric compression. Prog. Steel Build. Struct. 2018, 20, 60–66. [Google Scholar]
  23. Le, T.T.; Patel, V.I.; Liang, Q.Q.; Huynh, P. Axisymmetric simulation of circular concrete-filled double-skin steel tubular short columns incorporating outer stainless-steel tube. Eng. Struct. 2021, 227, 111416. [Google Scholar] [CrossRef]
  24. Le, T.T.; Patel, V.I.; Liang, Q.Q.; Huynh, P. Numerical modeling of rectangular concrete-filled double-skin steel tubular columns with outer stainless-steel skin. J. Constr. Steel Res. 2021, 179, 106504. [Google Scholar] [CrossRef]
  25. EN 1994-1-1; Eurocode 4. Design of Composite Steel and Concrete Structures Part1-1: General Rules and Rules for Building. CEN: Brussels, Belgium, 2004.
  26. EN 1993-1-1; Eurocode 3. Design of Steel Structures Part1-1: General Rules and Rules for Building. CEN: Brussels, Belgium, 2005.
  27. EN 1993-1-4; Eurocode 3. Design of Steel Structures Part1-4: General Rules—Supplementary Rules for Stainless Steels. CEN: Brussels, Belgium, 2006.
  28. GB/T 2975-2018; Steel and Steel Products—Location and Preparation of Samples and Test Pieces for Mechanical Testing. China Architecture and Building Press: Beijing, China, 2018.
  29. GB/T 228-2010; Metallic Materials—Tensile Testing—Method of Test at Ambient Temperature. China Architecture and Building Press: Beijing, China, 2010.
  30. GB/T 50081-2002; Standard for Test Method of Mechanical Properties on Ordinary Concrete. China Architecture and Building Press: Beijing, China, 2002.
  31. GB/T 50152-2012; Standard for Test Method of Concrete Structures. China Architecture and Building Press: Beijing, China, 2012.
  32. Wang, C.G. Experimental and Analytical Study on Eccentric Compression and Seismic Behavior of Recycled Aggregate Concrete Filled Square Steel Tube Long Columns. Ph.D. Thesis, Heifei University of Technology, Heifei, China, 2018; pp. 67–73. [Google Scholar]
  33. Cao, B.; Zhang, X.; Liang, N.; Yang, Y.; Shen, D.; Huang, B.; Du, Y.H. Bearing capacity of welded composite T-shaped concrete-filled steel tubular columns under axial compression. Adv. Mech. Eng. 2020, 12, 1687814020923102. [Google Scholar] [CrossRef]
  34. Han, L.H. Concrete-Filled Steel Tubular Structure-Theory and Practice; Science Press: Beijing, China, 2004. [Google Scholar]
  35. Luo, X.; Wei, J.G.; Han, J.P. Experimental study on compression performance of ultra-high strength concrete (UHSC) filled high-strength steel tube stub columns subjected to eccentric load. J. Build. Struct. 2021, 42, 271–277. [Google Scholar]
Figure 1. Schematic diagram of specimen.
Sustainability 14 08946 g001
Figure 2. Arrangement of strain gauges and LVDT displacement meters.
Sustainability 14 08946 g002
Figure 3. Typical failure mode of specimens.
Sustainability 14 08946 g003
Figure 4. Constitutive models [32]. (a) Stress-strain relation of stainless steel. (b) Compression stress-strain relation of concrete. (c) Tensile stress-strain relation of concrete.
Sustainability 14 08946 g004
Figure 5. Finite element model.
Sustainability 14 08946 g005
Figure 6. Failure mode comparison between finite element and test. (a) Rectangular specimen S2. (b) Square specimen S7.
Sustainability 14 08946 g006
Figure 7. Comparison of load–displacement curves for the finite element model and test. (a) S1. (b) S2. (c) S3. (d) S4. (e) S5. (f) S6. (g) S7.
Sustainability 14 08946 g007
Figure 8. Comparison of load–displacement curves subject to different parameters. (a) 120604C40720. (b) 120604C402880. (c) 120605C40720. (d) 120605C402880. (e) 1201206C40720. (f) 1201206C405760.
Sustainability 14 08946 g008
Figure 9. Comparison of variation of the compression bearing capacity with relative eccentricity under different slenderness ratios. (a) 120604C40. (b) 120605C40. (c) 120804C40. (d) 120805C40. (e) 1201204C40. (f) 1201205C40. (g) 1201206C40.
Sustainability 14 08946 g009aSustainability 14 08946 g009b
Figure 10. Variation of the compression bearing capacity with slenderness ratio under axial compression load and eccentric axial compression load.
Sustainability 14 08946 g010
Figure 11. Longitudinal stress distribution of the stainless steel tube in the central cross-section when the ultimate bearing capacity is reached. (a) 120604C40-0-8. (b) 120604C40-1-8. (c) 120604C40-2.67-8. (d) 120604C40-0-48. (e) 120604C40-1-48. (f) 120604C40-2.67-48. (g) 1201206C40-0-4. (h) 1201206C40-1-4. (i) 1201206C40-1.33-4. (j) 1201206C40-0-48. (k) 1201206C40-1-48. (l) 1201206C40-1.33-48.
Sustainability 14 08946 g011aSustainability 14 08946 g011b
Figure 12. Longitudinal stress distribution of the core concrete in the central cross-section when the ultimate bearing capacity is reached. (a) 120604C40-0-8. (b) 120604C40-1-8. (c) 120604C40-2.67-8. (d) 120604C40-0-48. (e) 120604C40-1-48. (f) 120604C40-2.67-48. (g) 1201206C40-0-4. (h) 1201206C40-1-4. (i) 1201206C40-1.33-4. (j) 1201206C40-0-48. (k) 1201206C40-1-48. (l) 1201206C40-1.33-48.
Sustainability 14 08946 g012aSustainability 14 08946 g012b
Figure 13. Verification of the proposed formula of compression bearing capacity. (a) Comparison between theoretical calculation and the test [20,21,22]. (b) Comparison between theoretical calculation and the finite element model.
Sustainability 14 08946 g013
Table 1. Parameters of specimens.
Specimen NumberLength of Steel Tube a/mmWidth of Steel Tube b/mmThickness of Steel Tube t/mmLength of
Specimen L/mm
Compression Bearing
Capacity Nuexp/kN
S11206043601261
S21206053601632
S31208043601362
S41208053601732
S512012043601814
S612012053602224
S712012063602913
Table 2. Parameters of finite element models.
Finite Element Model TypeLength of Steel Tube a/mmWidth of Steel Tube b/mmThickness of Steel Tube t/mmYield Strength of Steel Tube fy/MPaAxial Compressive Strength of Concrete fc/MPaSlenderness Ratio λRelative
Eccentricity e
FEM 1120604534.329.486~480~2.667
FEM 2120605572.329.486~480~2.667
FEM 3120804534.329.486~480~2
FEM 4120805572.329.486~480~2
FEM 51201204534.329.483~960~1.333
FEM 61201205572.329.483~480~1.333
FEM 71201206598.029.483~480~1.333
Table 3. Failure modes of specimens.
Failure ModeNeutralization AxisTensile Area of the Stainless Steel Tube Compressive Area of the Stainless Steel TubeTensile Area of the Core ConcreteCompressive Area of the Core Concrete
1Not through the cross-sectionNo tensile areaAll are under compression, which is yieldingNo tensile areaAll are under compression, which has reached the ultimate compressive strength
2Not through the cross-sectionNo tensile areaAll are under compression, which is not yieldingNo tensile areaAll are under compression, some areas have reached the ultimate compressive strength, while other areas have not reached it
3Not through the cross-sectionNo tensile areaAll are under compression, but some areas are yielding and other areas are not yieldingNo tensile areaAll are under compression, some areas have reached the ultimate compressive strength, while other areas have not reached it
4Through the cross-sectionThere are tensile areas, which are not yieldingThere are tensile areas, which are not yieldingNo tensile areaAll are under compression, some areas have reached the ultimate compressive strength, while other areas have not reached it
5Through the cross-sectionThere are tensile areas, which are not yieldingThere are tensile areas, which are not yieldingThere are tensile areas, which have reached the ultimate tensile strengthThere are compression areas, which have not reached the ultimate compressive strength
6Through the cross-sectionThere are tensile areas, which are not yieldingThere are tensile areas, which are not yieldingThere are tensile areas, which have reached the ultimate tensile strengthThere are compression areas, which have reached the ultimate compressive strength
7Through the cross-sectionThere are tensile areas, which are yieldingThere are tensile areas, which are yieldingThere are tensile areas, which have reached the ultimate tensile strengthThere are compression areas, which have reached the ultimate compressive strength
Table 4. The formula of the influence coefficient η of relative eccentricity.
Slenderness Ratio λThe Formula of ηScope of Application
λ ≤ 4 η = 0.07487 e 3 0.04403 e 2 0.41727 e + 1.00409 0 < e ≤ 2.667
e = max{ex, ey}
4 < λ ≤ 6 η = 0.03224 e 3 + 0.24713 e 2 0.63878 e + 1.00018
6 < λ ≤ 8 η = 0.03193 e 3 + 0.19992 e 2 0.53382 e + 1.00317
8 < λ ≤ 13.5 η = 0.06516 e 3 + 0.37696 e 2 0.80405 e + 0.99221
13.5 < λ ≤ 18 η = 0.07015 e 3 + 0.39878 e 2 0.83841 e + 0.97895
18 < λ ≤ 24 η = 0.10133 e 3 + 0.52723 e 2 0.95313 e + 0.95699
24 < λ ≤ 36 η = 0.12129 e 3 + 0.60338 e 2 1.01076 e + 0.83234
36 < λ ≤ 48 η = 0.19951 e 3 + 0.90127 e 2 1.20665 e + 0.78439
Table 5. The compression bearing capacity of the 39 test specimens in [20,21,22].
Specimen NumberCompression Bearing
Capacity Nuexp/kN
Data SourcesSpecimen NumberCompression Bearing
Capacity Nuexp/kN
Data Sources
304-t8C506290Reference [20]120 × 60 × 41261Reference [21]
304-t10C507113120 × 60 × 51632
304-t12C507924120 × 80 × 41362
304-t8C706743120 × 80 × 51732
304-t10C707947120 × 120 × 41814
304-t12C708575120 × 120 × 52224
304-t8C807436120 × 120 × 62913
304-t10C808430r-0-0-a1542Reference [22]
304-t12C809257r-0-0-b1498
2205-t8C508771r-0.50-0.50-a734
2205-t10C5010,111r-0.50-0.50-b716
2205-t12C5012,472r-0.75-0.75-a485
2205-t8C709686r-0.75-0.75-b497
2205-t10C7010,820rc1-0.5-0.5-a533
2205-t12C7012,560rc1-0.5-0.5-b524
2205-t8C809962rc2-0.5-0.5-a824
2205-t10C8011,728rc2-0.5-0.5-b814
2205-t12C8013,272rl1-0.5-0.5-a795
rl1-0.5-0.5-b778
rl2-0.5-0.5-a562
rl2-0.5-0.5-b564
Publisher’s Note: MDPI stays neutral with regard to jurisdictional claims in published maps and institutional affiliations.

