1. Introduction
With the development of global economic integration and the continuous expansion of market demand, the links between various parts of the supply chain have become closer, making the supply chain network structure increasingly complicated. Meanwhile, the supply fluctuations, demand shocks, and assets and liabilities brought about by COVID-19 also make the supply chain system more vulnerable to risks. Heckmann [
1] defines supply chain risk as “the potential loss of supply chain efficiency and effective target value caused by the uncertain development of supply chain characteristics”. Risks will not only make the entire supply chain unstable but also cause companies to suffer substantial financial losses. Therefore, understanding the risk diffusion mechanism of the supply chain network [
2] and taking effective measures to suppress it is of great significance to the stability of the entire market and social progress [
3,
4].
In recent years, supply chain risk diffusion has become a hot topic of research. Various factors affecting risk diffusion have attracted the attention of scholars. Uncertainty on the demand side and supply sides will affect the diffusion of risk [
5], while supply and manufacturing flexibility will reduce the process risks [
6]. Risk attitudes also have an impact on the spread of risk [
7]; risk-pursuing decision-makers will accelerate the diffusion of risk, while risk-averse decision-makers have the opposite effect [
8]. Besides this, the herd mentality will affect the spread of risk [
9] and hinder the development of each country’s market [
10]. A better external information environment will help weaken herding among venture capitalists [
11], and an information-sharing incentive mechanism will promote the stable operation of the supply chain [
12]. In that context, it is necessary to take measures against risk diffusion according to various influencing factors.
The dynamic evolution of supply chain networks also affects risk diffusion. An activity-driven network is a time-varying network, as proposed by Perra [
13], and is mostly used in the study of innovation diffusion [
14] and the contagion process [
15]. Considering the aggregation behavior of individuals, Han et al. [
16] improved the SIS (susceptible-infected-susceptible) epidemic model in an ADN (activity-driven network). Under the framework of an activity-driven network, An et al. [
17] proved that the individual attention decay effect greatly interferes with the process of information dissemination. Furthermore, Hu et al. [
18] demonstrated the influence of behavior on information propagation by coupling behavior spreading and information propagation in a two-layer activity-driven network. It can be seen that activity-driven networks are suitable for dynamic studies of complex networks, including coupled dynamics.
The extensive studies on supply chain risk diffusion have greatly promoted the development of the economy, but most of the research has been based on complex network theory. To establish green practices as the priority, Sellitto et al. [
19] proposed a tree-like structure to describe and handle the complexity of the supply chain. Tang et al. [
20] constructed a supply chain network consisting of an undirected cyber network and a directed physical network to study the cascading failure mechanism. Zhu et al. [
21] proposed a weighted network-based SITR (susceptible–infected–temporarily removed–completely removed) risk propagation model to analyze the dynamic propagation process of risk. However, the edges of the complex network represented by the graph only connect two nodes. Due to the complexity of the edge types and network structure [
19], complex networks can no longer describe real-world systems well. In 1985, Denning [
22] first proposed the concept of a super network, but it was still described by a graph. After that, Estrada et al. [
23] proposed a complex system based on a hypergraph, creating the term “hypernetwork”, which promoted the development of the network. Cheng et al. [
24] proposed a hypernetwork model of manufacturing service supply and demand matching, and they verified the feasibility of the model. Suo et al. [
25] applied hypergraph theory to the field of complex supply chain systems and established an evolutionary model of supply chains. As a tool to describe complex relationships and multiple layers, the hypernetwork has been widely used in different fields [
26]. This paper aimed to study the risk diffusion process in the supply chain network using hypernetwork theory.
From the perspective of a hypernetwork, this paper deeply explores the risk diffusion mechanism under the influence of various factors and provides reasonable suggestions on how to restrain the risk diffusion and improve the risk outbreak threshold. The innovations of this paper are as follows:
- (1)
A two-layer dynamic evolution network model under the vision of a hypernetwork is constructed;
- (2)
We consider the impacts of the herd mentality, self-vigilance, talent recruitment, and enterprise management on risk diffusion;
- (3)
A theoretical analysis is carried out with a Microscopic Markov Chain Approach (MMCA), and a Monte Carlo (MC) simulation is used to verify the correctness of the MMCA.
The rest of this paper is structured as follows.
Section 2 describes the two-layer dynamic evolution network model and the compartment model in detail. The risk diffusion scale and threshold are analyzed theoretically in
Section 3. In
Section 4, we present the results of a numerical simulation carried out using MATLAB to verify the correctness of the theoretical analysis.
Section 5 summarizes the contributions of the paper and proposes future research directions.
2. Model Description
The concept of hypernetworks is as follows:
First, let
be a finite set, and let
,
be a family of non-empty subsets of
. The pair
is known as a hypergraph [
25].
is referred to as a hyperedge, and if
,
is a k-uniform hypergraph [
25]. A hypernetwork is a complex system described by a hypergraph. As shown in
Figure 1, the set of nodes is
, hyperedges are
and
, and
is a set of hyperedges.
In fact, most supply chains are composed of suppliers, manufacturers, distribution companies, retail companies, consumers, etc. (i.e., each supply chain has the same components), and the social circle is generally fixed in a short time (i.e., each social circle contains a certain number of people). To simplify the model, the supply chain network and social network are both set as uniform hypernetworks in this paper.
2.1. Two-Layer Dynamic Evolution Network Model
Against the background of economic globalization, the supply chain has expanded from the original small scope to the global. For the maximum benefit, an enterprise always has multiple cooperations, and there are multiple participants in an item. The complex network represented by a graph cannot fully describe the complex relationships in the supply chain network, while the hypernetwork represented by a hypergraph can do it well. The activity rate of each node is dynamic, and given that the topology of actual supply chain networks always changes with time, the supply chain risk diffusion model considering multi-factor influences, under a hypernetwork vision, is useful for studying risk diffusion in supply chain networks.
Activity-Driven Network
This paper constructs a two-layer activity-driven network. Two-layer networks share the same individuals, i.e., each node in one layer has a one-to-one correspondence with the node in the other layer. We assign an activity rate to node
according to the definition
. As shown in Equation (1), the activity rate
is proportional to the ratio of the number of links for node
to the number of links for all nodes at time
.
where
is the adjustment coefficient, and
indicates the number of hyperedges of node
at time
. The activity rate
is the probability that a node generates links with others per unit time, bounded in the interval (0,1). Based on the traditional activity-driven network model [
18], we use the hypernetwork theory to improve it. The generation of the instantaneous network
of each layer is as follows:
- (1)
At each discrete time step , the network consists of isolated nodes;
- (2)
Each node
becomes active with probability
, and it forms
hyperedges with
nodes selected by Equation (2). The inactive nodes can also receive connections.
where
is the degree. In the supply chain network, the greater the degree of the node, the stronger the cooperation ability [
27], hence why we choose cooperation partners with probability
;
- (3)
At the next time step , all hyperedges in network are removed. Therefore, the continuous action time between nodes is constant.
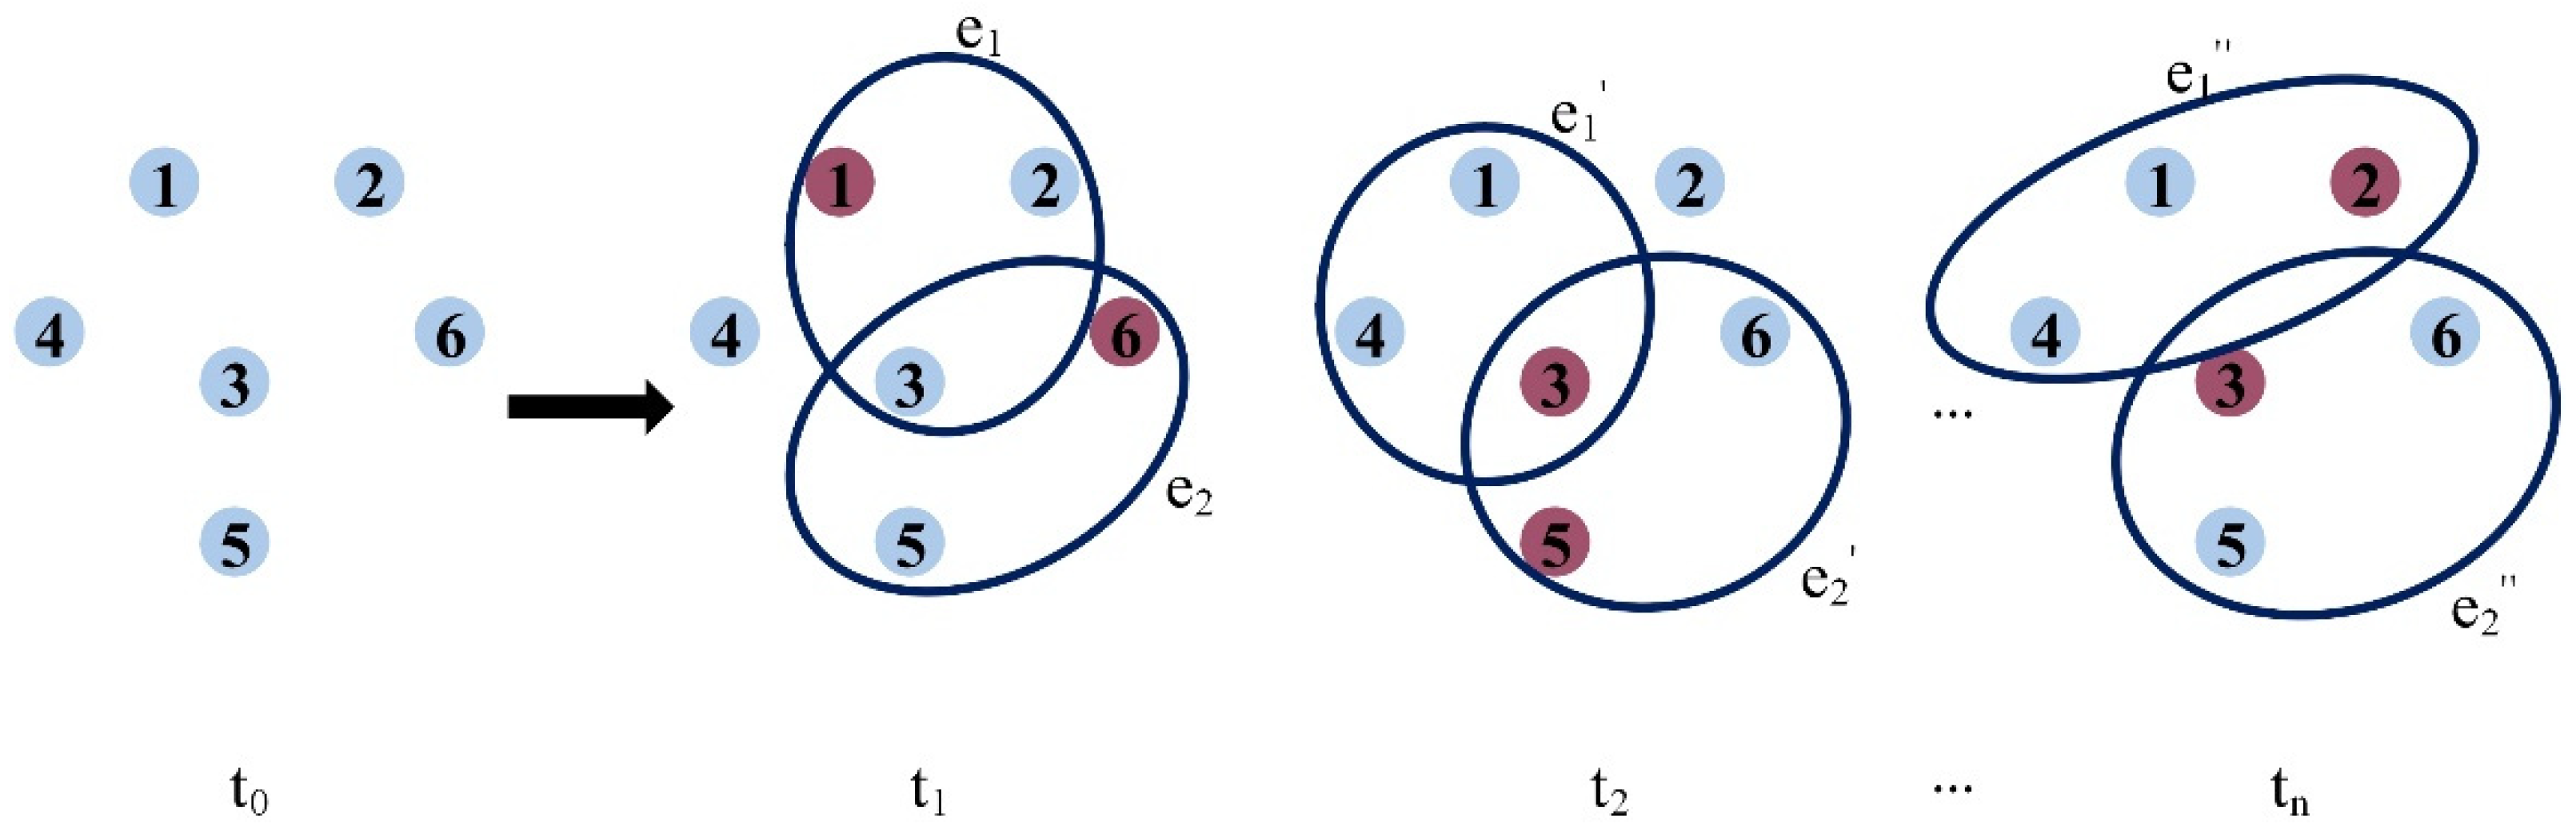
An example of the dynamic evolution of the activity-driven network is shown in
Figure 2, where the purple node denotes an active individual, while the blue node denotes an inactive individual. The continuous action time between nodes is 1.
All cooperation has a period. As individual communication in social networks will not end after a chat is over, the continuous action time of the upper layer is longer than that of the lower layer . There are many factors to consider in the cooperation of enterprises, beyond and potentially excluding social interaction. Thus, the number of selected nodes and the number of hyperedges formed by the active node of the consciousness layer will always be greater than those of the cooperation layer .
2.2. Coupled UAU–SIRS Compartment Model
In past research, the UAU (unaware–aware–unaware) model was mostly used in the propagation of the consciousness layer [
28], while the classic SI (susceptible–infected) model [
28] and SIR (susceptible–infected–recovered) model [
9] were used in the risk diffusion layer. In fact, due to the diversity of risks, enterprises may encounter risks again, even if they recover from previous ones, in the process of risk diffusion. Therefore, the SIRS model, considering a transition from state R to state S, will better represent the dynamic changes to enterprises’ states during risk diffusion.
2.2.1. UAU Compartment Model
Assuming that vigilance spreads in a social network via the UAU model, the state of each node will be one of the following two states: unalert (U), alert (A). In
Figure 3a, the unalert state means that the company has not yet realized the risks and still has a positive attitude toward cooperation. Under the influence of neighbors, unalert enterprises will become alert with probability
. Alert companies will lose vigilance with rate
and revert to an unalert state.
Herd mentality is where, under the influence of the group, individuals give up their own opinions and align their behaviors with the group. It is a blindly obedient behavior. Enterprise managers who do not understand group psychology will make the wrong judgments based on the behavior that suits their surroundings, thereby exposing the enterprise to serious risks [
9]. However, the effect of herd mentality is not 100%. Even if surrounding companies are alert, the company may consider only its own interests and thus stay unalert. Similarly, even if the surrounding companies are not alert, enterprises may become cautious because of self-vigilance. Therefore, we use Equation (3) to represent the probability of node
transitioning from state U to state A at time
.
where
represents the herd mentality,
represents self-vigilance, and
represents the probability that node
is in state A at time
. Equation (4) is the mathematical interpretation of
, which is the ratio of the number of A-state nodes connecting to node
to the total number of nodes connecting to node
. Moreover, in the consciousness layer, if node
is connected to node
, then
; otherwise,
.
2.2.2. SIRS Compartment Model
We assume the risk spreads in the cooperation layer via the SIRS model—susceptible (S), infected (I), recovered (R), susceptible (S). As shown in
Figure 3b, the probability that infected nodes (I) will transmit the risk to susceptible nodes (S) on the same hyperedge takes
, and recovery from the risk occurs at rate
. The recovered nodes (R) have recovered from the risk and will not re-spread it, but they may lose immunity to the risk with probability
.
Talent introduction corresponds to local units employing talents whose educational background is higher (masters and doctors) through various preferential policies. It is key to social progress and enterprise development. Enterprise managers seek to obtain the maximum input-output efficiency by utilizing the human, material, financial, information, and other resources of the enterprise as much as possible. Enterprise management can enhance operational efficiency, improve production efficiency, and enable each employee to give full play to their potential. Those factors all play important roles in promoting economic development and resisting risks. As such, according to the external negative information function [
29], which considers the influence of multiple factors, we obtain the risk diffusion rate function, which is also a negative effect, as shown in Equation (5) below.
where
represents the initial risk diffusion rate,
represents talent recruitment, and
represents enterprise management.
Consciousness propagation and risk diffusion are two mutually influential processes [
9]. For the consciousness layer, the more enterprises collaborate, the more interested leaders will be in understanding the current status. Thus, suppose the activity rate
of node
in the consciousness layer is the same as in the cooperation layer; as infected nodes (I) will become vigilant with a probability of 100%, state UI is not considered here. In the cooperation layer, if an enterprise is alert, it will not cooperate more with others than those enterprises that are not alert, i.e., for a node in state A in the upper network, the number of hyperedges formed by it in the cooperation layer will be reduced from
to
.
Based on the above, each node in the coupling dynamics of social networks and supply chain networks will be in one of five states: US (unalert and susceptible to risk), UR (unalert and recovered), AS (alert and susceptible to risk), AI (alert and infected by risk), AR (alert and recovered). To sum up the description of the two-layer dynamic evolution network model and the coupled UAU-SIRS compartment model, the evolution mechanism of the supply chain risk diffusion model, under the hypernetwork vision, is shown in
Figure 4. Nodes in the upper layer have two states: alert (blue), unalert (pink). Similarly, there are three states in the lower layer: susceptible (green), infected (yellow), recovered (orange). At each time step, red links represent newly formed hyperedges, and black links represent previously formed ones.
3. Theoretical Analysis
In this section, we discuss the risk diffusion in the supply chain network with MMCA [
9].
At each time step, the node interacts with its neighbors and then may change its state, which is still applicable in the ADN represented by the hypergraph. In the cooperation layer, if there is a link between node
and node
, then
; otherwise,
. Let
denote the probability that susceptible node
is not infected by risk at time
. Then, we have
Table 1 summarizes the key parameter descriptions of the model. According to Equations (3) and (6) and
Figure 3, the obtained state transition probability tree is shown in
Figure 5, which can describe the transition of states between various nodes. The roots represent the state of node
at time
, the outermost leaf represents the possible state of node
at time
, and the arrow is the probability of state transition. Each tree contains two processes: the UAU process in the consciousness layer, the SIRS process in the cooperation layer.
Based on
Figure 5, we can derive the Markov chains of state transition as
Obviously, the normalization condition
holds at each time step.
When
, the probability of each state of each node reaching a steady state is
. The risk diffusion threshold is one of the key parameters for studying supply chain risk diffusion. It decides whether the risk breaks out or disappears. Around the outbreak threshold, the number of nodes in the infected state approaches 0; thus, we assume
. Equation (6) can be approximated as
Based on the above assumptions, when
, we ignore high-order terms. From Equations (7)–(11), we can get
Since
,
, and
, we have
and
. Then, according to Equations (20) and (13), we get the following equation
Substitute Equation (5) into Equation (21), and you get
Let
be the element of the identity matrix. Equation (22) can be transformed into
is the element of matrix Z, and
is the maximum eigenvalue of matrix Z. According to Equation (23), the risk outbreak threshold of the proposed supply chain risk diffusion model can be described as
where
is the solution to the eigenvalue problem; it is the critical threshold of the initial risk spread rate in the supply chain network. Once
, the risk will break out in the system. Therefore, this threshold is significant for the entire supply chain network. Observing Equation (24), we can conclude that the risk outbreak threshold is positively correlated with the recovery rate, talent recruitment, and enterprise management, and related to the dynamics of the consciousness layer.
4. Numerical Simulation
In this section, we present how we used MATLAB to simulate the supply chain risk diffusion process to obtain data and then fit the data points. The correctness of the theoretical analysis is illustrated with the results figures, and effective suggestions for supply chain management are provided.
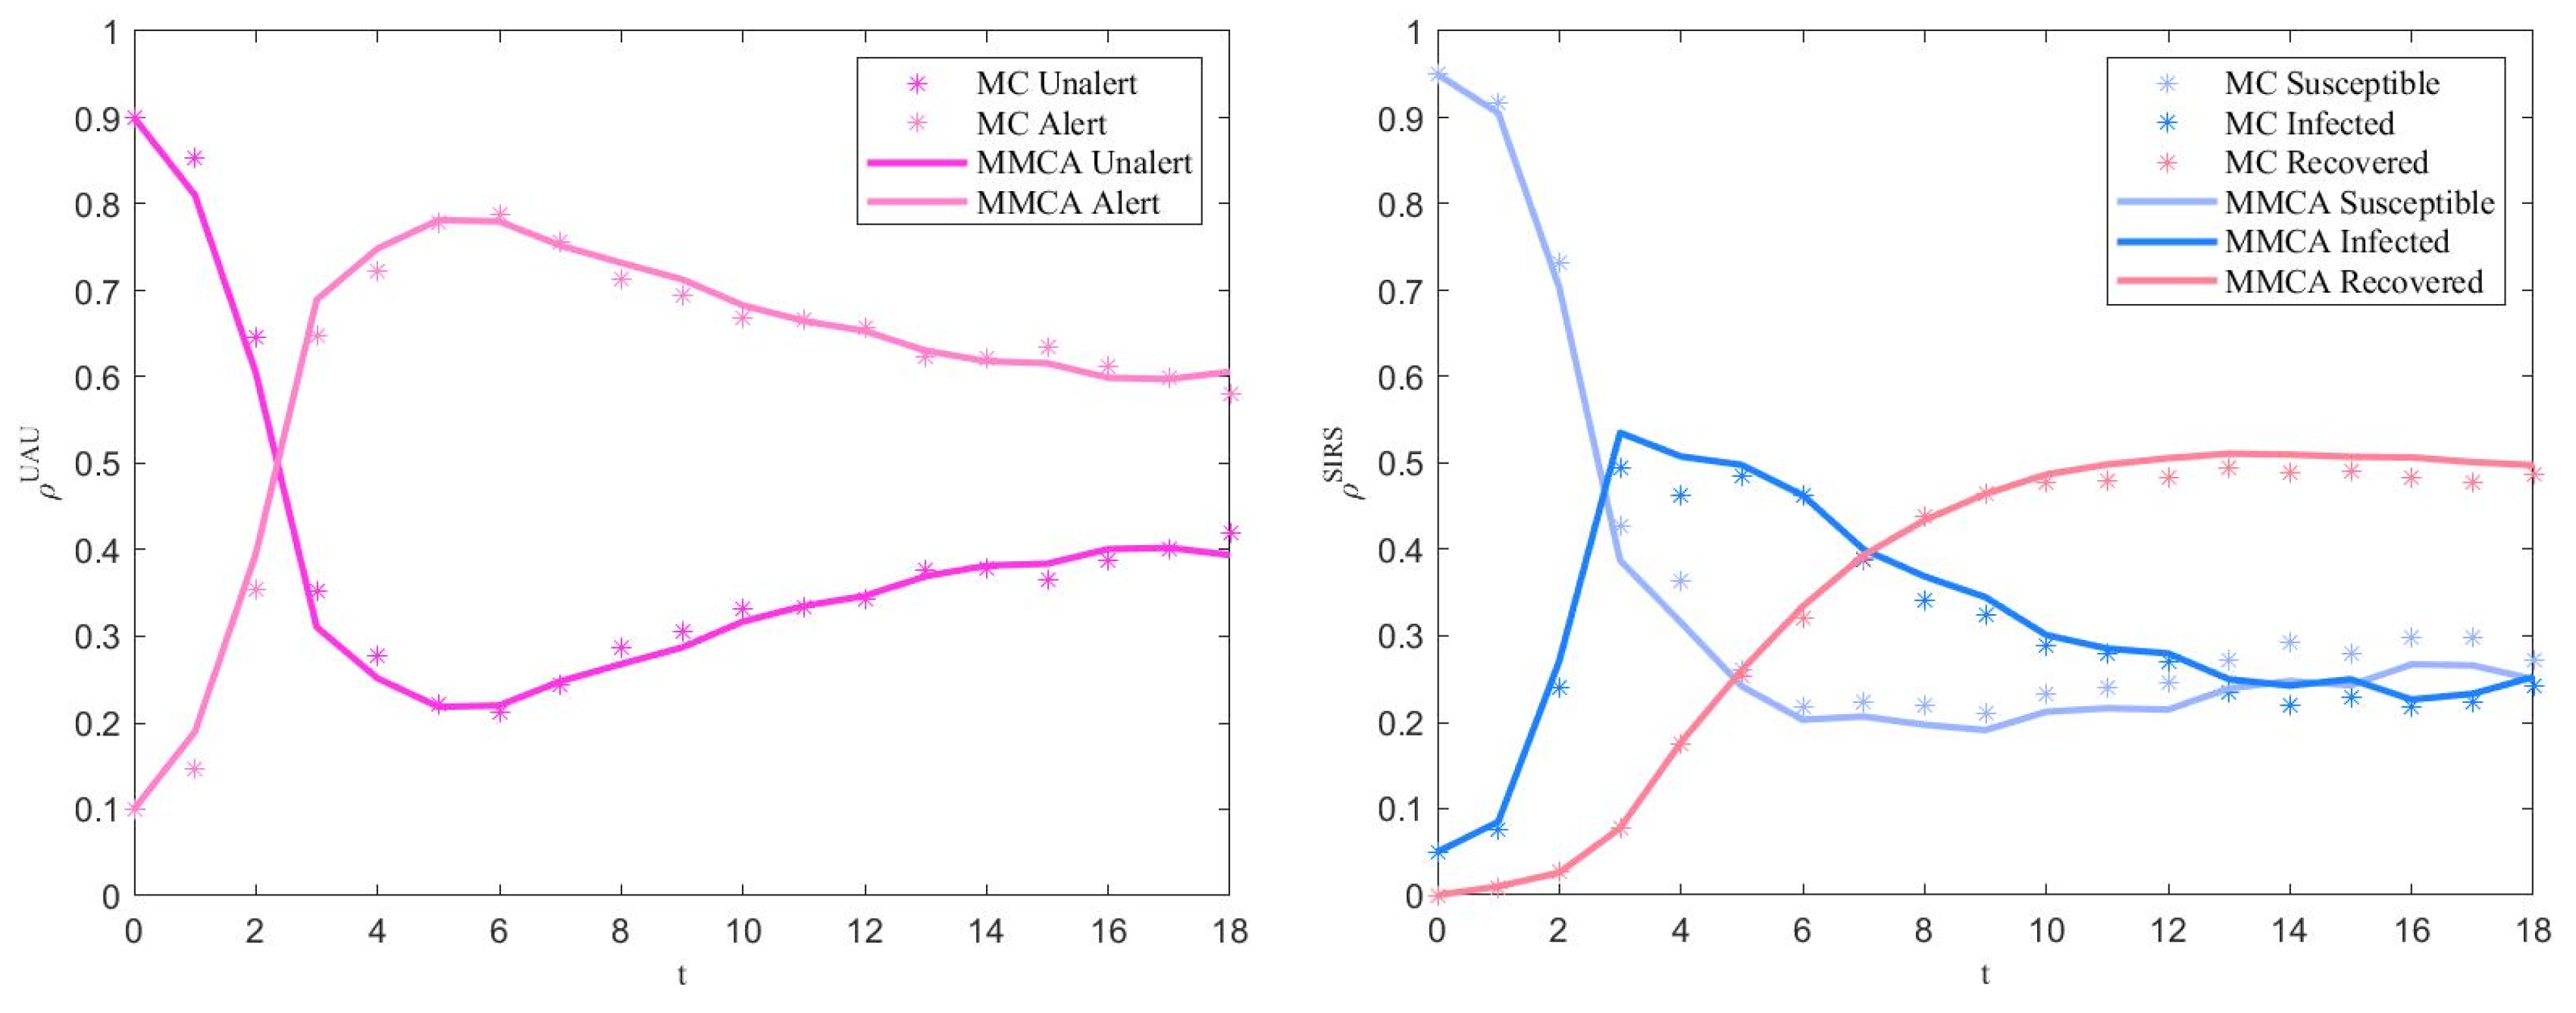
The parameters of the simulation experiment in
Figure 6 were set as follows:
,
,
,
,
,
,
,
,
,
,
,
,
,
,
,
,
,
,
. The left panel of
Figure 6 depicts the enterprise proportions of U and A states as a function of the time step
, and the right panel depicts the enterprise proportions of S, I, and R states as a function of the time step
. MC simulation is a stochastic simulation method of a dynamic process with a computer. It can be seen from the figure that the results of MMCA are basically consistent with those of MC, indicating that MMCA is effective and can be used to simulate the process of supply chain risk diffusion. Therefore, MMCA was next used to test the influence of each parameter.
4.1. Scale
By iteratively solving Equations (7)–(11), we simulated the scale of supply chain risk diffusion. The parameters were set as , , , , , , , , , , , , , , , , , .
Figure 7 depicts the relationship between the parameters
and
of the consciousness layer and the risk diffusion scale
under the increased recovery rate
. We can see that the risk diffusion scale
decreases with increasing
. Moreover, the herd mentality
and self-vigilance
are negatively correlated with the risk diffusion scale
, and the effect of self-vigilance awareness is more pronounced than that of the herd mentality. Improving recovery rates is an option if the diffusion of risk in the supply chain network is to be controlled. Besides this, enterprises may take measures relating to corporate awareness. Increasing self-vigilance is more effective than enhancing the herd mentality.
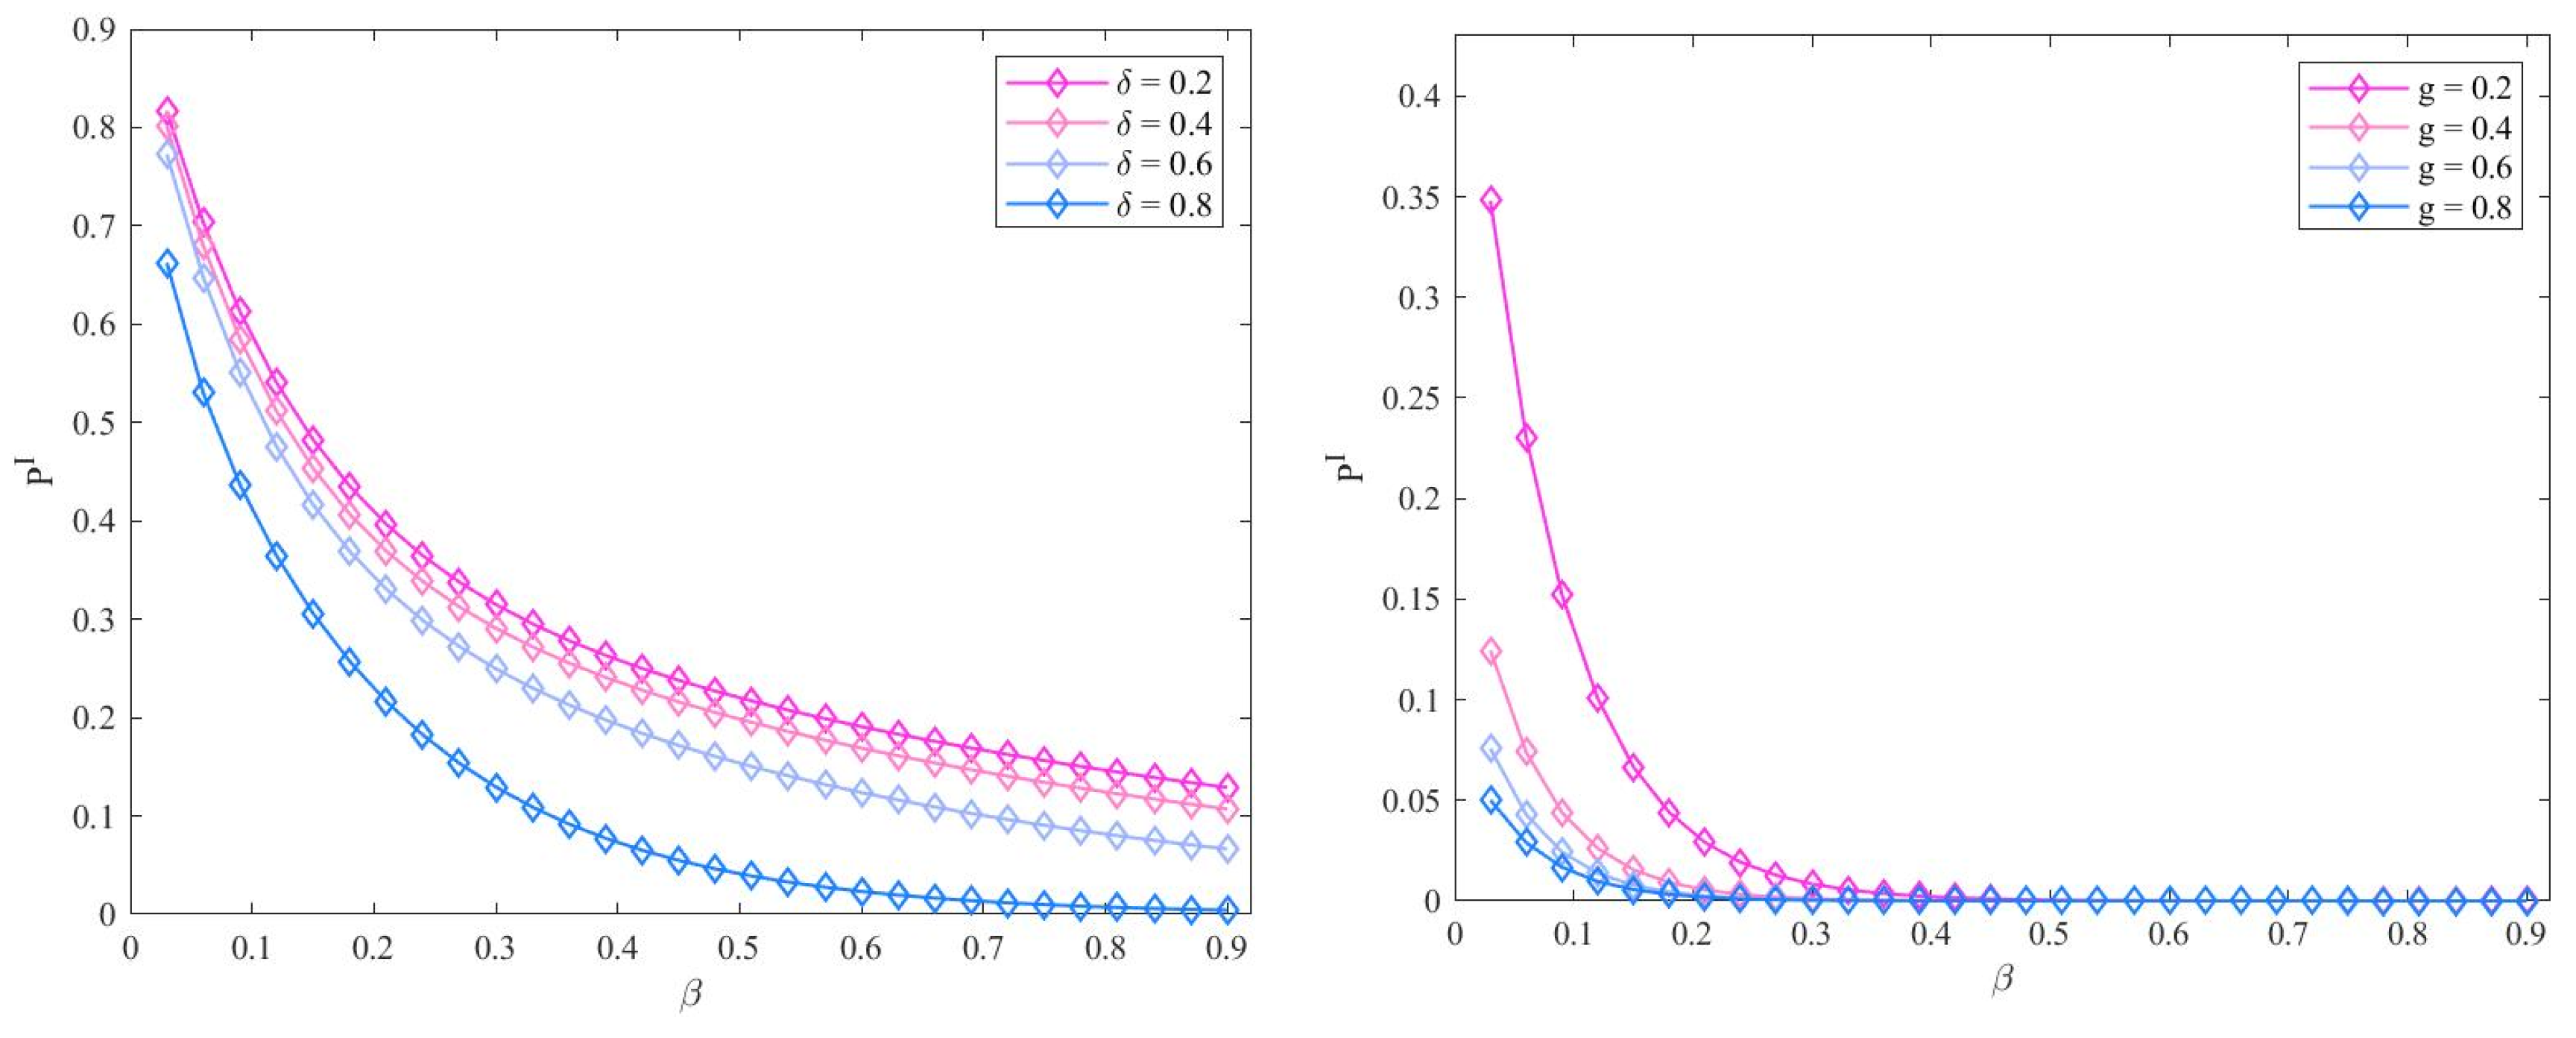
Figure 8 depicts the relationship between the cooperation layer parameters
and
and the scale of risk diffusion
under the increased recovery rate
. With the recovery rate
increasing, the risk diffusion scale
is declining. Furthermore, talent recruitment
and enterprise management
are negatively correlated with the risk diffusion scale
. After
, the effect of suppressing risks is more obvious, while the effect of enterprise management on risk suppression is no longer apparent after
. The simulation results are consistent with real conditions. In the original resource allocation, the influence of enterprise management had certain limitations; only by continuously recruiting talents and then managing them well can companies effectively avoid risk.
Next, in
Figure 9, the risk diffusion scale
is obtained using different parameters
and
in a two-layer network. It can be seen from the figure that self-vigilance and talent recruitment can reduce the diffusion scale of risk, and talent recruitment in the cooperation layer has more of an influence than self-vigilance in the consciousness layer for risk suppression. To effectively suppress the diffusion of risks, measures should be taken in talent recruitment and enterprise management.
4.2. Threshold
We used Equation (24) to simulate the outbreak threshold of supply chain risk. The parameters were set as , , , , , , , , , , , , , , , , .
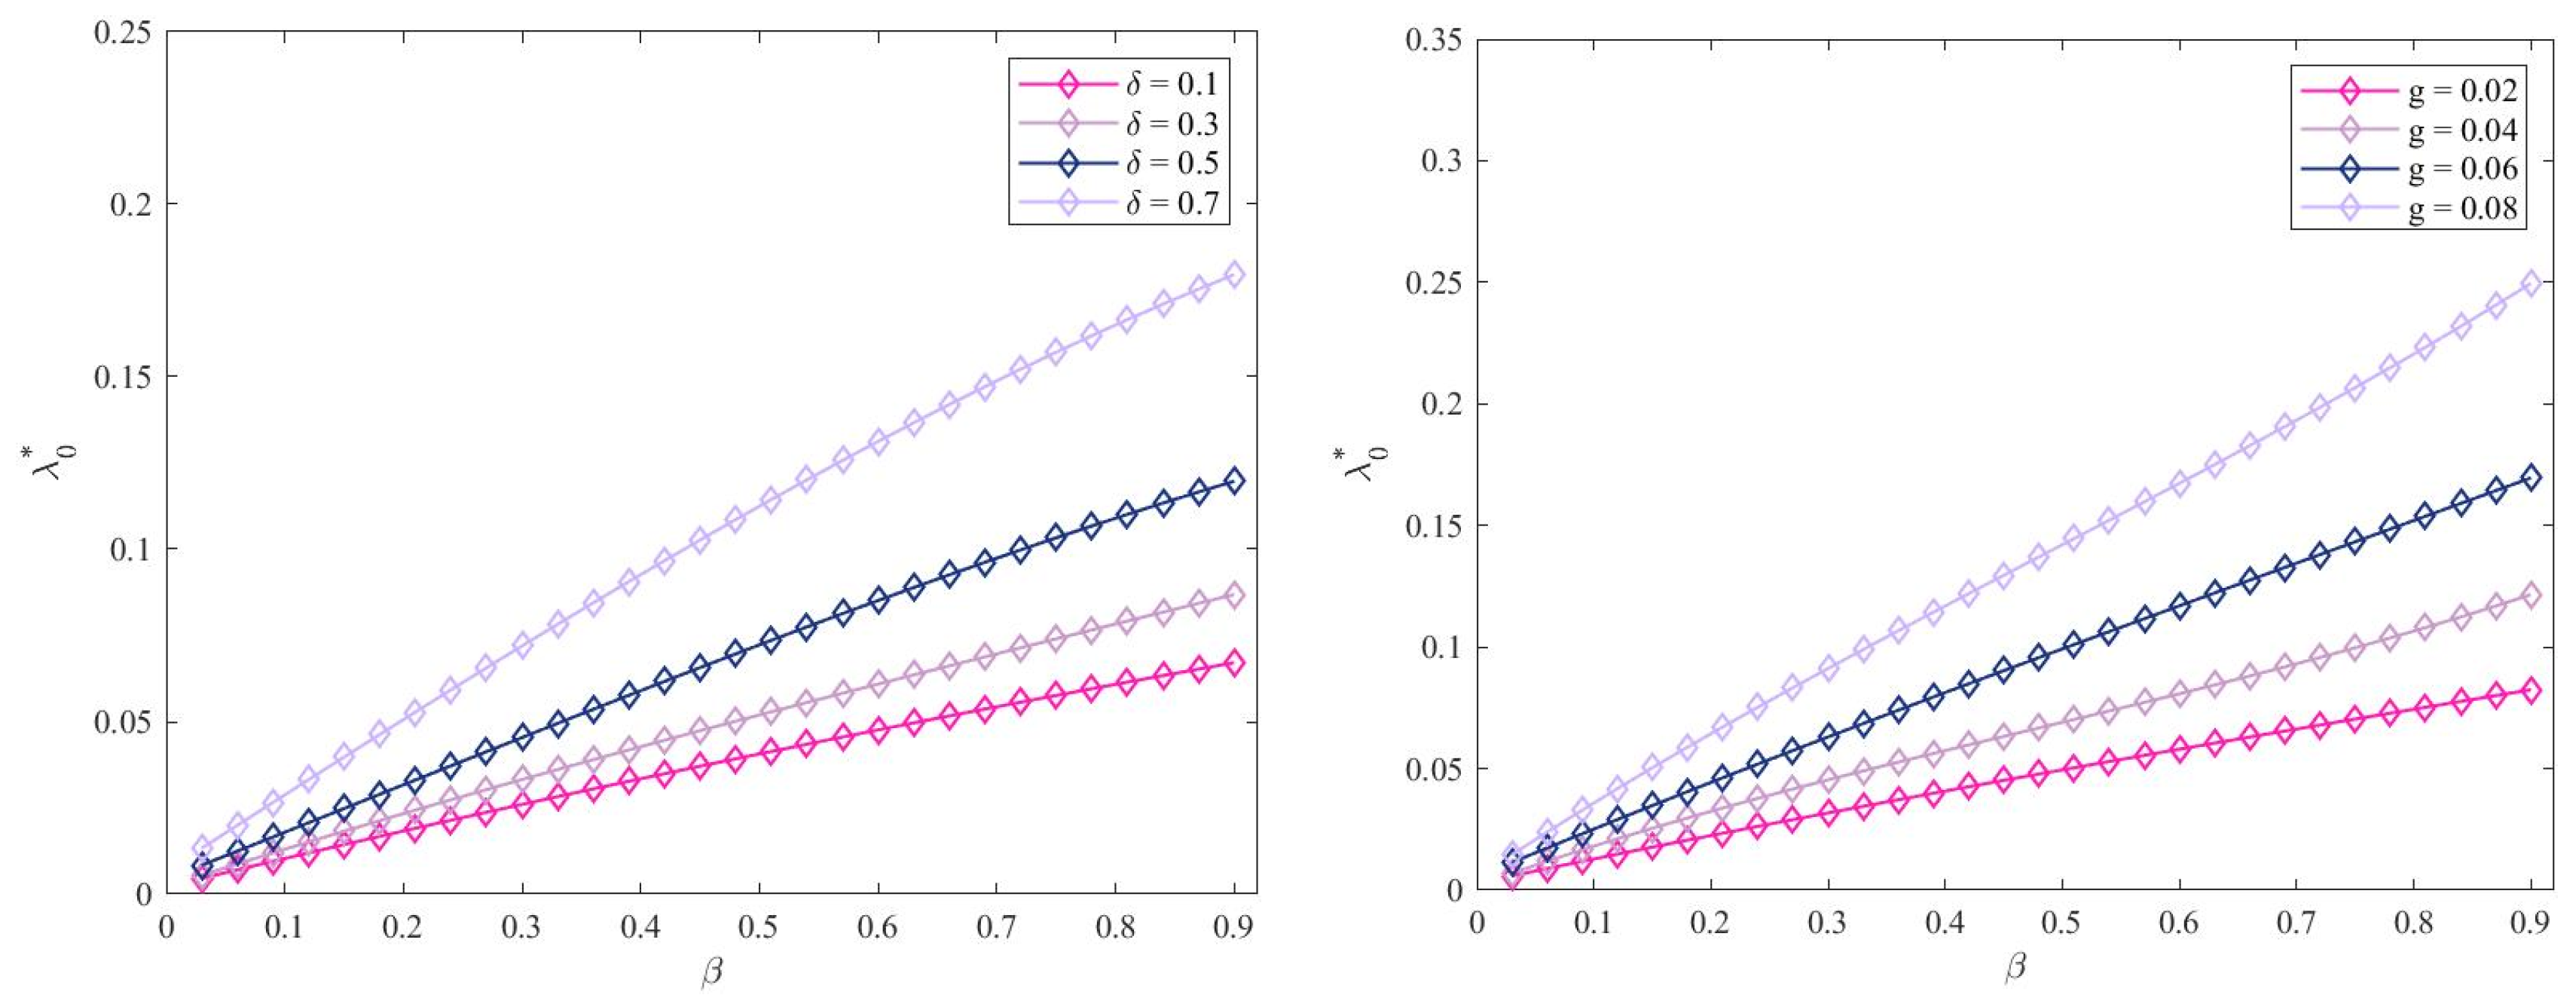
In
Figure 10, under the condition of different herd mentality
and self-vigilance
, the evolutionary tendency is of the risk outbreak threshold
with the increase of recovery rate
when the system reaches a stable state. It can be seen from the two figures that the threshold
increases with the increase in the recovery rate
. Besides this, the herd mentality
and self-vigilance
are positively correlated with the risk outbreak threshold
, where self-vigilance has a more significant impact than the herd mentality. This means, to suppress risk, in addition to improving the recovery rate, improving self-vigilance is more effective than enhancing the herd mentality.
Under the condition of different talent recruitment
and enterprise management
,
Figure 11 depicts the evolution trend of the risk outbreak threshold
with the increase of the recovery rate
. It can be seen that the risk threshold
is an increasing function of the recovery rate
. The threshold increases with the increases in talent recruitment
and enterprise management
. Talent recruitment has a more obvious impact after 0.5, while enterprise management does not need to be great to have an apparent influence. Therefore, to suppress risk, more human and material resources should be awarded to talent recruitment rather than enterprise management.
Finally, in
Figure 12, we present the impact of changes in the values of parameters
and
in the two layers on the risk outbreak threshold
The figure indicates that the risk outbreak threshold increases with the increase in parameters, and talent recruitment
in the cooperation layer has more influence than self-vigilance
in the consciousness layer on the risk outbreak threshold. Hence, it is more effective to take measures directly in the cooperation layer than to raise alertness in the conscious layer to suppress risk.
5. Discussion and Conclusions
The past research on risk diffusion in supply chain networks focused on complex networks. It is difficult to clearly describe the supply chain composed of multiple enterprises and express the increasingly complex relationships in the real supply chain system. This paper proposed a supply chain risk diffusion model, under the hypernetwork vision, to study risk diffusion in the supply chain network. Unlike in the past, this paper’s activity-driven network was a hypergraph-based hypernetwork, which changes the randomness of node links [
13] and selects cooperative nodes according to the degree. Further, the rules for nodes to form hyperedges are expended [
30]. Nodes will generate hyperedges when they become active, and the active rate of nodes changes with the evolution of the network structure. Then, in addition to the influence of previous factors [
8], this paper studied the influence of the herd mentality, self-vigilance, talent recruitment, and enterprise management. Overcoming the limitations of the two results of the Heaviside step function [
18], we came up with the state transition probability function, considering the individual’s judgment ability, which is more in line with the decision made by a manager in reality based on their understanding of the attitudes of surrounding enterprise managers. It is worth mentioning that we verified the correctness of the theoretical derivation by checking the consistency of the MC simulation results with the MMCA results. Finally, according to the MMCA, the risk diffusion scale and the risk diffusion threshold of the supply chain network were analyzed. The following conclusions can be drawn:
- (1)
The risk diffusion scale is negatively correlated with the herd mentality, self-vigilance, talent recruitment, and enterprise management;
- (2)
The risk diffusion threshold is positively correlated with the herd mentality, self-vigilance, talent recruitment, and enterprise management;
- (3)
The indirect influence is not as good as the direct influence; talent recruitment and enterprise management in the cooperation layer are more effective than the alertness-raising of the consciousness layer for restraining the diffusion of risks.
This work provides a detailed analysis of risk diffusion processes in supply chain networks, reporting the utility of this in supply chain management. Today, enterprises ought to increase their vigilance and hone their judgment ability. An enterprise’s leader ought to strengthen their enterprise management and continuously recruit talents, which are of significant importance to promote regional economic development and improve the ability of the supply chain to resist risks. The paper built a mathematical model through MMCA, then used an MC simulation to verify the validity of the model. We suggested how enterprise managers understand the risk diffusion process without a lot of manpower and material resources, and we advised on effective measures to curb the risk.
However, the model has limitations that require further research in the future. Firstly, since the probability of state U transitioning to state A is obtained according to the negative information function proposed by Ran [
29], it has a certain degree of subjectivity. Simulations with real data [
31] and improvements to the probability function should be considered. Secondly, the values of parameters in the numerical simulation were set based on the experience summed up in previous research on supply chain risk diffusion [
8,
9,
32], and there is a certain difference from real events. Applying the model to a real risk diffusion event will better reveal the level of effectiveness of the model [
33]. In addition, the SEIR (susceptible–exposed–infectious–removed) model can express the existence of potential risks in the process of risk diffusion. The degree of cooperation between various enterprises in the supply chain network can also be further described by weighted networks. Therefore, future work should make more effort into the network structure, diffusion mechanism, and testing of the model with real data.


