Article

Delving Deeper into Market Concentration of Poultry Feed and the Driving Factors for Brand Switching: Evidence from Commercial Egg Producers in Nigeria

by
Fatai Abiola Sowunmi
1,
Abeeb Adetunji Bello
1,
Adebayo Isaiah Ogunniyi
2 and
Abiodun Olusola Omotayo
3,*
1
Department of Agricultural Economics, University of Ibadan, Ibadan 200005, Nigeria
2
United Nations International Fund for Agricultural Development (IFAD), Abuja 900211, Nigeria
3
Food Security and Safety Niche Area, Faculty of Natural and Agricultural Sciences, North West University, Mmabatho 2735, South Africa
*
Author to whom correspondence should be addressed.
Sustainability 2022, 14(13), 8030; https://doi.org/10.3390/su14138030
Submission received: 30 March 2022 / Revised: 19 June 2022 / Accepted: 23 June 2022 / Published: 30 June 2022
(This article belongs to the Special Issue Sustainable Agricultural Development Economics and Policy)

Abstract

:
An increase in the price of branded feed has been a major problem for the poultry subsector of Nigerian agriculture, and brand switching for a cheap feed at the expense of quality is a common strategy used by egg-producing farmers. Using descriptive statistics, the Markov chain model and the logistic regression model, our study shows that almost 96% of the egg producers use branded feed while 43.1% switched feed brands because of the increase in the price of their preferred brands. Most farmers used Chikun (39.3%) and Top feed (23.2%) six months before data collection and during data collection, respectively. Our study found that approximately 37% of the feed sellers sold at least 10–50 bags per day. We revealed great inequality regarding market concentration: 50% of the feed sellers accounted for 89.5% of the total bags of feed sold per day. Hybrid had the highest customer loyalty. The study shows that Chikun gained 23.7% and 7.1% from Hybrid and Top feed, respectively, while Hybrid gained 36.0% and 35.7% from Chikun and Top feed (change in loyalty by egg producers), respectively. Membership of an association, distance to feed sellers, flock size and the average price of feed per bag were factors that influenced brand switching of poultry feed among egg producers. The study recommends that the government assists in subsidizing the price of critical ingredients (maize and soya bean) in feed production to prevent the price of eggs (the cheap source of protein) from becoming out of reach for most Nigerians.

1. Introduction

The importance of the poultry industry in the Nigerian economy cannot be over-emphasized. The industry contributes about 25% of agricultural GDP to the Nigerian economy (CBN, 2019). Apart from employment generation, eggs, one of the products of poultry production, are more affordable for the populace sources of animal protein [1,2,3]. Interestingly, egg consumption has jumped from 366,000 tons in 2000 to 598,000 tons in 2015, and projected to reach 947,000 tons by 2030. The poultry meat subsector has grown from 158,000 tons in 2000 to 317,000 tons in 2015, and projected to reach 544,000 tons by 2030 [4]. However, despite the importance of the industry, various challenges of which cost of feed and others factors (high rate of disease and pest attack, lack of loan and credit procurement, lack of technical knowledge, high rate of mortality, supply of poor-quality chicks, inadequate poultry extension services, and inadequate access to and high cost of veterinary services) have prevented the industry from expected performance [5,6].
Feed alone accounts for 70% of the total costs in poultry production [7]. The unabated increase in the price of poultry feed in Nigeria led to the high cost of maize, which constitutes between 50 and 60% of feed ingredients [8]. According to Akinfenwa [9], the price of maize thatwas NGN 80 (USD 0.22)/kg in March 2020, crept to NGN 180 (USD 0.22)/kg and NGN 260 (USD 0.69)/kg in August 2020 (the official exchange rate of dollars to naira in March 2020: USD 1 = NGN 364.55 and August 2020: USD 1 = NGN 378.49) and December 2021, respectively. As a result of the sharp increase in the price of maize, the cost of feed per bag also increased from NGN 3000 (USD 7.87) in March (the average official exchange rate of dollars to naira from March–April 2021: USD 1 = NGN 381) to between NGN 4600 (USD 12.07) and NGN 5300 (USD 13.91) in April. In December 2021, the price of 25 kg poultry feed ranged from NGN 5300 (USD 12.60)–NGN 7950 (USD 18.90) (the average official exchange rate of dollars to naira from March–April 2021: USD 1 = NGN 381), depending on the type and the brand of feed. Several reasons have led to the increase in the price of maize. These include a ban on the importation of maize used to augment the shortfall in the local supply, the problem of armyworm infestation, insecurity and climate change, among others [10]. Financially viable poultry production in Nigeria is essential to keep the cost of protein (e.g., eggs) lower for consumers and is in line with the National Food and Nutrition Policy and Agricultural Food Security and Nutrition Strategy of the Federal Government [11].
The consequence of the high cost of maize has resulted in higher poultry production costs and alteration of the finished poultry feed quality (commercial feed millers often do not meet the requirements of the animals due to the high cost of conventional feedstuffs). This leads to inadequate animal protein intake as a result of poor performance of the host animals fed with the poor-quality diets by some feed miller [12]. According to Madubuike [13], the high cost of feed has remained the major constraint facing poultry production in Nigeria because of the high percentage it accounts for in the total cost of poultry production. The poultry feed industry in Nigeria operates under monopolistic competition where each producer claims product differentiation from others in terms of content (quality) and package. It is a type of imperfect competition such that many producers compete against each other, but sell products that are differentiated to Top feed, Animal care, Chikun, Breedwell, New Hope, Vital and Hybrid, among others. Since these brands are differentiated from each other in the market based on quality and other attributes, the market is not perfectly competitive but rather monopolistically competitive [14,15]. According to Chron Contributor [16], brand switching as an outcome of customer switching behavior describes customers/consumers abandoning a product or service in favor of a competitor. The high cost of feed encourages brand switching among poultry farmers.
With the ever-increasing cost of feed, the likelihood of the commercial egg producer switching to cheaper poultry feed that will make it possible to achieve the profit-maximization goal is becoming unrealistic. The consequence is that many egg farmer workers may opt out of egg production. This may lead to farmworkers losing their jobs. The inability of the remaining few commercial farmers to meet egg demand will increase the price. This would make eggs unaffordable for an average Nigerian. Prior research [17] revealed that a medium-sized egg/crate was sold for NGN 1200 (USD 3.16) in November 2020. The price increased to NGN 1500 (USD 3.94) in March 2021 and is currently sold for NGN 1900 (USD 5.00). In the long run, at the detriment of food security, the pressure on the natural resources (soil and water) for the production of feed ingredients (maize, soybean, sorghum and groundnut) would decline. Tropical deforestation through various human activities, such as intensive crop farming, would not only lead to biodiversity loss and soil degradation, but deforestation is also responsible for significant amounts of greenhouse gas (GHG) emissions [18,19]. The expansion of arable land has driven growth in crop production rather than adoption of improved technology to enhance productivity [20].
Many factors influencing brand switching have been identified in the literature. These include price, promotional activities, brand image, variety and packaging [21,22,23,24], involvement [25,26] and dissatisfaction [25]. The effects of an increase in the price of poultry feed include: a reduction in the number of poultry farmers, the emergence of different poultry feeds that may be marginally cheaper than others, increase in the price of poultry products regarded as a cheap source of protein (egg and chicken), which makes it out of reach for the high percentage of the populace, as well as losses of jobs and livelihoods [27,28,29]. Manipulation of feed ingredients by the feed millers, use of synthetic amino acids, control of feed wastage, enzyme supplements, use of flavors and sourcing for cheap poultry feed are some of the coping strategies being adopted by poultry farmers to cope with the increasing cost of feed [30].
Consumer brand switching behavior has been researched in several studies in the mobile telecommunications, cosmetics, toothpaste, soft drink and banking industries [30,31,32]. Past studies on poultry feed [33,34,35,36,37,38] have concentrated on profitability analysis, quality of poultry feed, alternative feedstuff and marketing. Our study’s aim is to address the gap in the literature on the brand switching of poultry feed among egg producers in southwest Nigeria, which is the nation’s poultry production hub. Here, brand switching is a coping strategy to adapt to higher poultry branded feed prices by commercial egg farmers.
The poultry industry is concentrated in southwest Nigeria, which is a geopolitical zone over six decades old with a poultry population that has steadily grown to 30 million or 60% of the national flock [9]. Our study is timely because the current increases (almost weekly) in the cost of feed has forced many farmers out of business and remaining farmers are searching for coping strategies that would keep them in business. There is a dearth of literature on feed brand switching by poultry farmers unlike other commodities, such as mobile phones, beer, gin, toilet soaps, etc. Therefore, this study seeks to fill these gaps and also provide answers to the following research questions: What are the socioeconomic characteristics of egg farmers/farms and poultry feed sellers in southwest Nigeria? What is the extent of market concentration in the sales of poultry feed in the study area? What is the pattern of brand switching of poultry feed among commercial egg-producing farmers? What are the factors influencing brand switching of poultry feed and the proportion of feed used in the long run by commercial egg-producing farmers? What are the implications of brand switching of poultry feed in the community? Evidence and recommendations from this study are important for policy trajectories and the development of the poultry industry in Nigeria, which enhances and ensures the possibility of household dietary diversity.

2. Theoretical Framework and Literature Review

Production and rational choice theories support our study. Production involves the combination of various material and immaterial inputs (plans, know-how) to produce something for consumption (the output). In the egg production business, feed, day-old chicks, drugs and depreciation on fixed items (the pen, cage, feeder, drinkers, wheelbarrow and shovel, among others) constitute production inputs, while the eggs are the output. Rational choice theory states that individuals use calculations to make rational choices and achieve outcomes in agreement with the objectives [39]. This theory is associated with maximizing an individual’s self-interest. Using rational choice theory is expected to result in outcomes that provide people with the greatest benefit and satisfaction, given the limited option they have available. Many mainstream economic assumptions and theories are based on rational choice theory. Rational choice theory is associated with the concepts of rational actors, self-interest and the invisible hand [39,40]. As an entrepreneur, the motive of a commercial egg farmer is to have good returns on the amount invested through profit maximization. One of the ways to achieve this is to ensure low mortality and having access to quality feed feeds (Chikun, Top, Hybrids and Animal Care, among other brands) at a price that will not undermine profit. This is because feed costs are 60–70% of the cost of egg production. While egg farmers may not influence the cost of poultry feed per bag in the market, they can opt for cheaper poultry feed if their preferred brand of feed is costly [41].
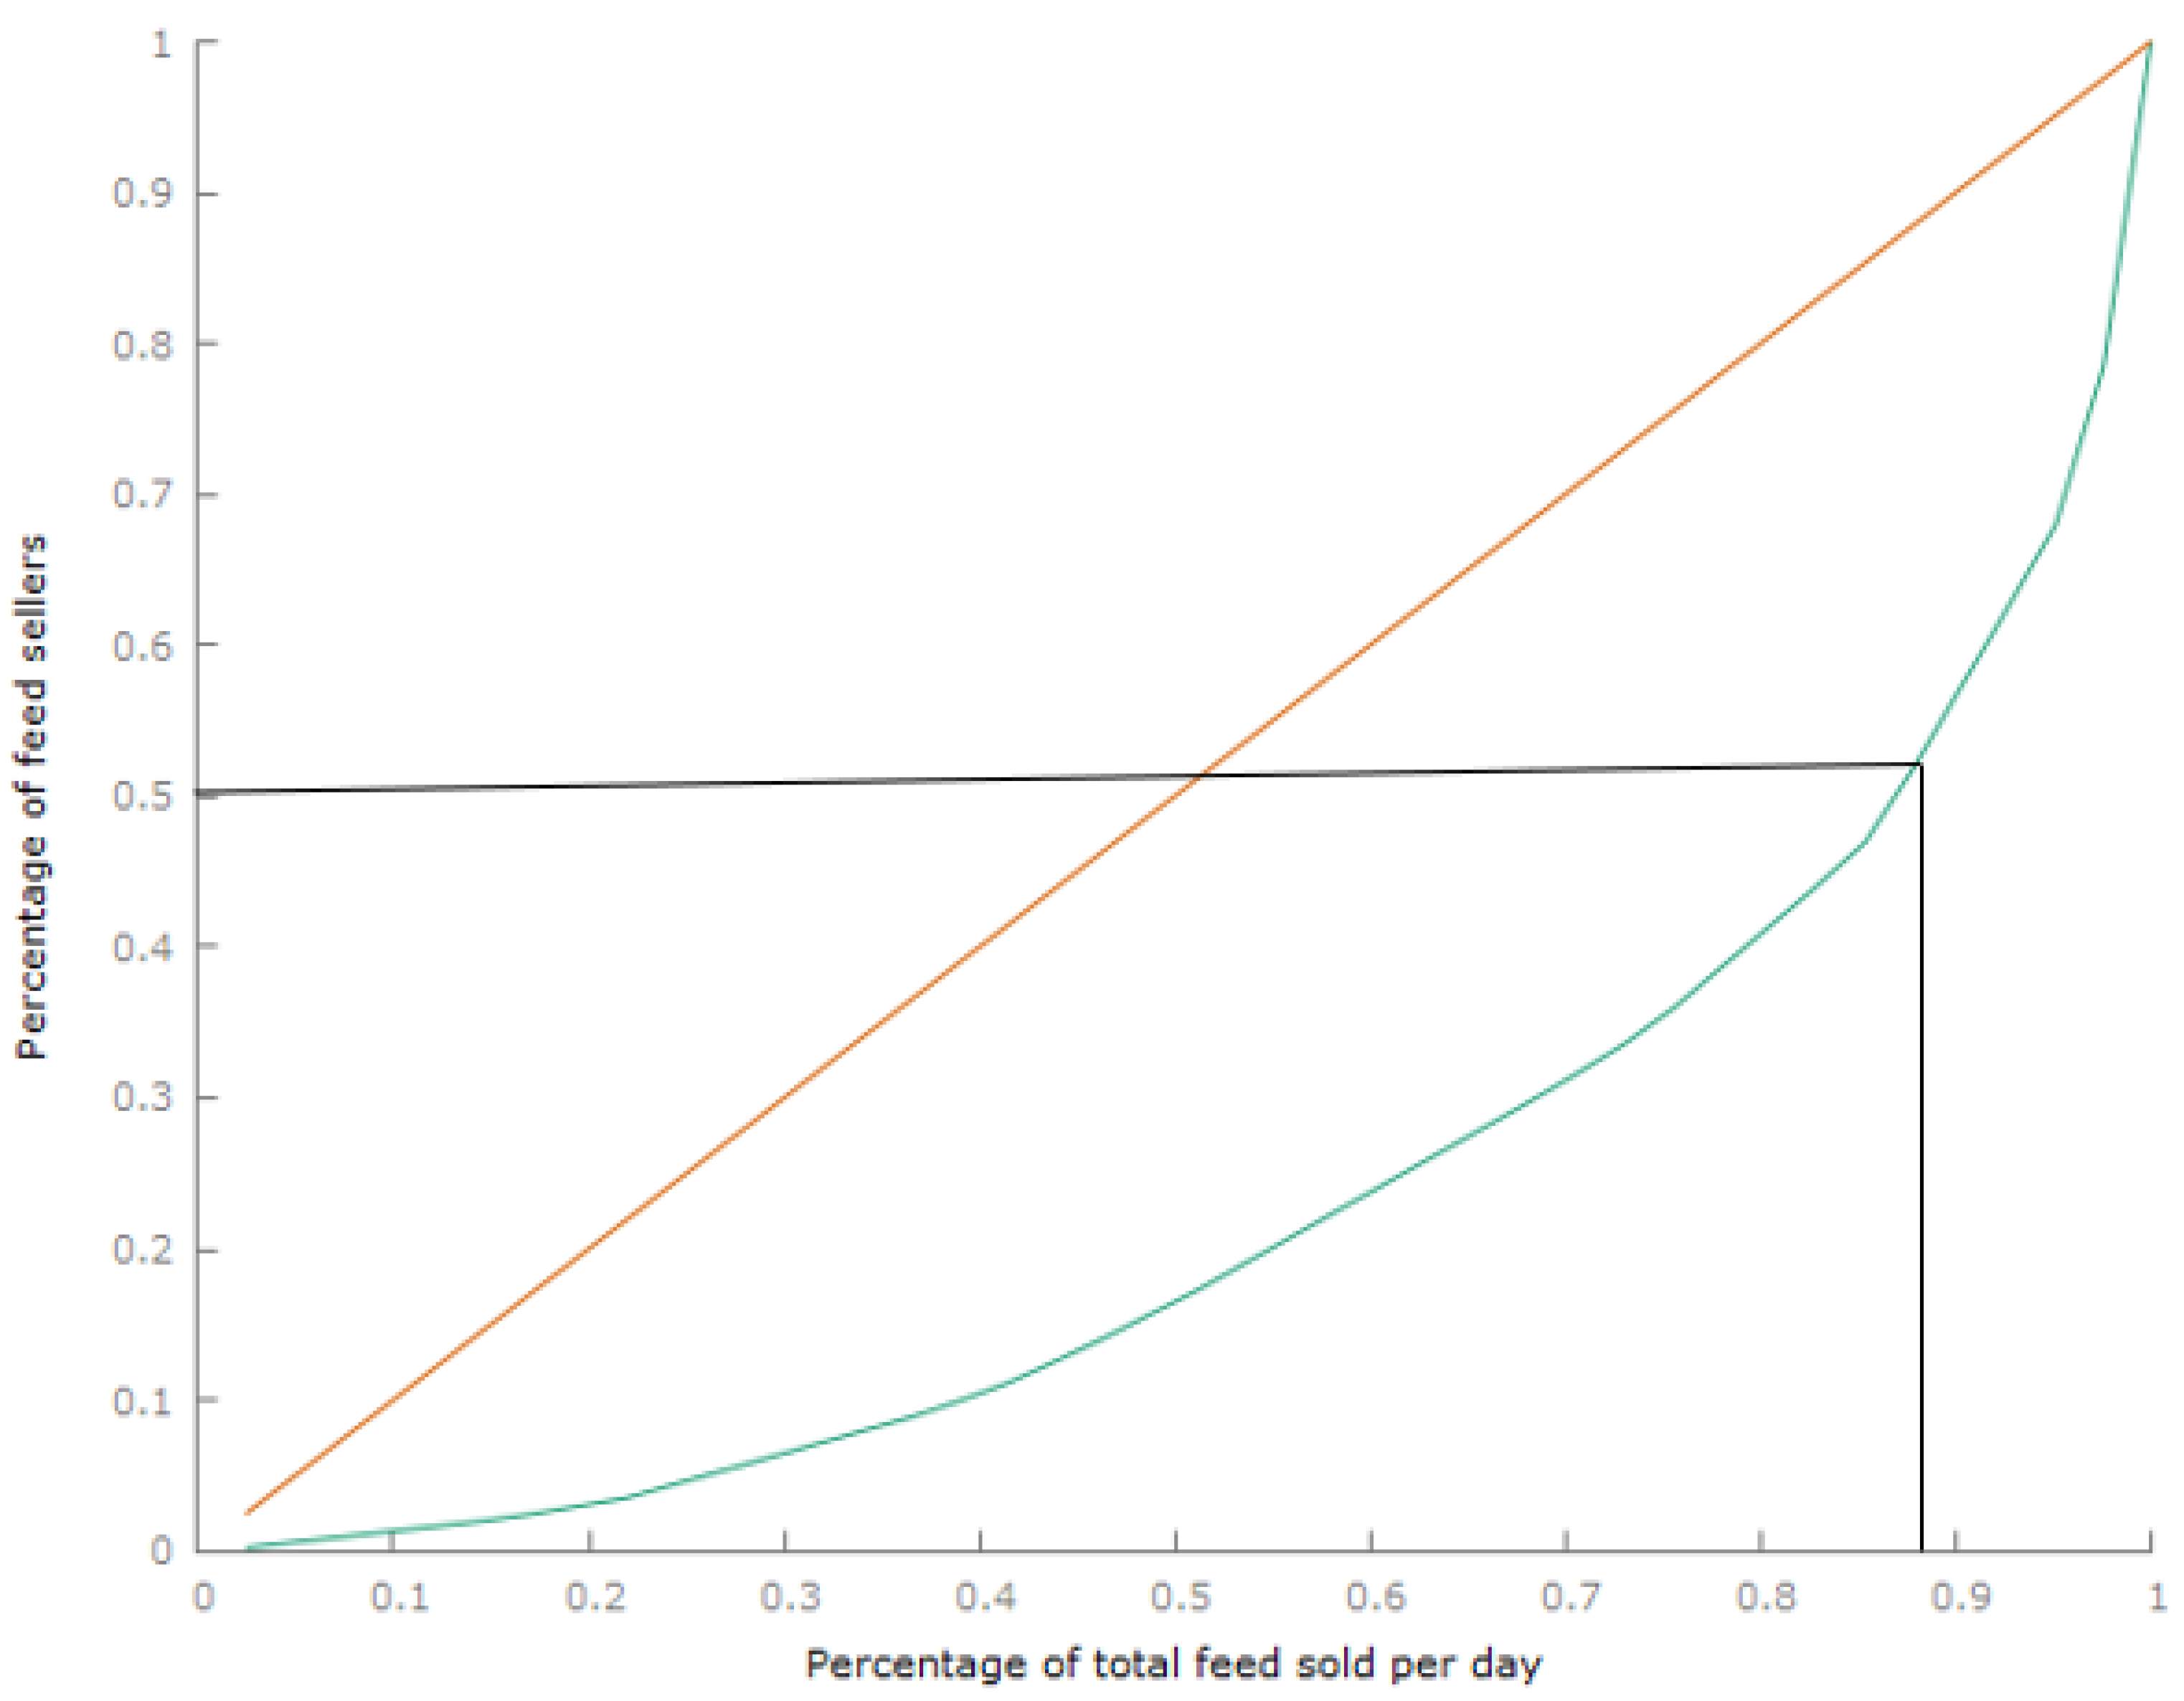
In the literature, Herfindahl–Hirschman, Linda and Horwath indices approaches are methods used to measure the market concentration or of the extent of inequality in the market shares in a particular sector. However, HHI shows sensitivity to firm size, while the Linda index is based on the distribution of the largest firms, not the entire distribution within the sector. It is difficult to find the data required for the estimation of the Horwath index, especially the marginal cost [42]. The Lorenz curve and Gini coefficient were used in this study to measure the extent of market concentration in branded poultry feed. The Lorenz curve is an absolute measure of concentration in which firm size inequality is represented by the convexity of the curve [43]. The Gini coefficient was calculated from the Lorenz curve and this measures the magnitude of the area between the Lorenz curve and the absolute equation line. This area reflects the proportional effect of the firm’s size and control share [42]. The Lorenz curve shows how the variable of interest is distributed among the population. It produces an alert for monopoly emergence.
Several methods (Autoregressive Integrated Moving Average (ARIMA); exponential smoothing and simultaneous equations) have been used in the literature for forecasting. The ARIMA model has been used to make future predictions and this model uses time-series data [44,45]. One of the limitations of the ARIMA model is that the parameters (p, d and q) need to be manually defined. Therefore, finding the most accurate fit can be a lengthy trial-and-error process. The exponential smoothing model has also been used, but it does not recognize seasonal patterns and cannot project trends [46,47]. Simultaneous equation models have also been adopted in many studies [48,49,50,51]. The limitation of this method is that the two-stage least squares (2SLS) estimator is just the ratio of two covariances and it has weak instrumental variables. The 2SLS or general instrumental variables estimator does not exist and is inconsistent. Generalized method of moments (GMM) parameter estimates are usually measured with more errors. GMM estimates have the limitation of small sample properties.
A Markov chain model was used in this study since two consecutive periods were considered (brand of feed in use during data collection and the brand of feed used six months before data collection). A Markov chain or Markov process is a stochastic model describing a sequence of possible events in which the probability of each event depends only on the state attained in the previous event [52]. The state of probabilities at a future instant given the present state of the process does not depend on the state it occupied in the past. Markov chain models have been extensively used in brand switching studies [53,54,55,56,57]. Markov models are generalized and the generated sequences look similar to a sample of the real usage as long as the model captures the operational behavior. The analytical theory of the Markov chain model presumes a formal stochastic process [58].

Analytical Frameworks of the Markov Chain Model

The theory of Markov process assumes the existence of a physical system S, which has a number of possible systems, S1, S2, …, Sn, and which at each instant of time can be in one of these states. The time after each successive trials can be denoted by t0, t1, t2, …, tn, with t0 representing the starting point in time, t1 as the time of conducting the first trialfor Markov chain; the probability of passing to some state S1 at a given time depends on the state that the system was at the preceding time and does not change if you know what the states were at the earlier times. In the Markov chain, Pij is used to denote the transition from one state to another (i to j). The probability transition matrix can be simplified as:
p = ( p 11 p 12 p 13 p 21 p 22 p 23 p 31 p 32 p 33 ) .
To forecast the proportion of the variable of interest at time k:
p ( k ) = p ( 0 ) p k
where:
  • p(k) represents the probability transition matrix at time k, and
  • p(0) represents the probability transition matrix (PTM) at the initial or time zero (0).
At the equilibrium or steady state, the proportion of variable of interest is equal to the proportion multiplied by the PTM given as:
e = e p
where:
  • e can be 1 × 2 when PTM is 2 × 2, 1 × 3 when PTM is 3 × 3, 1 × 4 when PTM is 4 × 4, etc.
  • p istheprobability transition matrix.
For 3 × 3 PTM, e = ep is given as:
( e 1 e 2 e 3 ) = ( e 1 e 2 e 3 ) ( p 11 p 12 p 13 p 21 p 22 p 23 p 31 p 32 p 33 )
This gives three equations:
p 11 e 1 + p 21 e 2 + p 31 e 3 = e 1
p 12 e 1 + p 22 e 2 + p 32 e 3 = e 2
p 13 e 1 + p 23 e 2 + p 33 e 3 = e 3
e 1 + e 2 + e 3 = 1
The total equation from e = ep is four (4). Solving the system of equations for the es produce the required equilibrium probability vector. However, it should be noted that the system of equations provides a set of n + 1 equations. That is, the equations are more than the unknowns—four equations with three unknowns. This shows that one of the equations (first three) is not linearly independent of the others. Therefore, one of the firstthree equations can be removed (assuming Equation (11) is removed) to presentthree equations with three unknowns as:
p 12 e 1 + ( p 22 1 ) e 2 + p 32 e 3 = 0
p 13 e 1 + p 23 e 2 + ( p 33 1 ) e 3 = 0
e 1 + e 2 + e 3 = 1
The solution to the system of equations producesthe equilibrium probability vectors of e1, e2 and e3.

3. Materials and Methods

3.1. Study Area

The study was conducted in South West Nigeria (SWN), which is one of the six geographical zones in Nigeria. Three states (Ogun, Lagos and the Oyo States) were considered out of the six states that make up the zone. SWN falls within latitude 60° to the North and latitude 40° to the South (Figure 1). SWN is bounded in the North by Kogi and Kwara States, in the East by Edo and Delta States, in the South by the Atlantic Ocean and in the West by the Republic of Benin. The zone is characterized by a tropical climate with a distinct dry season between November and March and a wet season between April and October. The mean annual rainfall is 1480 mm with a mean monthly temperature range of 18–24 °C during the rainy season and 30–35 °C during the dry season [59]. The zone has a land area of about 114,271 square kilometers. The total population of the SWN was 27,581,992 in 2006 [60]. Occupations in this region are predominantly crop farming. In addition to crops, this region has the highest concentration of poultry farms in Nigeria and contributed to most of the 646,667 tons of eggs produced in 2020 [9,61].

3.2. Sampling Procedure and Sample Size

A four-stage sampling technique was employed. The first stage was the purposive selection of Ogun, Osun and Lagos States out of the six states that make up SWN, which is known for commercial egg production. In the second stage, two Local Government Areas (LGAs) with a high concentration of poultry farms (egg production) were purposively selected from each state (Ogun; Sagamu and Ikenne, Oyo: Afijio and Iddo, Lagos: Ikorodu and Epe). The third stage involved random sampling of towns/villages where poultry production is concentrated, based on proportionate size. The fourth stage was a random selection of commercial egg farmers proportionate to size based on the list obtained from the local chapter of the Poultry Association of Nigeria (Table 1). Eighty poultry feed sellers were randomly selected based on the list of the sellers in each location. The sample sizes for the egg producers (150) and feed sellers (80) were arrived at using the International Fund for Agricultural Development (IFAD) procedure [62].
The calculated sample sizes (egg producers: 138.2 ≅ 138; feed sellers: 59.0 ≅ 59) for the study were obtained using IFAD procedure based on the formula below. The final sample sizes (150 and 80 for egg producers and feed sellers, respectively) used included allowances for design effect and contingency. The allowance for design effect is expected to correct the difference in design, while the allowance for contingency accounts for contingencies, such as non-response or recording error.
The sample size was obtained using:
n = z 2 p ( 1 p ) m 2
where:
  • n = the sample size;
  • Z = the confidence level at 95% (1.96);
  • p = the estimated percentage of egg producers using branded feed in the study area (90%), estimated percentage of feed sellers with at least two different brands being sold (96%);
  • m = the margin of error (5% or 0.05).
Moreover, 150 and 80 copies of the questionnaires were administered to egg producers and feed sellers, respectively. One hundred and forty copies of completed questionnaires were collected. However, after cleaning the completed questionnaires, 145 copies of the questionnaire for egg producers were good enough for analysis. Additionally, 65 copies of the sellers’ questionnaires were returned, and 62 properly completed questionnaires were used for the analysis (Table 1). Data were collected on the socio-economic characteristics of egg-producing farmers and feed sellers (age, sex, marital status, household size, educational status, sellers’ membership of association and source of credit). Other data collected were farm characteristics that included flock size, bag(s) of feed consumed per day, duration of birds laying and distance to the feed sellers.

3.3. Analytical Techniques

3.3.1. Lorenz Curve and Gini Coefficient

The Lorenz curve was used to show the extent of market concentration in branded poultry feed graphically, while the Gini coefficient was used to complement the Lorenz curve by giving the empirical value of the market concentration or inequality in branded poultry feed markets. The Gini coefficient is expressed mathematically as:
G = 1 k = 1 n ( X k X k 1 ) ( Y k Y k 1 )
where:
  • Xk is the cumulated proportion of the poultry feed sellers.
  • Yk is the cumulated proportion of the sales revenue of poultry feed seller per month.

3.3.2. Markov Chain Model

The probability transition matrix (PTM) was used to determine the pattern of brand switching of poultry feed among commercial egg producers. The study considered only three brands of poultry feed (Chikun, Hybrid and Top feed) that had consistent patronage before (6 months ago) and during the data collection (Table 2). The notation of PTM is given in Equation (1).
Table 2. The probability transition matrix.
Brand Switching of Poultry FeedDuring Data Collection (t)
ChikunHybridTop Feed
Six months before data collection (t − 1)ChikunP11P21P23
HybridP12P22P23
Top feedP13P23P33
where P11, P12, P13, …, P33 represents the probability transition of the poultry egg farmers as theyswitch from one brand of poultry feed to the other, as well as where loyalty is maintained. The initial proportion of the branded poultry feed is given as:
p ( 0 ) = ( t 1 t 2 t 3 )
where t1t3 represents the proportion of the feed sold at the initial stage.

3.4. Logistic Regression

The logistic regression was used to determine the factors influencing brand switching of feed among the egg producers in the study area. Following [63], the logistic regression gives each predictor a coefficient, which measures its independent contribution to variation in the dependent variable. The dependent variable Y takes the value 1 if the response is “Yes that brand switching of feed took place”, and takes a value 0 if the response is “No that there was no brand switching of feed.” The model form for predicted probabilities is expressed as a natural logarithm (ln) of the odds ratio:
ln ( P ( Y ) 1 P ( Y ) ) = β 0 + β 1 X 1 + β 2 X 2 + β 3 X 3 + β 4 X 4 + β 5 X 5 + β 6 X 6 + β 7 X 7 + + β 8 X 8 + β 9 X 9 + β 10 X 10
where:
  • β0 represents the intercept;
  • β1 to β10 represents the regression coefficient;
  • X1 represents the age (year) of respondent;
  • X2 represents the marital status of respondent (married = 1, others = 0);
  • X3 represents the respondent’s household size;
  • X4 represents the respondent’s engagement in other economic activities (Yes = 1, No = 0);
  • X5 represents the respondent’s membership of related organization (Yes = 1, No = 0);
  • X6 represents the respondent’s flock size (population of egg-laying birds);
  • X7 represents the respondent’s years of experience in egg production;
  • X8 represents the respondent’s duration (months) of egg laying by flock;
  • X9 represents the average number of bags of feed (25 kg) fed to birds per day;
  • X10 represents the respondent’s distance (km) to the nearest feed seller;
  • X11 represents the average price (NGN) of feed per bag (25 kg) used by the respondent.

4. Results and Discussion

4.1. Socioeconomic Characteristics of Egg Producers

Our study revealed that most commercial egg production was dominated by males (69.3%), while 29.9% of the respondents were within the age bracket of 38–47 years with an average age of 42.9 years. The average age of egg farmers obtained in the study agrees with the findings of [64] on access to credit by poultry farmers in SWN. Additionally, 2.1% of the poultry farmers had primary school education, while most egg producers (43.4%) had tertiary certificates. Moreover, 57.8% of the egg producers were members of associations. The breakdown of the association membership showed that 88.2% were members of the Poultry Association of Nigeria while 11.8% were members of the Poultry Egg Producers’ Association. However, there was a marginal difference in the percentage of poultry farmers that belonged to associations in the findings of [65] on poultry farmers’ willingness to participate in national agricultural insurance scheme in Oyo State. They recorded 60.3% poultry farmers. The benefit gained was prompt information on the current price of egg per crate through the social medium used by the members. Moreover, 46.2% of the egg producers had 6 to 10 years of experience. The average years of experience in egg production by respondents was 7.7 years. Most poultry farmers (85.2%) in the study area adopted the intensive method of egg production. The average laying period of birds per farmer was 9.3 months, and most egg producers’ birds had been laying for 8 to 10 months. Our study revealed that 95.6% of the farmers used branded feed, which is higher than 55.6% recorded by [66]; most egg producers used 6 to 10 bags (25 kg/bag) to feed birds per day. The average quantity of feed used by farmers to feed their birds per day was 7.7 bags (Appendix A, Table A1). Moreover, 70.1% of the egg producers changed the feed brand used six months before data collection for the study, while 43.1% and 25.5% attributed the change in feed used to the increase in the price of their favorite poultry feed and the availability of the cheaper brand of feed, respectively (Appendix A, Table A1). Out of twelve brands of feed used by farmers in the study area, 39.3%, 18.0% and 14.8% of the egg producers used Chikun, Top and New Hope, respectively, to feed birds six months before data collection for the study. Ten brands of feed commonly used by poultry farmers, namely, Vital, Stellar, Animal care, Breedwell, Amo Byng, Top, Hybrid, Ultima, Chikun and New Hope, were identified by [67]. During the data collection, 23.2% and 21.6% of the farmers used Top and Chikun, respectively, to feed birds (Appendix A, Table A2). The average distance from the farms to the feed sellers was 8.9 km (Appendix A, Table A1).

4.2. Socio-Economic Characteristics of Feed Sellers

Our study showed that 56.5% of the sellers of branded poultry feed were male. This is similar to the finding of [68] conducted in Free State province, South Africa. The average age of the sellers was 32.5 years, and the majority (26.2%) of the feed sellers were within the age range of 28 to 37 years. This finding disagrees with [33,36] that found 45 and 37 years, respectively, in Delta and Imo States. Furthermore, 1.7% and 37.3% of the feed sellers we surveyed had no formal education and Higher National Diploma (HND)/Bachelor of Science (BSc) certificates, respectively. In [69], 1.4% of the feed sellers had no formal education. The average experience in feed sales was 5.3 years, and most respondents had experience in feed sales below the average (positive skewness). Similar studies on feed marketing in Delta and Imo States [33,36] recorded 15 and 12 years experience in feed marketing, respectively. The differences in the years of experience may be attributed to frequent increases in the price of feed over the past year, which has driven many sellers out of the business. Most sellers sold between 10 and 50 bags of feed per day, and the average bag (25 kg) of feed sold was 136.1 bags per day (Appendix A, Table A3). The average number of bags sold per day was higher than 3.3 bags.
The most expensive branded poultry feed was New Hope while Spring was the cheapest six months before the data collection. New Hope and Bonka brands were the most expensive and cheapest, respectively, during data collection (Appendix A, Table A4). Table 3 and Table 4 shows there is asignificant difference in the average price of the different brands of poultry feed in the two periods (p < 0.05). According to [70], the average price of 25 kg bag of poultry feed was NGN 7500 (USD 19.68) (the exchange rate of dollars to naira as at the time of data collection (March 2021): USD 1 = NGN 381).

4.3. Extent of Market Concentration (Inequality) in the Number of Bags of Feed Sold per Day

In the Lorenz curve, the farther away from the curve from the diagonal (line of equality), the more inequality will be encountered. Being away from the diagonal shows more monopolization tendency in the industry [42]. Figure 2 shows that 50% of the poultry feed sellers in the study area controlled about 89.5% of the total sales (bags of feed). The result was confirmed by a Gini coefficient of 0.5377. This showed that there was high inequality (concentration) in the bags of feed sold per day. This means that few sellers were controlling the feed sales in the study area. The high inequality in daily sales may lead to monopoly, thus forcing other sellers out of business. This may be attributed to reduced price compared to others, having assorted brands most of the time, location close to where many farms were sited and good customer relationships, among others. The market concentration of bagged of poultry feed sold was lower (0.302) in Osun State in 2018 [71].

4.4. Pattern of Change in Feed Brands and the Proportion of Change in the Brand in the Long Run

Table 4 shows that consumers of Hybrid feed had the highest rate of brand loyalty (59.1%), followed by Top (57.1%). This means that 59.1% of the egg farmers that bought Hybrid six months before the data for the study were collected used the same feed during data collection. Chikun had the least loyalty of customers (36.0%). Additionally, 57.1% of the egg farmers that used Top feed six months before the data for the study were collected used the same feed during data collection. Moreover, Table 4 reveals that 36% of the egg-producing farmers that purchased Chikun before maintained the brand loyalty status after (during data collection). Chikun gained 23.7% and 7.1% from Hybrid and Top feed, respectively. That is, 23.7% (7.1%) of the egg producers that used Hybrid (Top feed) before changed to Chikun six months after. Hybrid gained 36.0% and 35.7% from Chikun and Top feed (change in loyalty by egg producers), respectively. On the other hand, Top feed gained 28.0% and 13.6% from Chikun and Hybrid. Generally, the change in brand/loyalty appeared to be attributed to an increase in price, a drop in egg production, as well as the scarcity of preferred brands, and many farmers complained during data collection, which is consistent with a study conducted in Irepodun LGA of Kwara State in 2017 [72]. Additionally, [73] revealed that Top feed is prone to more switches than any other brand while Chikun users expressed the least switches. They posited that the Top feed brand has more latent competitors and may be more prone to switching experiences in case of failed customer experiences or when the brand is out of stock in the retail outlets.
The predictions for k = 1 and k = 2 showed that six months after the data collection, 23.3% of the egg producers would purchase Chikun, while 45.1% and 31.6% would use Hybrid and Top feed, respectively. Additionally, twelve months after the data were collected, 22.9%, 46.3% and 30.7% of the egg producers in the study area would purchase Chikun, Hybrid and Top feed, respectively. Moreover, our study affirmed that at equilibrium (long-run prediction), the proportion of egg farmers buying the three brands of feed would be 23.0% for Chikun, 46.8% for the hybrid and 30.2% for the Top feed.

4.5. Determinants of Brand Switching in Poultry Feed among Egg-Producing Farmers

The independent variables considered in the logistic regression model were age (years), marital status, household size, engagement in other activities, membership of association, flock size, experience in egg production, duration in bird laying, bags of feed given per day, distance to feed sellerandthe average price of poultry feed. The log-likelihood value of −52.820865, LR chi2 (11) = 32.73, Prob > Chi2 = 0.0006 and Pseudo R2 = 0.237 affirmed that the explanatory variables in the model predicted the outcome of the model effectively. Out of the eleven independent variables captured in the model, the coefficients of five variables (membership of an association, flock size, bags of feed used per day, distance to feed sellers and average price of feed) significantly influenced consumer brand switching. Specifically, other variables included in the model were not significant (Table 5).
The membership of association variable had a significant (p < 0.1) and positive relationship with brand switching of poultry feed by the farmers in the study area. The result implies that farmers’ memberships in the association would increase the probability of brand switching of feed by 19.5%. This may be attributed to the access to information and new technology by members of associations. The result shows that as the flock size increases, the probability of brand switching increases, especially when there is an increase in the price of feed or a drop in the birds’ production. As the number of bags used per day increases in an inflationary economy, the likelihood of the farmer opting for cheaper feed increases. The coefficient of distance to feed sellers was significant at 10% and had a positive relationship with brand switching of poultry feed by the farmers in the study area. This shows that the further the feed seller is from the farm, the higher the probability that the farmer would engage in brand switching of feed. This may be the case to reduce the cost of production, most especially the cost of transporting feed from a distance far away from the farm. This finding agrees with a non-agricultural study [74] in Indonesia that an increase in distance to the preferred brand increases the likelihood to switch to another brand nearby. The result also revealed that the average price of feed had a negative relationship with brand switching of poultry feed by the farmers in the study area. This shows that as the price of the feed band increases, the probability that a farmer would switch the brand of feed used increases by 1.6%. The negative relationship with brand switching agrees with a study conducted in Manado by [75] that an increase in the price of a branded commodity increases the decision of the buyer to switch brands.

4.6. Community Sustainability Implications

The expected positive impact of the commercial egg farmers on the immediate environment hinges on sustainable production. A good return on the capital invested is important for economic sustainability. Since feed accounted for the major cost of production, the availability of poultry feed at a reasonable price is germane to achieve the profit maximization objective. However, brand switching may be able to keep poultry farmers in business with the increasing cost of poultry feed, as confirmed in Table 3. This may lead to farmers opting out of egg production, and by extension, the farm workers who serve as an important component of the rural economy would be jobless. As many as 350,000 poultry farmers were forced out of business in Ogun State alone, while others are reducing their flocks (reduction in labor) due to the high cost of feed making egg production unattractive [76]. Though, to the detriment of food security, the reduction in the number of poultry farmers may reduce the pressure of clearing vegetation all the time for the cultivation of maize, soybeans, sorghum and groundnut used in poultry feed production to meet increased demand. Intensive crop management practice is accompanied by the use of fertilizers, herbicides and heavy farm machines. These inputs escalate rates of land degradation as well as soil and water deterioration [77,78,79,80].

5. Conclusions and Recommendations

The importance of the poultry industry in the Nigerian economy cannot be over-emphasized. This study estimated the extent of market concentration of the sales of poultry feeds, the pattern of brand switching of poultry feed among egg-producing farmers, and factors influencing brand switching of poultry feed and the proportion of feed used in the long run among the egg-producing farmers. The result shows that there is great inequality in the number of bags of branded feed sold in the study area, which suggestamonopolistic market in branded feed may force feed sellers out of the business. A substantial percentage of poultry farmers engaged in brand switching of poultry feed attributed to an increase in the price and the distance to the sellers of choice feed. However, the buyers of Hybrid and Top feeds were more loyal to the feed sellers compared to other brands. Further research on the impacts of brand switching in poultry feed on the profitability of commercial egg farmers is advocated.
Since most egg-producing farmers attributed the increase in the price of feed to brand switching behavior, it is recommended that the government assists in subsidizing the price of critical ingredients (maize and soybean) in feed production to reduce the frequent increase in the price of feed. The Poultry Association of Nigeria should mandate state branches to embark on the backward integration of the production of maize and soybean. The Feed Dealers Association should ensure that the emerging monopolists in the feed market are addressed to protect the small feed sellers. This may be accomplished by engaging the expertise of marketing specialists. However, as long as the cost of feed continues to increase, poultry egg farmers will keep on searching for cheaper brands of feed that they believe will help reduce their cost of production to sustain their business.

Author Contributions

Conceptualization, F.A.S. and A.A.B.; methodology, F.A.S. and A.I.O.; software, F.A.S.; validation, F.A.S. and A.O.O.; formal analysis, F.A.S. and A.I.O.; data curation, A.O.O. and F.A.S.; writing—original draft preparation, F.A.S. and A.O.O., writing—review and editing, F.A.S., A.I.O. and A.O.O.; supervision, F.A.S. All authors have read and agreed to the published version of the manuscript.

Funding

This research received no external funding.

Institutional Review Board Statement

Not applicable.

Informed Consent Statement

Informed consent was obtained from all participants in the study.

Data Availability Statement

Data are available upon request from the first author.

Acknowledgments

The authors appreciate their respective institutions for providing an environment to conduct this research study.

Conflicts of Interest

The authors declare no conflict of interest.

Appendix A

Table A1. Socioeconomic characteristics of egg producers.
Socioeconomic CharacteristicsFrequencyPercentage (%)
Age (Year) Distribution
18–271410.2
28–373122.6
38–474129.9
48–574029.2
58–6796.6
68–7721.5
Total137100
Experience (years) in egg production
1–54131.1
11–152518.9
16–2053.8
6–106146.2
Total132100
Average experience7.7
Educational level
Primary education32.1
Secondary education3624.8
OND/NCE2819.3
BSC/HND6343.4
Post-graduate1510.3
Total145100
Sex of respondents
Female4230.7
Male9569.3
Total137100
Average bag (25 kg) of feed birds consumed per day per farmer
1–55641.2
6–105036.8
11–151511.0
16–20118.1
21 andabove42.9
Total136100
Average bags consumed7.7 bags
Flock size distribution
At most 100 birds32.2
101–5003626.7
501–10004231.1
1001–15002014.8
1501 and above3425.2
Total135
Average1309.3
Membership of association
No3842.2
Yes5257.8
Association
Poultry Association of Nigeria PAN7550.0
Poultry Egg Producers’ Association106.7
Benefits from association
New sales point34
New sales point and price preference1417.9
Price preference3038.5
Total78100.0
Management Practice
Intensive11585.2
Semi-intensive2014.8
Total135100
Laying period (month)
2–4107.8
5–73325.6
8–104333.3
11–132519.4
14–161310.1
17–2053.9
Total129
Branded feed usage
No64.4
Yes12895.6
Total135100.0
Reason for change in brand used
Availability of cheap feed2625.5
Decline in birds productivity1918.6
Increase in feed price4443.1
Reduction in egg size65.9
Scarcity of the preferred brand76.9
Distance (km) to feed sellers
1–54331.2
6–105539.9
11–152014.5
16–2085.8
20 and above128.7
Total138100.0
Average distance8.9
Table A2. Distribution of branded feeds used by farmers before and during data collection.
BrandSix Months Before Data CollectionBrandDuring Data Collection
FreqPercent (%)FreqPercent (%)
Amobyng43.3Amobyng64.8
Animal care21.6Animal care21.6
Breedwell21.6Biacom10.8
Chikun4839.3Bonka10.8
Hi pro32.5Breedwell10.8
Hybrid1310.7Chikun2721.6
Livestock54.1Cornerstone21.6
New hope1814.8Hi pro43.2
Spring21.6Hybrid2419.2
Top2218.0Livestock129.6
Victory10.8New hope118.8
Vital21.6Spring feed21.6
Total122100Top2923.2
Vita feed32.4
Total125100
Table A3. Socioeconomic characteristics of branded poultry feed sellers.
Socioeconomic CharacteristicsFrequencyPercentage (%)
Sex of respondents
Male3556.5
Female2743.5
Total62100.0
Age (year) range of feed sellers
18–271524.6
28–371626.2
38–471626.2
48–571016.4
58–6746.6
Total61100.0
Average age32.5
Experience (year) of feed sellers
1–42848.3
5–82136.2
9–12610.3
Above 1235.2
Total58100
Average5.3
Educational level
No formal education11.7
Primary education35.1
Secondary education1728.8
OND/NCE1220.3
BSC/HND2237.3
Post-graduate46.8
Total59100
Bags of different
brands sold per day
10–501536.6
60–1001331.7
105–160717.1
270–30549.8
585–120024.9
Total41100
Average136.1
Table A4. Distribution of price per bag of branded feed used by farmers before and during data collection.
BrandPrice (NGN) per 25 kg Six Months Before Data CollectionBrandPrice (NGN) per 25 kg during Data Collection
Spring4300.0Amo5625.0
Animal Care4650.0Animal care5562.5
Bonka4600.0Bonka5150.0
Chikun4635.0Chikun5625.6
Hybrid4571.6Hybrid5250.0
New Hope5400.0Livestock5325.0
Top4787.5New hope5950.0
Top5781.4
Hi pro5200.0
Victory5300.0
N.B: Exchange rate of dollars to naira in March 2021 when the data were collected was USD 1 = NGN 381.

References

  1. Heise, H.; Crisan, A.; Theuvsen, L. The poultry market in Nigeria: Market structures and potential for investment in the market. Int. Food Agribus. Manag. Rev. 2015, 18, 197–222. [Google Scholar]
  2. Aboki, E.; Jongur, A.A.U.; Onu, J.I. Productivity and technical efficiency of family poultry production in Kurmi Local Government Area of Taraba State, Nigeria. J. Agric. Sustain. 2013, 4, 52–66. [Google Scholar]
  3. Ojo, S.O. Productivity and Technical Efficiency of Poultry Egg Production in Nigeria. Int. J. Poult. Sci. 2003, 2, 459–464. [Google Scholar]
  4. Chiekezie, N.R.; Nwankwo, E.C.; Ozor, M.U. Analysis of Small Scale Broiler Poultry Production in South East Nigeria, West Africa. Int. J. Anim. Livest. Prod. Res. 2022, 6, 1–16. [Google Scholar]
  5. Anosike, F.; Rekwot, G.; Owoshagba, O.; Ahmed, S.; Atiku, J. Challenges of poultry production in Nigeria: Areview. Niger. J. Anim. Prod. 2018, 45, 252–258. [Google Scholar] [CrossRef]
  6. Hafez, H.M.; Attia, Y.A. Challenges to the poultry industry: Current perspectives and strategic future after the COVID-19 outbreak. Front. Vet. Sci. 2020, 7, 516. [Google Scholar] [CrossRef]
  7. Netherlands Enterprise Agency. Poultry Sector Study Nigeria. 2020. Available online: https://www.rvo.nl/sites/default/files/2020/10/Poultry-Sector-Study-Nigeria.pdf (accessed on 29 March 2022).
  8. Poultry World. Nigeria: Shortage of Maize Is Crippling the Poultry Industry. 2020. Available online: https://www.poultryworld.net/poultry/nigeria-shortage-of-maize-is-crippling-the-poultry-industry/ (accessed on 29 March 2022).
  9. Akinfenwa, G. High Cost of Feeds Threaten Southwest Poultry-Farms. 2021. Available online: https://guardian.ng/features/high-cost-of-feeds-threaten-southwest-poultry-farms/#:~:text=PHOTO%2FKHALED%20DESOUKI-,As%20predicted%20last%20December%20by%20the%20national%20body%20of%20the,of%20the%20industry%20anytime%20soon (accessed on 29 March 2022).
  10. Šūmane, S.; Kunda, I.; Knickel, K.; Strauss, A.; Tisenkopfs, T.; des Ios Rios, I.; Rivera, M.; Chebach, T.; Ashkenazy, A. Local and farmers’ knowledge matters! How integrating informal and formal knowledge enhances sustainable and resilient agriculture. J. Rural Stud. 2018, 59, 232–241. [Google Scholar] [CrossRef]
  11. Youssoufane, A. Shaping national food and nutrition policy in Nigeria. Nutr. Exch. 2017, 8, 28. [Google Scholar]
  12. Jiwuba, P.; Dauda, E.; Ezenwaka, L.; Eluagu, C. Replacement value of maize with sweet potato (Ipomoea batata) root meal on growth performance and haematogical characteristics of broiler starter birds. Arch. Curr. Res. Int. 2016, 53, 1–7. [Google Scholar] [CrossRef]
  13. Madubuike, F.N. Bridging the Animal Protein Supply and Demand Gap in Nigeria; Inaugural lecture; Serial No.: 7; Imo State University: Owerri, Nigeria, 2012. [Google Scholar]
  14. Krugman, P.R.; Obstfeld, M. International Economics: Theory and Policy; Addison-Wesley: Boston, MA, USA, 2008. [Google Scholar]
  15. Poiesz, T.B.C. The Free Market Illusion Psychological Limitations of Consumer Choice. Rev. Bus. Econ. Lit. 2004, 49, 309–338. [Google Scholar]
  16. Chron Contributor. Concept of Consumer-Switching Behavior. 2020. Available online: https://smallbusiness.chron.com/concept-consumerswitching-behavior-65092.html (accessed on 29 March 2022).
  17. Abdulkareem, M.; Udegbunam, O. Special Report: Nigeria’s Poultry, Egg Prices ‘Highest Ever’ amidst Inflation, Insecurity. 2021. Available online: https://www.premiumtimesng.com/news/headlines/450185-special-report-nigerias-poultry-egg-prices-highest-ever-amidst-inflation-insecurity.html (accessed on 29 March 2022).
  18. Henders, S.; Persson, U.M.; Kastner, T. Trading forests: Land-use change and carbon emissions embodied in production and exports of forest-risk commodities. Environ. Res. Lett. 2015, 10, 125012. [Google Scholar] [CrossRef]
  19. Busch, J.; Engelmann, J.; Cook-Patton, S.C.; Griscom, B.W.; Kroeger, T.; Possingham, H. Potential for low-cost carbon dioxide removal through tropical reforestation. Nat. Clim. Chang. 2019, 9, 463–466. [Google Scholar] [CrossRef]
  20. Silva, G. Feeding the World in 2050 and Beyond—Part 1: Productivity Challenges. 2018. Available online: https://www.canr.msu.edu/news/feeding-the-world-in-2050-and-beyond-part-1 (accessed on 29 March 2022).
  21. Manzoor, U.; Baig, S.A.; Usman, M.; Shahid, M.I. Factors affecting brand switching behavior in telecommunication: A Quantitative Investigation in Faisalabad region. J. Mark. Inf. Syst. 2020, 3, 63–82. [Google Scholar]
  22. Veloutosou, C.; Gioulistanis, E.; Moutinho, L. Own label choice criteria and perceived characteristics in Greece and Scotland: Factors influencing willingness to buy. J. Prod. Brand Manag. 2004, 13, 228–241. [Google Scholar] [CrossRef]
  23. Ness, N.; Gorton, M.; Kuznesof, S. The student food shopper. Br. Food J. 2002, 104, 506–525. [Google Scholar] [CrossRef]
  24. Dick, A.; Jain, A.; Richardson, P. How consumers evaluate store brands. J. Prod. Brand Manag. 1996, 5, 19–28. [Google Scholar] [CrossRef]
  25. Shukla, P. Effect of product usage, satisfaction and involvement on brand switching behaviour. Asia Pac. J. Mark. Logist. 2004, 16, 82–105. [Google Scholar] [CrossRef]
  26. Baltas, G. Determinants of store brand choice: A behavioral analysis. J. Prod. Brand Manag. 1997, 6, 315–324. [Google Scholar] [CrossRef]
  27. Awodola, B.; Agyeno, O. Terrorismin Northern Nigeria: A threat to food security in Maiduguri. Mediterr. J. Soc. Sci. 2015, 6, 11–17. [Google Scholar]
  28. Onuoha, C.; Onyemaobi, O.O.; Anyakwo, C.N.; Onegbu, G.C. Effect of filler content and particle size on the mechanical properties of corn cob powder filled recycled polypropylene composites. Am. J. Eng. Res. 2017, 6, 72–79. [Google Scholar]
  29. Falodi, F.; Adeoye, G.; Ajaja, T.; Alagbe, J. Chickens Forced to Skip Meals as Cost of Poultry Feed Rises by 100% n.d. Available online: https://punchng.com/chickens-forced-skip-meals-cost-poultry-feed-rises-100/ (accessed on 28 March 2022).
  30. Hussain, K.; Rizwan, M. Customer loyalty and switching behavior of customer for Pepsi in Pakistan. J. Public Adm. Gov. 2014, 4, 129–145. [Google Scholar] [CrossRef]
  31. Umoh, G.; Awa, H.O.; Ebitu, T. Markovian Application to Brand Switching Behaviour: A Survey of Toothpaste. Eur. J. Bus. Manag. 2013, 5, 110–124. [Google Scholar]
  32. Nimako, S.G. Consumer switching behaviour: A theoretical review and research agenda. Res. J. Soc. Sci. Manag. 2012, 2, 74–82. [Google Scholar]
  33. Gbigbi, T.M.; Chuks-Okonta, V. Performance analysis of poultry feed marketers in Delta State, Nigeria. Int. J. Rural Dev. Environ. Health Res. 2020, 4, 145–154. [Google Scholar] [CrossRef]
  34. Wali, A.F.; Wright, L.T.; Uduma, I.A. Customer relationship management for brand commitment and brand loyalty. Br. J. Mark. Stud. 2015, 3, 45–58. [Google Scholar]
  35. Dejene, M.; Bediye, S.; Alemu, D.; Kitaw, G.; Kehaliw, A.; Assefa, G.; Tadesse, G. Livestock feed marketing in Ethiopia: Challenges and opportunities for livestock development. J. Agric. Sci. Technol. A 2014, 4, 155–168. [Google Scholar]
  36. Emenyonu, C.; Nkemka, C. Profitability analysis of poultry feed marketing in Imo State, Nigeria. World Poult. Sci. J. 2013, 69, 407–413. [Google Scholar] [CrossRef]
  37. Idahor, K.O. Alternative feed stuffs utilization in Nigerian poultry industry: Potentials, problems and prospects. World Poult. Sci. J. 2013, 69, 666–675. [Google Scholar] [CrossRef]
  38. Achoja, F.; Ofuoku, A.; Okoh, R. Linkages between socio-economic variables and the efficient marketing of poultry feeds in Delta State, Nigeria:Implication for extension services. World Poult. Sci. J. 2006, 62, 709–715. [Google Scholar]
  39. Paternoster, R.; Jaynes, C.M.; Wilson, T. Rational choice theory and interest in the“fortune of others”. J. Res. Crime Delinq. 2017, 54, 847–868. [Google Scholar] [CrossRef]
  40. Levin, J.; Milgrom, P. Introduction to Choice Theory 2004. Available online: https://web.stanford.edu/~jdlevin/Econ%20202/Choice%20Theory.pdf (accessed on 26 April 2022).
  41. Cabanias, J.O. Why Does Choice Matter? Eur. J. Educ. Pedagog. 2021, 2, 21–37. [Google Scholar] [CrossRef]
  42. Ukav, I. Market Structures and Concentration Measuring Techniques. Asian J. Agric. Ext. Econ. Sociol. 2017, 19, 1–16. [Google Scholar] [CrossRef]
  43. Clarke, R. Industrial Economics; Blackwell: Cambridge, MA, USA, 1993. [Google Scholar]
  44. Mgaya, J. Application of ARIMA models in forecasting livestock products consumption in Tanzania. Cogent Food Agric. 2019, 5, 2–29. [Google Scholar] [CrossRef]
  45. Kaltoch, R.; Sidhu, A. An Application of ARIMA Model to Forecast the Dynamics of COVID-19 Epidemic in India. Glob. Bus. Rev. 2021, 1–14. [Google Scholar] [CrossRef]
  46. Kumar, M.; Anand, M. Anapplication of time series ARIMA forecasting model for predicting sugarcane production in India. Stud. Bus. Econ. 2014, 9, 81–94. [Google Scholar]
  47. Shastri, S.; Sharma, A.; Mansotra, V. A Model for Forecasting Tourists Arrival in J and K, India. Int. J. Comput. Appl. 2015, 129, 32–36. [Google Scholar]
  48. Evans, R.W. Generalized Method of Moments (GMM) Estimation. 2018. Available online: https://notes.quantecon.org/submission/5b3b1856b9eab00015b89f90#:~:text=GMM%20allows%20for%20most%20flexible,enough%20to%20identify%20the%20parameters (accessed on 29 March 2022).
  49. Roberts, M.J.; Schlenker, W. World supply and demand of food commodity calories. Am. J. Agric. Econ. 2009, 91, 1235–1242. [Google Scholar] [CrossRef]
  50. Lin, C.Y. Estimating supply and demand in the world oil market. J. Energy Dev. 2008, 34, 1–32. [Google Scholar]
  51. Epple, D.; McCallum, B.T. Simultaneous equation econometrics: The missing example. Econ. Inq. 2006, 44, 374–384. [Google Scholar] [CrossRef] [Green Version]
  52. Gagniuc, P.A. Markov Chains: From Theory to Implementation and Experimentation; John Wiley & Sons: New Jersey, NJ, USA, 2017. [Google Scholar]
  53. Adekoya, A.; Oyatoye, E. Modelling online retailing repurchase and switching behaviour of nigeria millennials using continuous time Markov chain (ctmc). UNILAG J. Bus. 2021, 7, 216–225. [Google Scholar]
  54. Meher, N.; Afzal, H.; Zakir, H.; Bhuiyan, H.; Kabir, C. Markov analysis for assessing consumers’ brand switching behavior: Evidence from telecommunication sector in Bangladesh. Int. J. Educ. Soc. Sci. 2021, 8, 55–67. [Google Scholar]
  55. Neger, M. Consumers’ Attitude towards Brand Switching: A Study on Telecommunication Sector in Bangladesh. Ph.D. Thesis, University of Dhaka, Dhaka, Bangladesh, 2018. Available online: https://repository.library.du.ac.bd:8080/handle/123456789/1392 (accessed on 25 March 2022).
  56. Brezavšček, A.; Bach, M.P.; Baggia, A. Markov analysis of students’ performance and academic progress in higher education. Organizacija 2017, 50, 83–95. [Google Scholar] [CrossRef] [Green Version]
  57. Shujaat, S.; Ahmed, U.; Syed, N.A. Factors behind brand Switching in telecom sector of Pakistan. IBT J. Bus. Stud. 2015, 11, 29–40. [Google Scholar]
  58. Wohlin, C.; Höst, M.; Wesslén, A.; Runeson, P. Software Reliability. Encycl. Phys. Sci. Technol. 2001, 15, 25–39. [Google Scholar]
  59. Aderogba, K.A. Substantive causes and effects of floods in south western Nigeria and sustainable development of the cities and towns. J. Emerg. Trends Educ. Res. Policy Stud. 2012, 3, 551–560. [Google Scholar]
  60. Makama, S.I.D. Report of Nigeria’s National Population Commissionon the 2006 census. Popul. Dev. Rev. 2007, 33, 206–210. [Google Scholar]
  61. Knoema. Nigeria—Production of Eggs Primary. 2021. Available online: https://knoema.com/atlas/Nigeria/topics/Agriculture/Live-Stock-Production-Production-Quantity/Production-of-eggs-primary (accessed on 29 March 2022).
  62. International Fund for Agricultural Development (IFAD). Calculating the Sample Size. n.d. Available online: http://www.ifad.org/gender/tools/hfs/anthropometry/ant_3.htm (accessed on 29 March 2022).
  63. Boateng, E.Y.; Abaye, D.A. A review of the logistic regression model with emphasis on medical research. J. Data Anal. Inf. Processing 2019, 7, 190–207. [Google Scholar] [CrossRef] [Green Version]
  64. Akintunde, O.; Coster, A.; Nwigwe, C.; Agboola, T. An analysis of factors influencing access to credit by poultry egg farmers in Southwestern, Nigeria. Niger. J. Anim. Sci. 2020, 22, 204–212. [Google Scholar]
  65. Adeyonu, A. Determinants of poultry farmers’ willingness to participate in national agricultural insurance scheme in Oyo State, Nigeria. Appl. Trop. Agric. 2016, 21, 55–62. [Google Scholar]
  66. Okoli, I.; Anyaegbunam, C.; Etuk, E.; Opara, M.; Udedibie, A. Entrepreneurial characteristics and constraints of poultry enterprises in Imo state, Nigeria. J. Agric. Soc. Res. 2005, 5, 25–32. [Google Scholar] [CrossRef]
  67. nigerianfinder.com. 10 Best Broiler Feed Brands in Nigeria. 2022. Available online: https://nigerianfinder.com/best-broiler-feed-brands-in-nigeria/ (accessed on 29 March 2022).
  68. Nkonki-Mandleni, B.; Ogunkoya, F.T.; Omotayo, A.O. Socioeconomic factors influencing livestock production among smallholder farmers in the free state province of south Africa. Int. J. Entrep. 2019, 23, 1–17. [Google Scholar]
  69. Okonkwo, K. Analysis of Poultry Feeds Marketing in Ahiazu-Mbaise Local Government Area of Imo State. J. Mark. Consum. Res. 2013, 1, 76–82. [Google Scholar]
  70. Adebowale, O.; Makanjuola, M.; Bankole, N.; Olasoju, M.; Alamu, A.; Kperegbeyi, E.; Oladejo, O.; Fasanmi, O.; Adeyemo, O.; Fasina, F.O. Multi-Drug Resistant Escherichia coli, Biosecurity and Anti-Microbial Use in Live Bird Markets, Abeokuta, Nigeria. Antibiotics 2022, 11, 253. [Google Scholar] [CrossRef]
  71. Kassali, R.; Tanimonure, V.; Owabumuwa, J.; Isioye, A. Analysis of Poultry Feeds Marketing in Osun State, Nigeria. IFE J. Agric. 2019, 31, 92–101. [Google Scholar]
  72. Isitor, S.; Ehien, A.E.; Makinta, U.; Olude, D.A. Socio-economic factors influencing egg production in Irepodun Local Government Area of Kwara state. FUW Trends Sci. Technol. J. 2019, 4, 196–201. [Google Scholar]
  73. Jolaosho, S.O.; Ogunpaimo, O.R.; Dipeolu, A.O.; Mudasiru, Y.A. Switching Among Brands of Poultry Feeds: The Egg Farmers’ Acuity in Ogun State, Nigeria. Asian J. Soc. Sci. Manag. Technol. 2020, 2, 68–78. [Google Scholar]
  74. Arafah, W.; Mutis, T. The Research of Customer Switching Behavior at Some Leasing Companies. Int. Rev. Manag. Mark. 2018, 8, 115–118. [Google Scholar]
  75. Pantow, E.F. The Effect of Price and Advertising on Brand Switching Scooter Motorcycle in Manado. J. EMBA J. Ris. Ekon. Manaj. Bisnis Dan Akunt. 2019, 7, 3428–3437. [Google Scholar]
  76. Linden, J. High Feed Prices Harm Nigeria’s Poultry Farmers. 2020. Available online: https://www.feedstrategy.com/africa/high-feed-prices-harm-nigerias-poultry-farmers/ (accessed on 29 March 2022).
  77. Kanianska, R. Agriculture and Its Impacton Land-Use, Environment, and Ecosystem Services. In Landscape Ecology—The Influences of Land Use and Anthropogenic Impacts of Landscape Creation [Internet]; Almusaed, A., Ed.; Intech Open: London, UK, 2016; Available online: https://www.intechopen.com/chapters/51201 (accessed on 15 June 2022).
  78. Omotayo, A.O. Economic synergy between rural off-farm income and households’ poverty in Ekiti State, Nigeria. J. Hum. Ecol. 2016, 56, 99–106. [Google Scholar] [CrossRef]
  79. Omotoso, A.B.; Daud, A.S.; Adebayo, R.A.; Omotayo, A.O. Socioeconomic determinants of rural households’ food crop production in Ogun state, Nigeria. Appl. Ecol. Environ. Res. 2018, 16, 3627–3635. [Google Scholar] [CrossRef]
  80. Daud, S.A.; Omotayo, A.O.; Aremu, A.O.; Omotoso, A.B. Rural infrastructure and profitability of food crop production in oyo state, Nigeria. Appl. Ecol. Environ. Res. 2018, 16, 4655–4665. [Google Scholar] [CrossRef]
Figure 1. Geographical location of the selected states and communities in the South West, Nigeria.
Sustainability 14 08030 g001
Figure 2. Extent of inequality in bags of feed sold per day.
Sustainability 14 08030 g002
Table 1. Distribution of respondents based on sampling technique.
StateLGATown/VillageNumber of Respondents of Egg
Producers
Number of Respondents of Feed Sellers
OgunSagamuOgijo3217
Gbaga95
Shotumbo42
IkenneIkenne74
Aiyepe42
LagosIkoroduErikorodo2915
Gbaga116
Imota32
Laspotech21
Lucky Fibre179
EpeFarm Settlement32
Araga74
Gbodu32
OyoIddoCamp32
Akufo42
Iddo42
AfijioAwe21
Fiditi32
Jobele32
Total planned respondents15080
Table 3. Difference in average feed prices before and during data collection.
ParameterVariableMeanVarianceZ-CalZ-Tab
Average price (NGN) per bag (25 kg) of different brands of feedSix months before data werecollected (N = 32)5131.07482,004.22−2.31 **1.98
During data collection (N = 10)5476.9573,034.30
Note: ** means significant at 5%.
Table 4. Brand switching behavior of egg producer on feed.
Poultry Feed BrandsT
ChikunHybridTop Feed
T − 1Chikun0.3600.3600.280
Hybrid0.2730.5910.136
Top feed0.0710.3570.571
P ( K = 1 ) = ( 0.233 0.451 0.316 ) , P ( K = 2 ) = ( 0.229 0.463 0.307 )
Table 5. Logistic regression output for factors associated with poultry feed brand purchases.
VariablesCoef.Std. Err.zp-Valuedy/dx
Age0.0330.0281.170.2410.006
Marital status −1.0090.753−1.340.180−0.162
Household sizes −0.1440.106−1.360.173−0.027
Engagement in other activities0.6660.5191.280.1990.127
Membership of association 0.988 *0.5791.710.0880.195
Flock size per farmer 0.001 **0.0002.360.0180.000
Experience in egg production 0.1030.0811.280.2010.020
Duration of egg laying by flock 0.0980.0871.120.2640.186
Average bags of feed used per day−0.105 **0.051−2.050.040−0.020
Distance to the nearest feed seller0.084 *0.046−1.810.0700.016
Average price (NGN) of feed per bag0.003 ***0.0012.990.003−0.001
Con.14.82005.1485042.880.004
Note: *** indicates significance at 1%, ** indicates significance at 5%, * indicates significance at 10%.
Publisher’s Note: MDPI stays neutral with regard to jurisdictional claims in published maps and institutional affiliations.

