Article

Spatial Evaluation of Villages and Towns Based on Multi-Source Data and Digital Technology: A Case Study of Suining County of Northern Jiangsu

1
School of Architecture and Urban Planning, Nanjing University, Nanjing 210003, China
2
Jiangsu Collaborative Innovation Center for Building Energy Saving and Construction Technology, Jiangsu Vocational Institute of Architectural Technology, Xuzhou 221000, China
3
School of Architecture and Design, China University of Mining and Technology, Xuzhou 221000, China
4
School of Mechanics and Civil Engineering, China University of Mining and Technology, Xuzhou 221000, China
*
Author to whom correspondence should be addressed.
Sustainability 2022, 14(13), 7603; https://doi.org/10.3390/su14137603
Submission received: 2 May 2022 / Revised: 12 June 2022 / Accepted: 15 June 2022 / Published: 22 June 2022

Abstract

:
Based on the research on the current situation and transformation path of the spatial construction of villages and towns in northern Jiangsu, “compactness” and “convenience” are extracted as the elements of spatial evaluation. With multi-source data, comprehensively using ENVI remote sensing image interpretation, GIS spatial analysis, Fragstats landscape index calculation, entropy weight–TOPSIS comprehensive evaluation, and SPSS cluster analysis, a “digital full cycle” of a research framework for the spatial evaluation of villages and towns is built. In this paper, Suining County is taken as the research object, and the spatial construction level of its villages and towns is studied. The research results show that at the county level, the spatial compactness of villages and towns roughly presents the characteristics of an “X” pattern, decreasing from the middle to the four sides, while facility convenience generally presents the characteristics of a right “人” (Chinese character) pattern. At the town level, facility convenience basically presents the pattern characteristics of the “center-node” differentiation structure. The research aims to guide villages and towns to solve the current dilemma of spatial construction, promote the construction of digital villages and towns, and impel the digital transformation of the village and town evaluation system, data, and methods, so as to provide real-time, quantitative, and accurate data and method support for planning and decision-making in villages and towns.

1. Introduction

Villages and towns are collectively referred to as villages, townships, and organic towns (except county towns). They are settlement spaces formed by people who conform to the natural environment and the social culture to gather and settle down and have the basic forms of mass, ribbon, radiation, and so on [1]. However, the phenomenon of “hollowing out” in villages and towns has become more and more serious with the continuous promotion of urbanization in recent years. In addition, the spatial form of the “decentralization” of traditional villages and towns has also led to the mismatch and inconvenience of facility layout, and the declining trend of village and town space has intensified year by year [2]. Thus, it is very important to build a scientific and effective evaluation system to guide the transformation of the spatial construction mode of villages and towns.
With the in-depth implementation of the rural revitalization strategy, the central government has clearly put forward the slogan of accelerating the construction of a “digital village”. In the “14th Five-year Plan” it is also emphasized that information, networking, and intelligent technologies should be widely applied to the development practice of economy and society in villages and towns. At present, the research on the application of digital technology in the field of villages and towns at home and abroad mainly focuses on the planning and construction level. In foreign research, Yoshida N. et al. think that it can provide new research ideas for spatial measurement and visual analysis with the help of geospatial data [3]. Using GIS technology and remote sensing data, Conrad C. et al. measure and analyze the expansion trend of rural residential areas, and predict the demand for rural construction land to realize the intensive and sustainable development of spatial planning in rural areas [4]. With the help of GIS technology, according to the level division of town, village, rural public space, and building plot, Sowińska-Świerkosz B. et al. explore the adaptability of multi-source data in the analysis of spatial planning indicators in rural areas [5]. Additionally, many scholars start from an accessibility perspective [6,7,8] and use multi-source data and GIS technology for spatial measurement and spatial feature analysis, thereby providing a reference for the optimized layout of rural facilities and guiding the sustainable development of villages and towns. In domestic research, due to the characteristics of easy access, wide information coverage, rich data types, and high positioning accuracy, POI data has become a research hotspot in the field of spatial planning [9]. Some scholars use such data to make statistics and spatial measurements on public service facilities in villages and towns. With the Arc GIS tool, the spatial pattern characteristics of various facilities are visually analyzed and suggestions for optimizing the layout are put forward [10,11,12,13]. By getting POI data and using GIS spatial analysis methods (nearest neighbor index and kernel density estimation) and mathematical statistics methods, some scholars study the spatial pattern characteristics of rural leisure tourism or leisure agricultural facilities, analyze influencing factors of its agglomeration, and put forward optimization suggestions for its spatial layout [14,15,16,17]. In terms of the digestion [18,19,20], agglomeration [21], layout, and classification [22,23] of village and town space, some scholars carry out quantitative analysis and layout optimization of residential areas with the help of such data. Meanwhile, as an innovative spatial data type, remote sensing data also provides researchers with accurate, rich, and real-time spatial information [24]. Based on such data, many scholars combine the analysis of the spatial pattern of rural settlements [25,26,27], residential area distribution, and landscape patterns [28,29,30,31] by Arc GIS to quantitatively analyze the spatial differentiation characteristics of rural settlements. Existing research results show that when domestic and foreign scholars carry out planning activities, on the one hand, they should pay attention to extracting the existing spatial laws and building local spatial cognitive content; on the other hand, they should think about how to use the existing laws for spatial deduction. According to different data and research objectives, the optimal method is selected for correlation analysis. The quantitative analysis of the current situation of rural space with the help of multi-source data and digital technology has become a new trend of research and an indispensable auxiliary means of rural planning and construction. At present, there is little research on transforming the spatial analysis elements of villages and towns into an index system for evaluation.
In the existing research on village and town evaluation in China, due to the increasingly complex evaluation system and the gradual diversification of evaluation indicators, the evaluation data sources need to be obtained from various heterogeneous databases. Moreover, the qualitative evaluation index accounts for a relatively high proportion, and the subjectivity of the evaluation results is strong. It can be seen that the data acquisition method based on a manual investigation has had difficulty meeting the needs of high-efficiency, real-time, and quantitative evaluation research [32]. In the era context of big data and information technology, digital technology will further penetrate into the construction field of villages and towns with the continuous improvement of information elements in villages and towns. This also provides a new proposition and thinking for the development of village and town evaluation research in the new era. Therefore, it is imperative to explore the digital transformation of the village and town evaluation research process.
Based on this, this study first analyzes the current situation of village and town space in northern Jiangsu and extracts the leading characteristics of the transformation of “compact space” and “convenient facilities”. With the help of multi-source data and digital technology, a research framework for the spatial evaluation of villages and towns is built. Suining County is taken as the research object. Through the digital translation process of the “collection-processing-analysis-calculation” of data, evaluation indexes are obtained, and the entropy weight–TOPSIS evaluation model is used to evaluate the current spatial situation of villages and towns in Suining County. The research aims to guide villages and towns to solve the current dilemma of space construction, promote the construction of digital villages and towns, and impel the digital transformation of village and town evaluation content, data, and methods.

2. Current Situation of Village and Town Space in Northern Jiangsu

2.1. Spatial Structure

By referring to the Statistical Annual Report of Village and Town Construction and the Statistical Yearbook in Jiangsu Province, the statistical data of four time nodes were selected and the amount of construction land in villages and towns of northern Jiangsu in the recent 15 years was sorted out and compared (Table 1). The results show that the data structure of construction land in villages and towns of northern Jiangsu began to change after 2010, mainly due to the sharp reduction in village construction land. In order to focus more comprehensively on the use of village construction land, with the help of two types of statistical data (population and number of villages), three time nodes (2010, 2015, and 2019) were selected successively to further analyze the change of village land in northern Jiangsu (Table 2). The data show that the change in average village land area was not obvious during 2010–2015 but the per capita village land area expanded. At this stage, the phenomenon of the “hollow village” was highlighted by the loss of the village population. From 2015 to 2019, the per capita village land area and the average village land area were reduced, which shows that villages had a trend of agglomeration development. Since the village construction land includes two parts, the administrative village and the natural village, it further refers to the statistical data of the government in 2019. It is found that the land use of natural villages accounts for nearly 70%, and the population is mainly distributed in natural villages with a scale of fewer than 400 people, accounting for more than 60% of the total population of the village. Therefore, the structural system of rural settlements in northern Jiangsu needs to be further optimized. By adjusting the internal structure of village land, it could further excavate idle construction land indicators to reserve development space for the construction of villages and towns in northern Jiangsu.
Through the field investigation and remote-sensing image interpretation analysis of villages and towns in northern Jiangsu, the spatial forms of villages and towns in northern Jiangsu are classified into five types (Table 3) to intuitively perceive the spatial pattern characteristics of villages and towns in northern Jiangsu from a spatial perspective. It could be found that most of the spatial forms of traditional villages and towns in northern Jiangsu are still “decentralized”, and only a few are “centralized”. Moreover, the spatial form restricts the allocation efficiency of facilities to a certain extent.

2.2. Policy Guidance

The land improvement policies issued from the national level—the land increase and decrease linked policies and the high-standard farmland construction policies—are aimed at improving the quality of cultivated land, increasing the area of effective cultivated land, promoting the scientific digestion of decaying villages, the intensive use of construction land, the compact layout of urban and rural space, and the economic convenience of facility construction. Several village planning and construction policies issued at the provincial level (Table 4) and the rural housing improvement policies in northern Jiangsu are also aimed at promoting the intensive space construction of rural residential areas according to local conditions, changing the traditional loose spatial structure of villages and towns and optimizing the supporting efficiency of public service facilities.
It can be seen that these policies are layers of superposition and interlocking logic, showing a progressive relationship of “policy guidance-planning guidance-construction transformation”. Villages and towns in northern Jiangsu objectively have had the conditions to promote spatial reconstruction.

2.3. Selection of Study Sample

Suining County is located in the northwest of Jiangsu Province, covering an area of 1769 km2. It is under the jurisdiction of Xuzhou City and is an important part of Xuzhou. Due to the slow economic development and serious population loss in rural areas for a long time, the villages have been “hollowed out” and the development vitality has been reduced day by day. The spatial form of “decentralization” in villages and towns makes it difficult for public service facilities to exert centralized benefits, which further restricts the economic and social development of villages and towns. In this context, Suining County put forward the strategy of “strengthening towns and villages” in 2015 with the policy support of the comprehensive reform of land systems such as “linking the increase and decrease in urban and rural land”, the “layout adjustment of the same township”, and the “renovation project of many villages”, so as to transform the spatial construction mode of villages and towns (Figure 1). Guided by structural adjustment in urban and rural planning, driven by comprehensive land reform, taking the construction of characteristic towns, new rural communities, and characteristic countrysides as a focal point (Figure 2), it aims to improve the compact level of space and the convenience level of facilities in villages and towns, thereby realizing the double promotion and win-win of economic and environmental benefits. It has initially stepped out of the “Suining Model” of rural revitalization in northern Jiangsu. Therefore, Suining County is used as a research sample in this paper, which is typical. Through the evaluation and research of its village and town space, this paper analyzes its spatial construction level and differentiation characteristics, so as to provide a reference for the research on the transformation and development of village and town space in other regions.

3. Evaluation Index System

3.1. Analysis of Index Composition

Based on the analysis of policy documents and research literature on village and town evaluation systems at the national and academic levels, it could be found that at present, the attention to the spatial evaluation indicators of villages and towns is low, but they have gradually begun to pay attention to it in recent years, especially in the residential area system structure and facility allocation. This also coincides with the two leading characteristics of the transformation path of village and town spatial construction in Suining County. Nowadays, in the face of the era background of new urbanization and rural revitalization, village and town construction should not only emphasize the importance of the ecological environment and economic development but also pay attention to the rationality and sustainability of village and town space construction. Therefore, the spatial evaluation index system of villages and towns is constructed from the two spatial element dimensions of “spatial compactness” and “facility convenience” in this study.

3.2. Construction of Index System

On the basis of fully drawing lessons from the contents of the compact urban evaluation index system, urban facility convenience evaluation index system, and village and town evaluation index system, combining the relevant study on the spatial compactness and facility convenience in villages and towns, according to principles of availability, feasibility, comparability, and measurability, the evaluation index system of village and town space is finally constructed and completed, including two level-one criterion layers, nine level-two criterion layers, and twenty-seven specific indicators (Table 5).

3.3. Interpretation of Index Meaning

“Spatial compactness” is a measure of the intensive and efficient level of space construction in the process of urban and rural construction [33], including scale, form, and function [34]. Compact scale is characterized as the density value level of space from the spatial attribute. At present, the measurement of density is also an important index for domestic and foreign scholars to evaluate compactness. Form compactness is a comprehensive measure of the efficient and intensive utilization level of space from the edge contour, size, spacing, and other attributes of land use. Function compactness is the inevitable result of intensive and efficient land use under the guidance of form compactness and scale compactness, and it is also the key index to measure the compactness of space. This “intensive and efficient” response is manifested in the diversity of land use in terms of function, namely the mixed-use level of land function. The functional mixing is not only reflected in the level of land use, but also in the mixing of functional areas in villages and towns [35]. “Facility convenience” can be understood as residents’ satisfaction with the supply of public service facilities and can also be understood as the convenience of residents to enjoy and use public service facilities. Its quantity, scale, and aggregation will directly affect the convenience and satisfaction of residents [36]. The quantitative interpretation of specific indicators is as follows (Table 6).

4. Evaluation Data and Research Methods

4.1. Data Sources

There are five types of research data: remote sensing data, POI data, population spatialization data, economic spatialization data, and administrative boundary data of villages and towns in the Suining region in 2020. Remote sensing data are Landsat8 OLI remote sensing images with an accuracy of 30 m obtained through the geospatial data cloud website. POI data are selected from Gaode Map. Based on the Scrapy web crawler platform, the crawling program of POI data is developed through Python to obtain six types of POI data in Gaode Map, including business, science and education, transportation, medical treatment, life services, leisure, and entertainment. Population spatialization data are obtained from the platform of the resource and environmental science data center of the Chinese Academy of Sciences, and economy spatialization data are obtained from the cloud platform of geographical situation monitoring. They are all grid data types, and each grid represents a population (economy) value within a grid range of 1 km × 1 km. The administrative boundary data of villages and towns is obtained from the Bigemap website, and the data comes from Gaode Map.

4.2. Research Ideas

The research data required for the spatial evaluation system of villages and towns is collected from the network platform, and the research framework for the spatial evaluation system of villages and towns is built based on digital technology (Figure 3). The digital translation of evaluation index data is realized by means of ENVI remote sensing image interpretation, GIS spatial analysis, and Fragstats landscape index calculation. The entropy weight–TOPSIS evaluation model is used to evaluate and measure the spatial construction level of villages and towns in Suining County, and the cluster analysis of the evaluation results is carried out with the help of SPSS 24.0 software. The spatial construction level of villages and towns in Suining County is divided and its spatial differentiation characteristics are analyzed.

4.3. Research Methods

(1)
Remote sensing image interpretation
The maximum likelihood method in supervised classification is used to interpret and classify the obtained remote sensing images. The tool used is ENVI 5.3 software, and the specific operation process is as follows: the first step is image preprocessing, namely radiometric correction-image fusion-image stitching-image clipping. The second step is image classification, which is specifically classified into 6 categories: forest land, water land, construction land, cultivated land, grassland, and unused land. Finally, the image maps for the real-land classification and construction-land classification of the study area are obtained, and the industrial land and residential land are further classified on the basis of the construction-land classification image map, so as to provide basic research data for subsequent spatial analysis and operation in Arc GIS 10.2 software.
(2)
Spatial analysis method
With the help of the spatial analysis tool in Arc GIS 10.2 software, the image maps for real-land classification and construction-land classification after remote sensing image processing in ENVI 5.3 are mapped. According to the boundaries of each administrative unit in the study area, it is cut, extracted, and analyzed so as to calculate the data of seven indexes in Fragstats 4.2 software. Through the regional analysis and extraction analysis, the spatial information statistics are carried out, to extract the area, population, and GDP of each township in Suining County, and then the spatial density of the population and the spatial density of the economy are calculated. Through coordinate system transformation, spatial superposition analysis, nuclear density analysis, and other operations, the visual processing of the POI data of various public service facilities in the study area is conducted, so as to more intuitively reflect the spatial layout characteristics of the village and town facilities (Figure 4). Moreover, the data cutting-classification-statistics-calculation and other operations are carried out for each administrative unit in the study area, so as to obtain the index results of facility convenience, and then the facility convenience of villages and towns is evaluated and analyzed.
(3)
Landscape index method
Using relevant formulas and principles of landscape ecology, and taking Fragstats 4.2 calculation and analysis software as platform carrier, the current situation of the village and town space in the study area in 2020 is quantitatively reflected. Through the calculation of the landscape index, the results of seven indicators are finally obtained, including the proportion of construction land, the mean patch shape index, the mean nearest neighbor distance, the land fragmentation index, the land-use diversity index, the proportion of industrial land, and the proportion of residential land.
(4)
Comprehensive evaluation method
The entropy weight–TOPSIS evaluation model is used for evaluation research on the current situation of village and town space in Suining County. Firstly, the evaluation indexes are quantified and objectively weighted by the entropy weight method, and then the correlation degree between each index and the ideal index is calculated by the TOPSIS method. The two indexes are weighted, and finally, the evaluation results are obtained. This evaluation method can objectively and effectively evaluate the spatial compactness and facility convenience level of different villages and towns, making the evaluation results more objective, scientific, and reasonable.
(5)
Cluster analysis
After obtaining the evaluation score in each village and town of Suining County by the entropy weight–TOPSIS evaluation model, with the help of SPSS 24.0 software, cluster analysis is carried out on the evaluation results of the spatial compactness and facility convenience of villages and towns to determine the classification level, so as to make the evaluation and analysis more intuitive and contrastive.

5. Evaluation of Village and Town Space in Suining County

5.1. Determining Index Weight

Because the dimensions and units of each index in the evaluation system are different, it is impossible to compare and calculate directly. The non-dimensionalization of original indicators should be conducted first, and then the indicators should be weighted. In order to obtain a more objective weight, the entropy weight method is used to calculate the objective weight of the evaluation indicators in the study. The specific calculation steps are as follows:
1)
Standardize the original indicator data. The original data matrix is composed of f regions and n evaluation indicators in Suining County: W = ( w i j ) f × n ( i = 1 , 2 , 3 f , j = 1 , 2 , 3 n ), w i j is the ith index value of the jth region.
When the indicator is positive, its standardized formula is:
w i j = w i j w i j min w i j max w i j min
When the indicator is negative, its normalization formula is:
w i j = w i j max w i j w i j max w i j min
This results in a standardized evaluation matrix:
A = ( w i j ) f × n
2)
In order to eliminate negative values, translation processing is conducted. Some index values may be small or negative after normalization processing. In order to unify and facilitate the calculation, the standardized values are translated to eliminate the above situation. Its formula is:
w i j = H + w i j
Among them, H is the magnitude of the index translation, which is generally taken as 1.
3)
The non-dimensionalization of index data is conducted by the proportion method, and its formula is:
k i j = w i j i = 1 n w i j
4)
Calculate the entropy value of the jth index, and its formula is:
e j = 1 ln n i = 1 n k i j ln k i j
5)
The difference coefficient of the jth indicator is:
h j = 1 e j
where j = 1 , 2 , 3 p .
6)
The weight of the jth indicator is:
ϖ j = h j j = 1 p h j
where j = 1 , 2 , 3 p .
The weight of each index is seen in Table 5.

5.2. Determining Evaluation Results

In this paper, the TOPSIS method is used to evaluate the spatial compactness, facility convenience, and spatial construction level of each administrative unit in the study area. The specific calculation steps are as follows:
1)
Standardize the original indicator data. The original data matrix is composed of f regions and n evaluation indicators in Suining County: W = ( w i j ) f × n
( i = 1 , 2 , 3 f , j = 1 , 2 , 3 n ), w i j is the ith index value of the jth region.
When the indicator is positive, its standardized formula is:
w i j = w i j w i j min w i j max w i j min
When the indicator is negative, its normalization formula is:
w i j = w i j max w i j w i j max w i j min
This results in a standardized evaluation matrix:
A = ( w i j ) f × n
2)
Vector normalization of indicator data
Vector normalization is performed on the processed data, and the vector normalization is transformed by the following formula:
m i j = w i j i = 1 f w i j 2
Its biggest feature is that after normalization, the sum of squares of the same attribute value of each scheme is 1, so it is often used to calculate the Euclidean distance between each scheme and a certain virtual scheme (such as the ideal solution point or negative ideal solution point). Then, the weights are multiplied by the normalization matrix to obtain the weighted normalization matrix, and the formula is:
c i j = ϖ j m i j
3)
Determine the positive ideal solution C + and the negative ideal solution. C
Supposing that the value of the jth attribute of the positive ideal solution C + is c j + , and the value of the jth attribute of the negative ideal solution C is c j , then:
Positive   ideal   solution   c j + = max c i j ,   j = 1 , 2 , 3 n
Negative   ideal   solution   c j = min c i j ,   j = 1 , 2 , 3 n
4)
Calculate the Euclidean distance of each scheme from the positive ideal point and the negative ideal point. According to the Euclidean distance, the calculation formulas for the distances: d i + and d i of each scheme i from the positive ideal point and the negative ideal point are:
d i + = j = 1 n c i j max c i j 2 1 2
d i = j = 1 n c i j min c i j 2 1 2
The Equations (16) and (17) are used to obtain the distances from each scheme to the positive ideal solution and the negative ideal solution ( d i + and d i ), and then the evaluation values of space compactness, facility convenience, and green livable level for each administrative unit i in the study area of Suining County are calculated. The formula is as follows:
G i = d i d i + + d i
Since the evaluation of village and town space is to better promote the construction pace of urban and rural overall planning, the construction level and evaluation results of the space compactness and facility convenience of villages and towns need to be studied at the overall level of urban and rural areas. In order to facilitate the evaluation and analysis at the county scale, Suicheng Town (Chengguan Town), four industrial parks, and two economic development zones are comprehensively evaluated. Finally, the evaluation scores of spatial compactness, facility convenience, and the space construction level of each administrative unit in Suining County are obtained, and the results and ranking are as follows (Table 7).

5.3. Analysis of Evaluation Results

In order to more scientifically and objectively classify the spatial development level of villages and towns in the study area and analyze its spatial pattern characteristics, the hierarchical clustering (Q-type) analysis method is selected with the help of SPSS 24.0 data statistical analysis software. The sample data are the above-mentioned statistical table of evaluation results. The inter-group link method is selected in the clustering process, and the Euclidean distance method is selected for distance measurement.
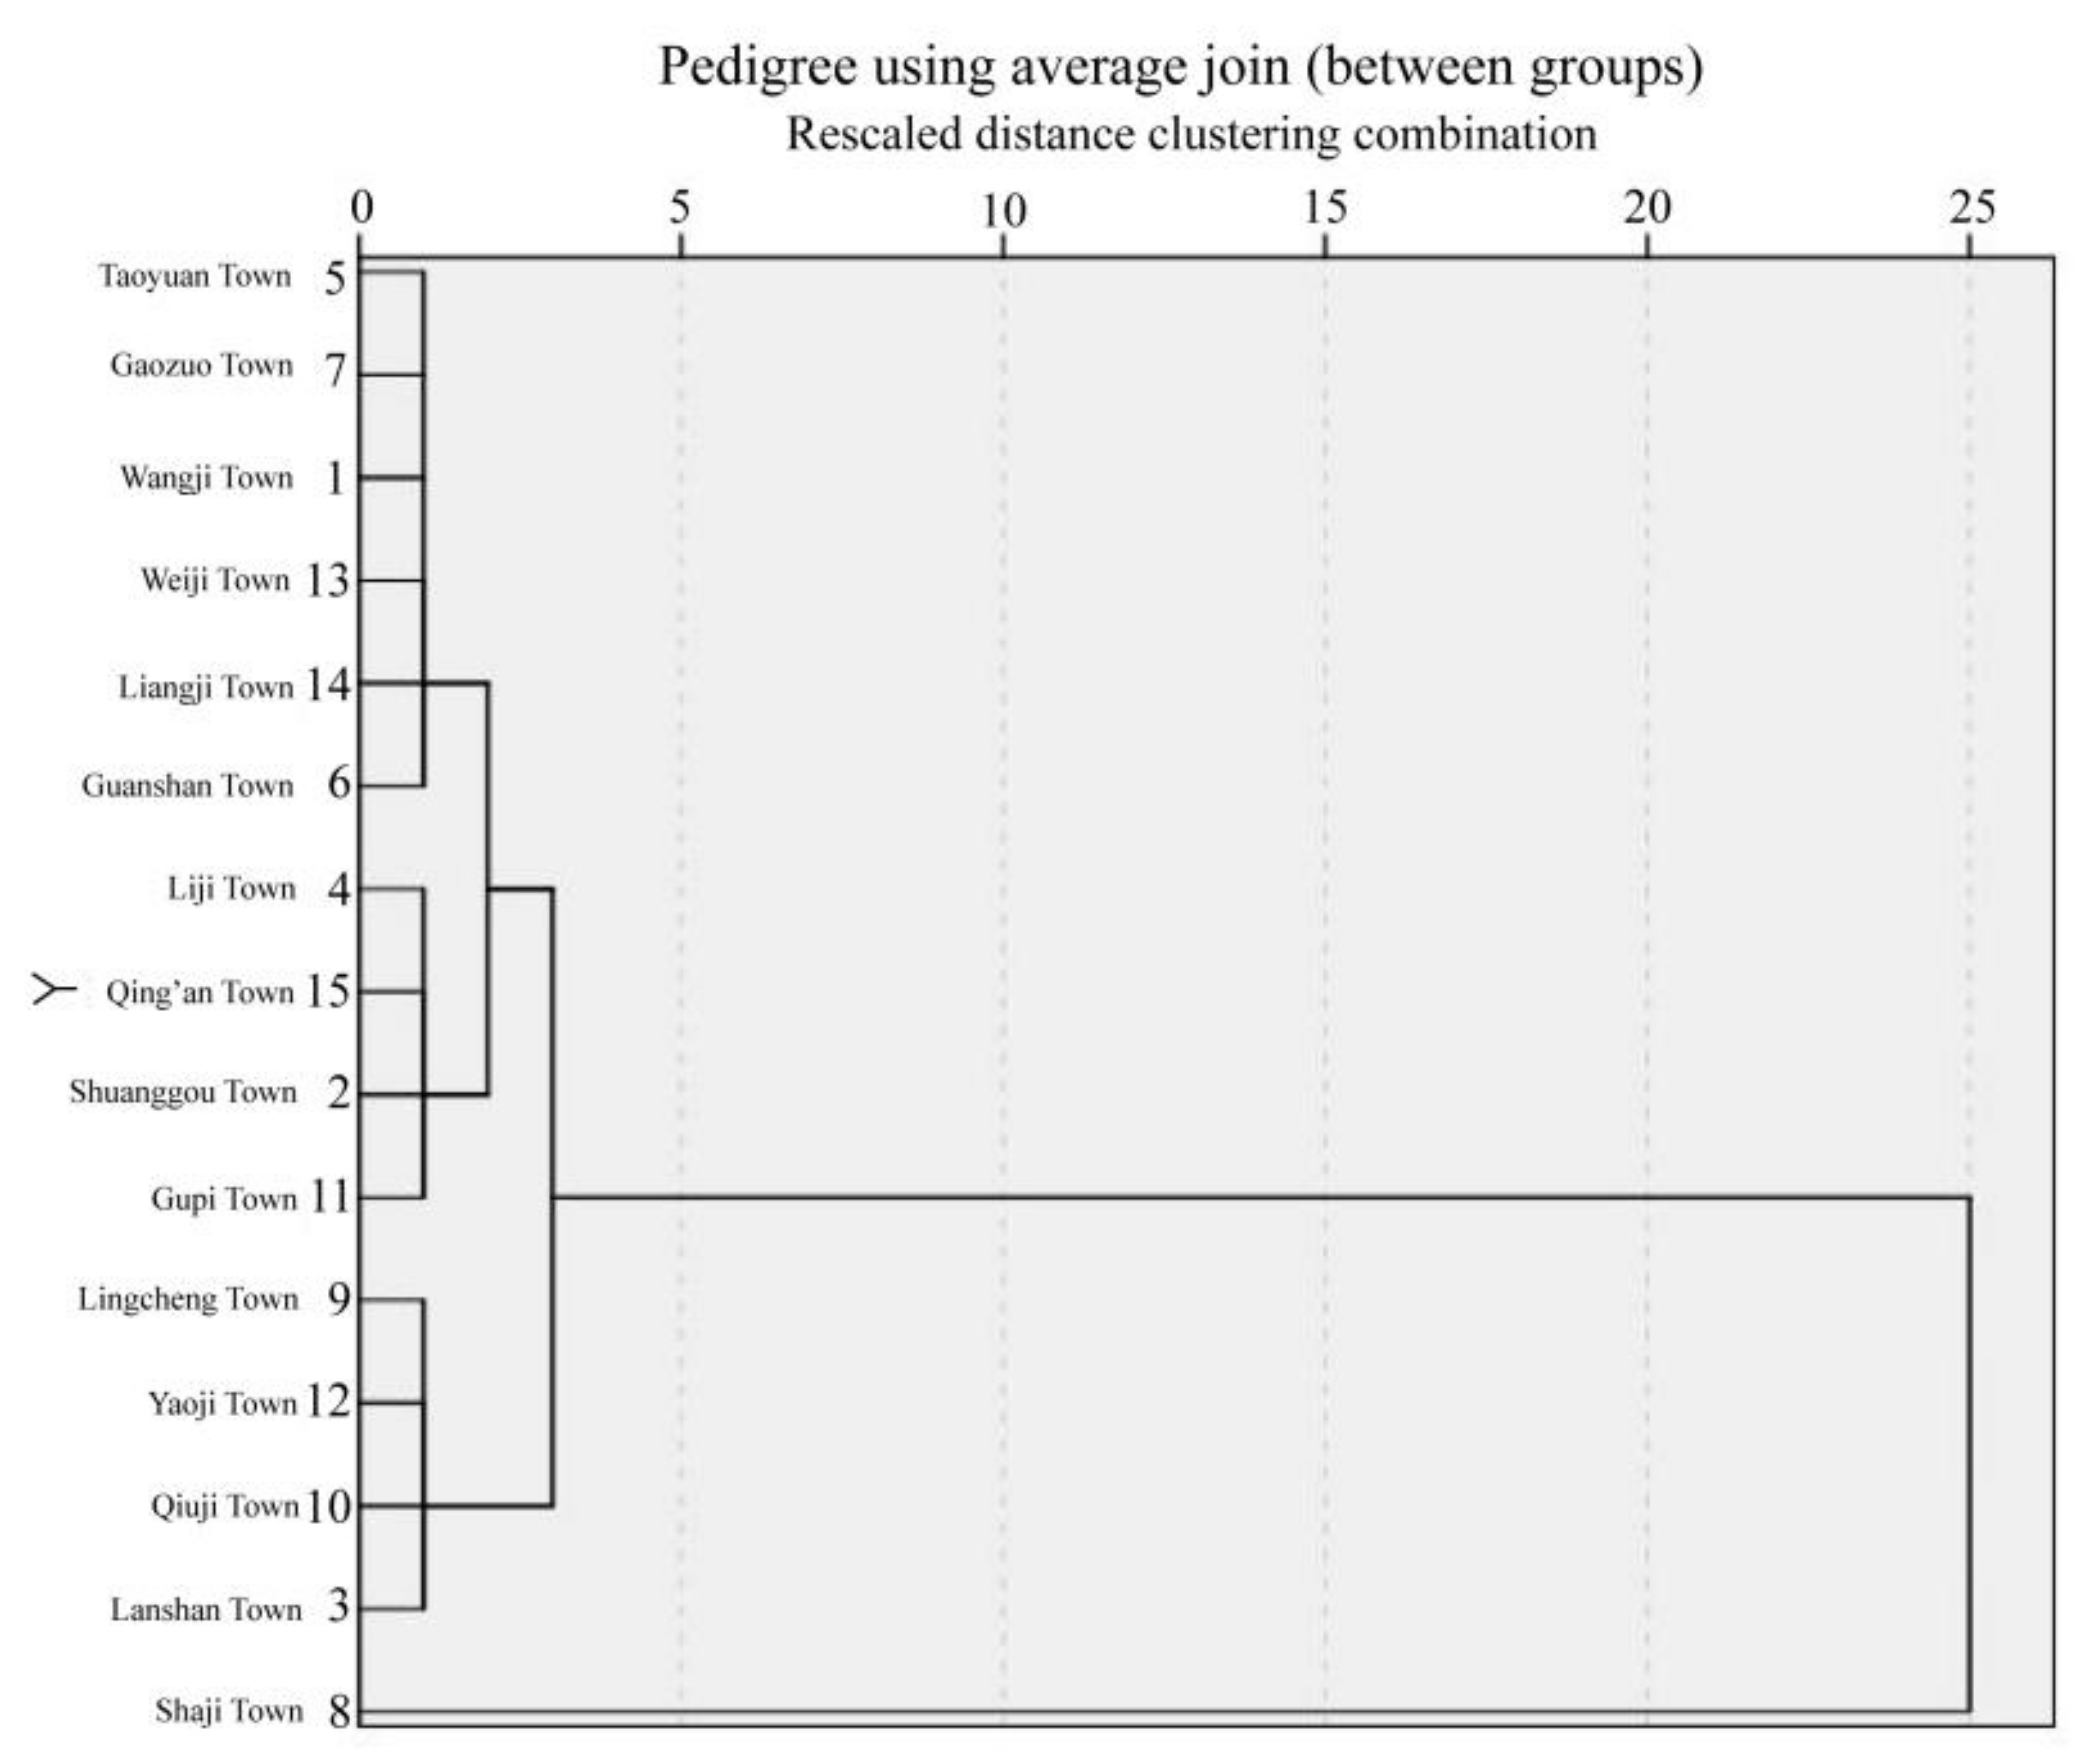
(1)
Space compactness
As seen in Figure 5, the spatial compactness level of villages and towns in Suining County can be divided into four categories at most: Shaji Town (level one); Shuanggou Town, Qing’an Town, Liji Town, and Gupi Town (level two); Guanshan Town, Weiji Town, Liangji Town, Wangji Town, Taoyuan Town, and Gaozuo Town (level three); and Lingcheng Town, Yaoji Town, Qiuji Town, and Lanshan Town (level four). With Arc GIS 10.2 software, the visibility processing of the spatial differentiation characteristics of space compactness in Suining County is conducted. The results show that the spatial compactness level in the central area of Suining County is relatively high. Except for the four marginal villages and towns such as Shuanggou Town, Gupi Town, Liji Town and Shaji Town, the spatial compactness level of other villages and towns is relatively low. At the county scale, it roughly presents the spatial characteristics of the “X” pattern, decreasing from the middle to the surrounding (Figure 6).
The reasons for its formation are analyzed: the central area of Suining is the location of the main urban area. Its urbanization process is relatively fast, and its economic development level is relatively high, which has formed the agglomeration economic effect of high-quality development. Therefore, this area has the highest level of spatial compactness. The geographical location of Shuanggou Town in the northwest is advantageous. Provincial Highway 252, National Highway 104, Huai’an–Xuzhou Expressway, and Xuzhou–Mingguang Expressway intersect vertically and horizontally in the town. Xuzhou International Guanyin Airport and Xusu Huaiyan High-speed Railway Shuanggou Station are also located in the territory, and it borders the urban area of Xuzhou City. It is one of the three major satellite cities in the periphery of Xuzhou City, and it is also the sub-center of Suining County. The establishment of the provincial Airport Economic Development Zone in 2016 has implanted a powerful engine for the construction of villages and towns in Shuanggou Town, and formed the coordinated development path of mutual promotion between industry and city under the guidance of “industrialization-urbanization” two-wheel drive, making it so the layout of its spatial structure, public facilities, and land-use function adjustments have gradually moved towards a centralized and intensive development mode, initially forming a cluster linkage development pattern of population concentration to town and industry concentration in development zones. Accompanied by the development trend of “village urbanization” [37], it is necessary to further prevent the spread of village urbanization through the agglomeration and development of small towns. The ancient Pi Town in the northeast is historically known as the ancient city of Xiapi. It is the birthplace of the “Xiapi culture of the Han Dynasties”, with profound historical deposits. The Yishan Scenic Spot and ancient city site are located in the north of the town, and the tourism economy is developing rapidly. In addition, the central part of the town has superior ecological resources, and the Yellow River, the Xuhong River, and other water systems are intertwined. The largest freshwater reservoir in northern Jiangsu, the Qing’an Reservoir, is located in the south of the town. The overall terrain of the town is high in the northwest and low in the southeast. Because the ancient city ruins, mountains, and reservoirs in the town area belong to the prohibited and restricted development areas, and due to the provincial-level pilot program of “comprehensive land improvement in the old Yellow River watershed”, the construction of villages and towns has shown a pattern of agglomeration and development in the central region. Liji Town in the southwest has been an important trade and logistics town since ancient times. It is located at the junction of Jiangsu and Anhui, and is known as “Little Nanjing”. Its urbanization started early. In 2019, the urbanization rate exceeded 55%, and the built-up area exceeded 5 km2. It has initially formed the spatial development pattern of large-scale agricultural concentration in the north (population inflow to towns) and large-scale industrial concentration in the south (population inflow to new rural communities). Shaji Town, in the southeast, borders the urban area of Suqian in the east, and the traffic conditions in the territory are convenient. The Huai’an–Xuzhou Expressway, Provincial Highway 324, the Xuhong River, and the Xusha River channel intersect here and directly connect with the Hongze Lake, the Luoma Lake, and Beijing Hangzhou Grand Canal. Shaji Port provides a strong driving force for the development of the water logistics industry. Especially in recent years, relying on the construction of e-commerce platforms and taking the path of e-commerce, promoting Dongfeng Village as a development model, has led to the formation of characteristic industrial clusters, promoted the agglomeration and development of industrial parks, made the population continue to agglomerate in townships, and walked out the “Shaji model” of digital economy, realizing rural revitalization. In other villages and towns, due to the lack of resource endowment, obvious transportation location advantages, leading industries, and radiation drive from the economic circle, the process of industrialization and urbanization has been severely restricted, resulting in a weaker level of economic development, decentralization, and the hollowing-out of villages. Therefore, the development centripetal force of villages and towns is not strong, and the level of space compactness is low.
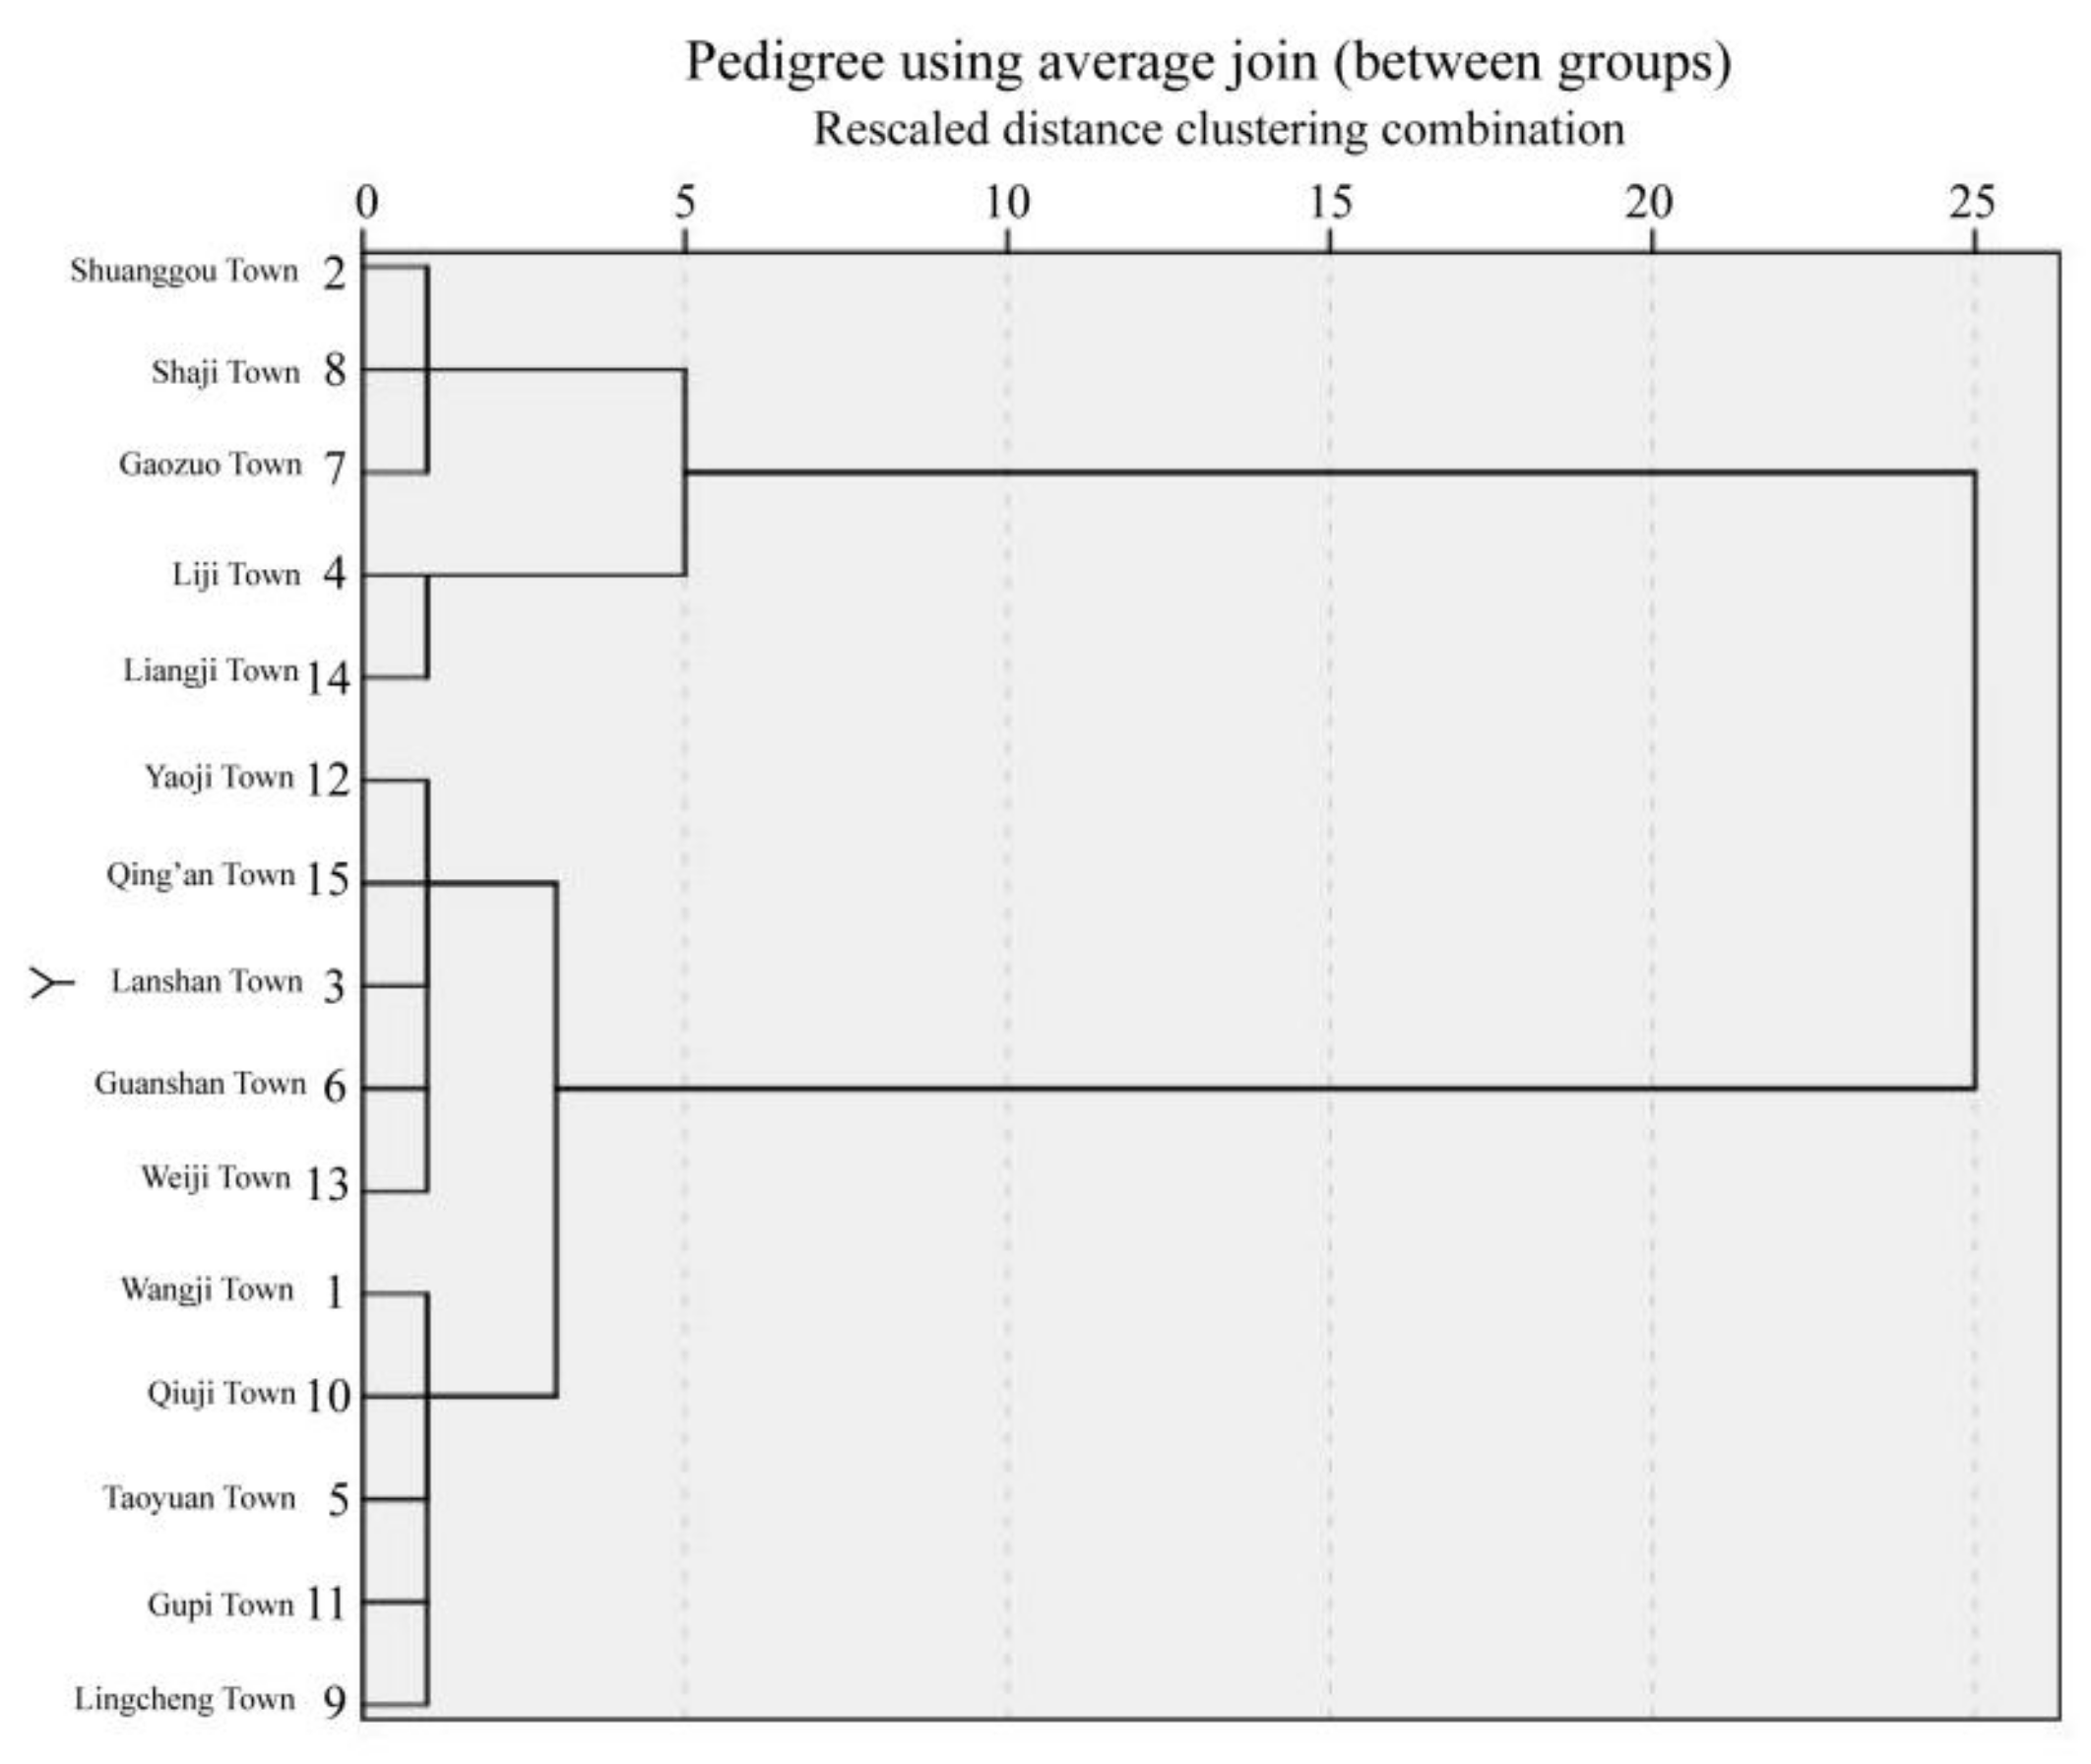
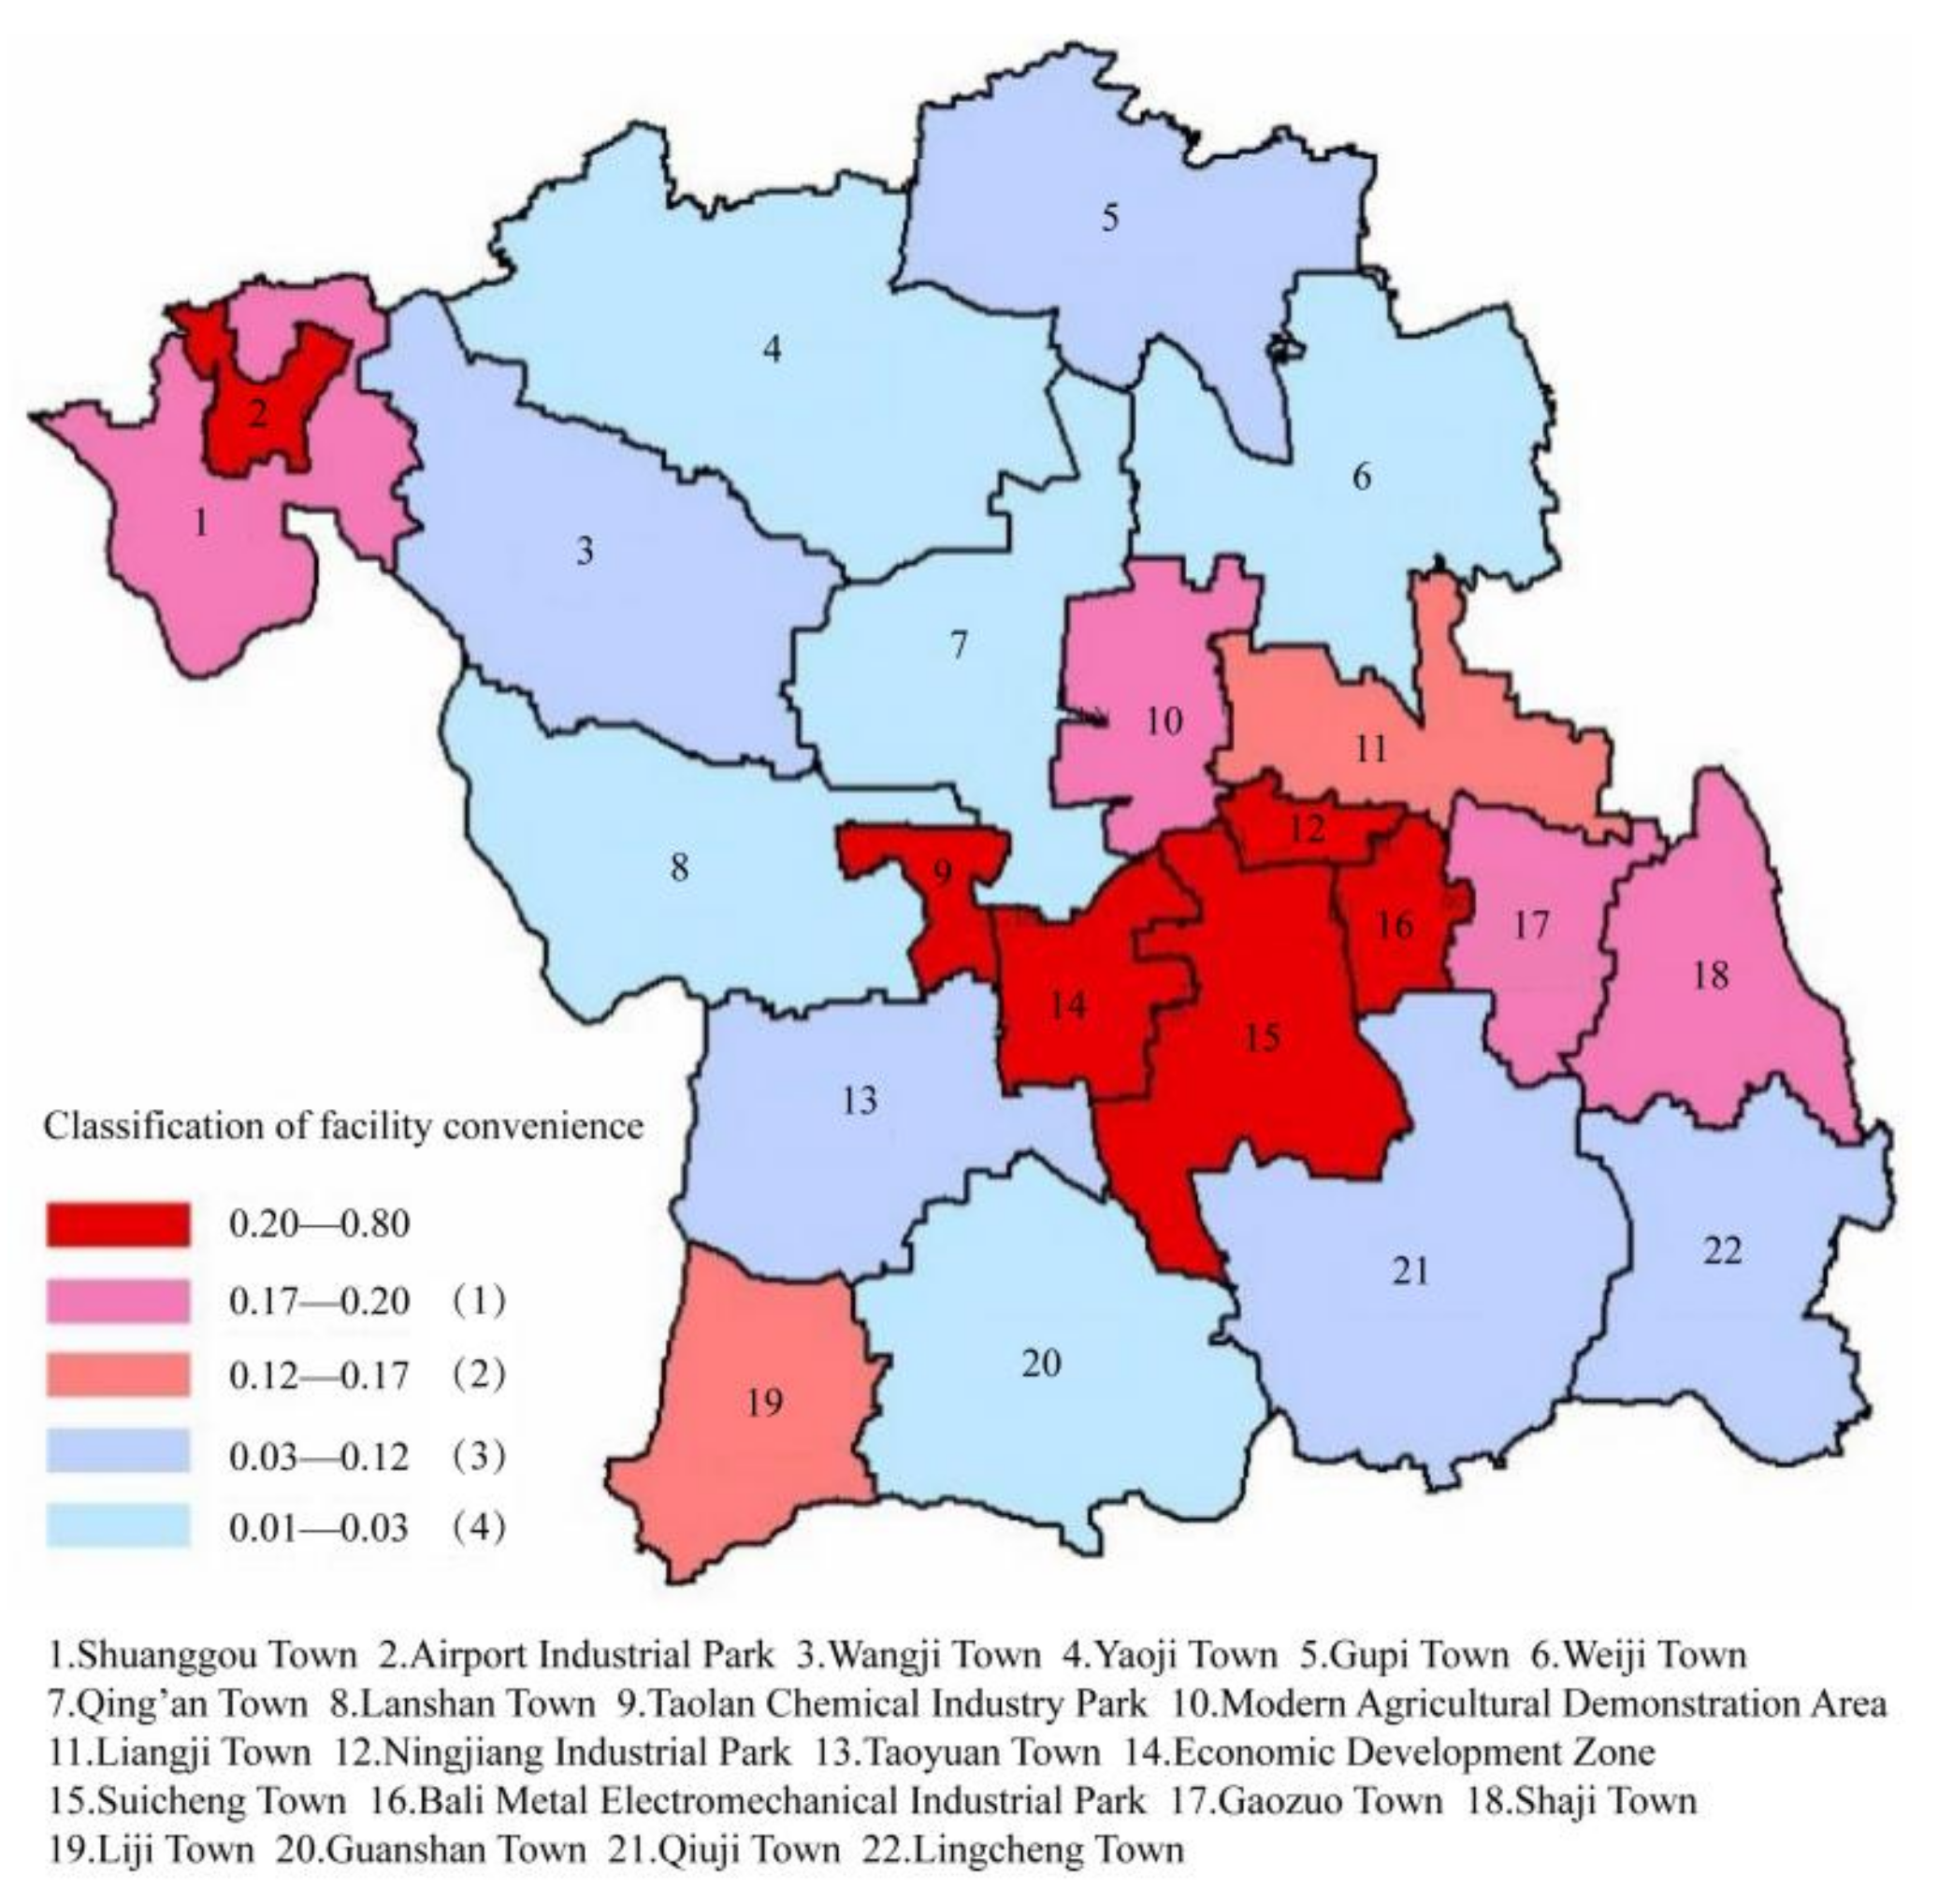
(2)
Facility convenience
As seen in 
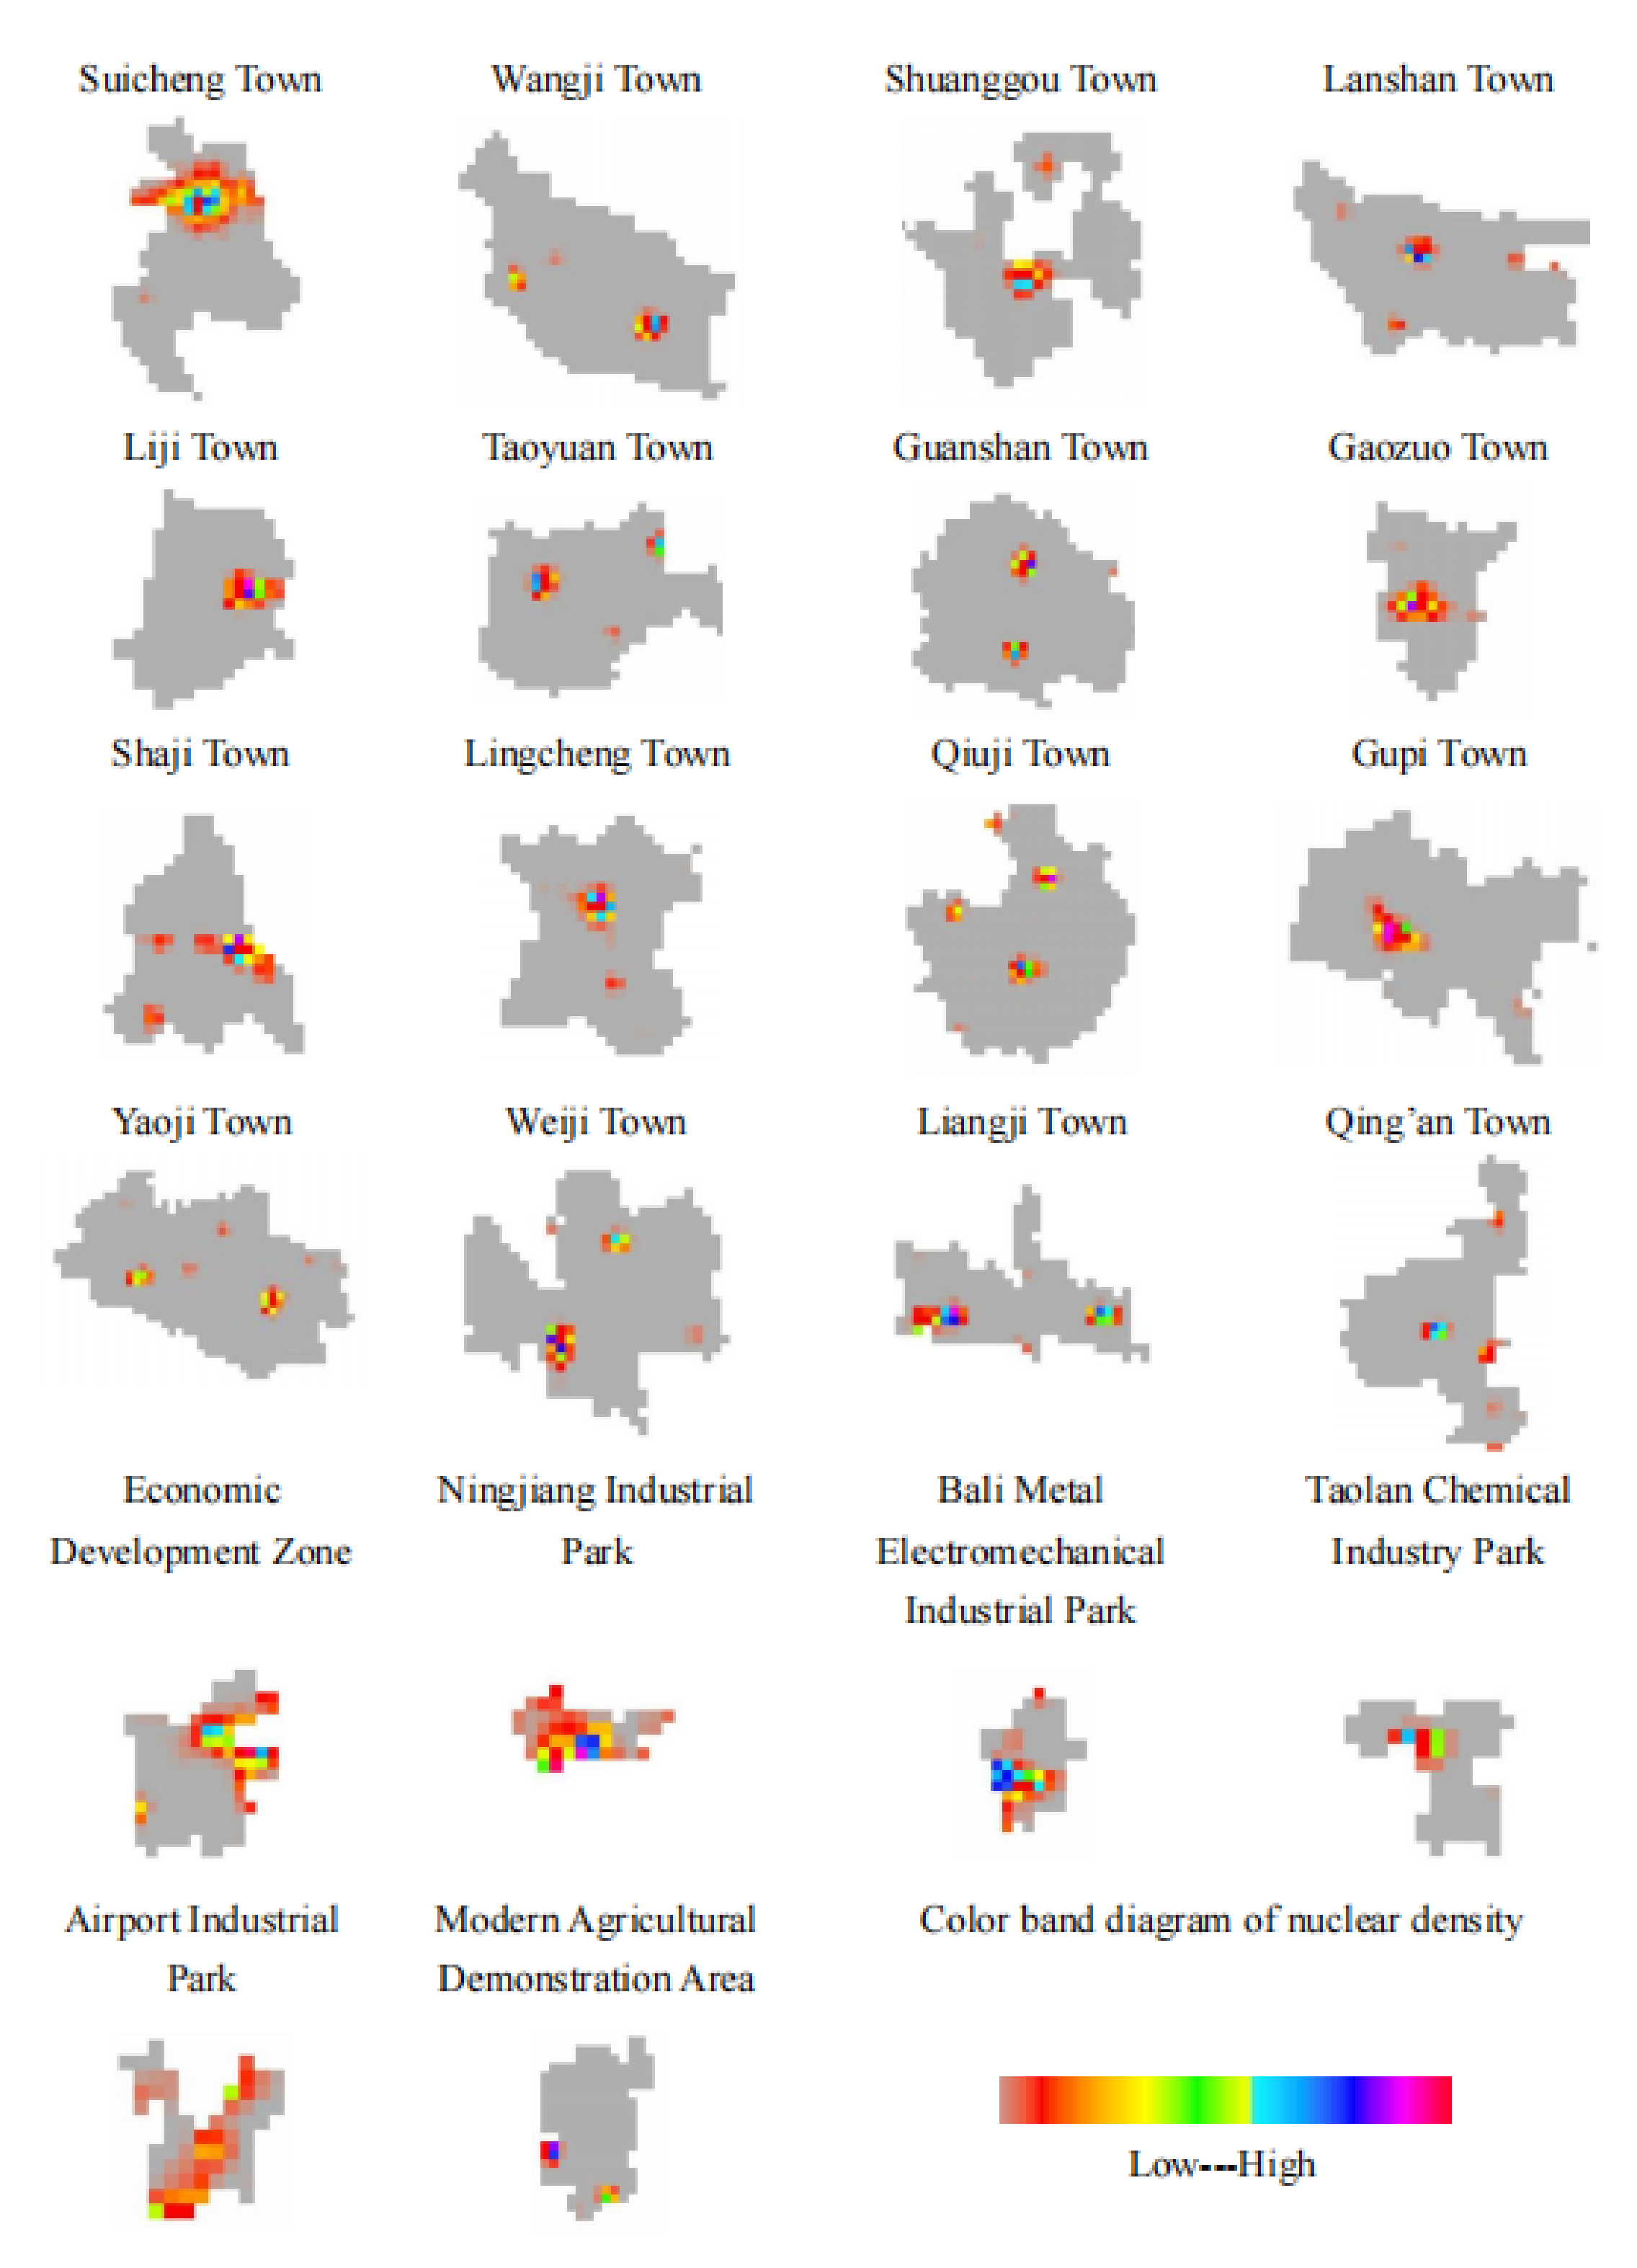
Figure 7, the level of facility convenience in villages and towns of Suining County can be divided into four categories at most: Gaozuo Town, Shuanggou Town, and Shaji Town (level one); Liji Town and Liangji Town (level two); Lingcheng Town, Taoyuan Town, Gupi Town, Qiuji Town, and Wangji Town (level three); Weiji Town, and Lanshan Town, Guanshan Town, Qing’an Town, and Yaoji Town (level four). With Arc GIS 10.2 software, the visibility processing of the spatial differentiation characteristics of facility convenience in Suining County is conducted. The results show that the level of facility convenience in the central and eastern regions of Suining County is relatively high. Except for five villages and towns such as Gaozuo Town, Liangji Town, Shaji Town, Shuanggou Town, and Liji Town, the level of facility convenience in other villages and towns is relatively low, showing the spatial characteristics of the right “人” (Chinese character) pattern at the county scale (Figure 8). At the town scale, it can be seen that the facility convenience of each unit in the central urban area of Suining (including Suicheng Town, Economic Development Zone, Ningjiang Industrial Park, Bali Metal Electromechanical Industrial Park, and Taolan Chemical Industry Park) presents an obvious “agglomeration-dispersion” trend from the center to the periphery. However, the facility convenience of each village and town unit basically presents the spatial agglomeration characteristics of the “center-node” differentiation structure (Table 8).
The reasons for its formation are analyzed: the central area of Suining is the location of the main urban area, its level of urbanization and economic development is relatively high, and the construction of infrastructure and public service facilities is relatively complete, so this area has the highest level of facility convenience. Due to the continuous expansion of urban construction, Liangji Town and Gaozuo Town, which are adjacent to the main urban area, have been included in the construction strategy of the integration in the north of the city and the new town in the east of the city. Especially when Suining High-speed Railway Station was put into operation at the border of Liangji Town in 2019, the main urban area has gradually accelerated the construction of the high-speed railway business district, and infrastructure and public service facilities have continued to radiate and gather in Liangji Town. At the same time, Liangji Town has accelerated its integration into the main urban area in terms of planning and construction and has continuously improved the construction level of public service facilities and infrastructure in the town. Driven by the radiation of Bali Metal Electromechanical Industrial Park and Ningjiang Industrial Park, Gaozuo Town has formed a high-tech industry agglomeration effect. The pace of the integrated development of industry and city has gradually accelerated, and infrastructure and public service facilities are seamlessly connected to the main urban area, realizing the interconnection. As Shuanggou Town and Shaji Town are adjacent to the urban areas of Xuzhou and Suqian, their location advantages are obvious. Driven by their radiation, they have formed an airport economic industry cluster and an e-commerce industry cluster, respectively. The development level of urbanization is relatively high, and the construction of infrastructure and public service facilities is relatively perfect. Liji Town has initially formed a relatively clustered development of townships, industrial areas, and communities. The layout of public service facilities is also relatively reasonable, and the infrastructure is interconnected, so the level of facility convenience is also high. In other villages and towns, it is relatively difficult to improve the level of public service facilities due to the lack of obvious location advantages, weak industrial foundation, and weak economic development level, so the level of facility convenience is relatively low.

6. Discussion

6.1. Comparison with Other Related Studies

The evaluation system is compared with other relevant studies to highlight the rationality and innovation of this study. At present, the research on the evaluation of “spatial compactness” at home and abroad mainly focuses on urban areas. For the measurement of scale, Guindon B analyzes the spatial compactness level from the spatial distribution of the population and the distance from different population divisions to the urban CBD through the population density indicator [38]. Some scholars select population density, economic density, land density, and other indicators to evaluate the spatial compactness and analyze its spatial-temporal changes [39,40,41]. The research results show that the unit land density value is used to characterize compactness, and the compactness level can be reflected more comprehensively and objectively through multi-index evaluation. Moreover, there is a certain correlation between the density index of “population-economy-land” and compactness. That is to say, the larger the population in the unit land, the higher the economic output value; the smaller the proportion of construction land in the study area, the higher the compactness, and vice versa. The measurement of form originated in the west, and Richardson [42], Gibbs [43], Cole [44], Boyce-Clark [45], and other foreign scholars have successively put forward calculation formulas for compactness. Seen from the value judgment of the formulas, these scholars all believe that the more circular the urban form is, the more compact the space is. Domestic scholars Wu Jin [46] and Wang Xinsheng et al. [47], respectively, use the calculation formulas proposed by Cole and Boyce-Clark to study the spatial and temporal evolution of urban form compactness in China and analyze its spatial characteristics and change trend. However, these formulas are only applicable to the urban shape of a single patch [48]. Compared with the villages and towns with high fragmentation, the compactness level can be objectively explained through the comprehensive measurement of multiple indicators. Many scholars evaluate the compactness of urban function from the land-use diversity index, the proportion of industrial land, the proportion of residential land, and other indicators [40,41,49,50].
The evaluation research on “spatial compactness” in rural areas is mainly explained by optimizing the spatial layout of rural settlements to improve the level of intensive land use. By selecting patch area, patch number, patch distribution density, the proportion of construction land, average nearest distance, average patch area, average patch shape index, area-weighted average patch fractal dimension, land-use fragmentation index, and other landscape pattern indicators, some scholars analyze the spatial distribution characteristics of urban and rural residential areas by GIS technology and landscape pattern analysis methods [51,52,53]. By selecting several landscape pattern indicators, Zhao Xin et al. analyze the spatial distribution characteristics of urban and rural residential areas through GIS technology and the landscape pattern analysis method. On this basis, an ant colony optimization model is built to optimize the spatial layout of urban and rural residential areas with the goal of suitability and compactness [21]. By comparing these research results, it could be found that it can adapt to the spatial form of villages and towns with multiple patches by selecting the average nearest neighbor distance, average patch shape, and land-use fragmentation index, and multi-index comprehensive measurement can comprehensively and objectively evaluate the compactness level of the spatial form of villages and towns.
Existing research results show that domestic and foreign scholars have discussed the evaluation index of “spatial compactness” from different perspectives to some extent, but the evaluation system has not yet formed a unified quantitative standard [54]. Especially, the research on rural areas is still in the blank stage. In this study, the selection of evaluation indicators for “spatial compactness” in rural areas fully draws on the evaluation indicators of “compact cities”, specifically including three aspects of compact scale, compact form, and compact function [40,55]. Combined with the relevant research results of “spatial compactness” in the villages and towns of China, a more comprehensive evaluation index system for spatial compactness in villages and towns has been determined for the first time.
For the evaluation research on “facility convenience”, foreign scholars have not been involved yet, and domestic scholars’ research is concentrated on urban areas. Many scholars have built an evaluation index system based on POI data, quantitatively calculated the facility convenience index, analyzed the spatial pattern characteristics of public service facilities with the help of GIS spatial analysis tools, and then put forward targeted guidance on spatial optimization layout, effectively improving the efficiency of facility allocation [36,54,56,57]. For rural areas, only Sun Jinying et al. conducted field visits and surveys on facility indicators from the perspective of convenience in the evaluation system of livable communities in villages and towns to obtain statistical data and obtained evaluation indicators in combination with expert scoring [58]. The evaluation indicators are mainly qualitative evaluation and lack scientific and objective data support. On the basis of reference, this study also determines the six aspects of commerce, science and education, transportation, medical treatment, life services, leisure, and entertainment as the evaluation indicators of facility convenience in villages and towns.
Based on the research on the current situation of village and town space in northern Jiangsu, the results show that there is a mutual influence and restriction between spatial compactness and facility convenience. Moreover, relevant research results have demonstrated that if the population size fails to reach the minimum threshold for facility allocation, the needs of residents will make it difficult to support the improvement of spatial functional diversity [59]. After that, it will bring about problems such as a high cost of facility construction and use, low efficiency of resource utilization, and imperfect supporting services [60]. It could affect the service level of living and production functions, accelerate population loss in villages and towns and the generation of idle land, and the stability of the village scale will be reduced. In addition, the lack of unified planning and management has led to the disorderly expansion of the village scale and the repeated construction of facilities [61]. Based on the above considerations, in accordance with the principles of availability, feasibility, comparability, and measurability, spatial compactness and facility convenience are integrated into the spatial evaluation index system of villages and towns in this paper. The indicators are not only independent, but also interrelated, and together form an organism with internal relevance. It can not only ensure the intensive land use in villages and towns, but also scientifically set up the layout structure of facility points, and guide the spatial construction of villages and towns in a compact, intensive, convenient, and efficient development direction.

6.2. Contribution and Impact

The research puts forward the evaluation index system of village and town space based on the current situation of the spatial development of villages and towns in northern Jiangsu, which points out the direction for the construction of villages and towns in China to a certain extent. The evaluation content is more in line with the actual needs of rural revitalization strategies and the transformation and development of village and town space at the present stage in China, which is conducive to promoting the coordinated and sustainable development among the economic society, resources and environment, and the residents’ lives, and realizing the intensive space, people-oriented, livable, green, and efficient development demands, with important economic and social benefits. The evaluation system framework used in the study is built based on multi-source data and digital technology. The quantitative method of “collection-processing-analysis-calculation” is used to study the current situation of rural space construction, which has promoted the digital transformation of the rural evaluation system in China to a certain extent. In the future, it will be widely used in quantitative research on village and town layout form, land use, spatial reconstruction, etc. [62,63]. Moreover, it can properly adjust the evaluation indicators and weights according to the developmental differences and needs of villages and towns in the study area, and carry out the evaluation application of village and town space in a wider range. The evaluation results can have important reference values for regional planning and further promote the application of digital technology in the field of village and town planning.
In this study, the evaluation system is applied to study the village and town space of Suining County, and the evaluation results can scientifically and objectively reflect the construction level of spatial compactness and facility convenience in villages and towns of Suining County. Based on the analysis of the evaluation results, it can provide a targeted design scheme of spatial optimization for the construction of villages and towns in Suining County, determine the overall spatial structure of the county from the two aspects of spatial zoning guidance and village classification layout, formulate differentiated zoning construction guidance strategies, and define the spatial carrier for the development of villages and towns according to the ideas of agglomeration and upgrading, suburban integration, characteristic protection, relocation, and merging. On this basis, in terms of the allocation level of public service facilities, it can build the life circle pattern in urban and rural areas by introducing the life circle theory and optimizing and adjusting their spatial layout according to local conditions in combination with the construction status of public service facilities. It is expected to achieve more reasonable spatial planning for the villages and towns of Suining County, optimize the spatial structure and facility layout of villages and towns, improve the utilization efficiency of land resources, reduce the capital cost of facility construction, promote the benign interaction between spatial quality and environmental benefits, and further improve the spatial construction level of villages and towns in Suining County, so as to help the in-depth implementation of rural revitalization and construction in Suining County and provide a reference for the development of research work on the evaluation of village and town space and urban-rural spatial transformation in different regions of China.

6.3. Limitation and Prospect

It is a complex and long process to carry out the evaluation and research on village and town space. The research framework of the digital evaluation system used in this paper is only an exploratory attempt, and there are certain limitations in the research that need to be optimized and improved in the follow-up research. (1) Data accuracy: restricted by the research fund, the remote sensing data used in this paper are Landsat8 OLI_TIRS satellite digital products with an accuracy of 30 m. There are certain restrictions on the spatial research at the village and town levels, and this can cause recognition errors in the image in the feature classification link. Therefore, remote sensing image data with higher precision should be selected in the later research. (2) Technology application: the supervised classification of the image also needs to be further optimized. Through the introduction of deep learning technology, the accuracy of image classification is increased, to improve the accuracy of evaluation index data, so as to ensure the objectivity of evaluation results. (3) Index composition: as the research data of public service facilities, POI data are easy to obtain, but there are also some problems such as a lack of online data and data anti-crawling. Moreover, the data are obtained in the form of “points”, so it is impossible to determine the boundary scale, shape scale, actual utilization status, and other information, which can only reflect the spatial layout and density of facilities. For the measurement of facility convenience, the calculation result of nuclear density is used as the evaluation index value, and it is not combined with road network, distance, and other data for analysis. Therefore, relevant indicators of spatial accessibility [6,7,8,64] can be incorporated into the evaluation system for overall consideration in the later research.

7. Conclusions

By introducing multi-source open data (remote sensing data, POI data, the spatialization data of population and economy) as the original data of evaluation indexes, and using digital technology to establish the technical route for the digital translation of evaluation indexes, the “secondary creation” of data is realized. Compared with the traditional evaluation research process, it reveals the potential and advantages of big data and digital technology in the research of village and town space evaluation, verifies the feasibility of the research means of “big data + digital technology” for the construction of an evaluation system, and has been successfully applied to the research of village and town space evaluation in Suining County. The main conclusions are as follows: (1) In terms of spatial compactness in villages and towns of Suining, the score of Shaji Town is 0.380, which is the highest, while the score of Lanshan Town is 0.152, which is the lowest. In terms of facility convenience, the score of Gaozuo Town is 0.189, which is the highest, while the score of Yaoji Town is 0.012, which is the lowest. In terms of the total score of spatial evaluation, the score of Shaji Town is 0.233, which is the highest, while the score of Lanshan Town is 0.076, which is the lowest. There is little difference in scores between villages and towns. In the remaining villages and towns, only Yaoji Town has a score lower than 0.1 (0.09), and other villages and towns are concentrated in the score range of 0.1–0.2. (2) At the county level, the spatial compactness of Suining villages and towns roughly presents the characteristics of the “X” pattern, decreasing from the middle to the four sides, while facility convenience generally presents the characteristics of the right “人” (Chinese character) pattern. At the town level, facility convenience basically presents the pattern characteristics of the “center-node” differentiation structure.
It can be predicted that the improvement of multi-source data covered in villages and towns and the promotion of digital technology applied in villages and towns will have a positive impact on the digital transformation and reform of the evaluation and research work in villages and towns, so as to promote the sustainable and in-depth development of the construction of digital villages and towns and provide real-time, quantitative, and accurate data and method support for the planning and decision-making of villages and towns.

Author Contributions

Writing—original draft preparation, Y.Z.; Writing—review and editing, L.S.; Project administration, X.J.; Data curation, Y.G. All authors have read and agreed to the published version of the manuscript.

Funding

Supported by the National Key R & D Projects in the “13th Five-year Plan” Period: “Research on Evaluation System and Key Technology of Green and Livable Villages and Towns Construction” (2018YFD1100203); Young Doctor Fund Project of Jiangsu Building Energy Conservation and Construction Technology Collaborative Innovation Center: “Research on Evaluation and Optimization of Village and Town Space Based on Convolutional Neural Network Technology” (SJXTBS2126); Major Research Fund Project of Jiangsu Building Energy Conservation and Construction Technology Collaborative Innovation Center: “Research on Evaluation System of Planning and Construction of Green and Livable Villages and Towns” (SJXTZD2105).

Conflicts of Interest

The authors declare no conflict of interest.

References

  1. Li, H.; Li, Z. Quantitative research on the spatial structure of rural settlements in the surrounding areas of Hefei City. Urban Archit. 2019, 16, 17–18. [Google Scholar] [CrossRef]
  2. Wang, Y. Research on the Current Problem and Countermeasures of “Hollowing” in My Country’s Rural Areas. Master’s Thesis, Hubei University of Technology, Wuhan, China, 2020. [Google Scholar] [CrossRef]
  3. Yoshida, N.; Deichmann, U. Measurement of accessibility and its applications. J. Infrastruct. Dev. 2009, 1, 1–16. [Google Scholar] [CrossRef]
  4. Conrad, C.; Rudloff, M.; Abdullaev, I.; Thiel, M.; Löw, F.; Lamers, J.P.A. Measuring rural settlement expansion in Uzbekistan using remote sensing to support spatial planning. Appl. Geogr. 2015, 62, 29–43. [Google Scholar] [CrossRef]
  5. Sowińska-Świerkosz, B.; Soszyński, D. Spatial indicators as a tool to support the decision-making process in relation to different goals of rural planning. Land Use Policy 2022, 119, 106180. [Google Scholar] [CrossRef]
  6. Piloyan, A.; Gevorgyan, A. Measuring Rural Accessibility in the GIS environment: Case study of Armenia. In Proceedings of the 7th International Conference on Cartography and GIS, Sozopol, Bulgaria, 18–23 June 2018; pp. 18–23. [Google Scholar]
  7. Akın, Ö.; Demirel, H. Measuring Rural Access Index via Spatial Information Science. In Proceedings of the 2019 9th International Conference on Recent Advances in Space Technologies (RAST), Istanbul, Turkey, 11–14 June 2019; pp. 461–463. [Google Scholar]
  8. Sarkar, T.; Sarkar, D.; Mondal, P. Road network accessibility analysis using graph theory and GIS technology: A study of the villages of English Bazar Block, India. Spat. Inf. Res. 2021, 29, 405–415. [Google Scholar] [CrossRef]
  9. Xue, B.; Li, J.; Xiao, X.; Xie, X.; Lu, C.; Ren, W.; Jiang, L. A review of human-land relationship research based on point of interest (POI) big data: Theory, methods and applications. Geogr. Geogr. Inf. Sci. 2019, 35, 51–60. [Google Scholar]
  10. Liu, S.; Qin, Y.; Xu, Y. Inequality and influencing factors of spatial accessibility of medical facilities in rural areas of China: A case study of Henan Province. Int. J. Environ. Res. Public Health 2019, 16, 1833. [Google Scholar] [CrossRef] [PubMed] [Green Version]
  11. Chen, Y.; Sun, S. Analysis of the spatial distribution pattern of child-friendly facilities in the ancient town of Changxindian, Beijing based on POI. Mod. Hortic. 2020, 43, 52–53, 145. [Google Scholar]
  12. Su, R.; Sun, S. Analysis of Spatial Distribution Pattern of Living Service Facilities in Changxindian Ancient Town Based on POI. Mod. Hortic. 2020, 43, 35–36. [Google Scholar]
  13. Jin, Y.; Sun, S. Analysis of Spatial Distribution Pattern of Elderly Facilities in Changxindian Ancient Town Based on POI. Mod. Hortic. 2020, 43, 40–41. [Google Scholar]
  14. Xu, D. Spatial Characteristics and Structure Optimization of Leisure Tourism in Nanjing Based on Network Data Mining. Master’s Thesis, Nanjing Normal University, Nanjing, China, 2017. [Google Scholar]
  15. Wang, J.; Xie, D.; Wang, S.; Yan, J. Research on Spatial Distribution of Rural Tourism in Mountainous and Hilly Areas Based on POI Extraction: Taking Chongqing Farmhouses as an Example. China Agric. Resour. Zoning 2020, 41, 257–267. [Google Scholar]
  16. Feng, L.; Li, C.; Liu, Z.; Yang, Y.; Wang, P. Spatial distribution characteristics of leisure agriculture in Zhengzhou City based on POI data. Jiangsu Agric. Sci. 2020, 48, 33–40. [Google Scholar]
  17. Wang, J. Research on the Spatial Distribution Characteristics and Driving Factors of Farmhouses Based on POI. Master’s Thesis, Southwest University, Chongqing, China, 2020. [Google Scholar]
  18. Liu, P. Basic Research on the Spatial Resolution of Grassroots Villages in the Gully Area of Northern Shaanxi under the Background of Data. Master’s Thesis, Xi’an University of Architecture and Technology, Xi’an, China, 2017. [Google Scholar]
  19. Zhang, X.; Yang, H. Characteristics and guiding strategies of spatial agglomeration evolution of rural settlements in the loess hilly and gully area of northern Shaanxi. Planner 2019, 35, 13–20. [Google Scholar]
  20. Yu, Y.; Wang, R.; Lei, Z. Quantitative Analysis Method of Village Distribution and Digestion Characteristics Based on Spatial Information Technology—A Case Study of Northern Shaanxi, Shaanxi Province. J. West. Hum. Settl. 2019, 34, 109–118. [Google Scholar]
  21. Zhao, X.; Song, Y.; Hu, Y.; Liu, Y.; Zhu, A. Optimization of the spatial layout of urban and rural residential areas based on multi-source open data. J. Guangxi Norm. Univ. (Nat. Sci. Ed.) 2020, 38, 26–40. [Google Scholar]
  22. Chen, W.; Dai, Y.; Geng, Y.; Gao, H.; Ma, Y. Research on village classification method based on POI data and gravity model. J. Agric. Mach. 2020, 51, 195–204. [Google Scholar]
  23. Zhang, X.; Yu, S.; Zhang, X.; Wang, X. Research on the Village Layout of Multi-source Data Fusion—Taking Wulian County as an Example. In Innovative Technology, Empowerment Planning, Wisdom and Sharing the Future—China in 2021, Proceedings of the Annual Conference on Urban Planning Informatization, Virtual Event, 10–11 December 2021; Guangxi Science and Technology Press: Nanning, China, 2021; pp. 29–41. [Google Scholar] [CrossRef]
  24. Xia, X.; Shi, Y.; Wu, W. The role of remote sensing technology in digital rural construction. Satell. Appl. 2020, 9, 8–13. [Google Scholar]
  25. Ma, X.; Li, Q.; Shen, Y. Morphological differentiation and regional types of rural settlements in Jiangsu Province. Acta Geogr. Sin. 2012, 67, 516–525. [Google Scholar]
  26. Ma, Y.; Wang, J.; An, J. Research on the spatial distribution and settlement characteristics of traditional villages in Shanxi Province from the perspective of watershed. J. Taiyuan Univ. Technol. 2021, 52, 638–644. [Google Scholar] [CrossRef]
  27. Hu, Z. Geographical information characteristics and understanding of traditional settlement landscape genes. J. Earth Inf. Sci. 2020, 22, 1083–1094. [Google Scholar]
  28. Ren, P.; Hong, B.; Liu, Y.; Zhou, J. Research on the spatial variation characteristics of rural settlements and the impact of landscape pattern based on RS and GIS. J. Ecol. 2014, 34, 3331–3340. [Google Scholar]
  29. Jiang, Z.; Jie, Y.; Li, R.; He, S. Research on the pattern evolution of rural settlements in arid oasis based on GIS: A case study in Hexi, Gansu. J. Ecol. Rural. Environ. 2019, 35, 324–331. [Google Scholar] [CrossRef]
  30. Zhou, L.; Wang, R.; Peng, Q.; Yan, H.; Li, C. Analysis of regional landscape pattern based on remote sensing images. Adv. Geophys. 2020, 35, 925–931. [Google Scholar]
  31. Zhang, W.; Zheng, R.; Hong, R. Research on the distribution characteristics and landscape pattern of rural settlements based on GIS: Taking Jieyang City as an example. J. Subtrop. Resour. Environ. 2021, 16, 89–94. [Google Scholar] [CrossRef]
  32. Wang, T. Research on the System Construction and Comprehensive Evaluation Application of Green Village System in the Severe Cold Region of Northeast China. Master’s Thesis, Harbin Institute of Technology, Harbin, China, 2017. [Google Scholar]
  33. Mei, Z. Research on the Evaluation Method of Space Compactness for the Development Process of Xincheng New District. Master’s Thesis, Xi’an University of Architecture and Technology, Xi’an, China, 2020. [Google Scholar]
  34. Burton, E. The Compact City: Just or Just Compact? A Preliminary Analysis. Urban Stud. 2000, 37, 1969–2001. [Google Scholar] [CrossRef]
  35. Zhang, L. Research on Comprehensive Measurement of Compact Cities and Their Planning Paths. Master’s Thesis, Chongqing University, Chongqing, China, 2011. [Google Scholar]
  36. Han, F.; Tao, D. Research on the evaluation of the convenience of living in the central urban area of Nanjing from the perspective of daily life circle. Planners 2020, 36, 5–12. [Google Scholar]
  37. Zhang, J. Research on the phenomenon of quasi-urbanization of villages in the process of urbanization. J. Tongji Univ. (Soc. Sci. Ed.) 2006, 4, 36–40. [Google Scholar]
  38. Bert, G.; Zhang, Y. Using Satellite Remote Sensing to Survey Transport-related Urban Sustainability: Part II. Results of a Canadian Urban Assessment. Int. J. Appl. Earth Obs. Geoinf. 2007, 9, 276–293. [Google Scholar]
  39. Zhang, C. Research on the Evaluation of Comprehensive Measures of Urban Compactness. Master’s Thesis, Yunnan University, Kunming, China, 2016. [Google Scholar]
  40. Ma, Z. The Evaluation of Urban Spatial Structure Compactness in Xi’an and Its Influencing Factors. Master’s Thesis, Shaanxi Normal University, Xi’an, China, 2018. [Google Scholar]
  41. Li, C.; Li, Z.; Long, Y. Research on urban compactness in Kunming. Urban J. 2019, 40, 85–91. [Google Scholar]
  42. Richardson, H.W. The Economics of Urban Size Lexington; Saxon House: Famborough, UK, 1973; pp. 8–243. [Google Scholar]
  43. Gibbs, J.P. Urban Research Methods; Van Nostrand: Princeton, NJ, USA, 1961; pp. 12–621. [Google Scholar]
  44. Cole, J.P. Study of Major and Minor Civil Division in Pllitical Geography. Miemgraphed. 1960. Available online: https://epubs.utah.edu/index.php/ISUF2020/article/download/4278/3658/ (accessed on 1 May 2022).
  45. Xiong, H.; Zheng, B.; Jia, L. my country’s urban spatial expansion under the interaction of driving and restricting forces. Econ. Geogr. 2016, 36, 82–88. [Google Scholar]
  46. Wu, J. Chinese Urban Form: Structure, Characteristics and Evolution; Jiangshang Science and Technology Press: Nanjing, China, 1990. [Google Scholar]
  47. Wang, X.; Liu, J.; Zhuang, D.; Wang, L. The spatial and temporal characteristics of spatial form changes in Chinese megacities. Acta Geogr. Sin. 2005, 3, 392–400. [Google Scholar]
  48. Li, L.; Huang, X. Research on the measurement and evaluation of compactness based on the interpretation of the connotation of “compactness”—The construction of the conceptual system and index system of “compactness”. Int. Urban Plan. 2012, 27, 33–43. [Google Scholar]
  49. Wang, D. The measurement of spatial compactness in Beijing and its improvement countermeasures. Urban Probl. 2013, 11, 25–30. [Google Scholar]
  50. Guo, H.; Huang, Y.; Zhao, D.; Xiao, R. Research on the compactness of urban space based on grid method—Taking Tianhe District of Guangzhou as an example. Int. Urban Plan. 2016, 31, 51–57. [Google Scholar] [CrossRef]
  51. Liu, S.; Guo, F. Research on the Layout Optimization of Rural Residential Sites Based on Landscape Pattern Analysis. J. Northeast. Agric. Univ. 2010, 41, 42–46. [Google Scholar]
  52. Wang, Y. Research on the Layout Optimization of Rural Settlements in Hengshan District Based on Landscape Pattern and Ant Colony Algorithm. Master’s Thesis, Chang’an University, Xi’an, China, 2017. [Google Scholar]
  53. Wang, M. Research on High Resolution Remote Sensing Image Classification Method and Its Application in Landscape Pattern Analysis. Master’s Thesis, Hefei University of Technology, Hefei, China, 2018. [Google Scholar]
  54. Zhao, Z.; Zeng, P. Analysis of the convenience of life in the main urban area of Tianjin based on POI data. In Vibrant Urban and Rural Beautiful Habitat, Proceedings of the 2019 China Urban Planning Annual Conference (05 Application of New Technologies in Urban Planning), Chongqing, China, 19 October 2019; China Construction Industry Press: Beijing, China, 2019; p. 9. [Google Scholar]
  55. Gordon, P.; Richardson, H.W. Are compact cities a desirable planning goal? J. Am. Plan. Assoc. 1997, 63, 95–106. [Google Scholar] [CrossRef]
  56. Zhuang, X.; Tao, N.; Wang, J. Research on Convenience Evaluation of Urban 15-minute Community Living Circle Based on POI Data—Taking the Third District of Wuhan as an Example. Huazhong Archit. 2020, 38, 76–79. [Google Scholar]
  57. Lu, Z.; Chen, Q.; Ren, Q.; Su, Y.; Rui, J. Evaluation of urban life convenience in southern Jiangsu based on POI data. J. Huaiyin Norm. Univ. (Nat. Sci. Ed.) 2020, 19, 233–238. [Google Scholar]
  58. Sun, J.; Jiao, Y.; Wang, Y. Research on the evaluation index system framework of livable communities in villages and towns. Constr. Econ. 2015, 36, 107–110. [Google Scholar] [CrossRef]
  59. Shi, Z.; Ma, L.; Zhang, W.; Gong, M. Differentiation and correlation of spatial pattern and multifunction in rural settlements considering topographic gradients: Evidence from Loess Hilly Region, China. J. Environ. Manag. 2022, 315, 115127. [Google Scholar] [CrossRef]
  60. Tang, C.L.; He, Y.; Zhou, G.; Zeng, S.S.; Xiao, L.Y. The research on optimization mode of spatial organization of rural settlements oriented by life quality. Acta Geogr. Sin. 2014, 69, 1459–1472. [Google Scholar]
  61. Yang, Y.; Bao, W.; Liu, Y. Coupling coordination analysis of rural production-living-ecological space in the Beijing-Tianjin-Hebei region. Ecol. Indic. 2020, 117, 106512. [Google Scholar] [CrossRef]
  62. Zhang, S.; Li, Z. Research and Prospect of the Spatial System Structure Layout of Villages and Towns. Int. J. Soc. Sci. Educ. Res. 2022, 5, 216–222. [Google Scholar]
  63. Yang, X. Advances in quantitative research methods of rural settlement layout patterns at home and abroad in the past 20 years. Int. Urban Plan. 2020, 35, 72–80. [Google Scholar]
  64. Yu, Y.; Hong, G.; Liu, Z.; Lu, K. Spatial accessibility and optimization strategy of Suzhou villages and towns based on travel big data. Planner 2019, 35, 81–87. [Google Scholar]
Figure 1. Thoughts on the transformation of village and town space construction in Suining County.
Sustainability 14 07603 g001
Figure 2. Spatial construction mode of villages and towns in Suining County.
Sustainability 14 07603 g002
Figure 3. Research framework of village and town space evaluation system based on multi-source data and digital technology.
Sustainability 14 07603 g003
Figure 4. Nuclear density analysis of public service facilities in Suining County.
Sustainability 14 07603 g004
Figure 5. Cluster analysis pedigree of space compactness in villages and towns of Suining County.
Sustainability 14 07603 g005
Figure 6. Spatial differentiation diagram of space compactness in Suining County.
Sustainability 14 07603 g006
Figure 7. Cluster analysis pedigree of facility convenience in the villages and towns of Suining County.
Sustainability 14 07603 g007
Figure 8. Spatial differentiation diagram of facility convenience in Suining County.
Sustainability 14 07603 g008
Table 1. Construction land change of villages and towns in northern Jiangsu from 2005 to 2019.
YearBuilt-Up Area of Organic Towns (Unit: km2)Built-Up Area of Township (Unit: km2)Village Land Area (Unit: km2)
2005662793710
2010988923922
20151088893770
20191110503270
Change range during 2005–2019+448−29−440
Table 2. Village land-use changes in northern Jiangsu from 2010 to 2019.
YearAverage Village Land Area (Unit: hm2)Per Capita Village Land Area (Unit: m2)
20106.33199
20156.35210
20195.92183
Table 3. Interpretation of the spatial form types of villages and towns in northern Jiangsu.
TypeFormation Mechanism and Morphological CharacteristicsTypical AtlasAdvantageDisadvantageMajor Region
Zoned centralized typeThis type is mostly distributed in the suburbs of various cities. Driven by the radiation of economy and infrastructure, it mostly develops in the production mode of “half industry and half agriculture”. The village is large in scale, and the spatial form is relatively concentrated Sustainability 14 07603 i001Compact space, intensive and efficient land use, relatively independent function, and convenient facilitiesPoor coordination between functions, more convenient facilitiesIndustry-led villages in cities (smaller part)
Mixed concentrated typeThis type is mainly distributed in low-lying plain areas. In terms of agricultural production, there are both dry farming and paddy fields. The farming radius and village density are relatively large, but the edge shape is broken Sustainability 14 07603 i002Compact space, intensive and efficient land use, and convenient facilitiesMutual interference and confusion between functions, more convenient facilitiesHuai’an (smaller part), Lianyungang (smaller part)
Punctate dispersion typeThis type is mainly distributed in lakes and hillock areas (Hongze Lake, Weishan Lake, Luoma Lake). Most farmers choose their fields to live and the villages are sparse and small. The spatial form is mostly scattered, with a high degree of fragmentation Sustainability 14 07603 i003Flexible layout and high integration with the surrounding environmentNot compact space, weak connection between functions, and inconvenient facilitiesHuai’an (most regions), Xuzhou (smaller part), Suqian (smaller part)
Linear dispersion typeThis type is mainly distributed in the Jiangsu coastal reclamation area. Due to the impact of water conservancy facilities built in the early stage, in order to facilitate agricultural production, farmers mostly built their houses on both sides of rivers or roads close to cultivated land, forming a strip linear spatial form for a long time. The village is small in scale, scattered, and highly fragmented as a whole Sustainability 14 07603 i004Flexible layout and convenient transportationNot compact space, poorer connection between functions, and inconvenientLianyungang (smaller part), Yancheng (most regions)
Agglomerate dispersion typeThis type is mainly distributed in plains and hills, with sufficient cultivated land. Due to the low density of the river network, dry farming is the main agricultural production mode. The farming radius is large, and a large-scale village is dominant, which is scattered as a whole and partially grouped. The shape is regular, and the connectivity and integrity are also good Sustainability 14 07603 i005Flexible layout and intensive land useNot compact space, inconvenient traffic, and repeated construction of facilitiesLianyungang (most regions), Xuzhou (most regions), Suqian (most regions)
Table 4. Village planning and construction documents in Jiangsu Province from 2003 to 2014.
YearIntroduction DepartmentDocumentContent
2003Jiangsu Provincial GovernmentOpinions on Deepening the Reform of Land Use System and Optimizing the Allocation of Land ResourcesIt is required to vigorously implement the consolidation of idle land in villages and new rural houses should be built in plots after unified planning
2004Notice on Effectively Strengthening Intensive Land UsePromoting the construction of “three centralization” in villages and towns, namely industry concentrating in development zones, population concentrating in cities and towns, and housing concentrating in communities
2005Notice of the General Office of the Provincial Government on the Preparation of Town and Village Layout Planning in the Whole ProvinceActing according to circumstances, combining with practice, abolishing and integrating scattered natural villages, gradually implementing the construction of centralized residential areas
2009Overall Land Use Planning of Jiangsu Province (2006–2020)Further promoting the centralized layout and construction of farmers’ housing in cities, towns, and villages
2010Notice of the General Office of the Provincial Government on Strengthening the Overall Urban and Rural PlanningStrictly controlling the rural spatial form, emphasizing spatial agglomeration and intensive development, giving consideration to the balanced construction of urban and rural public services
2014Notice on Optimizing the Layout and Planning of Towns and VillagesAccelerating the optimization and adjustment of urban and rural spatial layout and structure and building a new compact urban and rural pattern
Table 5. Evaluation index system of village and town space.
Criterion Layer I (Weight)Criterion Layer II (Weight)Index Layer (Weight)Index Trend
Spatial compactness (0.347)Scale compactness (0.125)Spatial density of population (0.037)+
Spatial density of economy (0.038)+
Proportion of construction land (0.050)
Form compactness (0.095)Mean patch shape index (0.031)
Average nearest neighbor distance (0.023)
Land fragmentation index (0.041)
Function compactness (0.127)Land use diversity index (0.029)+
Proportion of industrial land (0.048)+
Proportion of residential land (0.050)+
Facility convenience (0.653)Commercial convenience (0.091)Catering (0.030)+
Shopping (0.028)+
Accommodation (0.032)+
Science and education convenience (0.091)Primary and secondary schools (0.030)+
Kindergartens (0.031)+
Education and training institutions (0.029)+
Traffic convenience (0.129)Parking lot (0.035)+
Station (0.059)+
Bus stop (0.035)+
Medical convenience (0.102)General hospital (0.032)+
Community health station (0.042)+
Pharmacy (0.028)+
Convenience of life service (0.119)Financial network (0.033)+
Communication operator (0.050)+
Logistics network (0.036)+
Leisure and entertainment convenience (0.121)Leisure place (0.030)+
Entertainment place (0.029)+
Sports venues (0.061)+
Table 6. Quantitative interpretation of evaluation indexes.
Index LayerFormulaQuantitative Interpretation
Spatial density of population P D I = P i A i PDI is the spatial density of a population, and the unit is persons/km2; Pi is the total resident population in the i study unit; Ai is the total land area in the i study unit
Spatial density of economy E D I = E i A i EDI is the spatial density of the economy, and the unit is 104 yuan/km2; Ei is the economic aggregate in the i study unit; Ai is the total land area in the i study unit
Proportion of construction land C D I = C A A i × 100 % CDI is the proportion of construction land, and the unit is %; CA is the total area of construction land in the i study unit; Ai is the total land area in the i study unit
Mean patch shape index M S I = 1 n × i = 1 n C i 4 × S i MSI is the mean patch shape index; Ci is the girth of the ith patch; Si is the area of the ith patch
Mean nearest neighbor distance M N N = 1 n × i = 1 n h i MNN is the mean nearest neighbor distance; hi is the distance between the ith residential area patch and its nearest residential area patch
Land fragmentation index F I = N 1 D × 100 % FI is the land fragmentation index; N is the total number of construction land patches; D is the ratio of total land area to the minimum land area in the study unit
Land use diversity index L U I = i = 1 n x i × ln x i LUI is the land-use diversity index; xi is the proportion of land belonging to type i in the total land use of the research unit; n is the total number of land types
Proportion of industrial land P I L = Y i A i × 100 % PIL is the proportion of industrial land, and the unit is %; Yi is the industrial land area in the i study unit; Ai is the total land area in the i study unit
Proportion of residential land P R L = R i A i × 100 % PRL is the proportion of residential land, and the unit is %; Ri is the residential land area in the i study unit; Ai is the total land area in the i study unit
Catering, shopping, and accommodation; primary and secondary schools, kindergartens, education and training institutions; parking lot, station, and bus stop; general hospital, community health station, pharmacy; financial network, communication operators, and logistics network; places of leisure, entertainment, and sports D i j = X i j A i j Dij shows the distribution density of the jth class of facility in the ith study unit, and the unit is km−2; Xij shows the total number of the jth class of facility in the ith study unit; Ai shows the total land area in the ith study unit
Table 7. Evaluation results and ranking of administrative units in Suining County.
No.Study AreaSpace
Compactness
RankingFacility ConvenienceRankingSpace Construction LevelRanking
1Suicheng Town0.70330.78510.7661
2Wangji Town0.211160.040170.10319
3Shuanggou Town0.25780.17590.1969
4Lanshan Town0.152220.024190.07622
5Liji Town0.249100.126110.16111
6Taoyuan Town0.211160.062140.11115
7Guanshan Town0.221130.021200.10418
8Gaozuo Town0.211160.18970.19410
9Shaji Town0.38050.174100.2337
10Lingcheng Town0.188190.073130.11016
11Qiuji Town0.172210.045160.09320
12Gupi Town0.234120.054150.12413
13Yaoji Town0.184200.012220.09021
14Weiji Town0.212140.029180.10517
15Liangji Town0.216150.123120.14812
16Qing’an Town0.25390.015210.12214
17Economic Development Zone0.74310.30350.4114
18Ningjiang Industrial Park0.64240.45520.4952
19Bali Metal Electromechanical Industrial Park0.72320.40930.4763
20Taolan Chemical Industry Park0.33260.28160.2926
21Airport Industrial Park0.30670.30440.3045
22Modern Agricultural Demonstration Area0.246110.18580.1998
Table 8. Interpretation of the spatial differentiation structure of facility convenience in villages and towns of Suining County.
Name of Villages and TownsDifferentiated Agglomeration Structure
Wangji Town“1 + 1 + 1” of three levels: namely town area (main center), Pinglou (sub-center), Sutang (node)
Shuanggou Town“1 + 1” of two levels: namely town area (main center), Guanlu (node)
Lanshan Town“1 + 4” of two levels: namely town area (main center), Chenji, Huji, Xingwei, Shuizhang (node)
Liji TownForming town agglomeration
Taoyuan Town“1 + 1 + 1” of three levels: namely town area (main center), Zhuji (sub center), Zhupeng (node)
Guanshan Town“1 + 1 + 1” of three levels: namely town area (main center), Huangji (sub-center), Tangji (node)
Gaozuo TownForming town agglomeration
Shaji Town“1 + 3” of two levels: namely town area (main center), Xiawei, Dagu, Dongfeng (node)
Lingcheng Town“1 + 1” of two levels: namely town area (main center), Liwei (node)
Qiuji Town“1 + 1 + 3” of three levels: namely town area (main center), Wanglin (sub-center), Yaowei, Zhukai, Nianpan (node)
Gupi Town“1 + 1” of two levels: namely town area (main center), Lvji (node)
Yaoji Town“1 + 1 + 4” of three levels: namely town area (main center), Zhangwei (sub-center), Liuji, Datong, Liudian, Gaodang (node)
Weiji Town“1 + 1 + 2” of three levels: namely town area (main center), Putang (sub-center), Wangwei, Xudaizhuang (node)
Liangji Town“1 + 1 + 2” of three levels: namely town area (main center), Liuweiwei (sub-center), Sunmiao, Qianxi (node)
Qing’an Town“1 + 1 + 2” of three levels: namely town area (main center), Longji (sub-center), Yangwei, Guaner (node)
Publisher’s Note: MDPI stays neutral with regard to jurisdictional claims in published maps and institutional affiliations.

