Article

Fertilization Practices: Optimization in Greenhouse Vegetable Cultivation with Different Planting Years

1
Department of Horticulture and Landscape Architecture, Henan Institute of Science and Technology, Xinxiang 453003, China
2
Henan Province Engineering Technology Research Center of Characteristic Horticultural Plant Development and Utilization, Xinxiang 453003, China
3
Department of Logistics Information Engineering, Henan Institute of Logistics and Vocational, Zhengzhou 450000, China
4
Department of Resource and Environment, Henan Institute of Science and Technology, Xinxiang 453003, China
*
Author to whom correspondence should be addressed.
Sustainability 2022, 14(13), 7543; https://doi.org/10.3390/su14137543
Submission received: 25 April 2022 / Revised: 8 June 2022 / Accepted: 15 June 2022 / Published: 21 June 2022

Abstract

:
Cucumber plant growth and the fate of N in the plant-soil system are influenced by fertilization practices, the strengths of which may vary among soils. Three soils with different years of greenhouse vegetable cultivation (0, 2, and 18 years) were fertilized differently (CK, no N fertilizer applied; CF, chemical NPK fertilizers applied; RCF, reduced chemical NPK fertilizers applied, with N, P, and K reduced by 46.5%, 68.6%, and 54.7%; RCF+CM, 75% of the total N derived from chemical fertilizer and the rest from chicken manure in the case of reduced fertilization) in a pot experiment to study the changes in cucumber (Cucumis sativus L.) growth, N uptake, residue, and losses. The original N in soil was insufficient to maintain leaf growth and chlorophyll synthesis at later growth stages, even in soil with 18 years of greenhouse vegetable cultivation, where the original N content was the highest (total N 1.73 g kg−1). However, the CF treatment with excessive N fertilization inhibited leaf growth at the early growing stage and accelerated leaf senescence later, especially in soil with longer years of greenhouse vegetable cultivation. Therefore, reduced fertilizer application (RCF and RCF+CM) is appropriate to improve cucumber growth and productivity in greenhouse cultivation with different planting years. Although the same amount of N was applied, the RCF+CM treatment performed better than the RCF treatment in terms of increasing plant N uptake (by 30.5%) and soil N pool storage (by 25.0%) while decreasing N losses (by 16.6%) in soil with 0 years of greenhouse vegetable cultivation. In soil with 2 and 18 years of greenhouse vegetable cultivation, the soil itself functions much better in exogenous N retention and supply, with the N storage and losses not significantly different between the RCF and RCF+CM treatments. We conclude that reduced fertilization with the co-application of chicken manure is optimal for plant growth promotion, output-input ratio increase, soil N fertility improvement, and environmental risk mitigation.

1. Introduction

In China, greenhouse vegetables have been developing rapidly due to the urgent need for vegetable supply [1]. Cucumber is one of the most widely cultivated species due to its short nutrient cycling, high economic benefits, and nutritious values [2]. However, the year-round overuse of nitrogen (N) fertilizer in such intensively cultivated system has resulted in a low N use efficiency that barely exceeds 20% [3]. The unused N can be lost through ammonium volatilization, denitrification, leaching, and runoff, contributing to environmental risks such as the greenhouse effect, eutrophication, and groundwater pollution [4,5,6,7,8]. Additionally, the long-lasting heavy N fertilization adversely influences soil physicochemical and microbiological properties, such as soil acidification [9,10], salt accumulation [11], imbalanced NPK nutrients [12], and decreased microbial diversity and populations [13,14]. With high yield as the only priority, the system was considered unsustainable [15]. Thus, there is a great N-saving potential in such intensive production systems [16,17]. Studies focusing on optimized fertilizer management in full consideration of the associated environmental risks, soil sustainability, plant nutrition uptake, and output–input ratio have been gradually appreciated by researchers [18,19].
It is widely reported that reduced fertilizer application plays a positive role in N use efficiency improvement as well as N losses control [20,21]. Partial substitution of chemical fertilizers with organic material has also been advocated. However, the effects change not only with the properties of organic materials, such as C/N ratio, lignin content, and soluble organic N [22,23,24], but also with the status of soils [25]. In contrast to the farmland, organic manure is widely used at 13–20 t ha−1 annually in vegetable fields [26], and the amount of N fertilization is two to three times higher [27]. Such differences in fertilization history may cause changes in soil N fertility and microbial activity among fields with different years of greenhouse vegetable cultivation [11,28], both of which have been reported to have influences on key processes associated with exogenous N retention, plant N uptake, and N losses [29,30]. Research by Liang et al. [31,32] reported that the long-term co-application of organic materials with chemical fertilizers (instead of no fertilizer or merely chemical fertilizers) improved the synchrony between N supply and crop demand, thus increasing N use efficiency while reducing N losses from the system. Further research found that the sufficient plant-available original N in soil over the growing season would result in a limited crop response to fertilized N by increasing the contribution of soil derived N [33,34]. However, how the effects of fertilization practices would change with the cultivation years of greenhouse vegetables is still unknown. An improvement of N management practices according to the status of the soil is urgently required.
In this study, a pot experiment in a glasshouse was used to investigate the effect of different fertilization treatments (CK, control; CF, conventional chemical fertilization; RCF, reduced chemical fertilization; RCF+CM, reduced chemical fertilization + chicken manure) on cucumber growth and the fate of N in soils with different years of greenhouse vegetable cultivation (0, 2, and 18 years). The objectives were (1) to compare the effects of different fertilization practices on cucumber growth, N absorption, residue in soil, and losses and (2) to analyze how the mechanisms involved would change at different cultivation years of greenhouse vegetable fields. We suppose that (1) reduced fertilization or chicken manure co-application can achieve lower N residue and losses, (2) soil with longer years of greenhouse vegetable cultivation would function better in exogenous N retention and supply, and the gap of different fertilization effects on plant growth, N uptake, residue, and losses may decrease or even disappear with the increasing years of cultivation. Such knowledge helps establish site-specific N management practices according to the status of the soil.

2. Materials and Methods

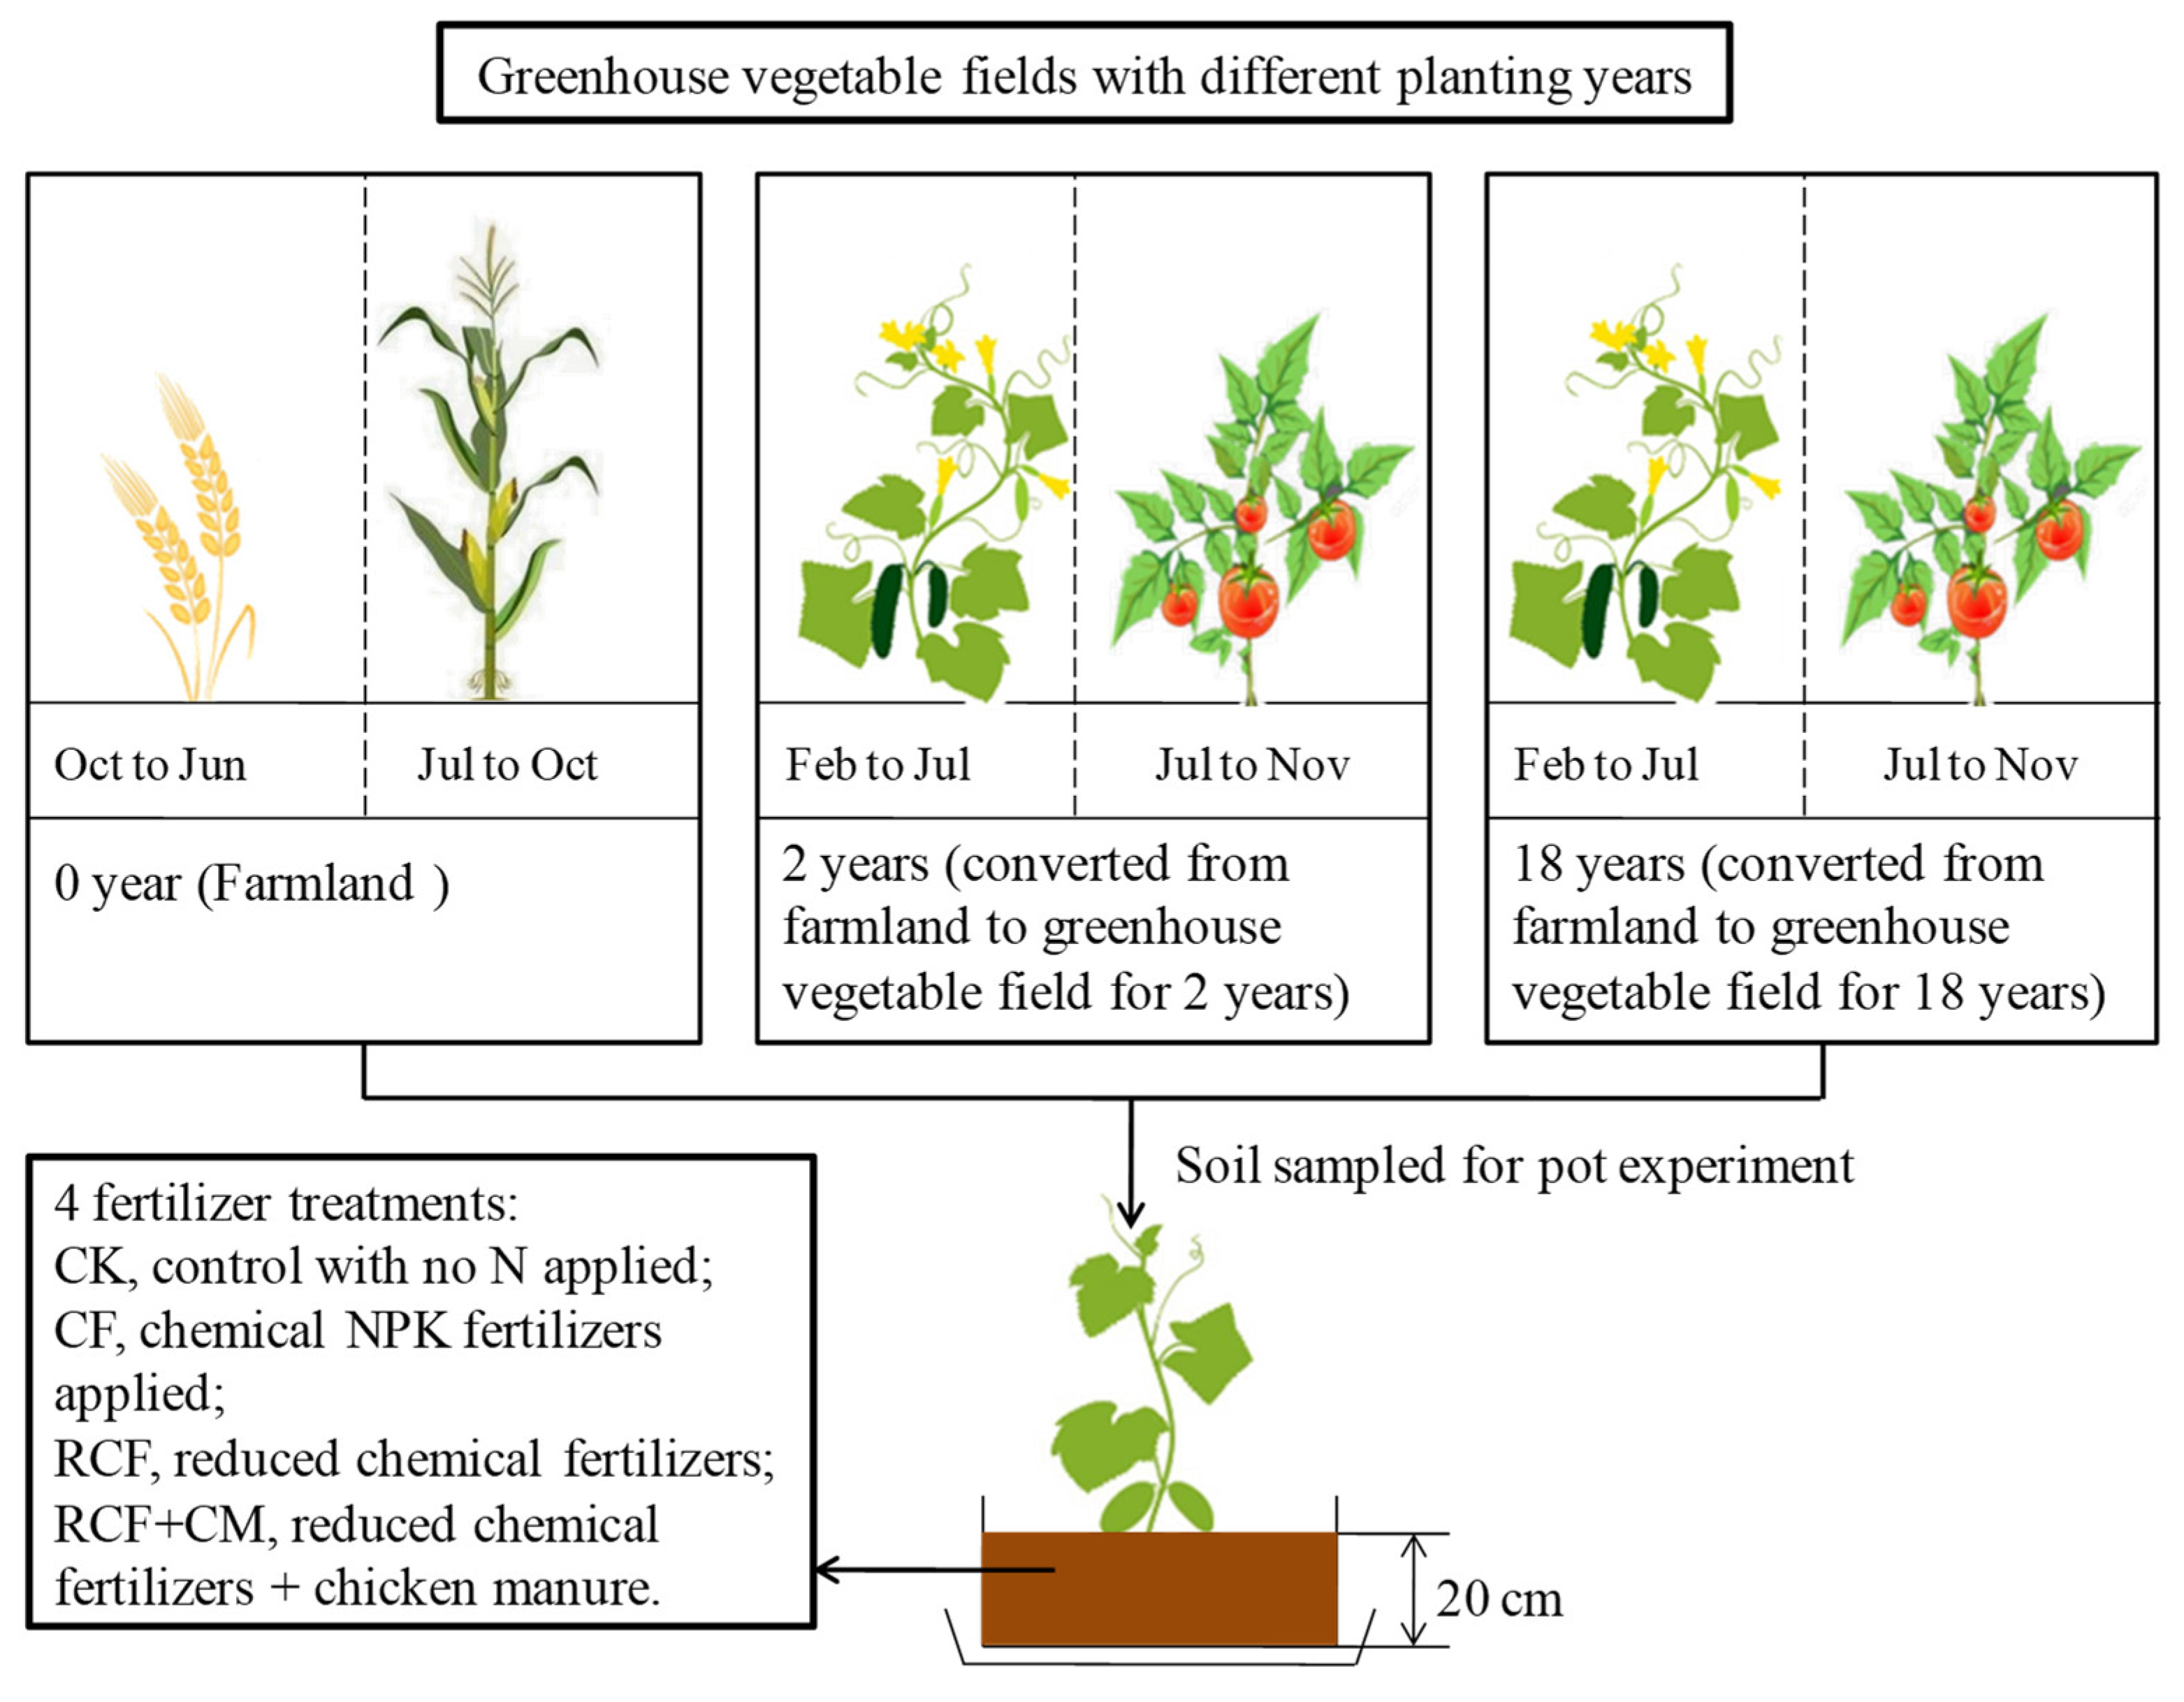
2.1. Site Description

The field site was located in Zhuzhuangtun village (35°18′ N, 113°54′ E), Xinxiang City, Henan Province, China. The region is classified as a warm temperate continental monsoon climate. The annual average temperature is 14.0 °C. The annual average rainfall is 573.4 mm. The soil is classified as a fluvo-aquic soil. This area’s dominant plastic greenhouse vegetable growing system was an early spring cucumber–autumn tomato rotation.

2.2. Experimental Design

Three greenhouse vegetable fields with different cultivation years were selected from the adjacent fields of the same farmer, thus minimizing the influence of soil types (Figure 1). To reduce fertilizer influences on soil samples, we avoided collecting samples during fertilization season and taking samples at fertilization sites. Soil sampling (0–20 cm) was conducted in July 2018 from the greenhouse vegetable fields with two different planting years (2 and 18 years, converted from farmland to facility vegetable field for 2 and 18 years, respectively) after the harvest of early spring cucumber. Multi-point mixed sampling was adopted within the 0–20 cm depth. The soil corresponding to year 0 came from nearby farmland rotated with winter wheat and summer maize yearly. The experimental soil was sampled after the winter wheat harvest on 10 June 2018. After removing large rocks and plant materials, part of the soil (2 mm sieved) was used to determine basic physicochemical properties. The remaining sample was air dried and stored for the pot experiment.
A pot experiment was conducted with early spring cultivated cucumber (Cucumis sativus L.) in a glasshouse at Henan Institute of Science and Technology from 19 March to 18 June 2019. For each soil, four fertilizer treatments were performed in a completely randomized block design: (1) CK, control with no N fertilizer applied, only P and K were fertilized; (2) CF, chemical N, P, and K fertilizes were applied according to the fertilization habit of local vegetable growers in the forms of urea (N 46.0%), sodium hydrogen phosphate (P 21.8%), and potassium chloride (K 52.4%) (all chemical reagents); (3) RCF, reduced amounts of chemical N, P, and K fertilizers were applied (N, P, and K were reduced by 46.5%, 68.6%, and 54.7%, respectively); (4) RCF+CM, reduced amounts of N, P, and K fertilizers were applied, with 75% of the total N derived from chemical fertilizer and the rest from chicken manure. The same amounts of N, P, and K nutrients were applied in the RCF and RCF+CM treatments. Details of the fertilization used in the four treatments are present in Table 1. The amounts of N, P, and K applied per kg of dry soil were calculated according to the fertilization amount in the field case (the average N fertilization amount of local farmers: 1122 kg ha−1) and the average bulk density of the three soils (bulk densities from the 0–20 cm soil layer were 1.27 g cm−3, 1.50 g cm−3, and 1.72 g cm−3 for soil with 0, 2, and 18 years of greenhouse vegetable cultivation, respectively; the calculated average bulk density was 1.50 g cm−3).
Chemical fertilizers were applied by dissolving in distilled water. All P and K fertilizers were basal-applied before sowing. Thirty percent of N fertilizer was basal-fertilized before transplanting and the rest was applied as supplementary fertilizer at the initial flowering stage of cucumber. Chicken manure (commercial pure chicken manure, already fermented at high temperature; total N, P, and K contents in chicken manure were 26.4 g kg−1, 23.2 g kg−1, and 8.36 g kg−1, respectively) was added to the soil directly and thoroughly mixed before potting.
Forty-eight basins (4 planting years × 4 treatments × 3 replicates) were used and the tested cucumber variety was ‘Xinjinchun 4′. Seeds were grown on acupoint disc substrate in the glasshouse on 19 March 2019. Then, seedlings were transplanted to the basin (1 plant per basin, 30.0 cm in length, 17.5 cm in width, and 25.0 cm in height, corresponding to a field density of 47 thousand plants per ha; 15 kg air-dried soil per pot) on 20 April 2019, when most of the forth true leaf unfolded. On 18 June 2019, 90 days after sowing, cucumber growth was finalized. A soil moisture detector was used each week to monitor soil moisture content and calculate the irrigation amount needed in each basin (soil water content was adjusted to 60% of the water holding capacity with distilled water) during the cucumber growth. Water was slowly added to prevent any leaching. Other management measures during the plant growth followed the same schedule as local farmers.

2.3. Data Collection and Sample Analysis

Plant height, stem diameter, leaf area, and SPAD value were measured at 30 (seedling stage), 47 (first flowering), 65 (early fruiting), and 90 (uprooting) days after sowing. Plant height was measured from the base of the plant stem to the growing point of the main stem. Stem diameter was measured with a vernier caliper at the base of the stem. SPAD values were measured with a portable chlorophyll meter (SPAD-502Plus, Konica Minolta Investment Ltd.). Three functional leaves were selected from each plant and the average value was taken. The length and width of all unfolded blades were measured with tape to calculate the total leaf area (LA). Plant and soil samples were collected destructively from the basin 90 days after sowing when most of the lower leaves began to become senile.
Above and belowground parts of collected plants were weighed after baking in the oven at 65 °C until constant weight. Pulverized plant samples and soil samples (0.25 mm sieved) were used to determine total N with an elemental analyzer (Inductar EL Cube, Elementer Ltd. Langenselbold, Germany). Soil organic matter was determined by the potassium dichromate oxidation method and conversion coefficient (1.724) [35]. Total P was determined after acid digestion by the phosphovanado-molybdate method [36], and total K was determined by flame spectrometry (AP1302, Shanghai Aopu Analytical Instrument Co. Ltd. Shanghai, China) after dissolution with HF-HClO4. Soil pH was measured in a 1:2.5 soil to water solution by a pH meter (Model PHS-3C, Shanghai Precision and Scientific Instrument Co. Ltd. Shanghai, China). EC was measured in saturated soil paste using an electrical conductivity meter (DDS-307, Shanghai Thunder Magnetic Scientific Instrument) as described by Rhoades [37]. Soil water holding capacity was obtained using the cutting ring method for the undisturbed soil from the upper 20 cm in the field [38].

2.4. Calculations and Statistical Analysis

LA = ∑(length × width × k)
Leaf area index (LAI) = LA/Cover area
Plant growth potential = LA × Plant height
where k is the conversion ratio of leaf area (equivalent to 0.74 for greenhouse cucumber) [39]. The cover area was roughly calculated as the size of one basin (30.0 cm × 17.5 cm). Plant growth potential was calculated according to Guo et al. [40].
N losses were calculated according to the nutrient balance method below [12,41]:
Ni = Nup + Ns + Nl
where Ni indicated N input, including applied fertilizer or manure, seed, irrigation, and dry and wet deposition. N input from the seed was negligible considering that this part of N was comparatively low. N from irrigation and deposition were both estimated as zero, considering that only distilled water was used during the cucumber growth and the basins were all kept in a glasshouse. Nup indicated plant N uptake (the total N accumulation in aboveground and belowground biomass). Ns indicated soil N pool increment, calculated as the deviation between soil total N accumulation within 0–20 cm depth before and after cucumber growing. Nl indicated total N losses by way of leaching and gaseous volatilization. N losses by leaching were ignored considering that there was no leachate in the basin tray. Thus, N losses here indicated just gaseous N volatilization through ammonium volatilization and denitrification.
N loss rate (%) (NLR) = 100 × Nl/Ni
N use efficiency (%) (NUE) = 100 × (Nup-t − Nup-0)/Ni
N residue rate (%) (NRR) = 100 × (Ns-t − Ns-0)/Ni
where Nup-t and Nup-0 indicated the amounts of plant N uptake (at uprooting) in the N fertilized treatment and the control without any N fertilization, respectively. Ns-t and Ns-0 indicated soil N pool increment in the N fertilized treatment and the control, respectively.
All statistical analyses were performed with Excel 2007 and SPSS 19.0. Two-way ANOVA was performed to test the effects of different fertilizer treatments and greenhouse vegetable soils with different years of cultivation. A least significant difference (LSD) post-hoc test at the significance level of 0.05 was conducted to assess the differences. Figures were made by Origin 8 software. Data in tables and figures were presented as means (n = 3).

3. Results

3.1. Properties of Soils with Different Planting Years

The contents of soil total N, total P, and total K generally increased with the increasing years of greenhouse vegetable cultivation (Table 2), indicating the increasing effect of continuous vegetable cultivation on soil fertility and nutrients accumulation due to the well-known far excessive application of fertilizer in the forms of both organic and inorganic. Soil pH was not significantly influenced by the cultivation years of greenhouse vegetables. Soil EC ranked as 2 years > 18 years > 0 years, and the differences were significant between the soils (p < 0.05).

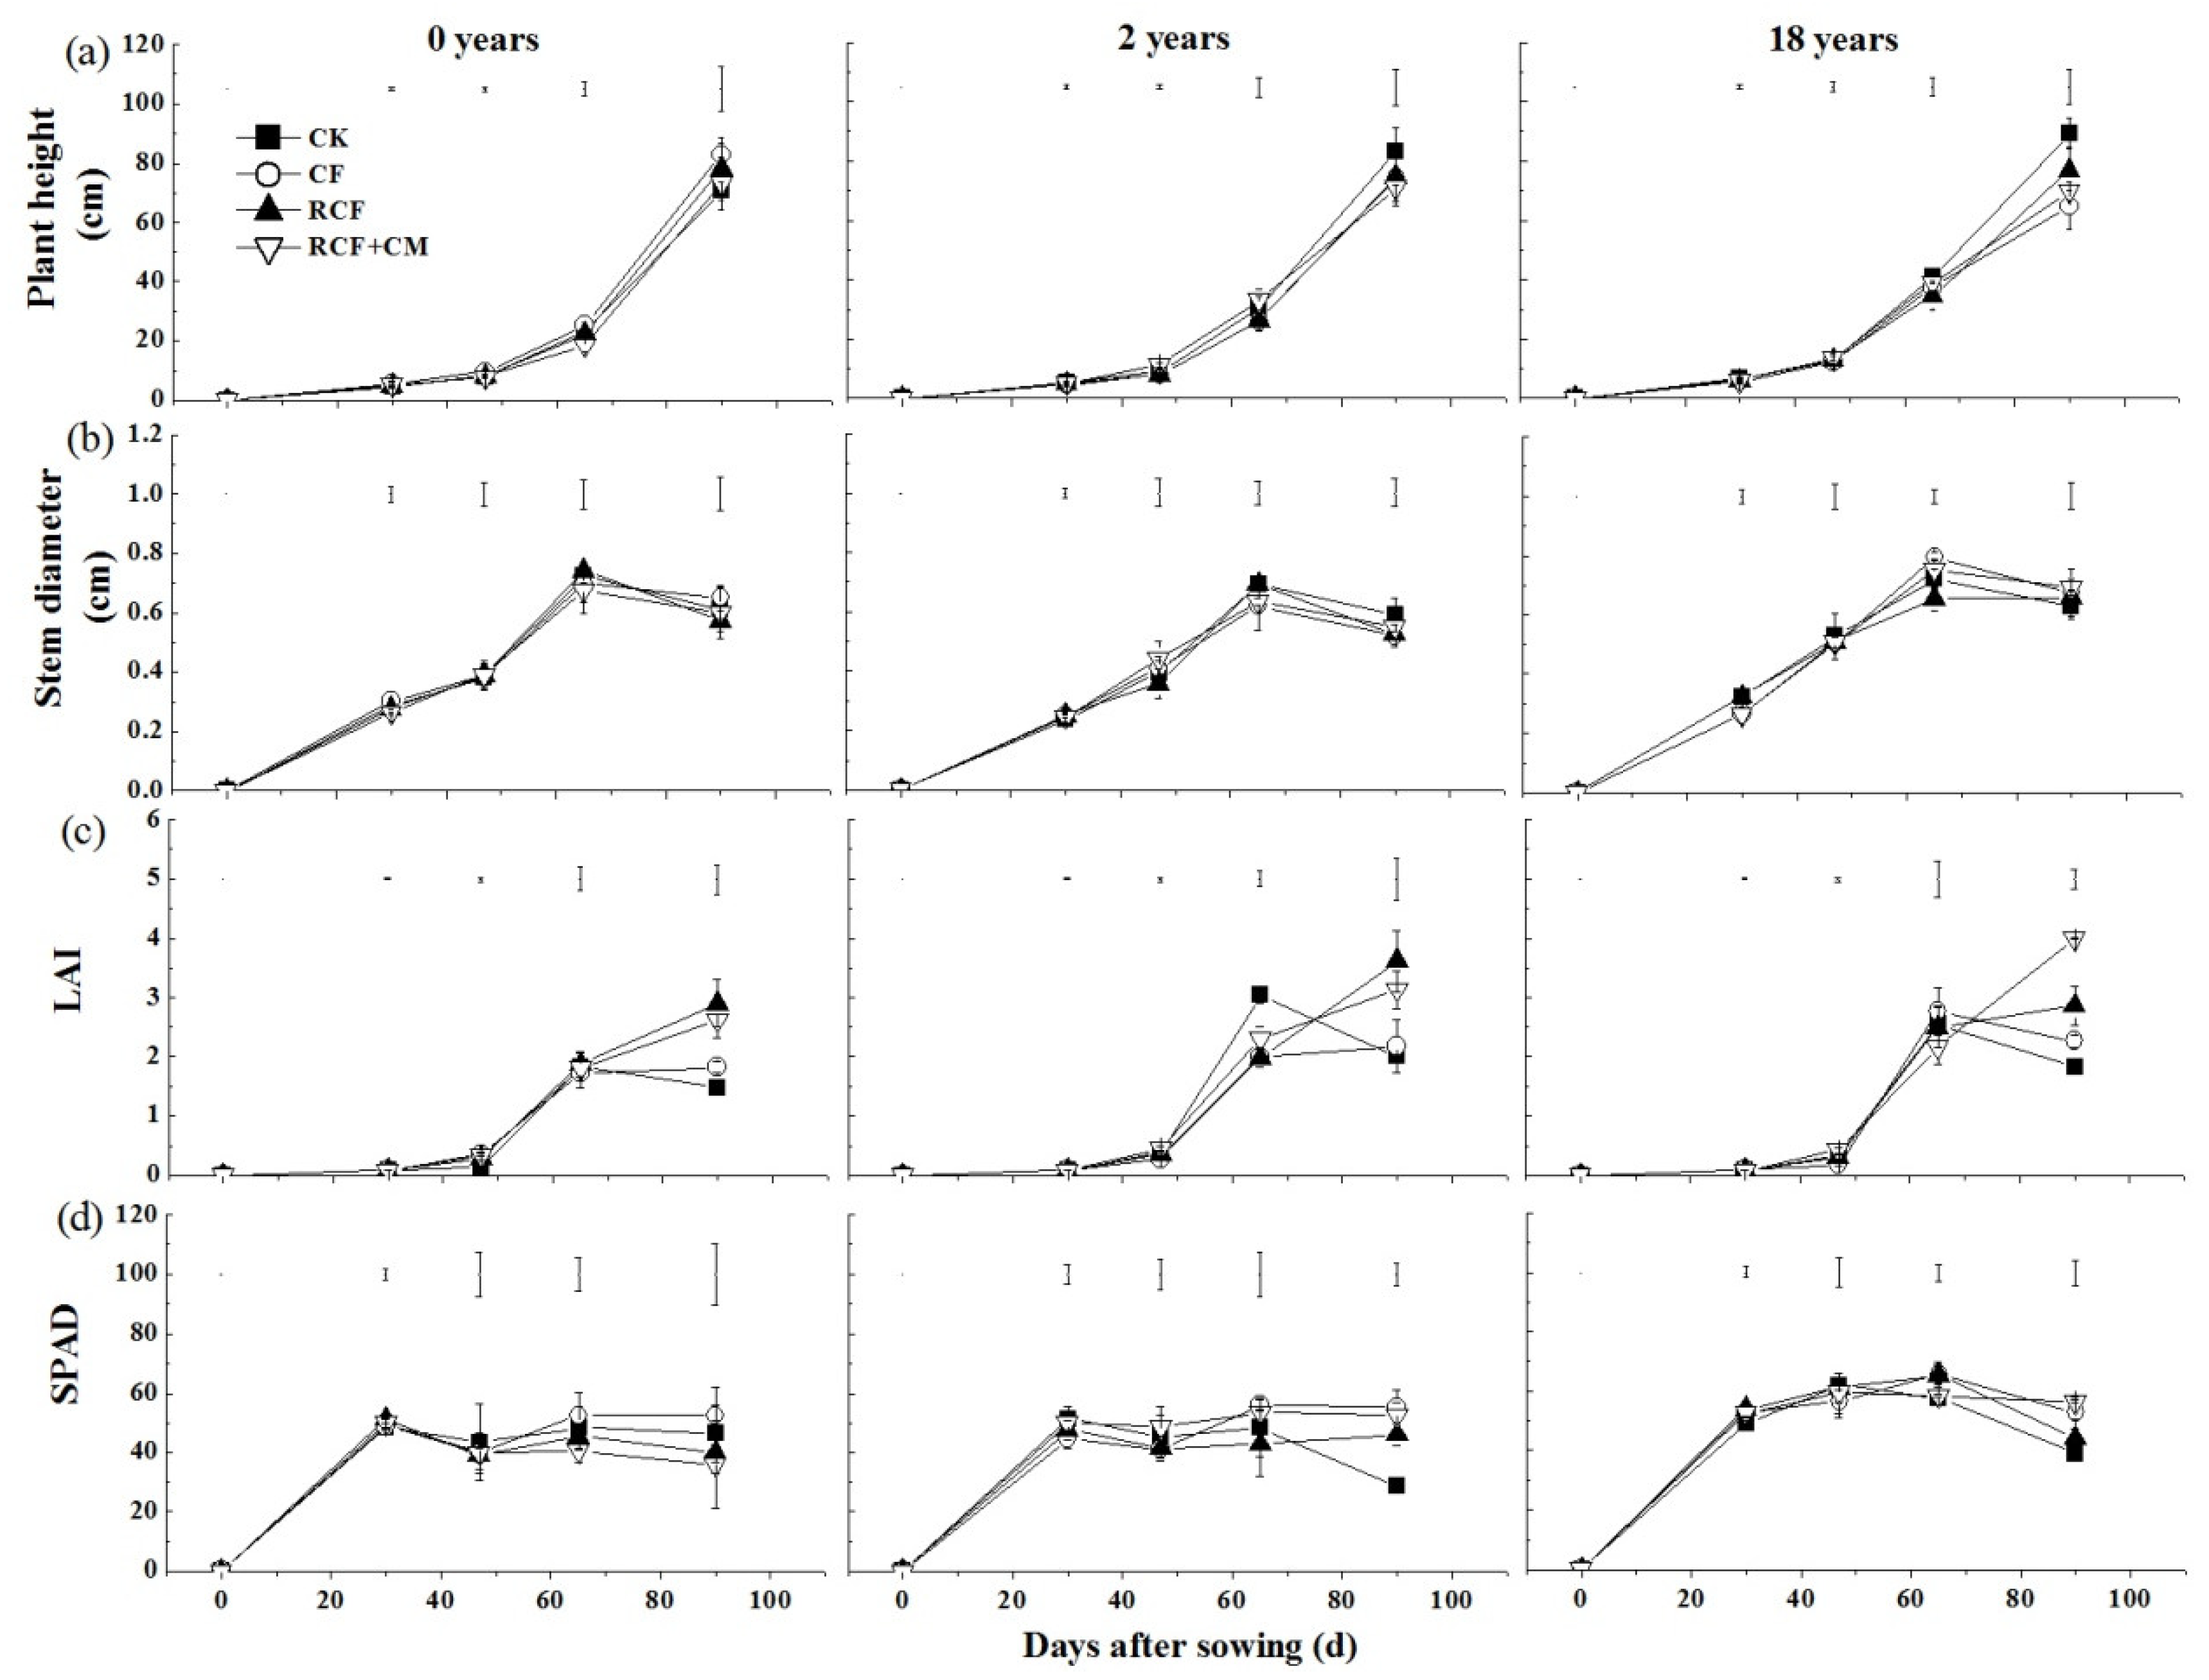
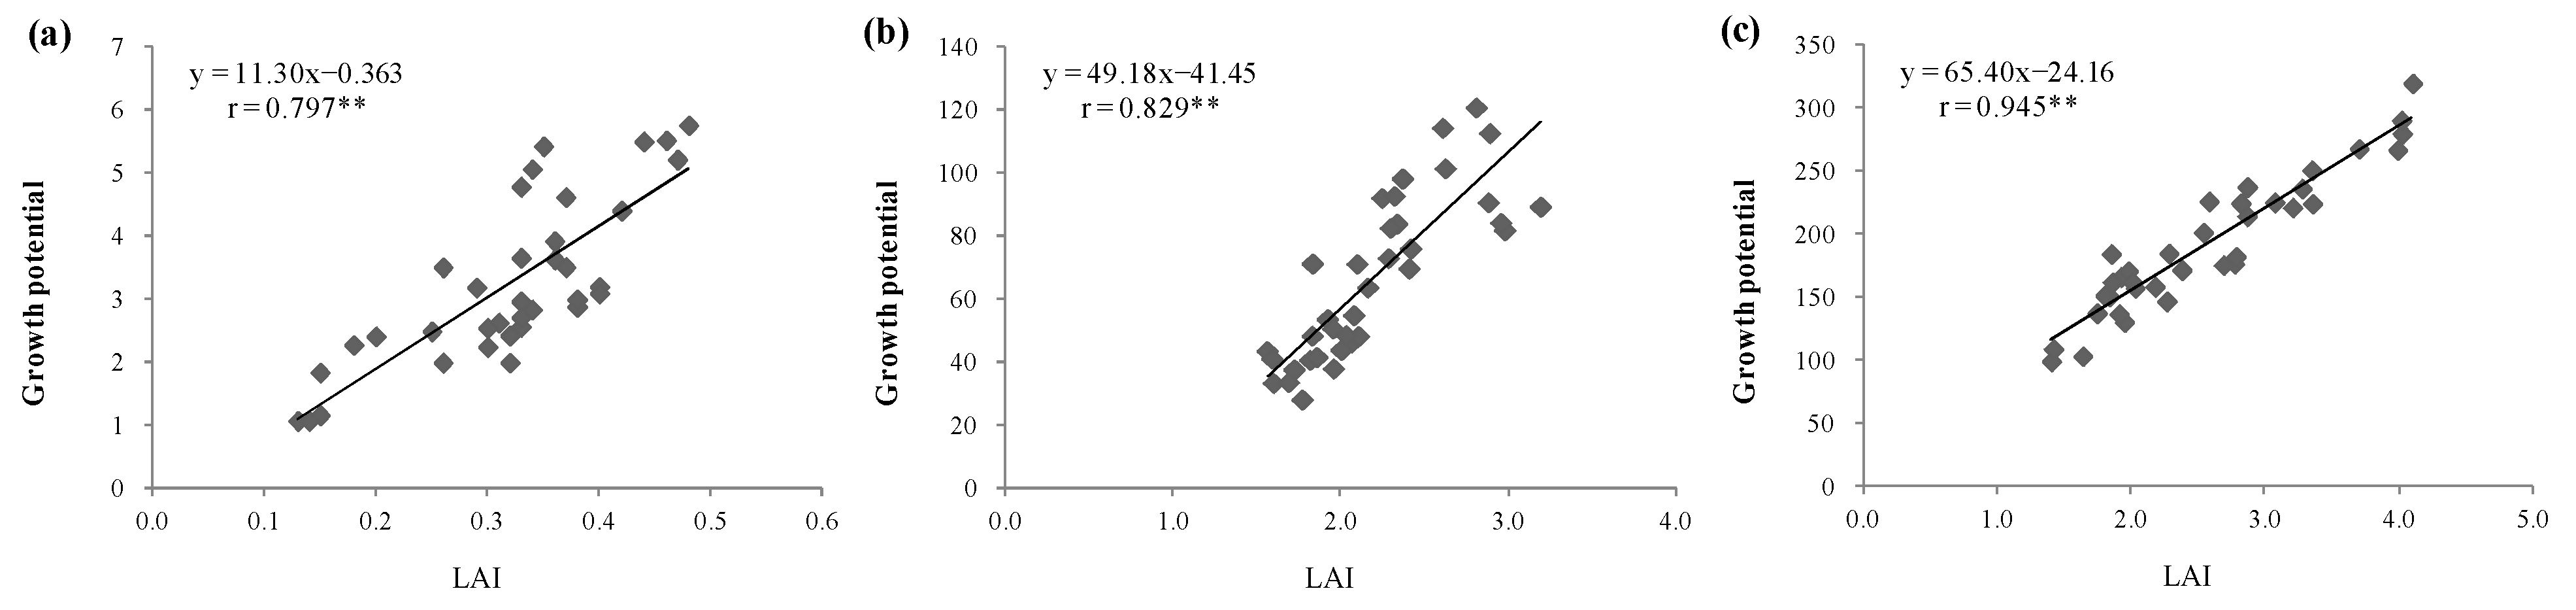
3.2. Response of Plant Growth to Fertilizer Practices in Three Soils

Cucumber plant height and stem diameter increased with increasing growth days and obtained the maximum at 90 and 65 days after sowing, respectively (Figure 2a,b). However, the effects of different fertilizer treatments on plant growth changed with the years of greenhouse vegetable cultivation. In soils with 0 and 2 years of greenhouse vegetable cultivation, the maximum plant height and stem diameter were not significantly different (p > 0.05) between different fertilizer treatments. In soil with 18 years of cultivation, the maximum plant height ranked as CK>RCF>RCF+CM>CF, whereas the maximum stem diameter ranked as CF>RCF+CM>CK>RCF. The differences were significant (p < 0.05) between the CK, CF, and RCF treatments.
At early growth stages (before 47 days), in soil with 0 years of greenhouse vegetable cultivation, leaf area index (LAI) and cucumber growth potential were both significantly increased by N fertilizer application (Figure 2c, Table 3). The promoting effect of N fertilization on cucumber growth potential increased with the increasing N fertilization amount. While in soils with 2 and 18 years of greenhouse vegetable cultivation, LAI and growth potential were significantly decreased by the CF treatment compared with the CK, showing that excessive N fertilization may inhibit early plant growth. Additionally, 90 days after sowing, LAI and growth potential of the CF treatment were significantly lower than that in the RCF and RCF+CM treatments. Correlation analysis in Figure 3 also showed that cucumber growth potential was significantly correlated with LAI at p < 0.01. Compared with those N fertilized treatments, though the CK treatment without any N fertilizer application was able to keep or even promote leaf growth of the cucumber until 65 days after sowing, it was unable to maintain the subsequent LAI, which decreased obviously at 90 days after sowing, especially in soils with 2 and 18 years of cultivation. The result was in accordance with the SPAD value, which decreased the most in the CK treatment after 65 days (Figure 2d).
Compared with CK, the effect of N fertilization on cucumber biomass yield depended on the cultivation years of the soil (Table 4). In soil with 0 years of greenhouse vegetable cultivation, N fertilization significantly promoted the aboveground and total biomass accumulations, which were, in contrast, restrained in soil with 2 years of greenhouse vegetable cultivation. The RCF treatment markedly improved the belowground biomass yield and root–shoot ratio compared with the CK in the two soils above. While in soil with 18 years of cultivation, the amount of biomass accumulation (aboveground, belowground, or total biomass) was not significantly influenced by N fertilization. In all cultivation years, total biomass yields were not significantly different between different N fertilized treatments.
During cucumber growth, the average growth potential of different fertilizer treatments in the same soil increased with the increasing years of greenhouse vegetable cultivation, and the differences were significant between 0 and 18 years. The average aboveground, belowground, and total biomass yield of different fertilizer treatments in the same soil ranked as 2 years > 0 years > 18 years, and the values in the former two soils were significantly higher. Conversely, CV% of different treatments in the same soil generally decreased with the increasing greenhouse cultivation years, showing the weakened influence of fertilization practices on plant growth and biomass yield.

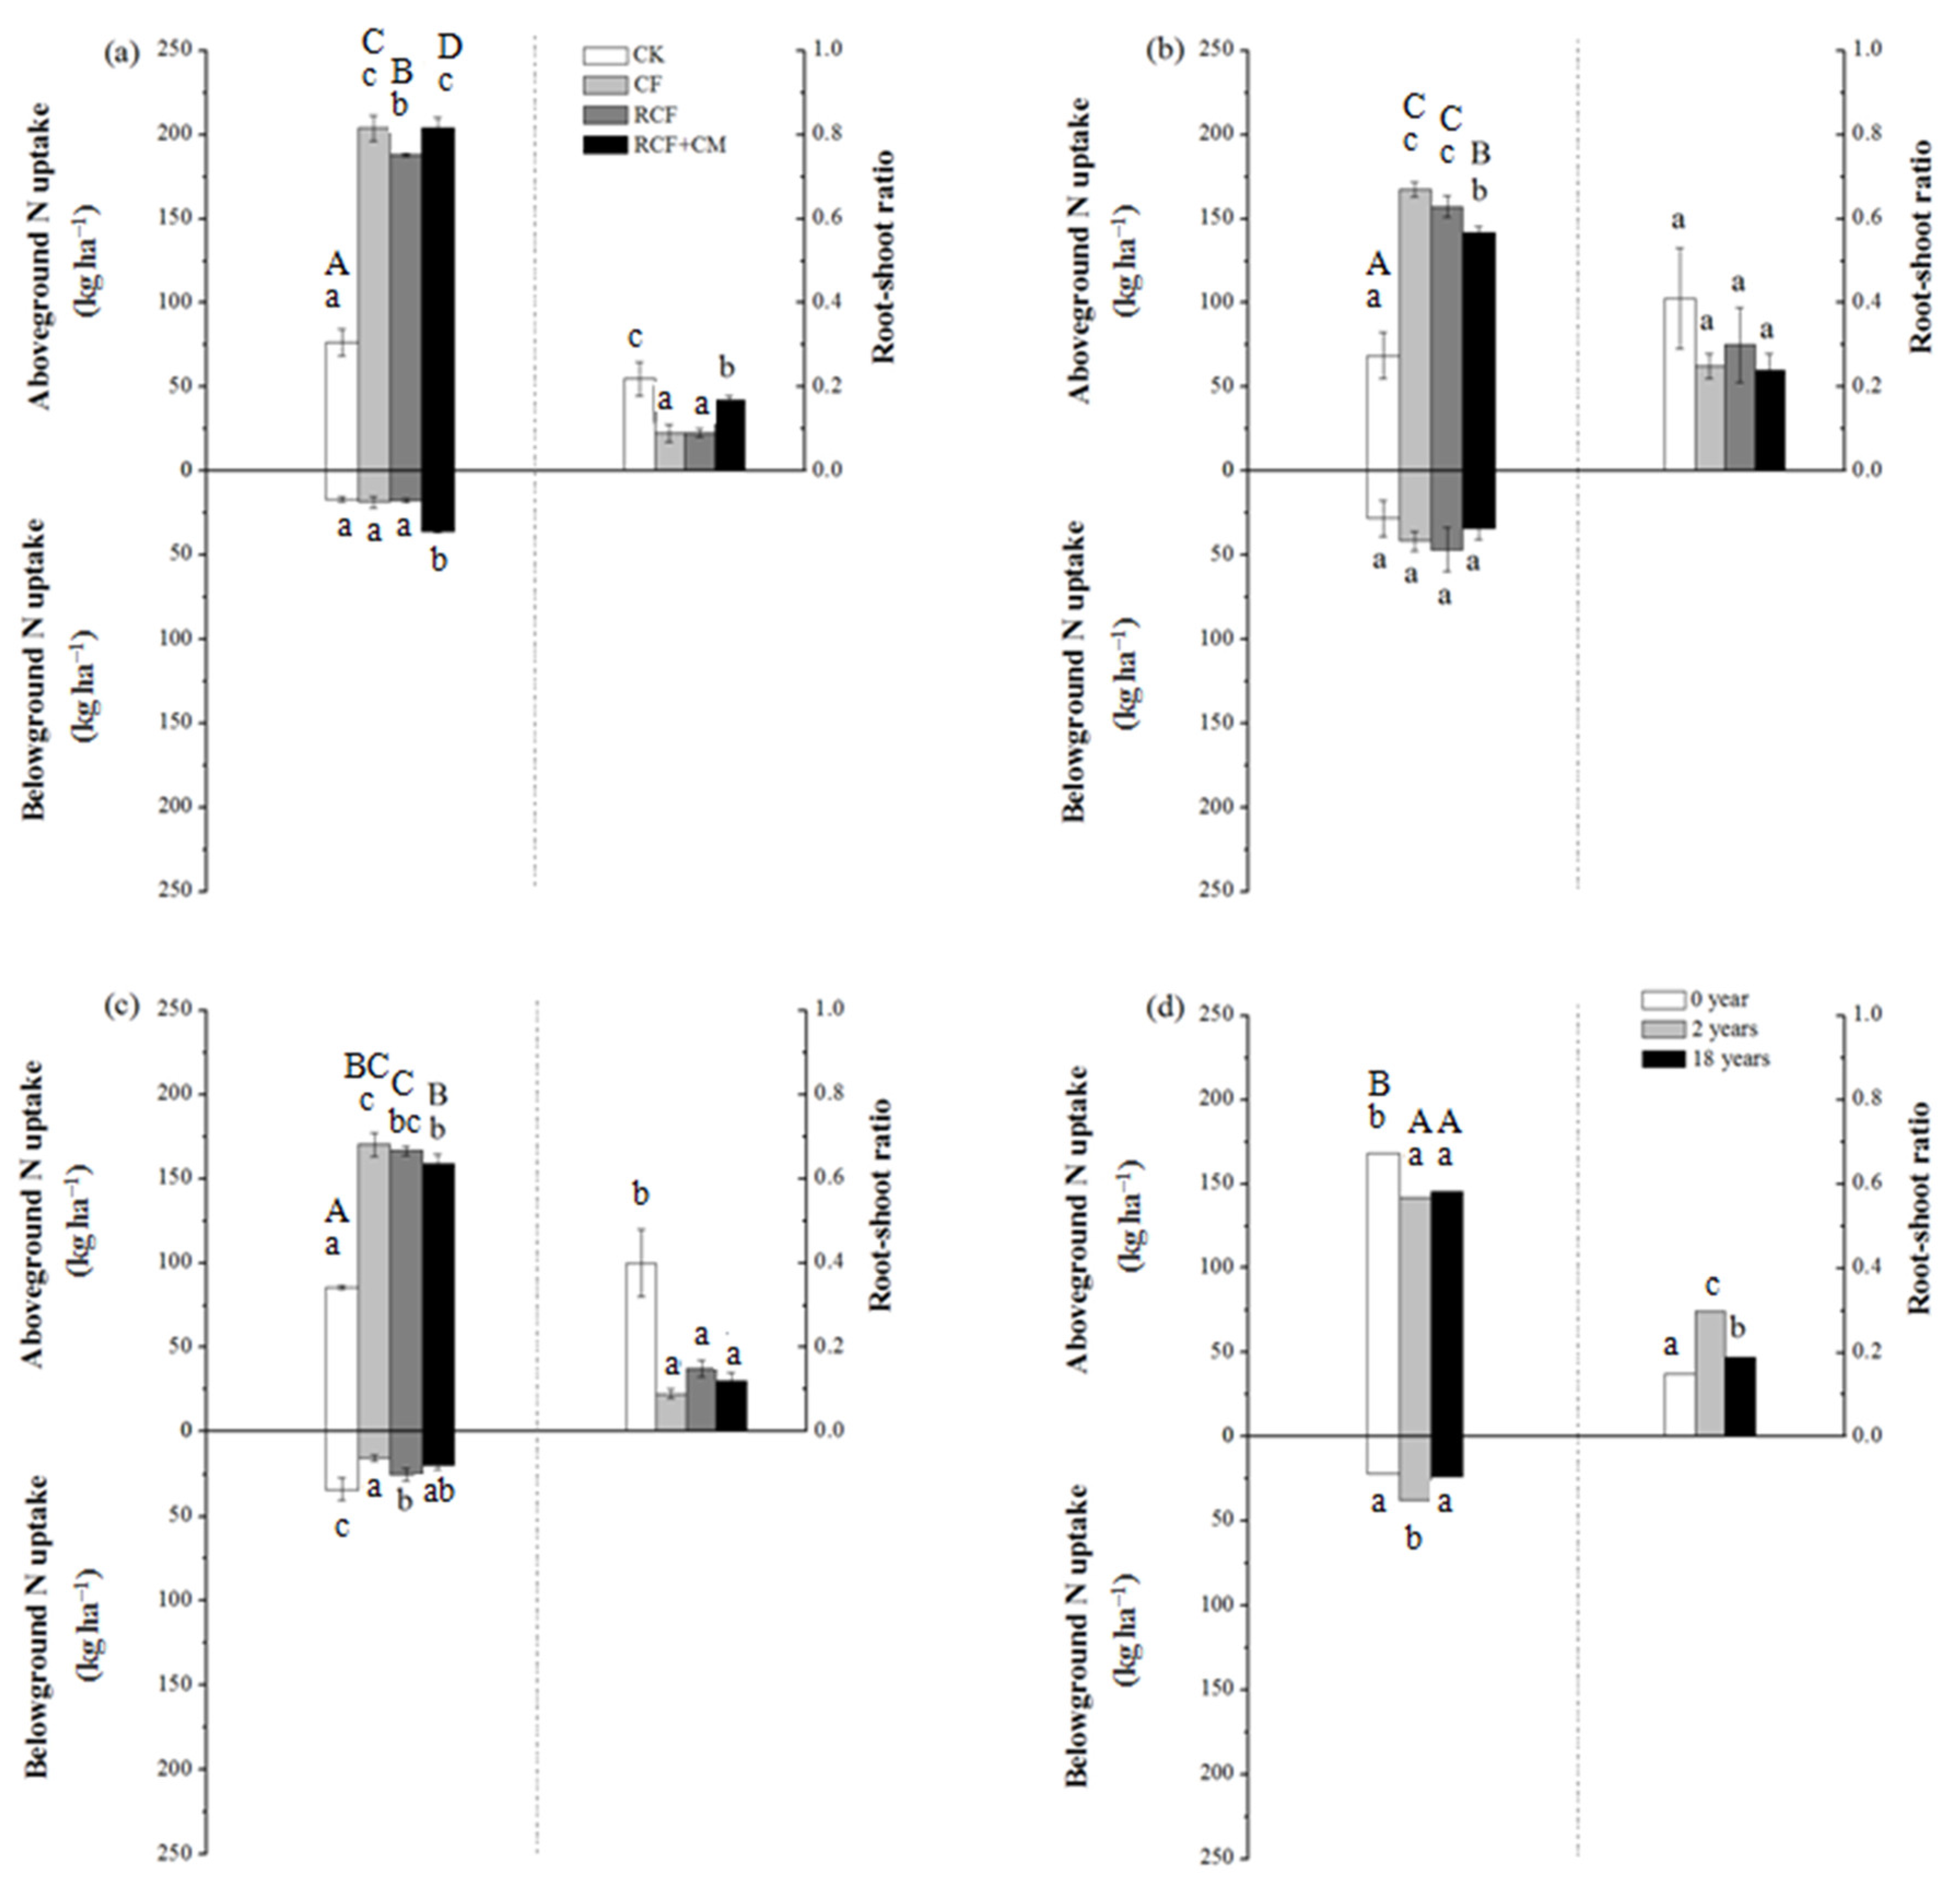
3.3. Response of Plant N Uptake to Fertilizer Practices in Three Soils

In soils with different cultivation years, the amounts of belowground N uptake and the corresponding root–shoot ratio in the CF and RCF treatments were not significantly higher or even lower than that in the CK treatment (Figure 4a–c). Such a result was not in accordance with the belowground biomass yield and root–shoot ratio present in Table 4. The lower N accumulation relative to biomass accumulation of the belowground part in the CF and RCF treatments compared with the CK treatment indicated that part of nitrogen nutrient in the root was transported to aboveground organs. The significantly higher aboveground and total N uptake at uprooting also verified the transformation of N from belowground to aboveground, especially in soil with 2 years of greenhouse vegetable cultivation, where the aboveground and total biomass yield in the CF and RCF treatments was lower than the CK treatment, whereas the aboveground and total N uptake was significantly higher in the former two treatments.
The effect of the RCF+CM treatment depended on the years of greenhouse vegetable cultivation. In soil with 0 years of greenhouse vegetable cultivation (Figure 4a), the RCF+CM treatment promoted the root absorption capacity as well as the transformation to aboveground parts considering the relatively significantly higher belowground, aboveground, and total N uptake, whereas the root–shoot ratio of N uptake was significantly lower compared to the CK treatment. In soil with 2 years of cultivation (Figure 4b), belowground N uptake was not significantly influenced. In soil with 18 years of cultivation (Figure 4c), the transformation of belowground N to aboveground parts was promoted considering the significantly lower belowground N uptake and root–shoot ratio, whereas the aboveground N uptake was higher than the CK treatment.
For the CK treatment, the plant total N uptake ranked as 0 years < 2 years < 18 years. Compared with the CK, plant total N uptake was significantly increased by N fertilizer application. However, the effects changed with the soils. In soil with 0 years of cultivation, plant total N uptake of the CF treatment was significantly higher than the RCF treatment, while in soil with 2 and 18 years of cultivation, there was no significant difference between the two treatments above. Overall, with the increasing years of greenhouse vegetable cultivation, the average plant total N uptake ranked as 0 years > 2 years > 18 years (Figure 4d), and the differences were significant between 0 and 2 or 18 years.

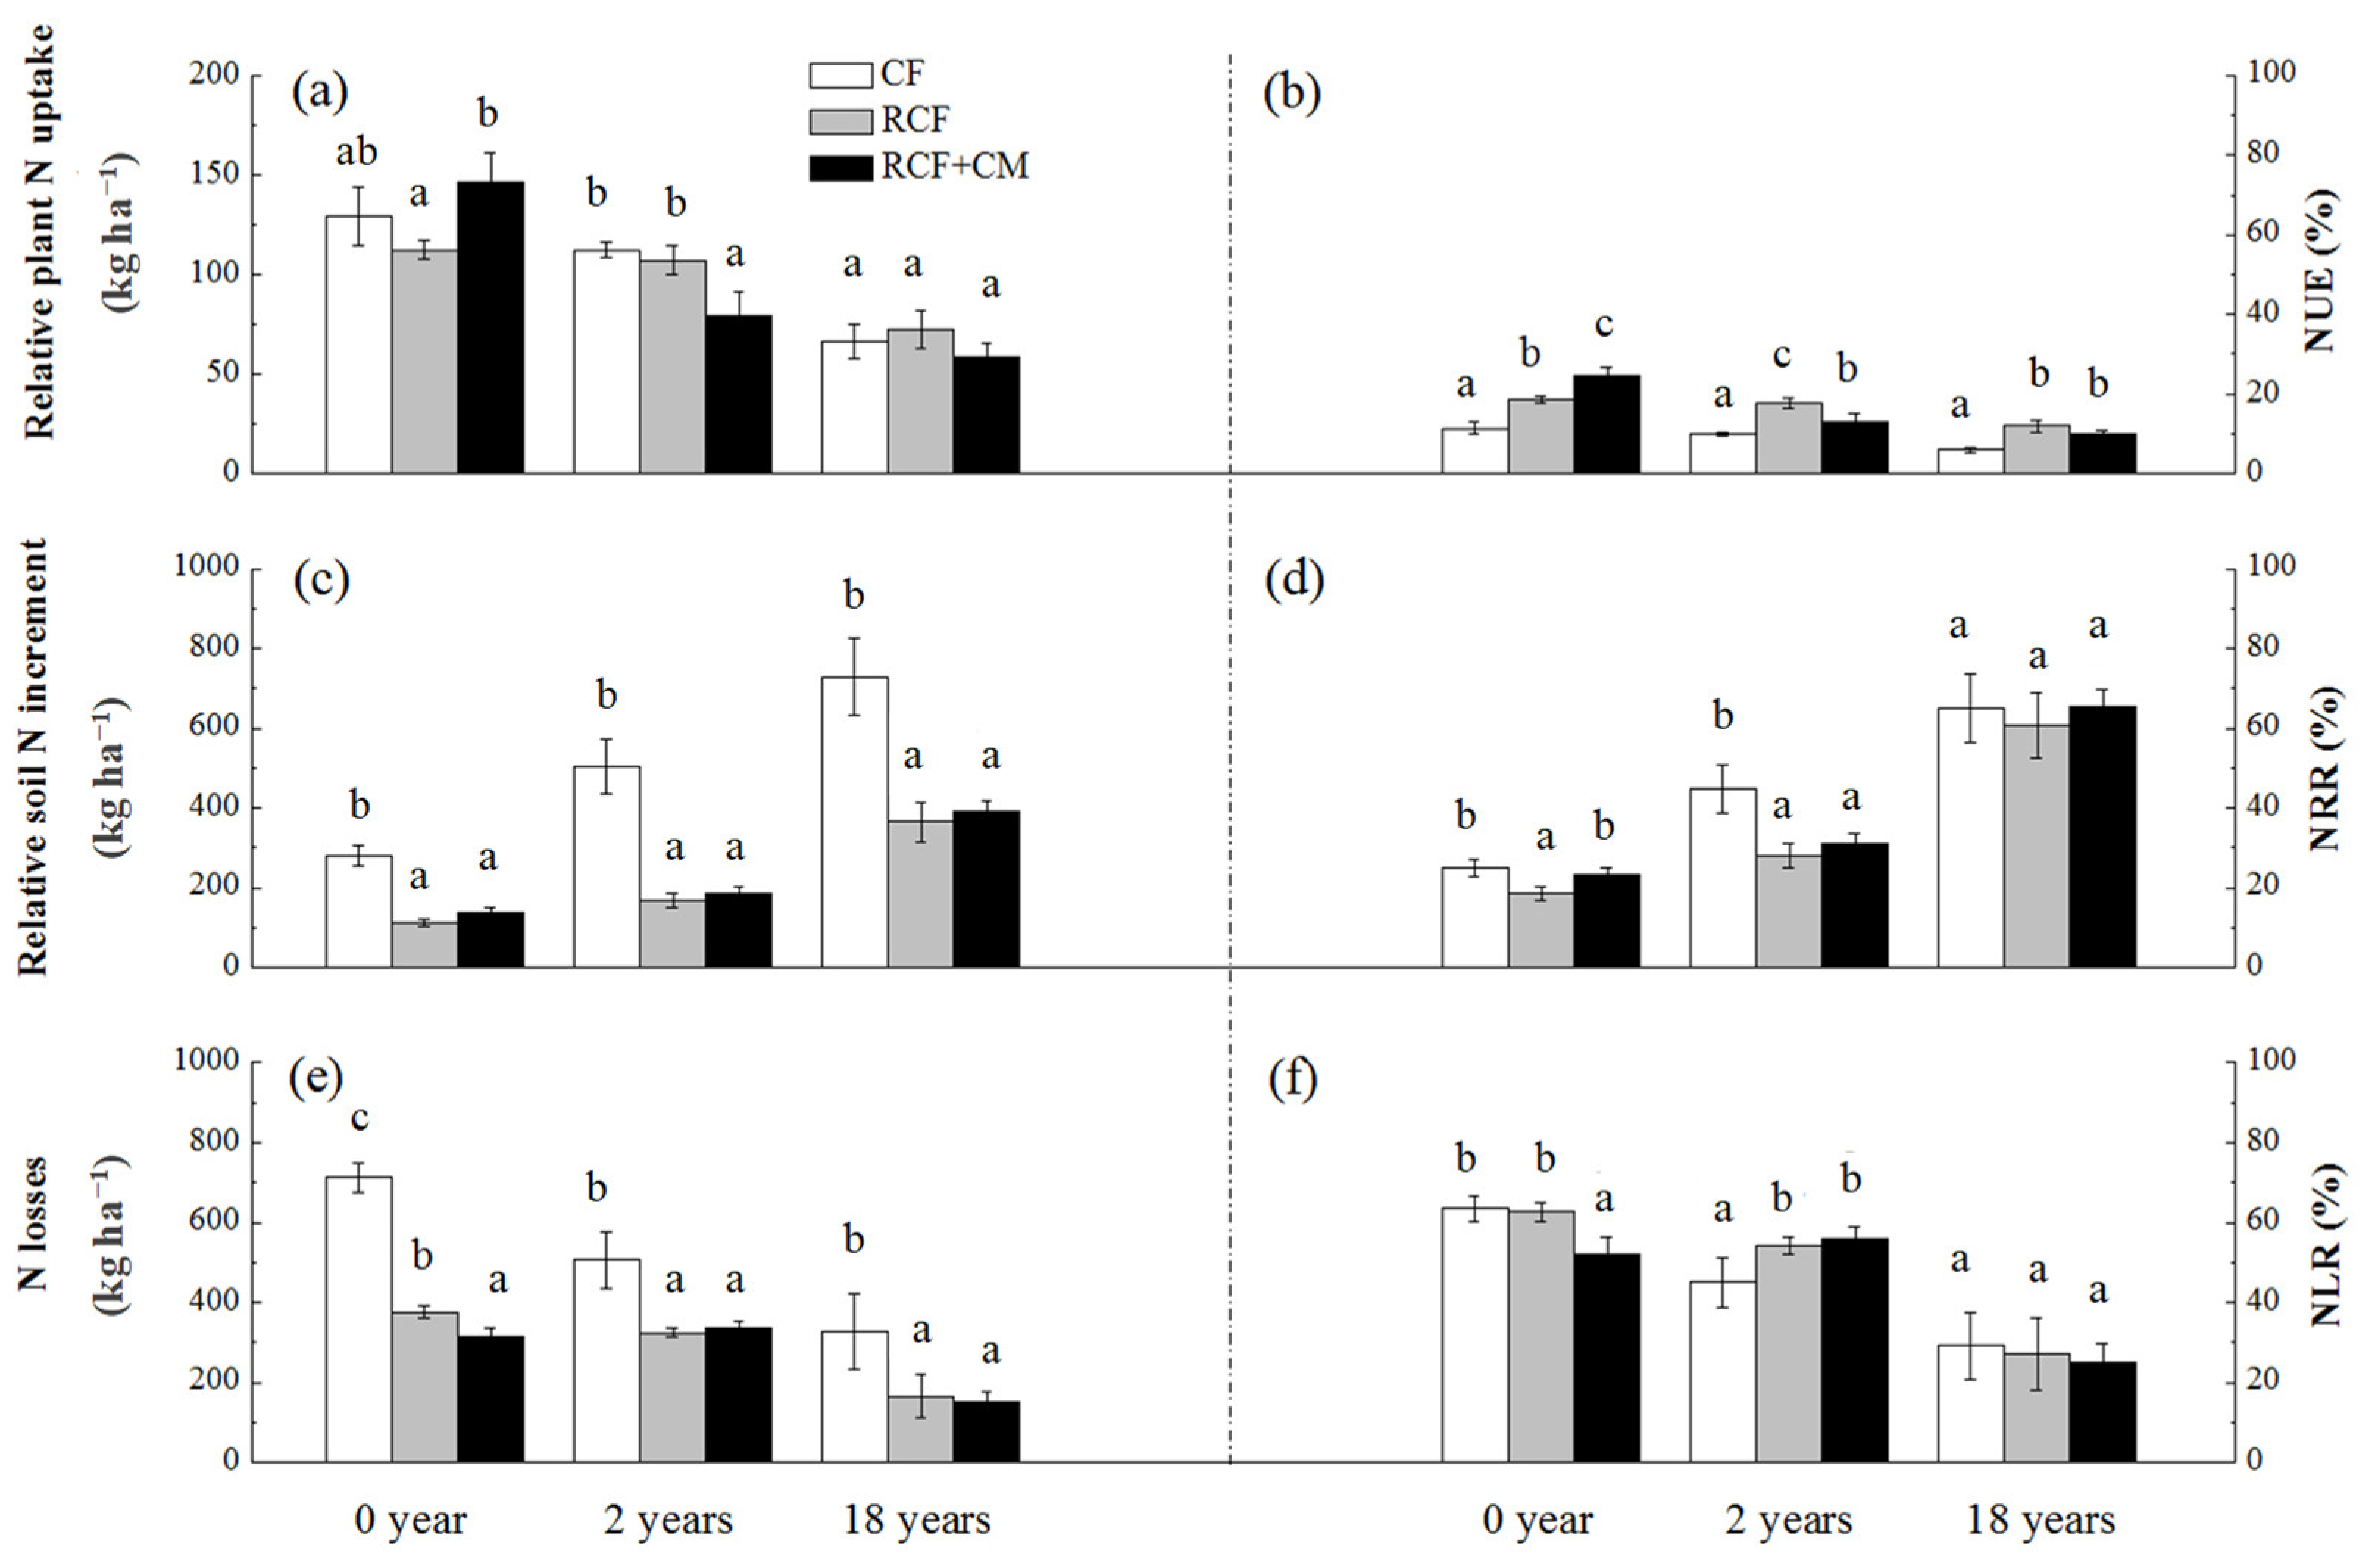
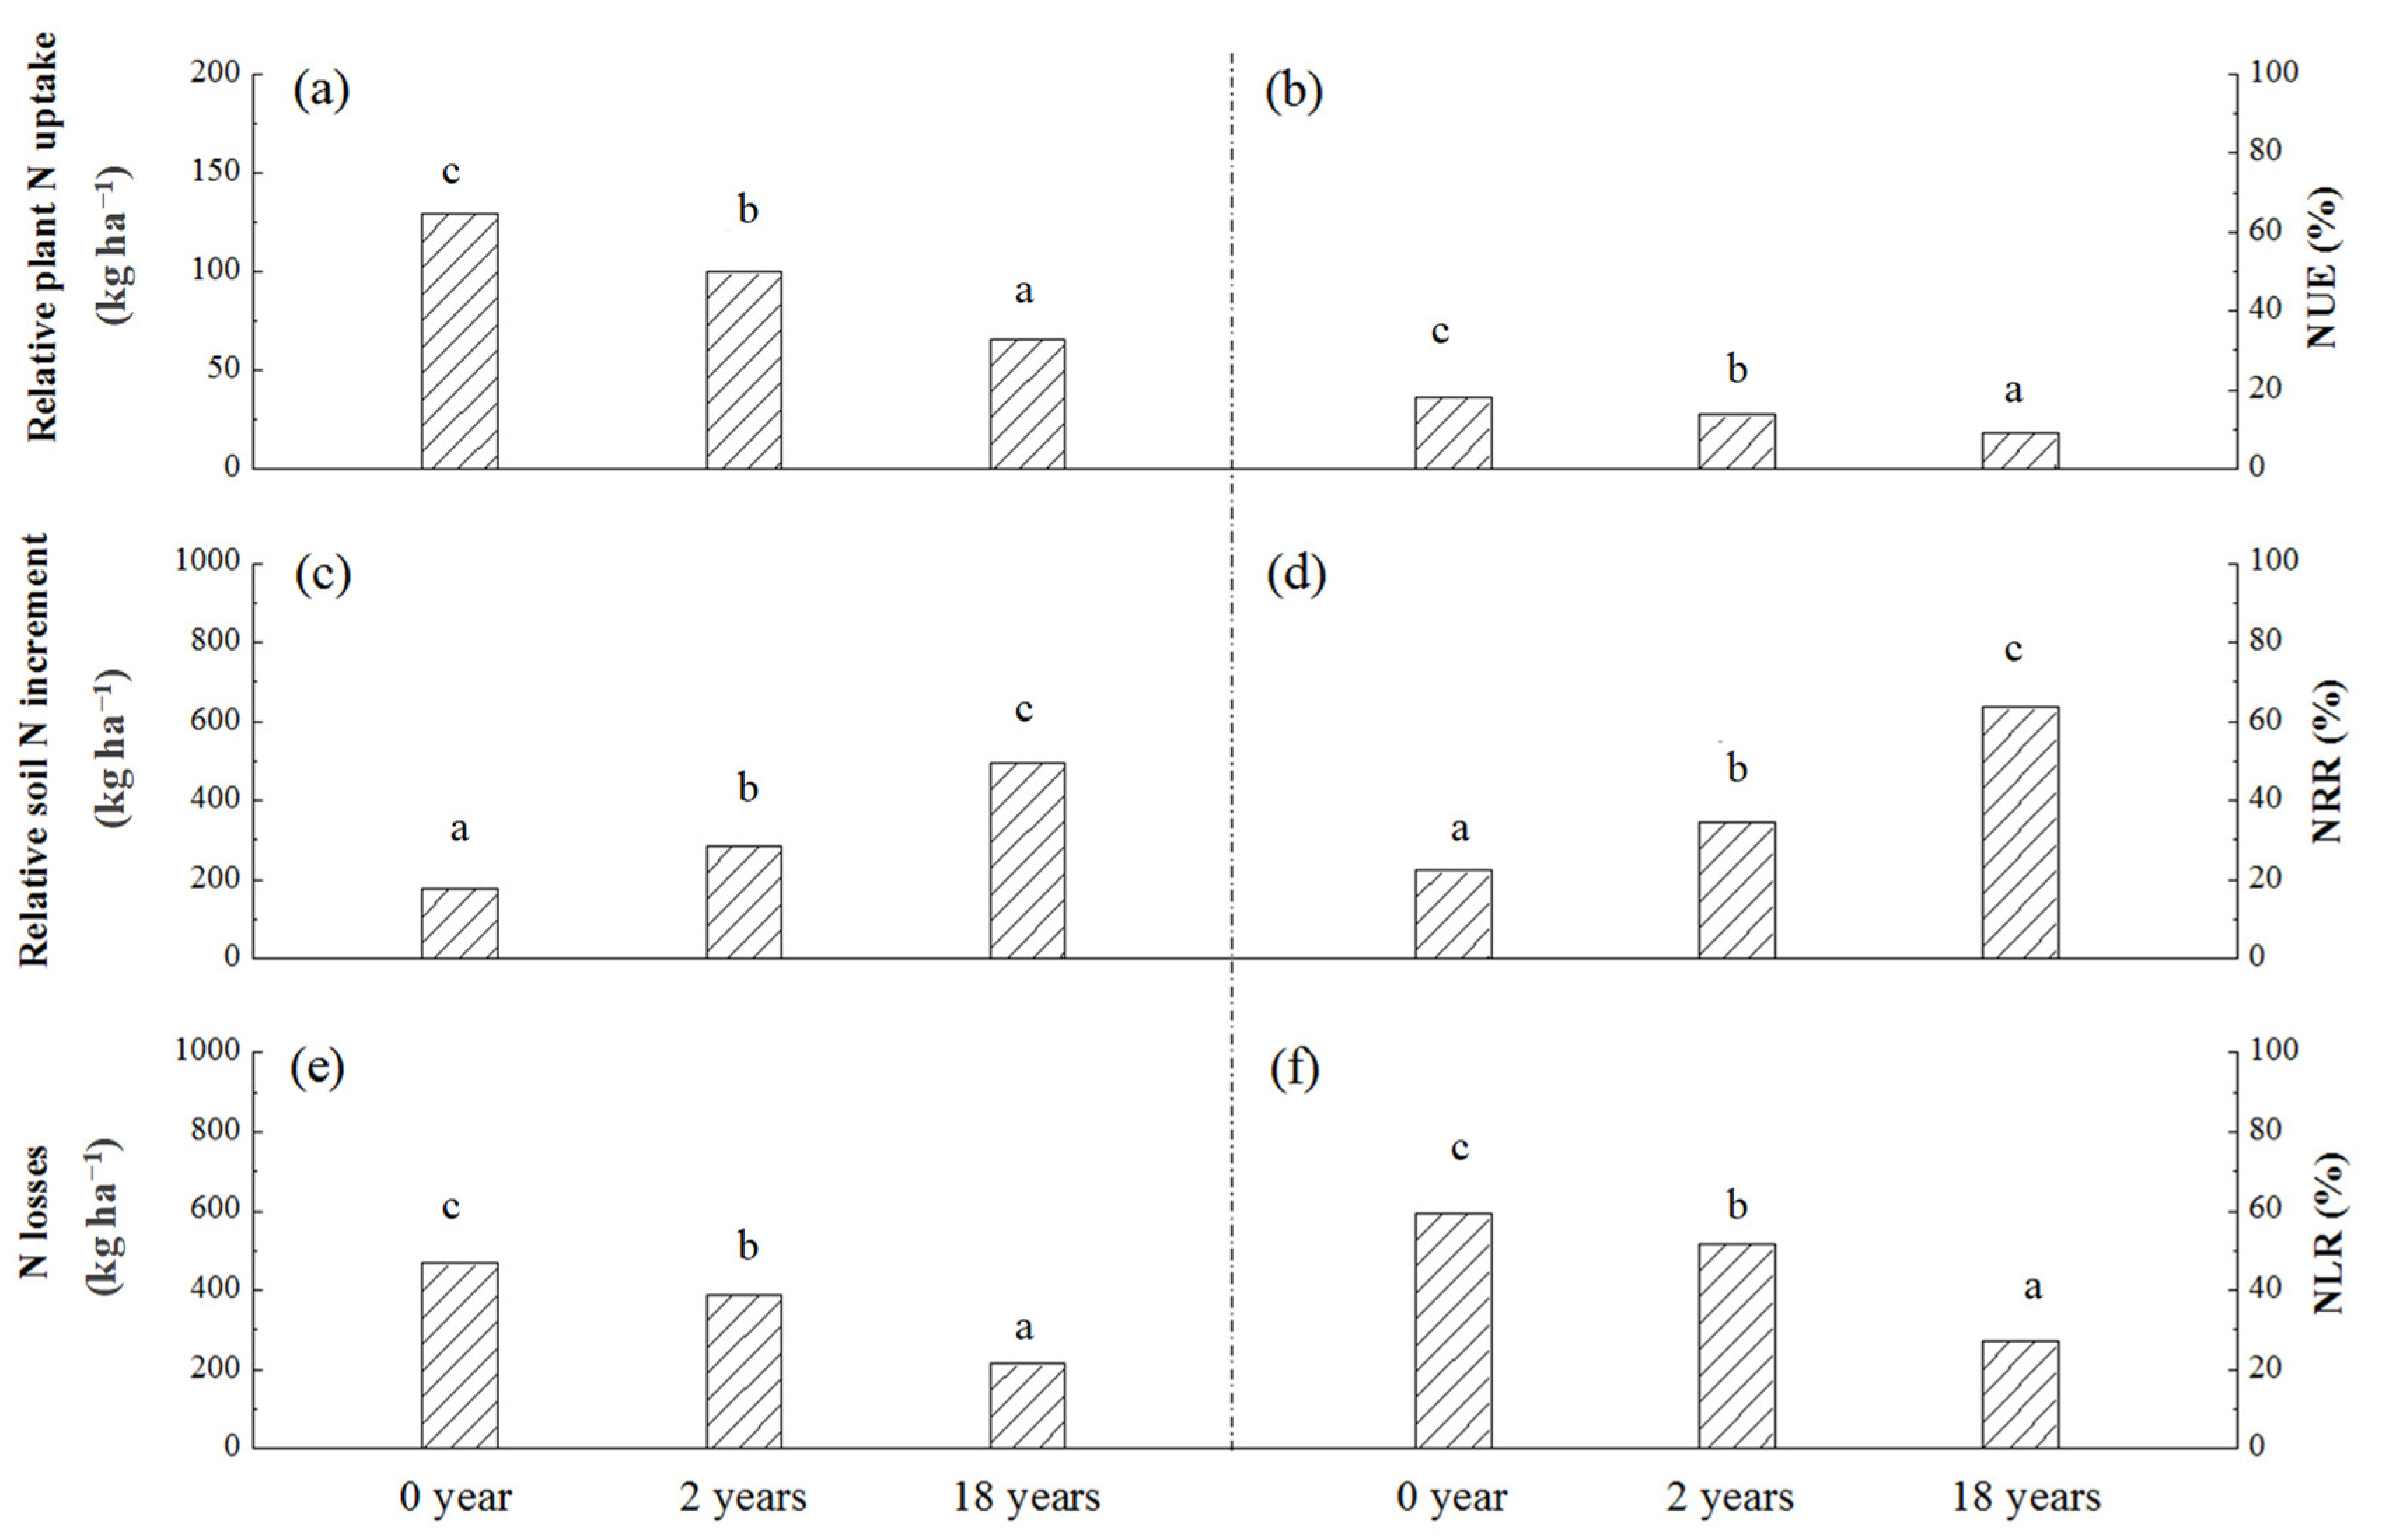
3.4. N Use Efficiency, Residue, and Losses Rate of Different Fertilizer Practices in Three Soils

In all the three soils, there was no significant difference between the CF and RCF treatment in the amount of relative plant N uptake (Figure 5a), whereas the NUE in the CF treatment was significantly lower than that in the RCF treatment (Figure 5b). The amount of residue N in soil and N losses were significantly higher in the CF treatment than in the RCF treatment (Figure 5c,e). In soil with 0 years of greenhouse vegetable cultivation, the RCF+CM treatment performed obviously better than the RCF treatment in increasing the amount of relative plant N uptake, NUE, and NRR, while decreasing the amounts of N losses and NLR (Figure 5a,b,d,f), although the same amount of N was fertilized. However, in soil with 2 or 18 years of greenhouse vegetable cultivation, the promoting effects of the RCF+CM treatment on plant N uptake and NUE disappeared.
Overall, with the increasing years of greenhouse vegetable cultivation, both average relative plant N uptake and average NUE of different fertilizer treatments in the same soil decreased markedly (Figure 6a,b). Unexpectedly, the significantly lower use efficiency of fertilizer N in soil with longer years of greenhouse vegetable cultivation did not result in greater N losses and NLR. Both the amounts of average N losses and average NLR decreased markedly (Figure 6e,f). Moreover, with the increasing years of greenhouse vegetable cultivation, the average relative soil N increment and average NRR increased significantly (Figure 6c,d).

4. Discussion

4.1. Cucumber Plant Growth

In soils with different cultivation years, compared with those N fertilized treatments, though the CK treatment was able to keep or even promote cucumber leaf growth until 65 days after sowing, it was unable to maintain the subsequent LAI (Figure 2c). The value decreased obviously from 65 days till 90 days, especially in soils with 2 and 18 years of greenhouse vegetable cultivation. Similarly, the SPAD value in the CK treatment also decreased the most after 65 days (Figure 2d). This suggested that the original N in the soil may not be sufficient to maintain leaf growth and chlorophyll synthesis at later growth stages, even in the soil with 18 years of greenhouse vegetable cultivation, where the N supply was greatest among the three soils (Table 2). Similarly, Ullah et al. [20] reported that all growth parameters of vegetable plants significantly decreased with the decreased N fertilizer application, indicating the deficit in soil N supply for plant growth in vegetable fields. A further result from multivariate analyses also showed that compared with CK, N fertilizer application would be a better choice to improve cucumber growth and productivity under facility cultivation conditions [42]. Hence, it is necessary to replenish soil N supply by topdressing at a later growing stage, despite the widely reported N accumulations with the increasing years of greenhouse vegetable cultivation [16,43,44]. Additionally, it has been reported that the N transfer from root to aboveground can be promoted by N application [45]. The transformation may partly cover the brief shortage in soil N supply and help to guarantee the N requirement for aboveground plant growth and chlorophyll synthesis. The conclusion was verified by our research (Table 4, Figure 4). Furthermore, plant growth can be interfered with by a high value of EC [46]. The value was 4.32 and 3.61 times higher in soil with 2 and 18 years of greenhouse vegetable cultivation (107 mS m−1 and 89.0 mS m−1, respectively) than in soil with 0 years of cultivation. Na+ was highly related to the inhibition effect. When the exchangeable sodium percentage was greater than 15, plant growth would be limited [47,48]. This may partly explain the progressively weaker plant growth at later stages of CK treatment, especially in soil with 2 and 18 years of cultivation. Furthermore, soil acidification due to the long-term intensive fertilization can promote soil organic carbon accumulations [49], which provided an adequate carbon source for microbial growth. Subsequently, the microorganisms would compete with the plant for N nutrient [50]. This may cause limited soil N supply for crop demand and thus negatively influence crop growth.
However, the results of Zhu et al. [27] and Zhao et al. [51] showed that the treatment with no N fertilized can achieve a satisfactory biomass and fruit yield comparable to that in those N fertilized treatments due to the abundant residual N in soil. These differing results may be due to the soil fertility status, crop species, and historical fertilization [18,52,53]. Therefore, to guarantee normal plant growth, which was considered a prerequisite for high yield and plant N uptake, priority should be given to soil N supply potential before determining N fertilization amount.
LAI and growth potential changed differently for the CK treatment depending on the soils. In soil with higher original N content (2 years and 18 years), the treatment with excessive N fertilization inhibited leaf growth at the early growing stage (Figure 2c) and accelerated leaf senescence at the later stage (Table 3). This result was consistent with previous research [54,55]. Nevertheless, in soil with relatively lower original N content, such as the soil with 0 years of greenhouse vegetable cultivation, the CF treatment promoted leaf growth and obtained higher growth potential at the early growing stage in contrast to other treatments. The promoting effect of N fertilization on plant growth at early growing stage weakened with decreasing N application rate. Such results showed that in soil with lower original N content, sufficient exogenous N application was able and also necessary to promote better growth performance at the early growth stage [56] because fertilization can reduce the negative influence of N deficiency stress on cucumber growth [57], whereas in soil with higher original residue N, exogenous N supply should be controlled for fear of the restrained plant growth associated with the physiological disorders in plants [58].
In all the three soils, the aboveground and total biomass yields of cucumber were not significantly different among the CF, RCF, and RCF+CM treatments. This again confirmed that excessive N fertilizer application was unnecessary, considering that the same amount of biomass yield was achieved in reduced fertilizer treatments. Additionally, reduced chemical fertilizer was reported to help mitigate obstacles in the continuous vegetable growing systems due to the boost of the pseudomonas group, which acts as the defender against possible fungal pathogens [59]. Furthermore, in soil with 0 years of greenhouse vegetable cultivation, compared with the CF treatment, reduced fertilization played a positive role in promoting root growth (Table 4). A well-grown and large root system was considered to be beneficial in increasing microbial nutrient mobilization capacity due to the root exudates [60] and was regarded as a foundation for aboveground growth and biomass accumulations.

4.2. N Uptake, Residue, and Losses

In all the three soils, plant total N uptake was significantly increased by N application compared with the CK (Figure 4). Such result has been widely reported [61,62]. However, the effect may vary among different fertilizer treatments. It is generally agreed that plant uptake of fertilizer N increases with the increasing fertilization rate [63]. Nevertheless, this study showed that the result changed with differing soils. In soil with 0 years of greenhouse vegetable cultivation, plant total N uptake was significantly higher in the CF treatment than in the RCF treatment (Figure 4), whereas in soil with 2 or 18 years of greenhouse vegetable cultivation, plant total N uptake was not significantly different between the two treatments. This finding indicated that in soil with higher original N content, reduced chemical N fertilizer application was enough to achieve the same plant N uptake comparable to that of the excessive N fertilization, which inevitably significantly enhanced the amount of residue N in soil and N losses (Figure 5c). Residual N in soil may be further lost under environmental conditions such as continued flooding and excessive fertilization. In our research, significantly more amounts of N losses were found in the CF treatment (328 kg ha−1 ~ 713 kg ha−1) than in the reduced fertilizer treatments (149 kg ha−1 ~ 376 kg ha−1) (Figure 5e). The decreased NUE with the increased amount of N fertilization whatever the soil (Figure 5b) has been widely reported [63,64]. That is why reduced N fertilization should be strongly advocated in agricultural production to increase farmers’ income and to reduce environmental risks associated with N, especially in intensively fertilized vegetable fields [21]. In fact, the real NUE may be lower than those present in Figure 5, considering that more soil-derived N was absorbed by the plant in fertilized treatment than in the CK treatment due to the priming effect of exogenous N additions on soil organic N mineralization [65]. Nevertheless, the priming effect was not considered in our calculations. The application of 15N labeled fertilizer was favored in future research to eliminate the disturbance from soil N and clarify the specific absorption of fertilizer-derived N [66].
Although the same amount of N was applied, the RCF+CM treatment performed better than the RCF treatment in increasing soil N pool storage (Figure 5c,d) and decreasing N losses (Figure 5e,f). The effect was most apparent in soil with 0 years of greenhouse vegetable cultivation, where both plant N uptake and NUE were also significantly increased by the RCF+CM treatment. On the one hand, this was due to the increased microbial immobilization of fertilizer N. Soil microbial growth and metabolism can be accelerated by organic material additions. If the decomposable N sources in organic materials were relatively low, microorganisms would immobilize those N nutrients in soil [22,67]. The increased immobilization also plays a positive role in reducing N losses [23,68]. On the other hand, the result may be related to the higher residue rate of manure-derived N in soil, because organic materials are a slower-release N source [69].
The effects of fertilizer treatments on N uptake, storage, and losses changed with soil status. It has been reported that compared with soil that received no or only chemical fertilizer, soil with higher fertility due to the long-lasting application of organic amendments together with chemical fertilizer performed much better in soil N retention and supply as well as in increasing N use efficiency [30,31]. In our research, with the increasing years of vegetable cultivation, plant total N uptake (aboveground and belowground) in the CK treatment was 93.0 kg ha−1, 96.7 kg ha−1, and 120 kg ha−1, respectively (Figure 4). Additionally, the average growth potential increased with the increasing years of greenhouse cultivation (Table 3). Both verified that in greenhouse vegetable fields with longer years of abundant organic and chemical fertilizer applications, the soil itself functioned much better in supply. Microbial immobilization-remineralization also played an important role in the retention and supply of fertilizer N. The promoted microbial growth and activity due to the long-lasting organic material application guaranteed the predominance of the microbial related pathway on N retention and supply [29,70]. It should be noted that this kind of high soil microbial activity and N retention caused by long-lasting organic material application is difficult to be improved persistently when the same organic material is reapplied. Therefore, in soil with longer years of greenhouse vegetable cultivation, the favored role of organic manure addition in N retention and supply disappeared. This was consistent with our previous study, where the role of microbial immobilization on fertilizer N retention was less promoted by organic material addition in higher fertility soil (with 25-years of combined application of manure and NPK fertilizers) [30]. Accordingly, an indirect soil fertility management that aims at “feeding the soil instead of the plant” would help in increasing fertilizer N use efficiency and decreasing the risks of N losses [12], whereas in soil with 0 years of greenhouse vegetable cultivation, the role of microbial immobilization-remineralization on N retention and supply was supposed to be relatively weaker considering that little organic manure was applied in farmland fertilization history. As a result, soil N retention relied much more on the microbial immobilization promoted by the newly added organic manure. All this confirms that organic material application is a positive practice in increasing N retention and N supply, possibly in the long or short term [71,72,73].
Overall, with the increasing years of greenhouse vegetable cultivation, both average relative plant N uptake and average NUE decreased markedly (Figure 6a,b). The result was consistent with that of Joris et al. [34], who found that long-term fertilization reduced the uptake of N from fertilizer and increased the uptake of N from the soil. Similarly, Van et al. [33] found that the sufficient plant-available original N in soil over the growing season would result in limited yield response to fertilized N. This means that in soil with a higher capacity for N supply, the contribution of exogenous N to plant N uptake was not as much as that in soil with lower capacity for N supply, because plant growth depended more on the soil-derived N. This result also confirmed the fact that the NUE present in our research was higher than the real value due to the interference of soil-derived N. The gap between them might increase with the increasing years of greenhouse vegetable cultivation. Surprisingly, the significantly lower NUE in soil with longer years of greenhouse vegetable cultivation did not result in a higher amount of N losses and NLR, which on the contrary decreased markedly with the increasing years (Figure 6e,f). This was mainly due to the improved function of soil in fertilizer N storage with the increasing years of organic manure application. Therefore, in greenhouse vegetable fields with higher fertilities, high N application is still not advocated considering the lower fertilizer-N use efficiency, although it functioned well in expanding soil N storage.

5. Conclusions

The original N in soil was insufficient to maintain cucumber leaf growth and chlorophyll synthesis at later growth stages, even in the soil with 18 years of greenhouse vegetable cultivation. The CF treatment with excessive N fertilization inhibited leaf growth at the early growing stage and accelerated leaf senescence later, especially in soil with 2 and 18 years of greenhouse vegetable cultivation. Therefore, reduced N fertilization instead of no or excessive N fertilization is a better choice to improve plant growth and productivity in greenhouse cultivations with different planting years. Though equivalent N was applied, the RCF+CM treatment performed better than the RCF treatment in increasing NUE and NRR while decreasing NLR in the 0-year soil. However, in the 2- or 18-year soil, the soil itself functions much better in exogenous N retention and supply, with the gap between the RCF and the RCF+CM treatments reduced or even having disappeared. Hence, the co-application of organic material with chemical fertilizer based on reduced fertilization is a positive practice in increasing N retention and N supply, especially for fields lacking a history of organic material application or newly built facilities.

Author Contributions

Conceptualization, F.P.; data curation, F.P. and S.P.; investigation, J.Y.; methodology, F.P., H.Z. and B.C.; resources, F.P. and J.T. All authors have read and agreed to the published version of the manuscript.

Funding

This work was supported by the Doctoral Research Start-up Fees from Henan Institute of Science and Technology (207010618002); the Key Research and Extension Projects of Henan Province (202102110065).

Institutional Review Board Statement

The study did not involve humans or animals.

Data Availability Statement

Data are contained within the article.

Acknowledgments

Thanks to all authors for their efforts.

Conflicts of Interest

The authors declare that the research was conducted in the absence of any commercial or financial relationships that could be construed as a potential conflict of interest.

References

  1. Hu, W.; Zhang, Y.; Huang, B.; Teng, Y. Soil environmental quality in greenhouse vegetable production systems in eastern China: Current status and management strategies. Chemosphere 2017, 170, 183–195. [Google Scholar] [CrossRef] [PubMed]
  2. Zhao, H.; Zhai, X.; Guo, L.; Yang, Y.; Li, J.; Ren, C.; Wang, K.; Liu, X.; Zhan, R.; Wang, K. Comparing protected cucumber and field cucumber production systems in China based on emergy analysis. J. Clean. Prod. 2019, 236, 11723648. [Google Scholar] [CrossRef]
  3. Miao, Y.; Stewart, B.A.; Zhang, F. Long-term experiments for sustainable nutrient management in China. A review. Agron. Sustain. Dev. 2011, 31, 397–414. [Google Scholar] [CrossRef] [Green Version]
  4. Qasim, W.; Xia, L.; Lin, S.; Wan, L.; Zhao, Y.; Butterbach-Bahl, K. Global greenhouse vegetable production systems are hotspots of soil N2O emissions and nitrogen leaching: A meta-analysis. Environ. Pollut. 2021, 272, 116372. [Google Scholar] [CrossRef]
  5. Zhao, H.; Li, X.; Jiang, Y. Response of Nitrogen Losses to Excessive Nitrogen Fertilizer Application in Intensive Greenhouse Vegetable Production. Sustainability 2019, 11, 1513. [Google Scholar] [CrossRef] [Green Version]
  6. Wang, X.; Zou, C.; Gao, X.; Guan, X.; Zhang, Y.; Shi, X.; Chen, X. Nitrate leaching from open-field and greenhouse vegetable systems in China: A meta-analysis. Environ. Sci. Pollut. Res. 2018, 25, 31007–31016. [Google Scholar] [CrossRef]
  7. Liang, B.; Kang, L.; Ren, T.; Junliang, L.; Chen, Q.; Wang, J. The impact of exogenous N supply on soluble organic nitrogen dynamics and nitrogen balance in a greenhouse vegetable system. J. Environ. Manag. 2015, 154, 351–357. [Google Scholar] [CrossRef] [PubMed]
  8. Chen, X.; Ma, C.; Zhou, H.; Liu, Y.; Huang, X.; Wang, M.; Cai, Y.; Su, D.; Muneer, M.A.; Guo, M.; et al. Identifying the main crops and key factors determining the carbon footprint of crop production in China, 2001–2018. Resour. Conserv. Recycl. 2021, 172, 105661. [Google Scholar] [CrossRef]
  9. Chen, X.; Yu, W.; Cai, Y.; Zhang, S.; Muneer, M.A.; Zhu, Q.; Xu, D.; Ma, C.; Yan, X.; Li, Y.; et al. How to identify and adopt cleaner strategies to improve the continuous acidification in orchard soils? J. Clean. Prod. 2022, 330, 129826. [Google Scholar] [CrossRef]
  10. Guo, J.H.; Liu, X.J.; Zhang, Y.; Shen, J.L.; Han, W.X.; Zhang, W.F.; Christie, P.; Goulding, K.W.T.; Vitousek, P.M.; Zhang, F.S. Significant Acidification in Major Chinese Croplands. Science 2010, 327, 1008–1010. [Google Scholar] [CrossRef] [Green Version]
  11. Li, J.; Wan, X.; Liu, X.; Chen, Y.; Slaughter, L.C.; Weindorf, D.C.; Dong, Y. Changes in soil physical and chemical characteristics in intensively cultivated greenhouse vegetable fields in North China. Soil Tillage Res. 2019, 195, 104366. [Google Scholar] [CrossRef]
  12. Zikeli, S.; Deil, L.; Möller, K. The challenge of imbalanced nutrient flows in organic farming systems: A study of organic greenhouses in Southern Germany. Agric. Ecosyst. Environ. 2017, 244, 1–13. [Google Scholar] [CrossRef]
  13. Zhou, J.; Jiang, X.; Wei, D.; Zhao, B.; Ma, M.; Chen, S.; Cao, F.; Shen, D.; Guan, D.; Li, J. Consistent effects of nitrogen fertilization on soil bacterial communities in black soils for two crop seasons in China. Sci. Rep. 2017, 7, 3267. [Google Scholar] [CrossRef] [PubMed] [Green Version]
  14. Potter, D.A.; Bridges, B.L.; Gordon, F.C. Effect of N Fertilization on Earthworm and Microarthropod Populations in Kentucky Bluegrass Turf 1. Agron. J. 1985, 77, 367–372. [Google Scholar] [CrossRef]
  15. Yang, L.; Huang, B.; Mao, M.; Yao, L.; Niedermann, S.; Hu, W.; Chen, Y. Sustainability assessment of greenhouse vegetable farming practices from environmental, economic, and socio-institutional perspectives in China. Environ. Sci. Pollut. Res. 2016, 23, 17287–17297. [Google Scholar] [CrossRef]
  16. Fan, Y.; Zhang, Y.; Hess, F.; Huang, B.; Chen, Z. Nutrient balance and soil changes in plastic greenhouse vegetable production. Nutr. Cycl. Agroecosyst. 2020, 117, 77–92. [Google Scholar] [CrossRef]
  17. Cui, Z.; Wang, G.; Yue, S.; Wu, L.; Zhang, W.; Zhang, F.; Chen, X. Closing the N-Use Efficiency Gap to Achieve Food and Environmental Security. Environ. Sci. Technol. 2014, 48, 5780–5787. [Google Scholar] [CrossRef]
  18. Zhao, Y.; Lu, C.; Shi, Y.; Huang, B.; Chen, X. Soil fertility and fertilization practices affect accumulation and leaching risk of reactive N in greenhouse vegetable soils. Can. J. Soil Sci. 2016, 96, 281–288. [Google Scholar] [CrossRef] [Green Version]
  19. Chen, X.; Cui, Z.; Fan, M.; Vitousek, P.; Zhao, M.; Ma, W.; Wang, Z.; Zhang, W.; Yan, X.; Yang, J.; et al. Producing more grain with lower environmental costs. Nature 2014, 514, 486–489. [Google Scholar] [CrossRef]
  20. Ullah, I.; Mao, H.; Rasool, G.; Gao, H.; Javed, Q.; Sarwar, A.; Khan, M.I. Effect of Deficit Irrigation and Reduced N Fertilization on Plant Growth, Root Morphology, and Water Use Efficiency of Tomato Grown in Soilless Culture. Agronomy 2021, 11, 228. [Google Scholar] [CrossRef]
  21. Min, J.; Shi, W.; Xing, G.; Zhang, H.; Zhu, Z. Effects of a catch crop and reduced nitrogen fertilization on nitrogen leaching in greenhouse vegetable production systems. Nutr. Cycl. Agroecosyst. 2011, 91, 31–39. [Google Scholar] [CrossRef]
  22. Chen, Z.; Zhang, H.; Tu, X.; Sun, X.; Wang, J.; Cheng, Y.; Zhang, J.; Cai, Z.; Chang, S.X. Characteristics of organic material inputs affect soil microbial NO 3–immobilization rates calculated using different methods. Eur. J. Soil Sci. 2020, 72, 480–486. [Google Scholar] [CrossRef]
  23. Yansheng, C.; Fengliang, Z.; Zhongyi, Z.; Tongbin, Z.; Huayun, X. Biotic and abiotic nitrogen immobilization in soil incorporated with crop residue. Soil Tillage Res. 2020, 202, 104664. [Google Scholar] [CrossRef]
  24. Ma, Q.; Zheng, J.; Watanabe, T.; Funakawa, S. Microbial immobilization of ammonium and nitrate fertilizers induced by starch and cellulose in an agricultural soil. Soil Sci. Plant Nutr. 2020, 67, 89–96. [Google Scholar] [CrossRef]
  25. Burger, M.; Jackson, L.E. Microbial immobilization of ammonium and nitrate in relation to ammonification and nitrification rates in organic and conventional cropping systems. Soil Biol. Biochem. 2003, 35, 29–36. [Google Scholar] [CrossRef]
  26. Ren, T.; Wang, J.; Chen, Q. Is the heavy supply of manure adequate to stabilize soil organic matter in greenhouse vegetable planting system? Acta Hortic. 2014, 1018, 167–174. [Google Scholar] [CrossRef]
  27. Zhu, J.; Li, X.; Christie, P.; Li, J. Environmental implications of low nitrogen use efficiency in excessively fertilized hot pepper (Capsicum frutescens L.) cropping systems. Agric. Ecosyst. Environ. 2005, 111, 70–80. [Google Scholar] [CrossRef] [Green Version]
  28. Liu, X.; Zhang, Y.; Ren, X.; Chen, B.; Shen, C.; Wang, F. Long-term greenhouse vegetable cultivation alters the community structures of soil ammonia oxidizers. J. Soils Sediments 2018, 19, 883–902. [Google Scholar] [CrossRef]
  29. Ma, Q.; Wen, Y.; Wang, D.; Sun, X.; Hill, P.W.; Macdonald, A.; Chadwick, D.R.; Wu, L.; Jones, D.L. Farmyard manure applications stimulate soil carbon and nitrogen cycling by boosting microbial biomass rather than changing its community composition. Soil Biol. Biochem. 2020, 144, 107760. [Google Scholar] [CrossRef]
  30. Pan, F.-F.; Yu, W.-T.; Ma, Q.; Zhou, H.; Jiang, C.-M.; Xu, Y.-G.; Ren, J.-F. Influence of 15N-labeled ammonium sulfate and straw on nitrogen retention and supply in different fertility soils. Biol. Fertil. Soils 2017, 53, 303–313. [Google Scholar] [CrossRef]
  31. Liang, B.; Yang, X.; Murphy, D.; He, X.; Zhou, J. Fate of 15 N-labeled fertilizer in soils under dryland agriculture after 19 years of different fertilizations. Biol. Fertil. Soils 2013, 49, 977–986. [Google Scholar] [CrossRef]
  32. Liang, B.; Zhao, W.; Yang, X.; Zhou, J. Fate of nitrogen-15 as influenced by soil and nutrient management history in a 19-year wheat–maize experiment. Field Crop. Res. 2013, 144, 126–134. [Google Scholar] [CrossRef]
  33. Van, E.; Laura, L.; O’Reilly, K.A. Yield, nitrogen dynamics, and fertilizer use efficiency in machine-harvested cucumber. HortScience 2009, 44, 1712–1718. [Google Scholar] [CrossRef] [Green Version]
  34. Joris, H.A.W.; Vitti, A.C.; Ferraz-Almeida, R.; Otto, R.; Cantarella, H. Long-term N fertilization reduces uptake of N from fertilizer and increases the uptake of N from soil. Sci. Rep. 2020, 10, 18834. [Google Scholar] [CrossRef]
  35. Bao, S.D. Soil Agrochemical Analysis; China Agriculture Press: Beijing, China, 2008. [Google Scholar]
  36. Hanson, W.C. The photometric determination of phosphorus in fertilizers using the phosphovanado-molybdate complex. J. Sci. Food Agr. 1950, 1, 172–173. [Google Scholar] [CrossRef]
  37. Rhoades, J.D. Soluble salts. In Methods of Soil Analysis. Part 2. Chemical and Microbiological Properties; Page, A.L., Ed.; American Society of Agronomy, Soil Science Society of America: Madison, WI, USA, 1982; pp. 167–179. [Google Scholar]
  38. Lu, R.K. Soil Agricultural Chemical Analysis; China Agriculture Press: Beijing, China, 2000. [Google Scholar]
  39. Pei, X.B.; Li, S.C.; Zhang, F.M.; Cai, R. Study on leaf area calculation and its correlation with plant height of cucumber in greenhouse. Chin. Agric. Sci. Bull. 2005, 21, 80–82. (In Chinese) [Google Scholar] [CrossRef]
  40. Guo, H.Y.; Yang, X.G.; Huang, B.; Zhang, M.C.; Wang, N.Z. Establishment of growth status assessment system for crops in estern Gansu. Agr. Res. Arid Areas 2005, 23, 16–20+25. (In Chinese) [Google Scholar] [CrossRef]
  41. Yu, H.-Y.; Li, T.-X.; Zhang, X.-Z. Nutrient Budget and Soil Nutrient Status in Greenhouse System. Agric. Sci. China 2010, 9, 871–879. [Google Scholar] [CrossRef]
  42. Sallam, B.N.; Lu, T.; Yu, H.; Li, Q.; Sarfraz, Z.; Iqbal, M.S.; Khan, S.; Wang, H.; Liu, P.; Jiang, W. Productivity Enhancement of Cucumber (Cucumis sativus L.) through Optimized Use of Poultry Manure and Mineral Fertilizers under Greenhouse Cultivation. Horticulturae 2021, 7, 256. [Google Scholar] [CrossRef]
  43. Wang, S.; Chen, Z.; Man, J.; Zhou, J. Effect of Large Inputs of Manure and Fertilizer on Nitrogen Mineralization in the Newly Built Solar Greenhouse Soils. HortScience 2019, 54, 1600–1604. [Google Scholar] [CrossRef]
  44. Zhao, M.; Shi, Y.; Chen, X.; Ma, J. Soil Nitrogen Accumulation in Different Ages of Vegetable Greenhouses. Procedia Environ. Sci. 2011, 8, 21–25. [Google Scholar] [CrossRef] [Green Version]
  45. Huang, Y.; Li, T.X.; Zhang, X.Z.; Ji, L.; Wu, Y.P. Characteristics of nitrogen transportation and fractions in different organs of barley genotype with high nitrogen utilization efficiency. Sci. Agric. Sin. 2015, 48, 1151–1161. (In Chinese) [Google Scholar] [CrossRef]
  46. Ahmadi, M.; Souri, M.K. Growth and mineral content of coriander (Coriandrum sativum L.) plants under mild salinity with different salts. Acta Physiol. Plant. 2018, 40, 194. [Google Scholar] [CrossRef]
  47. Lee, J.-J.; Park, R.-D.; Kim, Y.-W.; Shim, J.-H.; Chae, D.-H.; Rim, Y.-S.; Sohn, B.-K.; Kim, T.-H.; Kim, K.-Y. Effect of food waste compost on microbial population, soil enzyme activity and lettuce growth. Bioresour. Technol. 2004, 93, 21–28. [Google Scholar] [CrossRef] [PubMed]
  48. Li, P.F.; Hou, Z.A. Effect of NaCl stress on growth and mineral element absorption of clove (Medicago Sativa L.) seedling during changes of soil moisture. Chin. J. Soil Sci. 2001, 33, 100–108. (In Chinese) [Google Scholar] [CrossRef]
  49. Zhang, X.; Guo, J.; Vogt, R.D.; Mulder, J.; Wang, Y.; Qian, C.; Wang, J.; Zhang, X. Soil acidification as an additional driver to organic carbon accumulation in major Chinese croplands. Geoderma 2020, 366, 114234. [Google Scholar] [CrossRef]
  50. Kuzyakov, Y.; Xu, X. Competition between roots and microorganisms for nitrogen: Mechanisms and ecological relevance. New Phytol. 2013, 198, 656–669. [Google Scholar] [CrossRef]
  51. Zhao, Y.; Luo, J.-H.; Chen, X.-Q.; Zhang, X.-J.; Zhang, W.-L. Greenhouse tomato–cucumber yield and soil N leaching as affected by reducing N rate and adding manure: A case study in the Yellow River Irrigation Region China. Nutr. Cycl. Agroecosystems 2012, 94, 221–235. [Google Scholar] [CrossRef]
  52. Xu, Y.; Ding, F.; Gao, X.; Wang, Y.; Li, M.; Wang, J. Mineralization of plant residues and native soil carbon as affected by soil fertility and residue type. J. Soils Sediments 2018, 19, 1407–1415. [Google Scholar] [CrossRef]
  53. Souri, M.K.; Sooraki, F.Y.; Moghadamyar, M. Growth and quality of cucumber, tomato, and green bean under foliar and soil applications of an aminochelate fertilizer. Hortic. Environ. Biotechnol. 2017, 58, 530–536. [Google Scholar] [CrossRef]
  54. Dong, J.; Li, X.; Duan, Z.-Q. Biomass allocation and organs growth of cucumber (Cucumis sativus L.) under elevated CO2 and different N supply. Arch. Agron. Soil Sci. 2016, 62, 277–288. [Google Scholar] [CrossRef]
  55. Nerson, H.; Edelstein, M.; Ben Hur, M. Mineral nutrition of winter-grown cucumbers under irrigation with effluent or fresh water. Acta Hortic. 2009, 807, 347–352. [Google Scholar] [CrossRef]
  56. Pan, M.; Yau, P.C.; Lee, K.C.; Man, H.Y. Effects of Different Fertilizers on the Germination of Tomato and Cucumber Seeds. Water Air Soil Pollut. 2022, 233, 25. [Google Scholar] [CrossRef]
  57. Solaiman, Z.; Shafi, M.; Beamont, E.; Anawar, H. Poultry Litter Biochar Increases Mycorrhizal Colonisation, Soil Fertility and Cucumber Yield in a Fertigation System on Sandy Soil. Agriculture 2020, 10, 480. [Google Scholar] [CrossRef]
  58. Xiao, F.; Yang, Z.; Huang, H.; Yang, F.; Zhu, L.; Han, D. Nitrogen Fertilization in Soil Affects Physiological Characteristics and Quality of Green Tea Leaves. HortScience 2018, 53, 715–722. [Google Scholar] [CrossRef] [Green Version]
  59. Zhang, Y.; Li, Q.; Shen, M.; Kang, Y.; Hu, J. Reducing chemical fertilizer use mitigates obstacles in intensive monocropping of cucumber: A probable role of Pseudomonads in the process. Acta Agric. Scand. Sect. B—Soil Plant Sci. 2017, 67, 308–317. [Google Scholar] [CrossRef]
  60. Marschner, P.; Crowley, D.; Rengel, Z. Rhizosphere interactions between microorganisms and plants govern iron and phosphorus acquisition along the root axis–model and research methods. Soil Biol. Biochem. 2011, 43, 883–894. [Google Scholar] [CrossRef]
  61. Yuan, W.-L.; Yuan, S.-Y.; Deng, X.-H.; Gan, C.-X.; Cui, L.; Wang, Q.-F. Effect of N Management on Root Yield and N Uptake of Radishes in Southern China. HortScience 2015, 50, 750–753. [Google Scholar] [CrossRef] [Green Version]
  62. Malhi, S.; Nyborg, M.; Solberg, E.; Dyck, M.; Puurveen, D. Improving crop yield and N uptake with long-term straw retention in two contrasting soil types. Field Crop. Res. 2011, 124, 378–391. [Google Scholar] [CrossRef]
  63. Iandolino, A.B.; Williams, L.E. Recovery of 15N Labeled Fertilizer by Vitis vinifera L. cv. Cabernet Sauvignon: Effects of N Fertilizer Rates and Applied Water Amounts. Am. J. Enol. Vitic. 2014, 65, 189–196. [Google Scholar] [CrossRef]
  64. Habtegebrial, K.; Singh, B.; Haile, M. Impact of tillage and nitrogen fertilization on yield, nitrogen use efficiency of tef (Eragrostis tef (Zucc.) Trotter) and soil properties. Soil Tillage Res. 2007, 94, 55–63. [Google Scholar] [CrossRef]
  65. Blagodatskaya, E.; Blagodatsky, S.; Anderson, T.-H.; Kuzyakov, Y. Priming effects in Chernozem induced by glucose and N in relation to microbial growth strategies. Appl. Soil Ecol. 2007, 37, 95–105. [Google Scholar] [CrossRef]
  66. Guo, R.; Miao, W.; Fan, C.; Li, X.; Shi, X.; Li, F.; Qin, W. Exploring optimal nitrogen management for high yielding maize in arid areas via 15N-labeled technique. Geoderma 2021, 382, 114711. [Google Scholar] [CrossRef]
  67. Said-Pullicino, D.; Cucu, M.A.; Sodano, M.; Birk, J.J.; Glaser, B.; Celi, L. Nitrogen immobilization in paddy soils as affected by redox conditions and rice straw incorporation. Geoderma 2014, 228, 44–53. [Google Scholar] [CrossRef] [Green Version]
  68. Pan, F.; Yu, W.; Ma, Q.; Zhou, H.; Jiang, C.; Xu, Y. Do organic amendments improve the synchronism between soil N supply and wheat demand? Appl. Soil Ecol. 2018, 125, 184–191. [Google Scholar] [CrossRef]
  69. Tran, Q.T.; Maeda, M.; Oshita, K.; Takaoka, M. Phosphorus release from cattle manure ash as soil amendment in laboratory-scale tests. Soil Sci. Plant Nutr. 2017, 63, 369–376. [Google Scholar] [CrossRef]
  70. Yu, W.T.; Pan, F.F.; Ma, Q.; Wang, J.; Zhou, H.; Jiang, C.M.; Xu, Y.G. Alterations of pathways in fertilizer N conservation and supply in soils treated with dicyandiamide, hydroquinone and glucose. Appl. Soil Ecol. 2016, 108, 108–117. [Google Scholar] [CrossRef]
  71. Chen, Y.S.; Camps-Arbestain, M.; Shen, Q.H.; Singh, B.; Cayuela, M.L. The long-term role of organic amendments in building soil nutrient fertility: A meta-analysis and review. Nutr. Cycl. Agroecosys. 2018, 111, 103–125. [Google Scholar] [CrossRef]
  72. Han, X.; Xu, C.; Dungait, J.A.J.; Bol, R.; Wang, X.J.; Wu, W.L.; Meng, F.Q. Straw incorporation increases crop yield and soil organic carbon sequestration but varies under different natural conditions and farming practices in China: A system analysis. Biogeosciences 2018, 15, 1933–1946. [Google Scholar] [CrossRef] [Green Version]
  73. Rahman, M.T.; Zhu, Q.H.; Zhang, Z.B.; Zhou, H.; Peng, X. The roles of organic amendments and microbial community in the improvement of soil structure of a Vertisol. Appl. Soil Ecol. 2017, 111, 84–93. [Google Scholar] [CrossRef]
Figure 1. A diagram of the experimental design.
Sustainability 14 07543 g001
Figure 2. Dynamics of plant height (a), stem diameter (b), LAI (c), and SPAD value (d) of the cucumber under different fertilization practices in soils with three greenhouse vegetable cultivation years. Soils with different years of greenhouse vegetable cultivation: 0 years, farmland soil rotated with winter wheat and summer maize; 2 years, greenhouse vegetable field with two years rotation of early spring cucumber and autumn tomato since the establishment of the facility; 18 years, greenhouse vegetable field with eighteen years rotation of early spring cucumber and autumn tomato since the establishment of the facility. Fertilizer treatments: CK, control without N addition; CF, chemical fertilizer; RCF, reduced chemical fertilizer; RCF+CM, reduced chemical fertilizer + chicken manure; the same amounts of N, P, and K were applied for the RCF and the RCF+CM treatment. LAI indicates leaf area index. Vertical bars represent standard deviations of the mean (n = 3). Separate bars indicate the range of least significant difference (LSD) (t = 0.05) for different treatments.
Sustainability 14 07543 g002
Figure 3. Correlation analyses between LAI and growth potential of cucumber at 47 days (a), 65 days (b), and 90 days (c) after sowing. r indicates the correlation coefficient, ** indicates the correlation coefficient was significant at p < 0.01. Correlation between LAI and growth potential of cucumber at 30 days after seeding was not analyzed considering that seedlings were transplanted to the basin for only 2 days and the effects of different fertilizer treatments on plant growth had not appeared yet.
Sustainability 14 07543 g003
Figure 4. Effect of fertilization practices on cucumber N uptake in soils with 0 (a), 2 (b), and 18 years (c) of greenhouse vegetable cultivation and the average of different fertilizer treatment in the same soil (d). Vertical bars represent standard deviations of the mean (n = 3). Different lowercase letters in the same group indicate there are significant differences (p < 0.05) in cucumber belowground or aboveground N uptake between different fertilizer treatments; different uppercase letters in the same group indicate significant differences (p < 0.05) in cucumber total N uptake between different fertilizer treatments.
Sustainability 14 07543 g004
Figure 5. Effect of fertilization practices on relative nitrogen uptake (a), NUE (b), residue (c), NRR (d), losses (e) and NLR (f) in soils with different years of greenhouse vegetable cultivation. NUE, nitrogen use efficiency, the percent of relative plant N uptake (the difference between plant total N uptake in the N fertilized treatment and CK treatment) in total N fertilizer application; NRR, nitrogen residual rate in soil, the percent of relative soil N increment (the difference between soil N pool in the N fertilized treatment and CK treatment) in total N fertilizer application; NLR, nitrogen losses rate, the percent of N losses (calculated according to the nutrient balance method) in total N fertilizer application. Different lowercase letters in the same group indicate there are significant differences (p < 0.05) between different fertilizer treatments in the same soil. The same below.
Sustainability 14 07543 g005
Figure 6. Main effects of greenhouse vegetable cultivation years on relative nitrogen uptake (a), NUE (b), residue (c), NRR (d), losses (e) and NLR (f). Different lowercase letters in the same frame indicate significant differences (p < 0.05) between soils with different years of greenhouse vegetable cultivation.
Sustainability 14 07543 g006
Table 1. Source of fertilizer and total nutrient input for different fertilizer treatments.
TreatmentFertilizationChicken Manure Application Rate
(kg ha−1)
Chemical Fertilizer Application Rate (kg ha−1)Total Nutrient Input
(kg ha−1)
UreaSodium
Hydrogen Phosphate
Potassium ChlorideNP2O5K2O
CKControl0.000.006008320.00300525
CFChemical fertilizer0.00243919081835211229541158
RCFReduced chemical fertilizer0.0013045600832600300525
RCF+CMReduced chemical fertilizer + chicken manure56829780.00741600301525
Table 2. Basic physicochemical properties of the soils with different greenhouse vegetable cultivation years.
Cultivation YearsOrganic Matter
(g kg−1)
Total N
(g kg−1)
Total P
(g kg−1)
Total K
(g kg−1)
pHEC
(mS/m)
Water Holding Capacity (%)
0 years12.8 ± 0.40 a1.20 ± 0.10 a4.34 ± 0.15 a1.11 ± 0.35 a6.40 ± 0.26 a24.7 ± 4.16 a46.4 ± 3.42 b
2 years15.2 ± 1.74 b1.27 ± 0.23 a4.06 ± 0.23 a1.15 ± 0.21 a6.18 ± 0.10 a107 ± 2.25 c37.5 ± 4.51 a
18 years13.3 ± 0.61 ab1.73 ± 0.25 b6.74 ± 1.58 b1.86 ± 0.45 b6.33 ± 0.17 a89.0 ± 6.22 b47.4 ± 4.01 b
EC indicates soil electric conductivity. Different lowercase letters within columns indicate significant difference (p < 0.05) between the soils. Values are means ± standard deviation (n = 3).
Table 3. Effect of fertilization practices on cucumber growth potential in soils with different years of greenhouse vegetable cultivation.
Cultivation YearsFertilizationGrowth Potential of Cucumber after Different Days of Sowing
30 Days47 Days65 Days90 Days
0 yearsCK0.41 ± 0.01 a1.11 ± 0.05 a42.9 ± 8.09 a104 ± 5.01 a
CF0.48 ± 0.05 a3.36 ± 0.66 c43.1 ± 1.50 a151 ± 14.4 b
RCF0.45 ± 0.03 a2.41 ± 0.50 b42.4 ± 5.43 a225 ± 0.99 d
RCF+CM0.47 ± 0.09 a2.63 ± 0.23 bc33.4 ± 4.92 a192 ± 20.0 c
Average0.46A2.38A40.4A168.1A
CV%9.3039.411.631.0
2 yearsCK0.47 ± 0.04 b3.28 ± 0.32 b85.23 ± 3.83 c163.47 ± 6.70 ab
CF0.40 ± 0.04 a2.35 ± 0.30 a52.57 ± 3.33 a147.50 ± 24.4 a
RCF0.46 ± 0.01 ab2.94 ± 0.20 ab52.14 ± 11.1 a270.81 ± 47.2 c
RCF+CM0.49 ± 0.03 b5.13 ± 0.68 c72.45 ± 3.30 b222.94 ± 36.1 bc
Average0.46A3.42B65.6B201.2B
CV%7.1935.024.628.2
18 yearsCK0.59 ± 0.07 a4.20 ± 0.88 b105 ± 14.61 a165.94 ± 16.9 a
CF0.51 ± 0.08 a2.18 ± 0.30 a104 ± 17.05 a158.94 ± 12.4 a
RCF0.54 ± 0.09 a4.08 ± 0.86 b85.6 ± 10.83 a219.86 ± 18.1 b
RCF+CM0.54 ± 0.09 a5.48 ± 0.05 c84.2 ± 13.51 a278.88 ± 11.7 c
Average0.55B3.99C94.6C206B
CV%6.3834.111.927.1
Different lowercase letters within columns indicate significant difference (p < 0.05) between fertilizer treatments in the same soil, while different capital letters within columns indicate significant difference (p < 0.05) between the averages of different fertilizer treatments. Values are means (n = 3) ± standard deviation. CV% indicates variation coefficient of different fertilizer treatments in the same soil. Average and CV% were calculated on the basis of the three replicates of each fertilizer treatment. The same below.
Table 4. Effect of fertilization practices on cucumber biomass yield in soils with different years of greenhouse vegetable cultivation.
Cultivation YearsFertilizationCucumber Biomass Yield (kg ha−1, DW)
BelowgroundAbovegroundRoot-Shoot
Ratio
Total
0 yearsCK165 ± 29.4 a1209 ± 133 a0.14 ± 0.01 a1374 ± 162 a
CF156 ± 25.5 a1541 ± 50.2 b0.10 ± 0.02 a1697 ± 54.0 b
RCF327 ± 93.1 b1532 ± 39.1 b0.21 ± 0.06 b1858 ± 70.8 b
RCF+CM237 ± 48.0 ab1480 ± 10.1 b0.16 ± 0.03 ab1718 ± 50.5 b
Average221B1440B0.15A1662B
CV%38.910.835.112.2
2 yearsCK295 ± 70.5 a1678 ± 70.0 b0.18 ± 0.05 a1972 ± 110 b
CF427 ± 72.3 b1423 ± 48.2 a0.30 ± 0.04 b1850 ± 120 ab
RCF403 ± 30.9 b1415 ± 76.8 a0.28 ± 0.01 b1818 ± 104 ab
RCF+CM277 ± 65.6 a1444 ± 77.8 a0.19 ± 0.04 a1721 ± 137 a
Average350C1490B0.24B1840C
CV%25.08.6027.47.50
18 yearsCK165 ± 2.19 a1218 ± 69.2 a0.14 ± 0.01 a1383 ± 67.0 a
CF120 ± 22.9 a1210 ± 87.8 a0.10 ± 0.02 a1330 ± 92.4 a
RCF180 ± 28.8 a1242 ± 38.9 a0.14 ± 0.02 a1422 ± 67.6 a
RCF+CM170 ± 54.8 a1191 ± 59.6 a0.14 ± 0.04 a1361 ± 113 a
Average159A1215A0.13A1374A
CV%23.44.9021.55.97
DW indicates plant dry weight biomass. Different lowercase letters within columns indicate significant difference (p < 0.05) between fertilizer treatments in the same soil, while different capital letters within columns indicate significant difference (p < 0.05) between the averages of different fertilizer treatments.
Publisher’s Note: MDPI stays neutral with regard to jurisdictional claims in published maps and institutional affiliations.

