
Using Flowchart to Help Students Learn Basic Circuit Theories Quickly


School of Polytechnic, Purdue University Fort Wayne, Fort Wayne, IN 46805, USA
Sustainability 2022, 14(12), 7516; https://doi.org/10.3390/su14127516
Submission received: 2 March 2022
/
Revised: 12 June 2022
/
Accepted: 18 June 2022
/
Published: 20 June 2022
(This article belongs to the Section Sustainable Education and Approaches)
Abstract
:College education, especially engineering education, is facing big challenges nowadays. Somehow, the gap between quickly developed modern technology used in every field and fundamental theories may discourage some students from continuing their studies in an engineering field. Most fundamental theories are taught in introductory courses in every field and are based on math, which is hard and tedious work to some students. Helping students to build a solid foundation of basic theories in engineering education not only aids students in the study of technical material but also keeps students interested in engineering education, which meets the requirement of sustainability and inclusivity in education. This article proposes a tool to help students quickly grasp basic theories in electronic engineering technology programs. It summarizes basic theories into a flowchart. Students can solve problems in DC and AC circuits following the flowchart with higher accuracy. The flowchart was used by different groups as a reference, and it helps students access to the material quickly according to student performance.
1. Introduction
Requirements of qualified electrical engineers and technicians from the market due to widely used technologies related to this field challenge every university or college’s Electrical Engineering (EE) and Electrical Engineering Technology (EET) program, especially in attracting more students to study in these fields. However, low student retention rates in EE and EET show a different result—a negative sign, even [1]. Increasing student retention rate, especially in the freshmen/sophomore year, and providing qualified education have become an important research work in every EE and EET program; this research focuses on addressing these issues. Strategies for improving students’ math skills, course materials’ setup, and faculties’ teaching techniques have been studied worldwide.
Interest is a key factor in motivating students to study [2,3]. Although most new technologies used in our daily life raise students’ interests in studying in EE and EET, many students lose their interests in studying in these fields after about two years of basic theories learning, which reduces freshman and sophomore retention rates to lower than or around 50% [1]. There are many reasons according to student surveys from different groups at different campuses in both two-year associate programs and four-year programs the author worked with. The gap between basic theories in textbooks and the real applications in our modern life and work, especially in the EET field, makes some students feel that they learn a great deal of useless material rather than real technology, which they expected to learn in college when they selected the program [4].
Flipping classes [5], learning hands-on [6], and basic introduction to electrical and digital concepts [4] are adopted in different programs. Although these works improve student retention rate, they might be improper for foundational theorem courses, such as DC/AC circuit analysis theory. Because most foundational theorems are taught in the first core course in every major, normally, students do not have experience in this field. They need more time to learn not only basic theory but also basic hands-on skills, such as how to build circuits on a breadboard as well as measuring voltage and current. Without basic training, students can only finish their work as a hobby without deep understanding of the basic theorem. Most research work emphasizes hands-on work, but building basic theorem foundation can not only use hands-on work. These basic theorems must be learned sooner or later to help students build a solid foundation in engineering education.
Furthermore, when more new courses must be added in a program to meet the applications of new technology, these important basic theorems must be squeezed into one course at some point. It is hard for most students to understand and remember real-world concepts in a very short time. Although some theorems are described by simple math equations, the concepts related to the real world are very important. If the real-world concepts are missed, the course looks like another math course, which covers several theories, and all these theories have fewer relationships to others. That is why most important basic theories are treated as useless material by some students, which makes them lose interest in the course material. When they are in their junior or senior year, they do not know when and how to use basic theories in following courses and real-life applications. The education quality will be reduced accordingly.
A diverse student body also challenges engineering education. Normally, students have different math skills and learning habits in the same group. To help all students meet course objectives and build a solid foundation on basic theorems is a challenge in freshman and sophomore education. It is important to study how to use new real-world applications to demonstrate the old math-based fundamental theorems during limited class time and to help all students regardless of their background build a solid foundation to their professional education, whereas it is ignored by most studies.
Self-regulated learning offers a great description of college student learning and motivation and has been studied by educators nowadays [7,8,9,10,11], especially in this information age, when most non-academic entertainment, such as social media, detracts from students’ studying time, which makes many students unprepared for their courses. Any method providing a flexible studying environment will help student performance.
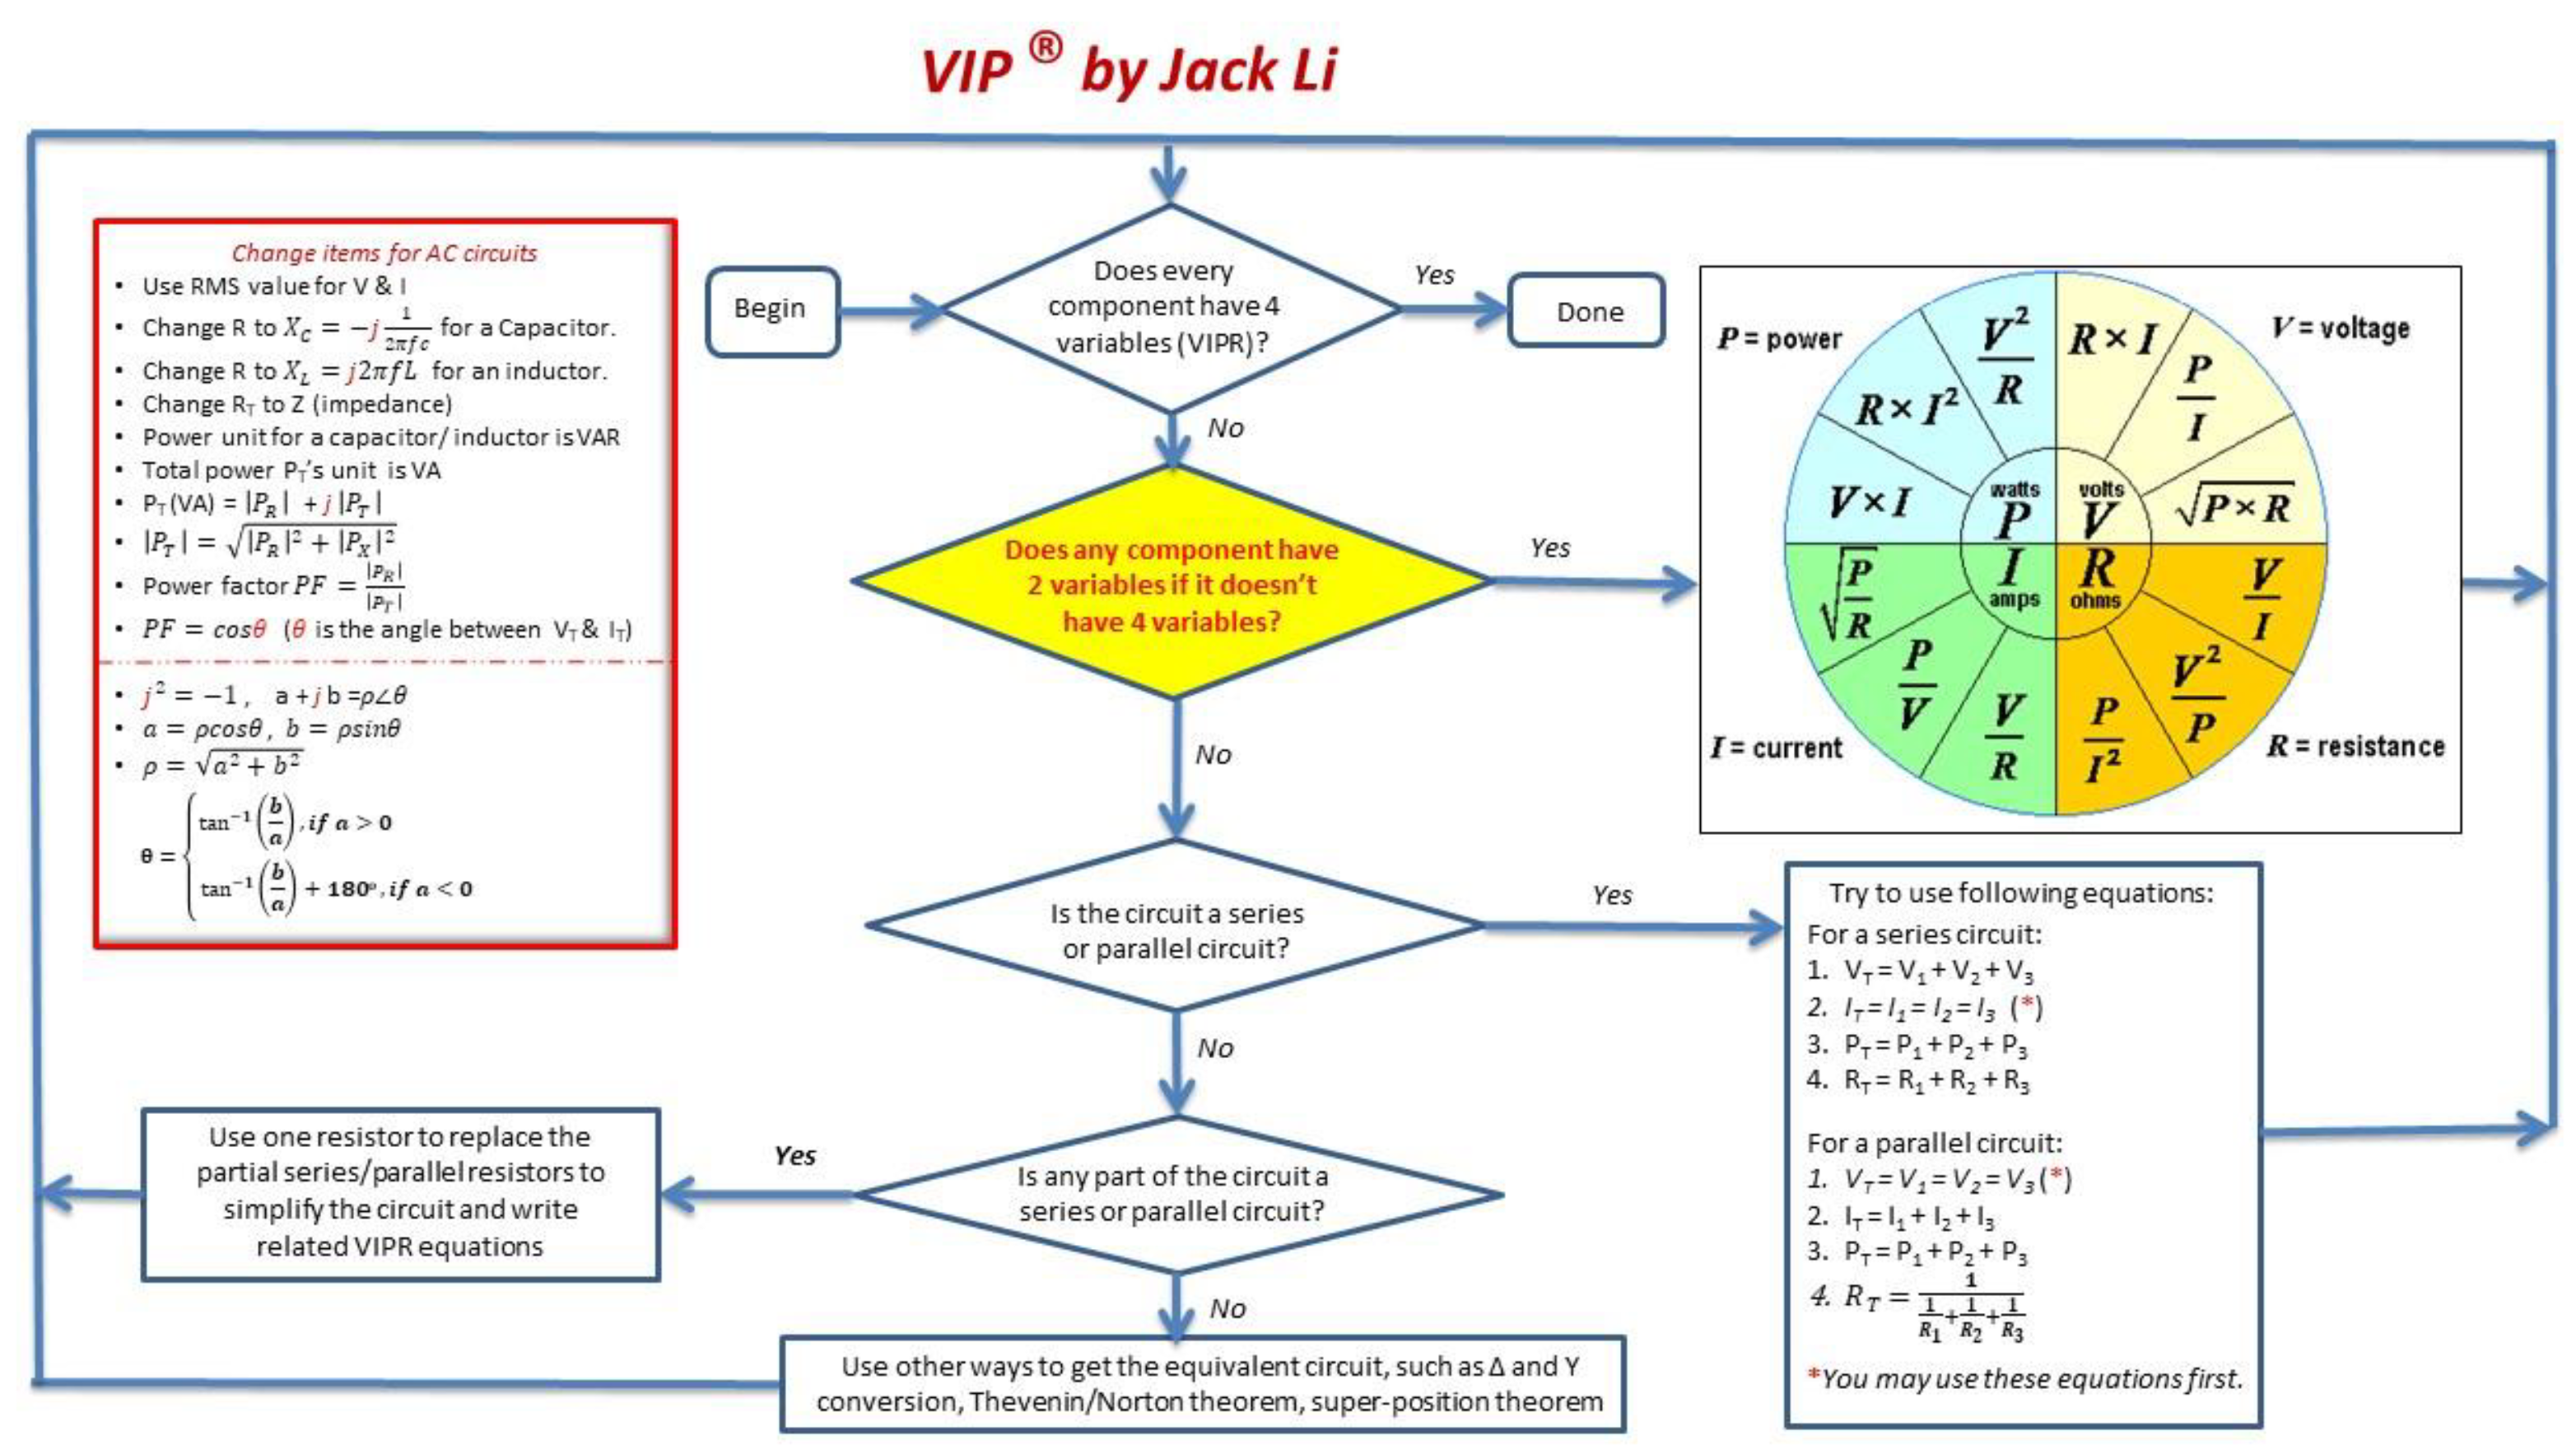
This work aims to help all students grasp theories and concepts in DC and AC circuit analysis quickly. An efficient way to help students learn basic theorems is found in this work. After analyzing common problems that students encounter in the class, the author created a flowchart as shown in Figure 1 and issued it to students as a handy reference to help them in problem solving.
For DC circuit analysis classes, this work studies student performance in 12 groups over six years. Students were evaluated by their performances in two homework assignments from the textbook [12], two unit tests at different times during one semester, as well as the final test of the course, which covers all materials that students should learn in a DC circuit analysis class. In AC circuit analysis classes, eight groups over six years were evaluated by student performance in a unit test about AC circuit analysis using complex numbers. The student performance was compared with the group in which the flowchart was not used. According to the course material, students really can analyze a DC or AC circuit only when they make fewer mistakes in math calculations. These calculation errors are not related to the theorems in circuit analysis, and students will not lose more than 20% points because of these calculation errors. In other words, it is assumed that students grasp the circuit analysis theorems only when their grades are above 80%, which is used to evaluate whether the flowchart is a helpful or not in studying circuit analysis. A student should continue to enroll in an AC circuit analysis class after he/she has passes the DC circuit analysis class following the requirement of the program studied by this work. Students will not enroll in AC circuit analysis class if they quit studying in engineering programs for any reason. Therefore, the enrollment of AC circuit analysis class and the enrollment DC circuit analysis class are used to analyze student retention rate.
The flowchart follows the classical conditioning theory, which helps students use the same process to analyze circuits repeatedly and helps students to memorize the method. As long as students can answer the simple yes/no questions according to their problems, the flowchart will show them how solve the problem step by step. Using a flowchart as a self-study guidance fits the self-regulated learning framework.
The overall outline of the article is as follows: The motivation of this research work and some challenge problems in DC and AC circuit analysis are described in Section 2. A flowchart summarizing most DC and AC circuit analysis theories is introduced in Section 3, and some possible real-world examples are also described in the same section. Student performances before and after using the flowchart are compared in Section 4. A short discussion of the proposed method can be found in Section 5, and the conclusion is given in Section 6.
2. Challenge Problems to Students in DC and AC Circuit Analysis
DC and AC circuit analysis is a basic skill for every student in EE and EET program. It is offered by one or two courses in most colleges in both the two-year program and four-year program. One objective is that students can analyze basic series and parallel circuits as well as series-parallel combinational circuits. According to the author’s experience in teaching different groups to learn DC and AC circuit analysis theorem at different campuses, the following problems continually challenge most students.
For simple explanation and matching the flowchart, this article calls the relationship among the voltage dropped on a resistor the current flowing throng the resistor, the resistance, and the power consumed by the resistor as Ohm’s law, while some textbooks only call the relationship of the voltage dropped on a resistor, the current flowing through the resistor, and its resistance as Ohm’s law.
DC circuit analysis is the first core course in the EE and EET programs after students have finished some general education courses, such as college algebra. Most students are excited to enroll their first core courses because they will learn material that they are interested in. At the beginning of class, e.g., when Ohm’s law is introduced after the introduction to resistor color code, students have less trouble solving problems. There are 12 equations related to Ohm’s law, as shown in the colored circle in Figure 1, a widely used figure called “Ohm’s law (formula) wheel (chart)” [13], in the flow chart. The Ohm’s law wheel makes problem solving so easy that all equations are shown in one picture. As long as students perform a simple word match according to the wheel and the problem, they can solve problems with no equation derivation in their calculation even if they forgot every variable’s physical meaning in the real world, for example, “Find the voltage dropped on a 10 ohms resistor when 10 mA current flow through it”. After students take time to match (find) the following common words, namely “voltage”, “ohms”, and “current” in both the problem and the wheel, they can figure out that they need calculate variable V when variables R = 10 ohms and I = 10 mA. Only one equation, R × I, is the choice to solve the problem. To most students at the beginning of class, the material is even easier than college algebra. One common problem at this time is that some students do not write the unit in their calculations and thus obtain the wrong answer. For example, some students calculate as V = R × I = 10 × 10 = 100 (W), as they did in most math classes, rather than V = R × I = 10 Ω × 10 mA = 100 (W). They ignore that all numbers only with proper units have real, proper physical meanings.
The easier beginning makes some students ignore concepts in the real world, do not remember equations, think that the class is so easy that they do not need to spend much time on it, or lose interest in the EE and EET programs because the course looks like a math class rather than a major core class. All these will cause trouble for them quickly. When series circuits are introduced, four more VIPR relationship equations, as called by the author to match the flow chart’s name, make problems a little bit complex, for example, “What is the current flowing through the circuit when a 10-Ohm resistor and a 15-Ohm resistor are connected in series across a 9 V battery?” If the concept of Ohm’s law, i.e., “current flowing through a resistor is equal to the voltage dropped on it divided by its resistance”, is not emphasized, it is easier to make mistakes because some students still use word matching to help them to solve problems, as they did in Ohm’s law calculation, for example, using 9 V and 10 Ohm to find the current of the 10-Ohm resistor and using 9 V and 15 Ohm for the 15-Ohm resistor. Some of them may find the two resistors’ currents are not the same current, which does not follow the rule of series circuits. It sometimes takes a great deal of time for them to figure out the problem. Almost 50% of students here begin to struggle to solve series circuit problems, as the author observed from student homework in different groups. If the problem is not solved as quickly as possible, it becomes worse after another four equations for parallel circuits are introduced, especially when DC and AC circuit analysis is squeezed into one course, as mentioned in Section 1, which makes it difficult for students to move forward.
As mentioned in Section 1, some students mistreat the course as a regular math class if they ignored the real-world conception related to these equations, which causes students to not know when and which equation should be used when they meet a new problem in this course and following courses as well as applications in daily life. For example, the calculations are different with the same circuit with different parameters (also called variables in the flowchart and this article) of its components. Compared with other new technology courses, these basic theories are even mistreated as useless or outdated material.
In most groups, some students pass calculus, while some still struggle with algebra. That is one reason some students do not like these basic theories because they seem either too simple or too difficult to study. It is common to see that some students have no problems in solving a complex circuit, while some students still struggle with a simple circuit.
Electrical or electronics devices have been widely used in every field in our modern life. Basic knowledge about electrical systems is required to not only for professional employees in EE-related fields but also general education in other fields. For example, all students should take DC and AC circuit analysis course if they study in one engineering technology program. The general idea is to help all students feel comfortable enough to use some electrical systems in their future work or in their daily life. Although some students are not really interested in EET programs, they must pass the course to graduate from the program. How to provide a higher-quality education to students challenges all educators in EE or EET programs.
When students ask for help, the author found that they always asked, “Which equation should I use?” or “Why should I use this equation first?” It is an inconvenience to always have to find equations in a textbook. Even when all 20 equations in Figure 1 are listed on one piece of paper, they still face the same question, which motivated the author to create a one-page reference sheet. It includes not only all equations but also the guidance to select the correct equation. The study result is the flowchart shown in Figure 1.
The flowchart is like self-tax software. It is so easy to be used that students are guided to solve the problem after answering yes/no questions according to the problem even they do not understand the basic theorems.
3. VIPR Flowchart Used in DC and AC Circuit Analysis
The flowchart summarizes most circuit analysis methods except network methods in one chart. Initially, it was used to help students memorize basic equations used in DC circuit analysis by one chart. After several modifications according to students’ feedback, the flowchart was adopted for AC circuit analysis when complex numbers are used to represent the parameters of a component, and a short review of complex numbers was added in the flowchart shown as several equations, too.
It might be tedious to follow the flowchart in circuit analysis at the beginning of class, such as introduction to Ohm’s law and power calculation. As mentioned in Section 2, calculations of Ohm’s law are so simple that only two parameters and a related equation are needed to solve a problem. However, following the flowchart in calculation helps students to remember some problems they may face in real applications. For example, the first question, “Does every component have 4 variables (VIPR)?”, tells students the meaning of the problem is solved, e.g., all four values should be found. Even if some problems only ask to find the resistance value of a resistor, its power value will remind students to pay attention to the resistor’s power rate in real-life applications. The second frequently asked question, “Does any component have 2 variables if it doesn’t have 4 variables?”, emphases the conception of Ohm’s law and the restriction when Ohm’s law is used in calculations as mentioned in Section 2. For a power supply, it provides energy to its loads, so its parameters can be called as the total voltage, current, and power provided by the power supply and its total load resistance of a DC power supply or total load impedance of an AC power supply. This concept was emphasized at the beginning of class because the author found that many students were confused by textbook when they analyzed series and parallel circuits. For example, most textbooks use total current in a series circuit to calculate all resistors’ voltage drop and power consumption directly to simplify or perform short calculation in the textbook. Although nothing is wrong, some students are confused by the format when they review the textbook by themselves. The textbook skips some calculation steps because it is assumed that students should know or memorize everything after they have learned, whereas this is impossible. The flowchart forces students to follow its strict way to solve the problem step by step, and no step can be skipped.
In order to help students to remember the four parameters of a component, VIP, which represents voltage, current, and power, respectively, is used for the name of this flowchart; resistance R is represented by registered trademark symbol (®) to show my “copyright”, as shown with red bold italic fonts in Figure 1, which helps students memorize all four parameters quickly. It is emphasized that the problem is solved only when all four parameters are found for all components in a circuit, including the power supply, as mentioned earlier in this section.
Different real-world examples are used after students practice examples in their textbooks. A real electronic or electrical device is given to students, and they are asked to find parameters in datasheet or the device tag. For example, a 100-watt incandescent light bulb is used in a lab or a class demonstration. Students are asked to find the rated voltage and rated power, which normally are printed on the bulb, and to use these two values to calculate the current flowing through the bulb. A smart meter as mentioned in [14] may be used by students to verify their calculations quickly and safely. The calculation result can also be used to explain the fuse used in a power system and wire selection in house wiring. The bulb’s resistance is also measured using a digital multimeter, and the explanation for the resistance change under different temperature is given at the same time.
The flowchart indicates that Ohm’s law can be used only when two parameters of a component are available. There are many real examples that can be used, such as a DC relay. Most relay manufactures only give rated coil voltage; according to the flowchart, students are asked to find one more parameter. It can be homework for real problem solving. After they find the coil resistance in a datasheet or through measurement using a digital multimeter, they use Ohm’s law to complete calculation. Their results can be verified by measuring current when the relay is powered by a DC power supply under the rated voltage. If time is available, how-to setup of a DC power supply can be introduced. Students can set their DC power supplies to rated voltage to power up the relay. The instructor can encourage students to observe the result when the power supply provides output current less than their calculation result. A similar practice is to ask students to explain why a 12VDC, 300 mA DC adapter cannot power up a 12VDC air bed pump. “Why may a USB hot coffee mug not be a good product?” and “Why do some portable DVD writers need Y-type USB cables to connect to a computer?” are also used as real problems.
When the flowchart is used at the beginning of class with real-life examples in calculations, students may realize that they are not sitting in another math class, and the class is not a tedious theories class either. It is related to real applications in our daily life, which motivates students to study hard and maintain their interests in EE or EET programs at the beginning of major courses learning.
There are 20 equations related to DC and AC circuit analysis and determining the relationship among them. The flowchart also divides them into two groups: one group is Ohm’s law, e.g., VIPR relationship of the same component; the other group is the VIPR relationships among different components. When more equations are needed to solve a problem, the flowchart shows which equations can be used and the sequence of using these equations. The real examples may include how to set up dual-channel DC power supply in series and parallel in an EE or EET laboratory, fuse and switch selection in house wiring and control systems, LED display circuits in microprocessor systems, etc. Students are encouraged to calculate the lighting system in their classroom and to explain “Why is an extra 120V 15A switch needed to control 20 120W 120V lamps in a big classroom?”
The most difficult part for most students is calculation of series-parallel combination circuits because there is not any equation that can be used to solve problems directly, and the important and helpful solution is the first step of calculation. After students answer questions raised by the flowchart, which will guide students in how to simplify the combinational circuit first and continue following the flowchart’s guidance until all four parameters of every component are found. The battery package for a hoverboard may be used as a real example.
After the above practice, most students can grasp the basic theories quickly, and it is easy to move to the advanced topics, such as super-position law, Norton theories, etc.
According to the study of using the flowchart in DC circuit analysis in different groups, it shows that most students can get the general ideal in circuit analysis. Most equations are memorized through more practice. About 30~60% students do not need to use the flowchart as a reference to check equations after they can analyze combinational circuits.
If complex numbers are used to represent impedances of a resistor, a capacitor, and an inductor, the flowchart can be adapted to AC circuit analysis directly. The only change is that all calculations are related to the calculation of complex numbers.
4. Evaluation of This Research Work
The flowchart was used by 12 groups during six years in one engineering technology program. It does not matter what is the student’s major is; all students studying in the program should take DC circuit analysis course and AC circuit analysis course. DC circuit analysis course is offered both in fall (Fx, where x is the assessment year) and spring (Sx), and it covers chapter 1 to chapter 14 of the textbook [12]. The AC circuit analysis course is only offered in every spring and covers chapter 15 to chapter 26. The classes sometimes are divided into two groups in order to fit most students’ schedule and the availability of lab equipment. In this article, Dx represents the assessed group x in DC circuit analysis course, while Ax is the assessed group x in AC circuit analysis course. Both courses are also opened to non-engineering students. Table 1 shows the enrollment of DC and AC circuit analysis classes in about six years. There were two AC circuit analysis classes, A5 (17 students) and A6 (17 students), in spring 2018 and two DC groups, D11 (11 students) and D12 (15 students), in fall 2018. The program began to offer AC circuit analysis class also in fall from 2018 because of increasing enrollment.
DC circuit analysis classes were evaluated by following homework and tests given to every group: (1) Ohm’s law calculation (homework, H1); (2) series and parallel circuit analysis (test, T1); (3) combination circuit analysis (homework, H2); (4) combinational circuit analysis (test, T2); and (5) the final test, which covers all material in the course (F1).
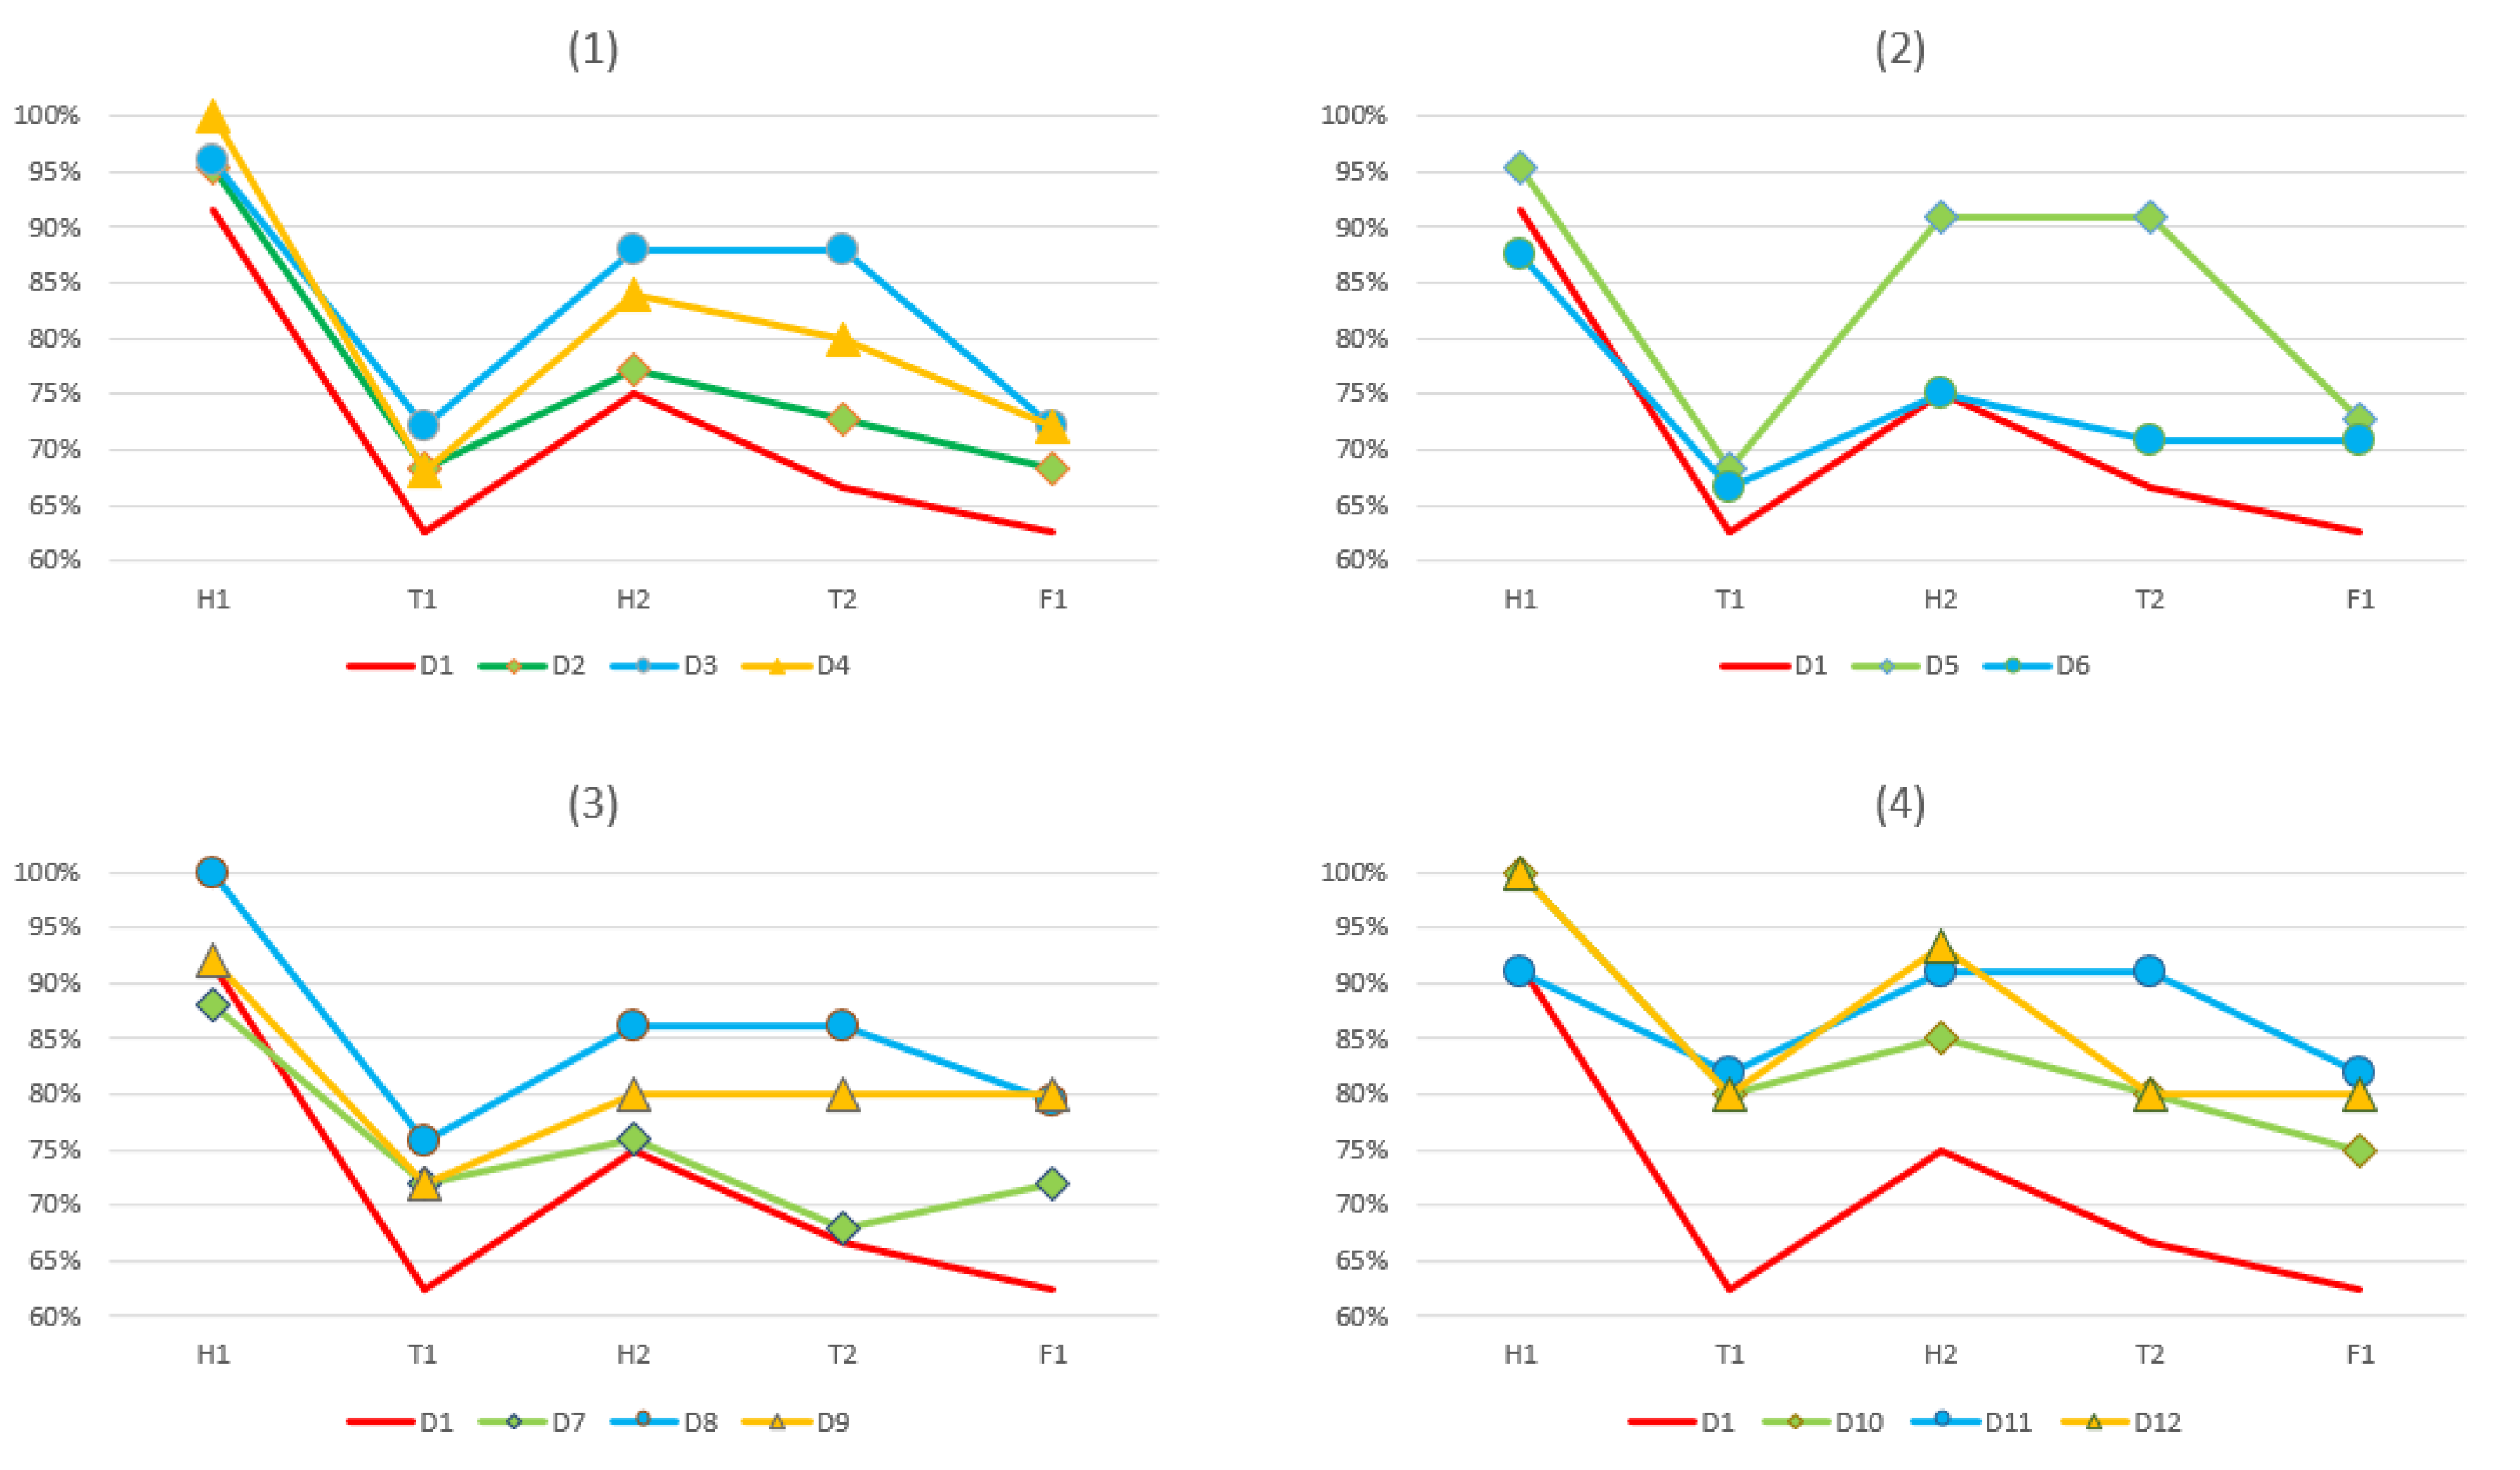
Combinational circuit analysis, such as H2 and T2, should be the most difficult in DC circuit analysis because a mistake in one calculation step, especially in circuit simplification, may lead to a wrong result in the whole circuit analysis. Normally, if a combinational circuit is simplified and solved correctly, it shows that the students understand the circuit structure as well as series and parallel circuits. Sometimes, students make mistakes in calculation, such as using a wrong unit, as mentioned in Section 2. One common problem is that only the last simplified circuit is calculated, and students do not solve every simplified equivalent circuit backwards, which will make them lose about 20% of their grade for the test the author designed. Therefore, it is assumed that a student grasps the general skill in DC circuit analysis if the student’s grade is over 80 points out of 100 points. This article uses 80% as the reference grade to assess H1, T1, and F1 as well. Table 2 shows the number of students whose grade is above 80% in assessed homework and tests. The rates of students whose grade is higher than 80% in every assessed homework and test are shown in Figure 2.
The author worked with group D1 in fall 2013 in the first DC circuit analysis class. This group pushed the author to create the flowchart, so the flowchart was not used by this group. Therefore, this group (D1), which is represented by the red line Figure 2, is used as a reference. All other groups in which the flowchart was used by students in their problem solving are shown as market lines in Figure 2. Because there are so many groups, the result is divided into four pictures to obtain clear pictures, all compared with group D1 (red line). There is no significant difference in H1, e.g., Ohm’s law calculation in all 12 groups because students can solve the problem correctly even using word matching, as we discussed in Section 2. After the flowchart is used to help students in problem solving, the assessed homework and tests results show that more students earned a grade above 80% than did those in group D1 that did not use the flowchart. This means that the flowchart is a helpful tool to help students to analyze DC circuits.
AC circuit analysis classes (Ax) were taught in two ways, as shown in the textbook [12]. Because the flow chart is only related to the method used in chapter 24 (AC circuit analysis using complex number), the test, which covered chapter 24, is used to assess the student performance in this article. The other AC circuit analysis method is a special example of the method used in chapter 24. In other words, students can analyze all AC circuits using the method covered in chapter 24 or using the flowchart. Similar to the DC circuit analysis class, the flowchart was not used by the first group, A1, which was used as reference. Table 3 shows the number of students whose grade is above 80% in the assessed test. The student number is converted to percentage as well. The data show that more students got a grade above 80% after they used the flowchart to help them analyze AC circuits when complex numbers are used in problem solving. As expected, the flowchart can be used in AC circuit analysis to help increase student performance.
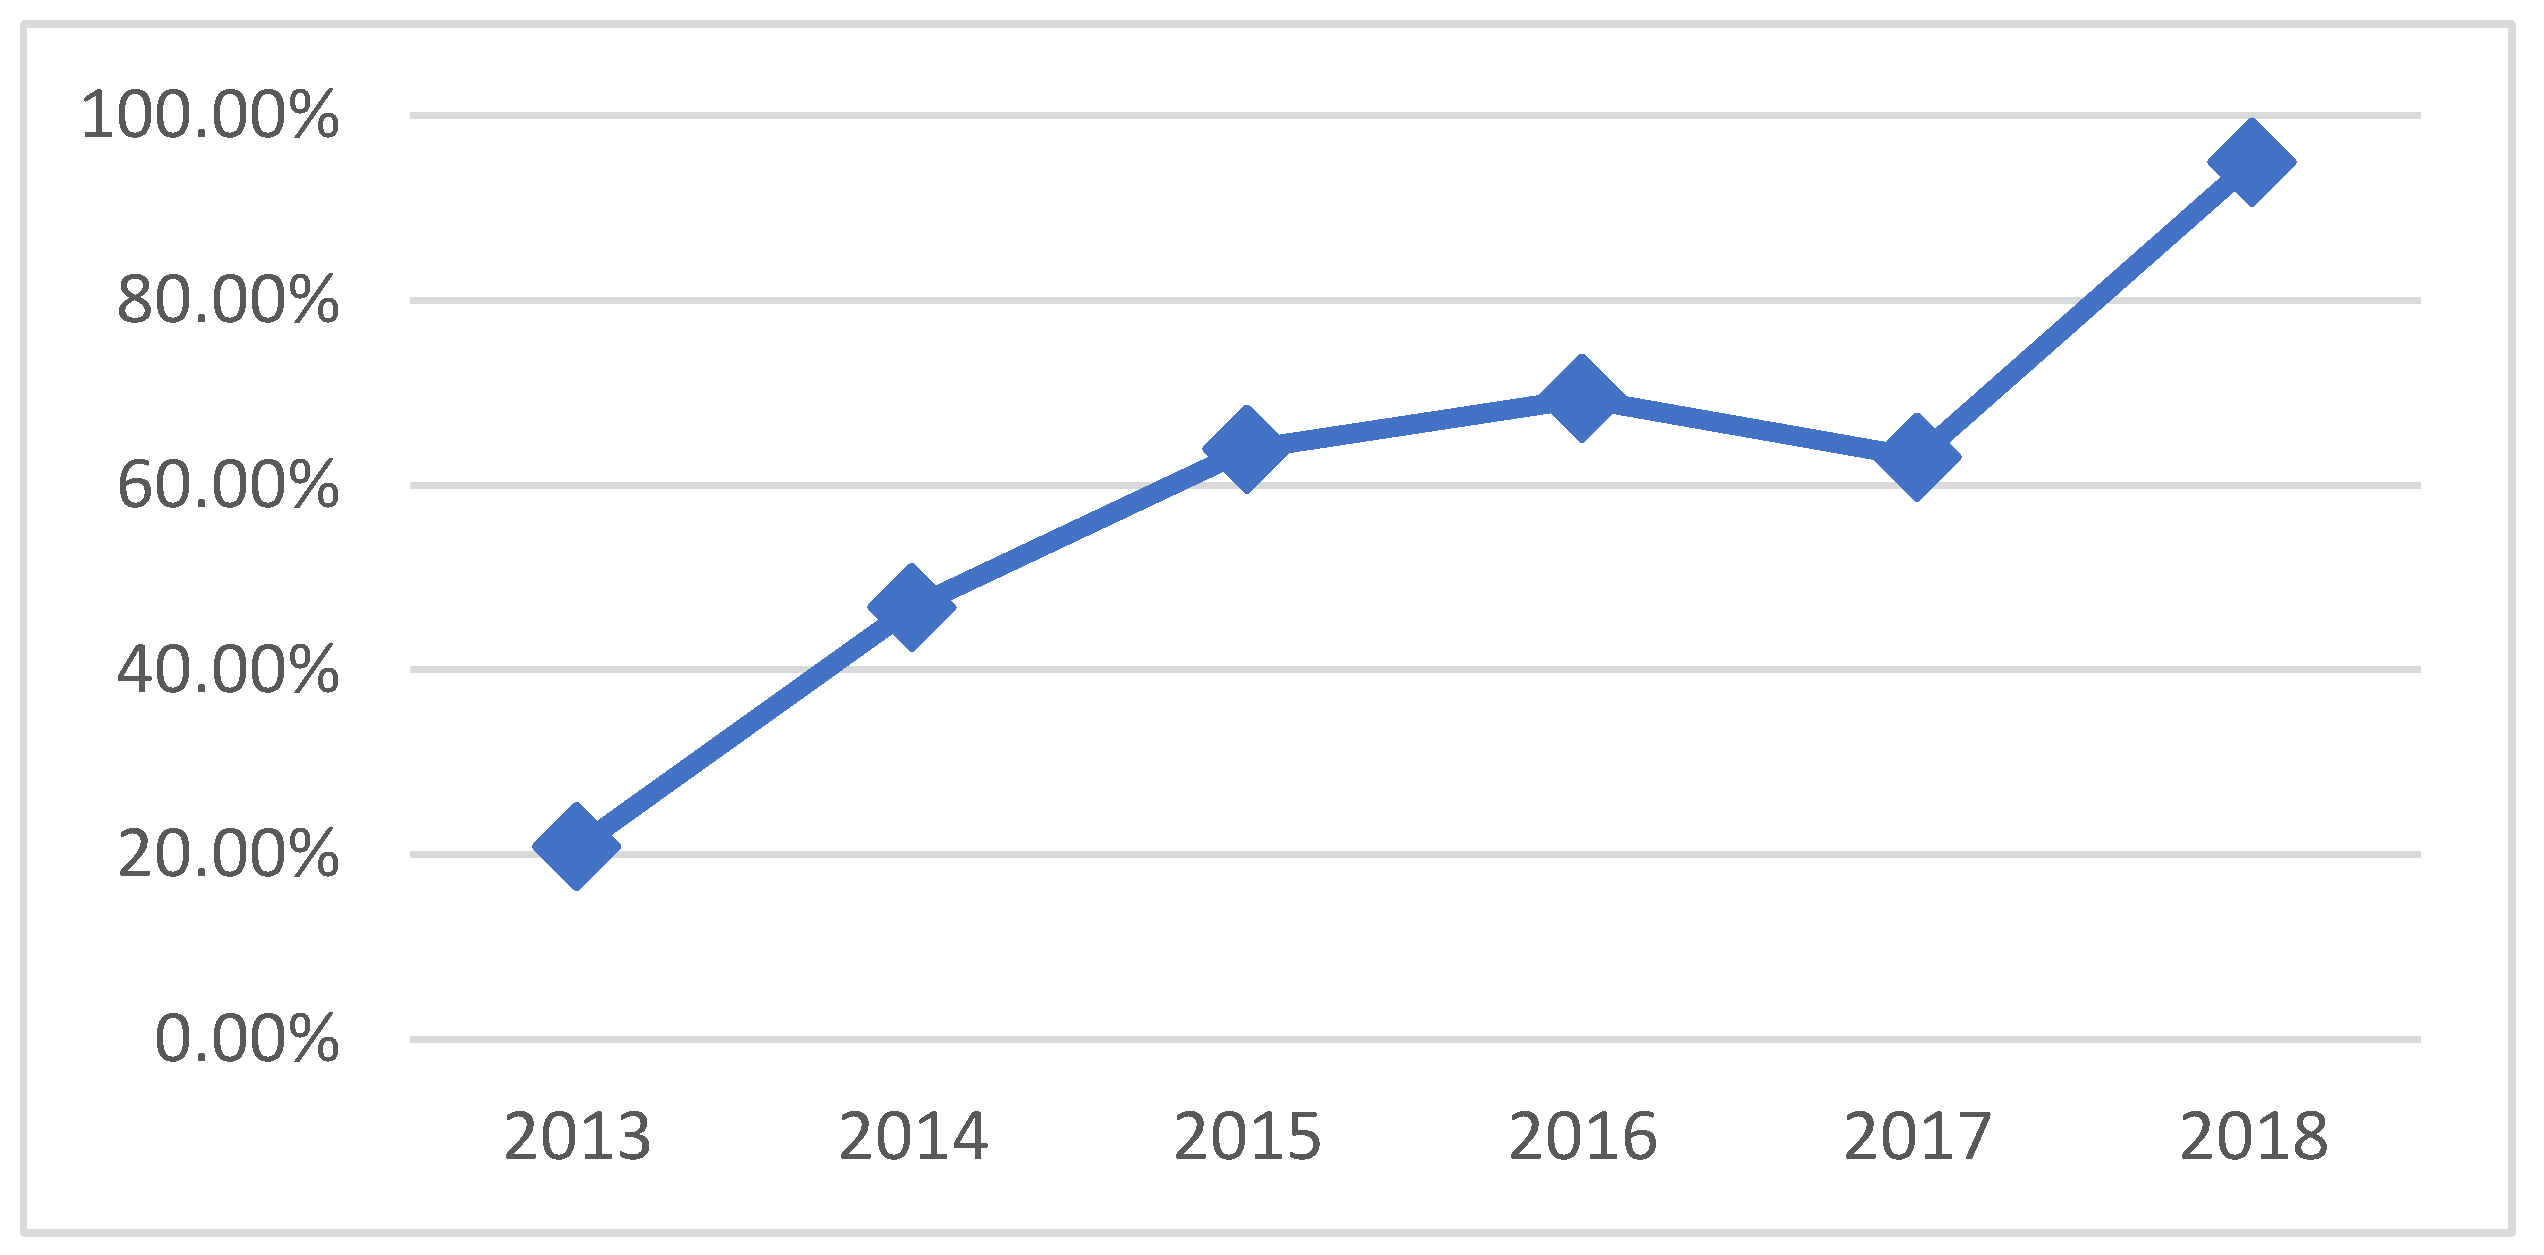
Most students enrolled in the AC circuit analysis class after they passed the DC circuit analysis class. A few students may take AC circuit analysis class later, but every student should take it before their graduation. Here, it is assumed that students would like to enroll in the AC circuit analysis class as early as possible, which is true most of the time when they pay more attention to their graduation time and the suggested course sequence provided by the program. For example, it is assumed that all students who took the DC circuit analysis class in spring 2014 (22 students) and fall 2014 (25 students) enrolled in the AC circuit analysis class in spring 2015 (22 students) shown in Table 1. The student number change may be used to calculate the student retention rate in 2014 approximately, which is about 22/(22 + 25) = 46.81%. The approximate student retention rate is shown in Figure 3. Although the calculation is not very accurate, it shows that the student retention rate is above 60% except in 2013 and 2014, which was before the flowchart was proposed and widely used in classes. The average student retention rate is 59.80%, which is above the national average rate [1].
The above results show that both student performance and student retention rate were raised after the flowchart was used to help students solve circuit analysis problems, as was expected.
5. Discussions
The flowchart guides students to finish basic circuit analysis quickly as well as helps them to build a solid foundation in EE or EET field. It summarizes DC/AC circuit analysis theorem in the same sequence as most textbooks [12] and represents the basic circuit analysis theorem. Furthermore, the flowchart shows the structure of basic theorems clearly. It links all different topics represented by different individual math equations together. The most important concept is also shown by the most frequently used steps, such as “Does any component have 2 variables if it doesn’t have 4 variables?”, which were mentioned in Section 3. The method does not fit network analysis, which is normally offered in EE programs after basic circuit analysis.
The assumption of most textbooks or education systems is that students should remember and understand material they have learned in previous sections when they learn a new section, which is not always true for most students. This assumption forces some students, such as some slow-learning students, to quit the class or program when they miss more basic material, while the flowchart negates this strict assumption and requirement for students. As mentioned in the previous section, the flowchart clearly shows students the related material that will be used to solve their problem. Student can use this guidance to make up their missed material. It can help them to keep studying. Furthermore, when they move forward to learn the new material, the flowchart will bring them back to basic material again and again, which helps them review material they have learned throughout the course. For example, when students solve a series circuit with two resistors, the Ohm’s law equations will be practiced three times according to the flowchart. Most students remember equations after continuous practice. There are several students in different groups who missed some classes because of military training, and they made up their missed work quickly when they used the flowchart. It really emphasizes the “nobody left behind” ideal.
As described in Section 3, real-world examples are given at different times in class according to the material covered, which maintains students’ interests in EE or EET fields, as other studies suggested [1,4,5,6]. Because the method also helps all students keep up with the course material, it prevents some students from dropping the class or program early because of their lower performance in the first core course in EE or EET programs. It gives students more time to consider not only if the program fits their college education but also if they are ready to study in the program after they take this core course.
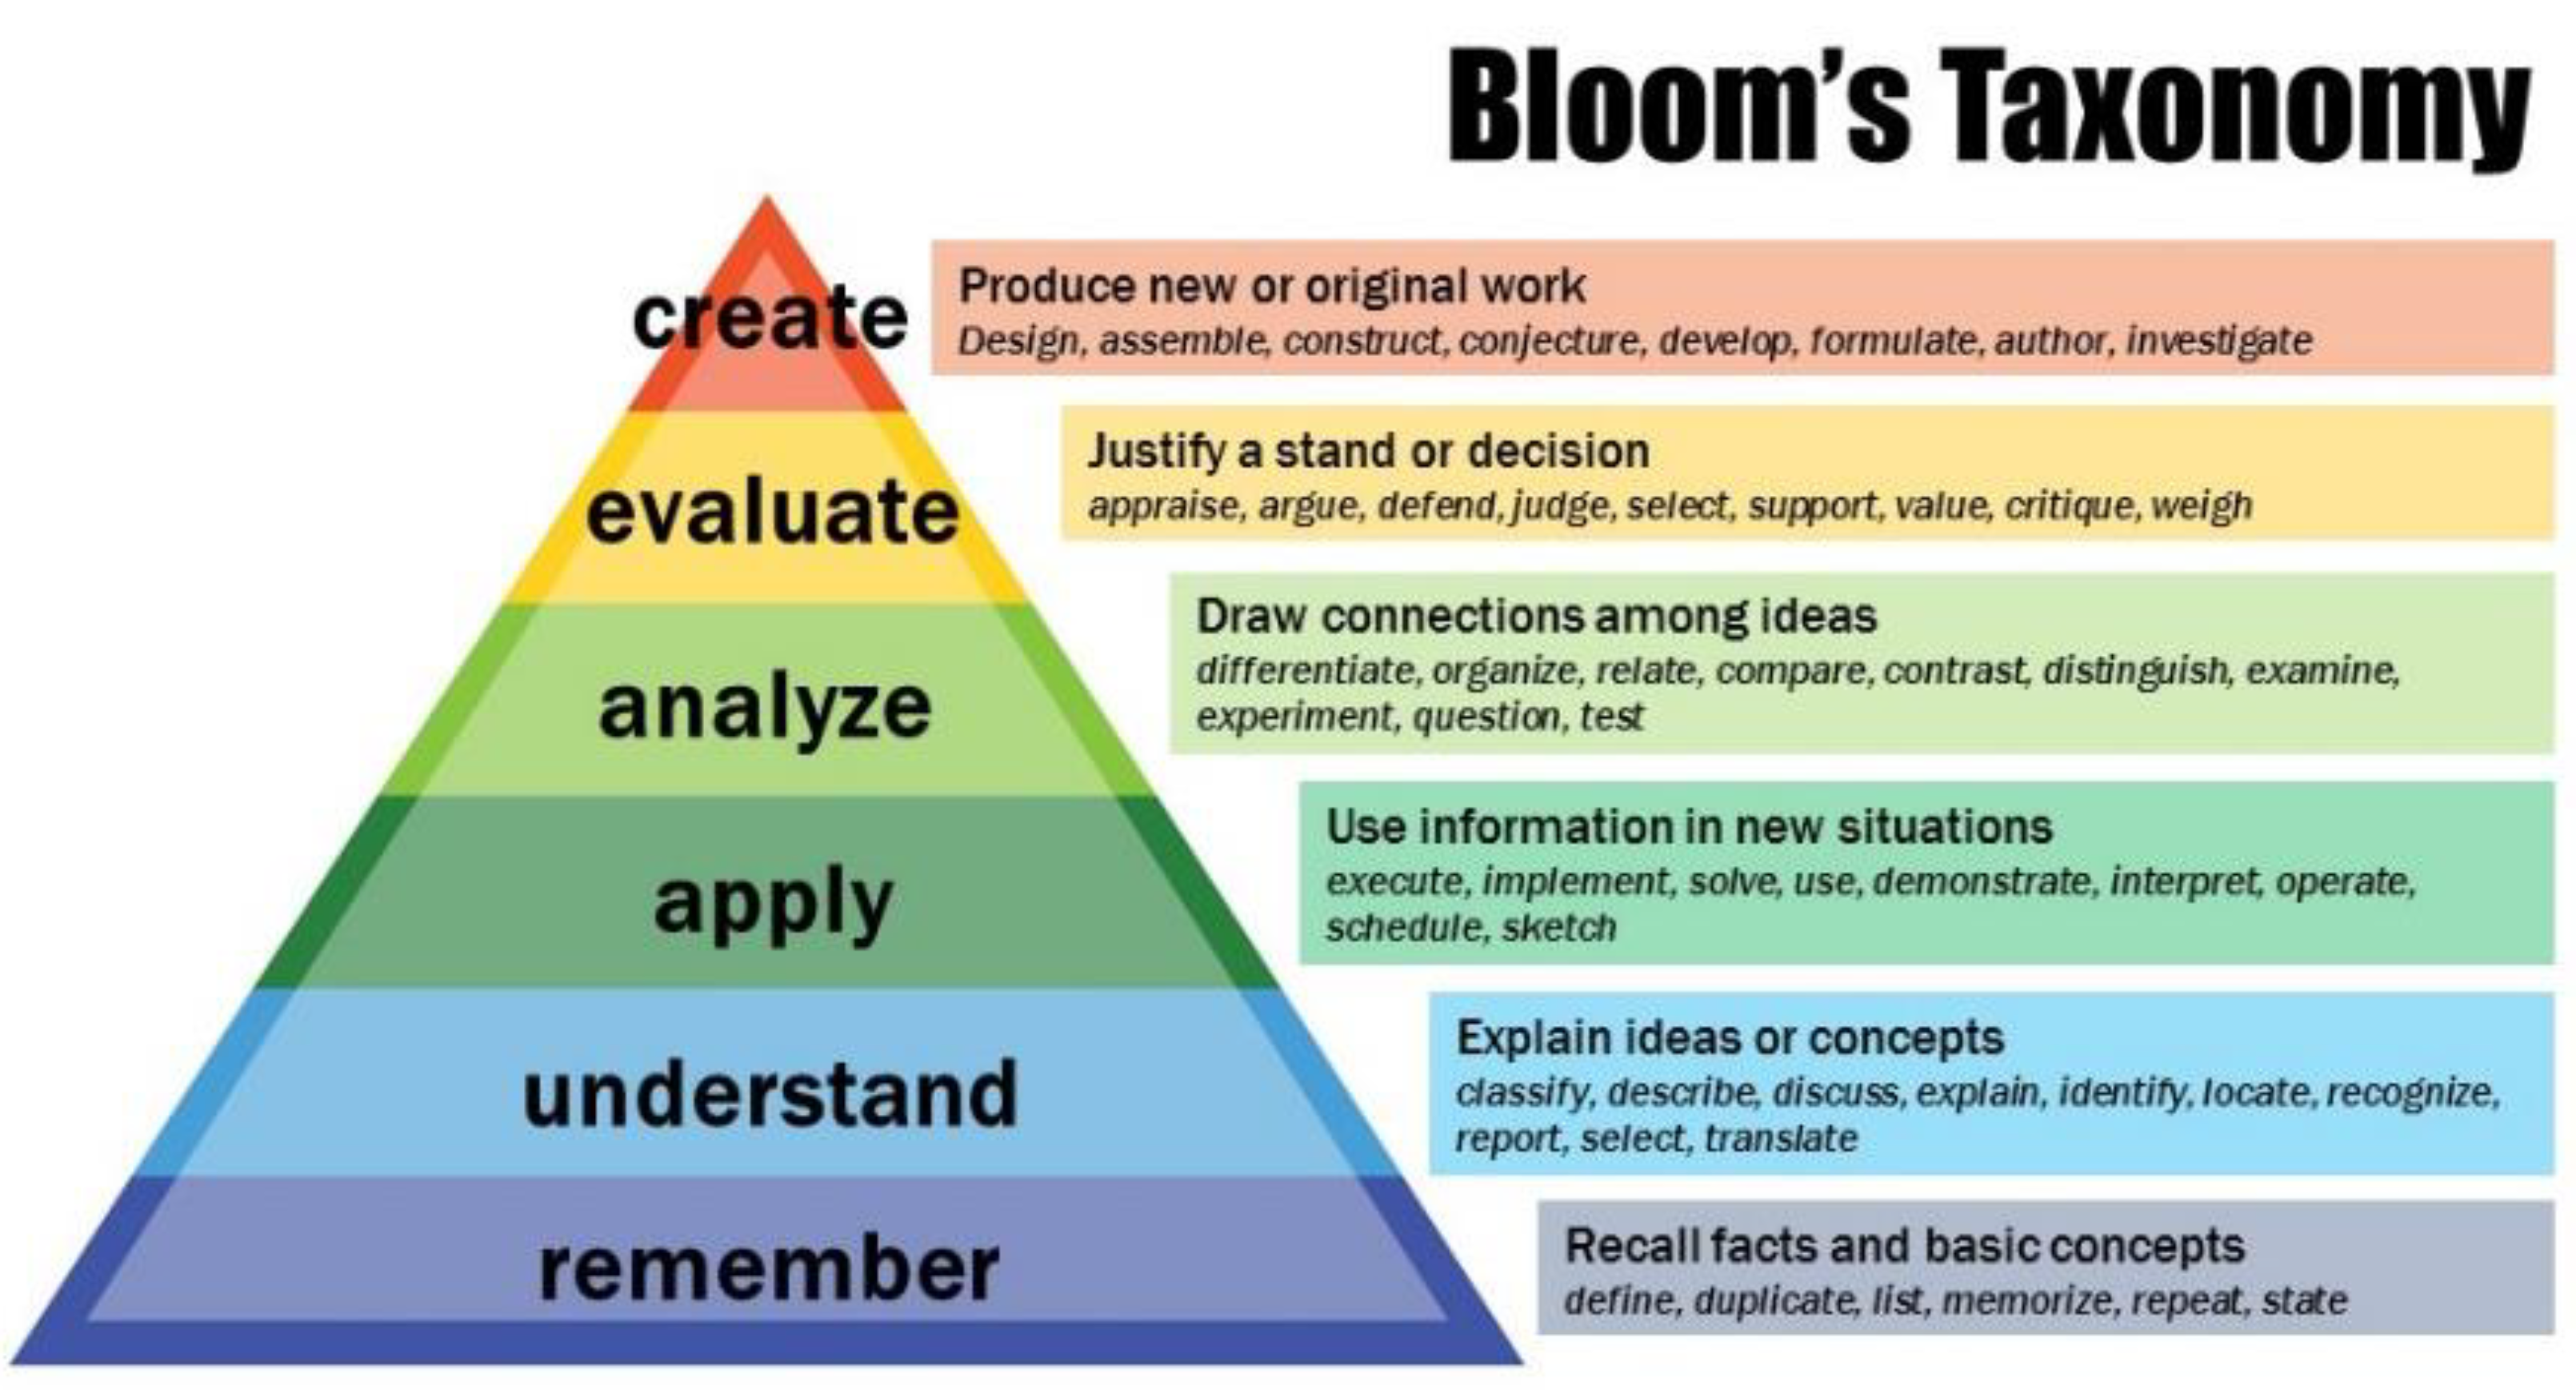
As mentioned early, the flowchart does help students to memorize material, which is an important step in learning according to Bloom’s Taxonomy of Learning, as shown in Figure 4 [15]. The flowchart helps students not only memorize class material but also understand the material at the same time.
Using the flowchart in DC and AC circuit analysis also fits the self-regulated learning framework. Being unprepared for courses and having less studying time are common problems in college learning. When an instructor or a tutor is not available, students face a big challenge in making up their missed material. Most of the time, they may not know which part they should make up to solve the problem they face. It is impossible for them to read the textbook and to memorize all the material during a short time, which renders their self-studying inefficient. At any time, the flowchart shows the material that should be used in problem solving as discussed earlier in the course, so students can engage in self-study at any time with or without any one’s help. Meanwhile, the steps of calculation guided by the flowchart are almost the same steps given in the textbook [12]. The only difference is that when there are two choices, the flowchart prefers using Ohm’s law equations, while the textbook may use the series or parallel equations first. Therefore, when students use the flowchart to help them analyze circuits and review material in their textbook, there is no conflict between them, and students will not be confused.
The flowchart was issued to students at the beginning of the class, and animation to follow the flowchart was added in PowerPoint files used in lectures in which the instructor demonstrates how to analyze a circuit step by step. It gives students a clear picture of circuit analysis step by step.
The studies of educational learning theories show that connectivism is one of the newest educational learning theories in this digital age [16,17]. Most students would like to use the Internet [13] or YouTube to help themselves study whenever they encounter problems rather than to review their textbooks or to ask for help from their teachers and tutors. There is so much material from the Internet that it takes a great deal of time to find a proper answer, especially if they have forgotten some background material. Even after they study their textbooks, they still cannot find solutions sometimes, as we discussed in Section 2. The flowchart created in this article is a perfect complement to a textbook. It provides a vivid touchpoint as a teacher asks questions and guides students to work in a proper way according to their answers. It saves time for students searching on the Internet.
Furthermore, classical conditioning theory shows a better solution to basic theorem learning because most materials about basic theorems are not based on other materials [16]. The materials must be memorized somehow, like the spelling of English words. The flowchart follows the classical conditioning theory. It guides students to analysis of different circuits in a special process. After students are trained to analyze circuits from simple ones to complex combinational circuits in the same process repeatedly, students will use the same method in problem solving unconsciously whenever they are presented with a new problem. As mentioned earlier, because the flowchart matches most textbooks, the method students follow in the flowchart is what the textbook illustrates. It does not provide a new analysis method, which may cause confusion for students compared to materials in their textbook, but provides a clear picture of the structure of circuit analysis on one page and helps students grasp materials quickly according to the studies shown in Section 4 and Section 6.
6. Conclusions
This article introduces a flowchart used to summarize general DC and AC circuit analysis methods. It summarizes the basic DC/AC circuit analysis theorem into one page. The flowchart matches course material in most textbooks, with a clear structure of the theorems. The biggest advantage is that the flowchart acts like a tutor. It guides students to solve any problem by themselves. Although there are other ways to help students learn circuit analysis, such as Ohm’s law wheel [13], the flowchart, to the best of the author’s knowledge, is the only one that covers the whole analysis method. After being used by 12 groups over six years, the flowchart has been shown to help students to review and memorize course material, guide students to find and make up their missed work, and guide students in problem solving. It is a useful reference, especially when students review course material. One-third of students do not need use the flowchart as a reference to check equations or analyze circuits at the end of semesters because they have by then memorized all the material. It helps increase students’ interests in learning basic theories and frees students from the pressure of struggling with math problems. The student retention rate of these groups increased as well.
Summarizing basic theories in different formats, such as the flowchart used here, will help students understand material quickly, according to this study. The flowchart can be used in AC circuit analysis directly if the complex number is used to calculate the impedance of a capacitor or an inductor. Although the flowchart introduced here does not fit the network analysis method, the flowchart is useful in helping students to review basic theorems, such as Ohm’s law and series/parallel circuit, before they learn the network analysis method.
Funding
This research received no external funding.
Conflicts of Interest
The authors declare no conflict of interest.
References
- Desai, N.H.; Stefanek, G. An Introductory Overview of Strategies used to Reduce Attrition in Engineering Programs. In Proceedings of the 2017 ASEE Annual Conference & Exposition, Columbus, OH, USA, 24–28 June 2017; Available online: https://peer.asee.org/27584 (accessed on 20 February 2022).
- Ainley, M. Connecting with Learning: Motivation, Affect and Cognition in Interest Processes. Educ. Psychol. Rev. 2006, 18, 391–405. [Google Scholar] [CrossRef]
- O’Keefe, P.A.; Linnenbrink-Garcia, L. The role of interest in optimizing performance and self-regulation. J. Exp. Soc. Psychol. 2014, 53, 70–78. [Google Scholar] [CrossRef]
- Ochoa, H.A.; Shirvaikar, M. The Engagement and Retention of Electrical Engineering Students with a First Semester Freshman Experience Course. In Proceedings of the 2011 ASEE Annual Conference & Exposition, Vancouver, BC, Canada, 26–29 June 2011; Available online: https://peer.asee.org/18540 (accessed on 20 February 2022).
- Han, T.-Y.; Chen, H.-R.; Lin, H.-C.K. Using Flipped Classroom to Improve the Learning Effectiveness of Digital Logic Courses. Electronics 2021, 10, 1602. [Google Scholar] [CrossRef]
- Kaplan, D.M.; White, C.G. Hands-on Electronics: A practical Introduction to Analog and Digital Circuits; Cambridge University Press: New York, NY, USA, 2003. [Google Scholar]
- Pintrich, P.R. A Conceptual Framework for Assessing Motivation and Self-Regulated Learning in College Students. Educ. Psychol. Rev. 2004, 16, 385–407. [Google Scholar] [CrossRef] [Green Version]
- Etkin, J. Understanding Self-Regulation in Education. BU J. Grad. Stud. Educ. 2018, 10, 35–39. Available online: https://files.eric.ed.gov/fulltext/EJ1230272.pdf (accessed on 25 May 2022).
- Winne, P.H.; Hadwin, A.F. Studying as self-regulated learning. In Metacognition in Educational Theory and Practice; Hacker, D.J., Dunlosky, J., Graesser, A.C., Eds.; Lawrence Erlbaum Associates Publishers: New York, NY, USA, 1998; pp. 277–304. ISBN 9780805824810. [Google Scholar]
- Ben-Eliyahu, A. Sustainable Learning in Education. Sustainability 2021, 13, 4250. [Google Scholar] [CrossRef]
- Bernacki, M.L.; Vosicka, L.; Utz, J.C.; Warren, C.B. Effects of digital learning skill training on the academic performance of undergraduates in science and mathematics. J. Educ. Psychol. 2021, 113, 1107–1125. [Google Scholar] [CrossRef]
- Schultz, M. Grob’s Basic Electronics (11e); McGraw-Hill Education: New York, NY, USA, 2011; ISBN 9780073510859. [Google Scholar]
- Ohm’s Law and Ohms Law Calculator. Available online: https://diyaudioprojects.com/Technical/Ohms-Law/ (accessed on 20 February 2022).
- Li, J. Use a Smart Power Meter to Add Practical Labs in AC Electronics. Technol. Interface Int. J. 2019, 20, 52–55. [Google Scholar]
- Armstrong, P.; Bloom’s Taxonomy. Vanderbilt University Center for Teaching. Available online: https://cft.vanderbilt.edu/guides-sub-pages/blooms-taxonomy/ (accessed on 20 February 2022).
- Drew, C. 31 Major Learning Theories in Education, Explained! Available online: https://helpfulprofessor.com/learning-theories/ (accessed on 17 June 2022).
- Five Educational Learning Theories. Available online: https://www.wgu.edu/blog/five-educational-learning-theories2005.html#close (accessed on 25 April 2022).
Figure 1.
VIPR Flowchart Used in Circuit Analysis.

Figure 2.
Rate of students with grade above 80% in assessment.

Figure 3.
Approximate student retention rate.

Figure 4.
Bloom’s Taxonomy of Learning.


Table 1.
Enrollment of DC and AC circuit analysis classes.
| F13 | S14 | F14 | S15 | F15 | S16 | F16 | S17 | F17 | S18 | F18 | |||
|---|---|---|---|---|---|---|---|---|---|---|---|---|---|
| Dx | 24 | 22 | 25 | 25 | 22 | 24 | 25 | 29 | 25 | 20 | 11 | 15 | |
| Ax | 5 | 22 | 30 | 34 | 17 | 17 | 19 | ||||||
Table 2.
The number of students with grade above 80% in DC circuit analysis.
| D1 | D2 | D3 | D4 | D5 | D6 | D7 | D8 | D9 | D10 | D11 | D12 | |
|---|---|---|---|---|---|---|---|---|---|---|---|---|
| H1 | 22 | 21 | 24 | 25 | 21 | 21 | 22 | 29 | 23 | 20 | 10 | 15 |
| T1 | 15 | 15 | 18 | 17 | 15 | 16 | 1 | 22 | 18 | 16 | 9 | 12 |
| H2 | 18 | 17 | 22 | 21 | 20 | 18 | 19 | 25 | 20 | 17 | 10 | 14 |
| T2 | 16 | 16 | 22 | 20 | 20 | 17 | 17 | 25 | 20 | 16 | 10 | 12 |
| F1 | 15 | 15 | 18 | 18 | 16 | 17 | 18 | 23 | 20 | 15 | 9 | 12 |
Table 3.
The number of students with grade above 80% in AC circuit analysis.
| A1 | A2 | A3 | A4 | A5 | A6 | A7 | |
|---|---|---|---|---|---|---|---|
| Total student number | 5 | 22 | 30 | 34 | 17 | 17 | 19 |
| Students with grade above 80% | 1 | 8 | 11 | 13 | 6 | 8 | 8 |
| 20% | 36% | 37% | 38% | 35% | 47% | 42% |
Publisher’s Note: MDPI stays neutral with regard to jurisdictional claims in published maps and institutional affiliations. |
© 2022 by the author. Licensee MDPI, Basel, Switzerland. This article is an open access article distributed under the terms and conditions of the Creative Commons Attribution (CC BY) license (https://creativecommons.org/licenses/by/4.0/).
Share and Cite
MDPI and ACS Style
Li, J. Using Flowchart to Help Students Learn Basic Circuit Theories Quickly. Sustainability 2022, 14, 7516. https://doi.org/10.3390/su14127516
AMA Style
Li J. Using Flowchart to Help Students Learn Basic Circuit Theories Quickly. Sustainability. 2022; 14(12):7516. https://doi.org/10.3390/su14127516
Chicago/Turabian StyleLi, Jack. 2022. "Using Flowchart to Help Students Learn Basic Circuit Theories Quickly" Sustainability 14, no. 12: 7516. https://doi.org/10.3390/su14127516
Note that from the first issue of 2016, this journal uses article numbers instead of page numbers. See further details here.