Article

A Study of the Spatial Structure and Regional Interaction of Agricultural Green Total Factor Productivity in China Based on SNA and VAR Methods

1
College of Economics and Management, Zhejiang A&F University, Hangzhou 311300, China
2
Zhejiang Provincial Credit Center, Hangzhou 310007, China
3
College of Environmental Science and Engineering, Donghua University, Shanghai 201620, China
4
Guangdong Polytechnic of Environmental Protection Engineering, Foshan 528216, China
5
School of Economic Information Engineering, Southwestern University of Finance and Economics, Chengdu 611130, China
6
Business School, Jiyang College of Zhejiang A&F University, Zhuji 311800, China
*
Author to whom correspondence should be addressed.
Sustainability 2022, 14(12), 7508; https://doi.org/10.3390/su14127508
Submission received: 15 April 2022 / Revised: 4 June 2022 / Accepted: 17 June 2022 / Published: 20 June 2022

Abstract

:
As regional interaction increases in an open economy, a region’s green total factor productivity in agriculture must be considered alongside relationships with other regions. In this study, the slack-based model (SBM) global Malmquist–Luenberger (GML) index is used to measure the green total factor productivity of agriculture in each province of China, and the social network analysis (SNA) and vector autoregressive model (VAR) impulse response function (IRF) are used to examine the spatial network structure and regional interactivity. The research confirms that the absolute value and concentration of agricultural green total factor productivity are generally higher in the south than in the north of China, but the peak is lower in the south than in the north. The network density of agricultural green total factor productivity in China from 2008 to 2019 shows an increase, with the cut-off values of mean, 10, 50, and 100 treated as 4.97%, 2.57%, 3.30%, and 2.43%, respectively. From 2008 to 2019, the central potentials of network entry and network exit of green total factor productivity in China’s agriculture show a “V”-shaped and inverted “V”-shaped evolution path, respectively, with the density of cohesive subgroups growing, which demonstrates that the spatial structure of green total factor productivity in Chinese agriculture has experienced an evolutionary path from polycentric to monocentric to polycentric conditions. The spatial interaction of different cohesive subgroups is intensifying and has a certain degree of self-stability. In terms of regional interaction, the siphon effect of the east on the green development of agriculture in the central and western regions is significant, but the trickle-down effect is not obvious, and the interaction between the central and western regions has a catalytic effect on the efficiency of the green economy of agriculture in both regions. It is recommended that targeted policies be introduced to support the flow of agricultural factors and industrial division of labour between the central and western regions and the south and north, taking into account the actual situation. The novelty of this paper is that it focuses on the green total factor productivity of Chinese agriculture and combines the innovative use of the social network analysis paradigm to analyse the green development of agriculture in a country from a spatial dynamic evolutionary perspective. A limitation of the research methodology in this paper is its poor applicability to closed economy analysis.

1. Introduction

The concept of “green development” was first introduced by the United Nations Development Programme in 2002 and is widely regarded by society as the ideal path to achieve the organic integration of economy and environment [1]. In line with the concept of green development in agriculture, the Chinese government introduced and implemented regulations in May 2008 regarding the disclosure of information from government departments that publish pollution data and the Ministry of Environmental Protection’s information disclosure measures, with a focus on promoting green and sustainable development in agriculture. The research questions are as follows: What is the level of total factor productivity in China’s agricultural environment under strict environmental regulation? With the gradual breakdown of administrative barriers, does China’s green total factor productivity in agriculture show a trend towards agglomeration at the spatial level? What is the correlation between green total factor productivity in agriculture in eastern, central, and western China, as well as in southern and northern regions, due to differences in geographical location and degree of economic development?
In a national context where green development has become the main goal of Chinese agriculture, an accurate grasp of the actual effects of environmental regulations on the efficiency of economic development in agricultural development is of great theoretical and practical value for the next stage of agricultural green development policy formulation in China and other developing countries similar to it. Therefore, in the research design of this paper, firstly, the theoretical and empirical studies are summarised and a more scientific approach is adopted to measure the green total factor productivity of agriculture in each province of China. Secondly, we innovate the use of social network analysis to analyse the spatial distribution pattern of green total factor productivity in agriculture at the provincial level in China. Thirdly, we focus on the regional interaction of green total factor productivity in agriculture in these key regions, taking into account the development disparities between the eastern, central, and western parts of China, as well as the southern and northern regions.
From the research literature, the exclusion of resource factors does not fully reflect the characteristics of agricultural development. Therefore, some scholars have included resource and environmental factors in the measurement models of agricultural productivity and used different methods to obtain green total factor productivity in agriculture [2,3,4]. For example, Tone (2003) [5] developed a standard DEA-SBM efficiency model that includes non-desired output, and after incorporating slack variables into the function, it could better correct the error problems of the general DEA model in radial and angular aspects. In their work on measuring total factor productivity (TFP) of Swedish pulp mills, Chung et al. (1997) [6] included, for the first time, pollution emissions as a non-desired output and developed the directional distance function (SBM). Based on this study, Kuosmanen (2013) [7] combined the strengths of DEA and SFA models to construct a stochastic semi-parametric data envelope model (StoNED) to analyse country-specific agricultural green productivity for the period 1990–2004, using OECD countries and selecting data on agricultural CO2 emissions, nitrogen stocks, and phosphorus stocks. Xiaocang Xu et al. (2020) attempted to incorporate environmental pollution into the framework of agricultural productivity analysis by using soil N2O emissions as an important variable with which to measure agricultural green total factor productivity (AGTFP) [8]. Dongdong Liu et al. (2020) used a super SBM model to calculate China’s carbon emission-based agricultural total factor productivity based on provincial agricultural panel data in China, and used kernel density estimation to examine its dynamic evolution [9]. Chen Yufeng et al. (2021) took carbon emissions and agricultural surface source pollution (ANSP) as non-expected outputs, used a three-stage data envelopment analysis (DEA) method combined with an SBM model to remove the effects of environmental factors and random errors, explored the true AGTFP of 30 Chinese provinces from 2000 to 2017, and further explored the spatial distribution and dynamics of AGTFP before and after adjustment to seek the reasons behind it [10]. Chen Yanling et al. (2022) used the recent 15-year provincial panel SBM-ML index method to measure agricultural productivity from the perspective of environmental constraints with agricultural surface source pollution as a non-desired output, and a dynamic panel regression model was used to empirically analyse the factors affecting agricultural productivity [11]. Huang Xiuquan et al. (2022) constructed two different data envelopment analysis models, combining the green Luenberger productivity indicator (GLPI), a two-year weight-corrected Russell model, and a two-year bounded adjustment model to measure AGTFP in China and decompose AGTFP growth at both the production and factor levels to examine its drivers [12]. Based on panel data from 2001 to 2019 for 30 Chinese companies, Zhu Yingyu et al. (2022) measured the green total factor productivity of China’s plantation industry based on the net carbon sink using stochastic frontier analysis with an output-oriented distance function, and empirically investigated the impact of agricultural mechanisation on the green total factor productivity [13]. Yuanxin Peng et al. (2022) used the Malmquist index, spatial autocorrelation analysis, and convergence analysis to analyse the GTFP of 263 prefecture-level and above cities in China [14]. Zhang Yanan et al. (2022) measured green total factor productivity in the Huaihe Economic Zone based on the carbon cycle in the period 2004–2017, and used a spatial Durbin model to analyse the effects of seven variables on green total factor productivity, including the level of economic development, environmental regulation, R&D level, and openness to the outside world [15]. Yining Zhang et al. (2022) measured green total factor productivity in the Chinese manufacturing industry using the Malmquist–Luenberger (ML) model based on provincial panel data from 2008 to 2017, and further constructed an empirical model to analyse the impact mechanism of green total factor productivity [16]. Fang Lan et al. (2022) used the SBM-GML index model to measure agricultural green total factor productivity based on provincial panel data in China from 2002 to 2015, and systematically examined the impact of crop insurance on agricultural green total factor productivity and its mechanism of action [17].
A number of scholars have conducted in-depth studies on the analysis of the spatial interaction of green total factor productivity in agriculture. Fredriksson and Millimet (2002) [18] were the first to study the spatial spillover effects of government policies that could lead to inter-regional resource flow mechanisms and scalar competition mechanisms [19]. Due to the spatial scale of agricultural green total factor productivity interactions, governments tend to weaken the intensity of local environmental regulations for the purpose of attracting competing high-quality agricultural production factors, thus triggering the phenomenon of bottom-up racing for environmental quality between regions [20]. In contrast, some studies have argued that quality agricultural resources have a higher demand for the environment and that there is also a race to the top in inter-regional agricultural development [21]. As a result, agricultural green total factor productivity is networked at a spatial scale and in turn influences the green economic efficiency of regions due to cooperative or competitive strategies between local governments [22]. Zhangqi Zhong et al. (2019) used data envelopment analysis to construct a spatial panel data model with embedded climate change factors to measure agricultural total factor productivity in China, and then explored the possible impact of climate change on agricultural total factor productivity in provincial regions of China [23]. Wang Haoran et al. (2020) used stochastic frontier analysis, the Malmquist index, and the spatial Durbin model to examine the spatial effects of green technology innovation on green total factor productivity from a regional perspective [24]. Zhang Xueyao et al. (2021) used ICT and panel spatial measurement (PSM) models to measure the overall characteristics, temporal changes, and regional differences in agricultural development in 30 Chinese provinces from 2000 to 2019 from the perspective of resources and environment, and constructed a panel data measurement model using generalised least squares to analyse the main factors affecting performance development [25]. Xingming Li et al. (2022) used a data envelopment analysis (DEA) model and the Malmquist–Luenberger (ML) index to measure China’s tourism GTFP from 2007 to 2018 and analyse spatial and temporal differences [26]. Huaping Zhang et al. (2022) established an assessment index system (AIS) for GTFP, and used the EBM model to calculate the GTFPs of 30 Chinese provinces from 2000 to 2019. They analysed the spatial correlation between the GTFPs of each province and discussed the convergence between them using spatial panel data [27]. Shiying Hou et al. (2022) used a spatial econometric model to investigate the spatial effects of market integration on regional green total factor productivity and the transmission mechanism by calculating the Malmquist–Luenberger index based on panel data of 30 Chinese provinces from 2008 to 2017 [28]. Qiang Li et al. (2022) used a slack metric-based data envelopment analysis (DEA-SBM) super-efficiency model to measure agricultural environmental total factor productivity (ETFP) in 30 provinces and regions in China. Based on the measurement results, the impact of the urban–rural income gap on agricultural ETFP was empirically tested using a spatial autoregressive (SAR) model and estimation methods [29].
However, an analysis of the existing literature reveals two points. Firstly, from the perspective of research objects, most of the existing studies have been conducted on green total factor productivity and agricultural total factor productivity, while few studies have been conducted on agricultural green total factor productivity. Secondly, from the perspective of research methods, most of the existing studies have used time series models, panel models, and spatial econometric models, while few studies have used social network models. In comparison with other methods, the use of social network models can both portray the spatial structure of green total factor productivity in agriculture in a given period and better analyse the evolutionary trends of green total factor productivity in agriculture in different time dimensions, with a variety of advantages applicable to the study. Therefore, there is a need to focus on green total factor productivity in agriculture and to combine research methodological innovations to examine a country’s development from a spatial dynamic evolutionary perspective. Indeed, given the spatial spread and interaction of policies and factors, the assessment of agricultural green total factor productivity of a given region cannot be undertaken in isolation, but must take into account both its own efficiency and the role of the efficiency of other regions in the local context, i.e., the region must be analysed in the context of a network formed by links with other regions. Social network analysis (SNA) is a powerful tool for studying social phenomena and structures, based on a “relational” perspective, which can better reflect the relative position and network characteristics of a province in a nationwide network of agricultural green total factor productivity [30]. Therefore, in this paper, we propose to use social network analysis to measure the overall profile of agricultural green total factor productivity in China and the position of each province in the network. On this basis, the VAR impulse response function (IRF) is applied to further examine how agricultural green total factor productivity in a particular region is affected by other regions, considering the economic linkages between the three major regions of China: north and south, central, and east and west (eastern provinces include Beijing, Tianjin, Hebei, Liaoning, Shanghai, Jiangsu, Zhejiang, Fujian, Shandong, and Guangdong; central provinces include Shanxi, Jilin, Heilongjiang, Anhui, Jiangxi, Henan, Hubei, and Hunan; western provinces include Inner Mongolia, Guangxi, Chongqing, Sichuan, Guizhou, Yunnan, Shaanxi, Gansu, Qinghai, Ningxia, and Xinjiang). The VAR impulse response function (IRF) is used to further examine how the green total factor productivity of agriculture in a given region is affected by other regions. The research in this paper is based on the following hypotheses: in the development of a market economy, due to the profit-seeking motive of enterprises, the allocation of resources and factors, etc., between regions is inevitable, so the magnitude of agricultural green total factor productivity in a region will not only be influenced by the development of the local economy, but also, in the long run, will be increasingly influenced by other regions, especially geographically adjacent regions. The research methods are based on the more scientific slack-based model (SBM) global Malmquist–Luenberger (GML) index to measure the green total factor productivity of agriculture in China’s provinces, and the innovative use of social network analysis (SNA) to examine the spatial linkages and network structure of green total factor productivity in China’s agriculture. Furthermore, a vector autoregressive model (VAR) impulse response function (IRF) was used to analyse the regional interaction of green total factor productivity in China’s agriculture. The aim of this paper is to establish a social network-based analytical framework through a systematic analysis of the spatial structure, dynamic evolution, and regional interaction of agricultural green TFP in China, in which it is possible to study the open economic linkages of a region at a spatial scale while taking into account developments over time, and in doing so, stimulate the thinking of policy makers.

2. Measurement of Agricultural Green Total Factor Productivity in China

2.1. Methodology for Measuring Agricultural Green Total Factor Productivity

Following Tone (2003) [5] and OH (2010) [31], the results of the GML index measure of the SBM model were used to characterise the green total factor productivity of agriculture in each province. It is assumed that there exist n decision unit production systems, and the decision units all consist of input, desired output, and non-desired output input-output vectors, with input m units obtaining S1 desired output and S2 non-desired output. Based on the production possibility set, the SBM model of green total factor productivity in agriculture in period i in region m is developed.
ρ * = min 1 m i = 1 m x ¯ i x i 0 1 S 1   +   S 2 ( r = 1 S 1 y ¯ r g y r 0 g + r = 1 S 2 y ¯ r b y r 0 b ) , s . t . { x ¯ j = 1 , k n θ j x j y ¯ g j = 1 , k n θ j y j g y ¯ b j = 1 , k n θ j y j b x ¯ x 0 , y ¯ g y 0 g , y ¯ b y 0 b , y ¯ g 0 , θ 0
x R m , y g R S 1 , y b R S 2
X = [ x 1 , x 2 , , x n ] R m × n , Y g = [ y 1 g , y 2 g , , y n g ] R S 1 × n , Y b = [ y 1 b , y 2 b , , y n b ] R S 2 × n
The SBM model is based on the assumption of constant size; S = ( S , S g , S b ) represents the input, desired, and undesired output slack; and the objective function value ρ* characterises the efficiency value of the decision unit.
The mathematical expression for the GML index is:
G M L t , t + 1 = 1 + D o G ( x t , y t , b t ; y t , b t ) 1   +   D o G ( x t + 1 , y t + 1 , b t + 1 ; y t + 1 b t + 1 ) = 1   +   D o G ( x t , y t , b t ; y t , b t ) 1   +   D o G ( x t + 1 , y t + 1 , b t + 1 ; y t + 1 b t + 1 ) × 1   +   D o G ( x t , y t , b t ; y t , b t ) / 1   +   D o G ( x t , y t , b t ; y t , b t ) 1   +   D o G ( x t + 1 , y t + 1 , b t + 1 ; y t + 1 b t + 1 ) / 1   +   D o G ( x t + 1 , y t + 1 , b t + 1 ; y t + 1 b t + 1 ) = E C t , t + 1 × T C t , t + 1
The GML index can be decomposed into technical efficiency (EC) and technical progress (TC), where x, y, b, and t denote input, desired output, undesired output, and time, respectively. D o G ( x t , y t , b t ; y t , b t ) and D o G ( x t + 1 , y t + 1 , b t + 1 ; y t + 1 , b t + 1 ) denote the efficiency values of the decision unit in period t and period t + 1, respectively.
In the agricultural green total factor productivity measurement, the input factors include seven indicators: labour, cultivated area, farm machinery, fertiliser application (discounted amount), agricultural irrigation area, agricultural film coverage area, and pesticide application. The desired outputs are agricultural output value and agricultural carbon sequestration, which mainly include crop types such as rice, wheat, maize, beans, potatoes, peanuts, rapeseed, sugar cane, cotton, melons, and vegetables. Non-desired outputs comprise the sum of carbon emissions from fertiliser, agriculture, mulch, diesel and irrigation, soil N2O emissions (converted to CO2), livestock carbon emissions, and paddy CH4 emissions (converted to CO2). In consideration of data availability, the study was conducted in 30 provincial-level regions in China (Hong Kong, Macao, Taiwan, and Tibet were not considered due to missing data), and the study interval was from 2008 to 2019.The research data in this paper were obtained from the China Statistical Yearbook, China Environmental Statistical Yearbook, China Rural Statistical Yearbook, China Agricultural Yearbook from 2009 to 2020, and the EPS data platform (https://www.epsnet.com.cn, accessed on 9 February 2022).

2.2. Analysis of the Results of Agricultural Green Total Factor Productivity in China

The results of the agricultural green total factor productivity measurement for each province in China based on the SBM-GML are reported in Table 1 and Figure 1. In terms of province comparison, the top five provinces in terms of average agricultural green total factor productivity from 2008 to 2019 are Zhejiang (1.049), Jiangxi (1.044), Fujian (1.039), Hunan (1.037), and Chongqing (1.035), mainly in the central and western regions, while the bottom five provinces are Hainan (0.999), Guangxi (1.0003), Xinjiang (1.0005), Qinghai (1.005), and Shaanxi (1.008), mainly in the western region. In terms of regional comparison, the average values of agricultural green total factor productivity in China’s southern provinces in 2008, 2015, and 2019 were 1.053, 1.011, and 1.061, respectively, while the average values of agricultural green total factor productivity in northern provinces were only 1.036, 0.985, and 1.035 respectively, showing a certain gap with the southern regions in different years. Figure 2 shows that the south was higher than the north in 8 of the 12 years analysed, accounting for 66.7% of the total years, which is in line with the above view. When analysed in terms of kernel density, we found that the peak value of agricultural green total factor productivity in the south (about 1.02) is lower than that in the north (about 1.03), but the concentration is higher than that in the north, indicating that the distribution of the quality of agricultural green development in the north is more dispersed and the development differences between different provinces are more obvious than in the south.

3. Spatial Structure Portrayal of Agricultural Green Total Factor Productivity in China

3.1. Spatial Network Construction Model of Agricultural Green Total Factor Productivity

3.1.1. Gravitational Model

On a spatial scale, different regions gradually form a network structure of links through interaction. Drawing on the gravitational model of physics, a basic gravitational model of inter-regional economic linkages is formed, with the expression generally expressed as:
P i j = P i · G i × P j · G j D i j 2
where Pij denotes the economic attractiveness of region i to j; Pi, Pj and Gi, Gj denote the population size and economic volume of regions i and j, respectively; and Dij denotes the geographical distance between the two places. The distance of each province in this paper is measured by the latitude and longitude of the provincial capital city.
Since this formula only characterises the single linkage between regions and lacks consideration of the two-way linkage between regions, the traditional gravity model is improved by combining the actual characteristics of the spatial structure of total factor productivity in China’s agricultural environment to form a new gravity model expression:
R i j = a i j × P i · G i × P j · G j D i j 2 , a i j = G B R i G B R j
where Rij denotes the influence of the agricultural green total factor productivity of region i on the agricultural green total factor productivity of region j. Gi, Gj denote the agricultural green total factor productivity of regions i and j, respectively. aij denotes the contribution of region i to Rij as measured by the general budget revenue (GBR) ratio of region i and region j.

3.1.2. Network Density Model

Network density is a measure of the spatial interaction between regions and is positively correlated with the closeness of regional ties, characterised by the ratio of the “total number of actual relationships” to the “theoretical maximum number of relationships” between regions, as expressed in the equation:
ρ = L N ( N 1 )
where ρ denotes the density, L denotes the total number of relationships actually present, and N denotes the number of regions.

3.1.3. Network Centrality Model

One of the most important tools for characterising the local features of a network is centrality analysis, which measures the centrality of a local region in the overall network and consists of two main types of metrics: point centrality and centrality potential. Point centrality is divided into point-in centrality and point-out centrality, where point-in centrality measures the ability of a particular region to receive influence from other regions and point-out centrality measures the ability of a particular region to influence other regions. The equation is described as:
C i n = j = 1 , j 1 N Q i j N 1
C o u t = j = 1 , j 1 N Q j i N 1
where Cin and Cout denote point-in centrality and point-out centrality, respectively; Qij and Qji denote the strength of the connection between regions i(j) and j(i) of the two nodes, respectively; and N denotes the number of regions.
In contrast to point degree centrality, point degree centrality potential indicates the concentration of nodes in a social network and characterises the central tendency of the social network. The equation is described as:
C i n = i = 1 N ( C max C 1 ) max [ i = 1 N ( C max C i ) ]
where C denotes the point degree centrality potential, Cmax denotes the social network centrality maximum, and Ci denotes the regional centrality of each node.

3.2. Overall Characteristics of the Spatial Network of Agricultural Green Total Factor Productivity in China

The NetDraw function of Ucinet software was used to draw the spatial structure of the Chinese agricultural green total factor productivity network (Figure 3), with nodes and directed line segments representing the direction and intensity of environmental information interactions between provinces of China, respectively. Based on this, the network density of green total factor productivity in Chinese agriculture was measured and collated in Table 2.
The results show that the network density of green total factor productivity in agriculture exhibited an increasing trend from 2008 to 2019 after the matrix was processed and measured using four methods with mean cut-off values of 10, 50, and 100. Numerically, the network density increased from 155.66, 0.894, 0.667, and 0.452 in 2008 to 163.40, 0.917, 0.689, and 0.463 in 2019, equal to increases of 7.74, 0.023, 0.022, and 0.011, respectively, in 11 years, representing year-on-year increases of 4.97%, 2.57%, 3.30%, and 2.43%, respectively. This indicates that the regional interaction of green total factor productivity in China’s agriculture is growing stronger and a spatial network structure is taking shape. With the increasing improvement in the national system of incentives for green agricultural production and the wider application of information technology, the spatial interaction and dependence of green total factor productivity in agriculture among China’s regions is also increasing.

3.3. Centrality Characteristics of Agricultural Green Total Factor Productivity in China

To reflect the changes in the status of different Chinese provinces in the agricultural green total factor productivity network, the provinces were ranked according to the values based on the measured network point-out and network point-in degrees, and the results are shown in Table 3. On the whole, the top 10 provinces do not change significantly in terms of either network point-out or network point-in, indicating that China’s agricultural green total factor productivity network has certain characteristics of self-stability. From the perspective of network point-out, Guangdong, Jiangsu, Shandong, and Zhejiang, as large economic provinces, have always ranked among the top provinces in China, leading the country in terms of agricultural green economy efficiency. From the perspective of network point-in degree, provinces such as Qinghai, Ningxia, and Gansu rank high. Data show that the average values of total factor productivity of the agricultural environment in Qinghai, Ningxia, and Gansu in 2008, 2015, and 2019 are only 1.005, 0.927, and 1.049, respectively, which are mainly driven by the demonstration of the eastern coastal region in the process of green agricultural development.
In order to characterise the regional linkages as a whole, the network centrality of the spatial linkages of agricultural green total factor productivity from 2008 to 2019 was calculated (Table 4), and the results show that the network point-in and network point-out centrality exhibit “V”-shaped and inverted “V”-shaped paths from 2008 to 2019, respectively. The results show that from 2008 to 2019, the network entry degree centrality and the network exit degree centrality exhibit “V”-shaped and inverted “V”-shaped paths, respectively. The point-out centrality increased from 30.57% in 2008 to 38.70% in 2015 and then decreased to 30.69% in 2019, indicating that the total factor productivity of China’s agricultural environment has undergone an evolutionary path from polycentric to monocentric to polycentric conditions, and that the provinces in China have basically formed a positive interaction pattern of competing for upward mobility in improving the efficiency of the agricultural green economy. The point-in centrality declined from 16.69% in 2008 to 13.47% in 2015 and then to 14.18% in 2019. Since the financial crisis in 2008, due to the unfavourable economic situation, the circulation of domestic agricultural products has been reduced, causing a shock to the environmental economic efficiency at the agricultural production end. However, as China has the advantage of a mega market and the potential of domestic demand, the resilience of green agricultural development has gradually increased, and the spatial interaction of China’s agricultural green total factor productivity will continue to strengthen as the national strategy of revitalising the countryside and building a new development pattern progresses.

3.4. Analysis of Cohesive Subgroups of Agricultural Green Total Factor Productivity in China

Cluster analysis was conducted using the iterative correlation convergence (CONCOR) method and the results are shown in Figure 4 and Table 5. The cohesive subgroups of China’s agricultural green total factor productivity from 2008 to 2019 are divided into four subgroups, with the subgroups in 2019 being (Beijing, Shanghai, Jiangsu, Guangdong, Shandong, Zhejiang), (Henan, Hebei, Sichuan), (Jiangxi, Anhui, Liaoning, Fujian, Hubei Shanxi, Tianjin, Hunan, Shaanxi), and (Jilin, Guangxi, Hainan, Chongqing, Heilongjiang, Guizhou, Yunnan, Inner Mongolia, Gansu, Qinghai, Ningxia, Xinjiang). Comparing regional disparities in the four cohesive subgroups in 2019 (Figure 5), there is a decreasing relationship in terms of agricultural green total factor productivity in the following order: third, second, fourth, and first subgroups. However, as shown in Table 5, the cohesive subgroups formed by China’s agricultural green total factor productivity do not differ significantly in different years, indicating that the internal structure of cohesive subgroups has some stability. Provinces with the same subgroup of agricultural green total factor productivity tend to be similar at the geographical or economic level, e.g., the first cohesive subgroup provinces are all located in eastern China, while the fourth cohesive subgroup provinces are mainly distributed in western China.
The results are reported in Table 6. In general, the density of cohesive subgroups of agricultural green total factor productivity in China shows a growing trend, indicating that the spatial interaction of different cohesive subgroups is strengthening, and that a national network structure of agricultural green development is being formed and optimised, which is of great value for cross-regional cooperation and industrial chain extension and integration in agriculture. In terms of the relationship between specific cohesive subgroups, the (Beijing, Shanghai, Jiangsu, Guangdong, Shandong, and Zhejiang) and (Jilin, Guangxi, Hainan, Chongqing, Heilongjiang, Guizhou, Yunnan, Inner Mongolia, Gansu, Qinghai, Ningxia, and Xinjiang) subgroups are the most closely linked, with the eastern provinces having more balanced development overall and advantages in terms of capital, technology, and human capital, while the western provinces, due to their soil, light, and other unique endowments, have natural complementarities with the eastern regions in the development of special agriculture and rural tourism. With the promotion of infrastructure and a rule-of-law business environment, both exogenous and endogenous transaction costs, which restrict industrial cooperation and factor flows, have dropped significantly, and cross-regional agricultural cooperation between the central and western regions, in the form of counterpart cooperation, has achieved satisfactory results.

4. Regional Interaction Analysis of Agricultural Green Total Factor Productivity in China

With the deepening and expansion of the market economy, the green development of regional agriculture is increasingly influenced by exogenous factors, superimposed on path-dependent effects, and the spatial correlation is constantly reinforced. However, it should be noted that it takes a long time for different regions to interact with each other and form a more stable spatial distribution pattern, i.e., spatial correlation must be analysed in a longer time dimension to be meaningful; therefore, spatial correlation analysis is not contradictory to the assumption that all DMUs should be independent in DEA analysis. In order to validate the spatial correlation of green total factor productivity in Chinese agriculture, we measured the global Moran I index (Moran’s I), whose mathematical expression is as follows.
M o r a n s   I = n i = 1 n ( Y i Y ¯ ) 2 i = 1 n j = 1 n W i j ( Y i Y ¯ ) ( Y j Y ¯ ) i = 1 n j = 1 n W i j
In the above equation, Y i and Y j denote the observed values of the examined indicators in regions i and j, respectively; n is the number of spatial cells; and W i j 
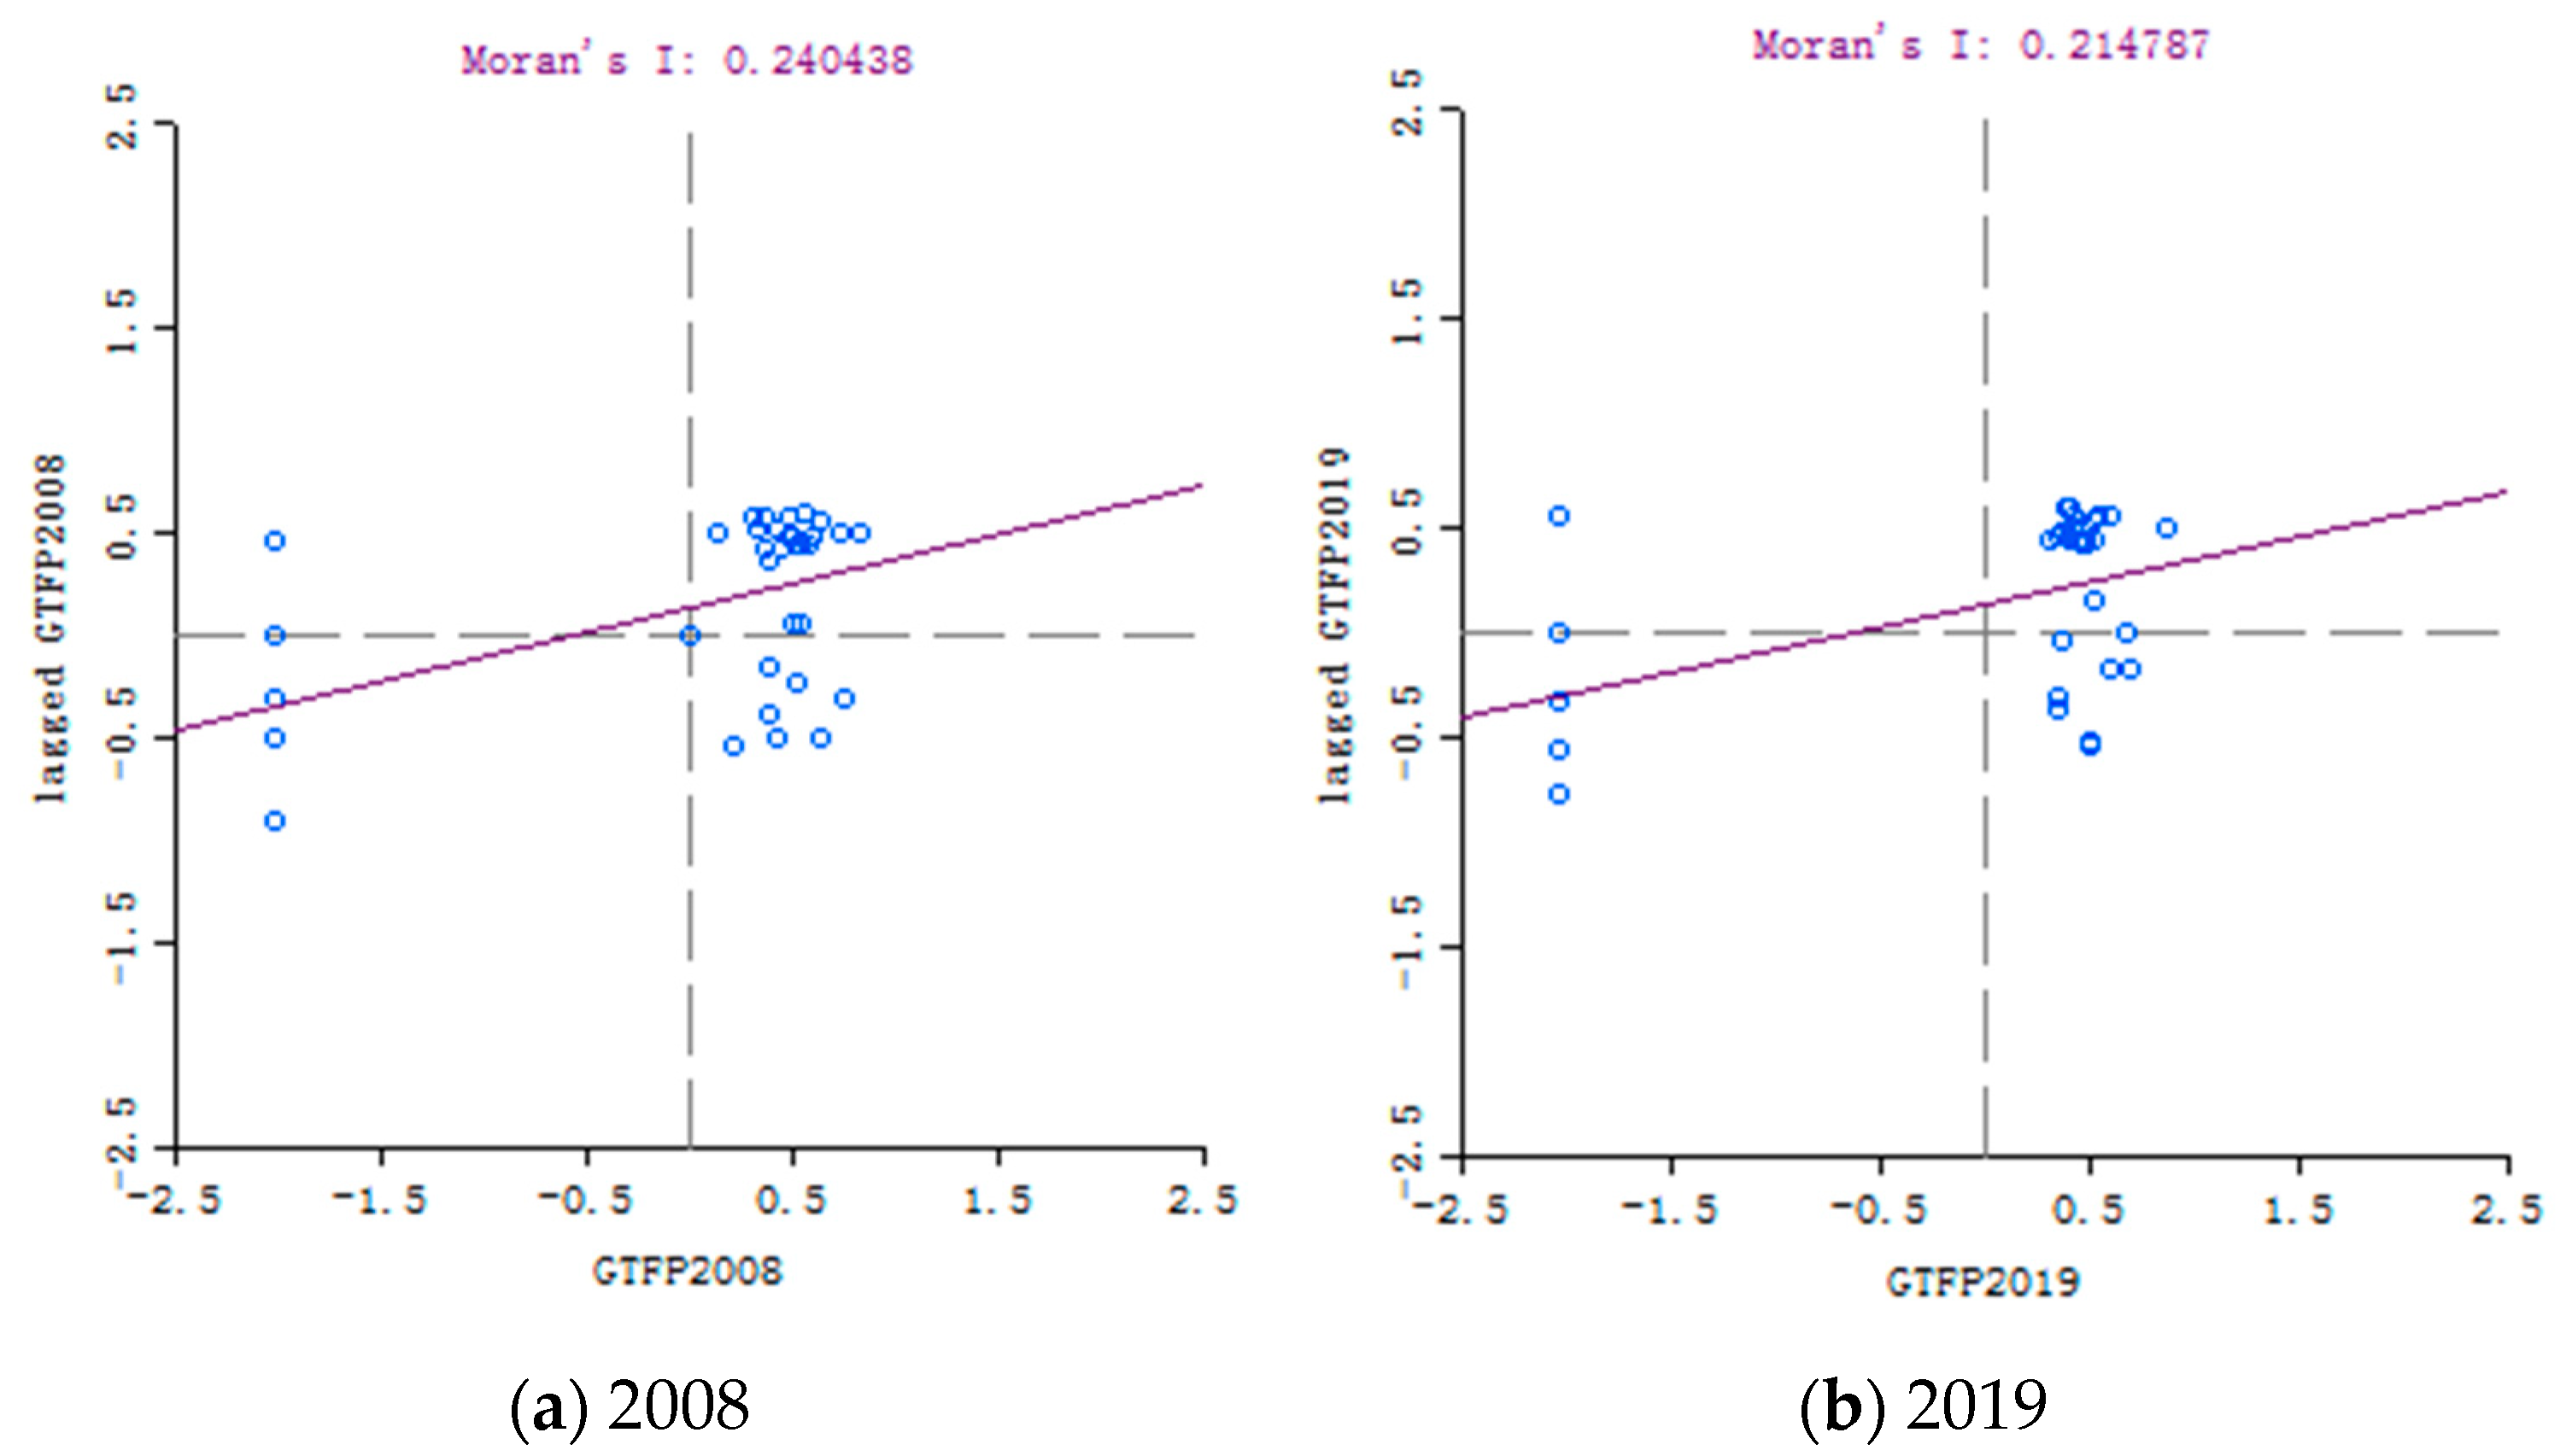
is the spatial weight matrix, which is used to measure the interrelationship between neighbouring regions. In this paper, we define the value of a regional neighbourhood as 1, otherwise the value is 0. Moran’s I takes values in the range [−1, 1], tends to −1 for negative spatial correlation, tends to 1 for positive spatial correlation, and equals 0 for no spatial correlation. We used OpenGeoDa software to create Moran scatter plots of China’s agricultural green total factor productivity in 2008 and 2019 (Figure 6), and the plots show that Moran’s I values in 2008 and 2019 are 0.2404 and 0.2148, respectively, which verifies the existence of the spatial correlation of China’s agricultural green total factor productivity.
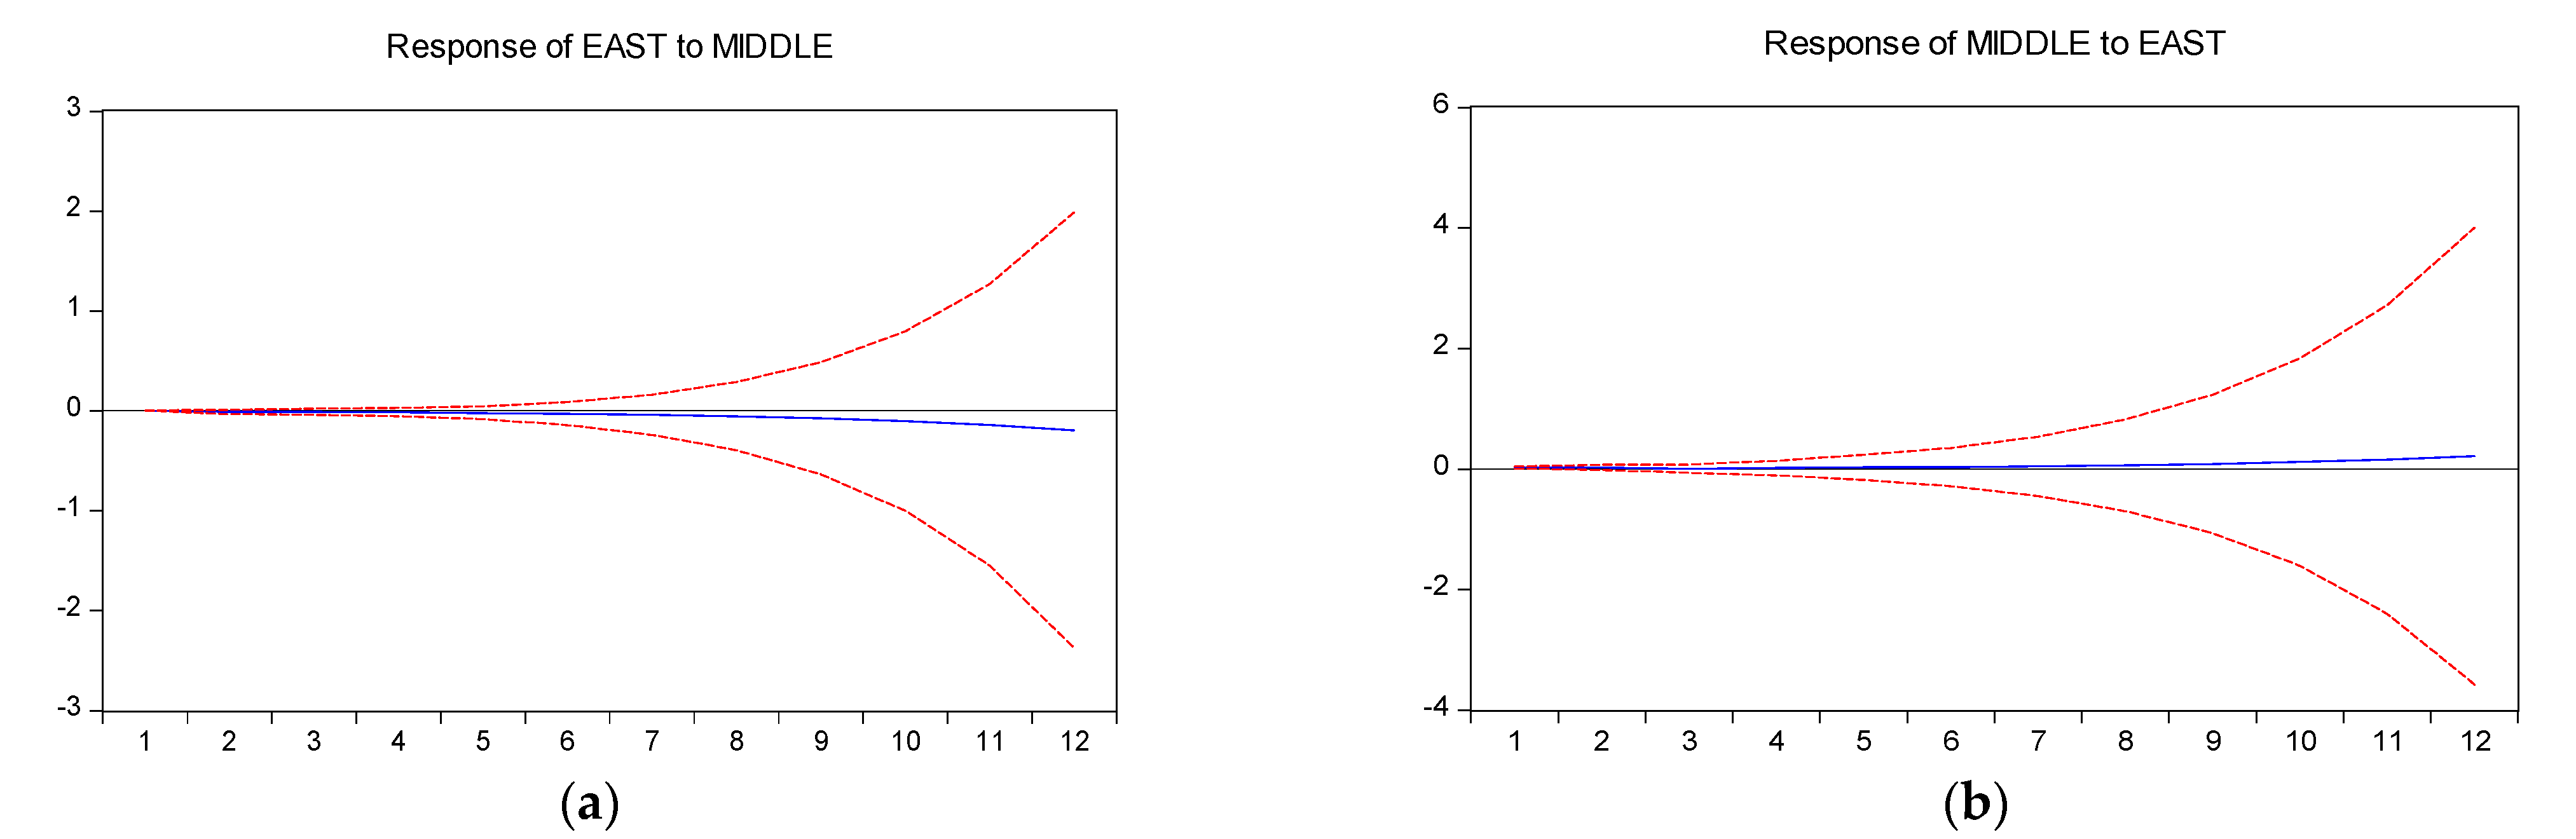
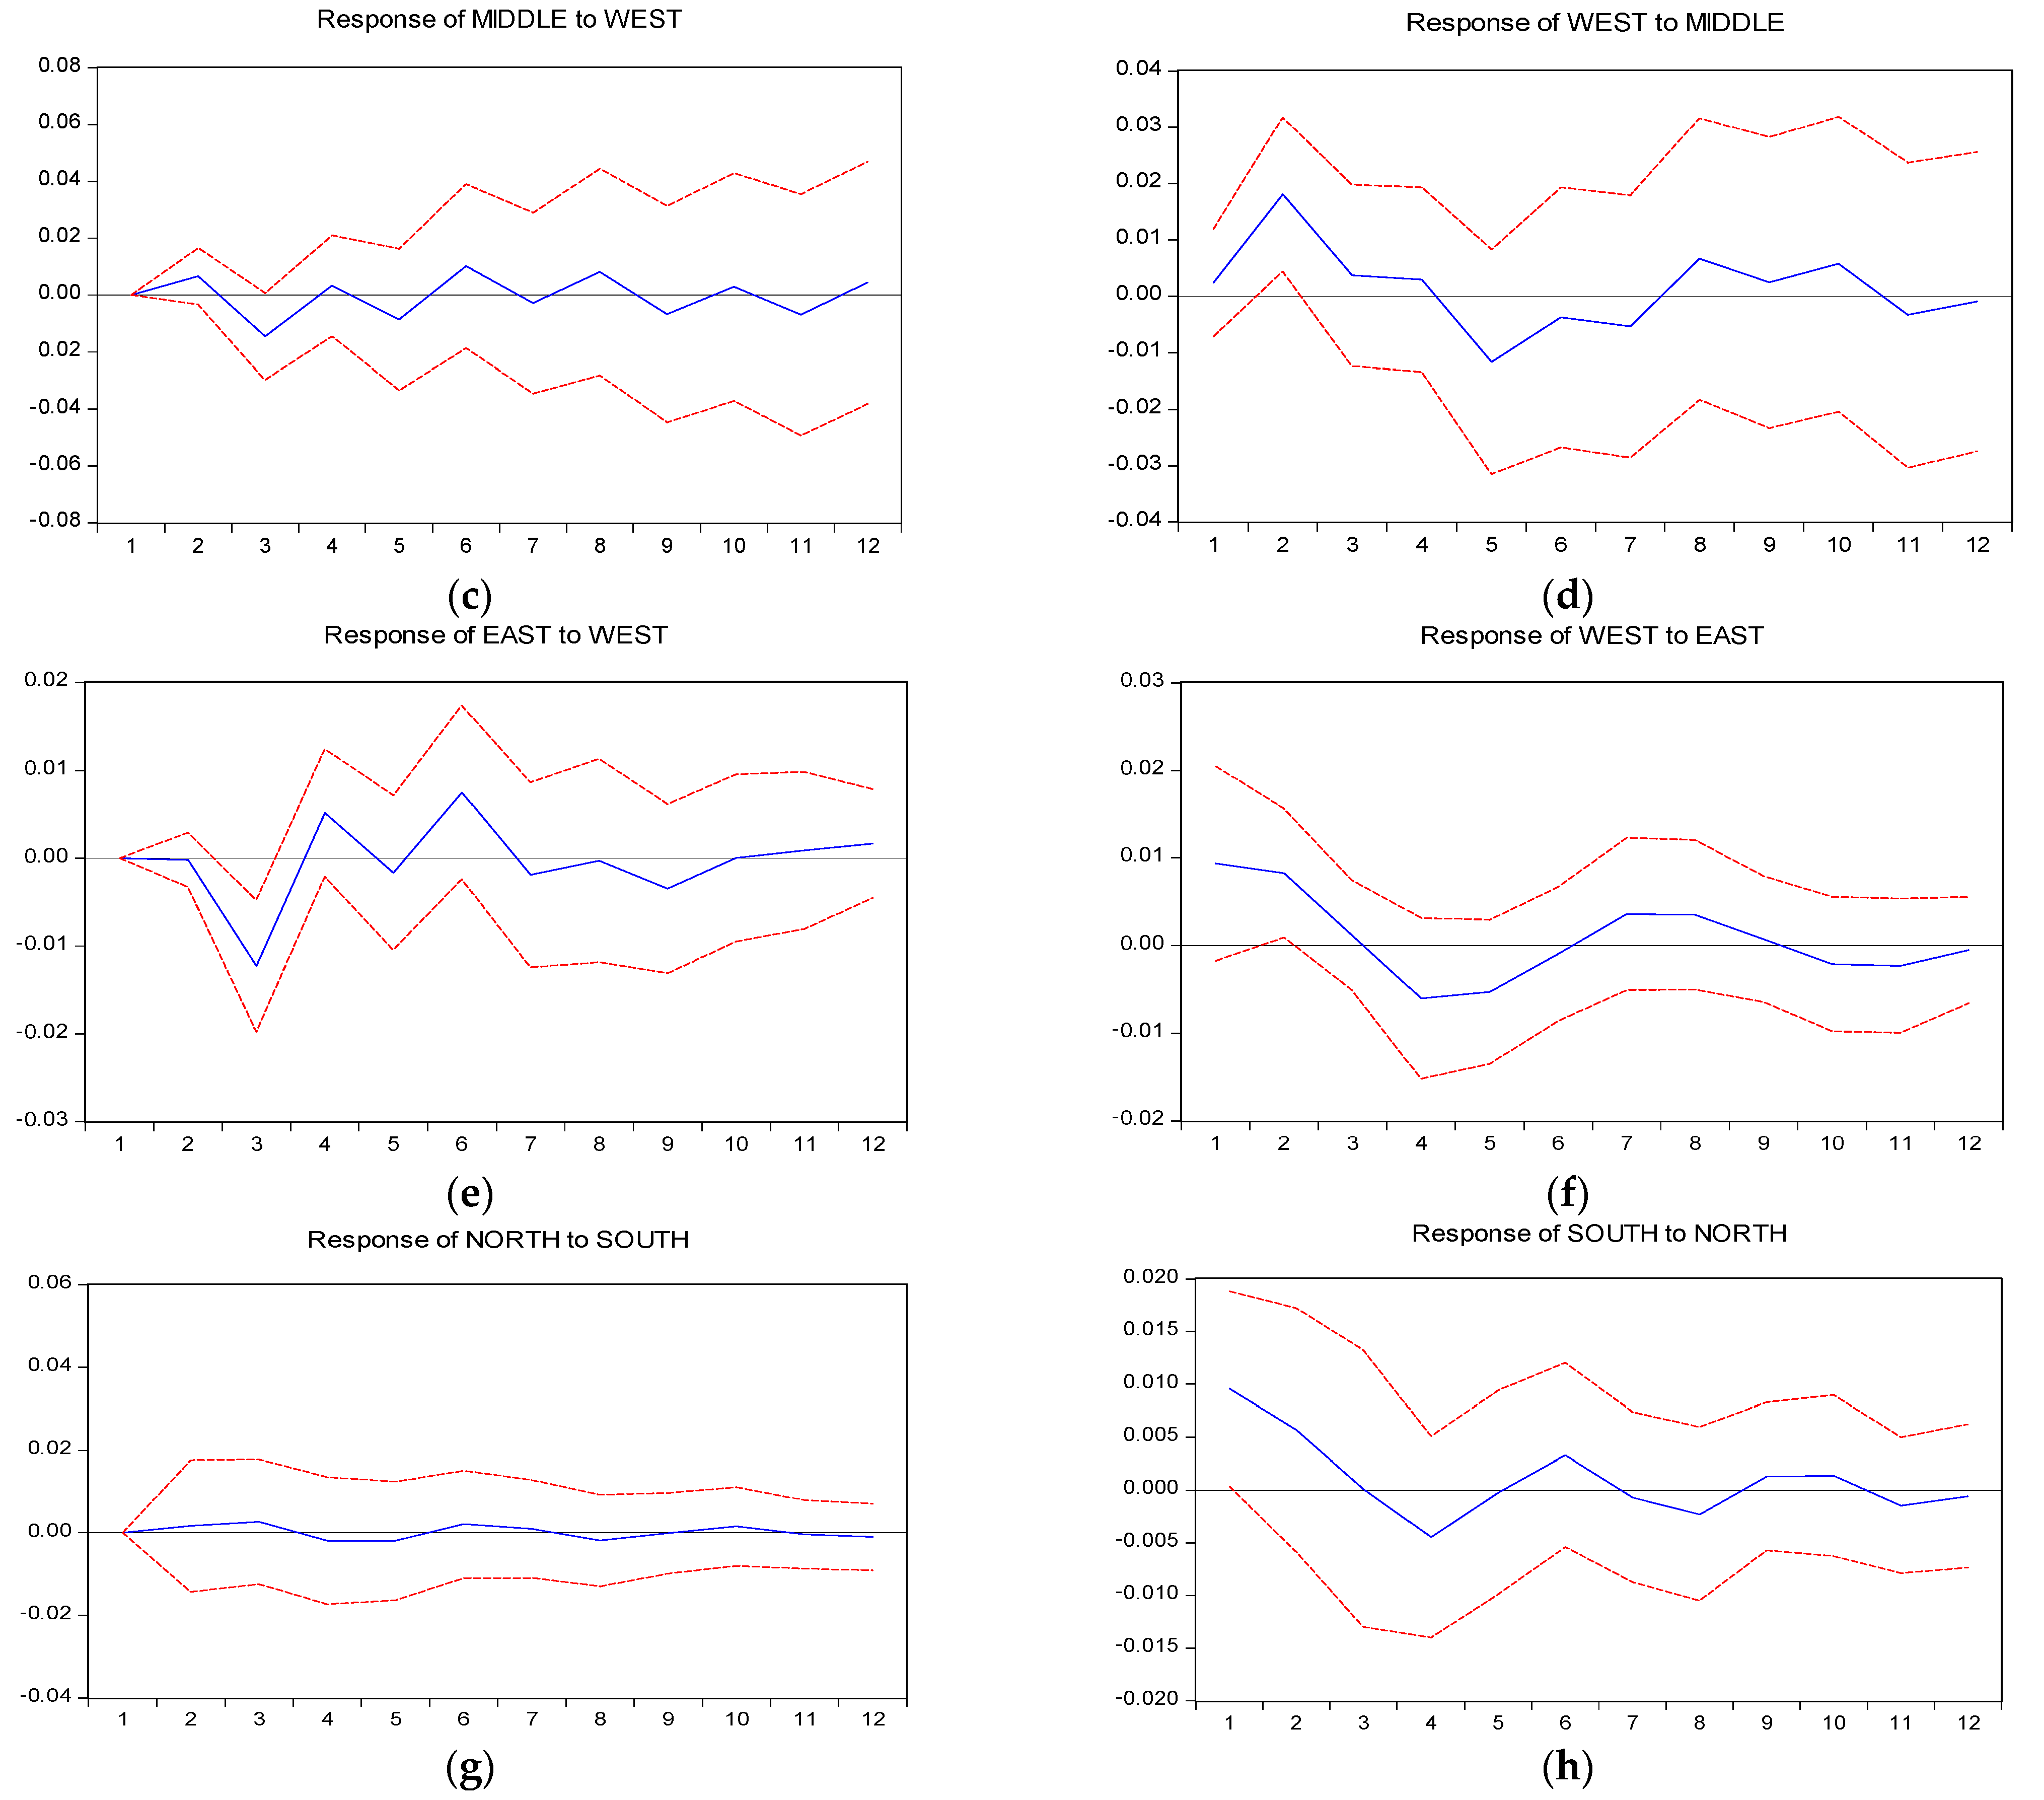
On the basis of spatial correlation analysis, considering regional heterogeneity, impulse response function (IRF) analysis was conducted by building a VAR model to further explore the regional interaction of green total factor productivity in agriculture in east, central, and west China, and in south and north China, resulting in the impulse response function composite plot reported in Figure 7, where the horizontal axis indicates the number of lag periods for the effect of shocks; the vertical axis indicates agricultural green total factor productivity; the solid line indicates the impulse response function, which represents the response of a particular region to a green agricultural efficiency shock from other regions; and the dashed line indicates the positive and negative two-times standard deviation bands.
For the analysis of image features, in terms of regional interactivity in the east, central, and west, and in the south and north, we found that the impulse response curves of east to central, west to central, and west to east showed roughly opposite trends, while the impulse response curves of west to central interaction showed roughly the same trend. This indicates that the interaction between the centre and the west and the east has generally improved agricultural green total factor productivity in the east, but has had an insignificant positive effect on agricultural green total factor productivity in the region, i.e., a significant siphon effect and a non-significant trickle-down effect. In contrast, the interaction between the central and western regions, with the direction of the impulse responses converging, indicates that the central region can also positively influence the efficiency of the agricultural green economy in the western region while improving its own agricultural green total factor productivity, showing a certain win-win pattern of agricultural development in the two regions. In terms of regional interaction between the south and the north, the intensity of the impulse response of the south to the north is much higher than that of the north to the south. On the one hand, this indicates that the south has a greater driving effect on the green total factor productivity of agriculture in the north, and on the other hand, it indicates that there is still a lack of innovative division of labour in agricultural development between the south and the north of China, and that the degree of industrial integration needs to be strengthened. Therefore, in order to further improve the overall level of agricultural green total factor productivity in China and optimise the cross-regional layout of agriculture, the next stage should focus on strengthening the rational allocation of factors and the division of labour between the middle and the west, the south, and the north.

5. Conclusions

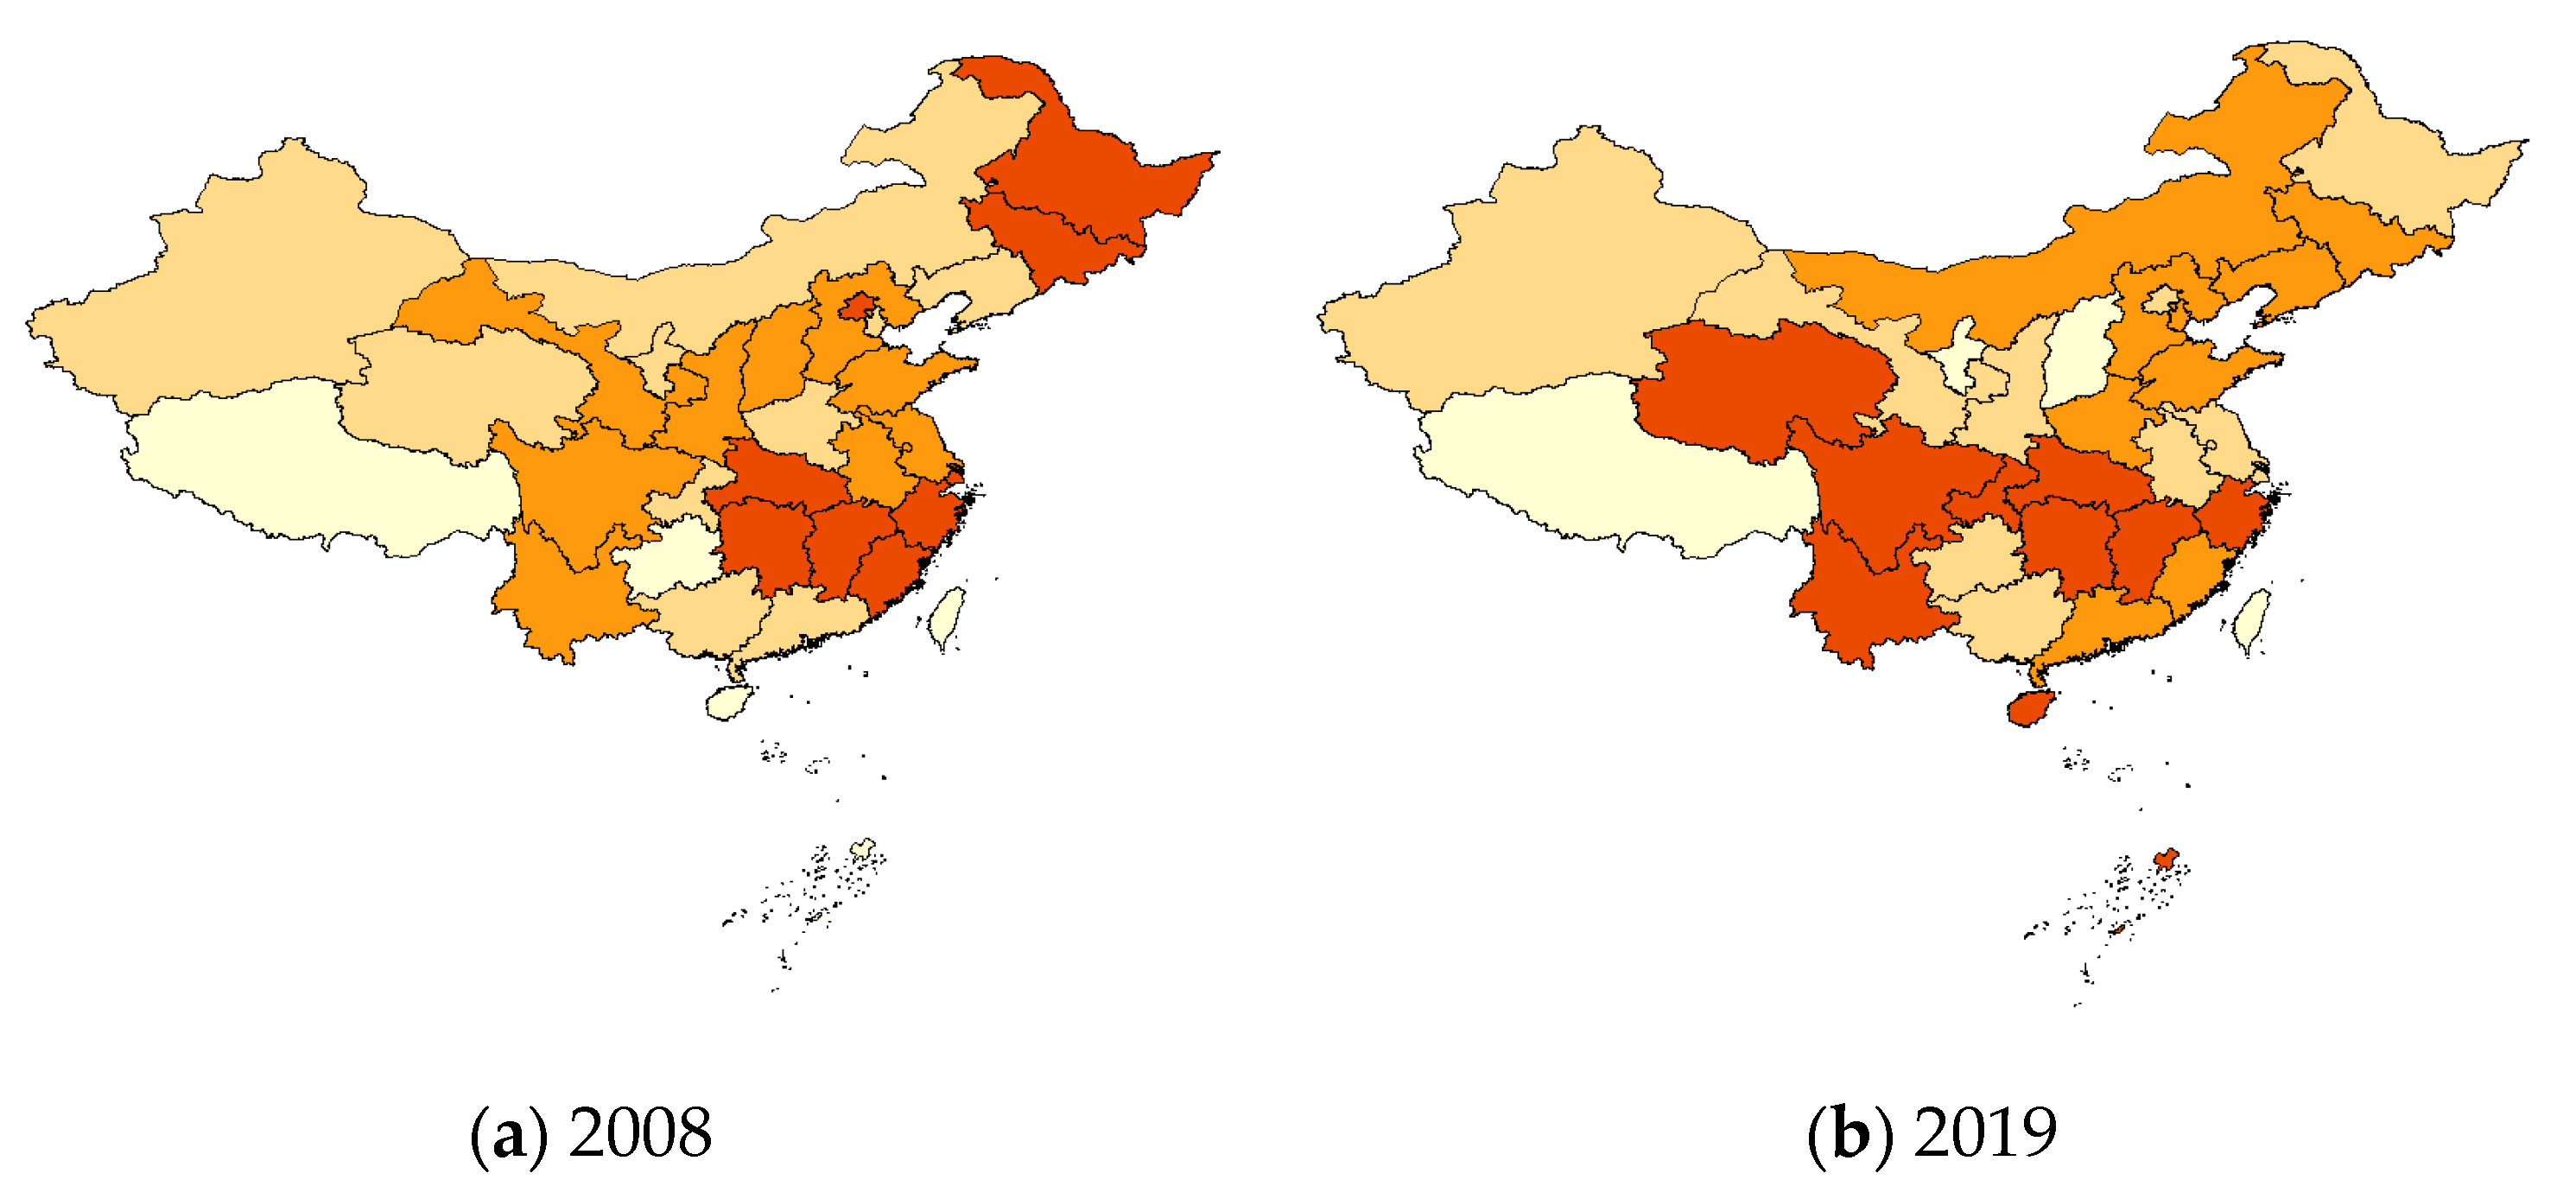
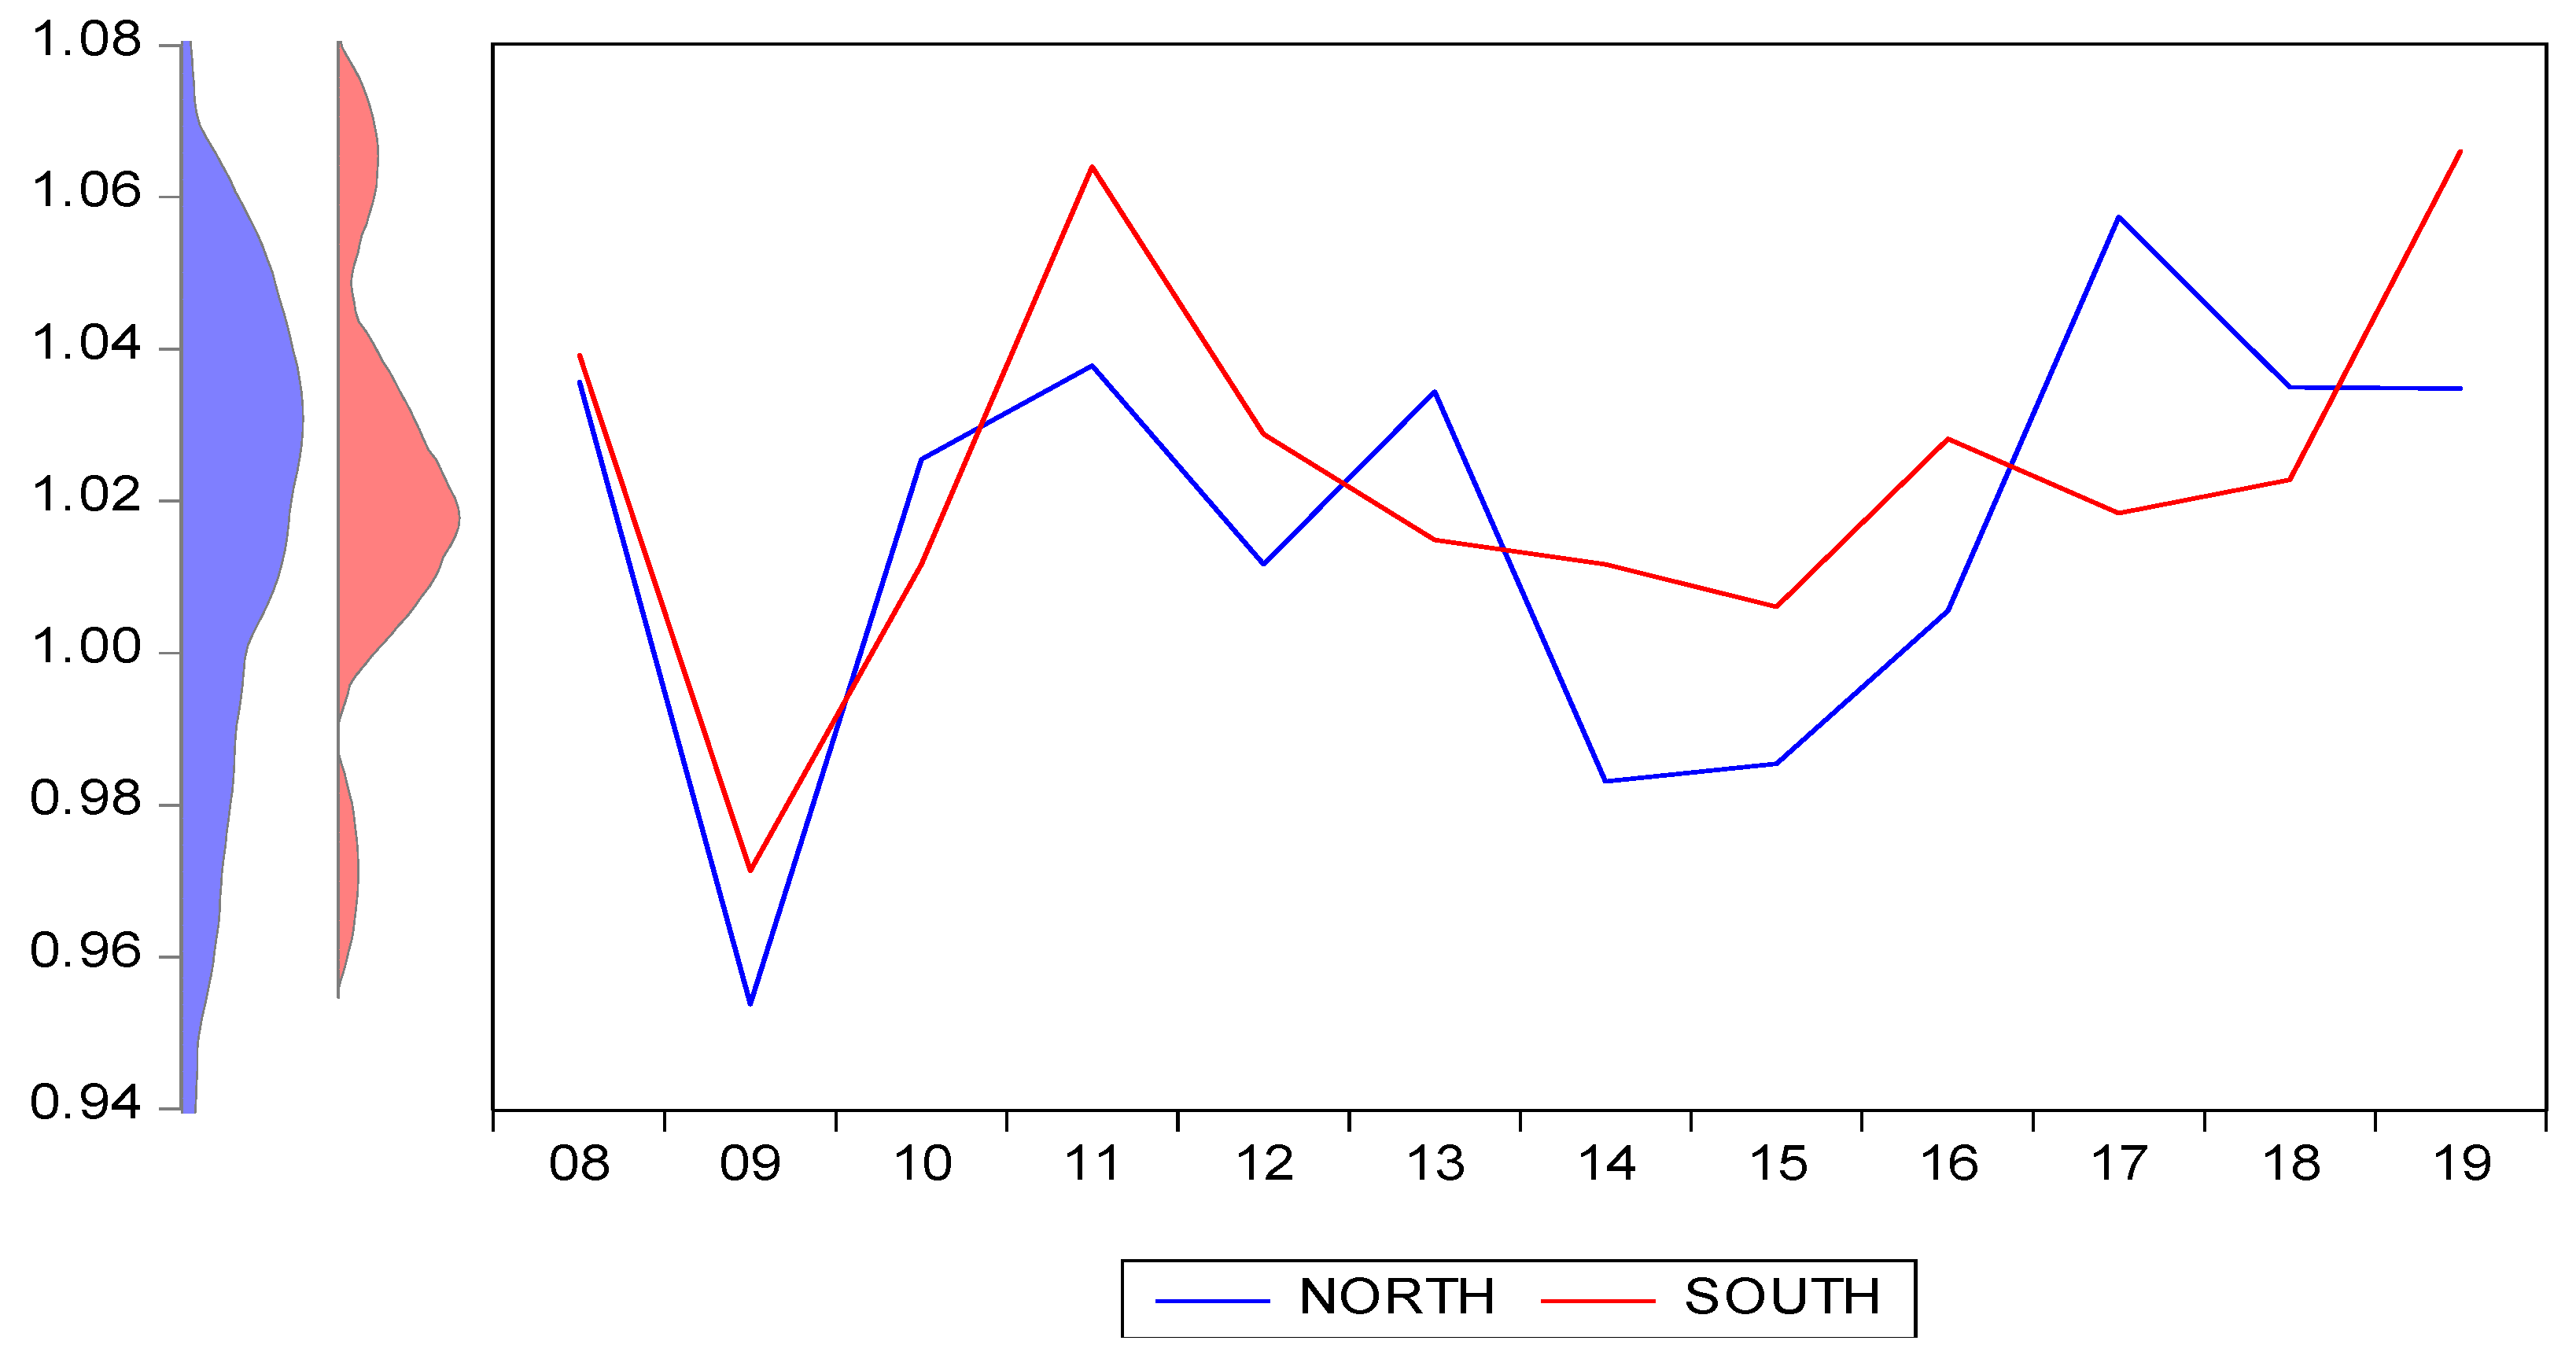
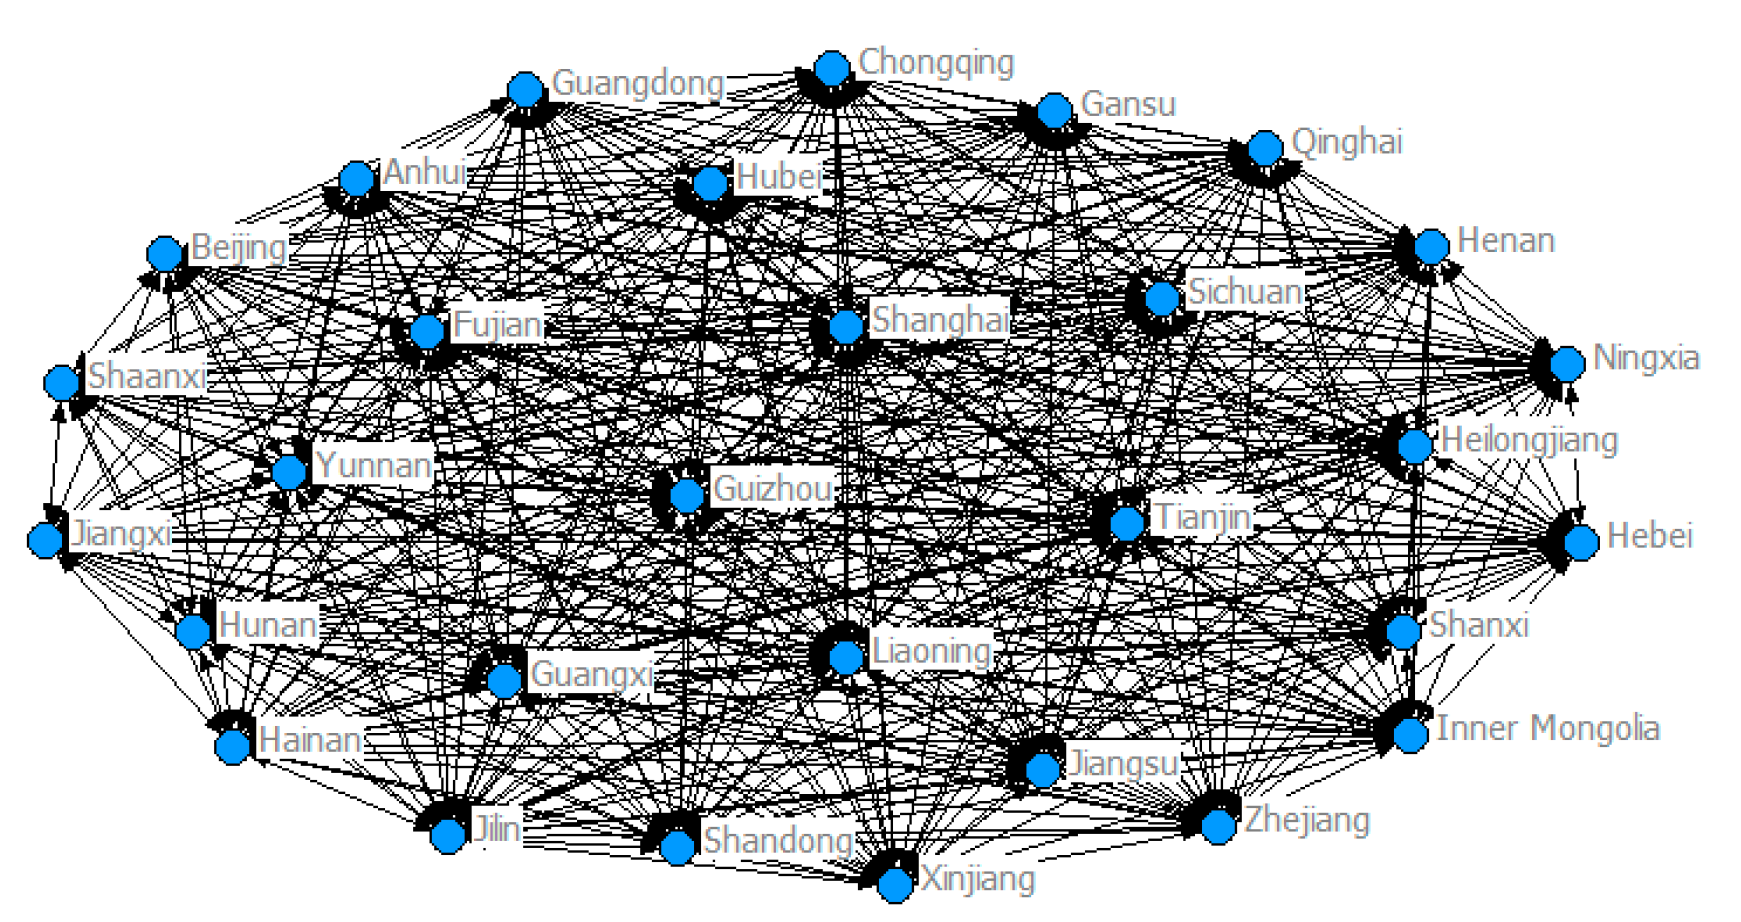
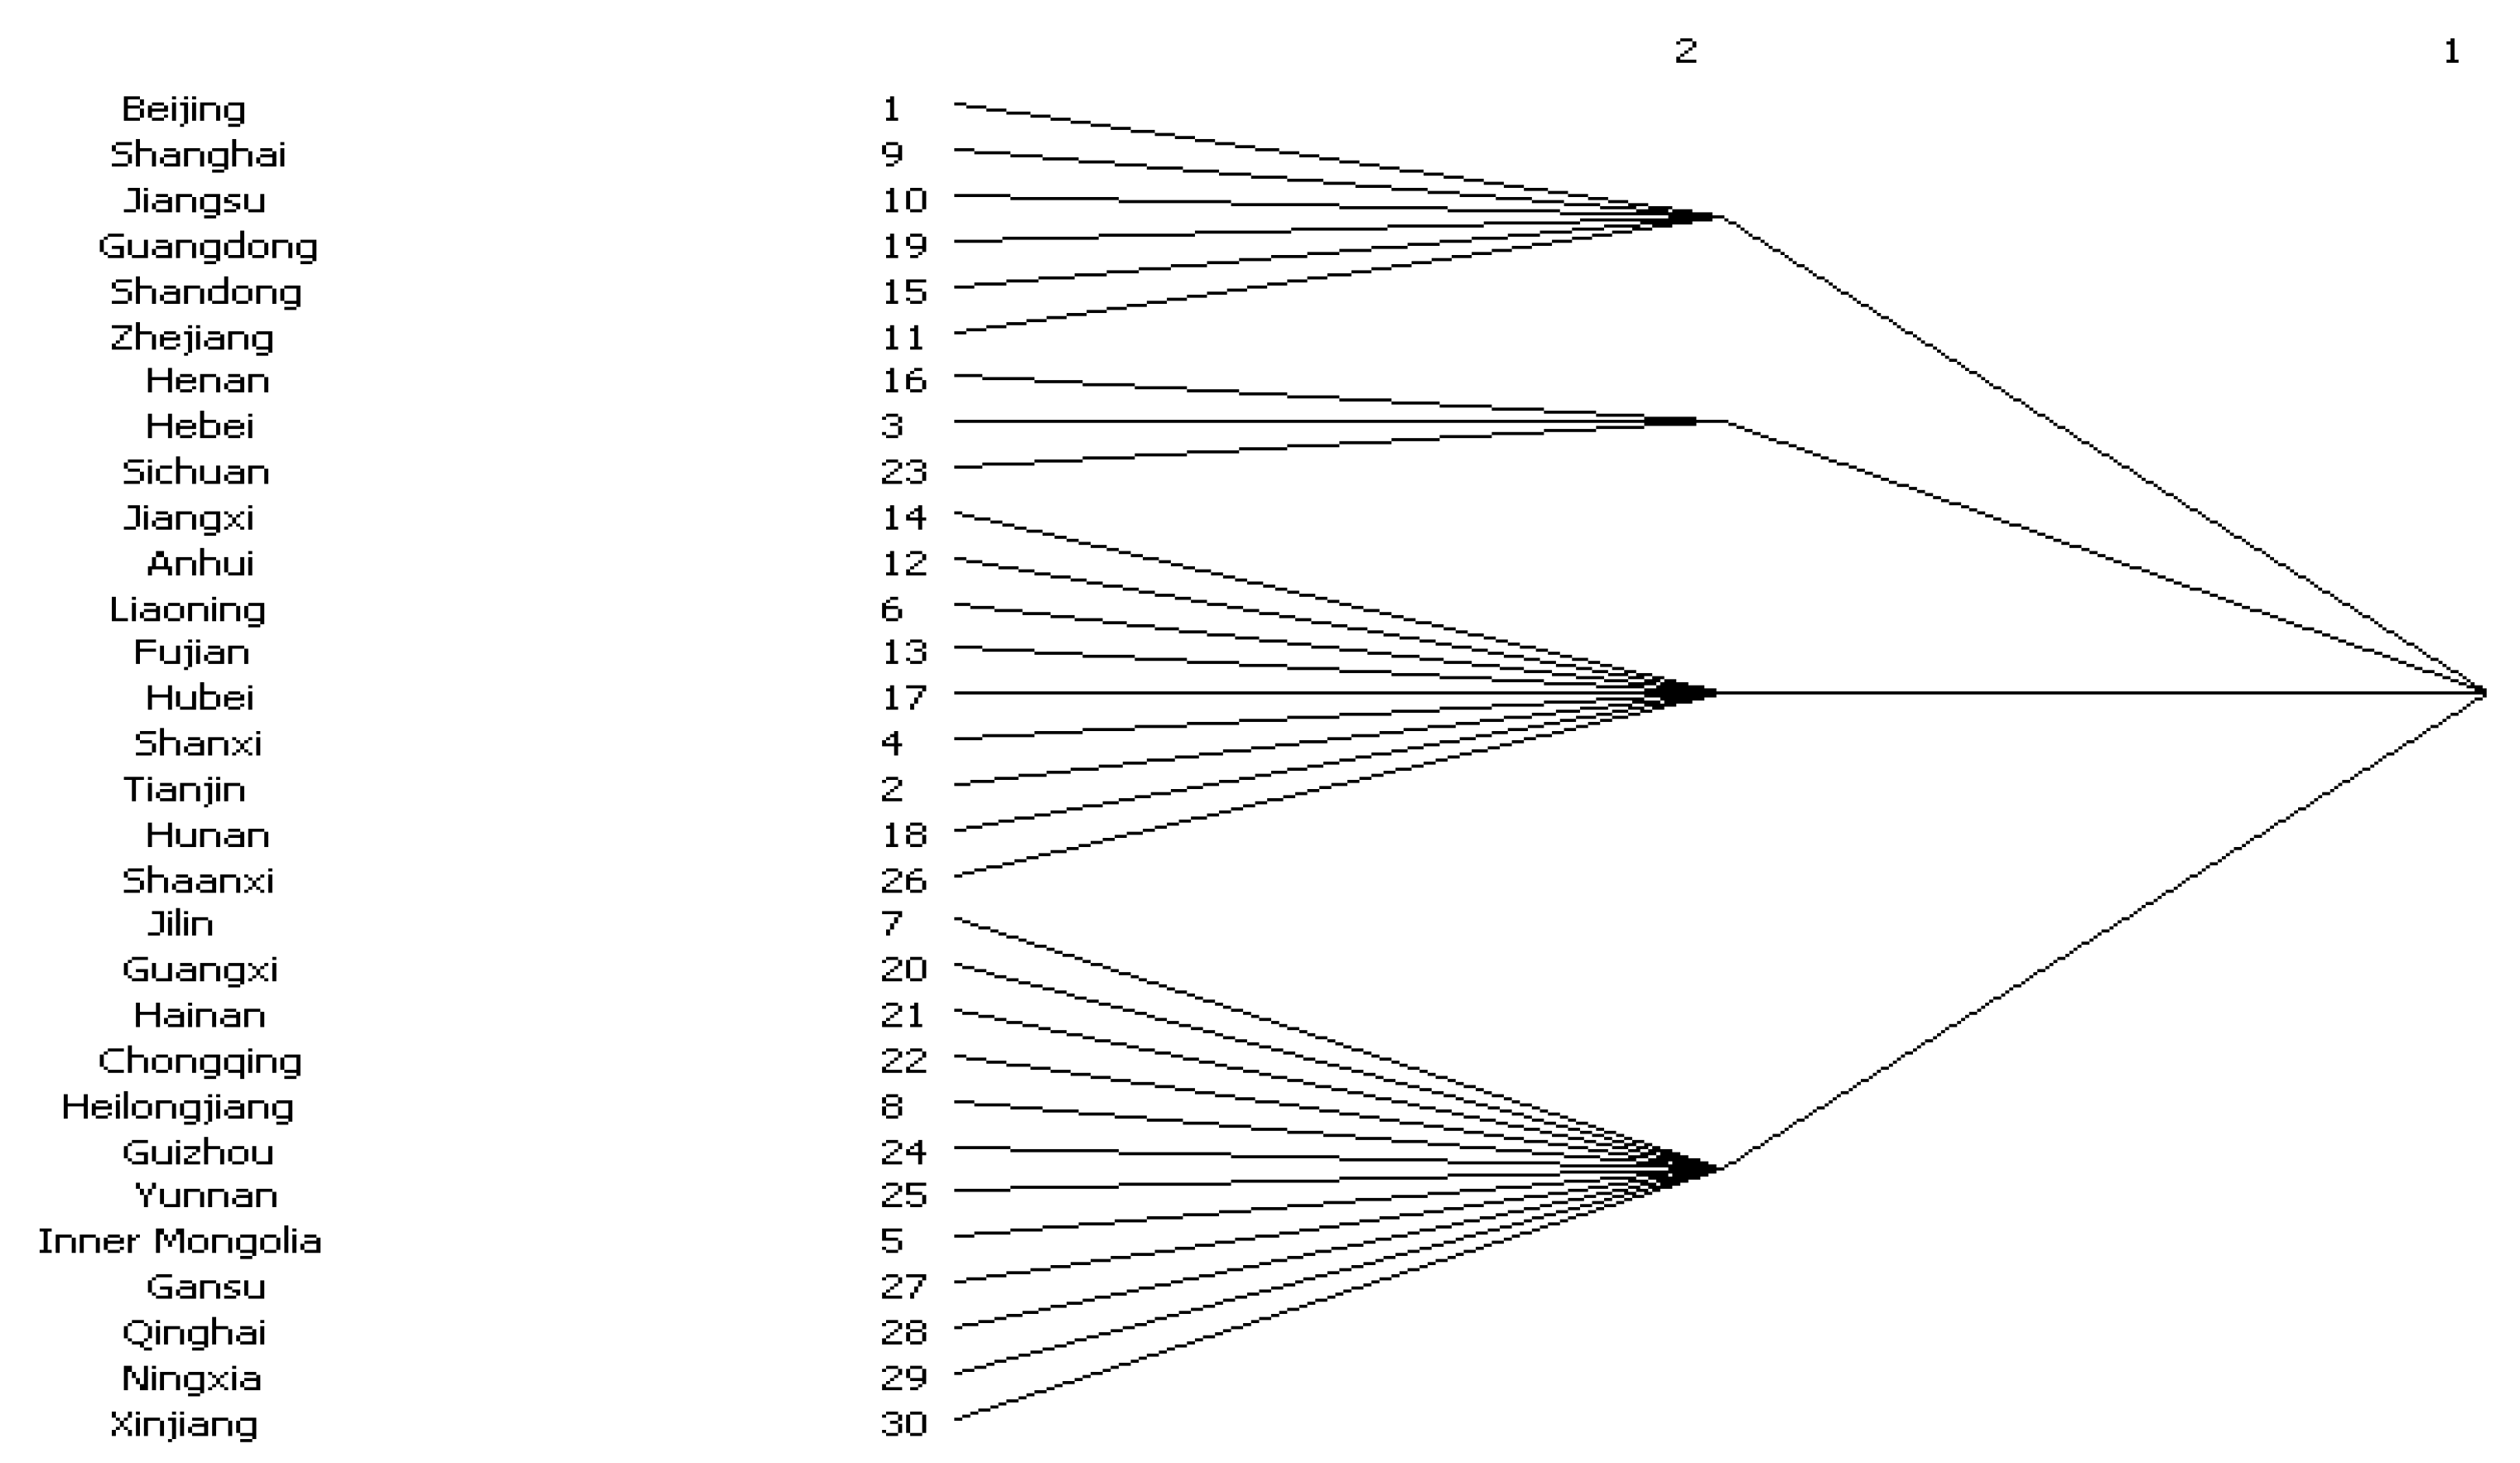
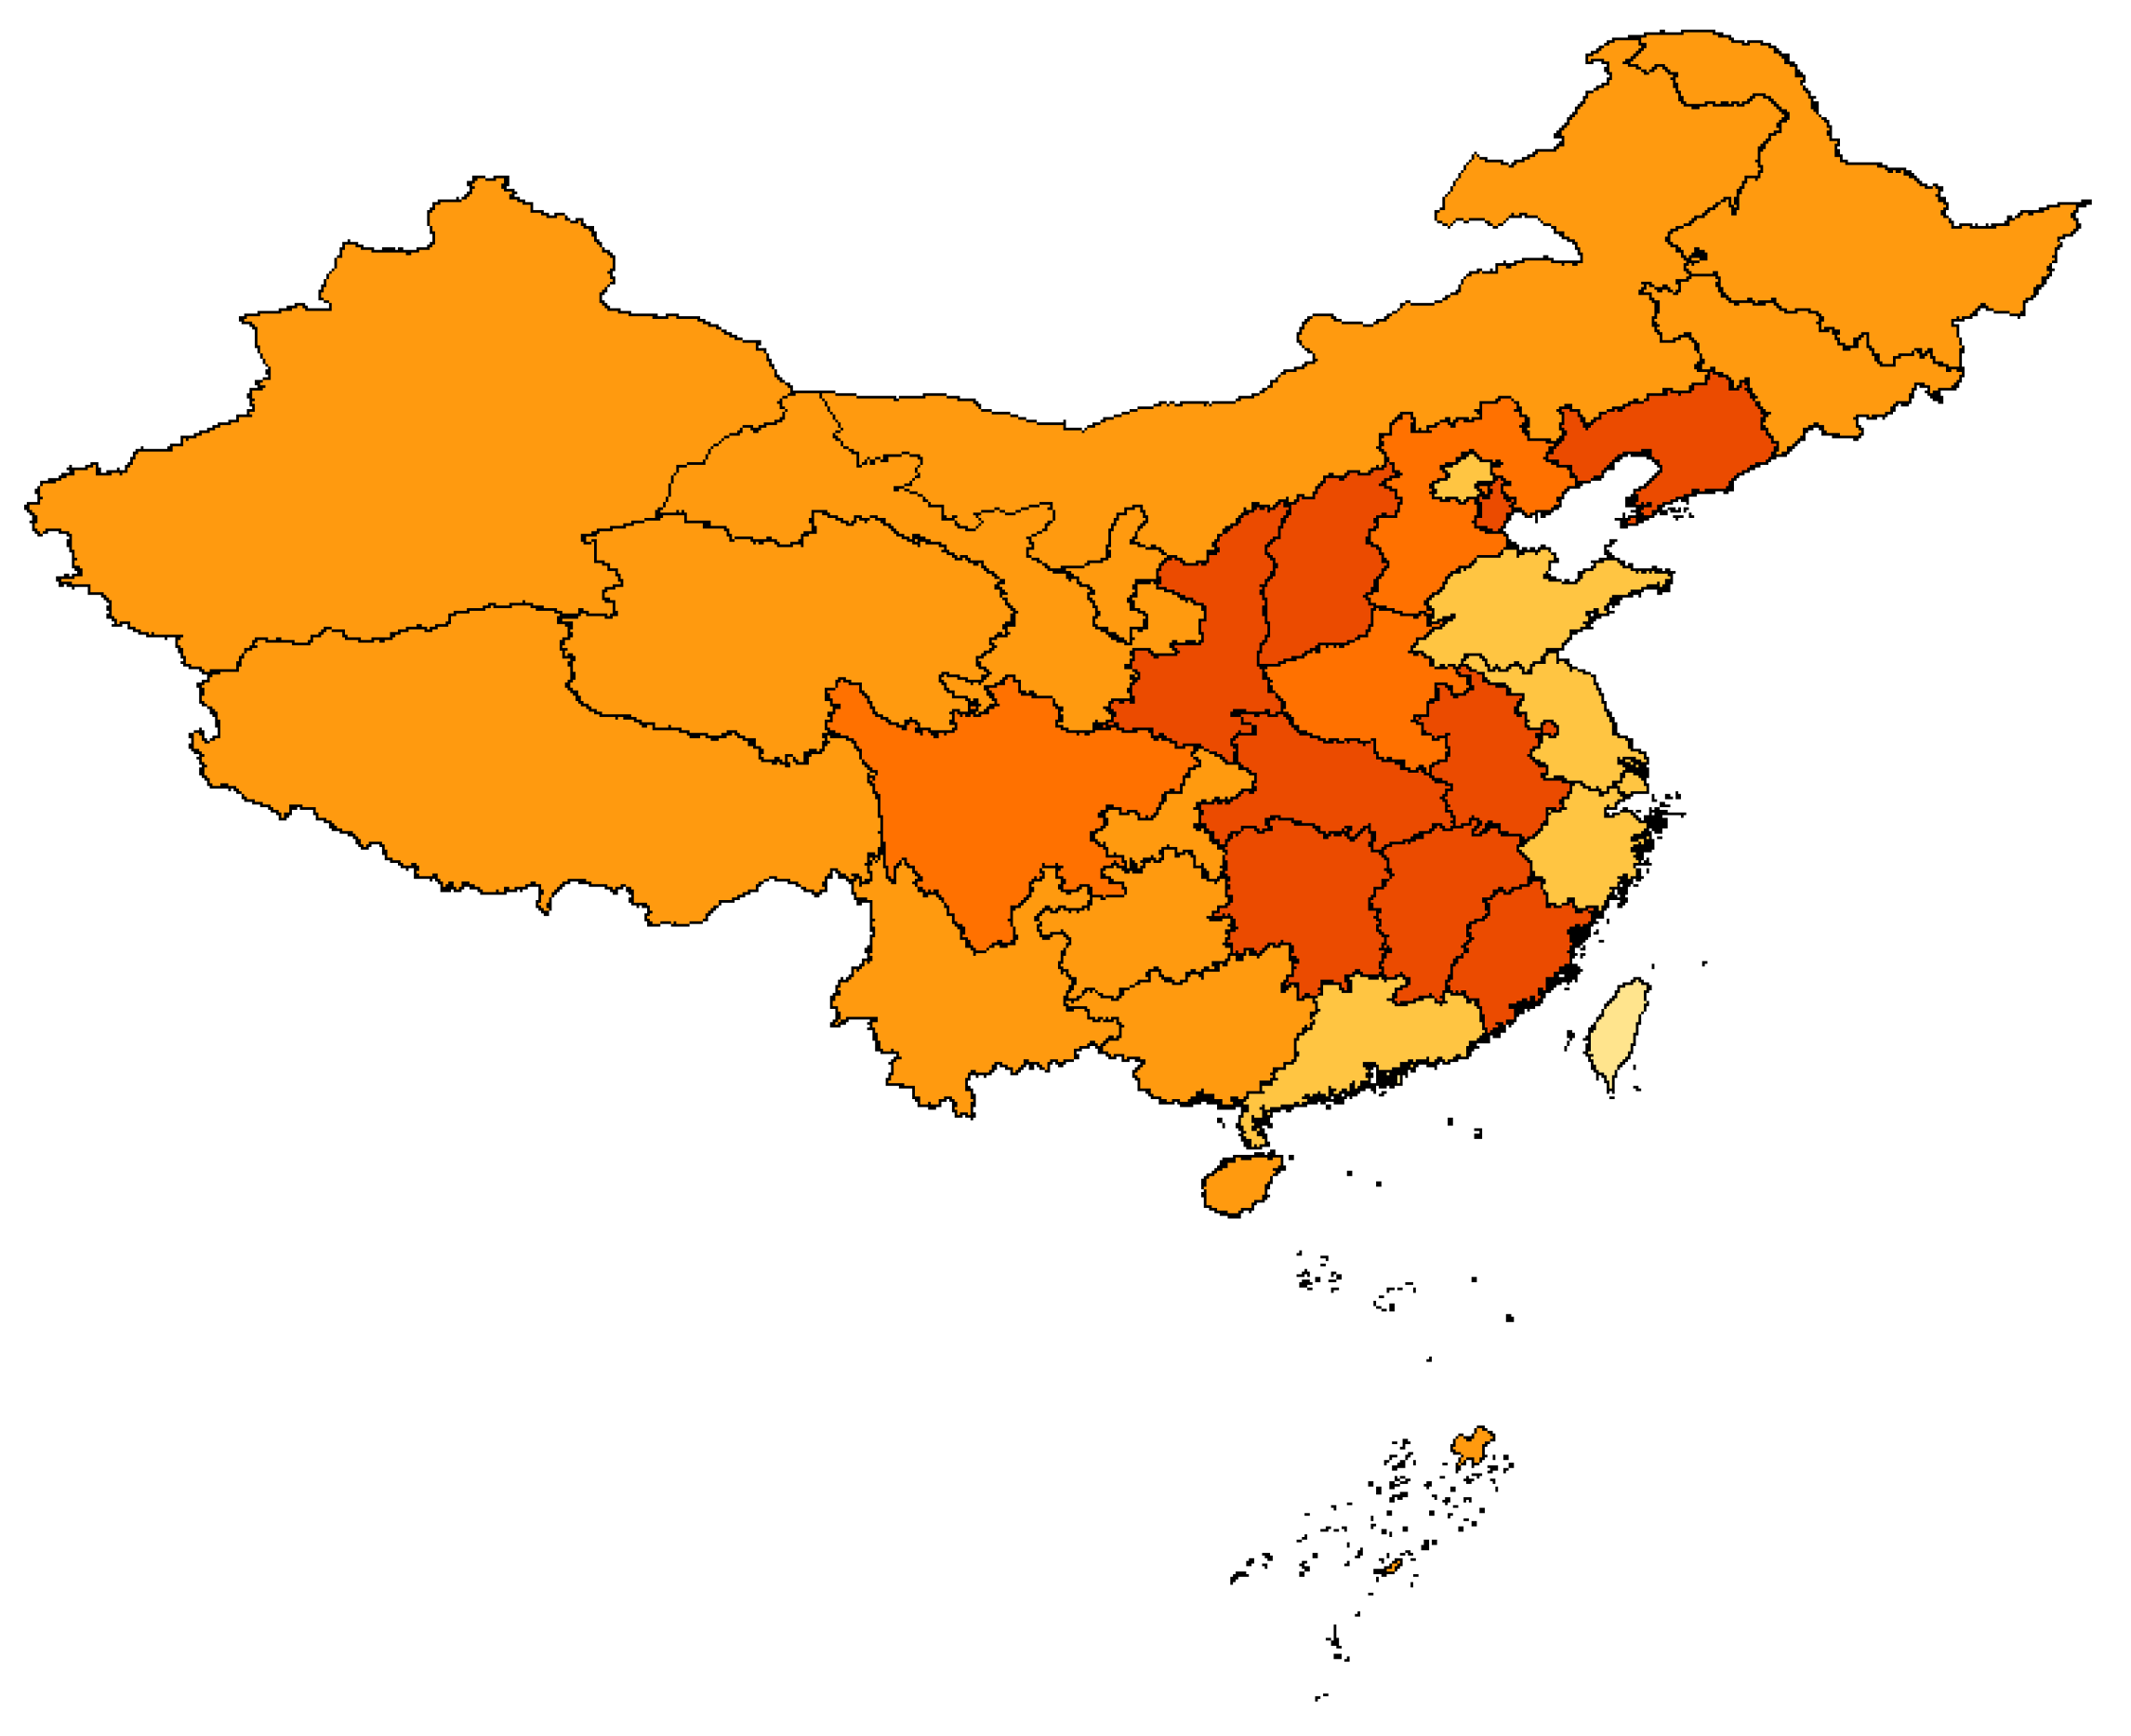
In this study, we measured agricultural green total factor productivity in each province of China based on the SBM-GML method and examined the spatial network structure of agricultural green total factor productivity in China and the regional interaction between the east, middle, and west using social network analysis (SNA) and impulse response function (IRF) in the VAR model, respectively. We found that agricultural green total factor productivity from 2008 to 2019 was generally higher in the southern provinces than in the northern provinces, and that the distribution of agricultural green development quality was more dispersed in the north, with development differences between different provinces being more pronounced than in the south. The spatial network structure of agricultural green economic efficiency across Chinese provinces is taking shape, experiencing an evolutionary path from polycentric to monocentric to polycentric conditions, with the same subgroup of provinces often having similarities at the geographical or economic level, indicating that China’s agricultural green total factor productivity has basically formed a benign interaction pattern of competing upwards in terms of improving agricultural green economic efficiency. China’s resilience in green agricultural development has gradually increased with the advantage of a mega market and the potential of domestic demand, and the spatial network is characterised by a certain degree of self-stability. With the in-depth promotion of the national strategies of rural revitalisation and building a new development pattern, the density of total factor productivity networks and the density of cohesive subgroups in China’s agricultural environment are both showing an increase, indicating that the spatial interaction of agricultural green development is strengthening, which has important practical significance for cross-regional cooperation in agriculture and the extension and integration of industrial chains; for example, the cross-regional agricultural cooperation in central and western China in the form of counterpart cooperation has achieved satisfactory results. The interaction between the eastern, central, and western regions has generally improved the total factor productivity of the agricultural environment in the east, but not in the central and western regions, meaning that the siphon effect is significant but the trickle-down effect is not obvious. Therefore, for policy makers, in order to improve the green total factor productivity of Chinese agriculture, targeted policies related to cross-regional cooperation in terms of factor mobility and industrial division of labour can be considered, taking into account the actual agricultural development in the mid-west and the south–north. For academic researchers, the possible inspiration of this paper is that for different research topics, appropriate research methods must be selected and applied in order to provide a more profound analytical portrayal of the real world. The social network analysis method adopted in the paper can obtain appropriate answers to the question of the spatio-temporal development of regional economies in an open economy, but it cannot do anything about the analysis of closed economies due to geographical and institutional factors. At a time when globalised markets are encountering increasing challenges and food security and environmental protection are prominent issues, the use of social network analysis tools to study the position and changing trends of countries in international trade in agriculture, in order to maintain global trade security and promote sustainable agricultural development, is a promising, challenging, and meaningful exercise.

Author Contributions

Conceptualization, H.C. and M.S.; methodology, H.C. and M.S.; software, S.Z.; validation, K.Z., J.S., X.W. and M.S.; formal analysis, M.S.; investigation, M.S.; resources, S.Z.; data curation, S.Z.; writing—original draft preparation, H.C.; writing—review and editing, M.S.; visualization, M.S.; supervision, M.S.; project administration, M.S.; funding acquisition, M.S. All authors have read and agreed to the published version of the manuscript.

Funding

This research was funded by the major topics of Zhejiang Cultural Research Project (no. 21WH70098ZD).

Institutional Review Board Statement

Not applicable.

Informed Consent Statement

Not applicable.

Data Availability Statement

All data generated or analyzed during this study are included in this published article.

Conflicts of Interest

The authors declare no conflict of interest.

References

  1. Adam, Z. Green Development-Environment and Sustainability in a Developing World; Routledge: London, UK, 2009; pp. 1–10. [Google Scholar]
  2. Oskam, A. Productivity measurement, incorporating environmental effects of agricultural production. Dev. Agr. Eco. 1991, 7, 186–204. [Google Scholar]
  3. Reinhard, S.; Lovell, C.; Thijssen, G. Econometric estimation of technical and environmental efficiency: An application to Dutch dairy farms. Am. J. Agr. Econ. 1999, 81, 44–60. [Google Scholar] [CrossRef]
  4. Hur, T.; Kim, I.; Yamamoto, R. Measurement of green productivity and its improvement. J. Clean. Prod. 2004, 12, 673–683. [Google Scholar] [CrossRef]
  5. Tone, K. Dealing with Undesirable Outputs in DEA: A Slacks-Based Measure (SBM) Approach; GRIPS Research Report Series; National Graduate Institute for Policy Studies (GRIPS): Tokyo, Japan, 2003. [Google Scholar]
  6. Chung, Y.H.; Fare, R.; Grosskopf, S. Productivity and undesirable output: A directional distance function approach. J. Environ. Manag. 1997, 51, 229–240. [Google Scholar] [CrossRef] [Green Version]
  7. Kuosmanen, T. Green Productivity in Agriculture: A Critical Synthesis; Aalto University: Espoo, Finland, 2013; pp. 19–21. [Google Scholar]
  8. Xu, X.; Zhang, L.; Chen, L.; Liu, C. The role of soil N2O emissions in agricultural areen total factor productivity: An empirical study from China around 2006 when agricultural tax was abolished. Agriculture 2020, 10, 150. [Google Scholar] [CrossRef]
  9. Liu, D.; Zhu, X.; Wang, Y. China’s agricultural green total factor productivity based on carbon emission: An analysis of evolution trend and influencing factors. J. Clean. Prod. 2020, 278, 123692. [Google Scholar] [CrossRef]
  10. Chen, Y.; Miao, J.; Zhu, Z. Measuring green total factor productivity of China’s agricultural sector: A three-stage SBM-DEA model with non-point source pollution and CO2 emissions. J. Clean. Prod. 2021, 318, 128543. [Google Scholar] [CrossRef]
  11. Chen, Y.; Fu, W.; Wang, J. Evaluation and influencing factors of China’s agricultural productivity from the perspective of environmental constraints. Sustainability 2022, 14, 2807. [Google Scholar] [CrossRef]
  12. Huang, X.; Feng, C.; Qin, J.; Wang, X.; Zhang, T. Measuring China’s agricultural green total factor productivity and its drivers during 1998–2019. Sci. Total. Environ. 2022, 829, 154477. [Google Scholar] [CrossRef] [PubMed]
  13. Zhu, Y.; Zhang, Y.; Piao, H. Does Agricultural mechanization improve the green total factor productivity of China’s planting industry? Energies 2022, 15, 940. [Google Scholar] [CrossRef]
  14. Peng, Y.; Chen, Z.; Lee, J. Dynamic Convergence of Green Total Factor Productivity in Chinese Cities. Sustainability 2020, 12, 4883. [Google Scholar] [CrossRef]
  15. Zhang, Y.; Wei, J.; Wang, Y.; Tsai, S.; Zheng, X. An empirical study on the growth of agricultural areen total factor productivity in the Huanghuai River Economic Zone by big data computing. Math. Probl. Eng. 2022, 2022, 1775027. [Google Scholar]
  16. Zhang, Y.; Wu, Z. Intelligence and Green Total Factor Productivity Based on China’s Province-Level Manufacturing Data. Sustainability 2021, 13, 4989. [Google Scholar] [CrossRef]
  17. Fang, L.; Hu, R.; Mao, H.; Chen, S. How crop insurance influences agricultural green total factor productivity: Evidence from Chinese farmers. J. Clean. Prod. 2021, 321, 128977. [Google Scholar] [CrossRef]
  18. Fredriksson, P.G.; Millimet, D.L. Strategic interaction and the determination of environmental policy across US states. J. Urban Econ. 2002, 51, 101–122. [Google Scholar] [CrossRef]
  19. Brueckner, J.K.; Saavedra, L.A. Do local governments engage in strategic property-tax competition? Natl. Tax. J. 2001, 54, 203–229. [Google Scholar] [CrossRef] [Green Version]
  20. Woods, N.D. Interstate competition and environmental regulation: A test of the race-to-the-bottom thesis. Soc. Sci. Q. 2006, 87, 174–189. [Google Scholar] [CrossRef]
  21. Angrist, J.D.; Pischke, J.S. Mostly Harmless Econometrics: An Empiricist’s Companion; Princeton University Press: Princeton, NJ, USA, 2008; Volume 315, p. 325. [Google Scholar]
  22. Brunnermeier, S.B.; Cohen, M.A. Determinants of environmental innovation in US manufacturing industries. J. Environ. Econ. Manag. 2003, 45, 278–293. [Google Scholar] [CrossRef]
  23. Zhong, Z.; Hu, Y.; Jiang, L. Impact of climate change on agricultural total factor productivity based on spatial panel data model: Evidence from China. Sustainability 2019, 11, 1516. [Google Scholar] [CrossRef] [Green Version]
  24. Wang, H.; Cui, H.; Zhao, Q. Effect of green technology innovation on green total factor productivity in China: Evidence from spatial durbin model analysis. J. Clean. Prod. 2020, 288, 125624. [Google Scholar] [CrossRef]
  25. Zhang, X.; Chen, H. Green agricultural development based on information communication technology and the panel space measurement model. Sustainability 2021, 13, 1147. [Google Scholar] [CrossRef]
  26. Li, X.; Shi, P.; Han, Y.; Deng, A.; Liu, D. Measurement and Spatial Variation of Green Total Factor Productivity of the Tourism Industry in China. Int. J. Environ. Res. Public Health 2020, 17, 1159. [Google Scholar] [CrossRef] [PubMed] [Green Version]
  27. Zhang, H.; Dong, Y. Measurement and spatial correlations of green total factor productivities of Chinese provinces. Sustainability 2022, 14, 5071. [Google Scholar] [CrossRef]
  28. Hou, S.; Song, L. Market Integration and Regional Green Total Factor Productivity: Evidence from China’s Province-Level Data. Sustainability 2021, 13, 472. [Google Scholar] [CrossRef]
  29. Li, Q.; Wu, X.; Zhang, Y.; Wang, Y. The Effect of Agricultural Environmental Total Factor Productivity on Urban-Rural Income Gap: Integrated View from China. Sustainability 2020, 12, 3327. [Google Scholar] [CrossRef] [Green Version]
  30. Serrano, M.Á.; Boguñá, M. Topology of the world trade web. Phys. Rev. E 2003, 68, 634–646. [Google Scholar] [CrossRef] [Green Version]
  31. Oh, D.A. Global Malmquist-Luenberger productivity index. J. Prod. Anal. 2010, 34, 183–197. [Google Scholar] [CrossRef]
Figure 1. Comparison of regional disparities in agricultural green total factor productivity in 2008 (a) and 2019 (b) (the darker the colour, the higher the value).
Sustainability 14 07508 g001
Figure 2. Comparative and kernel density analysis of agricultural green total factor productivity in south and north China, 2008–2019.
Sustainability 14 07508 g002
Figure 3. Network structure of China’s agricultural green total factor productivity in 2019.
Sustainability 14 07508 g003
Figure 4. Coalescent subgroups of China’s agricultural green total factor productivity network in 2019.
Sustainability 14 07508 g004
Figure 5. Comparison of regional disparities in agricultural green total factor productivity in the four cohesive subgroups in 2019 (the darker the colour, the higher the value).
Sustainability 14 07508 g005
Figure 6. Moran scatter plots of agricultural green total factor productivity, 2008 (a) and 2019 (b).
Sustainability 14 07508 g006
Figure 7. Impulse response function synthesis diagrams. (a) Impact of the east on the middle. (b) Impact of the middle on the east. (c) Impact of the middle on the west. (d) Impact of the west on the middle. (e) Impact of the east on the west. (f) Impact of the west on the east. (g) Impact of the north on the south. (h) Impact of the south on the north.
Sustainability 14 07508 g007aSustainability 14 07508 g007b
Table 1. Agricultural green total factor productivity measurements by province in China, 2008–2019.
Province2008 2015 2019 Province2008 2015 2019
Beijing1.084 1.043 1.003 Henan0.997 1.013 1.040
Tianjin0.973 1.027 1.056 Hubei1.184 1.006 1.075
Hebei1.066 0.992 1.049 Hunan1.083 1.007 1.212
Shanxi1.061 0.967 0.993 Guangdong0.926 1.016 1.058
Inner Mongolia0.981 0.962 1.043 Guangxi1.000 0.989 1.024
Liaoning1.015 1.063 1.065 Hainan0.842 0.932 1.134
Jilin1.104 0.972 1.059 Chongqing1.019 1.019 1.069
Heilongjiang1.150 0.982 1.006 Sichuan1.066 1.004 1.066
Shanghai1.151 0.932 1.000 Guizhou0.897 1.068 1.009
Jiangsu1.048 1.067 1.008 Yunnan1.058 0.976 1.106
Zhejiang1.077 1.018 1.072 Shaanxi1.043 1.001 1.022
Anhui1.041 1.000 1.027 Gansu1.025 1.010 1.023
Fujian1.089 1.062 1.027 Qinghai1.000 0.768 1.141
Jiangxi1.107 0.998 1.104 Ningxia0.991 1.004 0.983
Shandong1.048 1.009 1.040 Xinjiang1.000 0.968 1.000
Table 2. Network density of agricultural green total factor productivity in China, 2008–2019.
Year20082019
Using the average method155.66163.40
The cut-off value is 100.8940.917
The cut-off value is 500.6670.689
The cut-off value is 1000.4520.463
Table 3. Top 10 provinces in terms of network performance.
Web Spot Ranking(Degree of Point-out)
Year12345678910
2008GuangdongJiangsuShandongZhejiangShanghaiHenanSichuanHebeiLiaoningBeijing
2015GuangdongJiangsuShandongZhejiangHenanSichuanShanghaiHubeiHebeiBeijing
2019GuangdongJiangsuShandongZhejiangHenanSichuanHebeiShanghaiBeijingHubei
Web Spot Ranking(Degree of Point-in)
Year12345678910
2008QinghaiNingxiaGansuGuizhouJiangxiHainanAnhuiHubeiGuangxiHunan
2015QinghaiNingxiaGansuHeilongjiangHainanGuangxiGuizhouShanxiAnhuiJilin
2019QinghaiNingxiaGansuJilinHeilongjiangHainanGuangxiGuizhouHunanJiangxi
Table 4. Network centre potential, 2008–2019.
Year200820152019
Point-out centrality potential30.57%38.70%30.69%
Point-in centrality potential16.69%13.47% 14.18%
Table 5. Agricultural green total factor productivity linkage network cohesive subgroups in China from 2008 to 2019.
YearProvince
20081Beijing, Shanghai, Jiangsu, Guangdong, Shandong, Liaoning, Zhejiang2Hebei, Henan, Sichuan
3Chongqing, Inner Mongolia, Fujian, Hubei, Anhui, Tianjin, Heilongjiang, Hunan, Shanxi, Shaanxi, Yunnan4Hainan, Jiangxi, Guizhou, Jilin, Guangxi, Gansu, Qinghai, Ningxia, Xinjiang
20151Beijing, Shanghai, Jiangsu, Guangdong, Shandong, Zhejiang2Hubei, Henan, Sichuan
3Chongqing, Inner Mongolia, Liaoning, Hebei, Jiangxi, Anhui, Fujian, Tianjin, Hunan, Shaanxi4Guangxi, Hainan, Jilin, Heilongjiang, Guizhou, Yunnan, Shanxi, Gansu, Qinghai, Ningxia, Xinjiang
20191Beijing, Shanghai, Jiangsu, Guangdong, Shandong, Zhejiang2Henan, Hebei, Sichuan
3Jiangxi, Anhui, Liaoning, Fujian, Hubei, Shanxi, Tianjin, Hunan, Shaanxi4Jilin, Guangxi, Hainan, Chongqing, Heilongjiang, Guizhou, Yunnan, Inner Mongolia, Gansu, Qinghai, Ningxia, Xinjiang
Table 6. Density of cohesive subgroups of agricultural green total factor productivity network in China, 2008–2019.
2008/2015/20191234
1131.28/
152.68/
158.47
336.10/
326.53/
349.87
346.00/
330.85/
385.85
586.51/
499.19/
577.10
270.04/
76.29/
85.73
193.62/
178.55/
204.49
199.44/
180.31/
214.78
352.87/
285.14/
350.24
332.81/
44.50/
45.49
91.16/
100.94/
105.79
87.58/
94.41/
111.98
162.34/
152.70/
170.81
411.43/
14.96/
14.44
31.38/
36.14/
38.14
32.83/
35.03/
37.79
61.99/
62.18/
69.91
Publisher’s Note: MDPI stays neutral with regard to jurisdictional claims in published maps and institutional affiliations.

