Article

Changes in Temporal Dynamics and Factors Influencing the Environment of the Bacterial Community in Mangrove Rhizosphere Sediments in Hainan

1
College of Forestry, Hainan University, Haikou 570228, China
2
Key Laboratory of Agro-Forestry Environmental Processes and Ecological Regulation of Hainan Province, College of Ecology and Environment, Hainan University, Haikou 570228, China
*
Author to whom correspondence should be addressed.
Sustainability 2022, 14(12), 7415; https://doi.org/10.3390/su14127415
Submission received: 29 April 2022 / Revised: 10 June 2022 / Accepted: 12 June 2022 / Published: 17 June 2022
(This article belongs to the Special Issue Managing Forest and Plant Resources for Sustainable Development)

Abstract

:
The structural characteristics of the rhizosphere soil’s microbial community is crucial to understanding the ecological function of mangroves. However, the mechanism influencing mangrove plants in soil microbial communities has yet to be determined. Here, the mangrove ecosystem of Xinying Mangrove National Wetland Park in Hainan Province was taken as the research object. The microbial communities, external regulatory factors, and the relationship between communities were analyzed using 16S rRNA high-throughput sequencing in the rhizosphere and non-rhizosphere sediments of mangrove forests under different spatiotemporal conditions. The results showed that there was no significant difference in the α-diversity of the bacterial community between the rhizosphere and non-rhizosphere sediments. However, β-diversity was significantly different. Redundancy analysis (RDA) showed that other environmental factors besides sulfide and Fe2+ affected the bacterial community structure in sediments. The co-occurrence pattern analysis of bacteria in the mangrove ecosystem indicates that the bacteria in rhizosphere sediments were more closely related than those in non-rhizosphere sediments. The results reveal significant differences between the rhizosphere and non-rhizosphere bacterial community diversity, structure, and their interaction in the mangrove ecosystem. Therefore, the ecological system of the mangrove wetland needs to be preserved and rehabilitated, which would have a tremendous impact on the sustainable development.

1. Introduction

Mangrove forests are widely distributed in tropical and subtropical intertidal wetlands, which have important ecological value and are closely related to human activities [1]. The mangrove ecosystem is an important carbon sink, which can fix carbon sources from upstream rivers, oceans, and the atmosphere; eliminate organic pollution in estuary areas; and alleviate climate change [2]. The periodic influence of tides on mangrove wetlands means that environmental conditions such as soil salinity, organic nutrients, and oxygen concentration often show notable temporal and spatial variations [3]. In addition, there are extremely rich and diverse microbial communities in the mangrove rhizosphere’s soil sediments, which play an extremely important role in the material cycle of the sediment environment, as well as maintaining the productivity of mangrove ecosystems and protecting ecological functions [4,5].
Studying the microbial community structure’s characteristics and the succession regulation mechanism of mangrove sediments is of great significance for the protection and restoration of mangroves. Mangrove ecosystems have globally been damaged and disturbed to varying degrees due to human activities and climate change [6,7]. The microbial community in rhizosphere sediments has an important impact on the growth and development of plants. At the same time, the plants in turn also affect the structure and abundance of the microbial community due to their unique physical and chemical properties and due to rhizosphere secretion [8]. Bacteria are the key species that regulate the biogeochemical cycle of mangrove sediments, and they are an important part of mangroves’ microbial communities, as they are the microorganisms with the highest abundance and the most abundant metabolic functions in mangrove microbial communities [9]. They are directly or indirectly involved in various key metabolic pathways in mangrove ecosystems, such as ammonia oxidation, organic matter degradation, methane metabolism, and sulfate reduction [10]. Previous studies on mangrove bacterial communities were often based on pure culture, denaturing gradient gel electrophoresis (PCR-DGGE), and PCR-SSCP profiling. In these studies, the low resolution limited the understanding of mangrove bacterial communities [11,12,13]. High-throughput technology has been widely used in microbial research on mangrove systems in various regions throughout the world, which has improved our understanding of microbial communities in this region [14]. For example, the bacterial community in the sediments of mangrove ecosystems in India was studied using high-throughput technology. The results showed that the bacteria in surface sediments had an obvious pattern of temporal and spatial changes and that seasonal changes significantly affected the diversity of bacterial communities [15,16].
There are complex relationships among microbial communities with specific niches, such as competition, mutualism, and antagonism [17]. This relationship significantly affects the succession mechanism and the ecological function of the microbial community structure [18]. Based on the co-occurrence model, we can deeply understand the relationship among microorganisms in complex microbial communities in the soil environment. Researchers have conducted extensive and in-depth studies on the links between microbial communities in different environments such as the ocean, soil, farmland, and activated sludge using high-throughput sequencing technologies [19,20], which have effectively improved our understanding of microbial ecological relationships and the ecological functions in specific environments and our understanding that microbial relationships and coexistence mechanisms in specific environments are regulated by habitat-specific biological and abiotic factors [18,21,22]. Relatively few studies have investigated the characteristics and regulatory mechanisms of the interactions within the microbial community in mangrove ecosystems.
The Xinying Mangrove National Wetland Park in Hainan Province is the first national mangrove wetland park in China. The multitudinous diversity of its ecological system includes the geographical location and its unique landform, climatic characteristics of high temperature and high humidity, and tidal characteristics. In this study, we selected the mangrove ecosystem at Xinying Mangrove National Wetland Park in Hainan Province of China as the research object. Our research will have major theoretical value and practical purpose. Using high-throughput sequencing, the bacterial communities in sediments were analyzed for their diversity characteristics and influencing factors, and the co-occurrence patterns of bacterial communities were studied in mangrove sediments that combine the physicochemical properties of organic carbon, total nitrogen, nitrate nitrogen, and ammonium nitrogen. This study aims (1) to compare the diversity characteristics of rhizosphere and non-rhizosphere bacterial communities in mangroves; (2) to explore the key influencing factors of mangroves on the regulation of the rhizosphere and the non-rhizosphere bacterial community’s diversity; (3) to further elucidate the characteristics of bacterial community interaction (i.e., the co-occurrence pattern) in mangrove ecosystems. This study provides basic information and new insights into the bacterial community of the mangroves in Hainan.

2. Materials and Methods

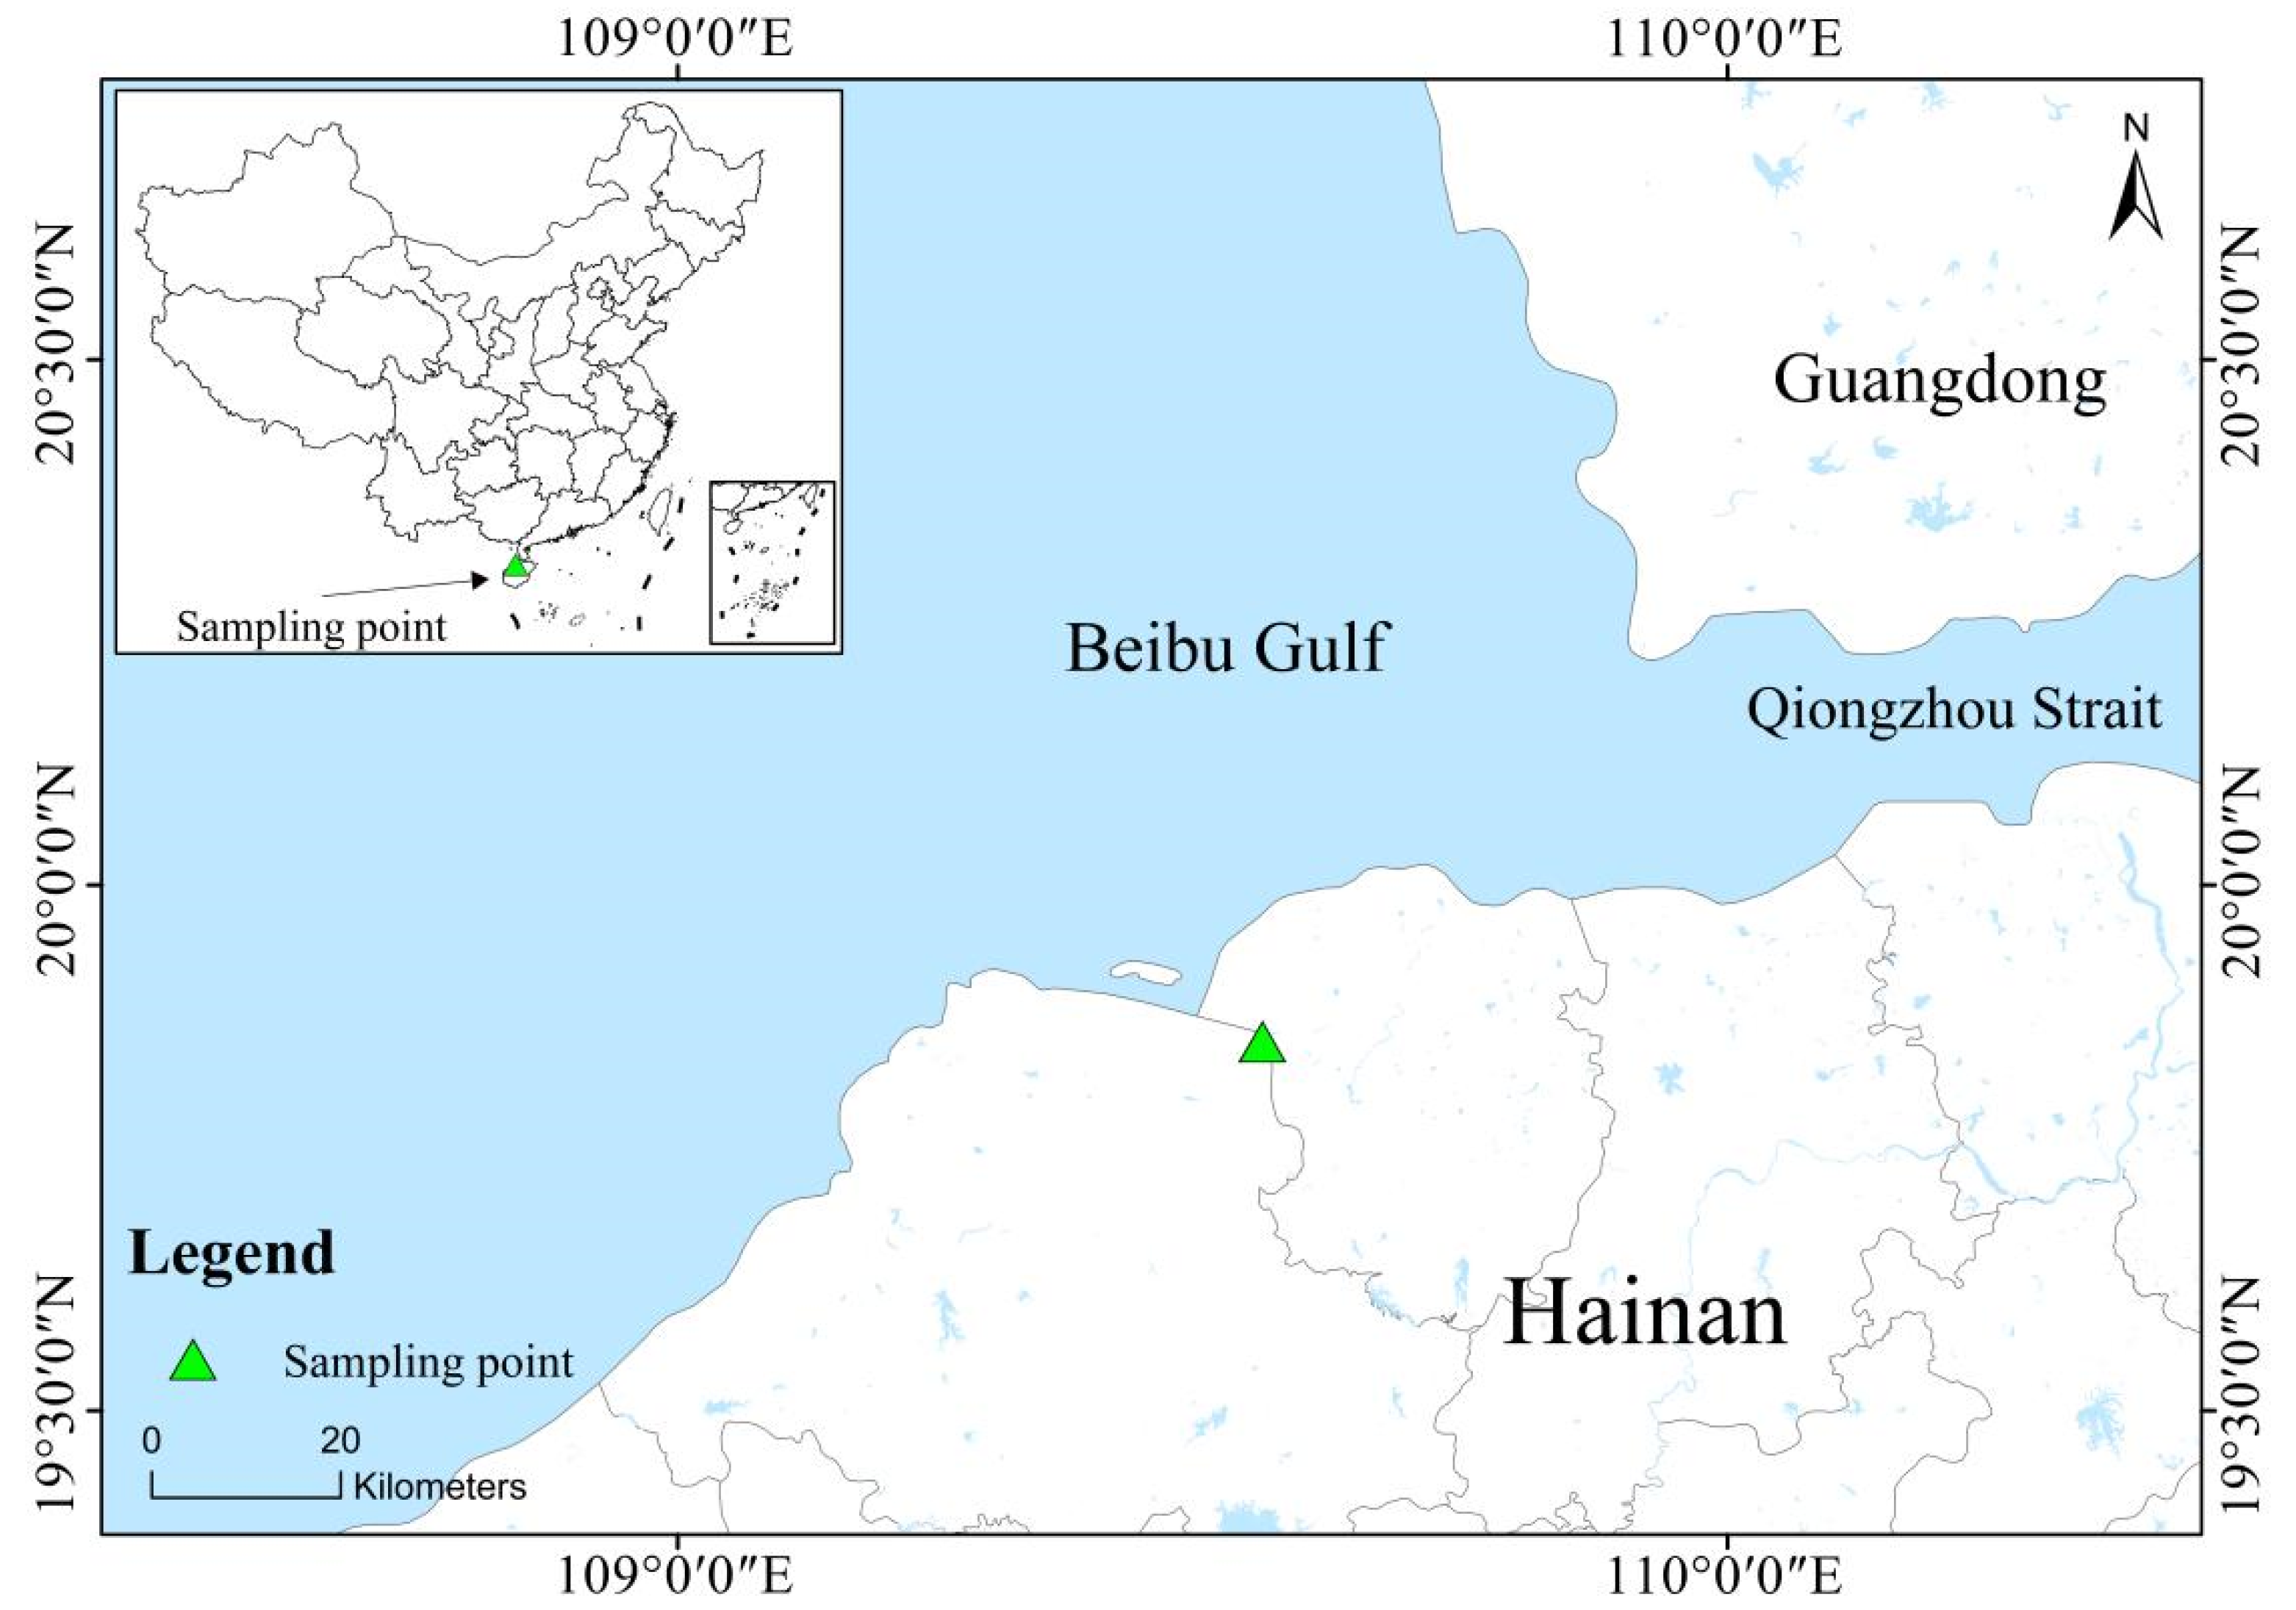
2.1. Overview of the Study Area

The Xinying Mangrove National Wetland Park in Hainan is located in Danzhou City (109°56′ N/19°86′ E) (Figure 1), which has a wetland area of 310.59 hectares (the natural mangrove wetland area is 126.90 hectares). The climatic condition of this area is the tropical monsoon marine climate. The average temperature was 22.9 °C, and the annual mean precipitation was 1600 mm, and with a rainy season from May to October. The average tidal range of the irregular diurnal tide in Dongzhai Harbor is approximately 1.2 m. There are 18 species of mangrove plants in this wetland park, including 13 species of 7 families of true mangrove plants (including 1 introduced species) and 5 species of 5 families of semi-mangrove. The mangrove plants mainly include Bruguiera gymnorhiza (L.) Lam, Bruguiera sexangula (Lour.) Poir, Kandelia candel (Linn.) Druce, Aegiceras corniculatum (L.) Blanco, Lumnitzera littorea (Jack) Voigt, Acanthus ilicifolius L., Avicennia marina (Forsk.) Vierh, Excoecaria agallocha L., etc. The semi-mangrove plants include Barringtonia racemosa (L.) Spreng, Cerbera manghas, Hibiscus tiliaceus Linn, Heritiera littoralis Dryand, Pongamia pinnata (Linn.) Pierre, etc.

2.2. Sample Collection

Rhizosphere and non-rhizosphere sediment samples were collected in April (spring), July (summer), October (autumn), and December (winter) of 2021. Sediment samples from the mangrove root zone (0–15 cm away from the trunk) were collected as rhizosphere samples. The roots of the plant were carefully pulled out from the dug soil and shaken gently to remove loose soil on the root system. We then used sterile tweezers to pinch the soil within 2 mm around the roots into a 50 mL centrifuge tube and kept it in a glove box filled with nitrogen. Additionally, non-growing areas of mangrove plants were selected as non-rhizosphere areas. During sample collection, we dug down to a depth of 30 cm below the soil surface and collected the sample at a depth of 10 cm [23,24]. The non-rhizosphere samples were collected as the control group. At each study site, 10 cm of surface sediment was collected from six to eight plots (50 cm × 50 cm) using stainless steel tubes. When the collection was complete, these sediment samples were stored in sterile plastic bags, sealed, and shipped on dry ice to the laboratory within 4 h. Immediately upon arrival at the laboratory, the composite samples from each site were homogenized under nitrogen. A total of eight sediment samples were obtained. Some sediments were freeze-dried (10 g, dry soil) to determine soil parameters. According to the standard soil determination steps [25], the physical and chemical properties of soil were measured, including temperature, pH, inorganic nitrogen (NH4+ and NO3), Fe2+ concentration, sulfide (S), organic carbon (OC), total nitrogen (TN), available nitrogen (AN), and available kalium (AK). The other part of the sediment samples (0.5 g) were stored in a refrigerator at −80 °C for DNA extraction.

2.3. Method of Analysis for Sediment Physicochemical Indexes

The temperature was measured in field by an RC-4 temperature recorder (Jiangsu Jingchuang Electronics Co., Ltd., Xuzhou, China); pH was determined by an acidity meter (Extech Instruments, USA). Inorganic nitrogen (NH4+ and NO3) was measured with an extraction method and a continuous flow analyzer (SAN plus, Skalar Analytical B. V., Breda, The Netherlands). Fe2+ concentration and sulfide (S) contents were analyzed by spectrophotometry [26,27]. The content of organic carbon (OC) in sediments was measured using an automatic organic carbon analyzer (SSM-5000A, Shimadzu, Japan). The total nitrogen content (TN) of sediments was measured by the CN thermal combustion furnace analyzer (Elementar analyzer varioMax CN, Langenselbold, Germany). The available nitrogen (AN) in sediments was determined by the alkaline hydrolysis diffusion method. The determination of available kalium (AK) was used by the flame photometric method. The physical and chemical properties of rhizosphere and non-rhizosphere sediments in the mangrove wetland can be seen in Table 1.

2.4. High-Throughput Sequencing Method for Sediment Bacteria 16SrRNA

DNA was extracted from sediment samples (0.5 g) by the FastDNAⓇSPIN kit (MP Biochemicals, Solon, OH, USA). The V4-V5 variable region of the bacterial 16SrRNA gene was amplified by PCR with the primer 338F/806R (Jiao et al., 2016). The PCR system was 50 μL, including DNA template 50–100 ng, primer 20 pmol/L, 4 × dNTP (2.5 mmol/L) 5 μL, MgCl2 2.5 mmol/L, 10 × PCR buffer 5 μL, BSA 300 ng/mL, and Taq polymerase (5 U) 0.2μL, and we added ddH2O to 50 μL. Amplification conditions: 94 °C 3 min; 94 °C 30 s, 50 °C 30 s, 72 °C 30 s, 35 cycles; extension at 72 °C for 10 min. Three replicates were amplified in all samples. No template was added to the control group. The 5 μL PCR products were detected on 2% agarose gel, and the gel was recovered using a QIAquick gel recovery kit (Qiagen, Hilden, Germany). The PCR product concentration was determined by a Quant-iT PicoGreen dsDNA (Life Technologies, Merelbeke, Belgium) kit. Sequencing was performed using the Illumina MiSeq (250-bp) platform. The obtained sequence was de-noised by Denoiser V0.91 software and the chimera was removed by USEARCH software. Mothur software was used to cluster the sequences with 97% similarity into operational classification units (OTUs) [28]. Each OTU selects a representative sequence using the RDP classifier to annotate the classification unit with an 80% confidence threshold. In order to eliminate the influence of different sequence sizes of samples, a random rarefaction of all sample reads must be performed according to the smallest value before the data analysis.

2.5. Statistical Analysis

The α-diversity index (including Chao1 index, Shannon index, and Simpson index) was calculated by Mothur software. The Bray–Curtis distance matrix between samples was calculated using the R language vegan package. PCoA and Permutation Multivariate Analysis of Variance (PERMANOVA) used the Bray–Curtis distance matrix to test the differences between groups. Spearman correlation was used to test the influence of environmental attributes on the OTUs of the top 50 relative abundances. Redundancy analysis (RDA) was used to analyze the relationship between microbial structure and environmental indicators. The Mantel test was used to test the correlation between Bray–Curtis distance matrices.
The co-occurrence network diagram was used to explore the relationship between microorganisms. OTUs with relative abundance greater than 0.05% were selected for Spearman correlation analysis, and the correlations with a correlation coefficient greater than 0.6 and a significant P-value less than 0.01 were screened to construct the correlation network [20]. Each node in the network diagram represents an OTU, and each edge represents a strong correlation between nodes. The topology parameters of each network graph were calculated, including average path length, network diameter, clustering coefficient, modularity, average degree, and network density. Each node of the network graph was colored according to the module property, and the OTU was annotated in the genus-level classification unit [29].

3. Results

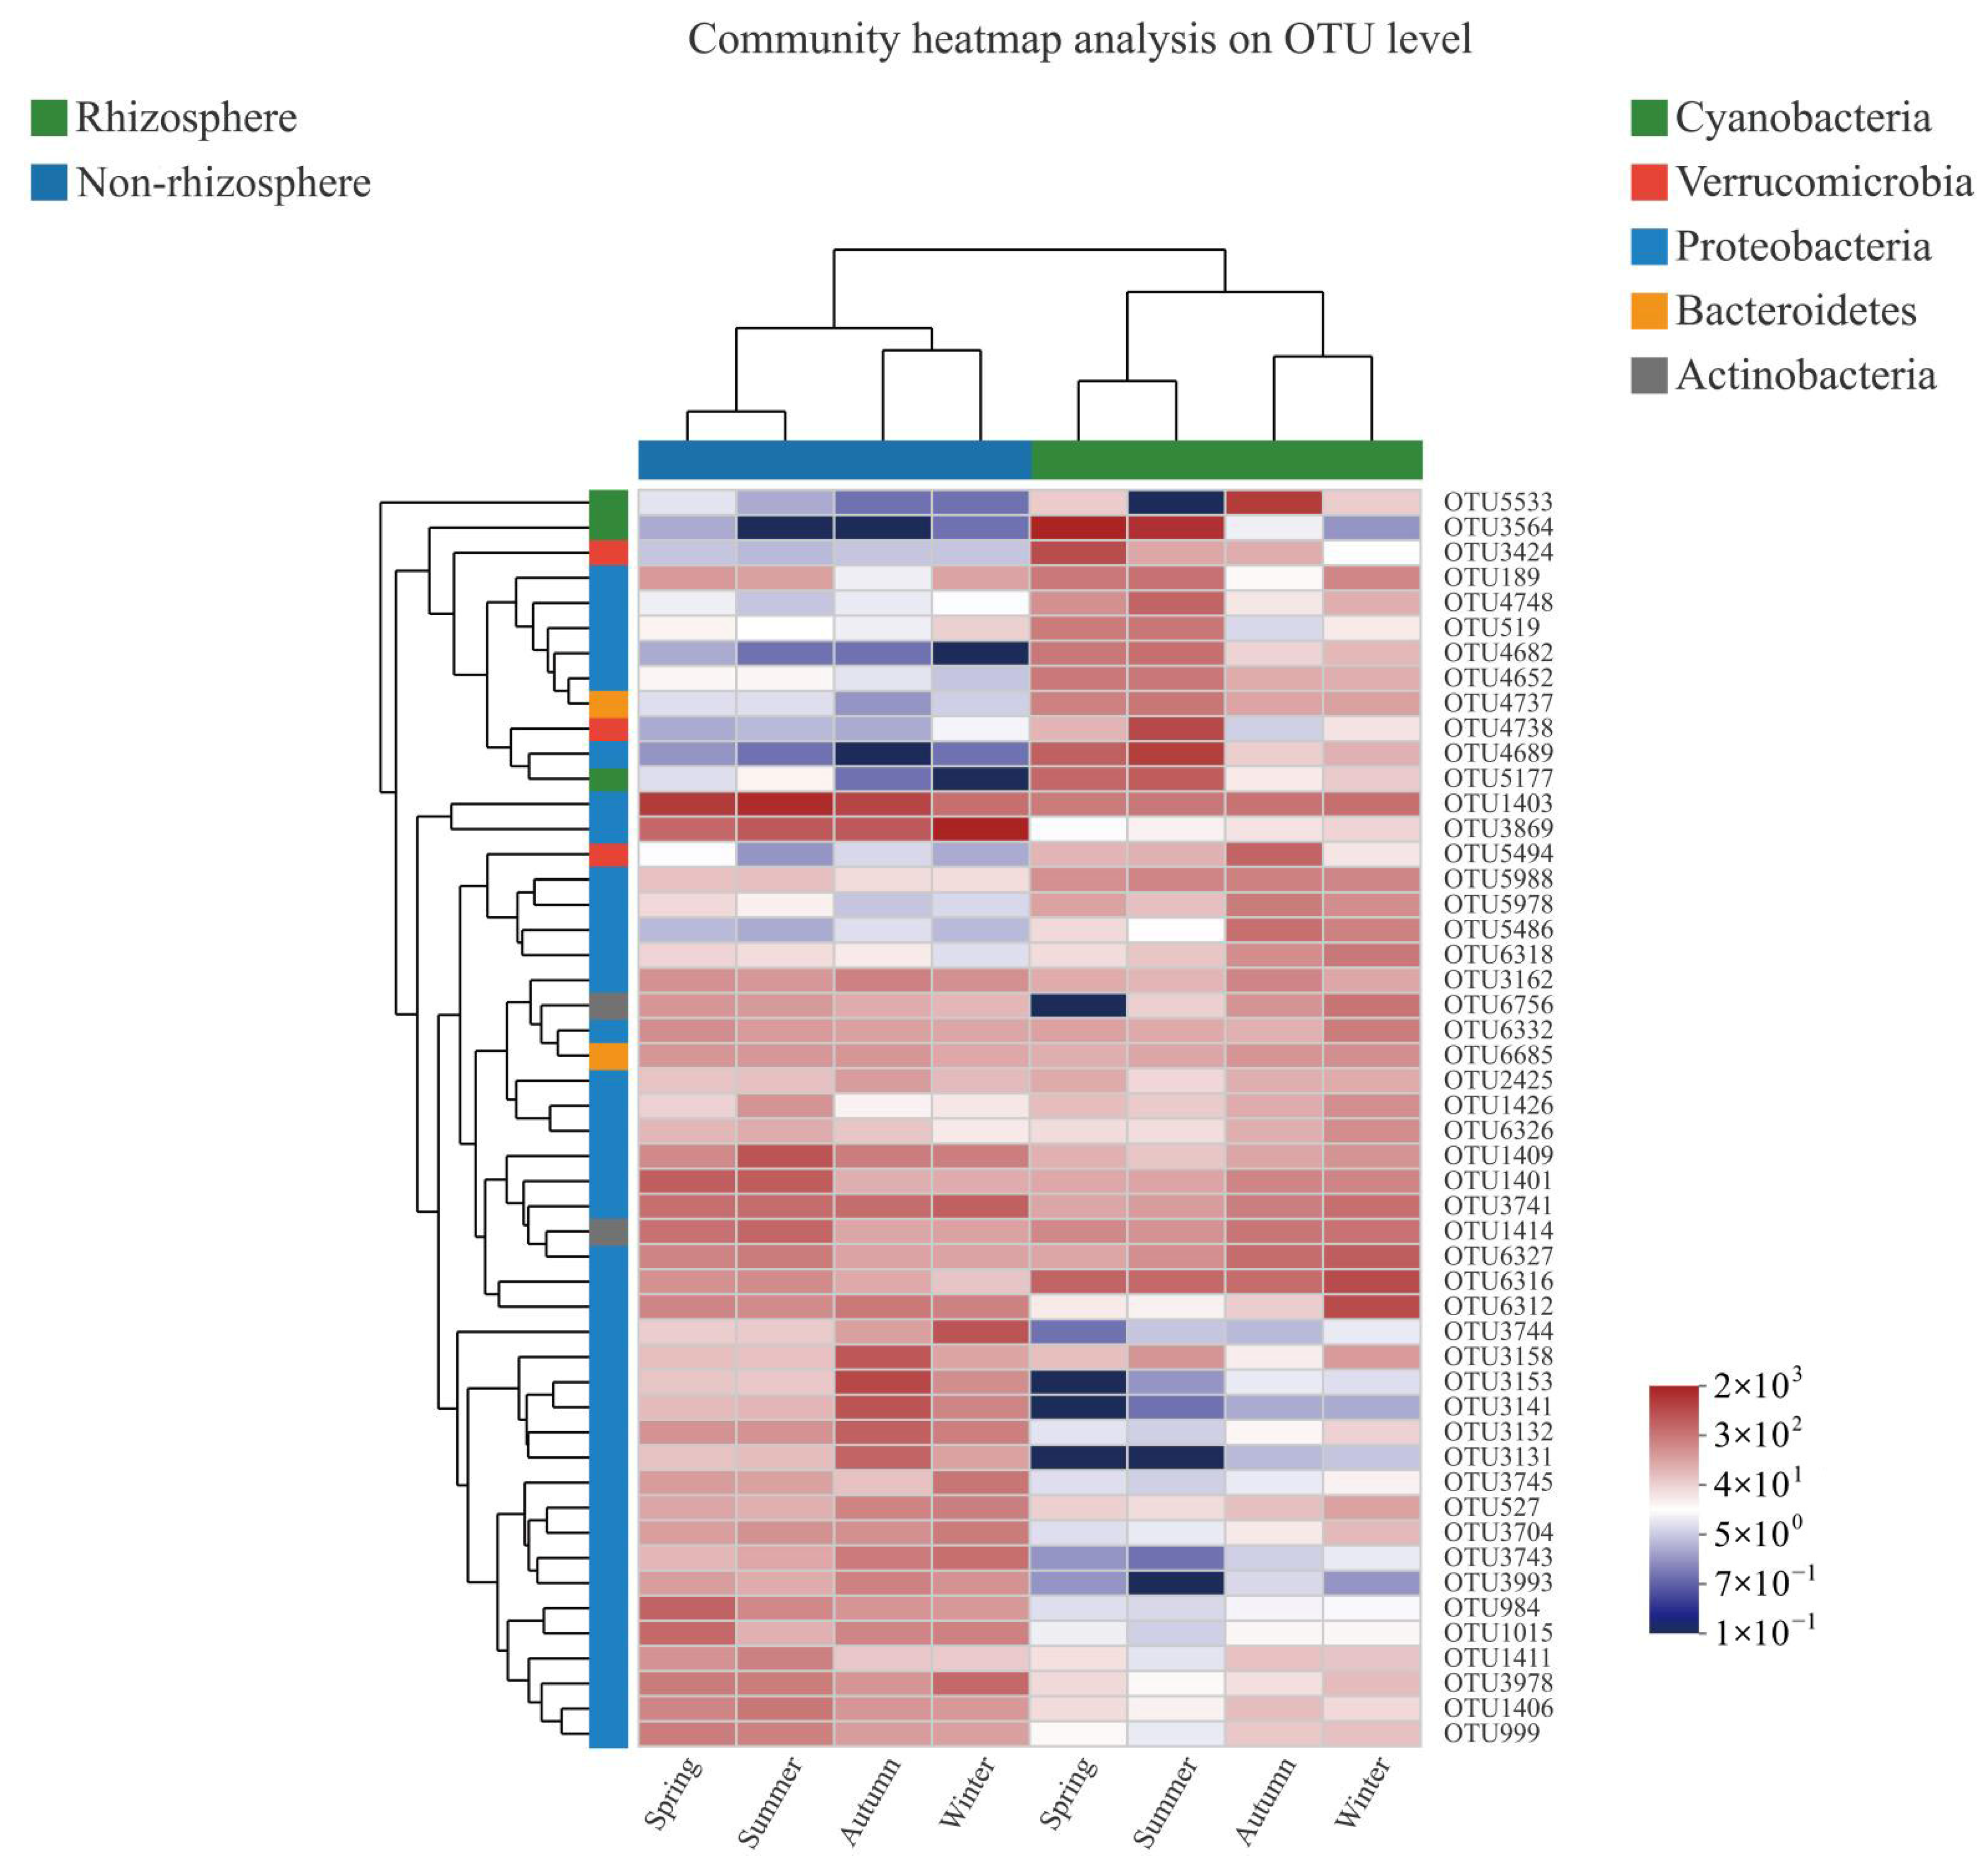
3.1. Bacterial α-Diversity and Its Taxonomic Composition

A total of 158,160 high-quality 16SrRNA sequences were obtained, and 1031 OTUs were obtained based on 97% sequence similarity. Dilution curve results showed that the number of OTUs tended to be stable, with an increase in sequencing depth. Additionally, the coverage range of samples was 99.43% to 99.60%, indicating that the sequencing depth of this experiment could cover most of the diversity of species. The Chao I and ACE indices of the eight samples ranged from 777.3733 to 945.0000 and from 770.4432 to 922.3090, respectively. Additionally, the Shannon and Simpson indices were 5.1772–5.6708 and 0.0087–0.0180, respectively (Table 2). The results of the independent variance T-test suggested that there was no significant difference in the α-diversity index of bacterial community between the rhizosphere and non-rhizosphere mangrove sediments in Hainan (Table 3).
The 16SrRNA gene classification results of the phylum-level classification showed that the abundance of Proteobacteria, Bacteroidetes, Actinobacteria, Cyanobacteria, Acidobacteria, and Verrucomicrobia (relative abundance > 2.50%) was highest, accounting for 93.36% of the total abundance (Figure 2). Proteobacteria was the most widely distributed species in the mangrove sediment system, accounting for 68.89% of the total abundance. Comparing rhizosphere and non-rhizosphere sediments showed that there were significant differences with five species in the top ten phyla (Figure 3). Among them, Proteobacteria had a high abundance in non-rhizosphere sediments, while Cyanobacteria and Verrucomicrobia were significantly enriched in the rhizosphere environment.

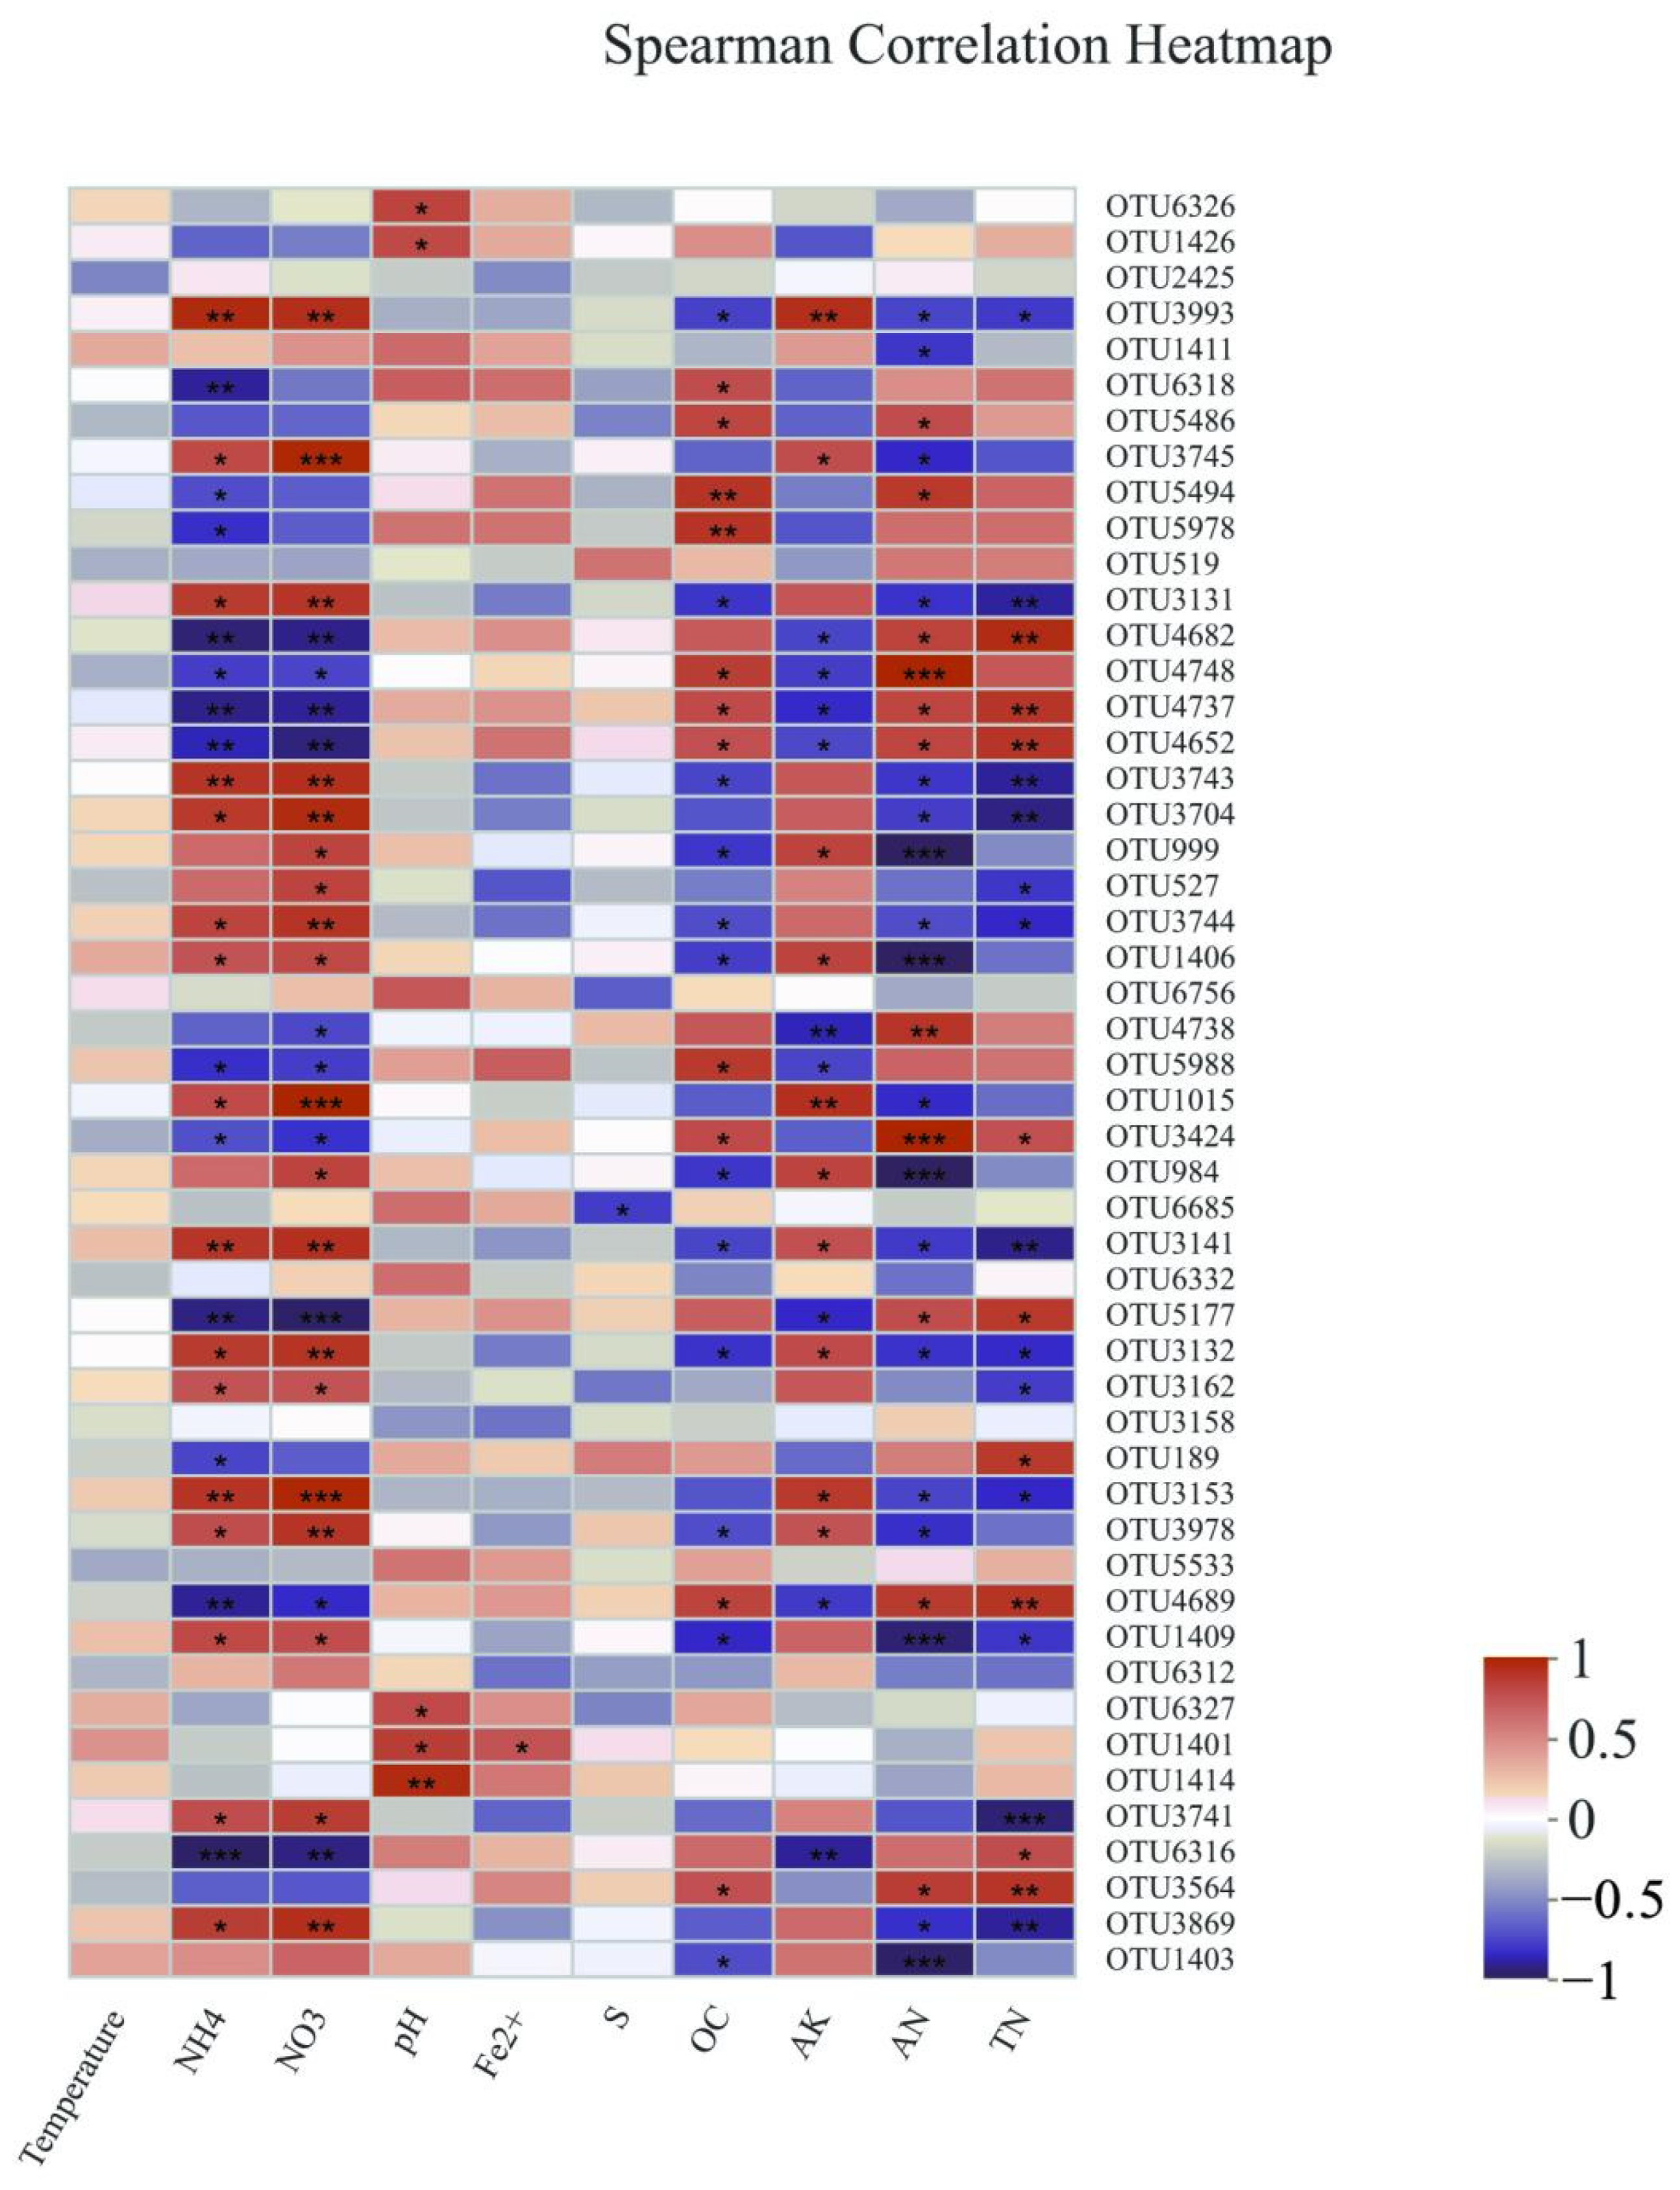
3.2. Diversity Characteristics and the Influential Factors of Bacterial Community β

The PCoA results showed that the distribution characteristics of the bacterial community structure were significantly affected by mangrove plants, and there were significant differences in bacterial communities between the rhizosphere and non-rhizosphere sediments (PERMANOVA, p < 0.001) (Figure 4). Similarly, the OTU clustering results based on the first 50 abundances also implied an obvious aggregation of bacterial communities. The bacterial communities from the rhizosphere sediments clustered in one branch, and the bacterial communities from the non-rhizosphere clustered in another branch (Figure 5). The correlation between the first 50 OTUs and environmental factors showed that OTU was significantly correlated with the majority of the environmental factors measured. This indicates that the environmental factors had significant regulatory effects on the abundance of major OTUs. The results also reveal that the nutrient salt concentration (NH4+ and NO3), total organic carbon (OC), available kalium (AK), available nitrogen (AN), and total nitrogen (TN) content in the sediments of mangroves in Hainan were the main environmental factors regulating the abundance of bacterial groups, whereas the temperature, pH, iron ion content (Fe2+), sulfide, and organic carbon content had weak regulatory effects (Figure 6). The results of RDA analysis also indicate that nearly all the measured environmental properties affected the bacterial structure of sediments except sulfide and Fe2+. This also explains 98.41% of the total variation in bacterial communities (Figure 7a). Moreover, the results also indicate that the structural changes in bacterial communities were significantly correlated with the relative abundance of Proteobacteria, Bacteroidetes, Actinobacteria, and Cyanobacteria (Figure 7b).

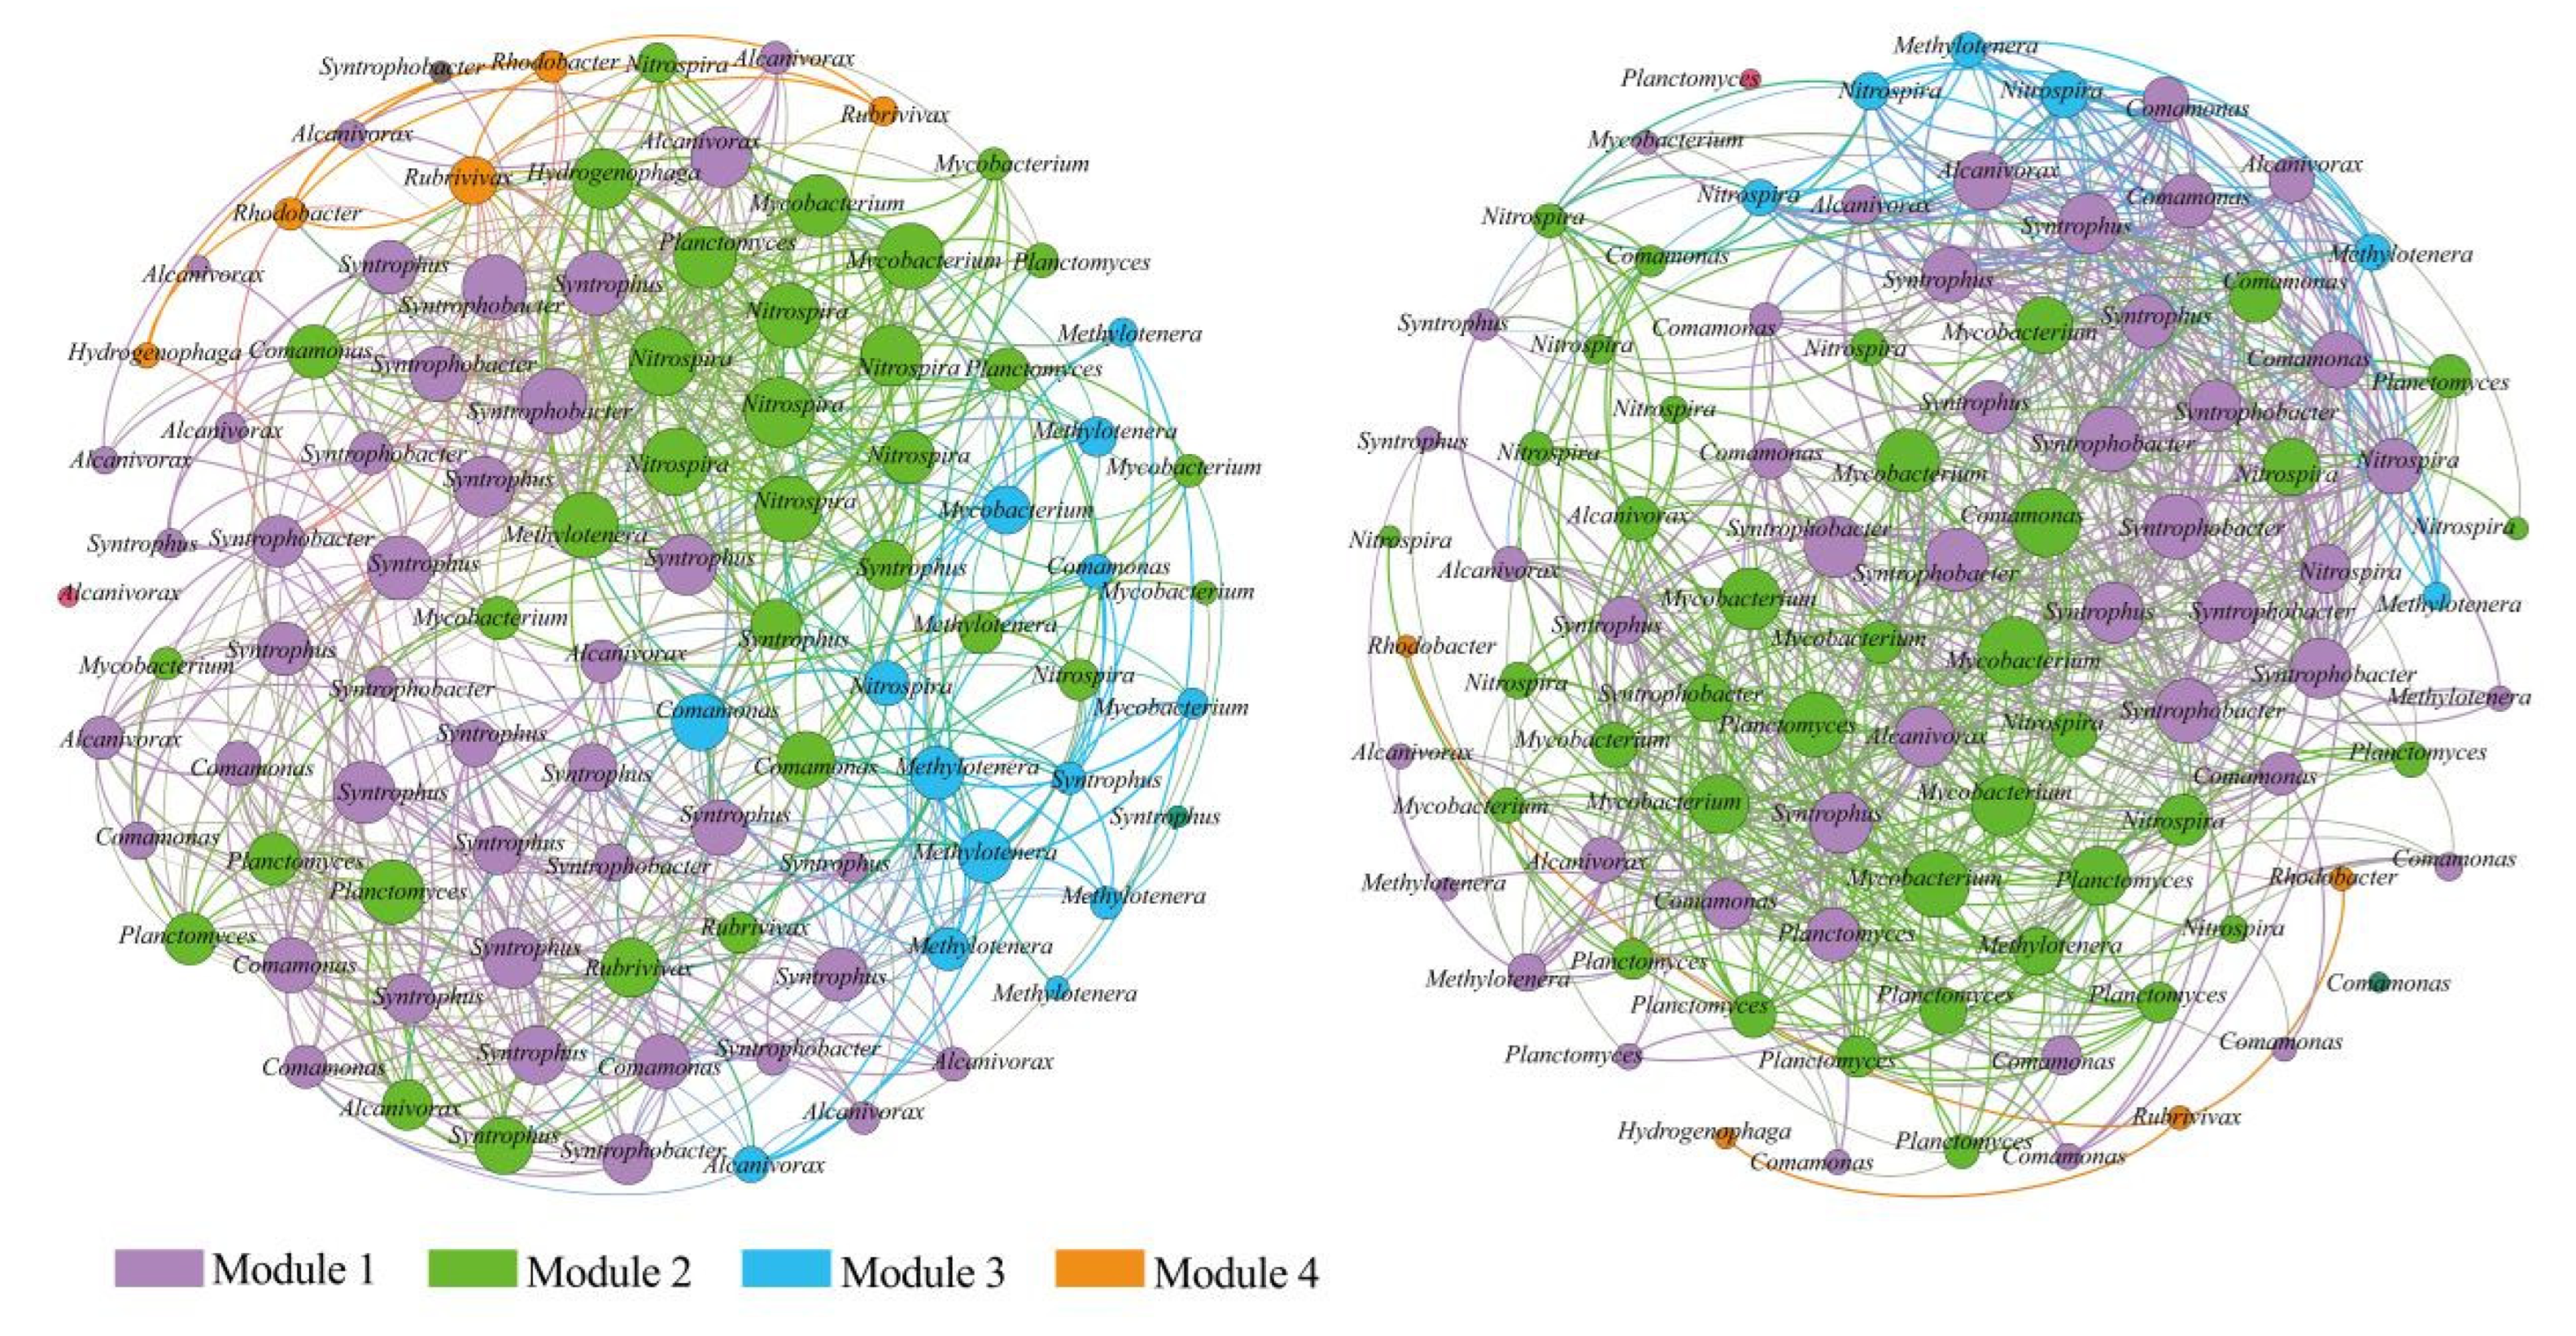
3.3. Interspecific Interactions of Bacterial Communities

Interkingdom relationships can be divided into four modules at the module level. The network diagram results of the co-occurrence analysis were obtained based on the correlation of the OTUs of bacterial microbial interactions in the top 100 abundances. The collinearity network of the rhizosphere bacterial community was composed of 100 “points” (nodes) (OTUs) and 782 “edges” (connections), and the collinearity network of the non-rhizosphere bacterial community was composed of 100 “points” (OTUs) and 693 “edges” (correlations). The fact that all module coefficients were greater than 0.4 shows the tightness of network connection, indicating that there was a close relationship among bacterial communities in sediments in this area (Figure 8). The network model results show that the network topology indexes (average path length (APL), average degree (AD), network diameter (ND), and clustering coefficient (CC)) of the rhizosphere bacteria were significantly higher than those of the non-rhizosphere bacteria, whereas the modularity index (MD) and the graph density (GD) were smaller, indicating that the relationship between the rhizosphere bacteria and the non-rhizosphere bacteria was closer than that of the non-rhizosphere bacteria (Table 4).

4. Discussion

4.1. Characteristics of Bacterial α-Diversity in Rhizosphere and Non-Rhizosphere Soils

Bacterial communities play a pivotal role in the material and energy cycle of ecosystems, and their diversity and community structure are important for maintaining ecosystem productivity, stability, and health [8,9,18]. A mangrove is a typical salt marsh plant, which is often colonized in the estuary area. This area is affected by the interaction of rivers and marine dynamics, and the disturbance is frequent. Therefore, the sediment bacterial community in this area is widely sourced, including marine microorganisms and terrestrial microorganisms, and it is also affected by aboveground plants, which may be the reason for the high bacterial diversity in this area [30]. At the same time, there was no significant difference in the α-diversity index between the rhizosphere and non-rhizosphere bacterial communities, indicating that the diversity of bacterial communities in this region was stable and that mangrove plants in this region could not affect the α-diversity characteristics of sediment bacterial communities. There are periodic tidal fluctuations in this region, as well as the influence of typhoons and upstream runoff emissions. Perhaps the stability of the bacterial community α-diversity is the result of the long-term adaptability of the bacterial community.

4.2. Important Factors Influencing Sediment Bacterial Community Structure

The results of community composition demonstrated that Proteobacteria showed absolute dominance in all phyla. These bacteria accounted for more than half of the total mangrove bacteria in the habitat. Proteobacteria were the most important species in global sediments, and previous studies have shown that a high abundance of this species was also observed in different ecosystems such as rivers, coasts, and marine sediments [31,32]. Our study also supports these views. Another species with high abundance was Bacteroidetes. Studies have shown that this phylum was significantly enriched in hydrocarbon-contaminated environments, which may be an important species for degrading organic polymers [33]. Therefore, the high abundance of Bacteroidetes in the study area may be due to the high organic carbon content in this area. The differences between Cyanophyta, Verrucosa, and Nitrospira in the rhizosphere and non-rhizosphere sediments were obvious, and the relative abundance in the rhizosphere sediments was significantly higher than that in non-rhizosphere sediments. Cyanobacteria, Verrucomicrobia, and Nitrospira were the main species of the carbon and nitrogen cycle, which played an important role in the global carbon and nitrogen cycle. Therefore, the enrichment of such species in the rhizosphere environment indicates that there could be the potential for a more active C/N cycle in the rhizosphere environment [34,35,36]. PcoA results showed that there were significant differences in bacterial community composition between the rhizosphere and non-rhizosphere (Figure 5), indicating that the composition of bacterial community in sediments was the mangrove plants’ key regulatory role. Vegetation can directly change the physical and chemical properties of sediments, such as salinity, organic carbon, and ammonia nitrogen concentration, thereby significantly affecting bacterial community composition [30]. Among the eight samples in this study, the results of correlation analysis and redundancy analysis showed that the bacterial community was mainly affected by organic carbon and nutrients. However, the environmental factors such as temperature and pH weakly regulated the bacterial community. Through root absorption, aboveground plants often have an obvious function of regulating nutrient elements in sediments, such as ammonia nitrogen concentration, and plants can also affect the form and content of carbon in sediments through rhizosphere secretions [37,38]. The results of this study highlight that the environmental factors of sediments could have a major role in the structural changes of bacterial communities in mangrove sediments, indicating that mangroves can change the composition of rhizosphere bacterial communities by affecting the physicochemical properties of sediments.

4.3. Co-occurrence Pattern Reveals Interspecific Relationships of Bacterial Communities

The results of the co-occurrence pattern analysis show that the bacterial community in the same module might have similar functional characteristics. In module 1, for example, Syntrophus, Syntrophobacter, Comamonas, and Alcanivorax are the main species involved in organic carbon degradation [39,40,41,42]. Modules 2 and 3, which mainly include Nitrospira, Methylotenera, Mycobacterium, and Planctomyces, are dominated by species involved in the C/N cycle [43], while module 4 is dominated by organic-pollutant-degradation-related bacterial communities such as Hydrogenophaga, Rubrivivax, and Rhodobacter [44]. The above-mentioned results illustrate that the bacterial communities with the same function in the mangrove ecosystem were significantly related. The co-occurrence pattern of microorganisms helps us to explore the relationship among bacterial community species [22]. The results of the network model of the rhizosphere bacteria and the non-rhizosphere bacterial community show that there was higher connectivity in the network structure of the rhizosphere bacterial community than that of the non-rhizosphere. This indicated that a closer relationship existed among bacterial community species in the rhizosphere environment. The mangrove rhizosphere is a special sediment microenvironment, which provides additional carbon sources and oxygen for bacterial communities in the rhizosphere environment due to the transport of plant rhizosphere secretion and oxygen [45,46]. This was beneficial to the attachment and reproduction of the rhizosphere’s bacterial communities, and this may be an important reason for the closer relationship between bacterial communities in this region.

5. Conclusions

There was no significant difference in the alpha diversity of bacterial communities between the rhizosphere and the non-rhizosphere. Mangrove plants regulate the composition of bacterial communities by regulating the physicochemical properties of sediments. The rhizosphere’s bacterial communities have closer relationships than those in the non-rhizosphere. This study provides a new research direction for the dynamic change and regulatory mechanism in the mangrove bacterial community in Hainan. Our results provide theoretical data for the ecological restoration and sustainable development of mangrove forests. In future work, more detailed soil physical and chemical information, climatic conditions, and microbial classification and functional information are needed to help us better understand and recognize the ecological and functional characteristics of microbial communities in the Hainan mangrove ecosystem.

Author Contributions

Funding acquisition, W.L.; Investigation, K.L.; Methodology, K.L.; Supervision, Q.Y. and W.L.; Validation, K.L., Q.Y. and Y.J.; Visualization, K.L.; Writing—original draft, K.L.; Writing—review & editing, K.L., Y.J. and W.L. All authors have read and agreed to the published version of the manuscript.

Funding

This work was supported by the Natural Science Foundation of Hainan province (2019RC012) and National Natural Science Foundation of China [No. 32160291].

Institutional Review Board Statement

Not applicable.

Informed Consent Statement

Not applicable.

Data Availability Statement

Not applicable.

Conflicts of Interest

The authors declare no conflict of interest.

References

  1. Barbier, E.B.; Koch, E.W.; Silliman, B.R.; Hacker, S.D.; Wolanski, E.; Primavera, J.; Granek, E.F.; Polasky, S.; Aswani, S.; Cramer, L.A.; et al. Coastal Ecosystem-Based Management with Nonlinear Ecological Functions and Values. Science 2008, 319, 321–323. [Google Scholar] [CrossRef]
  2. Twilley, R.R.; Chen, R.H.; Hargis, T. Carbon sinks in mangroves and their implications to carbon budget of tropical coastal ecosystems. Water Air Soil Pollut. 1992, 64, 265–288. [Google Scholar] [CrossRef]
  3. Pijush, B.; Arnab, P.; Sohan, S.; Sudip, N.; Anish, B.; Debojyoti, R.; Rudradip, P.; Abhrajyoti, G.; Dhrubajyoti, C.; Maitree, B. Bacterial diversity assessment of pristine mangrove microbial community from Dhulibhashani, Sundarbans using 16S rRNA gene tag sequencing. Genome Data 2016, 7, 76–78. [Google Scholar]
  4. Gomes, N.C.M.; Flocco, C.G.; Costa, R.; Junca, H.; Vilchez, R.; Pieper, D.H.; Krögerrecklenfort, E.; Paranhos, R.; Mendonça-Hagler, L.C.S.; Smalla, K. Mangrove microniches determine the structural and functional diversity of enriched petroleum hydrocarbon-degrading consortia. FEMS Microbiol. Ecol. 2010, 74, 276–290. [Google Scholar] [CrossRef] [Green Version]
  5. Alongi, D.M. Bacterial productivity and microbial biomass in tropical mangrove sediments. Microb. Ecol. 1988, 15, 59–79. [Google Scholar] [CrossRef]
  6. Feller, I.C.; Friess, D.A.; Krauss, K.W.; Lewis, R.R. The state of the world’s mangroves in the 21st century under climate change. Hydrobiologia 2017, 803, 1–12. [Google Scholar] [CrossRef] [Green Version]
  7. Trevathan-Tackett, S.M.; Sherman, C.D.; Huggett, M.J.; Campbell, A.; Laverock, B.; Hurtado-McCormick, V.; Seymour, J.; Firl, A.; Messer, L.F.; Ainsworth, T.; et al. A horizon scan of priorities for coastal marine microbiome research. Nat. Ecol. Evol. 2019, 3, 1509–1520. [Google Scholar] [CrossRef]
  8. Liu, J.; Li, X.; Yao, M. Research progress on assembly of plant rhizosphere microbial community. Acta Microbiol. Sin. 2021, 61, 231–248. [Google Scholar]
  9. Lin, X.; Hetharua, B.; Lin, L.; Xu, H.; Zheng, T.; He, Z.; Tian, Y. Mangrove Sediment Microbiome: Adaptive Microbial Assemblages and Their Routed Biogeochemical Processes in Yunxiao Mangrove National Nature Reserve, China. Microb. Ecol. 2018, 78, 57–69. [Google Scholar] [CrossRef]
  10. Cao, H.; Li, M.; Hong, Y.; Gu, J.D. Diversity and abundance of ammonia-oxidizing archaea and bacteria in polluted mangrove sediment. Syst. Appl. Microbiol. 2011, 34, 513–523. [Google Scholar] [CrossRef]
  11. Zhou, H.W.; Wong, A.H.Y.; Yu, R.M.K.; Park, Y.D.; Wong, Y.S.; Tam, N.F.Y. Polycyclic Aromatic Hydrocarbon-Induced Structural Shift of Bacterial Communities in Mangrove Sediment. Microb. Ecol. 2009, 58, 153–160. [Google Scholar] [CrossRef]
  12. Roesch, L.F.W.; Fulthorpe, R.R.; Riva, A.; Casella, G.; Hadwin, A.K.M.; Kent, A.D.; Daroub, S.H.; Camargo, F.A.O.; Farmerie, W.G.; Triplett, E.W. Pyrosequencing enumerates and contrasts soil microbial diversity. ISME J. 2007, 1, 283–290. [Google Scholar] [CrossRef]
  13. Bharathkumar, S.; Rameshkumar, N.; Paul, D.; Prabavathy, V.R.; Nair, S. Characterization of the predominant bacterial population of different mangrove rhizosphere soils using 16S rRNA gene-based single-strand conformation polymorphism (SSCP). World J. Microbiol. Biotechnol. 2008, 24, 387–394. [Google Scholar] [CrossRef]
  14. Dias, A.C.F.; Andreote, F.D.; Dini-Andreote, F.; Lacava, P.T.; Sá, A.L.B.; Melo, I.S.; Azevedo, J.L.; Araújo, W.L. Diversity and biotechnological potential of culturable bacteria from Brazilian mangrove sediment. World J. Microbiol. Biotechnol. 2009, 25, 1305–1311. [Google Scholar] [CrossRef]
  15. Chakraborty, A.; Bera, A.; Mukherjee, A.; Basak, P.; Khan, I.; Mondal, A.; Roy, A.; Bhattacharyya, A.; Sengupta, S.; Roy, D.; et al. Changing bacterial profile of Sundarbans, the world heritage mangrove: Impact of anthropogenic interventions. World J. Microbiol. Biotechnol. 2015, 31, 593–610. [Google Scholar] [CrossRef]
  16. Basak, P.; Pramanik, A.; Roy, R.; Chattopadhyay, D.; Bhattacharyya, M. Cataloguing the bacterial diversity of the Sundarbans mangrove, India in the light of metagenomics. Genome Data 2015, 4, 90–92. [Google Scholar] [CrossRef]
  17. Faust, K.; Raes, J. Microbial interactions: From networks to models. Nat. Rev. Genet. 2012, 10, 538–550. [Google Scholar] [CrossRef]
  18. Jiao, S.; Liu, Z.; Lin, Y.; Yang, J.; Chen, W.; Wei, G. Bacterial communities in oil contaminated soils: Biogeography and co-occurrence patterns. Soil Biol. Biochem. 2016, 98, 64–73. [Google Scholar] [CrossRef] [Green Version]
  19. Beman, J.M.; Steele, J.A.; Fuhrman, J.A. Co-occurrence patterns for abundant marine archaeal and bacterial lineages in the deep chlorophyll maximum of coastal California. ISME J. 2011, 5, 1077–1085. [Google Scholar] [CrossRef]
  20. Barberán, A.; Bates, S.T.; Casamayor, E.O.; Fierer, N. Using network analysis to explore co-occurrence patterns in soil microbial communities. ISME J. 2012, 6, 343–351. [Google Scholar] [CrossRef] [Green Version]
  21. Jiao, S.; Yang, Y.; Xu, Y.; Zhang, J.; Lu, Y. Balance between community assembly processes mediates species coexistence in agricultural soil microbiomes across eastern China. ISME J. 2020, 14, 202–216. [Google Scholar] [CrossRef]
  22. Stegen, J.C.; Lin, X.; Konopka, A.E.; Fredrickson, J.K. Stochastic and deterministic assembly processes in subsurface microbial communities. ISME J. 2012, 6, 1653–1664. [Google Scholar] [CrossRef] [Green Version]
  23. Chu, J.Y.; Zhang, J.P.; Zhou, X.H.; Liu, B.; Li, Y.M. A comparisonof an ammox bacterial abundance and community structures in three different emerged plants-related sediments. Curr. Microbiol. 2015, 71, 421–427. [Google Scholar] [CrossRef]
  24. Liu, D.; Fang, S.; Tian, Y.; Sx, C. Nitrogen transformations in the rhizosphere of different tree types in a seasonally flooded soil. Plant Soil Environ. 2014, 60, 249–254. [Google Scholar] [CrossRef] [Green Version]
  25. Bao, S.D. Soil and Agricultural Chemistry Analysis; Agriculture Publication: Beijing, China, 2000; pp. 355–356. [Google Scholar]
  26. Rodriguez, A.G. Simultaneous determination of iron, cobalt, nickel and copper by UV-visible spectrophotometry with multivariate calibration. Talanta 1998, 47, 463–470. [Google Scholar] [CrossRef]
  27. Niu, Z.-S.; Pan, H.; Guo, X.-P.; Lu, D.-P.; Feng, J.-N.; Chen, Y.-R.; Tou, F.-Y.; Liu, M.; Yang, Y. Sulphate-reducing bacteria (SRB) in the Yangtze Estuary sediments: Abundance, distribution and implications for the bioavailibility of metals. Sci. Total Environ. 2018, 634, 296–304. [Google Scholar] [CrossRef]
  28. Caporaso, J.G.; Lauber, C.L.; Walters, W.A.; Berg-Lyons, D.; Lozupone, C.A.; Turnbaugh, P.J.; Fierer, N.; Knight, R. Global patterns of 16S rRNA diversity at a depth of millions of sequences per sample. Proc. Natl. Acad. Sci. USA 2011, 108 (Suppl. 1), 4516–4522. [Google Scholar] [CrossRef] [Green Version]
  29. Newman, M.E.J. Modularity and community structure in networks. Proc. Natl. Acad. Sci. USA 2006, 103, 8577–8582. [Google Scholar] [CrossRef] [Green Version]
  30. Wang, H.T.; Su, J.Q.; Zheng, T.L.; Yang, X.R. Impacts of vegetation, tidal process, and depth on the activities, abundances, and community compositions of denitrifiers in mangrove sediment. Appl. Microbiol. Biotechnol. 2014, 98, 9375–9387. [Google Scholar] [CrossRef]
  31. Ghiglione, J.-F.; Galand, P.E.; Pommier, T.; Pedrós-Alió, C.; Maas, E.W.; Bakker, K.; Bertilson, S.; Kirchman, D.L.; Lovejoy, C.; Yager, P.L.; et al. Pole-to-pole biogeography of surface and deep marine bacterial communities. Proc. Natl. Acad. Sci. USA 2012, 109, 17633–17638. [Google Scholar] [CrossRef] [Green Version]
  32. Delgado-Baquerizo, M.; Oliverio, A.M.; Brewer, T.E.; Benavent-González, A.; Eldridge, D.J.; Bardgett, R.D.; Maestre, F.T.; Singh, B.K.; Fierer, N. A global atlas of the dominant bacteria found in soil. Science 2018, 359, 320–325. [Google Scholar] [CrossRef] [PubMed] [Green Version]
  33. Gomez, B.F.; Richter, M.; Schüler, M.; Pinhassi, J.; Acinas, S.; Gonzalez, J.; Pedrós-Alió, C. Ecology of marine Bacteroidetes: A comparative genomics approach. ISME J. 2013, 7, 1026–1037. [Google Scholar] [CrossRef] [PubMed] [Green Version]
  34. Lücker, S.; DeLong, E.F. A Nitrospirametagenome illuminates the physiology and evolution of globally important nitrite-oxidizing bacteria. Proc. Natl. Acad. Sci. USA 2010, 107, 13479–13484. [Google Scholar] [CrossRef] [PubMed] [Green Version]
  35. Affe, H.M.J.; Rigonato, J.; Nunes, J.M.C.; Menezes, M. Metagenomic Analysis of Cyanobacteria in an Oligotrophic Tropical Estuary, South Atlantic. Front. Microbiol. 2018, 9, 1393. [Google Scholar] [CrossRef]
  36. Chiang, E.; Schmidt, M.L.; Berry, M.A.; Biddanda, B.A.; Burtner, A.; Johengen, T.H.; Palladino, D.; Denef, V.J. Verrucomicrobia are prevalent in north-temperate freshwater lakes and display class-level preferences between lake habitats. PLoS ONE 2018, 13, e0195112. [Google Scholar]
  37. Sardans, J.; Peñuelas, J. The Role of Plants in the Effects of Global Change on Nutrient Availability and Stoichiometry in the Plant-Soil System. Plant Physiol. 2012, 160, 1741–1761. [Google Scholar] [CrossRef] [Green Version]
  38. Doornbos, R.F.; Loon, L.C.V.; Bakker, P.A.H.M. Impact of root exudates and plant defense signaling on bacterial communities in the rhizosphere. A review. Agron. Sustain. Dev. 2012, 32, 227–243. [Google Scholar] [CrossRef]
  39. Boone, D.R.; Bryant, M.P. Propionate-Degrading Bacterium, Syntrophobacter wolinii sp. nov. gen. nov., from Methanogenic Ecosystems. Appl. Environ. Microbiol. 1980, 40, 626–632. [Google Scholar] [CrossRef] [Green Version]
  40. Felföldi, T.; Székely, A.J.; Gorál, R.; Barkács, K.; Scheirich, G.; András, J.; Rácz, A.; Márialigeti, K. Polyphasic bacterial community analysis of an aerobic activated sludge removing phenols and thiocyanate from coke plant effluent. Bioresour. Technol. 2010, 101, 3406–3414. [Google Scholar] [CrossRef]
  41. Jackson, B.E.; Bhupathiraju, V.K.; Tanner, R.S.; Woese, C.R.; McInerney, M.J. Syntrophus aciditrophicus sp. nov., a new anaerobic bacterium that degrades fatty acids and benzoate in syntrophic association with hydrogen-using microorganisms. Arch. Microbiol. 1999, 171, 107–114. [Google Scholar] [CrossRef]
  42. Kasai, Y.; Kishira, H.; Sasaki, T.; Syutsubo, K.; Watanabe, K.; Harayama, S. Predominant growth of Alcanivorax strains in oil-contaminated and nutrient-supplemented sea water. Environ. Microbiol. 2002, 4, 141–147. [Google Scholar] [CrossRef] [PubMed]
  43. Schmid, M.C.; Maas, B.; Dapena, A.; van de Pas-Schoonen, K.; van de Vossenberg, J.; Kartal, B.; van Niftrik, L.; Schmidt, I.; Cirpus, I.; Kuenen, J.G.; et al. Biomarkers for In Situ Detection of Anaerobic Ammonium-Oxidizing (Anammox) Bacteria. Appl. Environ. Microbiol. 2005, 71, 1677–1684. [Google Scholar] [CrossRef] [PubMed] [Green Version]
  44. Roy, A.; Sar, P.; Sarkar, J.; Dutta, A.; Sarkar, P.; Gupta, A.; Mohapatra, B.; Pal, S.; Kazy, S.K. Petroleum hydrocarbon rich oil refinery sludge of North-East India harbours anaerobic, fermentative, sulfate-reducing, syntrophic and methanogenic microbial populations. BMC Microbiol. 2018, 18, 151. [Google Scholar] [CrossRef] [PubMed] [Green Version]
  45. De la Fuente Cantó, C.; Simonin, M.; King, E.; Moulin, L.; Bennett, M.J.; Castrillo, G.; Laplaze, L. An extended root phenotype: The rhizosphere, its formation and impacts on plant fitness. Plant J. 2020, 103, 951–964. [Google Scholar] [CrossRef] [Green Version]
  46. Brune, A. Life at the oxic–anoxic interface: Microbial activities and adaptations. FEMS Microbiol. Rev. 2000, 24, 691–710. [Google Scholar] [CrossRef]
Figure 1. Study site location.
Sustainability 14 07415 g001
Figure 2. The community structure of bacteria.
Sustainability 14 07415 g002
Figure 3. A phylum-level comparison of bacterial community structure between rhizosphere and non-rhizosphere.
Sustainability 14 07415 g003
Figure 4. The PCoA results based on OTU abundance.
Sustainability 14 07415 g004
Figure 5. The OTU heatmap and cluster analysis of the top 50 relative abundances.
Sustainability 14 07415 g005
Figure 6. Correlation analysis heat map of the top 50 OTUs in abundance and environmental factors. Note: the figure shows the correlation between environmental factors and OTUs with a warm tone indicating positive correlation and cool tone indicating a negative correlation. (* p < 0.05, ** p < 0.01, *** p < 0.001).
Sustainability 14 07415 g006
Figure 7. RDA results of bacterial community structure and environmental factors.
Sustainability 14 07415 g007
Figure 8. Network diagram of the bacterial community’s co-occurrence pattern. The network nodes are colored according to the module characteristics. The left figure is for the rhizosphere sample, and the right figure is for the non-rhizosphere sample.
Sustainability 14 07415 g008
Table 1. Physical and Chemical Properties of Rhizosphere and Non-rhizosphere Sediments in the Mangrove Wetland.
Temperature (°C)NH4+
(μg/g)
NO3
(μg/g)
pHFe2+
(mg/g)
S
(mg/kg)
OC
(g/kg)
AK
(mg/kg)
AN
(mg/kg)
TN
(mg/kg)
Rhizosphere
Spring17.5000 ± 1.32002.0000 ± 0.04002.5100 ± 0.21007.8100 ± 0.26000.8300 ± 0.08000.1500 ± 0.03000.8200 ± 0.350085.3300 ± 2.3400158.6500 ± 5.33001456.2500 ± 36.6500
Summer32.0000 ± 2.06001.8900 ± 0.36002.7700 ± 0.45007.6200 ± 0.18001.0700 ± 0.11000.0700 ± 0.01000.9900 ± 0.040066.2500 ± 4.2600179.62 ± 6.36001362.2600 ± 40.0500
Autumn25.0000 ± 1.05003.300 ± 0.43008.4900 ± 0.76007.9500 ± 0.4001.2400 ± 0.47000.0400 ± 0.04001.2000 ± 0.230085.4600 ± 1.5700132.5200 ± 2.1900599.3600 ± 29.3200
Winter18.0000 ± 2.33001.7000 ± 0.08007.6900 ± 0.17008.0200 ± 0.33000.7100 ± 0.79000.0500 ± 0.01000.9600 ± 0.130033.2500 ± 3.2600122.0500 ± 3.3500722.3600 ± 32.0600
Non-rhizosphere
Spring19.2500 ± 2.36008.8200 ± 0.590015.5100 ± 0.27008.0100 ± 0.23001.1800 ± 0.03000.0700 ± 0.02000.4000 ± 0.0200123.8900 ± 6.970065.3200 ± 5.2100933.4600 ± 42.3600
Summer36.5200 ± 0.300011.9500 ± 0.030011.6800 ± 0.37007.9800 ± 0.46001.0400 ± 0.22000.1000 ± 0.02000.3500 ± 0.140097.0500 ± 7.360059.6300 ± 4.3700567.3100 ± 39.4400
Autumn21.0000 ± 2.110012.9100 ± 0.060013.6600 ± 0.63007.0100 ± 0.39000.6100 ± 0.27000.0500 ± 0.01000.2200 ± 0.0500102.6500 ± 4.240076.9200 ± 2.770316.4500 ± 28.3700
Winter19.0000 ± 3.370014.7500 ± 0.440016.5500 ± 0.28007.4000 ± 0.66000.5300 ± 0.11000.0700 ± 0.02000.5200 ± 0.160099.3600 ± 3.3100100.2900 ± 5.5800231.6400 ± 19.2600
Table 2. α-diversity characteristics of the bacterial community in mangrove rhizosphere and non-rhizosphere sediments.
SobsShannonSimpsonAceChao
RhizosphereSpring736.00005.29150.0181795.0025816.8154
Summer714.00005.17720.0167770.4432777.3733
Autumn861.00005.67080.0090922.3090945.0000
Winter853.00005.64630.0087910.7371930.8571
Non-rhizosphereSpring835.00005.60250.0098867.7590896.1579
Summer825.00005.46110.0143858.1264870.3088
Autumn750.00005.32820.0123815.6761843.9231
Winter762.00005.28440.0187814.8643829.8082
Table 3. Comparison of α-diversity between rhizosphere and non-rhizosphere bacterial communities (n = 4).
EstimatorsNon-Rhizosphere
Mean
Non-Rhizosphere
SD
Rhizosphere
Mean
Rhizosphere
SD
p-Value
Sobs793.0000 43.1970 791.0000 76.8070 0.9653
Shannon5.4191 0.1435 5.4465 0.2495 0.8552
Simpson0.0138 0.0037 0.0131 0.0049 0.8334
ACE839.1100 27.8050 849.6200 78.0410 0.8081
Chao860.0500 29.3470 867.5100 83.0910 0.8711
Table 4. Topological properties of the bacterial co-occurrence network in sediments.
NodesEdgesAverage Path Length (APL)Modularity Index (MD)Graph Density
(GD)
Average Degree (AD)Network Diameter (ND)Clustering Coefficient (CC)
Rhizosphere samples100.0000 782.0000 5.7580 0.4790 0.1170 10.2900 11.0000 0.9550
Non-rhizosphere samples100.0000 693.0000 2.4560 0.5860 0.1250 9.6400 6.0000 0.6580
Publisher’s Note: MDPI stays neutral with regard to jurisdictional claims in published maps and institutional affiliations.

