Article

Spatial Distribution and Accessibility of High Level Scenic Spots in Inner Mongolia

1
School of Economics and Management, Northwest University, Xi’an 710127, China
2
School of Tourism and Culture, Guangdong Eco-engineering Polytechnic, Guangzhou 510520, China
*
Author to whom correspondence should be addressed.
Sustainability 2022, 14(12), 7329; https://doi.org/10.3390/su14127329
Submission received: 16 April 2022 / Revised: 8 June 2022 / Accepted: 13 June 2022 / Published: 15 June 2022
(This article belongs to the Topic Sustainability in Hospitality and Tourism Management)

Abstract

:
Based on the data of high-level scenic spots in Inner Mongolia, the methods of the nearest neighbor index, kernel density, accessibility, and spatial autocorrelation are used to systematically sort out the spatial distribution pattern, accessibility, and influencing factors of various types of scenic spots. The following conclusions are drawn from the analysis. The spatial distribution of different types of tourist attractions in Inner Mongolia is in a state of “small agglomeration and large dispersion”. The spatial accessibility of different types of tourist attractions in Inner Mongolia is generally poor, and the temporal accessibility presents an inverted U-shaped distribution over time. The county-level accessibility of different types of scenic spots in Inner Mongolia is relatively poor, basically showing an oblique distribution pattern of low in the west and high in the east. The influencing factors of the spatial distribution pattern and accessibility of various scenic spots in Inner Mongolia mainly include the natural environment, transportation network, resource endowment, and economic level. This study proposes an optimal path for accessibility according to the aspects of the design of tourism scenic areas in a circle and the construction of tourist traffic and facilities, as well as the linkage design of tourist routes.

1. Introduction

Tourism is a multi-compound organic whole [1]; scenic spots are the carrier of tourism supply and the cornerstone of tourism development, and they are the core components of the tourism industry. Among them, the high-level scenic spot is the key to the innovation and high-quality development of regional tourism and is also representative of the brand image of tourism spots [2]. The spatial structure of regional scenic spots not only involves the distribution state of scenic spots and the combination of elements but also directly influences the spatial behavior of tourists and finally influences the realization of tourist benefits [3,4]. Pan et al. took A-class attractions as examples to analyze the spatial distribution characteristics of 2,424 A-class tourist attractions in China through methods of the nearest neighbor index, K index, and hot spot clustering based on GIS technologies. Grid cost weighted distance algorithm was applied to compute the spatial accessibility of China’s A-class tourist attractions and measure the overall accessibility of county units [3]. The spatial distribution of scenic spots has a certain influence on tourists’ temporal–spatial behavior, regional tourism income, and the level of social development. Foreign scholars began to study the spatial structure of tourism early and mainly used the location theory, the central periphery theory, and the core edge model to explore the tourist market [5], the spatial structure, and the evolution process of tourism destination [6,7]; nevertheless, there are few studies on the spatial structure of scenic spots. At present, there is a lot of research on the spatial pattern of scenic spots in China, mainly focusing on the spatial distribution characteristics of scenic spots [8,9], influencing factors [10,11], time–space evolution [12], optimal path [13], etc. Ma et al. combined multiplex spatial statistical methods, including standard deviation elliptic analysis, kernel density estimation, and global spatial autocorrelation, to measure the spatial distribution characteristics of Great Xiangxi high-class tourist attractions and applied the Global Regression (OLS) model and the Geographically Weighted Regression (GWR) model to analyze the spatial heterogeneity in the influential factors of Great Xiangxi high-class tourist attractions [10]. The research areas are mainly national, regional and provincial [14]. Guo et al. adopted the approach to combining big data and traditional geographical information systems with studying the overall spatial distribution pattern, the distribution orientations, and spatial distribution characteristics of specific cities using the POI (Point of Interest) data of Shanxi tourist attractions as the research object [15]. Most of the research objects are all scenic spots, and some scholars have recently classified scenic spots. The main research methods are mathematical statistics and spatial analysis [16]. Tang et al. employed the GIS spatial analysis method respectively to dissect the administrative distribution characteristics of Changsha A-class tourist attractions and unravel the distribution correlations among the five factors of Changsha, including DEM, NDVI, rivers, GDP, and transportation [17].
Spatial accessibility refers to the ability to reach a designated place at an appropriate time and rely on traffic facilities, depending on the person’s mobility and the opportunity to achieve the goal by moving [17,18]. Since Hansen first proposed the concept of accessibility in 1959 [19], the foreign scholars have carried out thorough research on the accessibility, and its research content mainly includes the social public service facilities node layout and the location [20], the road net, and the different region accessibility relations as well as the influence factors and so on [21]. The study area is relatively micro, mainly involving the accessibility of specific places (schools, parks, hospitals, etc.) [22]. The main research methods are the moving search method, 2SFCA, gravitation method, gravity model, etc. [23]. At present, the domestic scholars mostly concentrate on the public facilities [24], green land of parks [25], and the influential factors of accessibility [26]. Yin et al. took 258 tourism-driven poverty alleviation key villages in the Wuling Mountain area, Hubei Province, as research samples, toward which grid cost weighted distance algorithm and the Geographically Weighted Regression (GWR) model were utilized for studies on the tourist transportation accessibility and the corresponding influence factors, as well as the influence extent spatially and the difference in influence directions [27], the research areas are predominantly regional urban agglomeration [27], scenic spots [28] and railway lines [29]. Yan et al. operated the ArcGIS spatial analysis method, accessibility model, and gravity model to investigate the impact of the launch of China’s “four vertical and four horizontal” high-speed trains on the accessibility of the cities along the railway and the economically related spatial structure [30]. The research method is based on the network cost method [30], network analysis [31], and space syntax [32]. Jia et al. optimized the model for accessibility computation with a layered grid cost method exampled by the Yangtze River Economic Belt. Indicators including weighted average travelling time, daily accessibility index and tourist utility function were applied to quantitatively measure and comprehensively analyze the “temporal-spatial compression” effect of high-speed trains on regional tourism [31]. A correct understanding of the differences in the spatial distribution and accessibility of scenic spots is the basic work to realize the optimal allocation of tourist resources and the development of tourist industry [33]. Zhu et al. comprehensively applied GIS spatial analysis method to establish overall assessment for the spatial structure and the accessibility for A-class tourist attractions of different categories in South Anhui International Cultural tourism demonstration Zone, and to investigate the patterns in spatial differentiation [34]. In order to further broaden the research content of the spatial pattern of the existing scenic spots, this study combines the spatial pattern of the scenic spots with the accessible pattern in order to provide the theoretical support for the planning and layout of scenic spots.
This study systematically reveals the spatial distribution and accessibility of scenic spots, clarifies the characteristics of regional differentiation, and clarifies the internal relationship between the distribution and accessibility of scenic spots and the factors such as natural environment, resource endowment, transportation network, and economic level, which plays a key role in the development of tourism industry. However, there are relatively few studies on frontier ethnic areas such as Inner Mongolia, and the existing studies in Inner Mongolia mainly focus on resource evaluation [35], image perception [36], and the farmer’s livelihood [37]. The research on the spatial distribution pattern and accessibility of scenic spots is relatively lacking. This study took the high-level scenic spots in Inner Mongolia as the research objects, which is an innovation in the study of the spatial distribution and accessibility of tourism, enriching the study of tourism system theory and expanding the research scope of tourism geography; which is especially a useful attempt in the study of spatial tourism structure. At the same time, this study broadened the research content of the existing spatial pattern of scenic areas; the study, combining the spatial distribution with the accessibility distribution pattern of scenic spots, can provide theoretical support for the planning layout of scenic spots. In addition, this study can also provide a scientific basis for the location, construction, and development of scenic spots, which will contribute to the planning direction of scenic spots and the renewal of urban space in the future; it can also provide a reference for the prediction and positioning of the visitor market of scenic spots. In a word, the measure and analysis of the spatial pattern and accessibility of the high-level scenic spots in Inner Mongolia are significant from three perspectives, including the macro level of governments, the medium level of enterprises, and the micro level of tourists, which has a key role in the sustainable development of these three perspectives.
Based on this study, the high-level scenic spots (3A and above) in Inner Mongolia were chosen as the research objects. First of all, this study adopted GIS spatial analysis to identify the proximity index and the kernel density of Inner Mongolia’s high-class tourist attractions, which reflected the distribution patterns of high-class tourist attractions. Subsequently, based on the distribution and the road network structure of high-class tourist attractions, GIS technologies were applied to discuss the accessibility spatial pattern of different-typed tourist attractions in Inner Mongolia. Thirdly, the accessibility factors of high-level scenic spots in Inner Mongolia were identified, and the paths for optimizing the accessibility of high-level scenic spots in Inner Mongolia were proposed in order to provide a reference for improving the accessibility of scenic spots in Inner Mongolia, promoting high-quality development facilitation and relevant policy making.

2. Materials and Methods

2.1. Study Area

The Inner Mongolia Autonomous Region is situated in the northern frontier of China, across northeast, north, and northwest China, adjacent to Heilongjiang, Jilin, and 8 other provinces, bordering on Russia, Mongolia, located at 37.24–53.23° N, and 97.12–126.04° E; the whole region consists of 9 cities and 3 leagues, and the total area is 1.18 million square kilometers, which has abundant grassland, forest, mountain, river and desert, and other natural resources and Manchu and Mongolian culture, ethnic customs, border ports, and other human tourism resources. In recent years, Inner Mongolia has made every effort to create the brand image of “bright Inner Mongolia is in the north of the motherland”. In 2020, Inner Mongolia planned to promote epidemic prevention and control and cultural tourism; the year-round reception of domestic tourists and domestic tourism revenue reached 125 million people and RMB240.406 billion, which means that tourism has been developing well.

2.2. Data Sources

The list of the high-level scenic spots in Inner Mongolia was obtained from the website of the Department of Culture and Tourism of the Inner Mongolia Autonomous Region. Based on the basic information of the scenic spots, the classification system of the high-level scenic spots in Inner Mongolia was constructed by referring to the existing classification research and combining it with the “Classification, Investigation and Evaluation of Tourist Resources” (GB/T 18972-2017). There are 277 high-level scenic spots in Inner Mongolia, among which 164 are natural, and 113 are human (additionally, 5A, 4A, and 3A scenic spots have 6, 139, and 132, respectively). The spatial coordinate data of scenic spots were acquired by Google Earth, and the geographical coordinate data of scenic spots were verified by using Baidu map, and the partial deviation data have been corrected. Geospatial Data Cloud (available at http://www.gscloud.cn/, accessed on 1 June 2022) was derived from vector data such as administrative division, watershed boundary, and river, and the road networks of different grades were gained from “China Traffic Map Atlas 2020” [38].

2.3. Research Methods

2.3.1. Nearest Neighbor Index

The nearest neighbor index (R) represents the degree of proximity of point elements in geographical space, and it can accurately and objectively determine the attribute of layout pattern [39], and it is widely used in the spatial structure analysis of scenic spots. The nearest index indicates the degree of the mutual proximity of point elements (high-level scenic spots in Inner Mongolia) in geographical space. When R < 1, the spots fit aggregated distribution; whilst R = 1, the spots fit random distribution; If R > 1, the spots fit uniform distribution.
R = r I r E
In the formula: r I is the average actual nearest neighbor distance; r E = 1 2 D = 1 2 n / A is the theoretical nearest distance, A is the area of the spatial domain, D is density of points and n is the number of points.

2.3.2. Kernel Density Analysis

Kernel density estimation (KDE) can directly reflect the scattered or aggregated characteristics of geographical elements in the space [40]. KDE was used to study the spatial sets of high-level scenic spots in Inner Mongolia. The larger the value, the stronger the concentration of high-level scenic spots in Inner Mongolia.
K ( X ) = 1 n d i = 1 n a ( x X i d )
In the formula: d denotes the bandwidth; n represents the number of points, x is the estimated point, Xi is the event point, x X i is the distance from the estimated point to the event point Xi, a ( x X i d ) is the kernel function.

2.3.3. Accessibility Measure

Accessibility can be utilized to measure the travel time from one point to the nearest scenic spot in the region, which can reveal the degree of convenience with respect to accessing scenic spots for tourists; it helps to clarify the relationship between scenic spots and traffic networks. The formula is as follows [34]:
A i = min ( M j T i j )
In the formula: i and j are the scenic spots in Inner Mongolia. Tij is the travel time of the shortest route for the point i to reach the scenic spot j in the traffic network. Mj is the weight of scenic spot j, if only traffic accessibility is studied, the value is 1; Ai is the accessibility of inner point i in Inner Mongolia. According to the speed provided to different levels of roads, that is, high-speed railway, ordinary railway, high-speed road, national road, provincial road, and county road, the speed is set to 250, 100, 100, 80, 60, 40 km/h respectively. The core steps of the shortest cost-weighted distance method include rasterizing the original vector base map with a 1 km × 1 km raster grid to obtain a total of 2,233,871 effective grids in Inner Mongolia; assigning different speeds to different roads, and then assigning different time weights to the grids; using ArcGIS platform to calculate the result of the time from each grid to the nearest scenic spot, and in order to find out the accessibility of scenic spots in the whole region.
In order to reflect the spatial structure of the accessibility of scenic spots on the administrative unit’s regional level as a whole and to depict the degree of convenience of tourists’ daily trips in the region more directly, the average value of the accessibility of grid spots in the county-level units in Inner Mongolia was calculated to reflect the accessibility of the whole county-level units. The formula is as follows:
R j = i = 1 n j A i / n j
In the formula: Rj is the accessibility of the overall scenic spots for No. j county-level unit; Ai is the accessibility of scenic spots for No. i grid of county-level units; nj is the total number of grids for No. j county-level unit.

2.3.4. Spatial Autocorrelation

Based on the calculated data of county unit accessibility in Inner Mongolia, the global Moran’s I index of ESDA was used to detect the spatial correlation model of county unit accessibility [41]. If Moran’s I is positive at provided significance level, it shows that the regions with higher (or lower) accessibility are obviously clustered in space. On the contrary, the regions with different attributes are clustered together, and the regional differences are obvious. However, Moran’s I index can only be used to evaluate the agglomeration of the whole region and cannot reflect the distribution of the cold and hot spots of the accessibility in the recognition space, that is, the specific county units. Therefore, Getis–Ord G i * was utilized to analyze the identification of hot spots. The formula is as follows:
G i * ( d ) = j = 1 n W i j ( d ) X j / j = 1 n X j
The standardization process for G i * ( d ) can be as follows:
Z ( G i * ) = [ G i * E ( G i * ) ] / V a r ( G i * )
In the formula: E ( G i * ) , V a r ( G i * ) and W i j ( d ) are the matrix of expectation, variance, and spatial weight, respectively. The matrix of spatial weight reflects the dependency relationship of individuals in space, W i j ( d ) represents the impact degree of individual i to individual j in space, Xj is the attribute value of the location j. When it shows statistical significance, if Z(Gi*) scores over 0, the higher the score, the denser the high-value clustering of target object attributes (to form hot spots); when Z(Gi*) scores below 0, the lower the score, the denser the low-value clustering of target object attributes (to form cold spots). The values of Moran’s I coefficient are in the range of [−1, 1]. When its value is greater than 0, it indicates that there is spatial positive correlation in the study area, and the closer the value is to 1, the stronger the spatial positive autocorrelation, and the value of the study object is aggregated distribution; when its value is less than 0, it indicates that there is spatial negative correlation in the study area, and the closer the value is to −1, the stronger the spatial negative autocorrelation, and the value of the study object is discrete mutually exclusive distribution; when its value is close to 0, it shows random distribution and that there is no autocorrelation among the study area.

3. Results of the Study

3.1. Spatial Distribution Characteristics

By using ArcGIS10.2 for calculation, the nearest neighbor index of all the scenic spots in Inner Mongolia is 0.465; the nearest neighbor index of human spots is 0.436, and the nearest neighbor index of natural spots is 0.577. Among them, the gathering degree of natural spots is the highest, and the gathering degree of human spots is the lowest. However, on the whole, the clustering degree of each kind of scenic spot is relatively low, and the distribution of scenic spots is relatively dispersed, which needs to promote the cooperation and high-quality development of the scenic spots in Inner Mongolia. Through the kernel density analysis (Figure 1), it can be seen that the distribution pattern of the human scenic spots and all the scenic spots in Inner Mongolia are very similar. The distribution difference of the kernel density in all kinds of scenic spots in Inner Mongolia is obvious, which shows the phenomenon of “small agglomeration and big dispersion”. The core scenic spots are rare, which are mainly in Huhhot (the provincial capital city of Inner Mongolia) and some surrounding areas; these scenic spots are highly correlated and developing well, while other areas are not high kernel density agglomeration areas. The areas with high density are mainly Huhhot, Ulanqab, and Ordos; the second is Hulun Buir Chifeng, etc., and the other cities have a relatively low degree of agglomeration. Moreover, the large number of scenic spots in Ordos, there are some famous scenic spots such as Xiangsha Bay and the mausoleum of Genghis Khan. Although Huhhot is short of 5A and scenic spots, it has a relatively large number of scenic spots. At the same time, because the economic strength of this area is relatively strong, it can drive the surrounding area to develop together. Therefore, it forms the most concentrated high kernel density area. Because of the wide area of Inner Mongolia, the relatively low abundance of tourism resources in most prefectures and counties of Inner Mongolia, the insufficient development of scenic spots, and the backwardness of infrastructure, there exists a large area with low kernel density. It can be seen from the map that there is a high kernel density area and a small number of low kernel density areas in all the scenic spots and human scenic spots, but there are three high kernel density areas and many low kernel density areas in the natural scenic spots, which shows that the correlation of the distribution of natural scenic spots in Inner Mongolia is relatively strong and the synergistic effect is relatively obvious.

3.2. Overall Spatial Accessibility Distribution Pattern

According to different kinds of scenic spots in Inner Mongolia as diffusion points, the accessibility of scenic spots in Inner Mongolia (Figure 2) was measured as 0–2 h, 2–4 h, 4–6 h, 6–8 h, 8–10 h, 10–12 h and more than 12 h (Table 1). The spatial accessibility distribution patterns of all the scenic spots, human scenic spots, and natural scenic spots in Inner Mongolia are similar, and the overall accessibility is relatively poor, but there are some differences; the average accessibility time values are 4.35 h, 4.23 h, and 4.50 h respectively. According to the average accessible time, the accessible time to natural attractions is 0.27 h shorter than that to humanities attractions, and thereby the accessibility of natural scenic spots is better than that of human scenic spots. Because the area of Inner Mongolia is relatively large and the density of the road network is relatively low, and the average reaching time of all kinds of scenic spots in Inner Mongolia is relatively poor. The area with accessibility of less than 2 h is only about 26%; the proportion within 6 h is basically 70%, and the highest is more than 18 h. Due to topography, hydrology, traffic network, and economic level, the accessibility of various scenic spots varies greatly, among which Hulun Buir, Alashan League, and Northwest of Xilingol League are relatively poor areas. Most of these areas are blocked by mountains, deserts or hills, or platforms and plateaus, such as the Greater Khingan Range in Hulun Buir, Badain Jaran, Tenggeli, Ulanbu Desert in Alashan League, Balongmagelong Hill, Ujumqin Wave-shaped Flat Plateau, and Abaga Lava Platform in Xilin Gol League. The areas with relatively good accessibility are Huhhot, Ordos, Baotou, Chifeng, and Tongliao. Most of these areas have relatively good topography and high traffic network density, which mainly include Beijing-Baotong Line, Jingtong Line, Daguang High-speed Road, Xingba High-speed Road, and Jingxin High-speed Road. According to the distribution frequency of accessibility of different kinds of scenic spots, the distribution frequency of all scenic spots, human scenic spots, and natural scenic spots was the highest within 2–4 h; the next was within 2 h, and then gradually decreased after 4 h, which presents an inverted U-shaped distribution pattern with the progression of time.

3.3. Spatial Differentiation of Accessibility at County Level

In order to analyze the regional difference in the accessibility of Inner Mongolia scenic spots, the method is to measure the accessibility of Inner Mongolia scenic spots according to the county unit. Inner Mongolia consists of 103 counties, the county unit accessibility can be divided into seven grades (Figure 3) by the natural fracture method, and the number of different accessibility grades (Table 2) is also counted. The accessibility of different types of scenic spots is relatively poor, and their spatial distribution patterns are basically the same though they are different. At the same time, the number of scenic spots of different types of scenic spots in different periods is very similar, which is very close to the traffic network. The spatial distribution pattern of the county unit accessibility of various scenic spots in Inner Mongolia is obviously different, which basically shows an oblique-line pattern of low-west and high-east, in which the accessibility of the counties in the northeast and southwest is relatively poor, and the accessibility of the counties in the southeast of Inner Mongolia is relatively good. In addition, the lowest accessibility time of all the scenic spots is about 0.08 h, but the highest accessibility time is 5.23 h. Among them, each county area of Huhhot, each county area of Baotou south, each county area of Ordos east, each county area of Ulanqab south, each county area of Chifeng south, and each county area of Tongliao south are the best, which is less than 1.3 h, and the traffic network of these areas is relatively developed. The accessibility of most counties of Hulun Buir, most counties of Alashan League, and the northwest counties of Xilin Gol League are relatively poor. The minimum accessibility time of each kind of scenic spot is still about 1.35 h, and the maximum accessibility time is 5.23 h; these areas are obstructed by mountains, waters, and deserts. At the same time, the spatial distribution characteristics of all kinds of scenic spots are similar. Among them, there are 22, 21, and 16 county-level units (21.36%, 20.39%, and 15.53%) in whole, human and natural scenic spots within 0.5 h, respectively, and the ratio of natural scenic spots within 0.5 h is the lowest; these scenic spots are mainly distributed in the southeast of Inner Mongolia. There are 81, 64, and 73 county-level units within 2 h for whole, human, and natural scenic spots, accounting for 78.64%, 62.14%, and 70.87%, respectively, which show a decentralized distribution.

3.4. Spatial Relevance Analysis of Accessibility Distribution

ESDA was used to explore the spatial correlation of accessibility of different types of scenic spots. The Moran’s I values of all scenic spots, human scenic spots, and natural scenic spots are 0.465, 0.436, and 0.577, respectively, and the results are significant at a 95% confidence level; which shows that there is a stronger positive spatial correlation among the accessibility of the county units in different kinds of scenic spots. The high-value and low-value of accessibility in Inner Mongolia are highly aggregated in spatial distribution, among which the value of natural scenic spots is the largest; the value of all scenic spots is the second, and the value of human scenic spots is the smallest, which indicates that the distribution of natural scenic spot is relatively concentrated. In order to further analyze the spatial pattern and the degree of connection of the accessibility cluster of the scenic spots at the county unit, the local spatial association index (Getis–OrdGi *) of each scenic spot was calculated, which was divided into seven types according to the natural breakpoints (Figure 4). The spatial distribution pattern of accessibility in different kinds of scenic spots is similar on the whole, and the cold spots in human scenic spots are relatively less, while the cold spots in natural scenic spots are the most. In a word, the distribution of cold and hot spots in various scenic spots is mainly in slice areas. The hot spots of accessibility among them in county areas are mainly in the counties of Huhhot, Zhunger Banner of Ordos, Dalate Banner, and Yijinholuo Banner, the counties of Tumote Right Banner, Guyang County, and Qingshan District of Baotou; of which the cold spots are concentrated in the counties of Alashan Right Banner and Ejina Banner of Alashan League, Olunchun Autonomous Nationality of Hulun Buir, Arong Banner and Yakeshi.

4. Conclusions and Discussion

4.1. Conclusions

This study used spatial analysis methods to scientifically identify the spatial structure of different types of tourist attractions in Inner Mongolia and measure their accessibility. On this basis, the spatial differentiation law of the overall accessibility of county units is studied. Additionally, ESDA spatial correlation analysis method was used to reveal the spatial correlation of the accessibility of different types of scenic spots in counties, and an in-depth analysis of the influencing factors of accessibility proposes an optimal path for accessibility. The result showed that this study combined the geographical spatial distribution characteristics and accessibility distribution characteristics of high-level scenic spots in Inner Mongolia to improve the accessibility of high-level scenic spots in Inner Mongolia from three aspects, including the stratified design of tourist attractions, the construction of tourist traffic and facilities, and the linkage design of tourist routes.
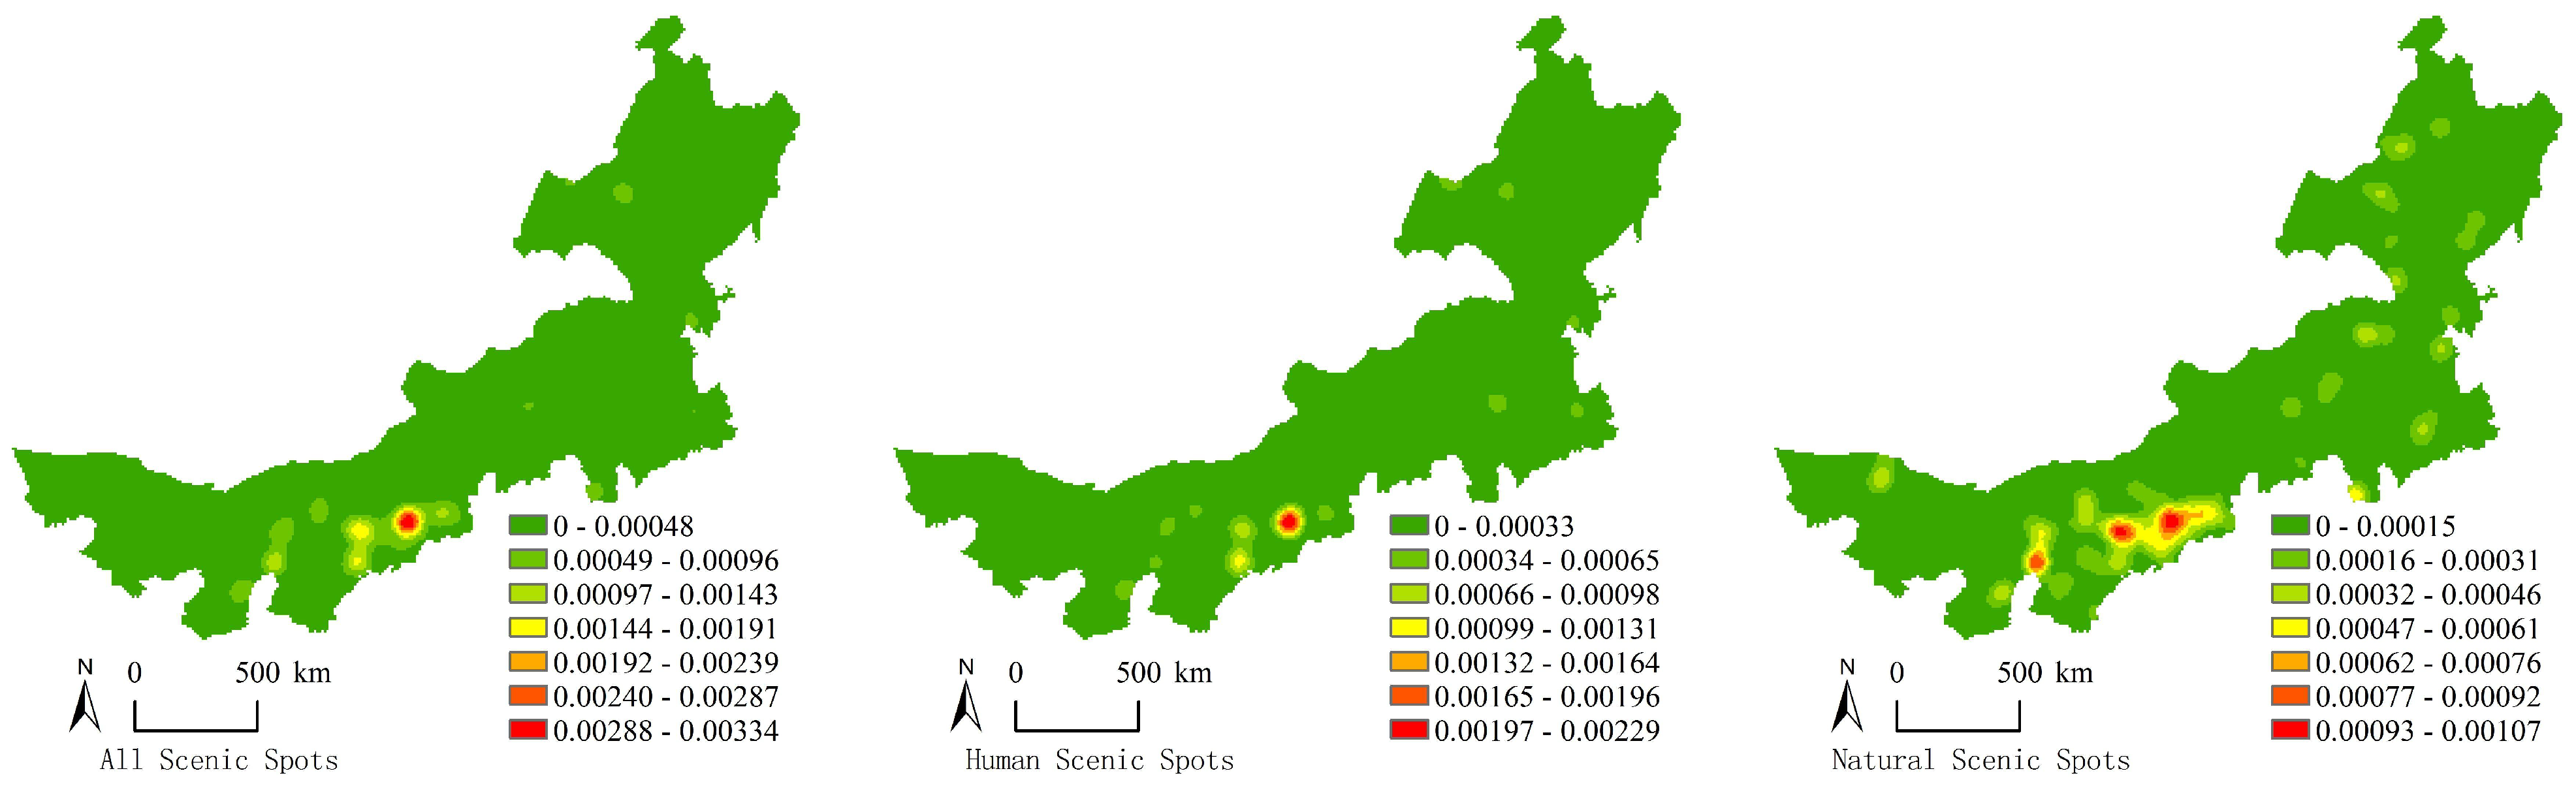
According to the distribution pattern of Inner Mongolia tourist attractions, the spatial distribution of tourist attractions of different categories in Inner Mongolia all exhibits a distribution state of “small-scaled aggregation and large-scaled dispersion” relative to fewer core attraction groups and variations in the aggregation degree of the spatial distribution of the attractions within the same category. In Inner Mongolia, natural attractions show the highest aggregation degree, while humanities attractions have the lowest. The capital city of Inner Mongolia, Hohhot, and the surrounding union cities have forged a relatively strong bond in attraction correlation and a good trend on synergetic and codependent development, whereas no high kernel density aggregation areas take shape in other union cities. Overall, tourist attractions of all categories aggregate to a relatively low extent, and the attraction distribution is scattered.
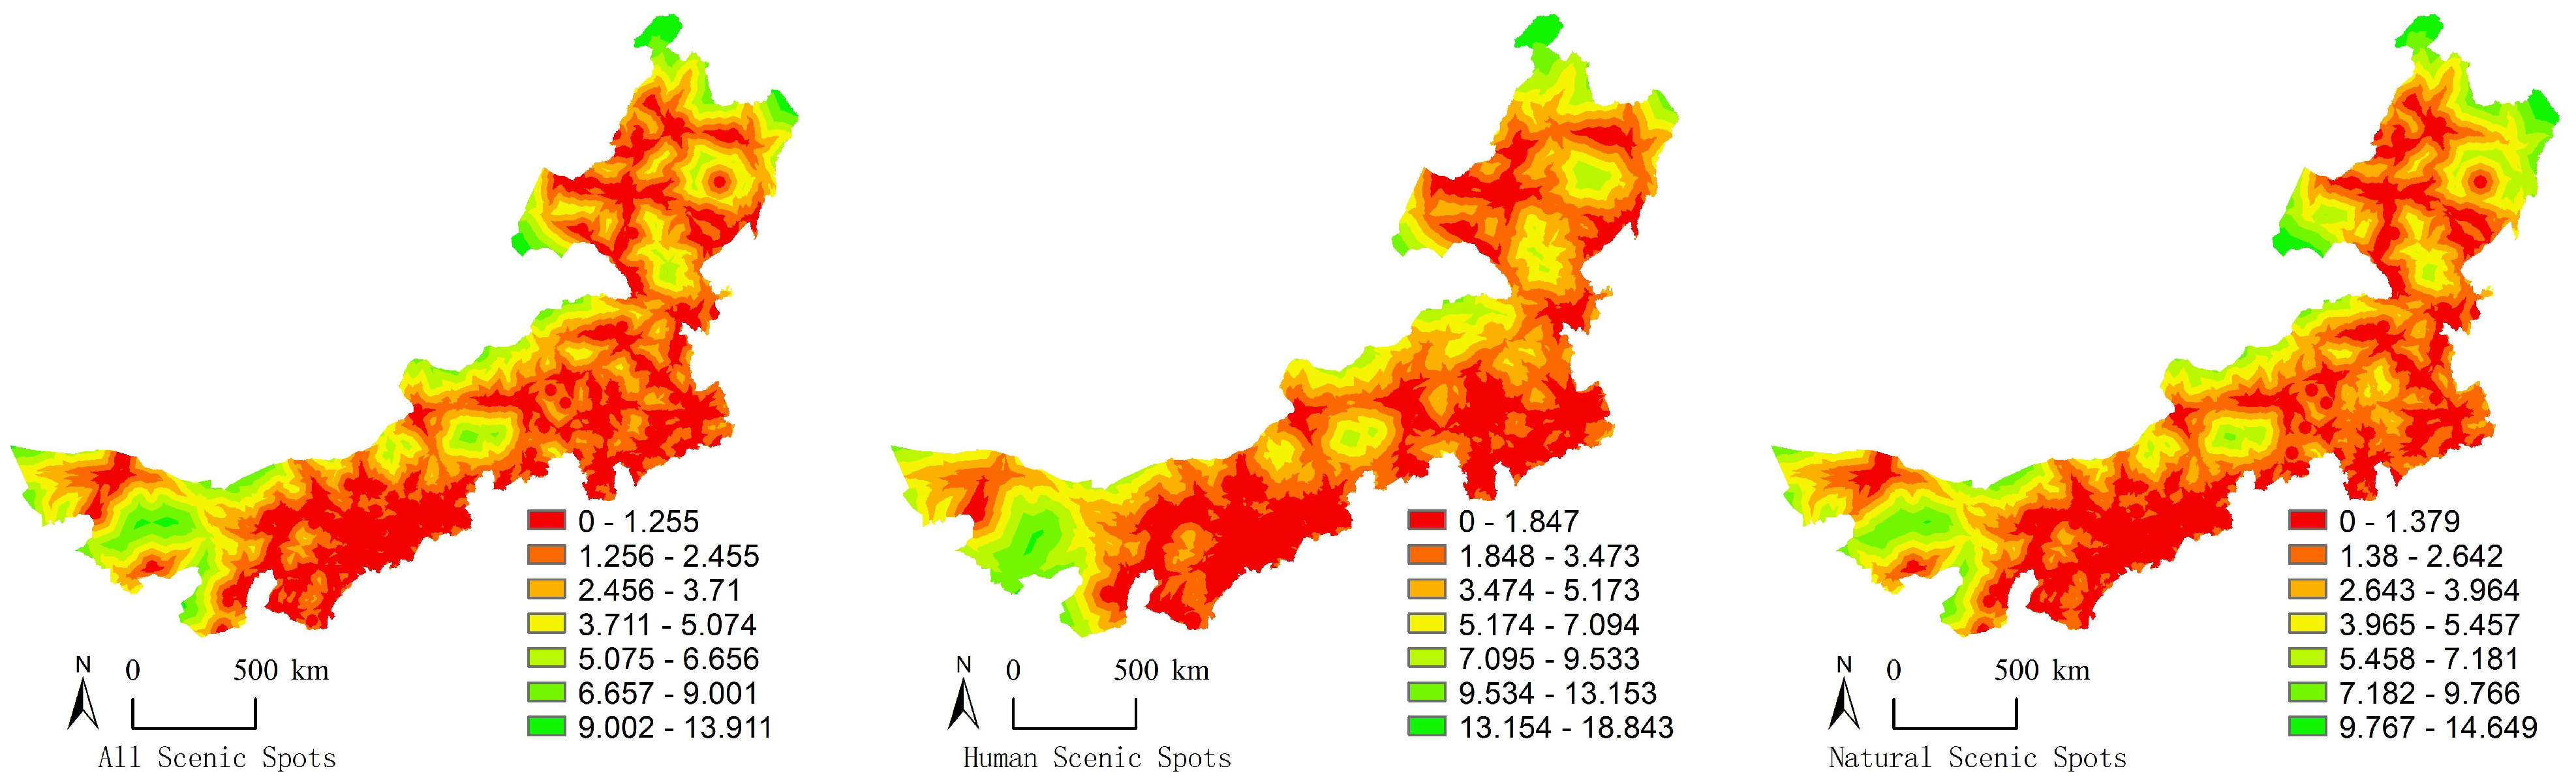
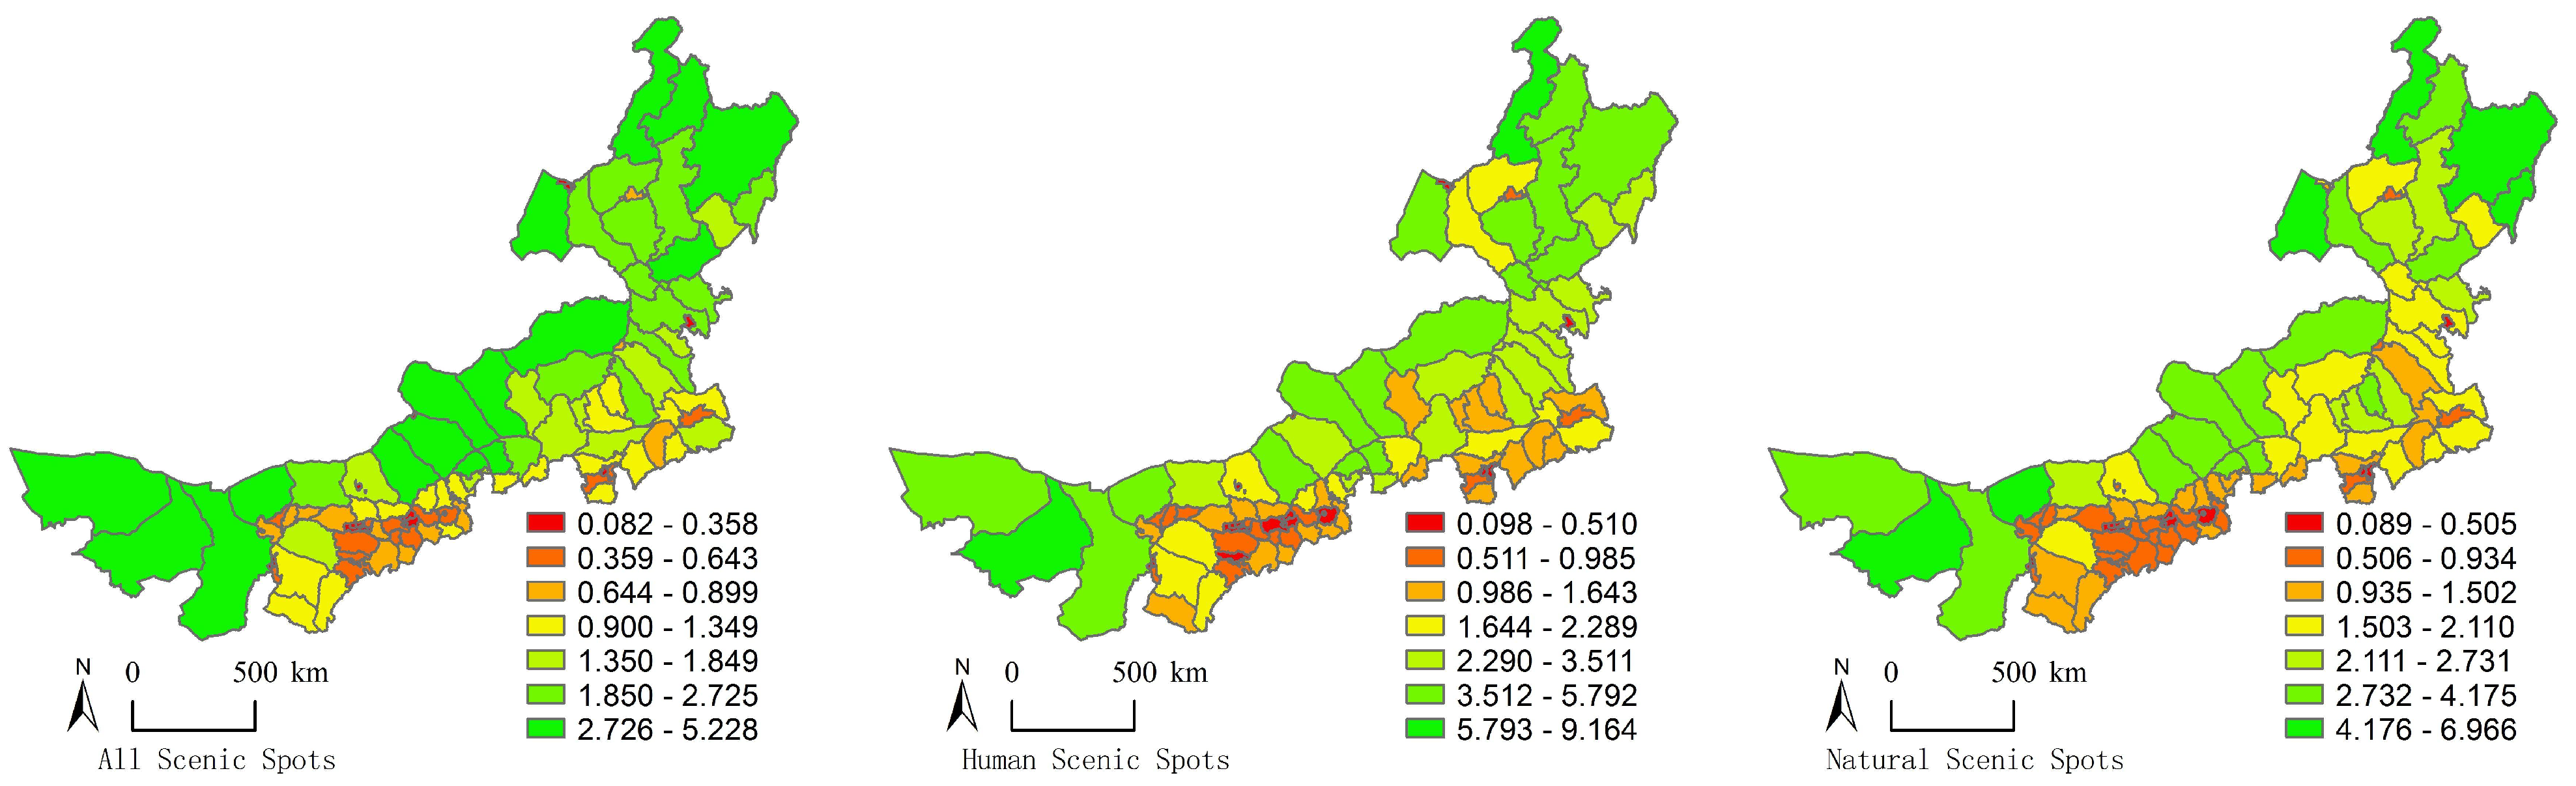
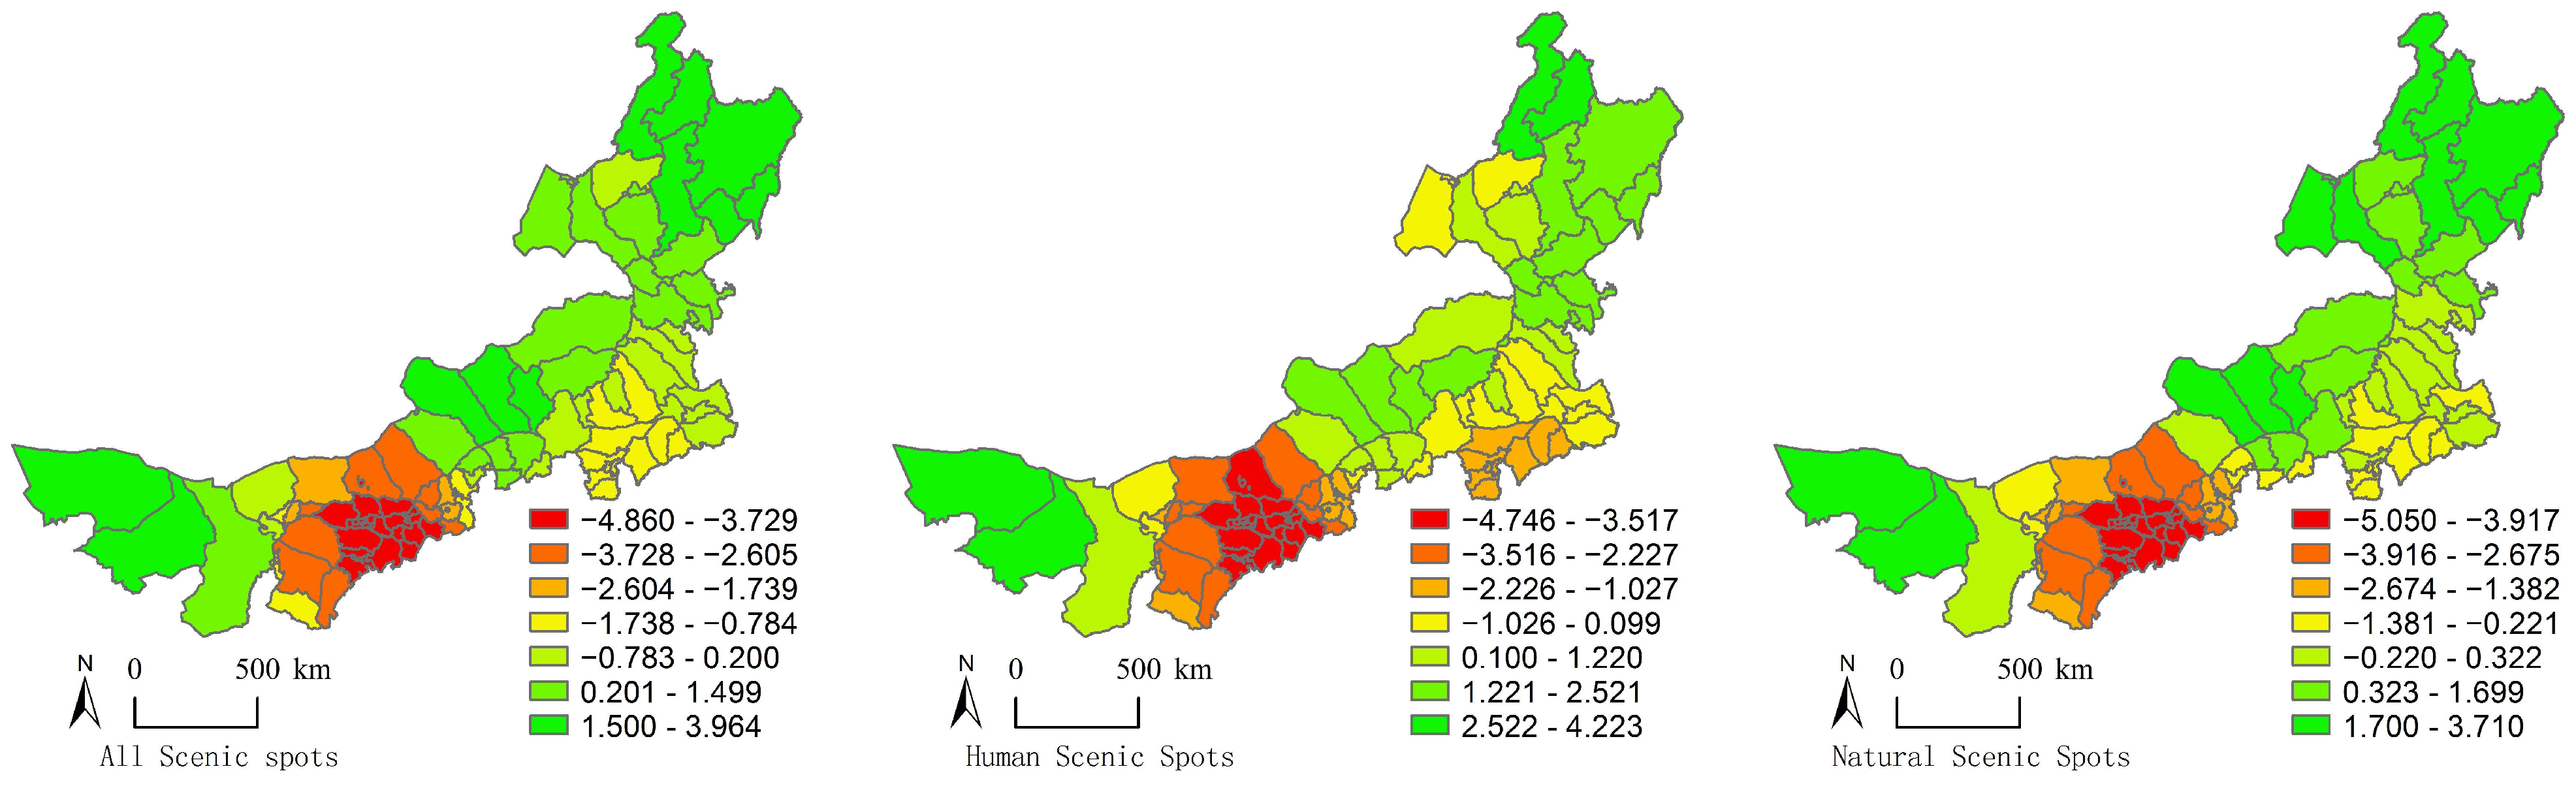
Based on the accessibility distribution of Inner Mongolia tourist attractions, spatial accessibility distribution patterns of all attractions, humanities attractions, and natural attractions in Inner Mongolia are in general accord, showing a relatively poor overall accessibility. Accessibility of natural attractions is better than that of humanities attractions. In the accessibility grade distribution of different types of attractions, the number of attractions for each time period basically remains the same, which is close to the distribution pattern of the transportation network. The accessibility spatial distribution of county units of all types of attractions in Inner Mongolia varies significantly, exhibiting an oblique distribution pattern of “low in the west, high in the east”, where accessibility of the northeast and southwest counties is relatively poor while relatively good accessibility is observed in the southeast counties in Inner Mongolia with an inverted U-shaped distribution over time. A strong positive spatial correlation exists in the accessibility of county units of all types of attractions in Inner Mongolia, showing a highly aggregated state in the spatial distribution of high values and low values of county accessibilities.
The accessibility of high-level scenic spots in Inner Mongolia varies spatially, and its influencing factors can be examined mainly from the following four aspects, namely, resource endowment, transportation network, natural environment, and economic level. Resource endowment and transportation network are the direct factors of regional tourist attractions accessibility, while the natural environment and the economic level are the indirect factors of tourist attractions accessibility, which mainly influence tourist attractions accessibility by acting on the first two factors. Resource endowment is the key element of tourism development, and the balanced degree and the number of tourist attractions are the key factors affecting accessibility. The number and balance of tourist attractions are positively correlated with their accessibility. The more tourist attractions are distributed, the more balanced the distribution of tourist attractions is, and the better their accessibility is. Transportation is an important fulcrum connecting the source and destination, and the density of developed transportation networks greatly reduces the spatial barriers to travel. The distribution level and density of the transportation network have an important influence on the accessibility of scenic spots. Generally, the more mature the development of the road network and the better the system, the better the accessibility of the spots. The level of socio-economic development is not only the dependent condition for the function of tourism but also the development basis for the scale of the tourism market and market potential of the source place. The more developed the economy of the region, its residents’ tourism demand is stronger, and the more money invested in improving roads and other infrastructure construction is bound to improve the accessibility of attractions. The distribution of tourist attractions is to some extent limited by the natural environment, different topography, rivers, etc., which will affect the layout and development of tourist attractions. Natural scenic spots are mostly distributed around mountains and rivers, and humanistic scenic spots are mostly distributed in flat terrain areas.

4.2. Implications

The measurement of the spatial pattern and accessibility of high-level scenic spots in Inner Mongolia in this study is closely related to the sustainable development of tourism. First, it can provide a reasonable reference for the government to optimize the layout of high-level tourist attractions in Inner Mongolia, improve the road network near high-level tourist attractions, formulate tourism development plans and publicity and marketing plans, and improve social transportation accessibility in a targeted manner. Secondly, it is beneficial for tourism enterprises to make reasonable site selection before investing and select suitable and profitable sites for investment and operation according to the distribution density and accessibility of scenic spots. In addition, in the process of daily travel consumption, residents can reasonably arrange the time, method, and route of travel, make travel preparations before travel, and efficiently realize their own travel purposes.
In terms of theoretical implications, most of the existing research cases are concentrated at the city or national level. This study takes the high-level scenic spots in Inner Mongolia as the research object. It is an innovation in the research on the spatial distribution characteristics and accessibility of tourism and enriches the tourism system theory. The research has expanded the research scope of tourism geography, especially a useful attempt in the research of spatial tourism structures. This study broadens the research content of the existing spatial pattern of scenic spots, and the research that combines the spatial distribution of scenic spots with the distribution pattern of accessibility can provide theoretical support for the planning and layout of scenic spots.
With respect to managerial implications, the exploration of the spatial distribution characteristics of scenic spots is conducive to breaking the shackles of the original spontaneous organization and provides strong support and a scientific basis for the rational and orderly construction of scenic spaces. This study provides a scientific basis for the location, construction, and development of scenic spots, which is helpful for the planning direction, resource allocation, and management guarantee of scenic spots in the future, as well as the shaping and renewal of urban space. It can also provide services for tourists to design high-quality circular tourism routes and provide a reference for the market forecast and positioning of existing scenic spots.
This study combined the geospatial distribution characteristics and accessibility distribution characteristics of high-level scenic spots in Inner Mongolia to enhance the accessibility of high-level scenic spots in Inner Mongolia from the following three aspects. The first one is the circle design of tourist attractions. Combining the spatial pattern of accessibility of high-level scenic spots in Inner Mongolia with the spatial distribution of circles and the different spatial distribution of natural and human attractions in different geomorphological zones, the development and construction of scenic tourism spots will be targeted according to the types of scenic resources in the circles. The second one is tourism transportation and facilities construction. It should not only optimize the external railroad, highway, and air traffic and take the initiative to integrate into the regional transportation system but also open up the internal traffic and pay attention to the construction of scenic tourism roads in Inner Mongolia. The third one is tourism line linkage design. According to the spatial layout of Inner Mongolia tourism, traffic pattern, planning convergence, and other factors, through product mix, traffic combination, etc., to adapt to the different needs of group tourists and casual tourists, comprehensive consideration of the travel needs of each market segment, integrated consideration to create a diverse tourism experience, the formation of multiple boutique theme tourism routes.

5. Future Research Directions

This study explored the spatial pattern and accessibility of various scenic spots in Inner Mongolia in depth, which has reference significance for future research on resource integration and accessibility in Inner Mongolia and other regions, but there are still some shortcomings in this study that need to be improved. First, regarding the calculation of accessibility values, there are various methods for measuring accessibility, including the cost method [31], network analysis [32], and spatial sentence method [33] based on road networks, and this study used the shortest cost-weighted distance to measure accessibility values. However, accessibility is not only influenced by time and traffic but also by attractiveness, comfort, and cost, so it should focus on judging the accessibility of scenic spots from multiple perspectives and methods to improve the scientific and precise accessibility measurement in future research. Secondly, the analysis of existing studies on spatial patterns includes both ephemeral data analysis [35] and cross-sectional data analysis of a single year [41], and this study selected data of a single year in Inner Mongolia for spatial and temporal pattern analysis. However, the spatial pattern of accessibility of tourist attractions is a process of continuous dynamic change, and it would be more scientific and reasonable to explore its evolution pattern by conducting comparative analysis and research on the spatial pattern of accessibility of tourist attractions at multiple time points in a region. Therefore, the quantitative research method of multiple time nodes will be the next research direction for the accessibility research of scenic tourism spots. In addition, the existing studies focus on exploring the spatial pattern of tourism scenic area distribution, accessibility measurement [3,15], and influencing factors [8,10], while this study not only analyzed the spatial layout and influencing factors of accessibility of scenic tourist areas in Inner Mongolia, but also put forward some countermeasure suggestions for spatial structure optimization in a relatively shallow way. Therefore, it should analyze in depth the reasons for the unreasonable spatial structure of tourist scenic spots, and at the same time, it should specifically offer reasonable suggestions for the optimization of the spatial structure of scenic spots in order to provide a reference for the improvement of accessibility of other similar areas in the future research.

Author Contributions

X.W. contributed to all aspects of this work; C.C. wrote the main manuscript text and analyzed the data. All authors reviewed the manuscript. All authors have read and agreed to the published version of the manuscript.

Funding

This research study was supported by the National Social Science Foundation of China (to Yuewei Wang), grant no. 19BGL145.

Institutional Review Board Statement

Not applicable.

Informed Consent Statement

Not applicable.

Acknowledgments

The authors would like to acknowledge all experts’ contributions in the building of the model and the formulation of the strategies in this study. All individuals included in this section have consented to the acknowledgement.

Conflicts of Interest

The authors declare no conflict of interest.

References

  1. Clark, G.; Chabrel, M. Special issue: Rural tourism in Europe. Tour. Geogr. 2007, 9, 345–468. [Google Scholar] [CrossRef]
  2. Zhou, H.; Zhang, Y.; Ning, X.; Zang, S. Spatial-temporal differentiation characteristics of A-class tourist attractions in Inner Mongolia. J. Arid Land Resour. Environ. 2021, 35, 202–208. [Google Scholar]
  3. Pan, J.; Li, J. Spatial Distribution Characteristics and Accessibility of A-Class scenic spots in China. J. Nat. Resour. 2014, 29, 55–66. [Google Scholar]
  4. Azazz, A.; Elshaer, I.A.; Ghanem, M. Developing a measurement scale of opposition in tourism public-private partnerships projects. Sustainability 2021, 13, 5053. [Google Scholar] [CrossRef]
  5. Papatheodorou, A. Exploring the evolution of tourism resorts. Ann. Tour. Res. 2004, 31, 219–237. [Google Scholar] [CrossRef]
  6. Song, Y.; Lee, K.; Anderson, W.P.; Lakshmanan, T. Industrial agglomeration and transport accessibility in metropolitan Seoul. J. Geogr. Syst. 2012, 14, 299–318. [Google Scholar] [CrossRef]
  7. Masson, S.; Petiot, R. Can the high speed rail reinforce tourism attractiveness? The case of the high speed rail between Perpignan (France) and Barcelona (Spain). Technovation 2009, 29, 611–617. [Google Scholar] [CrossRef]
  8. Lin, X.; Chen, Q. A Study on Spatial Distribution Characteristics and Influencing Factors of Tourist Towns in Fujian. Geogr. Sci. 2021, 41, 1645–1653. [Google Scholar]
  9. Wang, Y.; Chen, H.; Wu, X. Spatial Structure Characteristics of Tourist Attraction Cooperation Networks in the Yangtze River Delta Based on Tourism Flow. Sustainability 2021, 13, 12036. [Google Scholar] [CrossRef]
  10. Ma, X.; Yang, X. Spatial and Temporal Distribution Characteristics and Spatial Heterogeneity of Influential Factors in the High-level Scenic Spots of Great Western Hunan. J. Nat. Resour. 2019, 34, 1902–1916. [Google Scholar]
  11. Kropinova, E. Transnational and cross-border cooperation for sustainable tourism development in the Baltic Sea Region. Sustainability 2021, 13, 2111. [Google Scholar] [CrossRef]
  12. Hu, W.; Liang, X.; Sang, Z. Analysis on the characteristics and causes of the spatial-temporal evolution of 3A and above tourist attractions in Shanxi province. J. Arid Land Resour. Environ. 2020, 34, 187–194. [Google Scholar]
  13. Tao, S. The Developing Predicament and Optimizing Path of the Growing Summer-Avoiding scenic spots in the Ethnic Areas: Based on the Empirical Study of Maoba Scenic Spot in Youyang Tujia and Miao Autonomous County of Chongqing. J. Southwest Univ. Natl. 2019, 40, 40–46. [Google Scholar]
  14. Cong, L.; Li, S.; Hong, J.; Zhang, W. The spatial network structure of tourist flows for national red tourism attractions. J. Arid Land Resour. Environ. 2021, 35, 188–194. [Google Scholar]
  15. Guo, Y.; Liu, M. Classification and Spatial Distribution of scenic spots in Shanxi Province Based on POI Data. Geogr. Sci. 2021, 41, 1246–1255. [Google Scholar]
  16. Ma, X.; Zhou, H.; Tan, J.; Zhang, D. The coupling path and mechanism of the growth of tourist destinations and the formation of high-level scenic spots: Taking Zhangjiajie as an example. J. Econ. Geogr. 2021, 41, 205–212. [Google Scholar]
  17. Tang, L.; He, Q.; Zhu, X. Spatial Distribution Characteristics of A-Class Scenic Spots in Changsha City. Econ. Geogr. 2018, 38, 218–224. [Google Scholar]
  18. Jiang, B.; Chu, N.; Xiu, C.; Zhao, Y.; Li, X.; Luo, C. Comprehensive Evaluation and Comparison of Accessibility of “Four Longitudinal and Four Transverse” High Speed Railway Network in China. J. Geogr. 2016, 71, 591–604. [Google Scholar]
  19. Yin, J.; Bi, Y.; Ji, Y. Structure and formation mechanism of China-ASEAN tourism cooperation. Sustainability 2020, 12, 5440. [Google Scholar] [CrossRef]
  20. Hansen, W.G. How accessibility shapes land use. J. Am. Inst. Plan. 1959, 25, 73–76. [Google Scholar] [CrossRef]
  21. Geurs, K.T.; Van Wee, B. Accessibility evaluation of land-use and transport strategies: Review and research directions. J. Transp. Geogr. 2004, 12, 127–140. [Google Scholar] [CrossRef]
  22. Li, S.; Shum, Y. Impacts of the national trunk highway system on accessibility in China. J. Transp. Geogr. 2001, 9, 39–48. [Google Scholar] [CrossRef]
  23. Kwan, M.P.; Murray, A.T.; O’Kelly, M.E.; Tiefelsdorf, M. Recent advances in accessibility research: Representation, methodology and applications. J. Geogr. Syst. 2003, 5, 129–138. [Google Scholar] [CrossRef]
  24. Chen, W.; Qu, H.; Chi, K. Partner selection in China interorganizational patent cooperation network based on link prediction approaches. Sustainability 2021, 13, 1003. [Google Scholar] [CrossRef]
  25. Shen, Y.; Li, L. Influence of the Accessibility of Medical Facilities on Residents’ Seeking Medical Care Behavior from the Angle of Age Stratification: A Case Study of Chongming Island, Shanghai. Hum. Geogr. 2021, 36, 46–54. [Google Scholar]
  26. Ren, J.; Wang, Y. Spatial accessibility of park green space in Huangpu District of Shanghai based on modified two-step floating catchment area method. Adv. Geosci. 2021, 40, 774–783. [Google Scholar] [CrossRef]
  27. Yin, J.; Wang, X.; Jia, Y.; Li, C.; Wang, J. Spatial accessibility distribution characteristics and influencing factors of the tourism poverty alleviation key villages in Wuling Mountain area, Hubei Province. Adv. Geosci. 2019, 38, 1865–1875. [Google Scholar] [CrossRef]
  28. Luo, J.; Zhang, B.; Liu, S. Relationship between Traffic Accessibility and Tourism Economic Contact of Guangdong-Hong Kong-Marco Greater Bay Area. Econ. Geogr. 2020, 40, 10. [Google Scholar]
  29. Wang, S.; Guo, J. Spatial measure of traffic accessibility and market potential of the National Scenic Areas. Geogr. Res. 2016, 35, 1714–1726. [Google Scholar]
  30. Yan, H.; Wang, Q.; Xiong, H.; Yu, R. The Effect of Chinese “Four Vertical and Four Horizontal” High-Speed Railways on the Accessibility and Economic Relations of the Cities along the Line. Econ. Geogr. 2020, 40, 57–67. [Google Scholar]
  31. Jia, W.; Huang, Z.; Liu, J.; Xu, D. Measuring and analyzing the time-space compression of high-speed rail on regional tourism: A case study of Yangtze River Economic Belt, China. Geogr. Res. 2021, 40, 1785–1802. [Google Scholar]
  32. Li, X.; Wang, X.; Zhuo, R.; Wan, L. Spatial accessibility of leisure agriculture in suburbs of Wuhan based on spatial syntax and network analysis. J. Huazhong Normal Univ. 2020, 54, 882–891. [Google Scholar]
  33. Zhang, Q.; Xie, S.; Wang, X.; Jiang, L.; Gu, H.; Liu, D. Evaluation on the Accessibility of the Scenic Spots in Wuhan Based on the Spatial Syntax. Econ. Geogr. 2015, 35, 200–208. [Google Scholar]
  34. Hu, L.; Hu, J.; Zhou, B.; Li, Y.; Lyv, L.; Jia, Y. Regional Tourism Attractions Accessibility of Spatial Distribution Pattern and Measure—A Case Study of Southern Anhui International Cultural Tourism Destination. Econ. Geogr. 2018, 38, 190–198. [Google Scholar]
  35. Liu, M.; Hao, W. Spatial distribution and its influencing factors of national A-level tourist attractions in Shanxi Province. Acta Geogr. Sin. 2020, 75, 878–888. [Google Scholar]
  36. He, X.; Zhang, X.; Zhang, X. Evaluation of rural tourism resources in Inner Mongolia based on AHP-FCE. J. Arid Land Resour. Environ. 2020, 34, 187–193. [Google Scholar]
  37. Fan, M.; Zhang, H.; Chen, Y. Spatiotemporal analysis of visual tourism images in Inner Mongolia from the perspective of tourists. J. Arid Land Resour. Environ. 2020, 34, 194–200. [Google Scholar]
  38. Li, W.; Kuang, W. Impact of Tourism Development on the Herdsmen Livelihood in Pastoral Areas: A Case Study of XilaMuren Pastoral Area in Inner Mongolia. Sci. Geogr. Sin. 2019, 39, 131–139. [Google Scholar]
  39. Smith, S.L. Tourism Analysis: A Handbook; Routledge: London, UK, 1989. [Google Scholar]
  40. Berke, O. Exploratory disease mapping: Kriging the spatial risk function from regional count data. Int. J. Health Geogr. 2004, 3, 1–11. [Google Scholar] [CrossRef] [Green Version]
  41. Tang, J.; Ma, M. Spatial pattern and influencing factors of industrial tourism demonstration sites in China. Resour. Sci. 2020, 42, 1188–1198. [Google Scholar] [CrossRef]
Figure 1. Kernel density analysis in different kinds of scenic spots.
Sustainability 14 07329 g001
Figure 2. The spatial accessibility distribution of different kinds of scenic spots.
Sustainability 14 07329 g002
Figure 3. The county unit accessibility of different kinds of scenic spots.
Sustainability 14 07329 g003
Figure 4. Distribution map of overall accessibility hot spots of county units in different kinds of scenic spots.
Sustainability 14 07329 g004
Table 1. Accessibility frequency and cumulative frequency of different kinds of scenic spots (%).
Types of Scenic SpotsTime/h
<22–44–66–88–1010–12>12
All Scenic Spotsdistribution26.4227.1419.1613.508.404.151.24
summation26.4253.5672.7286.2194.6198.76100.00
Human Scenic Spotsdistribution26.3427.6321.0713.507.183.410.87
summation26.3453.9775.0488.5495.7299.13100.00
Natural Scenic Spotsdistribution24.5927.2418.9614.059.424.301.44
summation24.5951.8370.7984.8494.2698.56100.00
Table 2. The overall accessibility grade distribution of county units.
Types of Scenic SpotsTime/h
<0.50.5–11–1.51.5–22–2.52.5–3>3
All Scenic spots222420154216
Human Scenic Spots21151997824
Natural Scenic Spots162418157419
Publisher’s Note: MDPI stays neutral with regard to jurisdictional claims in published maps and institutional affiliations.

