Article

Evaluation of the Effectiveness of Traffic Calming Measures by SPEIR Methodology: Framework and Case Studies

by
Natalia Distefano
and
Salvatore Leonardi
*
Department of Civil Engineering and Architectural, University of Catania, Viale Andrea Doria, 6-95125 Catania, Italy
*
Author to whom correspondence should be addressed.
Sustainability 2022, 14(12), 7325; https://doi.org/10.3390/su14127325
Submission received: 28 May 2022 / Revised: 7 June 2022 / Accepted: 13 June 2022 / Published: 15 June 2022

Abstract

:
The speed value of 30 km/h should not be exceeded in urban areas, both to ensure safety requirements for all categories of users and to improve the overall quality of life in urban areas. Moreover, it is necessary not only to comply with the prescribed maximum speed, but also to ensure a uniform speed by limiting the variations in relation to the average value within an acceptable range of variation. An original analysis methodology is therefore proposed, useful for both technicians and administrators to verify the effectiveness of traffic calming measures, especially in areas where these measures are widely used, such as Zones 30. This methodology, called SPEIR (acronym for Speed Profile, Effectiveness Indicators and Results, which are the keywords of the three steps into which the proposed methodology is divided), is divided into three operational steps necessary to both verify the effectiveness of existing traffic calming measures in a given context and to plan new traffic calming measures to be implemented in specific urban sectors to be requalified and revitalized. Finally, three case studies are presented where the application of the SPEIR methodology is useful not only for understanding the operational steps in the application of the methodology itself, but also for understanding the differences in terms of the safety performance that the various traffic calming measures provide to the users of the urban streets where such measures are present.

1. Introduction

In recent years, in Italy, but also in Europe and the rest of the world, sustainable urban mobility planning has become increasingly established as a new approach to transport planning and mobility management in urban areas in a sustainable and comprehensive way. Stimulated by the constant increase in motorized traffic and its associated negative impacts, a new paradigm of sustainable mobility has, therefore, gradually emerged [1].
While mobility has brought positive economic and social impacts such as prosperity, international cooperation and exchange, there are also negative aspects such as the high proportion of urban land occupied by infrastructures of transport, urban sprawl, congestion, traffic noise, energy consumption, and social and environmental problems [1,2,3,4]. Moreover, the greatest negative impacts are mainly due to private cars. Its intensive use has been shown to reduce physical activity, increase the likelihood of traffic accidents, negatively impact health and the residential environment, and reduce opportunities for social interaction [1,5].
Sustainable urban mobility planning addresses these challenges. In line with explicit urban transport sustainability strategies, the world community goals call on urban planners and designers to incorporate road safety as an essential requirement to ensure sustainable mobility. Indeed, the goal of sustainable, safe road transport is to avoid accidents and reduce the likelihood of serious injuries to (almost) zero [6].
In this context, the risks to pedestrians on the road and their high vulnerability to serious injury as a result of traffic crashes have become a major concern for policy makers and health professionals [7]. The progressive aging of the population, associated with the decline in the abilities of older pedestrians, is also an important factor affecting the level of safety that urban areas provide for vulnerable users [8,9], which must also be taken into account when determining the most appropriate safety measures [10,11]. It is estimated that about 12 million road accidents involving pedestrians occur each year, killing about 270,000 people worldwide (about 23% of all road fatalities worldwide [12]). In 2019, 4628 pedestrian fatalities were reported in Europe, accounting for 20% of total traffic fatalities. Although the absolute number of pedestrian fatalities decreased from 5952 to 4628 between 2010 and 2019 (−22%), the total number of traffic fatalities decreased at the same rate (−23%), with the proportion of pedestrians in the total number of traffic fatalities remaining constant [13].
In Italy, the situation is even more serious: every year, about 20,000 traffic accidents occur with at least one pedestrian. According to Italian data published by ACI-ISTAT, 534 pedestrians were killed and more than 21,000 injured in traffic accidents in 2019 [14]. Although the data on traffic accidents for 2020 are already available, it was preferred not to use them because they are representative of a situation strongly influenced by the COVID-19 pandemic. In any case, the 409 pedestrians who died in 2020 (−23.4% compared to the previous year) are representative of the fact that the pedestrian category was one that experienced the smallest decrease in road accident mortality during the pandemic period: just consider that victims in cars decreased by 27.9% in 2020, those on bicycles by 30.4%, and those on mopeds by 33% (again, compared to 2019) [15].
Since high speeds are one of the main key factors in traffic accidents between motorized vehicles and vulnerable road users, the implementation of speed reduction measures would improve safety on urban roads [16]. It is well known that there are potential interventions in the road network that lead to a significant reduction in speed. In particular, both conventional and unconventional roundabouts can influence motorist behavior by limiting their approach speed [17]. However, in purely residential areas, it is not always feasible to install modern roundabouts, and even less feasible to install unconventional systems such as turbo-roundabouts, which would potentially be even more effective at achieving speed reductions due to their significant size [18]. In urban contexts with residential development, it is therefore necessary to resort to various strategies to achieve significant speed reduction. For this purpose, low speed zones, such as 30 km/h zones (so-called Zones 30), are a possible strategy that is increasingly used in many countries.
A low-speed zone is an important solution to reduce traffic and revitalize some urban areas, making them safer and more attractive for recreation, with a view to much desired sustainable mobility. A low-speed zone is simply defined as an area where the speed indicated on the sign (e.g., 30 km/h) cannot be exceeded [19]. A Zone 30 is a delineated area designed to improve the safety of vulnerable road users through traffic calming measures. It is well known that the placement of speed limit signs alone at the entrances to the zone is not sufficient to achieve the desired speed reduction. According to Kempa [20], engineering measures are needed to force drivers to obey the speed limit. In order to prioritize vulnerable road users, the implementation of Traffic Calming Measures (TCMs) has become very topical. TCMs are specific treatments and/or designs of the roadway whose main function is to force drivers to behave correctly. These measures (vertical deflection, horizontal deflection, physical obstacles, and signs and lane markings) work both toward reducing vehicle speed [21] and toward reducing the ability to reach certain areas [1]. Recent studies have shown that traffic calming groups must be used to ensure low speeds along an entire route or in an urban area [18,19,20,21,22].
Other studies have shown that the effectiveness of traffic calming groups varies depending on the geometric characteristics of the measures and the distance between them [23,24,25].
The establishment of traffic calming groups must provide good uniformity of speed. The lack of uniformity of speed can lead to frequent and dangerous deceleration and acceleration maneuvers [26]. These maneuvers cause higher fuel consumption and noise emissions, which have a negative impact on the environment [27].
Nowadays, speed management is a priority in urban areas. Several studies show that 30 km/h should be the maximum speed in residential areas. This is because below 30 km/h, the risk of a pedestrian fatality in a traffic accident is quite low (5–10%). At a speed of 20 km/h, the risk of serious injury is about 10%. For a pedestrian, the risk of being involved in a traffic accident (with fatal or serious injuries) increases significantly when the speed exceeds 30 km/h [28]. Injuries to cyclists show a similar pattern, with the likelihood of a fatal crash increasing with higher vehicle speeds. In high-speed environments, the risk of collisions also increases for children and the elderly as their motion perception skills are underdeveloped and diminish and they are unable to properly assess speed and the time available to cross the road [29,30,31]. Speed limits also have the potential to increase physical activity primarily by encouraging walking and cycling, reduce sedentary behavior, and improve the livability of an area. Speed limits to 30 km/h also reportedly have the potential to reduce fuel consumption and air pollution by reducing standing traffic, which allows for more efficient use of available road space and more effective merging and filtering at intersections, thereby reducing queues [32,33,34]. Therefore, speed limits of 30 km/h may have a significant impact not only on road safety but also on public health. Therefore, evaluating the effectiveness of speed limits is warranted not only from the perspective of sustainable mobility, but also from the perspective of the overall environmental sustainability of typical residential areas.
Ultimately, all technical and scientific literature agrees that 30 km/h is the speed value that should not be exceeded in urban environments, firstly to ensure safety requirements for all categories of users, and secondly to improve the overall quality of life in urban areas, which in this way would be revitalized and made more attractive, especially for pedestrians and cyclists. In this context, the authors of this work strongly believe that in order to achieve sustainable mobility, it is necessary not only to comply with the prescribed maximum speed, but also that traffic in urban areas is carried out at a uniform speed, limiting the variations in relation to the average value within an acceptable range. This has been highlighted in literature studies, as mentioned above, but not sufficiently and without the emphasis that this issue requires; to date, there is no procedure that allows a systematic evaluation of the effectiveness of traffic calming measures from the point of view of “uniformity of speed”. The aim of this study is, therefore, to propose an original and simple procedure, useful for both technicians and administrators, to verify the effectiveness of traffic calming measures, mainly in areas where these measures are widely used, such as Zone 30 or any other urban context where the speed is to be kept constant at or below the 30 km/h threshold.
This study, therefore, presents the SPEIR methodology, which is divided into three operational steps required to both verify the effectiveness of existing traffic calming measures in a given context (and, if necessary, prepare corrective interventions to improve their effectiveness) and plan new traffic calming measures to be implemented in specific urban sectors to be requalified and revitalized. This work also presents three case studies where the application of the SPEIR methodology is useful not only to understand the operational steps in the application of the methodology itself, but also to understand the differences in terms of the safety performance that the various traffic calming measures offer to the users of the urban streets where such measures are present.

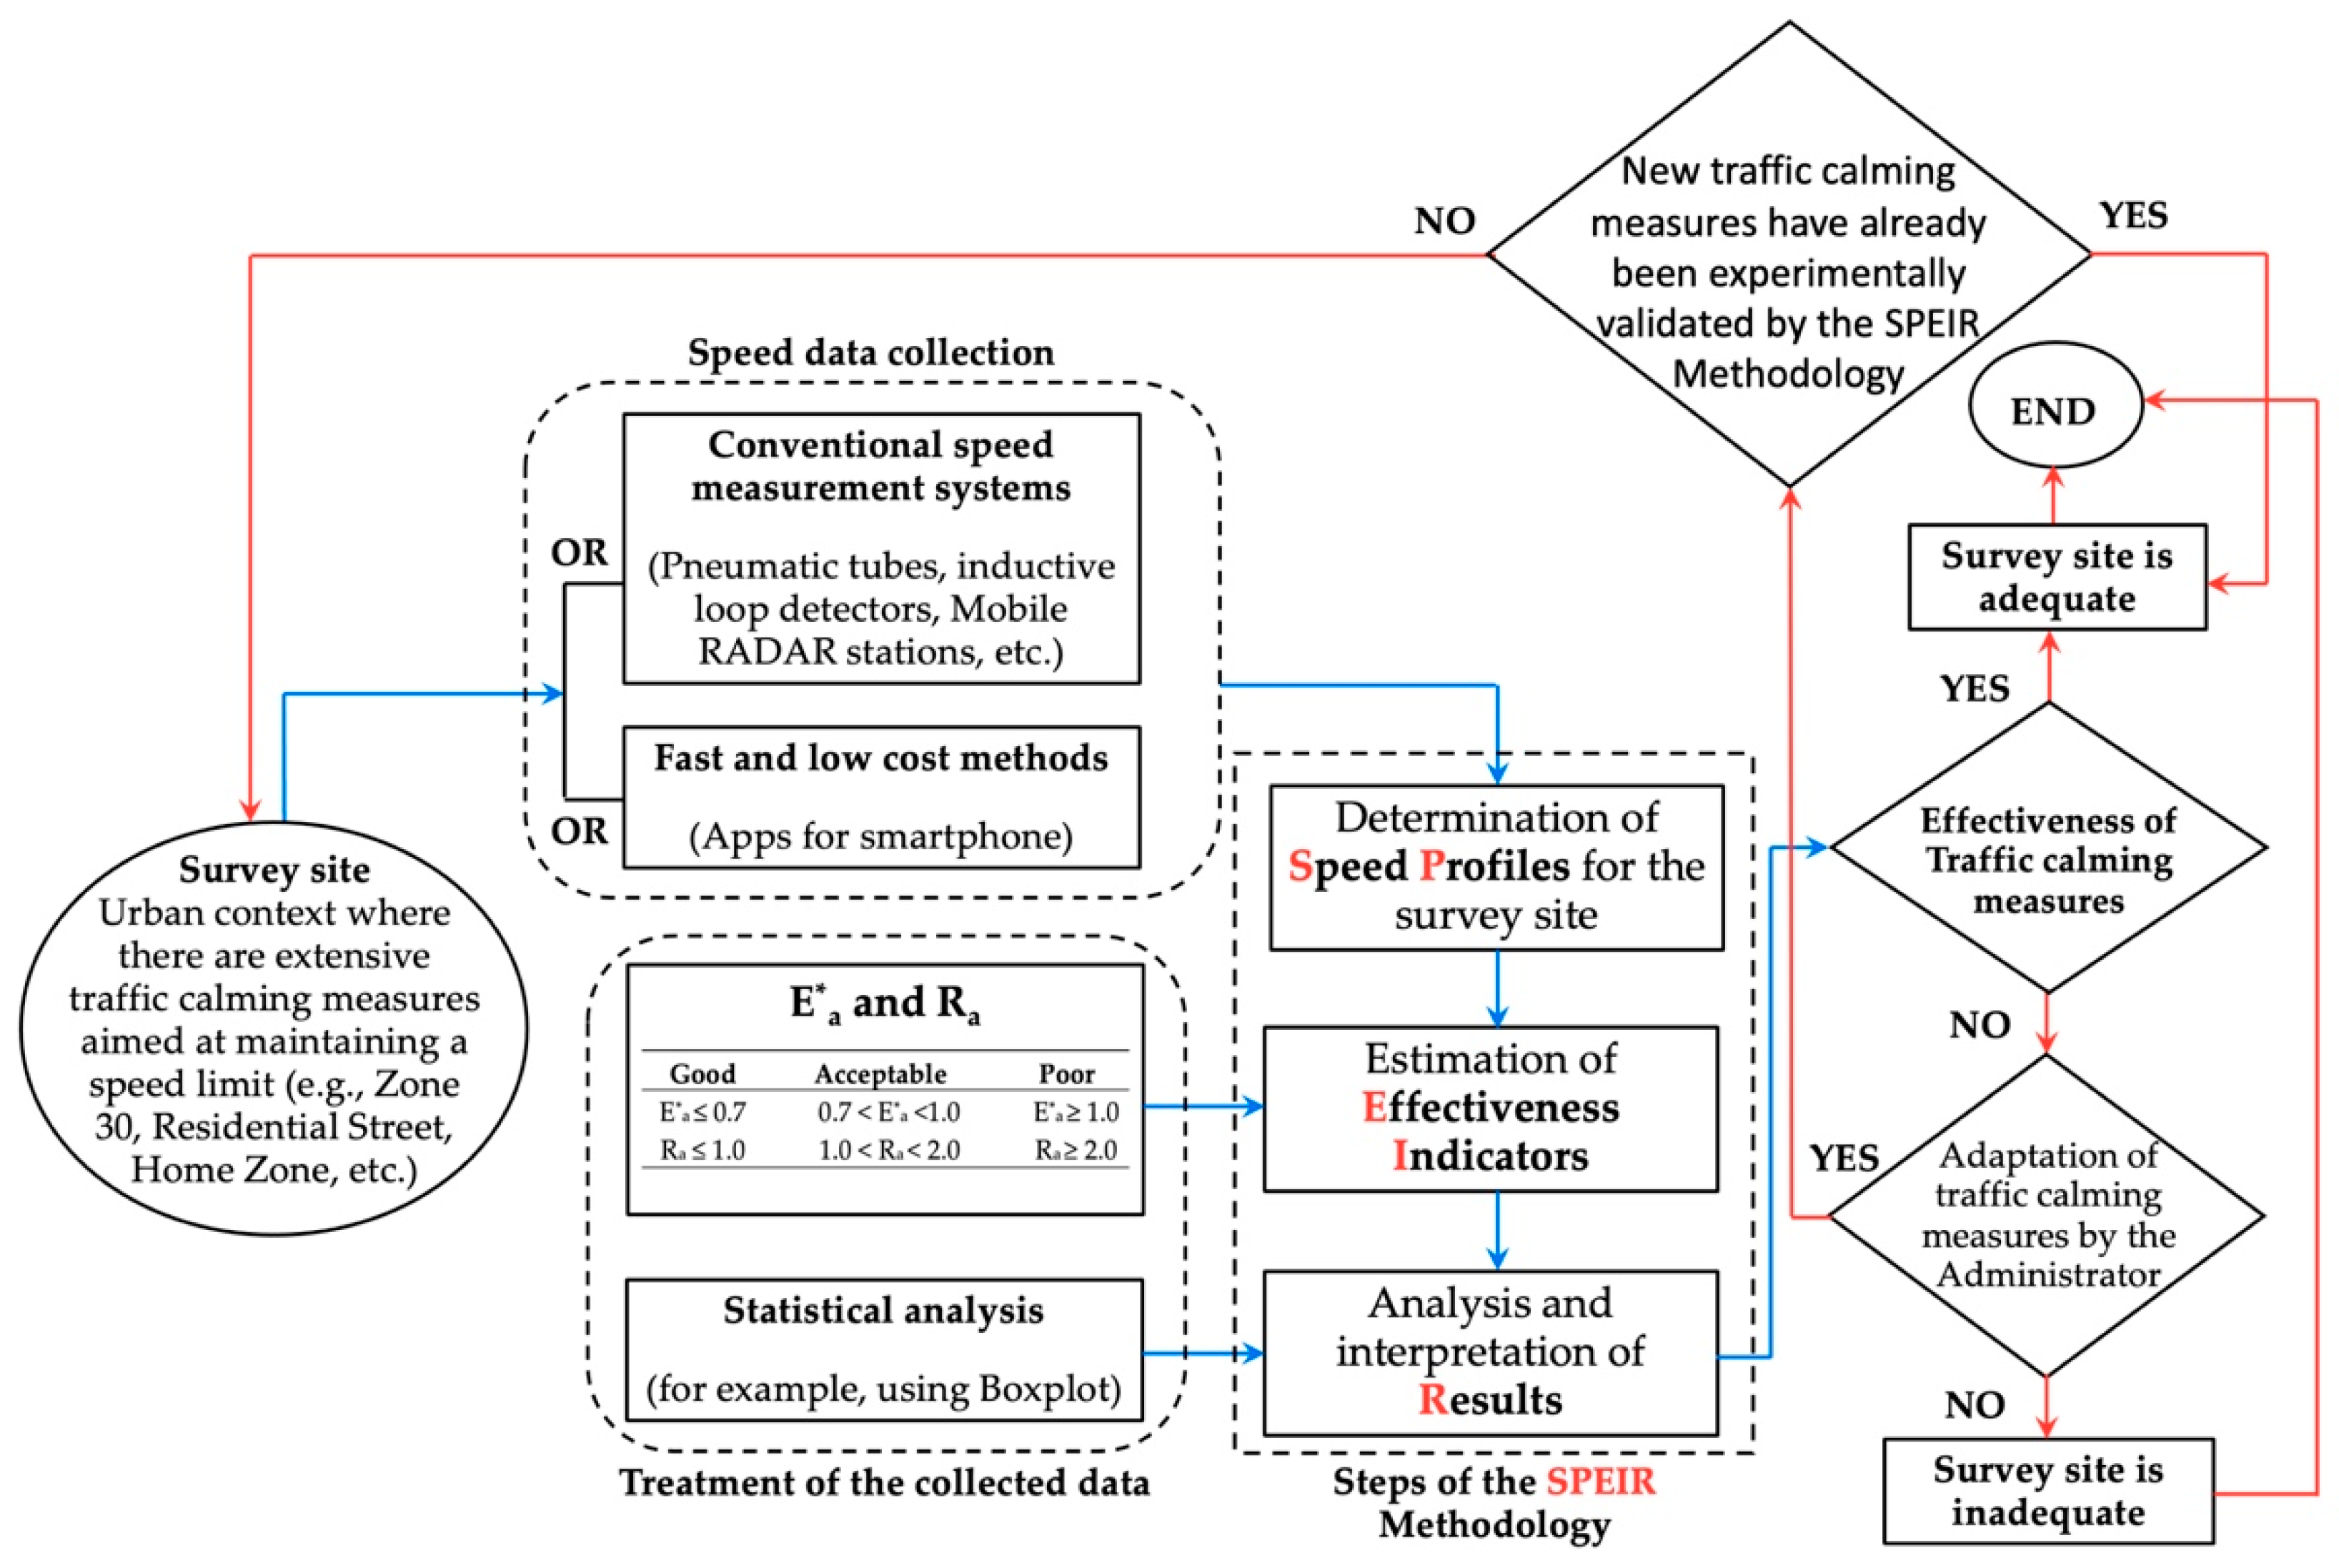
2. Framework of SPEIR Methodology

The proposed methodology for evaluating the effectiveness of traffic calming measures is divided into three basic steps:
(1)
determination of speed profiles for the survey site;
(2)
estimation of effectiveness indicators;
(3)
analysis and interpretation of results.
The framework of the proposed analysis method is shown in Figure 1. The keywords of the framework steps are the following three: Speed Profile, Effectiveness Indicators, and Results. From the initial letters of the aforementioned keywords, the acronym SPEIR was defined, which will be used to refer to the proposed methodology throughout this work.

2.1. Determination of Speed Profiles for the Survey Site

Speed profile reflects the physical nature of the road. It will indicate an approximately constant speed in road sections with fairly uniform geometric characteristics. This aspect is often missing in areas where TCMs are present. This is because each TCM has a “zone of influence” in which it exerts a speed-reducing effect [35]. Therefore, it is essential to verify that the realization of TCMs does not lead to high-speed differences.
Recording speed profiles at locations where traffic calming measures are in place is, therefore, the first step in verifying the effectiveness of the measures themselves. There are various measurement tools for assessing speed. The conventional ones are listed and briefly described below [36].
Speed measurement systems for a specific road section and for aggregated traffic counts:
  • Pneumatic tubes with automatic traffic counting systems: They are used for long surveys of vehicle speeds and annual average daily traffic counts. They are sufficiently accurate and inexpensive but lack flexibility in practice.
  • Inductive loop detectors: Generally inexpensive and adaptable systems. However, they are not very flexible because they are permanently installed.
  • Fixed RADAR stations: They can be installed on existing poles or on specially designed roadside structures. They are moderately expensive and can simultaneously measure the speeds of different vehicles in both directions of travel.
Speed measurement systems with the possibility of continuous surveys:
  • Mobile RADAR stations and LiDAR guns: they have high versatility, precision and immediate correspondence between vehicles and measured speeds. However, they are very expensive.
  • On-board diagnostic (OBD) black boxes: they allow knowing the exact location and speed of the vehicle through GPS systems. They are characterized by sufficient accuracy if the device is able to receive data from a sufficient number of satellites. However, a large number of devices may be required to obtain statistically significant samples.
For several years, in addition to conventional methods of measuring speed, new, inexpensive and fast methods have been developed based on the use of special apps for smartphones with the most popular operating systems such as Android and iOS.
Smartphones, which are available to drivers and have many built-in sensors (accelerometer, magnetometer, gyroscope, and GPS), have been used in the transportation, infrastructure, and automotive industries in recent years to collect sensory data from various sensors and then process it on a central server for further analysis [37,38,39]. Berloco et al. [36] have shown that these devices provide reliable results comparable to more expensive conventional instruments, especially when detecting low speeds such as those associated with traffic calming measures.
The application of methods based on smartphone apps requires the selection of a significant sample of test drivers, who must thus travel the road sections where the traffic calming measures are present. Each test must necessarily be conducted in the presence of a smartphone in the vehicle of each test driver, as well as an operator who must coordinate the survey operations (start the driving test, start the app, stop the app). It is advisable that this operator influences the driver as little as possible so that all driving tests can be as natural as possible. This can generally be carried out when the operator is in the back seat of the vehicle driven by the test driver.

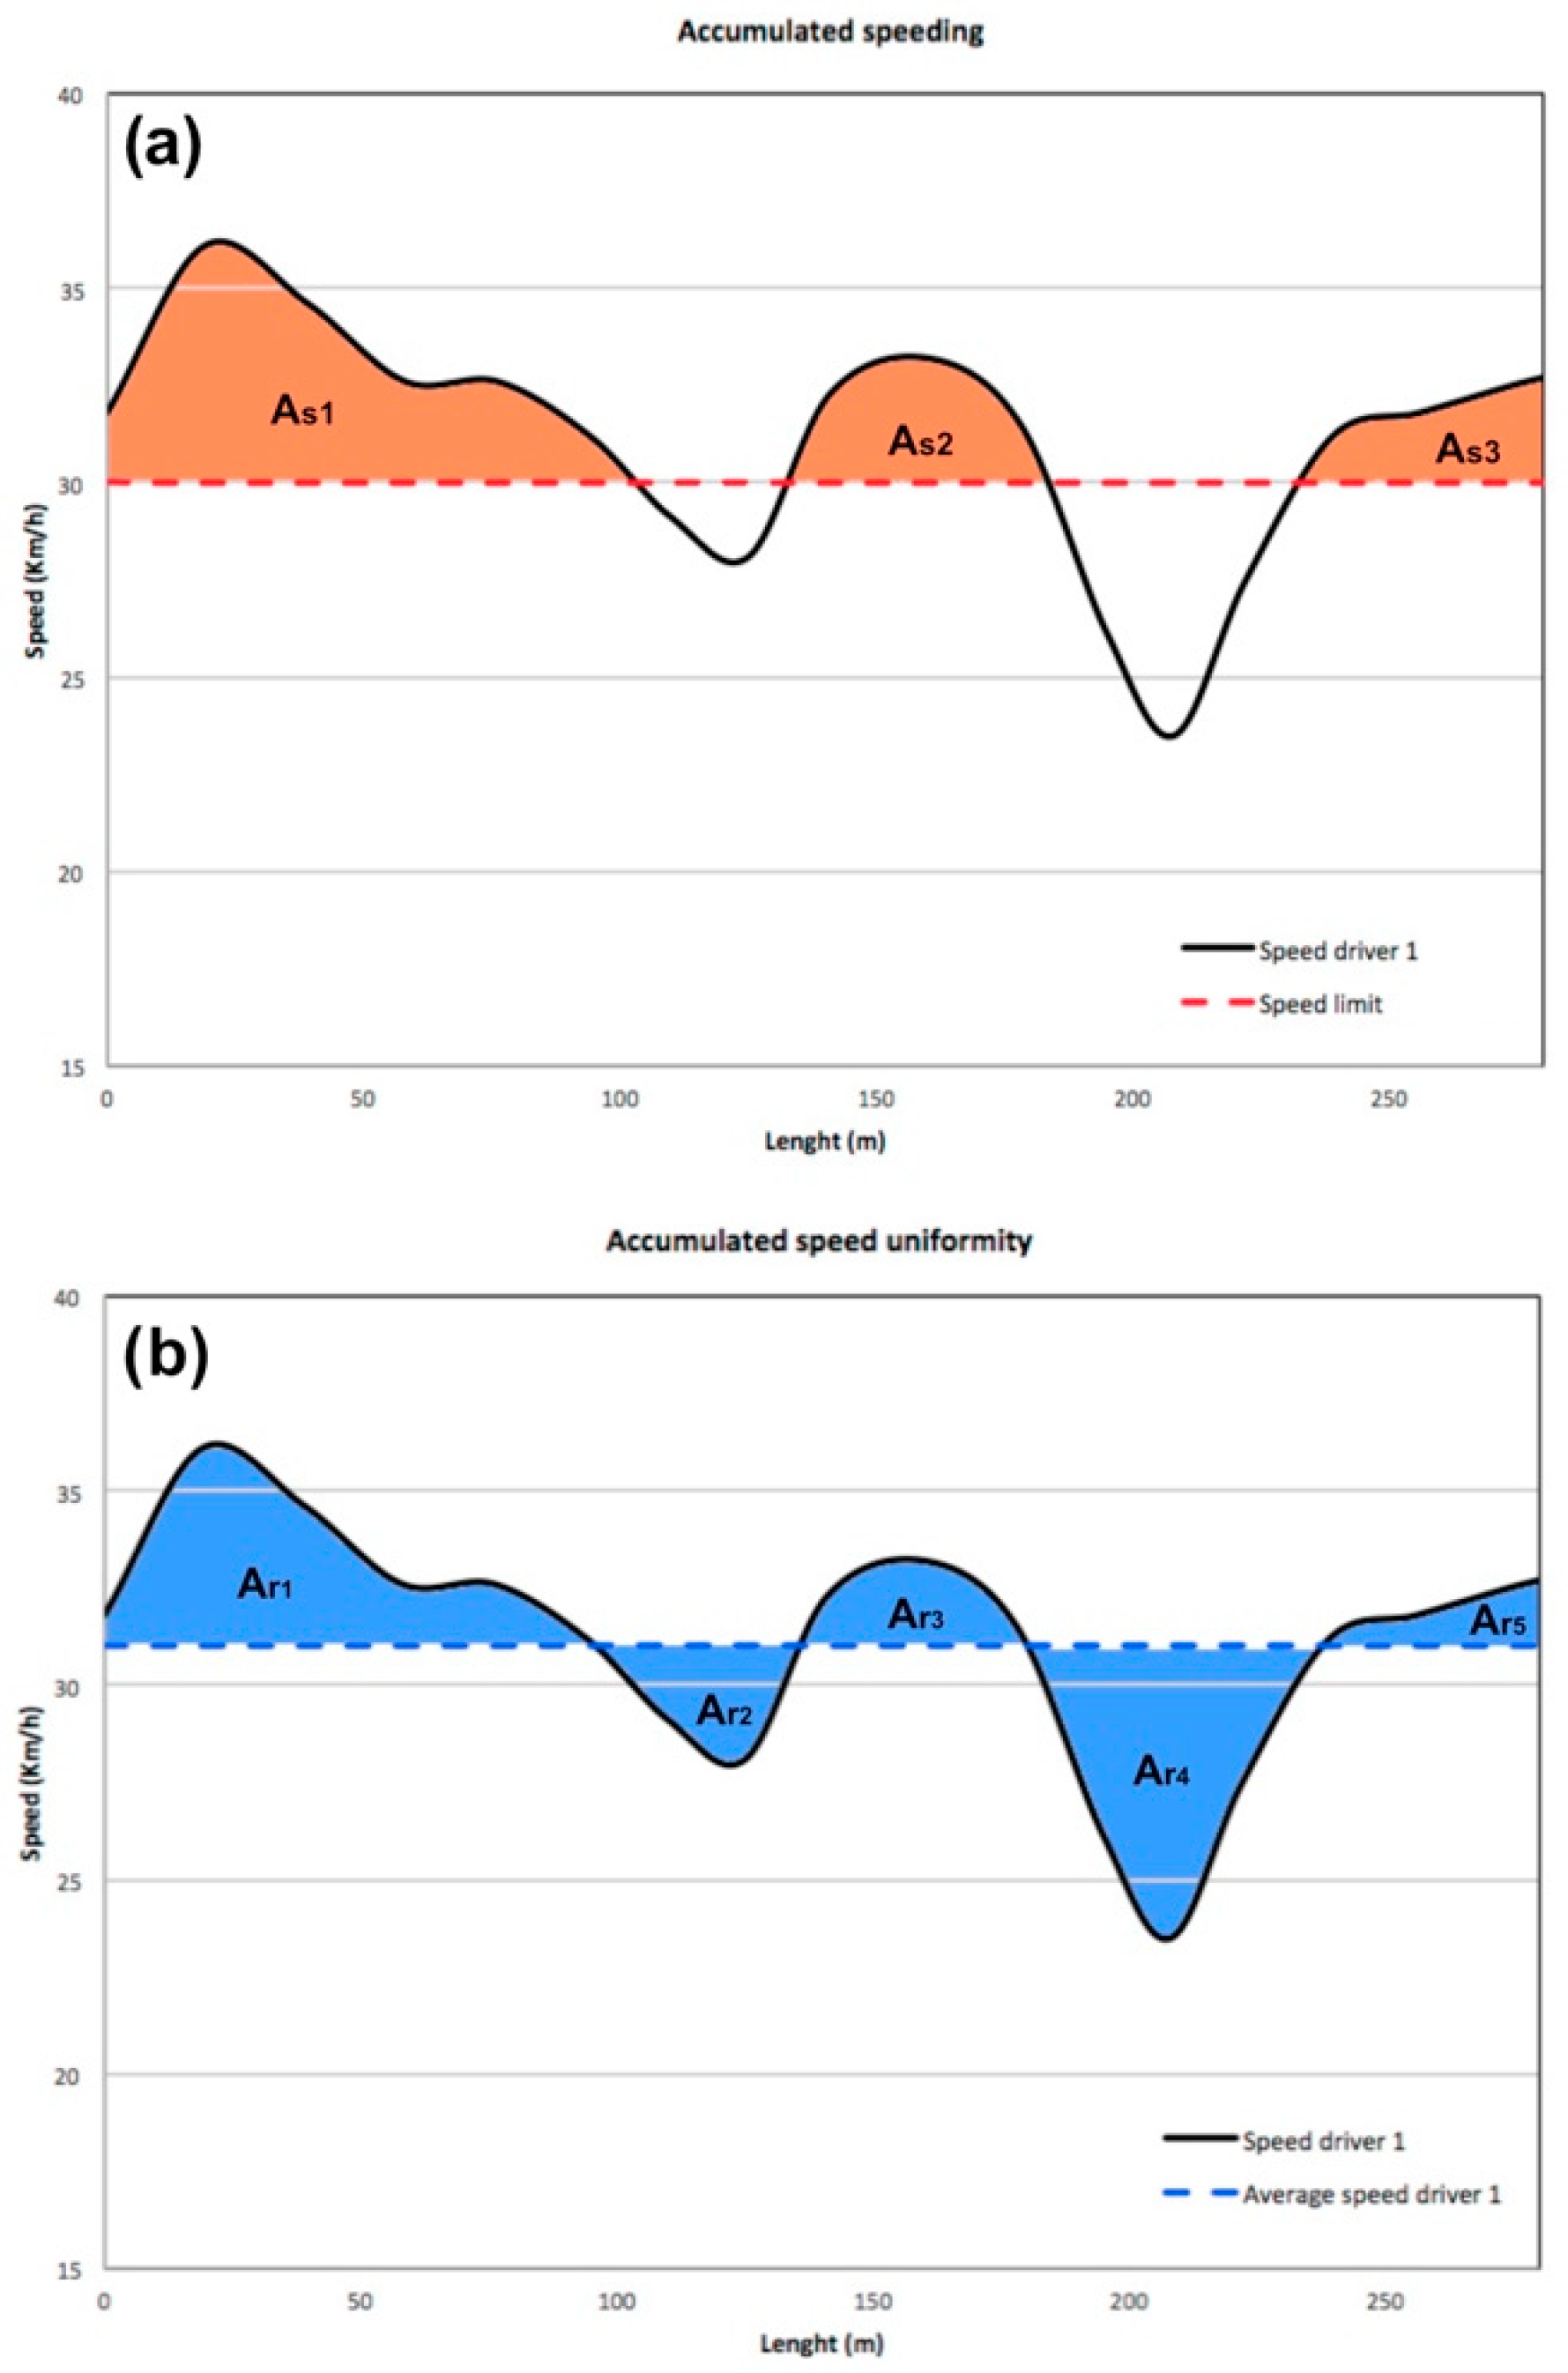
2.2. Estimation of Effectiveness Indicators

It is now well known that a uniform speed environment that meets driver expectations avoids abrupt changes in operating speeds and creates a safe operating environment. Uniformity of speed brings some main benefits: less impact on the environment, better quality and lower driver stress, and improved safety [40].
To evaluate the effectiveness of traffic calming measures, this study proposes the use of two indicators based on the continuous speed profile. These indicators were defined by Polus et al. [40] as a measure of the consistency of a highway section and subsequently used by other researchers as surrogate measures of safety in urban areas [41,42]. The first index (Ea) evaluates the accumulated speeding along the entire road segment, while the second index (Ra) evaluates the accumulated speed uniformity.
Ea is the normalized relative area (per unit length) between the speed profile values that are above the speed limit and the speed limit line. The measure can be applied to individual speed profiles or to an operating speed profile. Given a speed limit, the areas between the speed profile and the speed limit line must be determined. Only the areas above the speed limit line (Asi) must be considered in the measurement (Figure 2a). The accumulated speeding must be calculated using Equation (1) as the sum of the areas divided by the length of the segment (L). Consequently, Ea is directly related to the cumulative speeding.
E a = As i L
where:
  • Ea: accumulated speeding (m/s);
  • ∑Asi: sum of areas bounder between the speed profile and the speed limit where speed in higher than speed limit (m2/s);
  • L: road section length (m).
Figure 2. Example of evaluation of the areas for the definition of the effectiveness indicators: (a) accumulated speeding; (b) accumulated speed uniformity.
Sustainability 14 07325 g002
Moreno et al. [41] found that the individual accumulated speeding values did not follow a normal distribution; therefore, the variable was transformed into the square root of the accumulated speeding. Therefore, the variable to be analyzed was calculated as the square root of the accumulated speeding ( E a * ).
E a * = E a
The E a * thresholds for good, acceptable, and poor efficiency proposed by Moreno et al. [41] are shown in Table 1.
Ra is defined as the normalized relative area (per unit length) lying between the speed profile and the line of average speed. The measure can be applied to individual speed profiles or to the operating speed profile. The first step is to calculate the average speed of the speed profile along the road. In this way, the areas lying between the speed profile and the average speed line (Ari) are obtained (Figure 2b). The consistency measure is the sum of the absolute values of the areas divided by the length of the segment (L). Therefore, Ra is inversely related to the accumulated speed uniformity. Equation (3) must be applied.
R a = A r i L
where:
  • Ra: accumulated speed uniformity (m/s);
  • ∑Ari: sum of areas in absolute values bound between the speed profile and the average speed (m2/s);
  • L: road section length (m).
The Ra thresholds for good, acceptable, and poor design are shown in Table 1 [40].

2.3. Analysis and Interpretation of Results

For each speed profile acquired by one of the methods mentioned in Section 2.1, the pair of effectiveness indicators consisting of E a * and Ra is determined.
Depending on the number of profiles evaluated for a given study site, a more or less extensive database is created, which must be subjected to detailed statistical analyses in order to understand whether the traffic calming measures in the site in question are indeed, as a whole, suitable to ensure the desired effectiveness requirements, or whether they present anomalies that could be mitigated by appropriate corrective measures.
For this purpose, the use of the box and whisker plot (or boxplot) is considered particularly appropriate. It is a convenient method for visually representing the distribution of data by their quartiles. Boxplots have the advantage of taking up little space, which is useful when comparing distributions between many groups or datasets.
From the display of a boxplot, the following observations in particular can be made: (a) what key values there are, such as average, median, 25th percentile, etc.; (b) whether there are outliers and what their values are; (c) whether the data are symmetrical; (d) how closely the data are grouped; (e) whether the data are skewed, and if so, in what direction.
The results of the statistical analysis applied to the different values of the effectiveness indicators calculated for the traffic calming measures of a given survey site may ultimately allow the determination that the site in question is suitable or unsuitable to ensure the necessary safety requirements. If, after applying the SPEIR methodology, the site is found to be inadequate, the administrator must decide whether and when to take corrective action to improve the safety performance that the site itself must guarantee to the various users of the street. The administrator may also decide not to intervene. However, if the administrator contemplates adjusting the site, it would be advisable for him/her to have an appropriate tool to identify the corrective actions that must be implemented on the site to ensure compliance with the quantifiable requirements with the E a * and Ra indicators. The simplest solution, but one that could prove ineffective or only partially effective, would be to modify the traffic calming measures at the study site and verify their effectiveness by reapplying the SPEIR methodology. In this case, there could be a risk that the new traffic calming measures installed at the survey site would still be insufficient to provide the desired safety performance.
It would, therefore, be desirable for the manager to have the option of selecting design solutions that have already been experimentally “validated” in other urban contexts through the SPEIR methodology and, therefore, have a high probability of ensuring the effectiveness requirements. This would minimize the manager’s risk of expending financial resources without achieving the desired results. This possibility, shown in the right part of the framework in Figure 1, is discussed in more detail in the final part of this paper when the potential of the proposed methodology and future research developments are presented.

3. Case Studies and Results

The analysis methodology proposed by the authors was applied to evaluate the effectiveness of different traffic calming measures in three Zones 30.

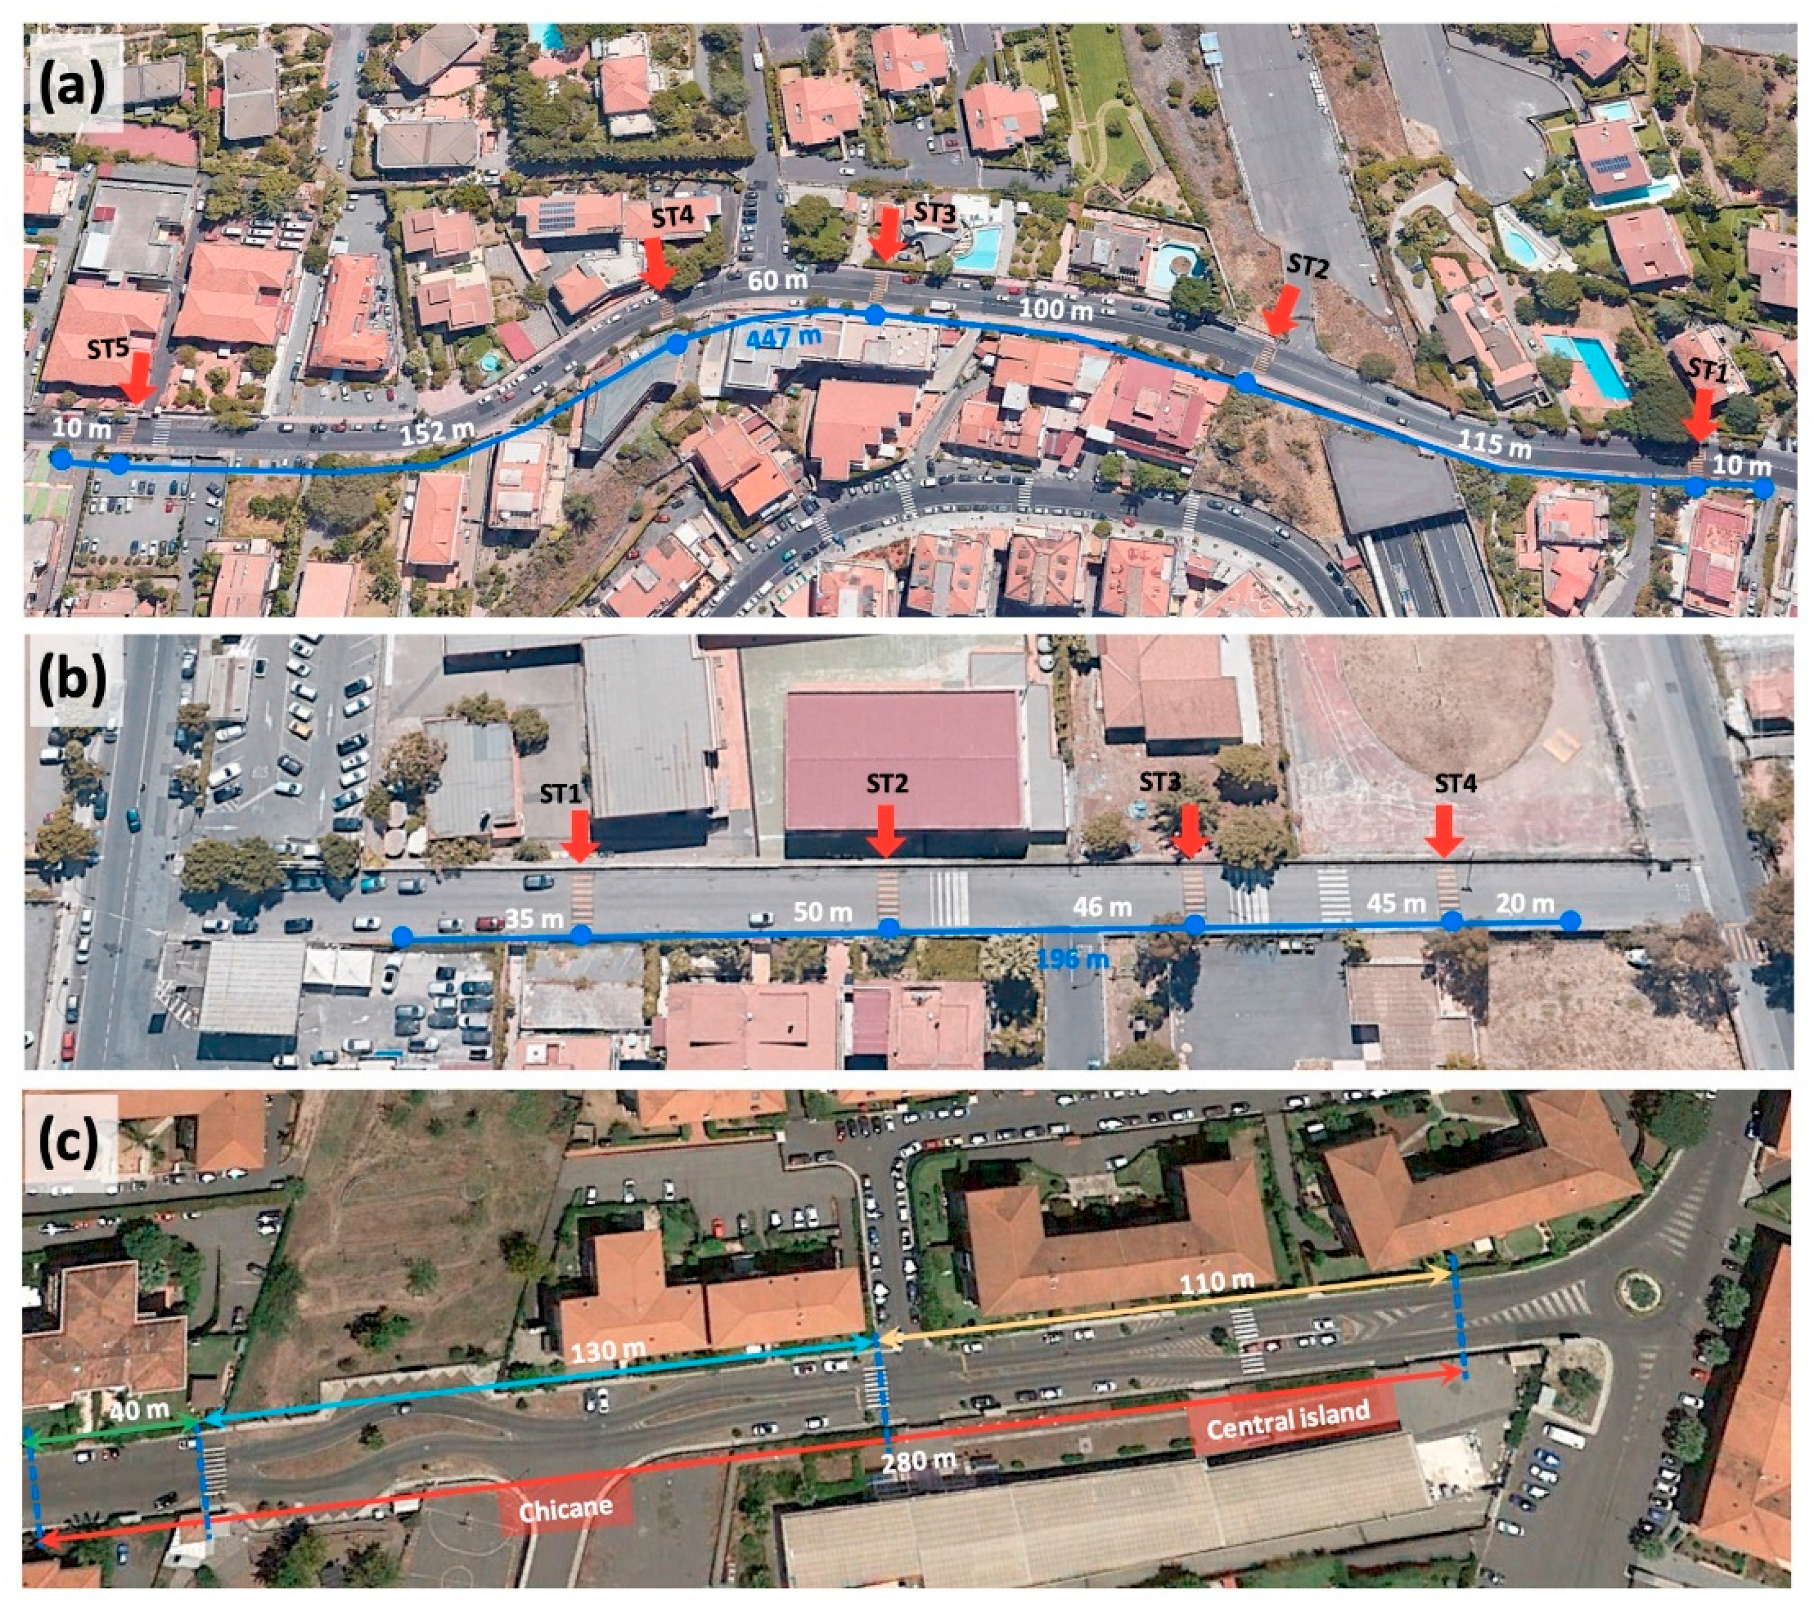
3.1. Selection of Zones 30

The experimental analysis was carried out in two municipalities in the hinterland of the metropolitan city of Catania, S. Agata Li Battiati and Tremestieri Etneo. These are two small municipalities (in both cases the population is less than 20,000), with predominantly residential buildings. In both municipalities, most of the inhabitants tend to move to the metropolitan capital to work, while all the needs, foodstuffs, and small trade products, as well as the children’s schooling, are met in the municipalities themselves.
Thus, the two communities have many similarities, and the administrations pursue similar strategies to improve the quality of life of the residents.
Three Zones 30 in the above municipalities were selected for this work. In two of them, there are vertical misalignments (Speed Tables, ST), while one of them is formed by horizontal misalignments (chicane and center island).
Zone 1 is a 447 m road section on which there are five speed tables placed on specific sections of the road, selected to attract the attention of drivers and cause them to slow down, and therefore, spaced at different distances from each other. All speed tables have a height of 8 cm and a width of 3 m. Zone 2, on the other hand, is a 196 m long section of road in which there are 4 speed tables placed at even distances from each other (about 45 m). All speed tables have a height of 4 cm and a width of 3.20 m. Zone 3 is a 280 m road section where a 130 m chicane and a 110 m horizontal deviation of the roadway by a center island have been created. Figure 3 shows the configurations of the studied sites.

3.2. Speed Data Collection

The speed measurement method used in this work is based on the use of a smartphone and a dedicated application to record the data collected. As mentioned in Section 2.1, a measurement campaign of this type requires the selection of a sample of test drivers with a sufficiently large number for the investigation carried out. Twenty drivers were recruited by the University of Catania to conduct the test drives. An advertisement was placed on the University of Catania website that included information about the study and a questionnaire to recruit participants. Participants were selected from all those who responded to the advertisement. Drivers had to be between twenty-five and sixty years old and had held a driver’s license for at least three years. The twenty test drivers were equally divided between male and female. The test drivers were selected from among those who were not regular users of the three survey sites. Indeed, one of the questions in the online recruitment questionnaire asked whether the usual trips were in the city center of Catania or in the hinterland communities. Since the three survey sites are located in two municipalities in the hinterland of Catania, only those users who indicated that they traveled mainly in the center of Catania were included. The drivers were called from time to time by the authors of this study, who played the role of the coordinators of the corresponding activities. Each driver performed the test in their own car, always accompanied by one of the coordinators who sat in the back seat during the test so as not to influence the behavior of the test driver. The coordinator took care of the correct positioning of the smartphone on the car dashboard (see Section 3.3) and assessed whether each test, once completed, was valid for the purposes of the study. The study was conducted in accordance with the Declaration of Helsinki, and the protocol was approved by the DISS-Center for Road Safety of the University of Parma (Deliberation of the Steering Committee—prot. 211112/2021 of 22 February 2021).
Participants gave their informed consent to participate in the experiment. They were informed that all data collected would be kept confidential and used for research purposes only. Participants were also informed that they would not be assessed on their skills as drivers and that the sole aim of the study was to analyze the behavior of a group of drivers to draw conclusions about drivers in general. For the purposes of the study, it was deemed necessary to collect speed profiles from non-regular users of the survey sites in order to evaluate the traffic calming effect of the measures in the Zones 30 as objectively as possible. Before the actual test, each driver was invited to drive through the Zone 30 accompanied by the coordinator. This allowed drivers to familiarize themselves with the specifics of the route and avoid the uncertainties that could arise from having to navigate a completely unfamiliar route. However, the actual test was performed by each driver only once for each survey location. The start of each test drive was always given by the coordinator present in the test driver’s car as soon as the conditions of the test route were judged to be optimal. For research purposes, the second coordinator, who was at the end of the path being investigated, informed the other coordinator of any anomalies in Zone 30. Speed data were collected from August 2020 to May 2021 during off-peak periods, during daylight hours, and under good weather conditions. Speed data were collected in free-flowing traffic to ensure that the measured operating speeds were influenced only by Zone 30 characteristics. Only in seven cases was it necessary for the test driver to perform more than one test, since there were episodes during the test that affected the driver’s behavior and invalidated the test (e.g., the sudden appearance of a slow vehicle or the presence of a pedestrian who expressed their intention to cross the road). An integrated system using smartphone applications was used to record, collect, store, analyze, and visualize speed data. The test drives were carried out using the test drivers’ cars and a high-end smartphone equipped with high-quality sensors (GPS, accelerometer, gyroscope) and with the GEO Tracker application for Android systems installed. The smartphone was placed in the car (on the front dashboard) with the Y-axis of the accelerometer pointing towards the car. The collected dataset refers to both one-dimensional indicators (e.g., X, Y, Z accelerations, speed, etc.) and high spatial resolution (at 0.3 s intervals).

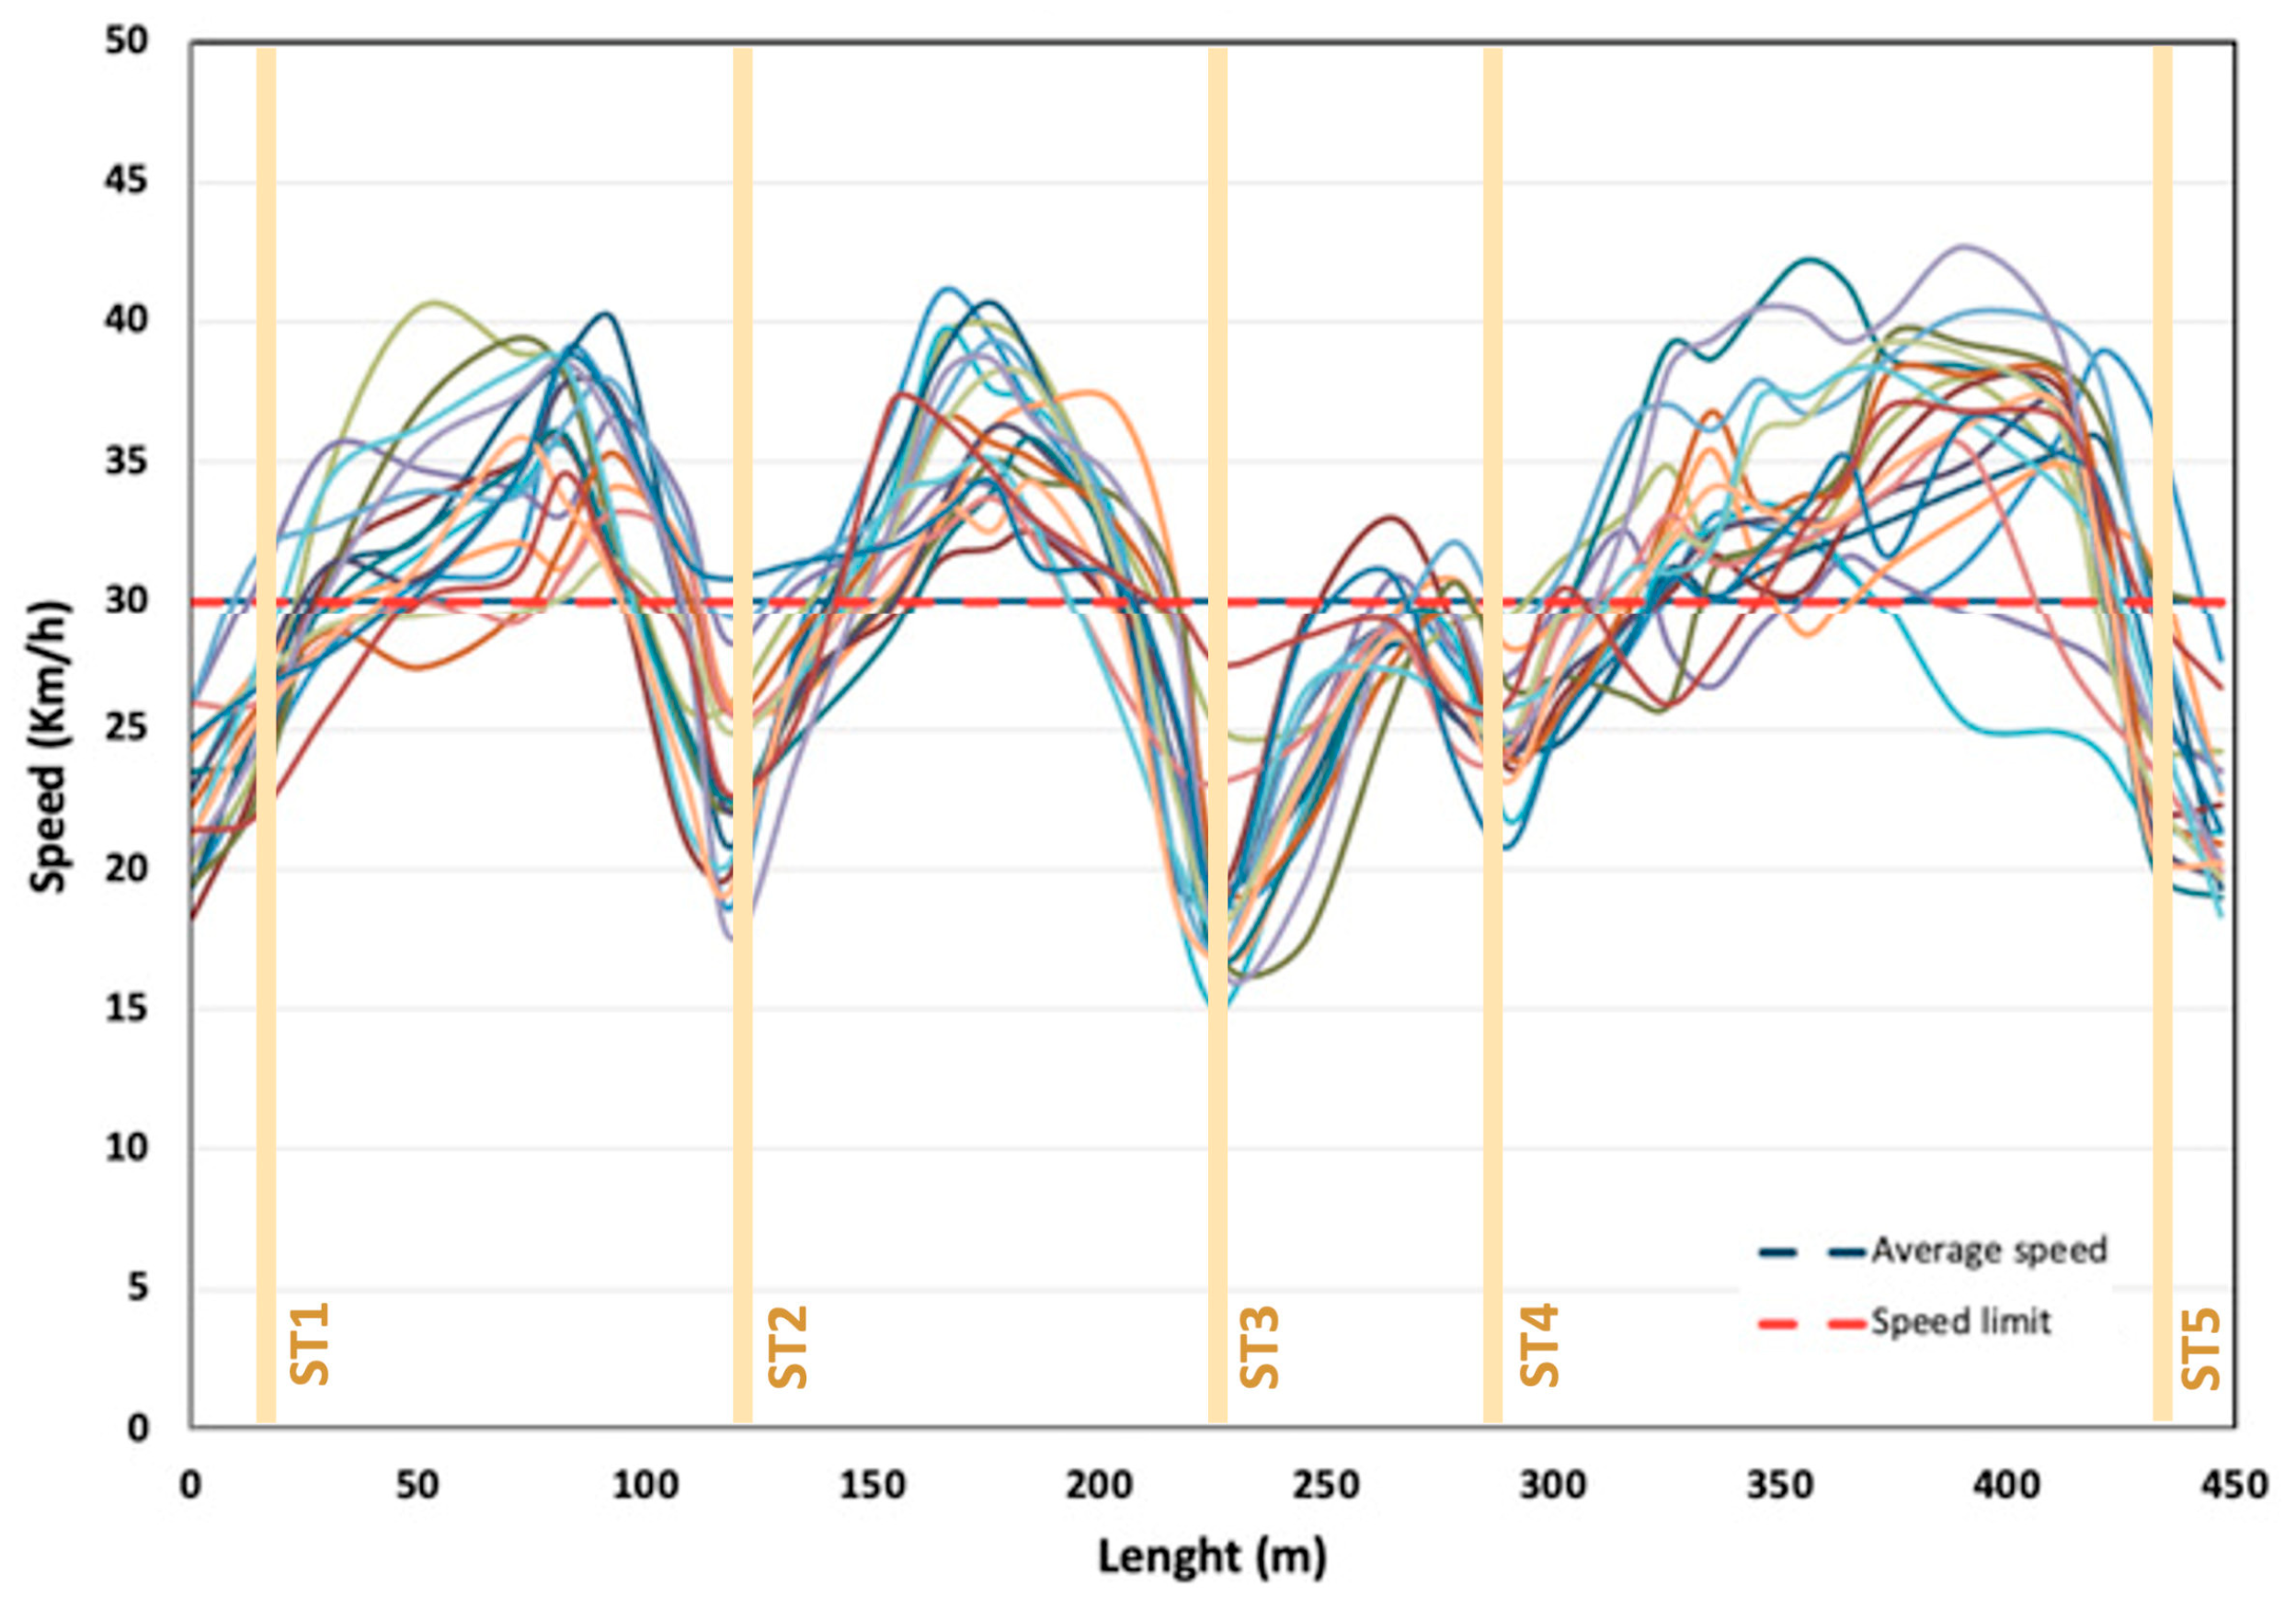
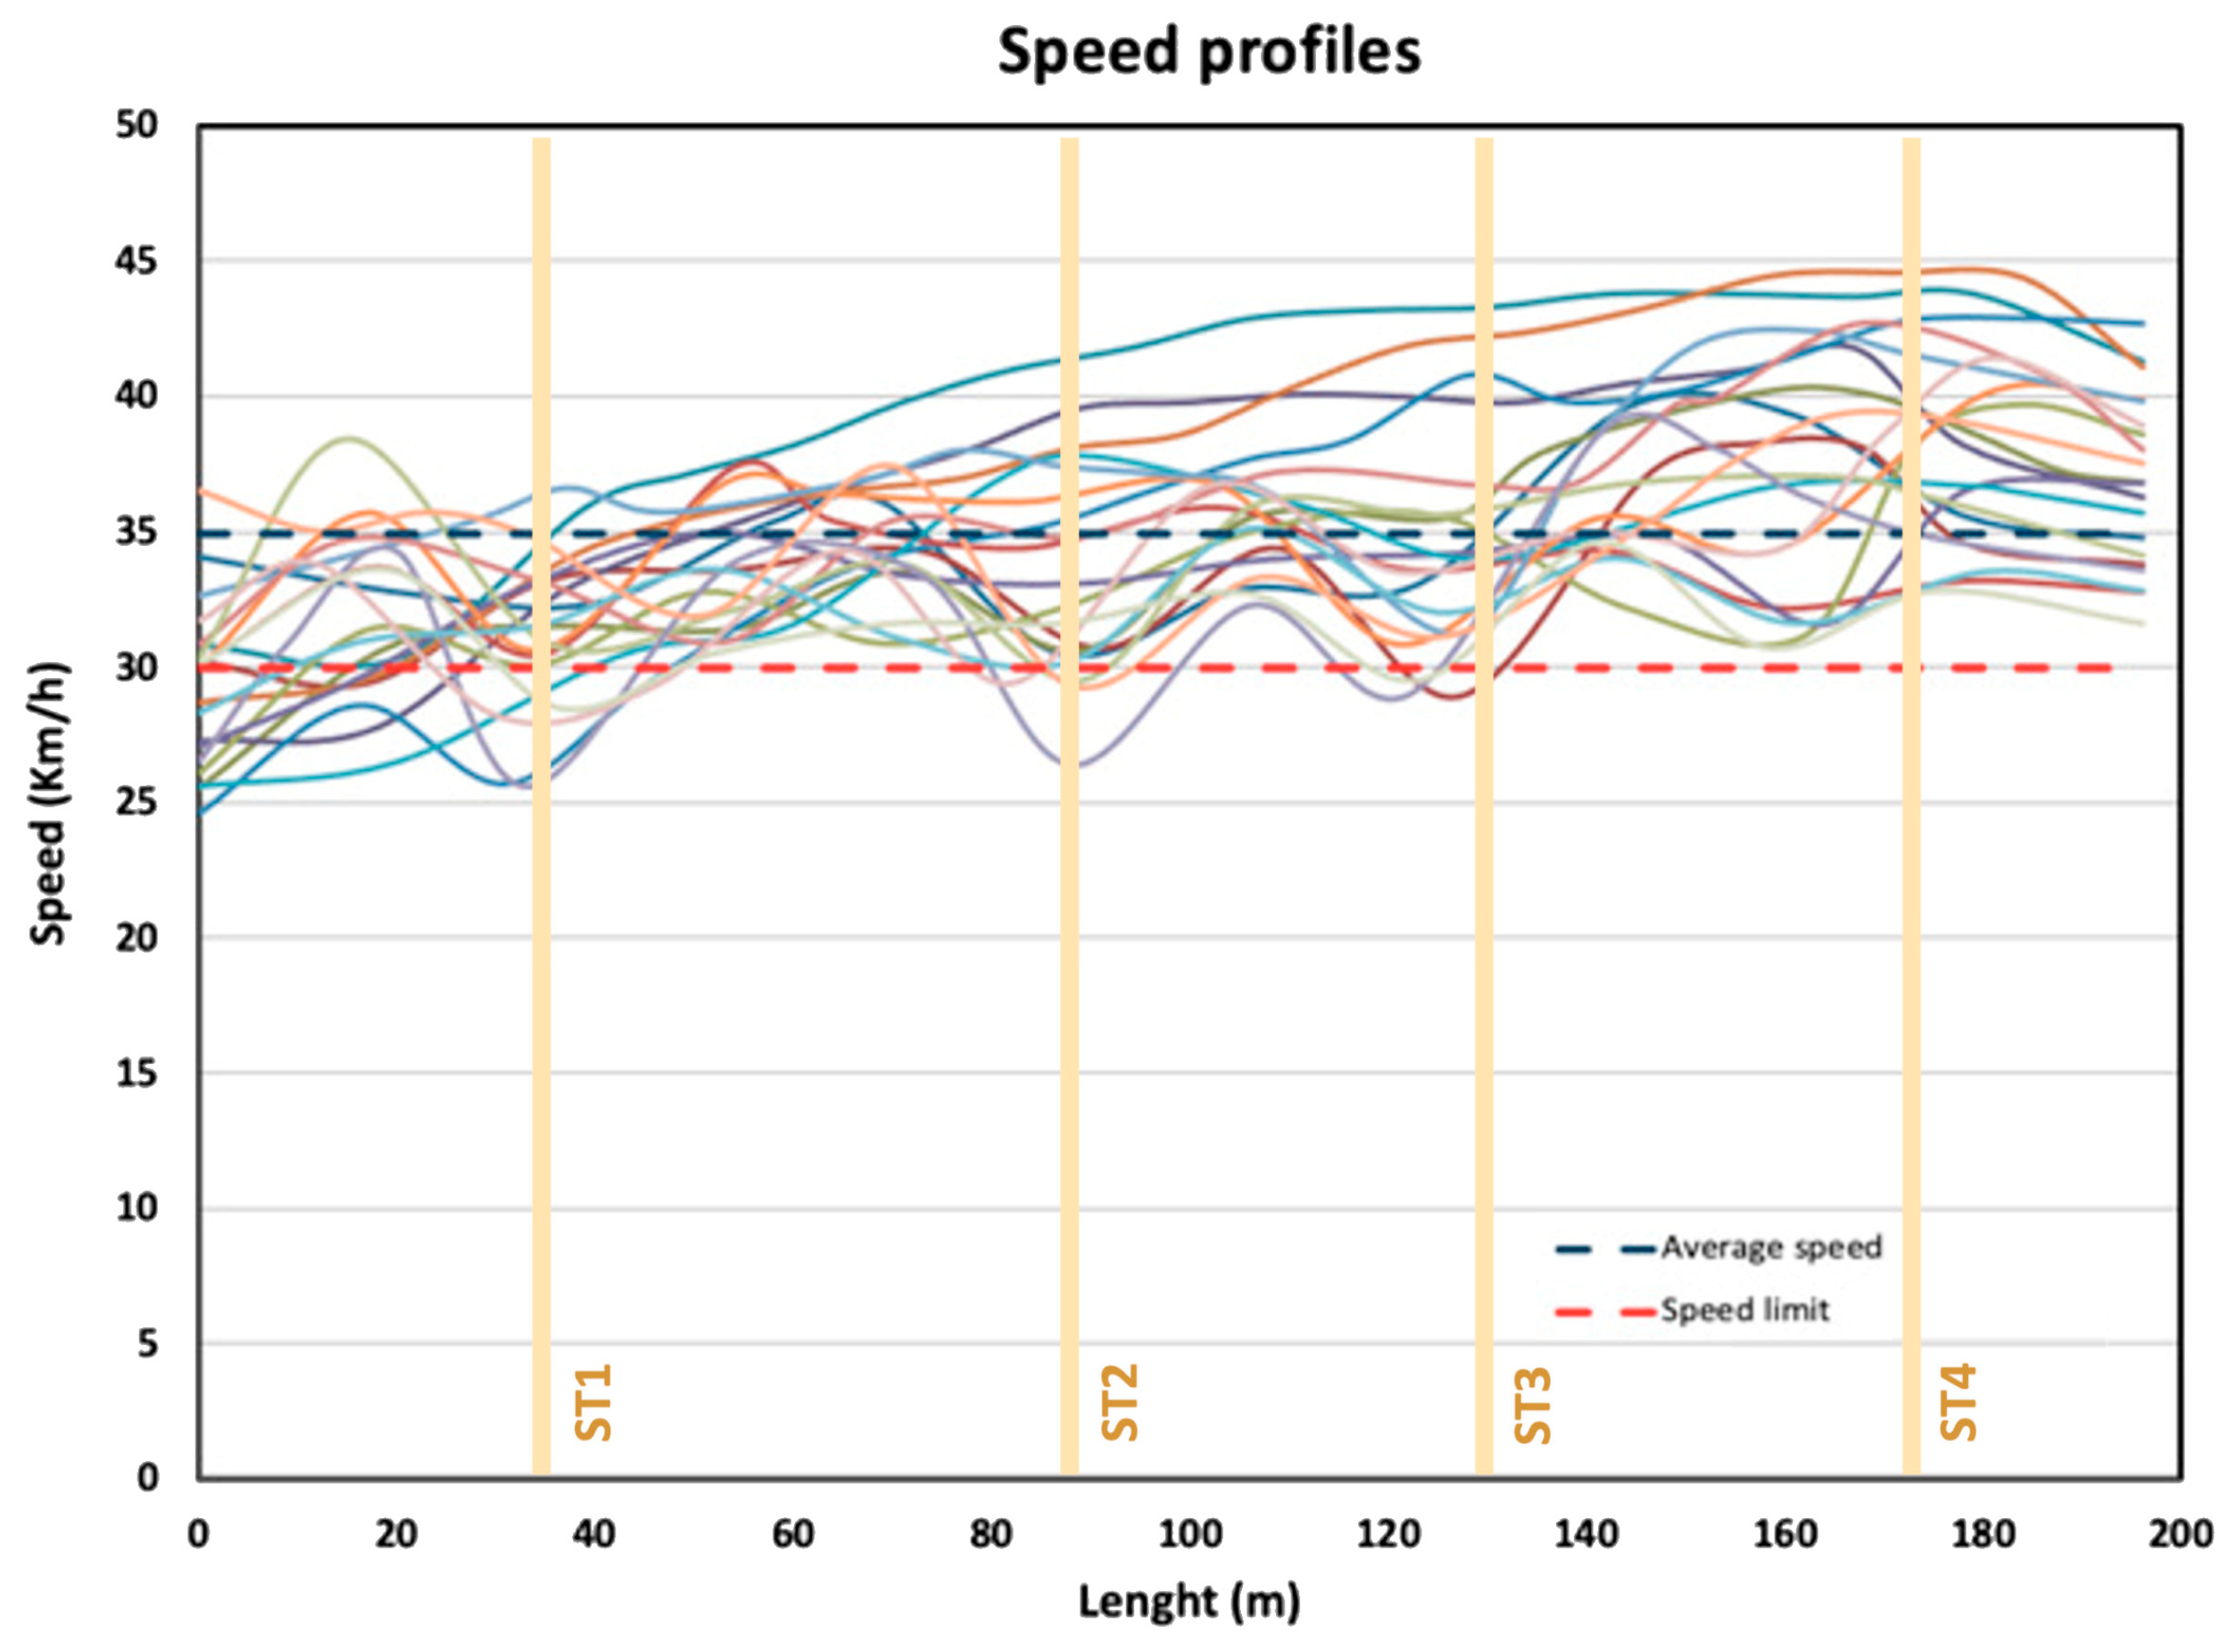
3.3. Determination of Speed Profiles

At the end of the survey work, 60 speed profiles were created (20 profiles for each of the three Zones 30 selected as a case study). Figure 4, Figure 5 and Figure 6 show the speed profiles for the three areas studied. It should be noted that these profiles vary considerably, and from a preliminary analysis of these profiles, the following considerations can be made:
  • In Zone 1, there are significant deviations of the speed from the average value. The latter coincides with the speed limit of 30 km/h. In particular, it can be observed how the speed peaks reached by the users are significantly reduced when the distances between the speed tables are reduced (e.g., between ST3 and ST4).
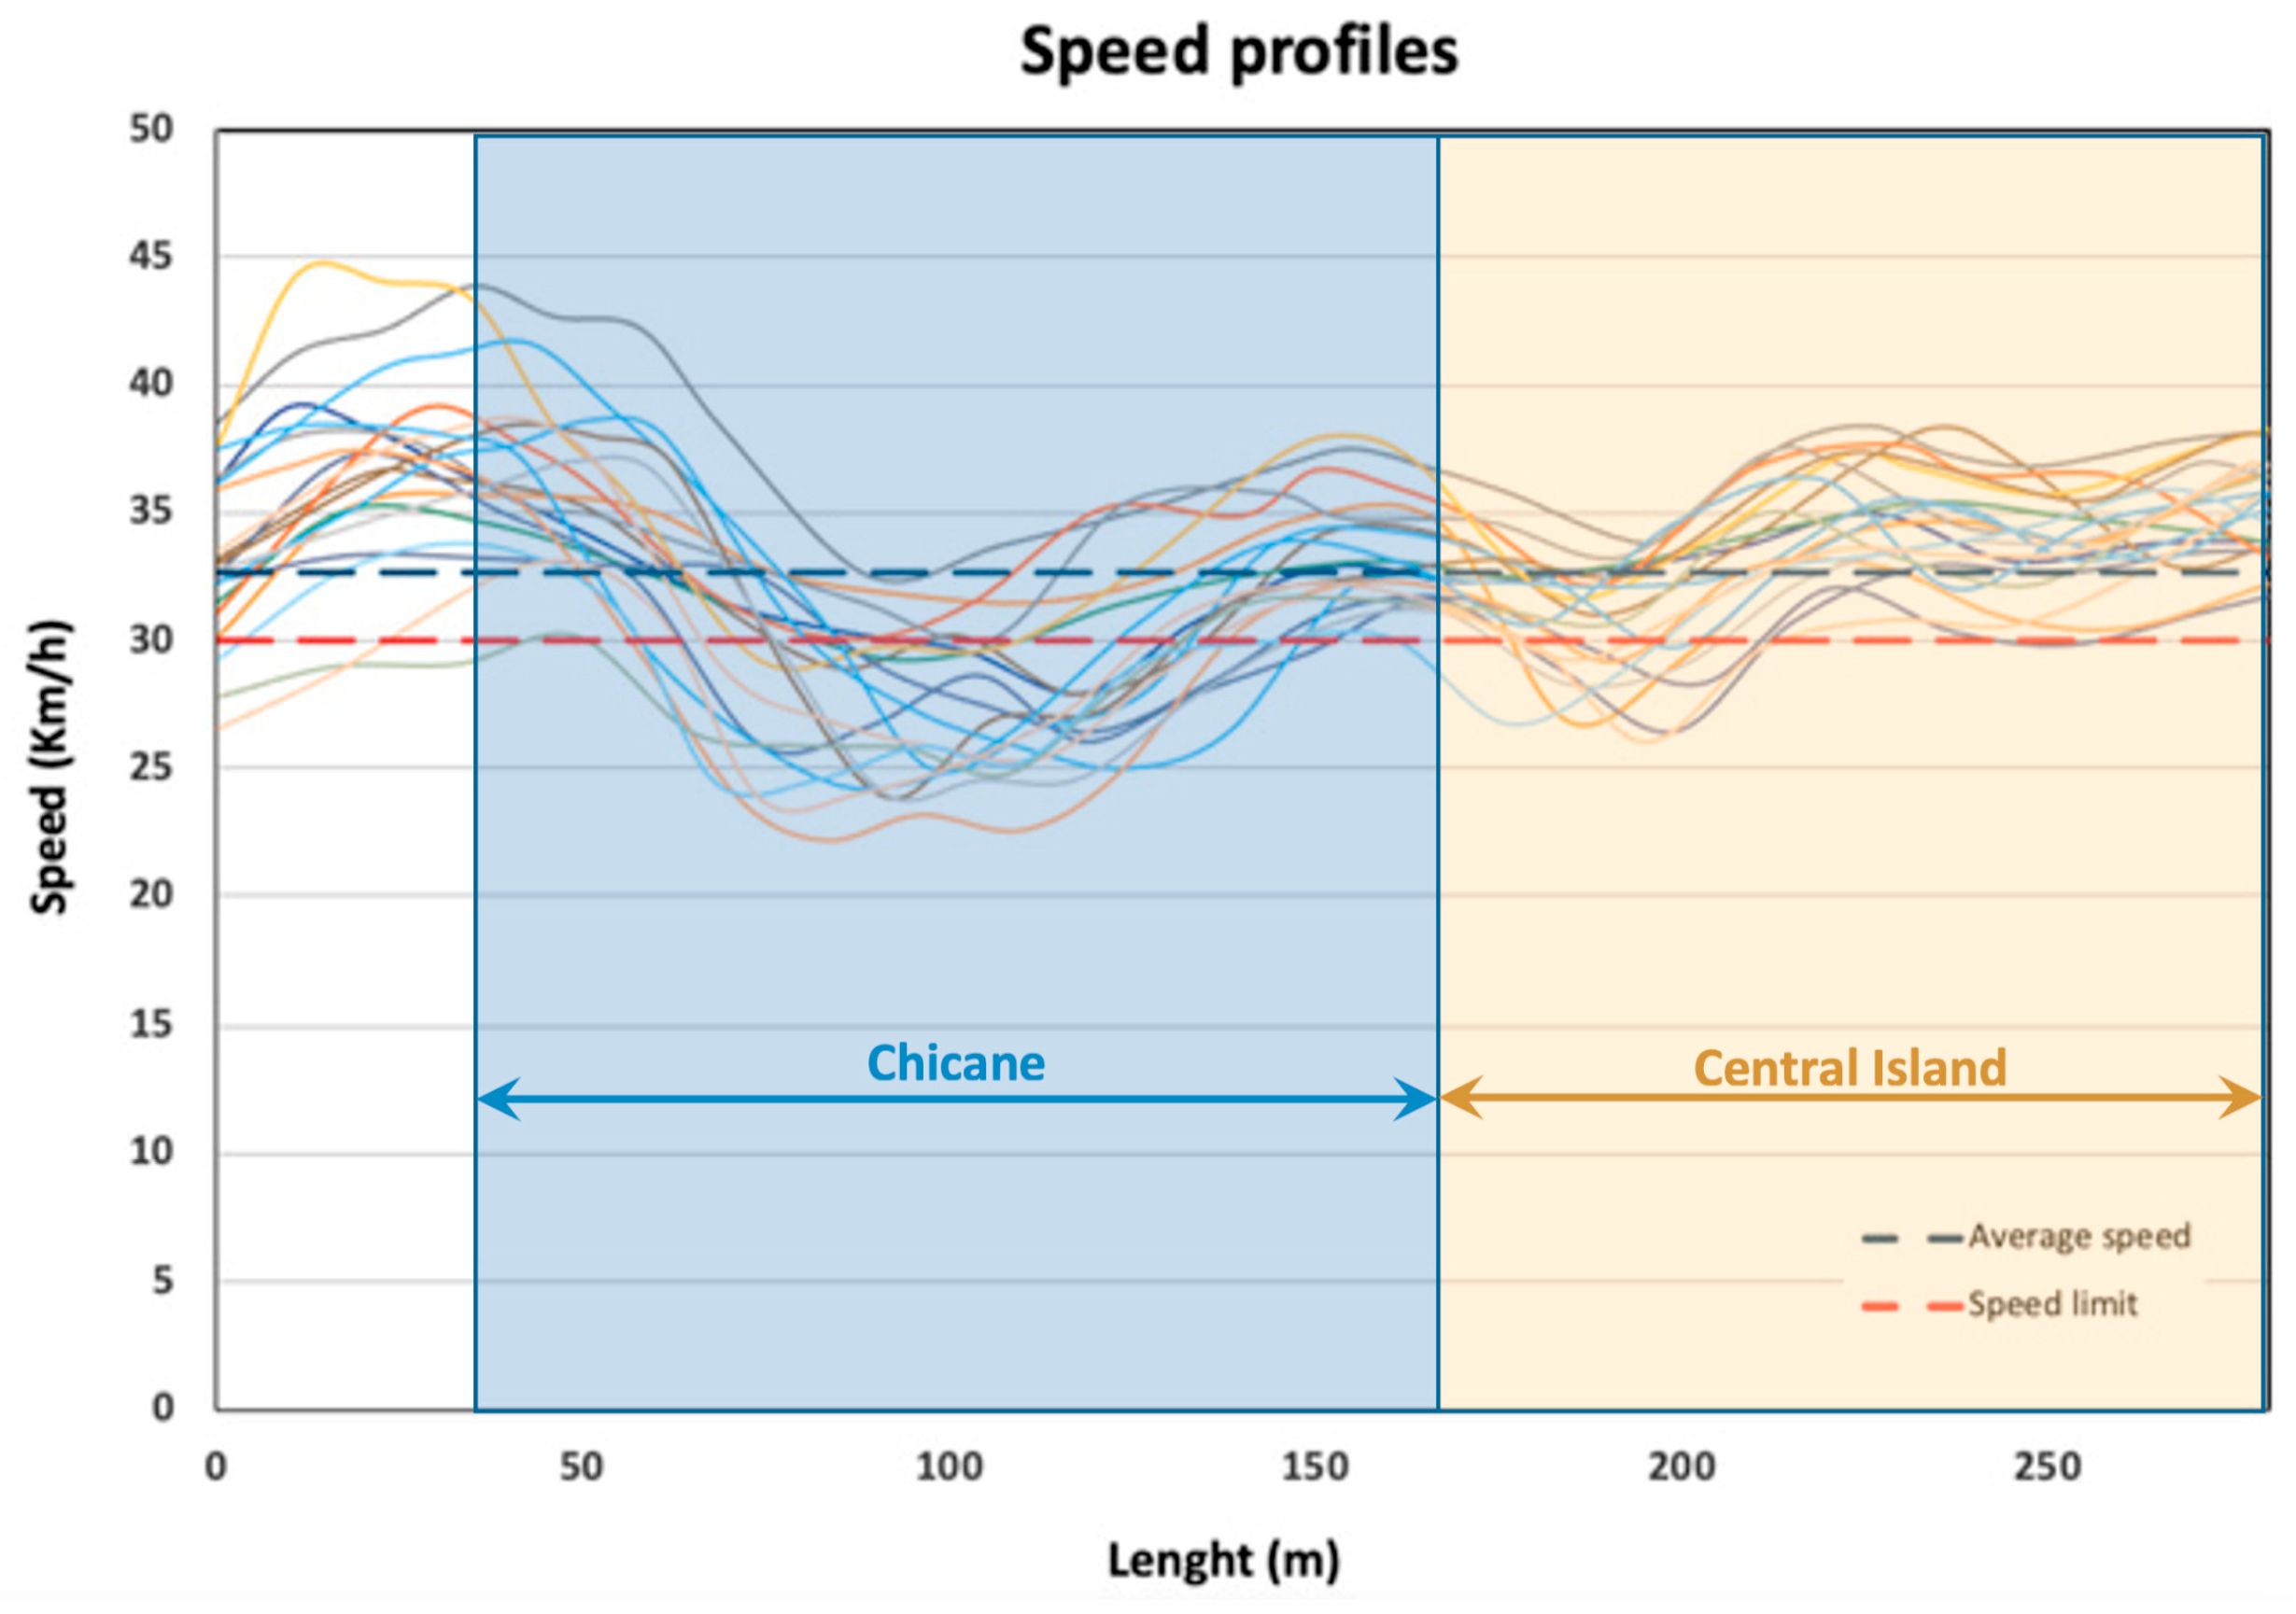
  • In Zone 2, the speed profiles of the test drivers are quite homogeneous and there are no significant variations. However, it is obvious that the average speed values are higher than those prescribed in this Zone 30.
  • In Zone 3, the speed profiles show little variation compared to the average, which is just above the 30 km/h speed limit. It is particularly noticeable that the speed profiles at the chicane fall much more below the average speed of the zone than on the central island.
Figure 4. Speed profiles for Zone 1.
Sustainability 14 07325 g004
Figure 5. Speed profiles for Zone 2.
Sustainability 14 07325 g005
Figure 6. Speed profiles for Zone 3.
Sustainability 14 07325 g006

3.4. Estimation of Effectiveness Indicators

The effectiveness indicators ( E a * e Ra) were calculated in relation to the speed profiles of the 20 test drivers and for each zone that was the subject of the experimental study. They were calculated according to the procedure outlined in Section 2.2.
Table 2 summarizes the results of the calculations performed. In particular, it contains the minimum and maximum values of the two indicators, as well as the values of the 85th percentile (i.e., the values exceeded by only 25% of the test drivers). Table 2 also contains summary information for each of the Zones 30 considered, as well as the average speeds (Save) assumed by the users who carried out the different driving tests.

3.5. Results

Normality tests of Kolmogorov–Smirnov and Shapiro–Wilk were preliminarily performed for the distributions of E a * and Ra associated with the three Zones 30 analyzed. Both tests show that the three distributions of the variable E a * and the variable Ra are always statistically comparable to normal distributions (the tests always yield values of p-value > 0.05).
Subsequent statistical analyses were performed using the box and whisker plot (or boxplot). Table 3 shows all the parameters resulting from the statistical analysis of the three distributions of E a * . Figure 7 shows the boxplots associated with the distributions of E a * for the three zones studied. This plot has been divided into three areas delimited by the thresholds given in Table 1.
Table 4 shows all the parameters resulting from the statistical analysis of the three distributions of Ra, while Figure 8 shows the boxplots associated with the distributions of Ra for the three zones analyzed. This plot has been divided into three areas delimited by the thresholds given in Table 1.

4. Discussion

The SPEIR methodology, proposed to analyze the effectiveness of traffic calming measures in a given study area, makes it possible to verify whether an urban infrastructure complex in which various measures have been implemented (e.g., low-speed zones, residential streets, home zones, etc.) is actually capable of ensuring compliance with speed limits and adherence to a uniform speed regime by road users.
The case studies presented in this work are fundamental results for the understanding of the methodology mentioned above and allow us to make considerations aimed at comparing the results obtained with those of other case studies in the technical and scientific literature.
In particular, the following observations can be derived from considering Table 3 and Figure 7:
  • No outliers were found in any of the three Zones. So, in any case, the TCMs do not lead to significant anomalies in the test drivers who participated in the experiment in terms of too high or too low speeds of the imposed limit.
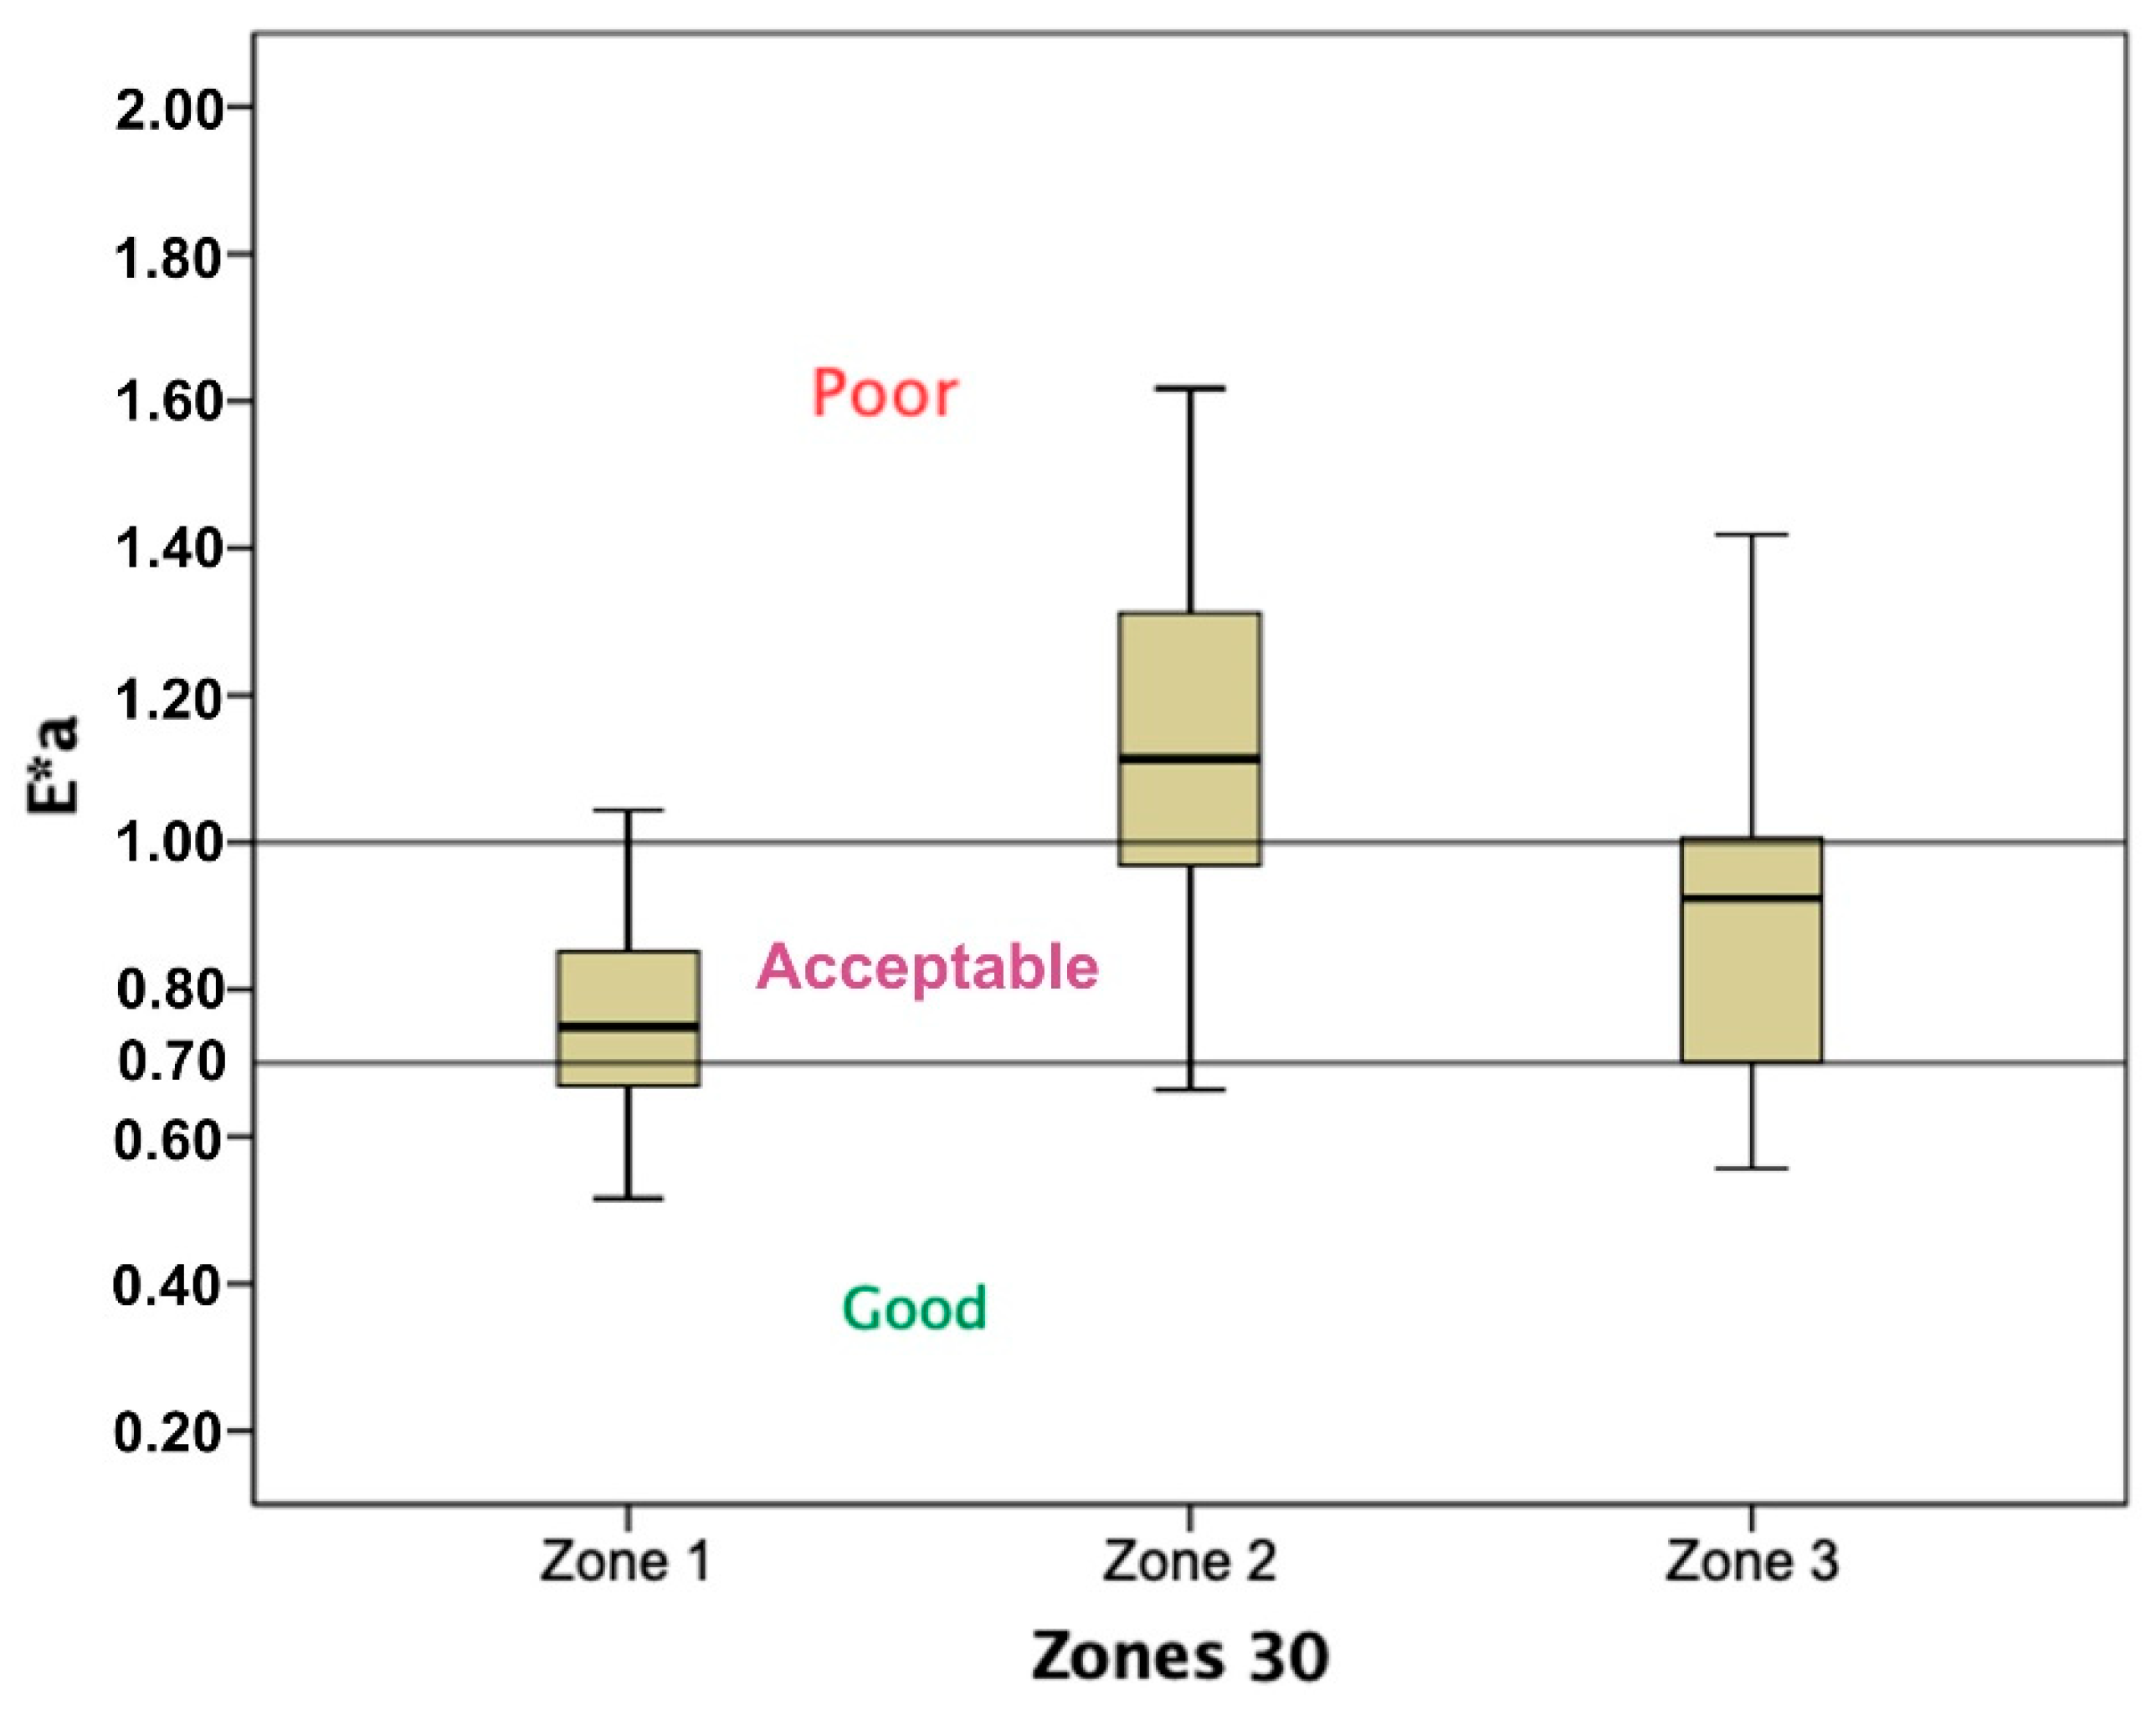
  • All three Zones have levels of effectiveness that exceed the threshold labeled as “good”. However, it should be noted that Zone 1, characterized by a median value of E a * of 0.75, performs largely acceptably and ensures that the values between the second and third quartiles, representing 50% of the total, are kept within a narrow range (dispersion of 0.53) and between the thresholds for “good” and “acceptable”. Only in a few cases, as shown by the final value of the upper whisker of 1.04, does it border on what is considered a “poor” performance.
  • Zone 3 provides an overall acceptable level of performance. The box is essentially bounded by the two threshold values (lower limit equal to 0.69 and upper limit equal to 1.014). However, the value at the end of the upper whisker of 1.40 shows how drivers can be misled into adopting speeds well above the limit imposed by the traffic signs.
  • Zone 2 is the least successful in getting road users to obey the 30 km/h speed limit in effect on that section of road. The median value of E a * , which is 1.11, represents a “poor” level of performance. Moreover, the box is almost entirely above the line that establishes the worst performance of the Zone in question in terms of compliance with the speed limit. If we also consider that (a) the end of the upper whisker shows how the values of the fourth quartile of E a * increase to a value above 1.60, (b) the first quartile is almost entirely contained in the part of the graph bounded below by the acceptance threshold; it becomes clear that the sequence of speed tables in Zone 2 is not an effective measure to ensure the dynamics “legally” required by a Zone 30.
However, from the analysis of Table 4 and Figure 8, it can be deduced that:
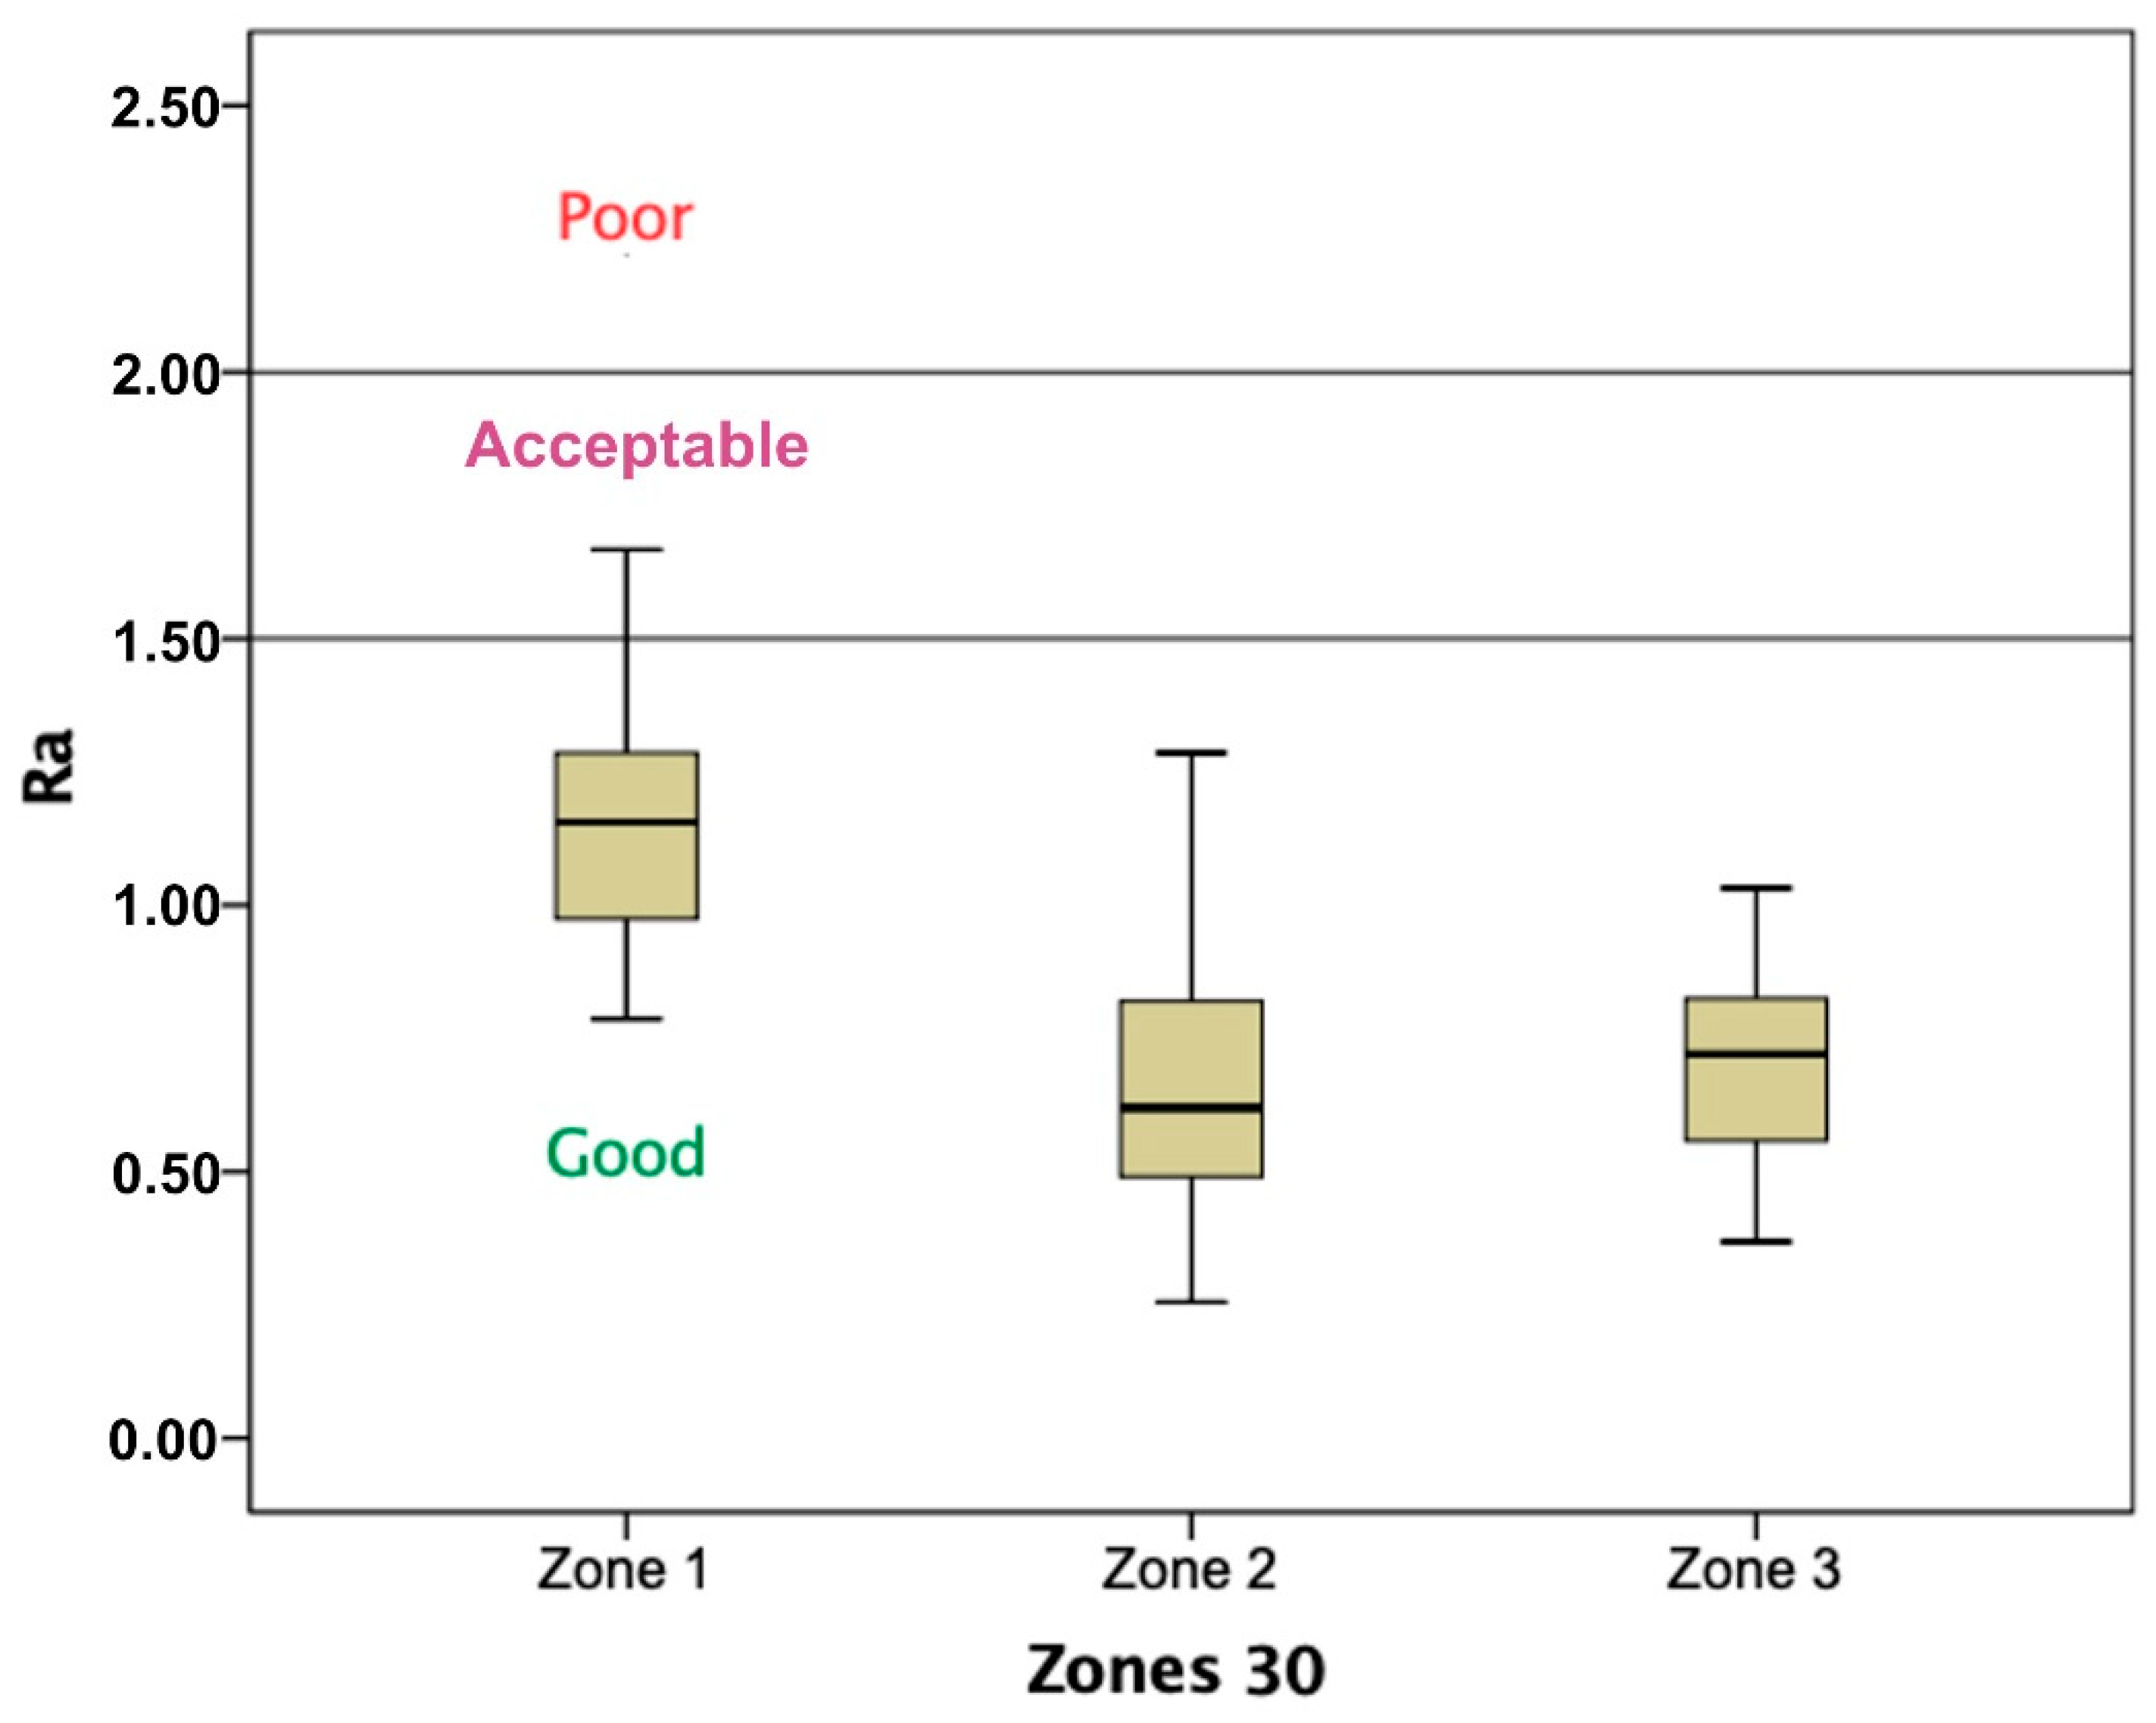
  • For all three Zones, there were no outliers for any test driver. This means that in no case do the traffic calming measures lead to very anomalous behavior in terms of uniformity of speed.
  • The medians for Zones 2 and 3 take similar values (0.62 and 0.72). Thus, in both Zones, users are induced to equalize their speed very close to the average value. It is also interesting to note that 50% of the Ra values are in an overall range between 0.48 and 0.83. This confirms the excellent response of the traffic calming measures in the two Zones to ensure a uniform speed. Instead, looking at the whiskers of the two boxplots, it can be seen that Zone 3 guarantees even more than Zone 2 a narrower dispersion of Ra values, actually containing all values between the minimum value of 0.36 and the maximum value of 1.03 (dispersion range 0.67). Zone 2, on the other hand, has a much wider dispersion of Ra values, equal to 1.03, although the end of the upper whisker, corresponding to Ra = 1.27, indicates in any case a “good” performance of the considered Zone.
  • Zone 1 influences user behavior, but to a lesser extent than the other two Zones. The median of Ra, which is 1.15, is below the threshold of 1.5 and, thus, representative of a “good” condition, but is significantly higher than the values for the other two Zones. Additionally, in this case, 50% of the Ra values (height of the box) are distributed in a range with reduced amplitude (equal to 0.37) between the extreme values of 0.93 and 1.3. However, the analysis of the whiskers of the boxplot shows how the fourth quartile of the distribution, bounded above by the value 1.66, indicates that the area in question induces a certain number of users to reach speeds well above the average value; in these cases, the Zone actually presents an “acceptable” operating condition, even if it is far from the one considered “poor”.
Thus, the analysis of the distribution of the parameter E a * using the boxplot technique allows us to confirm that Zone 1, consisting of a sequence of five speed tables (h = 8 cm), is best able to ensure compliance with the speed limit characteristic of the Zone 30 in which it is located. On the other hand, the analogous measure consisting of the sequence of speed tables in Zone 2 (h = 4 cm) results in a significant tendency of road users to drive at speeds above the 30 km/h limit, which is insufficient overall to fulfil the task of limiting speed within the prescribed limit. These results are in agreement with numerous previous studies that have shown that the effectiveness of traffic calming measures has a strong positive correlation with the height dimension of the vertical speed control device [43,44,45]. Zone 3, on the other hand, provides an overall “acceptable” performance and can be considered sufficiently suitable for the role of traffic calming aimed at limiting the driving speed below the legal limit of 30 km/h. This result is also consistent with the scientific literature. In fact, a review of numerous studies on chicanes concludes that chicanes can significantly reduce the vehicle speed and traffic accident rate [46].
Moreover, the analysis of the distribution of the parameter Ra using the boxplot technique allows us to confirm that Zone 3, characterized by the chicane and the central island, is the one that most affects the uniformity of the assumed speed of users who played the role of test driver. On the other hand, the succession of speed tables in Zone 1 leads to speed variations with respect to the average value, which, although a condition for the acceptance of the speed-calming measures offered, proves the inhomogeneous behavior of the users who carried out the test in this Zone. This result does not agree with the study of Agerholm et al. [47], which shows that chicanes lead to larger speed fluctuations before reaching the chicane compared to humps. However, it is necessary to point out the small number of studies analyzing the uniformity of the speed of TCMs.
The discussion up to this point has been based on a separate consideration of the two indicators, E a * and Ra. In order to derive a final judgment on the overall effectiveness of the three Zones studied, the following considerations were made, based on the simultaneous analysis of the two aforementioned indicators:
  • Zone 2, although not able to guarantee the basic requirement of a Zone 30, i.e., the respect of the speed limit, is characterized by the presence of TCMs suitable to influence the behavior of road users, who are induced to travel through the Zone without particular variations compared to the average speed, which is always below 40 km/h. This means that this design solution could be suitable to be installed in a context where it is necessary to respect a speed limit higher than 30 km/h (e.g., a 40 zone).
  • The TCMs in Zone 2 are of the same type (vertical misalignments) as in Zone 1 and differ in that the height of the speed boards is 4 cm in Zone 2 and 8 cm in Zone 1. This difference in height speaks in favor of the effectiveness of Zone 1, which is largely acceptable in terms of compliance with the speed limit and can also ensure good uniformity of speed.
  • Zone 3, similar to Zone 1, guarantees compliance with the 30 km/h speed limit, although at a lower level of acceptance. On the other hand, Zone 3 offers the best performance in terms of uniformity of speed (100% of Ra indicator values are well below the “Good” threshold).
Finally, it must be emphasized that no previous study has based the evaluation of the effectiveness of TCMs on the simultaneous analysis of the two indicators ( E a * and Ra). This is certainly the original aspect of the SPEIR methodology proposed in this study. The authors strongly believe that the effectiveness of TCMs is not exclusively related to the value of speed reduction they produce, but also to the uniformity of speed, a parameter strongly related to the safety conditions of the site where the TCMs are installed.

5. Conclusions

The installation of TCMs results in a fluctuating speed profile along the road, and under these conditions, the road sections may not be suitable to provide a consistent travel speed for users. In this study, the authors define an analysis procedure, called the SPEIR methodology, based on the use of two effectiveness indicators. The SPEIR methodology allows the analysis of the performance of traffic calming measures that can be used wherever traffic calming measures exist or are to be installed to ensure compliance with a speed limit in a more or less extended urban infrastructure context, such as a Zone 30. These performances can be evaluated both in terms of compliance with the prescribed speed limit and in terms of their effectiveness in ensuring a consistent speed profile without too much deviation from the average.
The authors believe, also because they are reassured by the results of applying the SPEIR methodology to three survey sites, that:
(1)
It is possible to compare different design solutions and better understand their effectiveness, also in terms of reproducibility within the same site or in terms of implementation in urban contexts that one wants to adapt, for example, by establishing a Zone 30;
(2)
If the proposed methodology is applied internationally to evaluate the effectiveness of TCMs in different urban contexts and the results are made publicly available, an important database could be created within a reasonable period of time. Thanks to this database, the values of E a * and Ra corresponding to the different design configurations would be clearly known. In this way, the values of the two effectiveness indicators would be available for the different types of traffic calming measures (e.g., chicanes, speed tables, speed bumps, chokers, etc.) and their installation criteria (e.g., distance between bumps, characteristic length of the chicane, extent of narrowing). These indicators could, thus, be used as reference parameters in new designs or in functional adaptation measures;
(3)
Achieving the objectives mentioned in the previous two points (comparison of different design solutions and creation of a reference database) can also be carried out using design scenarios created in simulated environments. The SPEIR methodology could be tested in virtual environments and, once validated, used to characterize different simulated configurations in which traffic calming measures are present through the proposed effectiveness indicators.
Systematic applications of the SPEIR methodology can greatly assist urban road managers in optimizing design decisions during the planning and design phases of Zones 30 or other urban contexts where extensive traffic slowing measures need to be implemented. They would also benefit from a tool that would certainly be useful under the sustainable mobility goal to identify corrective actions that need to be put into practice to improve the effectiveness of TCMs in the urban areas to be managed.
In this context, it is desirable that further case studies, similar to those presented here, are conducted by researchers and brought to the attention of managers and policy makers through the usual channels of cultural and scientific dissemination.

Author Contributions

Conceptualization, N.D. and S.L.; methodology, N.D.; software, N.D. and S.L.; validation, S.L.; formal analysis, N.D. and S.L.; investigation, N.D. and S.L.; resources, N.D. and S.L.; data curation, S.L.; writing—original draft preparation, N.D. and S.L.; writing—review and editing, N.D. and S.L.; visualization, N.D.; supervision, S.L. All authors have read and agreed to the published version of the manuscript.

Funding

This research received no external funding.

Institutional Review Board Statement

The study was conducted according to the guidelines of the Declaration of Helsinki, and the protocol was approved by the DISS-Center for Road Safety of the University of Parma (Deliberation of the Steering Committee—prot. 211112/2021 of 22 February 2021).

Informed Consent Statement

Informed consent was obtained from all subjects involved in the study. Written informed consent has been obtained from the patient(s) to publish this paper.

Data Availability Statement

The data presented in this study are available on request from the corresponding author. The data are not publicly available due to confidentiality issues.

Conflicts of Interest

The authors declare no conflict of interest.

References

  1. Balant, M.; Lep, M. Comprehensive Traffic Calming as a Key Element of Sustainable Urban Mobility Plans—Impacts of a Neighbourhood Redesign in Ljutomer. Sustainability 2020, 12, 8143. [Google Scholar] [CrossRef]
  2. Dickerson, A.; Peirson, J.; Vickerman, R. Road Accidents and Traffic Flows: An Econometric Investigation. Economica 2000, 67, 101–121. [Google Scholar] [CrossRef] [Green Version]
  3. Zang, K.; Batterman, S. Air pollution and health risks due to vehicle traffic. Sci. Total Environ. 2013, 15, 307–316. [Google Scholar] [CrossRef] [PubMed] [Green Version]
  4. Fuks, K.; Moebus, S.; Hertel, S.; Viehmann, A.; Nonnemacher, M.; Dragano, N.; Möhlenkamp, S.; Jakobs, H.; Kessler, C.; Erbel, R.; et al. Long-term urban particulate air pollution, traffic noise, and arterial blood pressure. Environ. Health Perspect. 2011, 119, 1706–1711. [Google Scholar] [CrossRef] [Green Version]
  5. Albalate, D.; Fageda, X. Congestion, Road Safety, and the Effectiveness of Public Policies in Urban Areas. Sustainability 2019, 11, 5092. [Google Scholar] [CrossRef] [Green Version]
  6. Granà, A.; Giuffrè, T.; Guerrieri, M. Exploring Effects of Area-Wide Traffic Calming Measures on Urban Road Sustainable Safety. J. Sustain. Dev. 2010, 3, 38–49. [Google Scholar] [CrossRef] [Green Version]
  7. Useche, S.A.; Alonso, F.; Montoro, L. Validation of the walking behavior questionnaire (WBQ): A tool for measuring risky and safe walking under a behavioral perspective. J. Transp. Health 2020, 18, 100899. [Google Scholar] [CrossRef]
  8. Pulvirenti, G.; Distefano, N.; Leonardi, S. Elderly perception of critical issues of pedestrian paths. Civ. Eng. Archit. 2020, 8, 26–37. [Google Scholar] [CrossRef]
  9. Distefano, N.; Pulvirenti, G.; Leonardi, S. Neighbourhood walkability: Elderly’s priorities. Res. Transp. Bus. 2021, 40, 100547. [Google Scholar] [CrossRef]
  10. Gálvez-Pérez, D.; Guirao, B.; Ortuño, A. Road Safety of Elderly Pedestrians in the Urban Context: An Approach Based on Infrastructure and Socioeconomic Variables. Transp. Res. Procedia 2021, 58, 254–261. [Google Scholar] [CrossRef]
  11. Leonardi, S.; Distefano, N.; Pulvirenti, G. Identification of road safety measures for elderly pedestrians based on k-means clustering and hierarchical cluster analysis. Arch. Transp. 2020, 56, 107–118. [Google Scholar] [CrossRef]
  12. WHO—World Health Organization. Global Status Report on Road Safety; World Health Organization: Geneva, Switzerland, 2018. [Google Scholar]
  13. European Commission. Facts and figures—Pedestrians. In European Road Safety Observatory; Directorate General for Transport; European Commission: Brussels, Belgium, 2021. [Google Scholar]
  14. ACI-ISTAT. Incidenti stradali in Italia (English translation: Road accidents in Italy). In Report of ACI-ISTAT—Anno 2019; ACI-ISTAT: Rome, Italy, 2020. [Google Scholar]
  15. ACI-ISTAT. Incidenti stradali in Italia (English translation: Road accidents in Italy). In Report of ACI-ISTAT—Anno 2020; ACI-ISTAT: Rome, Italy, 2021. [Google Scholar]
  16. Distefano, N.; Leonardi, S.; Consoli, F. Drivers’ Preferences for Road Roundabouts: A Study based on Stated Preference Survey in Italy. KSCE J. Civ. Eng. 2019, 23, 4864–4874. [Google Scholar] [CrossRef]
  17. Ciampa, D.; Diomedi, M.; Giglio, F.; Olita, S.; Petruccelli, U.; Restaino, C. Effectiveness of unconventional roundabouts in the design of suburban intersections. Eur. Transp. Eur. 2020, 80, 1–16. [Google Scholar] [CrossRef]
  18. Gonzalo-Orden, H.; Pérez-Acebo, H.; Linares Unamunzaga, A.; Rojo Arce, M. Effects of traffic calming measures in different urban areas. Transp. Res. Procedia 2018, 33, 83–90. [Google Scholar] [CrossRef]
  19. Sharpin, A.B.; Adriazola-Steil, C.; Job, S.; Obelheiro, M.; Welle, B.; Imamoglu, C.T.; Bhatt, A.; Liu, D.; Lleras, N.; Luke, N. Low-Speed Zone Guide. 2021. Available online: https://files.wri.org/d8/s3fs-public/2021-05/WRI_LowSpeedZone_web.pdf?VersionId=mMwA8aq.BSpHZ6w97Z4E2NSd5o1UPN7B (accessed on 17 January 2022). [CrossRef]
  20. Kempa, J. Respecting a speed limit and its effectiveness in a traffic calming zone. IOP Conf. Ser. Mater. Sci. Eng. 2019, 603, 042068. [Google Scholar] [CrossRef]
  21. Distefano, N.; Leonardi, S. Evaluation of the Benefits of Traffic Calming on Vehicle Speed Reduction. Civ. Eng. Arch. 2019, 7, 200–214. [Google Scholar] [CrossRef]
  22. Vaitkus, A.; Čygas, D.; Jasiuniene, V.; Jateikiene, L.; Andriejauskas, T.; Skrodenis, D.; Ratkeviciute, K. Traffic Calming Measures: An Evaluation of the Effect on Driving Speed. Promet-Traffic Transp. 2017, 29, 275–285. [Google Scholar] [CrossRef]
  23. Daniel, B.D.; Nicholson, A.; Koorey, G. Analysing speed profiles for the estimation of speed on traffic-calmed streets. Transp. Res. Rec. 2011, 20, 57–70. [Google Scholar]
  24. Pérez-Acebo, H.; Ziółkowski, R.; Linares-Unamunzaga, A.; Gonzalo-Orden, H. A Series of Vertical Deflections, a Promising Traffic Calming Measure: Analysis and Recommendations for Spacing. Appl. Sci. 2020, 10, 3368. [Google Scholar] [CrossRef]
  25. Gayathri, K.B. Evaluation of the Effectiveness of Traffic calming measures. In Proceedings of the International Conference on Systems, Energy & Environment (ICSEE), Singapore, 3–5 February 2021. [Google Scholar] [CrossRef]
  26. Ziółkowski, R. Speed Management Efficacy on National Roads—Early Experiences of Sectional Speed System Functioning in Podlaskie Voivodship. Transp. Probl. 2018, 18, 5–12. [Google Scholar] [CrossRef] [Green Version]
  27. Zito, R.; Taylor, M.A.P. Speed profiles and vehicle fuel consumption at LATM devices. In Proceedings of the 18th ARRB Conference, Christchurch, New Zealand, 2–6 September 1996; Volume 18, pp. 391–406. [Google Scholar]
  28. Jurewicz, C.; Sobhani, A.; Woolley, J.; Dutschke, J.; Corben, B. Exploration of vehicle impact speed-injury severity relationships for application in safer road design. Transp. Res. Procedia 2016, 14, 4247–4256. [Google Scholar] [CrossRef] [Green Version]
  29. Wann, J.P.; Poulter, D.R.; Purcell, C. Reduced sensitivity to visual looming inflates the risk posed by speeding vehicles when children try to cross the road. Psychol. Sci. 2011, 22, 429–434. [Google Scholar] [CrossRef] [PubMed] [Green Version]
  30. Lobjois, R.; Cavallo, V. Age-related differences in street-crossing decisions: The effects of vehicle speed and time constraints on gap selection in an estimation task. Accid. Anal. Prev. 2007, 39, 934–943. [Google Scholar] [CrossRef] [PubMed]
  31. Webb, E.A.; Bell, S.; Lacey, R.E.; Abell, J.G. Crossing the road in time: Inequalities in older people’s walking speeds. J. Transp. Health 2017, 5, 77–83. [Google Scholar] [CrossRef]
  32. 20’s Plenty for Us. 20mph Limits Save Time and Improve Traffic Flow. 2012. Available online: http://www.20splentyforus.org.uk/BriefingSheets/20mph_Improves_Traffic_Flow.pdf (accessed on 10 January 2022).
  33. 20’s Plenty for Us. 20mph Limits Improve Air Quality Where People Live. 2010. Available online: http://www.20splentyforus.org.uk/BriefingSheets/pollutionbriefing.pdf (accessed on 10 January 2022).
  34. Jones, S.J.; Brunt, H. Twenty miles per hour speed limits: A sustainable solution to public health problems in Wales. J. Epidemiol. Community Health 2017, 71, 699–706. [Google Scholar] [CrossRef]
  35. Brindle, R.E. Speed-Based Design of Traffic Calming Schemes. In Institute of Transportation Engineers (ITE) Annual Meeting 2005; ITE: Melbourne, Australia, 2005. [Google Scholar]
  36. Berloco, N.; Colonna, P.; Intini, P.; Masi, G.; Ranieri, V. Low-cost smartphone-based speed surveying methods in proximity to traffic calming devices. Procedia Comput. Sci. 2018, 134, 415–420. [Google Scholar] [CrossRef]
  37. Kyriakoua, C.; Christodouloua, S.E.; Dimitrioua, L. Do Vehicles Sense, Detect and Locate Speed Bumps? Transp. Res. Procedia 2020, 52, 203–210. [Google Scholar] [CrossRef]
  38. Dong, D.; Li, Z. Smartphone Sensing of Road Surface Condition and Defect Detection. Sensors 2021, 21, 5433. [Google Scholar] [CrossRef]
  39. Tu, W.; Xiao, F.; Li, L.; Fu, L. Estimating traffic flow states with smart phone sensor data. Transp. Res. Part C 2021, 126, 103062. [Google Scholar] [CrossRef]
  40. Polus, A.; Mattar-Habib, C. New Consistency Model for Rural Highways and Its Relationship to Safety. J. Transp. Eng. 2004, 130, 286–293. [Google Scholar] [CrossRef]
  41. Moreno, A.T.; García, A. Use of speed profile as surrogate measure: Effect of traffic calming devices on crosstown road safety performance. Accid. Anal. Prev. 2013, 61, 23–32. [Google Scholar] [CrossRef] [PubMed]
  42. Domenichini, L.; Branzi, V.; Meocci, M. Virtual testing of speed reduction schemes on urban collector roads. Accid. Anal. Prev. 2018, 110, 38–51. [Google Scholar] [CrossRef] [PubMed]
  43. Dinasty Purnomo, A.; Dewi, H.; Syafi, I. Correlation analysis between speed bump dimensions and motorcycle speed in residential areas. MATEC Web Conf. 2018, 195, 04013. [Google Scholar] [CrossRef]
  44. Antic, B.; Pesic, D.; Vujanic, M.; Lipovac, K. The influence of speed bumps heights to the decrease of the vehicle speed-Belgrade Experience. Saf. Sci. 2013, 57, 303–313. [Google Scholar] [CrossRef]
  45. Bachok, K.S.; Mohamed, M.Z.; Ibrahim, M.; Hamsa, A.A.K. A theoretical overview of road hump effects on traffic speed in residential environments. Plan. Malays. J. 2016, 14, 343–352. [Google Scholar] [CrossRef]
  46. Zhang, C.; Qin, S.; Yu, H.; Zheng, B.; Li, Z. A Review on Chicane Design based on Calming Theory. J. Eng. Sci. Technol. Rev. 2020, 13, 188–197. [Google Scholar] [CrossRef]
  47. Agerholm, N.; Knudsen, D.; Variyeswaran, K. Speed-calming measures and their effect on driving speed—Test of a new technique measuring speeds based on GNSS data. Transp. Res. F Traffic Psychol. Behav. 2017, 46, 263–270. [Google Scholar] [CrossRef]
Figure 1. Framework of SPEIR methodology.
Sustainability 14 07325 g001
Figure 3. Schemes of traffic calming measures in the studied sites: (a) Zone 1; (b) Zone 2; (c) Zone 3.
Sustainability 14 07325 g003
Figure 7. E a * boxplots for the three Zones 30 analyzed.
Sustainability 14 07325 g007
Figure 8. Ra boxplots for the three Zones 30 analyzed.
Sustainability 14 07325 g008
Table 1. Thresholds for effectiveness indicators [40,41].
Effectiveness IndicatorsGoodAcceptablePoor
Accumulated speeding E a * (m/s) E a * ≤ 0.70.7 < E a * < 1.0 E a * ≥ 1.0
Accumulated speed uniformity Ra (m/s)Ra ≤ 1.01.0 < Ra < 2.0Ra ≥ 2.0
Table 2. Summary of the values of the effectiveness indicators for the investigated sites.
SiteSpeed Limit [km/h]Length [m]N. of Speed ProfilesSave [km/h]Ra(min) [m/s]Ra(max) [m/s]Ra(85) [m/s] E a min * [m/s] E a max * [m/s] E a 85 * [m/s]
ZONE 1304472030.000.781.661.320.511.040.91
ZONE 2301962034.890.251.280.880.661.611.39
ZONE 3302802032.840.361.030.870.551.411.06
Table 3. Statistical parameters related to the distribution of E a * values.
E a * Distribution (ZONE 1)StatisticStd. Error
Mean0.7699900.0312493
Median0.749350
Variance0.020
Std. Deviation0.1397513
Minimum0.5154
Maximum1.0438
Range0.5284
E a * Distribution (ZONE 2)StatisticStd. Error
Mean1.1385060.0547420
Median1.113268
Variance0.060
Std. Deviation0.2448137
Minimum0.6640
Maximum1.6167
Range0.9527
E a * Distribution (ZONE 3)StatisticStd. Error
Mean0.8943780.0483706
Median0.923961
Variance0.047
Std. Deviation0.2163197
Minimum0.5567
Maximum1.4184
Range0.8617
Table 4. Statistical parameters related to the distribution of Ra values.
Ra Distribution (ZONE 1)StatisticStd. Error
Mean1.1290560.0527978
Median1.155217
Variance0.056
Std. Deviation0.2361188
Minimum0.7866
Maximum1.6668
Range0.8801
Ra Distribution (ZONE 2)StatisticStd. Error
Mean0.6566150.0607425
Median0.620068
Variance0.074
Std. Deviation0.2716487
Minimum0.2557
Maximum1.2856
Range1.0300
Ra Distribution (ZONE 3)StatisticStd. Error
Mean0.6920280.0414654
Median0.720154
Variance0.034
Std. Deviation0.1854391
Minimum0.3681
Maximum1.0318
Range0.6637
Publisher’s Note: MDPI stays neutral with regard to jurisdictional claims in published maps and institutional affiliations.

