Article

Characterizing the Spatiotemporal Patterns and Key Determinants of Homestay Industry Agglomeration in Rural China Using Multi Geospatial Datasets

Business College, Zhejiang University City College, Hangzhou 310015, China
*
Author to whom correspondence should be addressed.
Sustainability 2022, 14(12), 7242; https://doi.org/10.3390/su14127242
Submission received: 9 May 2022 / Revised: 6 June 2022 / Accepted: 11 June 2022 / Published: 13 June 2022
(This article belongs to the Topic Sustainability in Hospitality and Tourism Management)

Abstract

:
Understanding the spatiotemporal patterns and key determinants of rural homestay industry agglomeration is crucial for the well-planning and well-management of rural tourism during the process of rural revitalization in China. By employing multi geospatial datasets, this study investigated the long-term spatiotemporal patterns and their key determinants of homestay inns during the period 2004–2019 in Moganshan, a well-known rural tourism destination in Zhejiang Province, China. The kernel density estimation and spatial autocorrelation were integrated to identify the hotspots of rural homestay inns at a fine scale. The key determinants were further uncovered using multiple stepwise regression and logistic regression models. The result shows that the overall growth of homestay inns was slow at the early stage and has progressed rapidly since 2014, with 94.2% of homestay inns newly opened during the period 2014–2019. The first hotspot was located in Moganshan National Park and then spread to the surrounding villages. Three hotspot zones have emerged, including the northern hotspot zone (Sihe-Xiantan), central hotspot zone (Houwu-Park-Liaoyuan), and southern hotspot zone (Ziling-Laoling-Lanshukeng) by 2019. The modeling indicates that government policy was an essential determinant for the increase in homestay inns, followed by entrepreneurship and investment. The new homestay inns were more likely to occur in settlements close to scenic spots, river networks, and cultivated land. Abundant scenic spots and heterogeneous landscapes were also preferred when selecting sites and executing landscape design for homestay inns. Our empirical study has provided practical insights for policy makers, entrepreneurs, and planners for future sustainable homestay industry development.

1. Introduction

Since the reform and opening-up in 1978, China has experienced unprecedented urbanization, coupled with economic prosperity and a dramatic shift of population from rural to urban areas. In parallel to these processes, the rural decline has emerged with outward migration of young adults, shrinkage of rural communities and economies, as well as a drastic drop in rural life quality, restricting the sustainable development of rural areas [1]. Because of the urban bias that has for many decades characterized policy trajectories, rural areas severely lag behind cities in terms of income, infrastructure, social security, and services such as medical care and education.
In recent years, China initiated the strategy of rural revitalization, which has addressed the contradiction between unbalanced and inadequate development and people’s ever-growing needs for a better life [2,3]. As an effective approach to rural revitalization, developing rural tourism can contribute to the increase in farmers’ employment and income, and the appreciation of rural ecological capital, thereby accelerating the modernization of agriculture and rural areas [4,5]. With the continuous upgrading of the tourism industry, the rural homestay industry has set off a new tourism trend in China. It has been reported that there were nearly 170,000 homestay inns in 2019, and the online homestay market reached 20 billion yuan that year [6]. Meanwhile, the homestay inn specifically has become a typical and main component of rural tourism [7,8]. The criteria of basic requirements and evaluation of homestay inns (2019) define such establishments as a type of small accommodation in which visitors stay in the vacant houses of local residents [9]. Such inns are part of ecotourism and community-based tourism that give visitors experiences of local nature, culture, and lifestyles in the countryside [10]. Developing rural homestay inns has various advantages, such as revitalizing the idle rural resources, enhancing the vitality of rural communities, optimizing the rural economic structure, and alleviating poverty [11,12].
Despite the great economic benefits and cultural value brought by the homestay industry, due to inadequate supervision, the rapid expansion of homestay inns has discharged waste and caused progressive changes in rural landscape patterns, which can result in serious ecosystem service losses and affect species survival [13,14]. To optimize tourism resources and push forward the high-quality and sustainable development of the homestay industry in rural areas, it is vital first to understand the spatiotemporal dynamics of rural homestay inns and their underlying mechanism.
Prior studies have analyzed the spatial patterns of homestay inns based on official government statistics or sample surveys [15,16]. Although these traditional data sources could offer a relatively accurate profile of tourism resources, their deficiencies, such as long cycles, low efficiency, high costs, or limited survey samples, restrict their further application in tourism planning. In recent years, with the advanced development of internet information technology, extensive and diverse social sensing data such as check-in data and geotagged photos acquired from social networks (Weibo, Dianpin, Flickr, etc.) and hotel and homestay inn data from online travel agencies (Airbnb, Ctrip, etc.) have become freely accessible to researchers, enabling them to comprehensively investigate social and economic phenomena [17,18,19]. The superiority of these datasets in terms of their real-time capability, lower costs, and wider coverage than previous platforms have provided new opportunities for quantifying the spatiotemporal patterns of tourism resources at a fine scale [20]. Numerous studies have attempted to characterize the spatial patterns of homestay inns using social sensing data and offered references for sustainable rural tourism development [21,22,23,24]. Multiple methods have also been applied to quantify the spatial patterns of homestay inns, mainly including traditional index methods such as the spatial nearest neighbor index and spatial coefficient of variation, and GIS spatial analysis methods, such as kernel density estimation, DBSCAN algorithm, spatial autocorrelation, and geographically weighted regression [2,25,26]. Nevertheless, these spatiotemporal analyses of homestay inns mainly focus on quantity dynamics, density changes, and significant cluster mapping at the city or district level, and there is a lack of adequate attention to the identification of homestay inn hotspots at a fine scale.
Rural homestay inn growth and expansion, as a typical process of the socioeconomic phenomena, is involved in complicated natural, socioeconomic, and political environments [27]. A comprehensive investigation of their quantity growth and spatial expansion mechanism can help provide scientific references for the further planning and management of the rural homestay industry. Previous studies have indicated that the internal mechanism can be manifested as a multidimensional profile of principle determinants, including biophysical, accessibility, socioeconomic, and political determinants. Several studies have found that the expansion of rural homestay inns is related to favorable geographical location [15,28]. Some studies have proved that Airbnb accommodations are linked to sightseeing spots and land use associated with the leisure, hospitality, and entertainment industries [29]. Other researchers have attempted to unveil the effects of socioeconomic factors on the distribution of Airbnb or homestay inns. Likewise, it was found that Airbnb rentals were more likely to be located in neighborhoods with good transit services, short distances to the city center, and high median house value and household income [18]. Meanwhile, as early-stage tourism destinations often need external capital to establish, invest, and participate in tourism businesses at various levels [30], some studies have confirmed that the role of the private sector is increasingly significant, and entrepreneurship has become a driving force [31,32]. Moreover, it has been proven that governments retain an active role in rural tourism development through legislation and regulation, coordination and planning, infrastructural investments, top-down rural programs, and other rural governance apparatuses [33,34,35]. In addition, at the geographic scale, the potential determinants of homestay inn development can be loosely grouped by the macro (interregional) and micro (intraregional) geographic environments [36]. Macroenvironmental determinants create general conditions for business operations, shape the attractiveness of tourism destinations over time, and determine opportunities for development functions within a given area [37]. These determinants mainly include socioeconomic status, infrastructure, government policy, and regulations, which remain effectively invariant for a particular region in a given time. Microenvironmental determinants vary within a local region, which can exert spatially heterogeneous effects on the homestay industry. These determinants include accessibility to scenic spots and main transportation portals (e.g., railway stations and airports), land use and rental costs, and urban development [36]. In this regard, both macroenvironmental and microenvironmental determinants should be further considered for exploring the internal mechanism of homestay inn development, but so far, the two-dimensional determinants have barely been examined together in other studies. Additionally, because of the limited datasets and effective indicators for determinants such as government policy, most studies have been restricted to qualitative analyses of political effects on rural homestay inns. Therefore, a comprehensive spatial quantitative methodology is urgently needed to unveil the internal mechanism of the growth and expansion of rural homestay inns.
To fill this research gap, this paper aims to characterize the spatiotemporal pattern of homestay inns in rural China and investigate the underlying mechanism of the growth and expansion of the homestay industry. A well-known rural tourism destination, Moganshan Town, is chosen as the study area. Our specific goals are to (1) map the spatial changes in rural settlements in the Moganshan region from 2004 to 2019 by employing high-resolution remote sensing images; (2) quantify the spatiotemporal patterns of rural homestay inns from 2004 to 2019 using freely accessed open social data and multiple spatial analytical techniques, including (i) quantity growth analysis and (ii) fine-scale hotspot detection; and (3) introduce a comprehensive framework to identify the key determinants of the rural homestay industry development (i.e., quantity growth and spatial expansion) based on multiple stepwise regression and logistic regression models. These results will provide valuable information and scientific references for the sustainable development of rural homestay inns, thereby helping to promote the income and living standards of villagers during the process of rural revitalization.

2. Materials and Methods
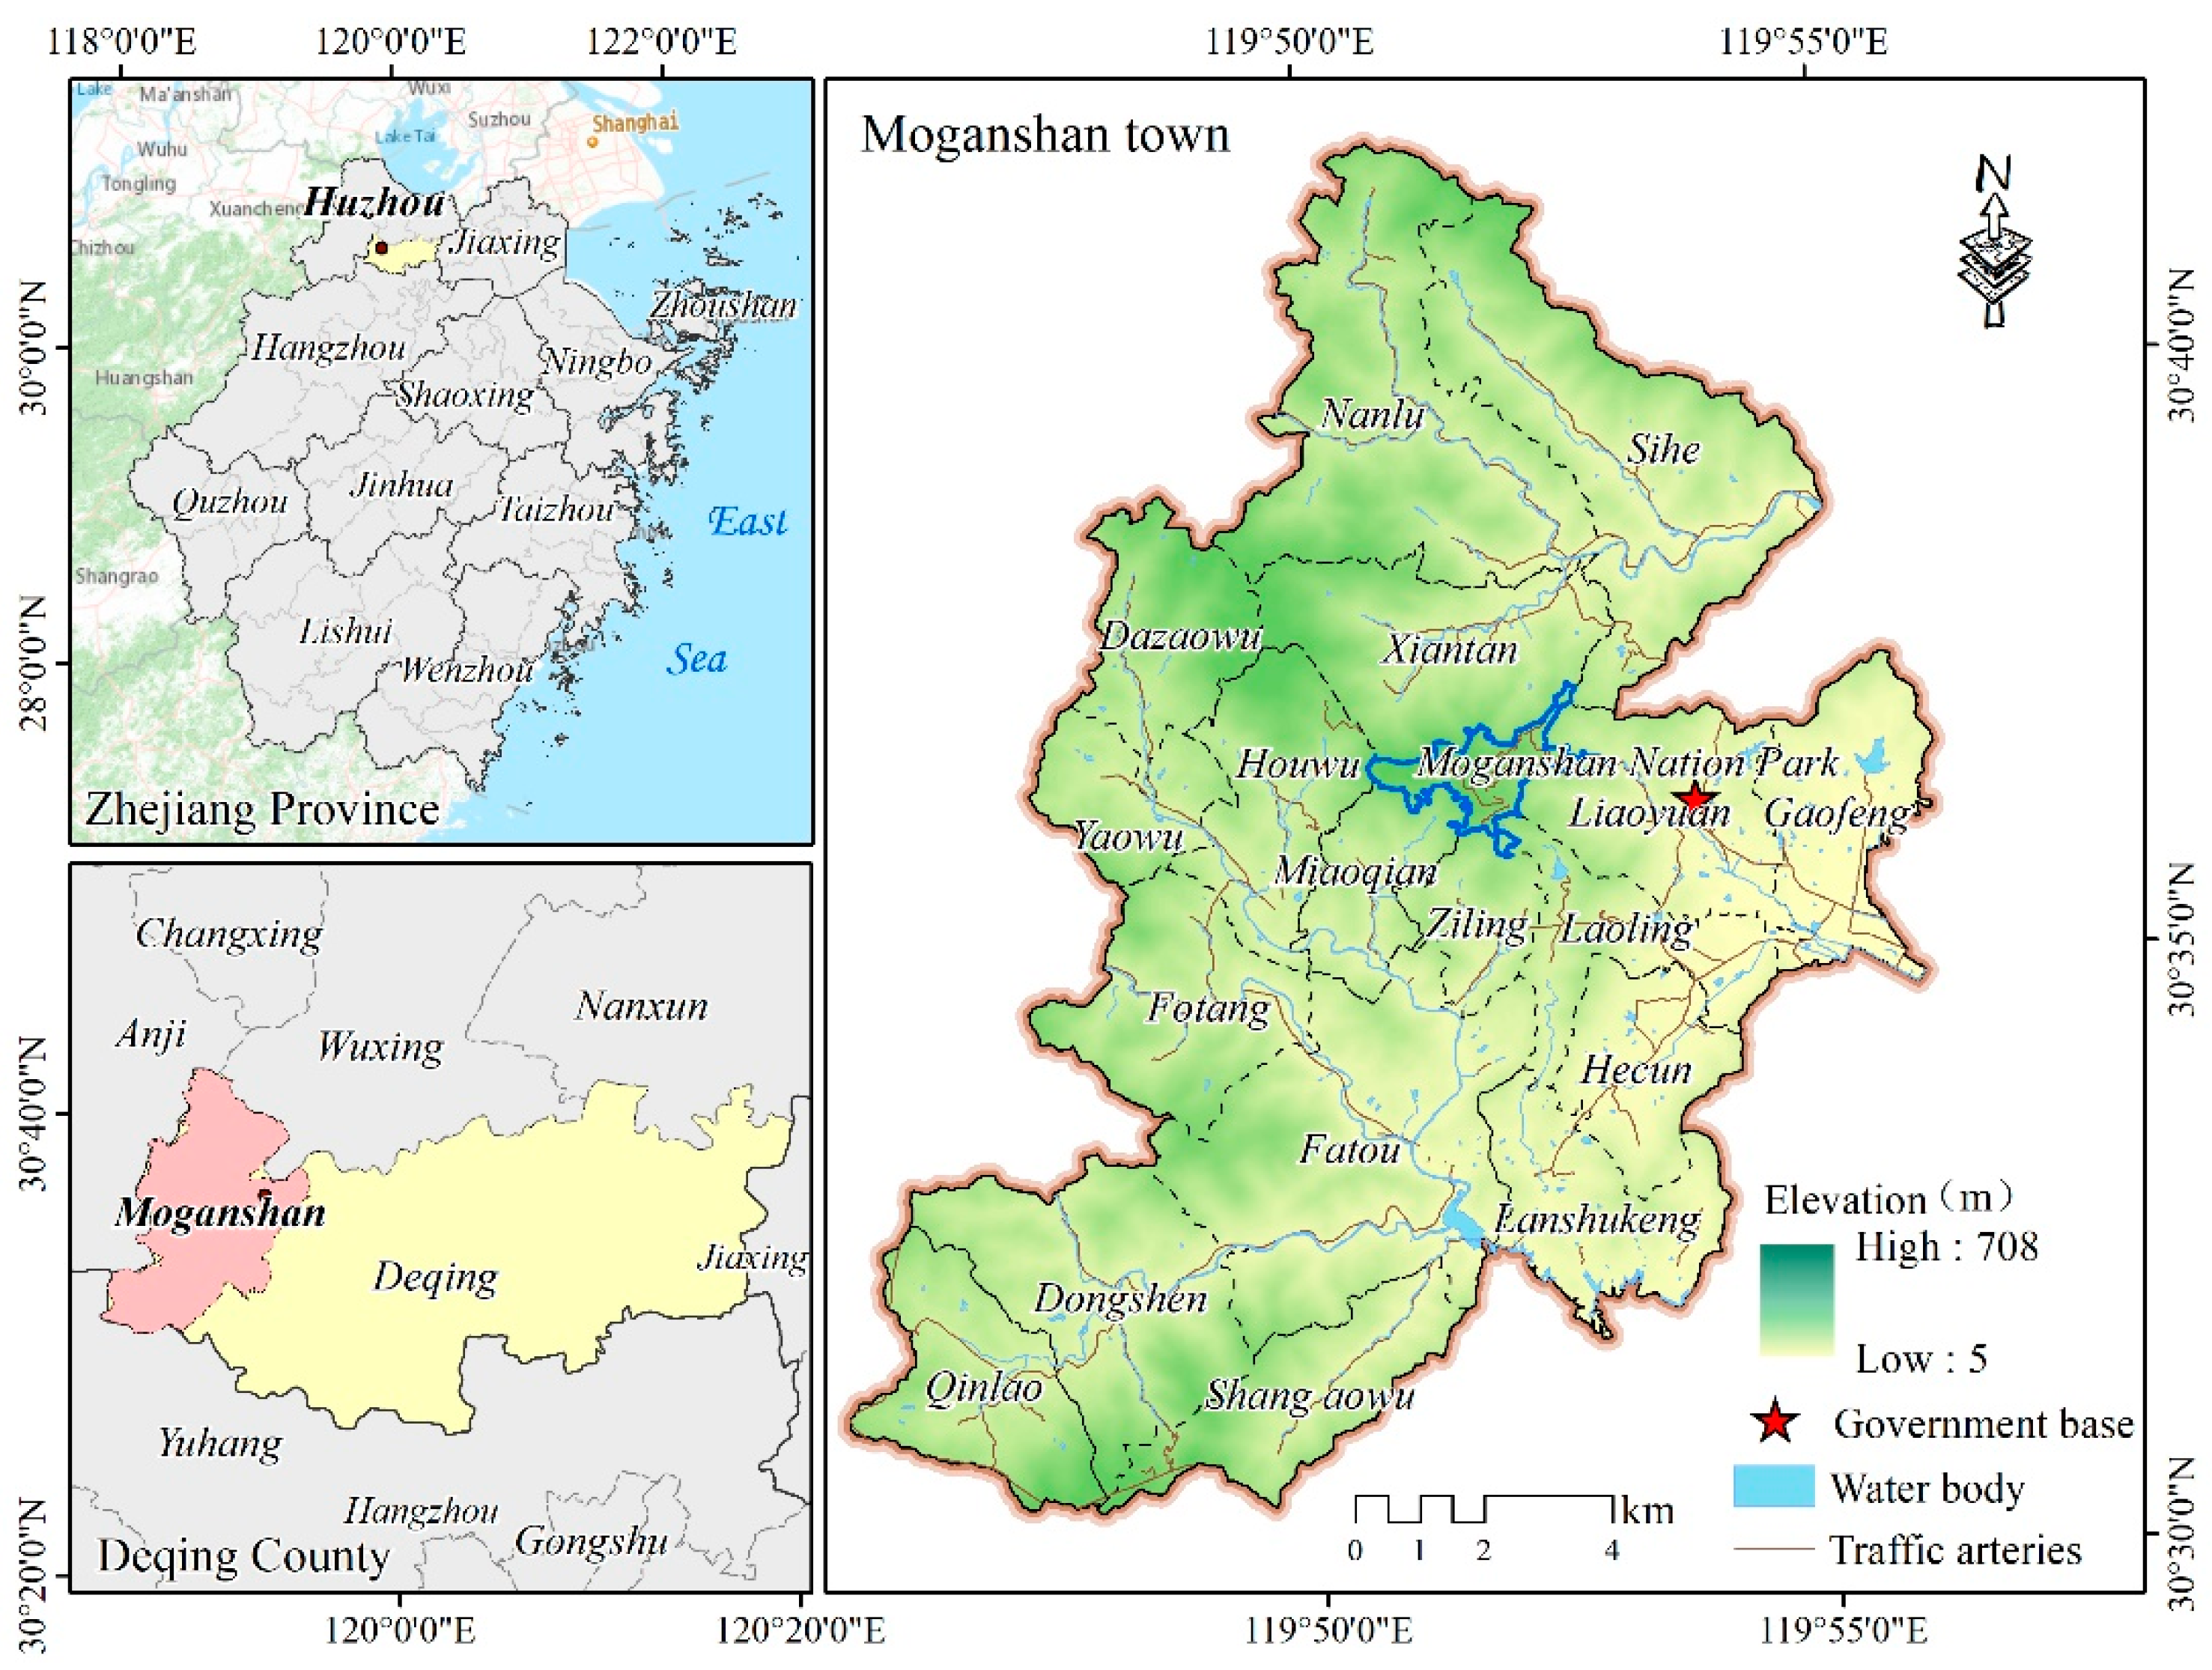
2.1. Study Area

Moganshan Town, located in Deqing County, Zhejiang Province (119°44′35″ E~119°57′11″ E, 30°30′7″ N~30°42′22″ N), is a booming new rural tourism destination in China (Figure 1). It is reported that 2.6 million tourists spent leisure time in Moganshan Town in 2018. It has a total area of 185.85 km2, and 93.5% of the town is covered by forest. Moganshan National Park, the center of Moganshan Town, is one of the four largest summer resorts in China. It is well-known for its unique juxtaposition of bamboo, cloud sea, and clear springs, as well as its clean, quiet, green, and cool environment.
As early as the 1980s, with the approval of the State Council to open Moganshan publicly, its tourist reception service gradually resumed. In 1994, Moganshan scenic spot was chosen and listed as National Park. During this period, sightseeing became the main tourist activity, and tourists’ motivation was mostly to visit the villas and heritage resources that were presented within Moganshan National Park.
With the increasing number of tourists in Moganshan National Park, rural tourism in the community began to develop in the 2000s. The form of early homestays was Nongjiale (Happy Farmer’s Home), which was mainly operated by residents in the villages to provide short-distance consumption experiences of “setting out in the morning, eating at noon and leaving at night” [38]. In 2007, Tiancheng Gao from South Africa started “Naked Stables”, which was a new style of homestay known as Yangjiale (Happy Foreigner’s Home) [39]. Since then, an increasing number of Yangjiale has been successively invested in and operated by both international capital and local members. Thus, Yangjiale is regarded as the starting point of a new rural tourism format in Moganshan, and the Chinese government endued Yangjiale with the official name “Minsu” (homestay inn). By 2019, approximately 900 homestay inns had been established, making Moganshan a famous rural tourism destination in China.

2.2. Data Source

This research involves multisource datasets, including remote sensing data, survey data, open social data, and statistical data. To map rural settlement changes, we applied high-resolution remote sensing images, including aerial photographs in 2004 and GF-2 images in 2019, with spatial resolutions of 2 m and 1 m, respectively.
Ctrip (www.ctrip.com, accessed on 31 December 2019) is a popular online platform that provides online search, query, and transaction services for diverse holiday rental products such as apartments, villas, and homestay inns worldwide. Because of its comprehensive collection of homestay inns, this paper selected Ctrip to obtain information on Moganshan homestay inns. First, we crawled information about the Moganshan homestay inns based on Python 3.8.0 from the API of the Ctrip website. The information mainly included name, geographic coordinates, opening year, price, and the number of people suitable for biding. The research covered the period up to 31 December 2019. Second, we deleted duplicates and entries with serious missing information and ultimately obtained 916 rural homestay inns to further characterize the spatiotemporal pattern of Moganshan homestay inns.
Through interviews and communication with specialists who are experts in the homestay industry from the Deqing Tourism Bureau, Moganshan Town Government, homestay association, and professional homestay hosts, and based on the housing price per night, we further divided the Moganshan homestay inns into ordinary homestay inns (RMB 0–400), boutique homestay inns (RMB 401–1100), and superior homestay inns (>RMB 1100), numbering 338, 452, and 126, respectively.
To evaluate the key determinants of the rapid growth of rural homestay inns from 2004 to 2019, the number of rural tourism policies issued by the government each year was obtained from the study by [40]. The data for the investment and funds from private and individual economies (Zhejiang Province) from 2004 to 2019 were gathered from the Zhejiang Statistical Yearbook. To fully comprehend the overall condition of markets and transportation in the case study area and its surrounding areas, the datasets for per capita consumption expenditure of urban residents and the area of urban roads in Zhejiang, Shanghai, Jiangsu, and Anhui from 2004 to 2019 were collected from the Statistical Yearbooks of Zhejiang, Shanghai, Jiangsu, and Anhui.
To identify the key determinants of the spatial expansion of rural homestay inns from 2004 to 2019, multiple spatial datasets were also obtained. The DEM downloaded from the Geospatial Data Cloud (www.gscloud.cn, accessed on 31 December 2019) was used to calculate the elevation and slope of Moganshan. Land use survey data from the Natural Resources and Planning Bureau of Huzhou City were used to obtain various land use types such as cultivated land, forest, orchard land, water body, etc. To show the richness of scenery and landscape resources, points of interest (POIs) of Moganshan Town in 2019 were gathered from Gaode API (lbs.amap.com, accessed on 31 December 2019).
In addition, various news items, local historical narratives, books, and other secondary materials related to Moganshan Town were also collected.

2.3. Methods

In this study, our goals were to quantify the spatial patterns of rural settlements and homestay inns and investigate the key determinants of the blooming process of these homestay inns. The research framework mainly consisted of three stages, as shown in Figure 2: (1) map the spatial changes in rural settlements in the Moganshan Town from 2004 to 2019 by employing high-resolution remote sensing images; (2) characterize the spatiotemporal patterns of rural homestay inns from 2004 to 2019 using freely accessed open social data, and multiple spatial analytical techniques, including (i) quantity growth analysis and (ii) fine-scale hotspot detection; (3) identify the key determinants of the rapid quantity growth and spatial expansion of the rural homestay inns based on stepwise regression and logistical regression model.

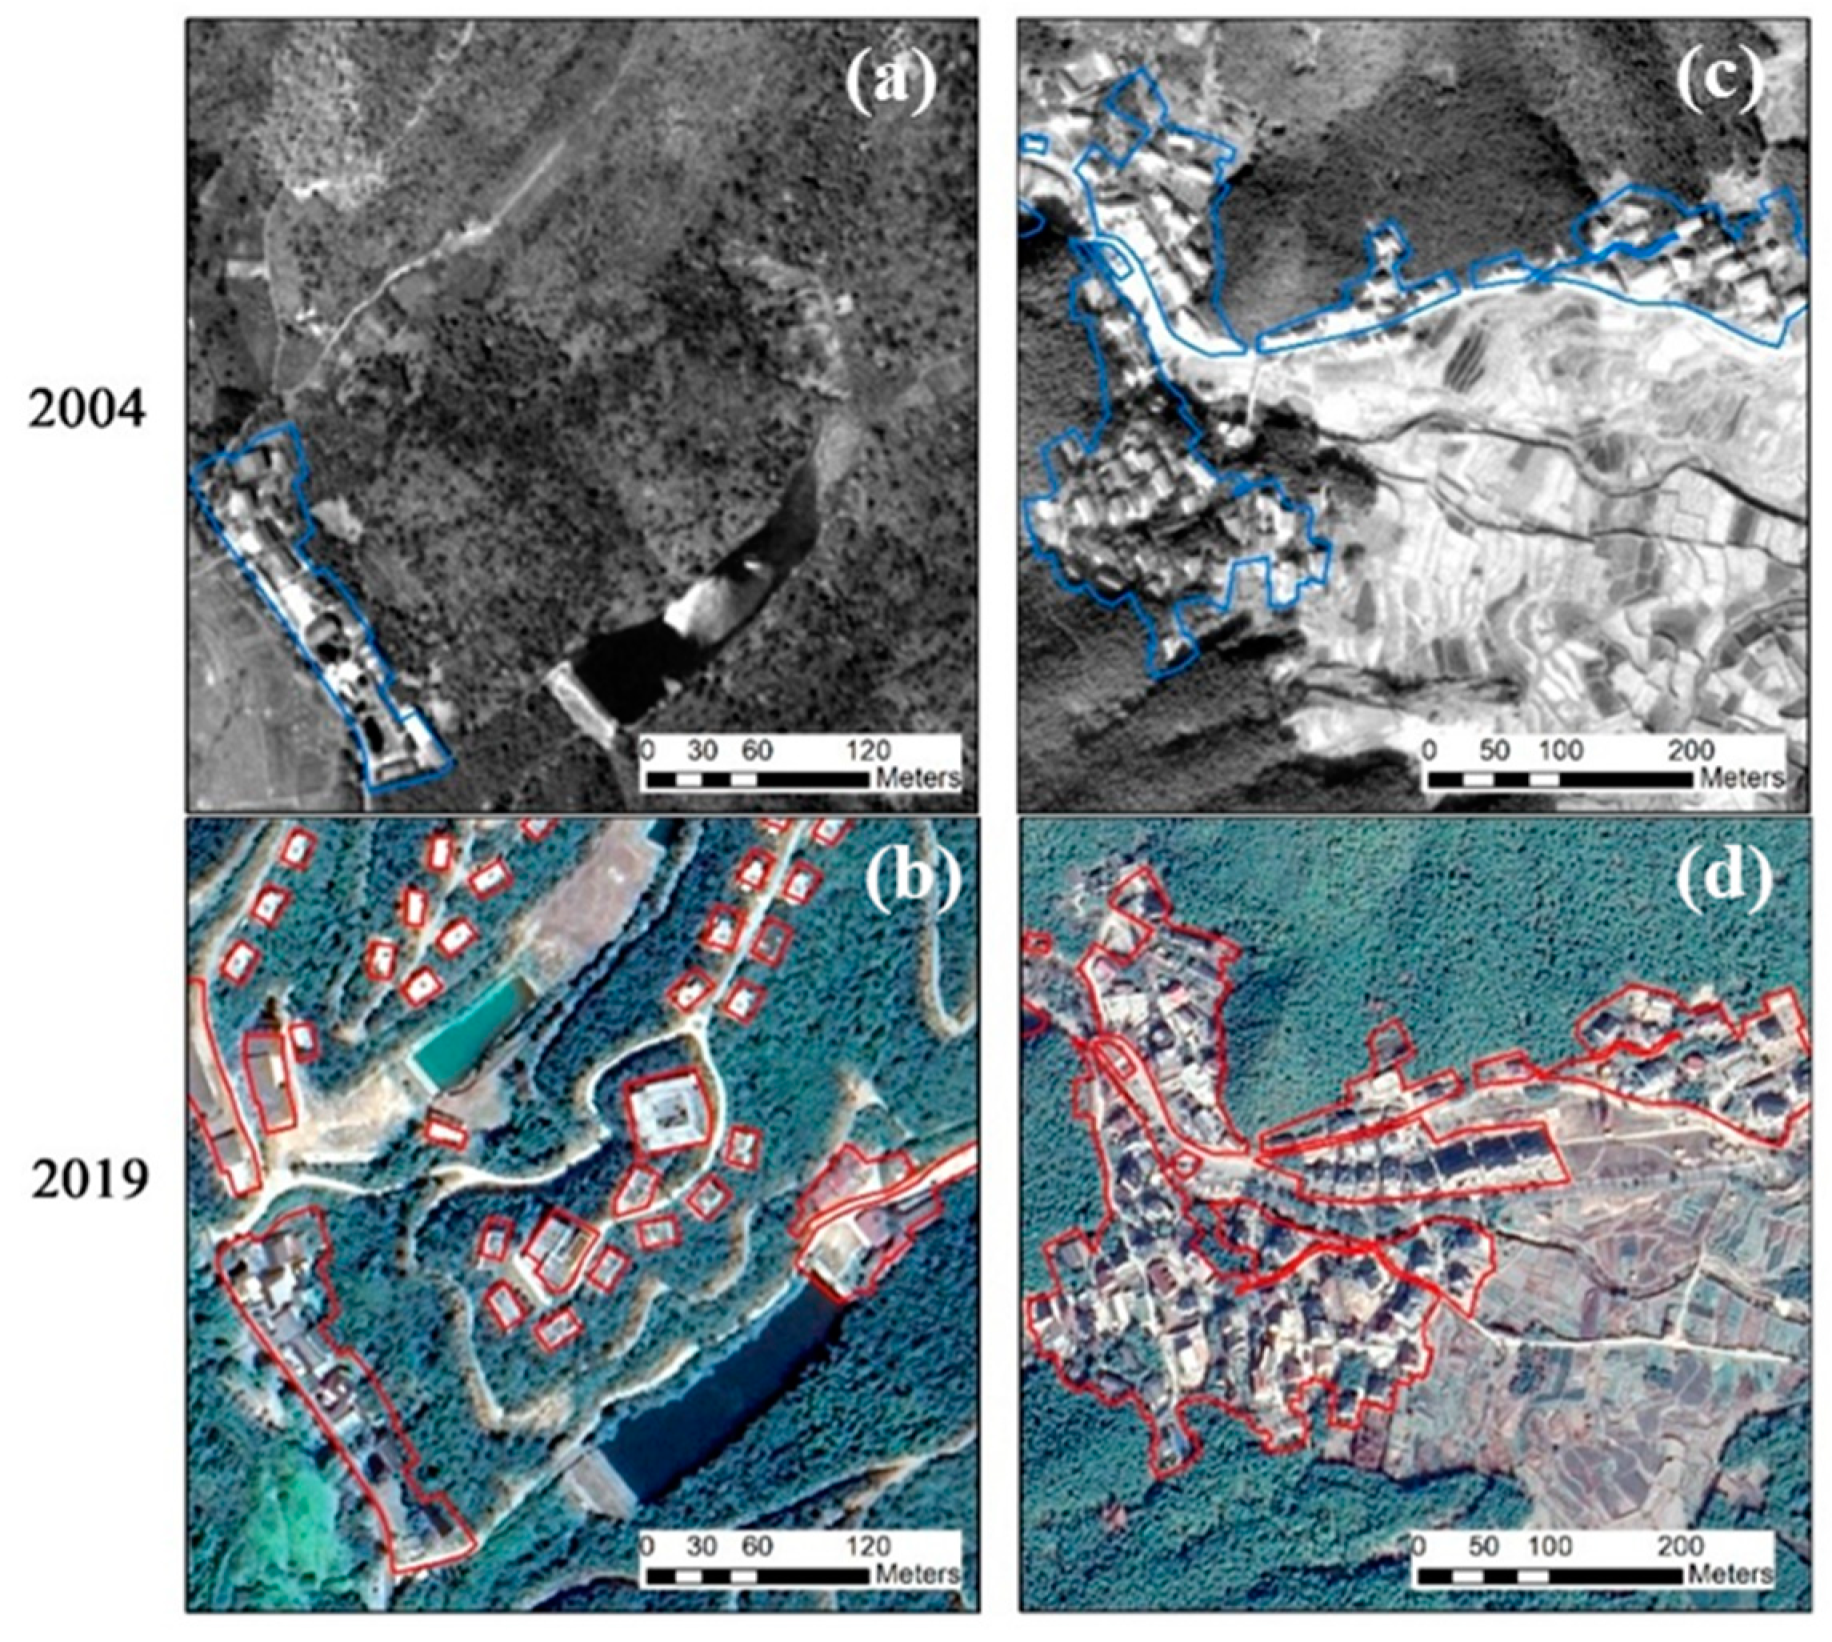
2.3.1. Mapping Rural Settlement Changes

With the aid of GF-2 remote sensing images in 2019, rural settlement in 2019 was first interpreted and then used as a baseline for determining rural settlement in 2004 (Figure 3). The rural settlement parcels in 2004 were delineated based on aerial photographs. Finally, expanded rural settlement parcels from 2004 to 2019 were obtained. Accuracy assessment was conducted with 150 random sampling points through a field survey in 2019, and the 98.7% accuracy implies that the visual interpretation of the mapping results was relatively reliable. The abovementioned procedures were performed with ArcGIS 10.6.

2.3.2. Spatiotemporal Pattern Analysis of Rural Homestay Inns

The spatiotemporal patterns characterize the changes of geographic entities in space and time, which plays an important role in grasping the laws of geographic phenomena [41]. In this paper, to unveil the spatiotemporal patterns of the rural homestay inns from 2004 to 2019 in Moganshan, we first conducted a general statistical analysis from the perspectives of quantity, growth rate, and different types of homestay inns and then executed fine-scale hotspot detection by the combination of kernel density estimation and spatial statistics techniques.
(1) Statistical analysis. The number of rural homestay inns in each year from 2004 to 2019 was counted to estimate the size of temporal dynamics and analyze them. The annual growth rate (GR, %) of rural homestay inns was further calculated with the following equation:
GR = N t 2 N t 1 Δ t × N t 1 × 100
where N t 2 and N t 1 are the number of rural homestay inns in years t 2 and t 1 , respectively, and Δ t is the number of years between t 2 and t 1 . In addition, the temporal changes of different types of rural homestay inns (i.e., ordinary homestay inns, boutique homestay inns, and superior homestay inns) were also calculated.
(2) Hotspot detection. We applied a density-based approach by integrating kernel density estimation (KDE) with a spatial statistics technique, Getis-Ord Gi*, to quantitively detect local hotspots for rural homestay inns from 2004 to 2019. KDE is one of the most popular methods for analyzing the first-order properties of a point event distribution [42,43]. Local statistics are any descriptive statistic associated with a spatial dataset whose value varies spatially [44]. Two of the most well-known local spatial statistics are Getis-Ord Gi* [45] and local Moran’s I [46], both of which have been widely used to detect hotspots. The strength of the integrated method is that it can be more effective because it can deal with the major limitation of KDE that there is no indication of a density threshold at which a hotspot can be confidently declared [47].
First, points of rural homestay inns were aggregated using kernel density estimation. The calculation formula is as follows:
f ( x , y ) = 1 n h 2 i = 1 n K ( d i h )
where f ( x , y ) is the density estimated at the location of observation ( x , y ) , K is the kernel function, d i represents the distance from the observation point ( x , y ) to ( x i , y i ) , n is the total number of rural homestay inns, and h is the bandwidth parameter. The bandwidth parameter h usually determines the smoothness of the estimated density. A larger h indicates a smoother density distribution, while a smaller h reveals more extensive peaks and valleys [48]. Through several experiments, we set the bandwidth of h at 500 m, which was suitable and exerted a remarkable effect on the spatial pattern of rural homestay inns.
Second, the Getis-Ord Gi* statistic was introduced to examine the spatial autocorrelation of density values resulting from KDE and identify the hotspots of rural homestay inns. The Getis-Ord Gi* statistic was expressed with the following equation:
G i = j n w i , j x j X ¯ j = 1 n w i , j S [ n j = 1 n w i , j 2 ( j = 1 n w i , j ) 2 ] n 1
S = 1 n j = 1 n x j 2 n ( X = ) 2
where   x j is the density value in the jth observation unit, the size of which is 30 m × 30 m, X ¯ is the mean value of x j , w i j is the spatial weight between unit i and unit j, and n is the total number of observation units.
The Gi* statistic can be interpreted as a z-score. For an observation unit, a positive z-score indicates a hotspot of high values, while a negative z-score implies a cold spot of low values [48]. A p value score is used to test the significance of the observed spatial pattern. Finally, the units with a Gi* statistic larger than 1.96 at the significance level of 0.05 were selected to generate the hotspot map for rural homestay inns.

2.3.3. Identifying Key Determinants of the Spatiotemporal Patterns of Rural Homestay Inns

In this paper, spatiotemporal patterns refer to the changes in rural homestay inns in space and time. The changes can be loosely divided into quantity changes (or growth) and spatial changes (or expansion) of rural homestay inns. Inspired by previous studies related to the multiple determinants of rural tourism development [15,31,34,36], we put forward a comprehensive framework to investigate the internal mechanism that influences the rural homestay inn development (i.e., quantity growth and spatial expansion). The framework consists of two steps: (1) identifying the key determinants of quantity growth by incorporating macroenvironmental determinants (e.g., government policy, investment and entrepreneurship level, market demand, and regional transportation facilities) based on a multiple stepwise regression model, and (2) exploring the key determinants of spatial expansion from the microenvironmental perspective (e.g., topography, tourism resources, landscape aesthetics, outdoor recreation, and proximity) using a logistic regression model.
(1)
Identifying key determinants of the quantity growth of rural homestay inns
In this section, we focused on exploring the key determinants of the dramatic quantity growth of rural homestay inns 2004–2019. Guided by the conceptual framework, four potential macroenvironmental determinants, including the government policy, entrepreneurship and investment, market demand, and regional transportation facilities, were selected (Table 1). A multiple stepwise regression (MSR) model, an extension of linear regression models based on Pearson’s correlation coefficient, was carried out to discover the empirical relationships between multiple types of dependent variables and independent variables [49]. The MSR model in this study can be derived as:
Y = β 0 + β 1 G p o l i c y + β 2 P i n v e s t + β 3 M d e m a n d + β 4 T r o a d + ε
where Y is the number of rural homestay inns, β 1 , β 2 ,   β 3 , β 4 are parameters, and ε is a random component (the rest of the model). The data from the years 2004 to 2019 were considered.
The MSR model was designed to leave a minimum set of independent variables in the regression model while maximizing the adjusted determination coefficient and minimizing the mean squared deviation from the regression model. In the first step, all potential dependent variables were included in the model. Then, to maintain the model with the highest determination coefficient, variables with no significant parameters were gradually eliminated. Finally, the MSR model was constructed while maintaining the significance of the parameters [49].
(2)
Identifying key determinants of the spatial evolution of rural homestay inns
In this section, we attempted to identify the multifaced determinants of spatial expansion of rural homestay inns 2004–2019.
(1) Selection of explanatory variables. Informed by the previous literature abovementioned, and considering representative, scientific and comprehensive principles, as well as data availability, microenvironmental variables were divided into five categories: topography, tourism resources, landscape aesthetics, outdoor recreation, and proximity (Table 2).
Topography is fundamental for the direction and extent of rural settlements and homestay inn distribution. Elevation and slope were chosen to represent topographical factors. The elevation and slope were calculated from the DEM, and the slope was divided into five grades: ≤2°, 2°~6°, 6°~15°, 15°~25°, and >25°.
The characteristics of tourism resources such as type, quantity, and spatial distribution can play essential roles in the expansion of homestay inns [50]. We thus classified tourism resources into historical, scenic, and natural scenic spots and used the total number of these scenic spots as a potential determinant.
Landscape aesthetics involve visual beauty, ecological beauty, and spiritual resonance, which can provide humans with health and social benefits contributing to overall well-being [51]. Various pleasant landscape elements will trigger a physiological and psychological reaction (e.g., enjoyment and happiness) in the body of visitors, implying that landscape aesthetics may have a positive effect on the spatial expansion of homestay inns. Here we selected the Shannon–Weaver diversity index (SWDI) and landscape dominance index (LDI) to characterize the aesthetic value of the landscape. A 600 m × 600 m fishnet was generated to calculate the SWDI and LDI, and the calculation was conducted with Fragstats 4.2.
Outdoor recreation refers to any leisure time activities where citizens access rural landscapes [52]. With the rapid development of urbanization, engaging in outdoor recreation activities such as agricultural sightseeing, fruit and vegetable picking, and natural education for a slow lifestyle have become popular among urban families. Hence, the supply of outdoor recreation may affect the location selection of rural homestay inns. The distance to cultivated land and orchard land was included, and the distances were calculated as the Euclidian distance with ArcGIS 10.6.
Good accessibility to well-known national or provincial parks denotes a high intensity of tourism activities. We selected the distance to Moganshan National Park as a potential explanatory variable. Transportation conditions can affect the accessibility to tourism destinations; thus, the distance to road networks (a combination of national roads, provincial roads, highways, county roads, and rural roads) was included. River networks can act as essential landscape elements and play an important role in rural tourism development [53]. Therefore, the distance to river networks was also chosen as a proximity factor. The distances were calculated as the Euclidian distance with ArcGIS 10.6.
(2) Logistic regression (LR) model. We applied the LR model to identify the key determinants of the spatial changes in rural homestay inns. Assuming that x 1 , x 2 , x 3 , , x n are a set of explanatory variables related to Y , P is the probability that a rural settlement parcel will be used to operate a homestay inn. The logistic regression can be derived as:
L o g i t ( P ) = ln ( P 1 P ) = α + i = 1 n β i x i
P = exp ( α + β 1 x 1 + L + β n x n ) 1 + exp ( α + β 1 x 1 + L + β n x n )
where α is a constant term, β 1 , β 2 , β 3 , , β n are regression coefficients, indicating the magnitude of influence of independent variables on the dependent variable. The significance level was set as 0.05 in this paper. When the p value is less than the given significance level, it is suggested that the explanatory variable should be kept in the model; otherwise, it cannot pass the significance test.
Two indicators were used to evaluate the performance of the logistic regression model in this paper, including the percentage of correct predictions (PCP) and the significance value of the Hosmer–Lemesho goodness fitting test (H–L test). PCP is the proportion of the number of correctly predicted samples to the total number of samples. The H–L test is used to evaluate whether the model makes full use of information to achieve the maximum fitting. If the significance value of the H–L test is greater than 0.05, it indicates that the goodness of fit is acceptable; otherwise, it indicates that the model is not well established.
An integrated approach of systematic sampling and random sampling was employed to balance the sample size and avoid spatial autocorrelation. Previous studies have shown that when the distance between points reaches 500 m, the spatial autocorrelation will be significantly reduced [54]. We first selected 50 points representing homestay inns (Y = 1), and then 50 points representing no homestay inns points (Y = 0) were also sampled on ArcGIS 10.6. In addition, to ensure that the correlation coefficient between the variables included was less than 0.5, multicollinearity between the variables was diagnosed. The Z-score method was used to standardize the variables. The LR model was performed with SPSS 22.0.

3. Results

3.1. Rural Settlement Changes

The statistics on the rural settlement changes between 2004 and 2019 are provided in Table 3. Overall, the total area of rural settlement expansion was 102.8 ha over the last 15 years. Regional differences in the expansion of rural settlements were notable within the study area (Figure 4).
We divided villages into three zones: the core zone, inner zone, and peripheral zone (Table 3). Limited expansion of rural settlements occurred in Moganshan National Park, with an area of only 0.4 ha. In the inner zone located adjacent to Moganshan National Park, the rural settlements of Xiantan and Liaoyuan experienced comparatively large expansion, with areas of 10.0 ha and 11.1 ha, respectively. In the peripheral zone, Fatou and Gaofeng witnessed obvious expansion with areas of 19.2 ha and 10.3 ha, respectively.

3.2. Spatiotemporal Patterns of Rural Homestay Inns

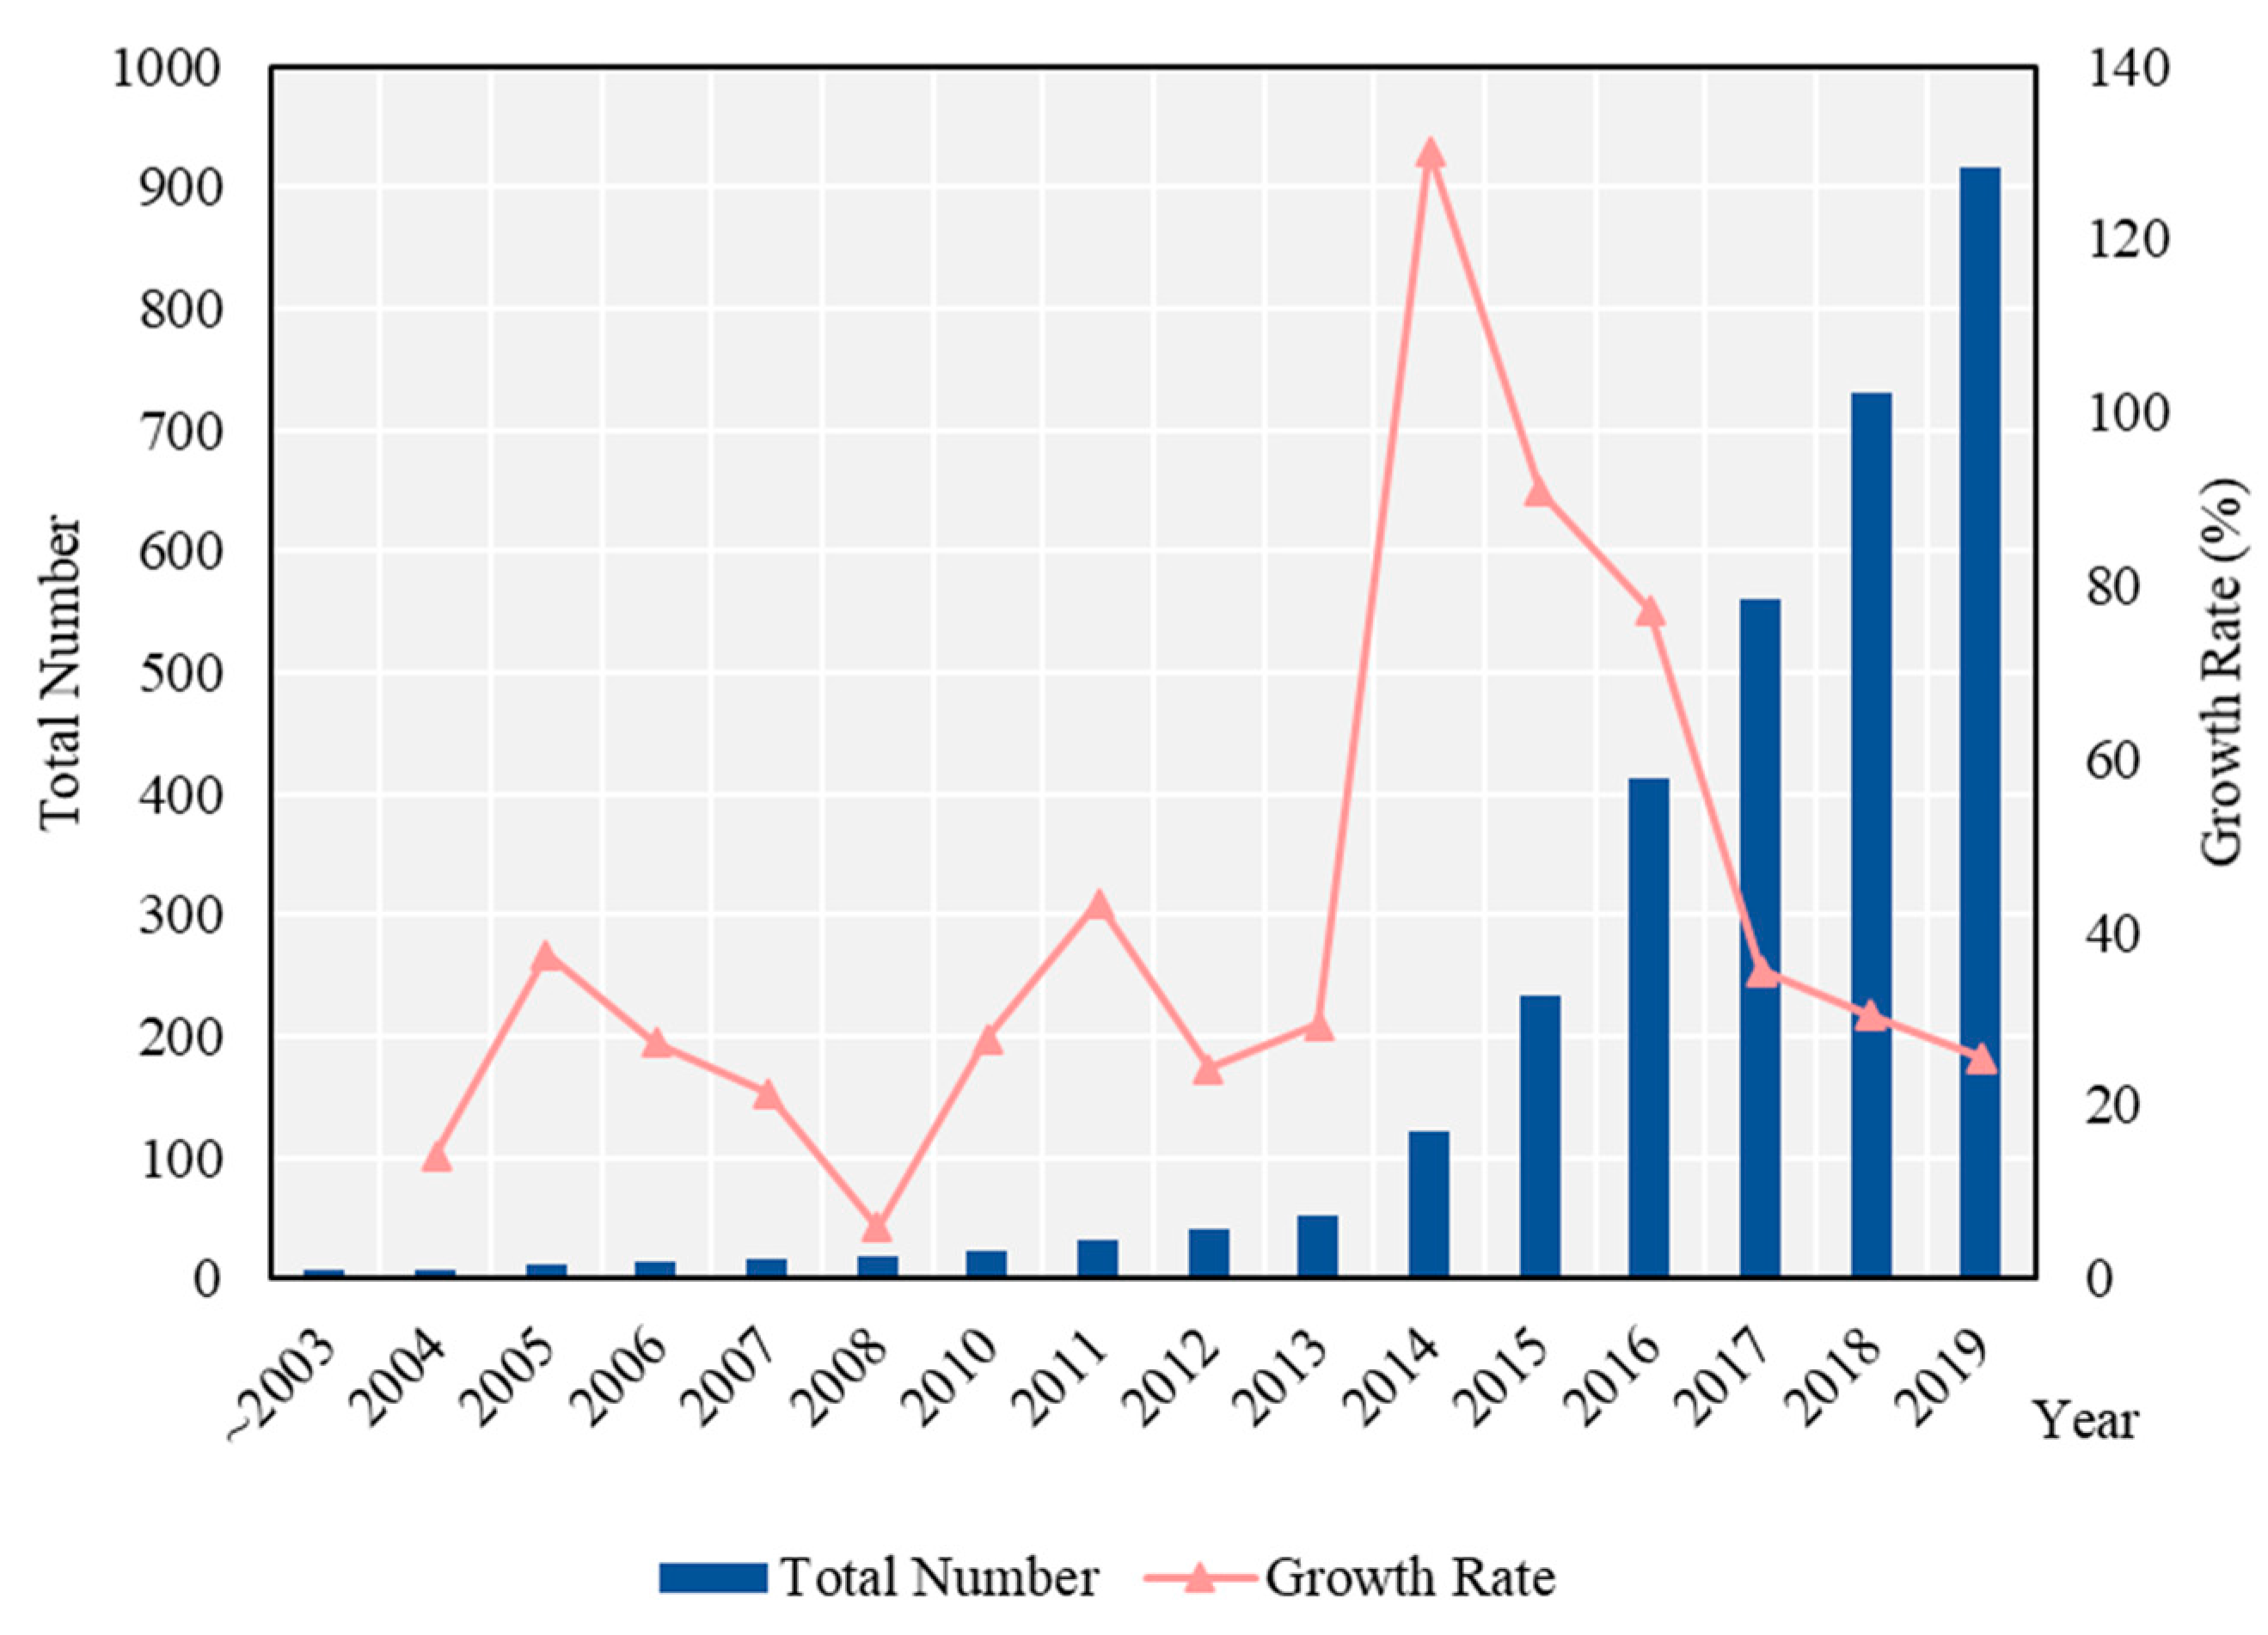
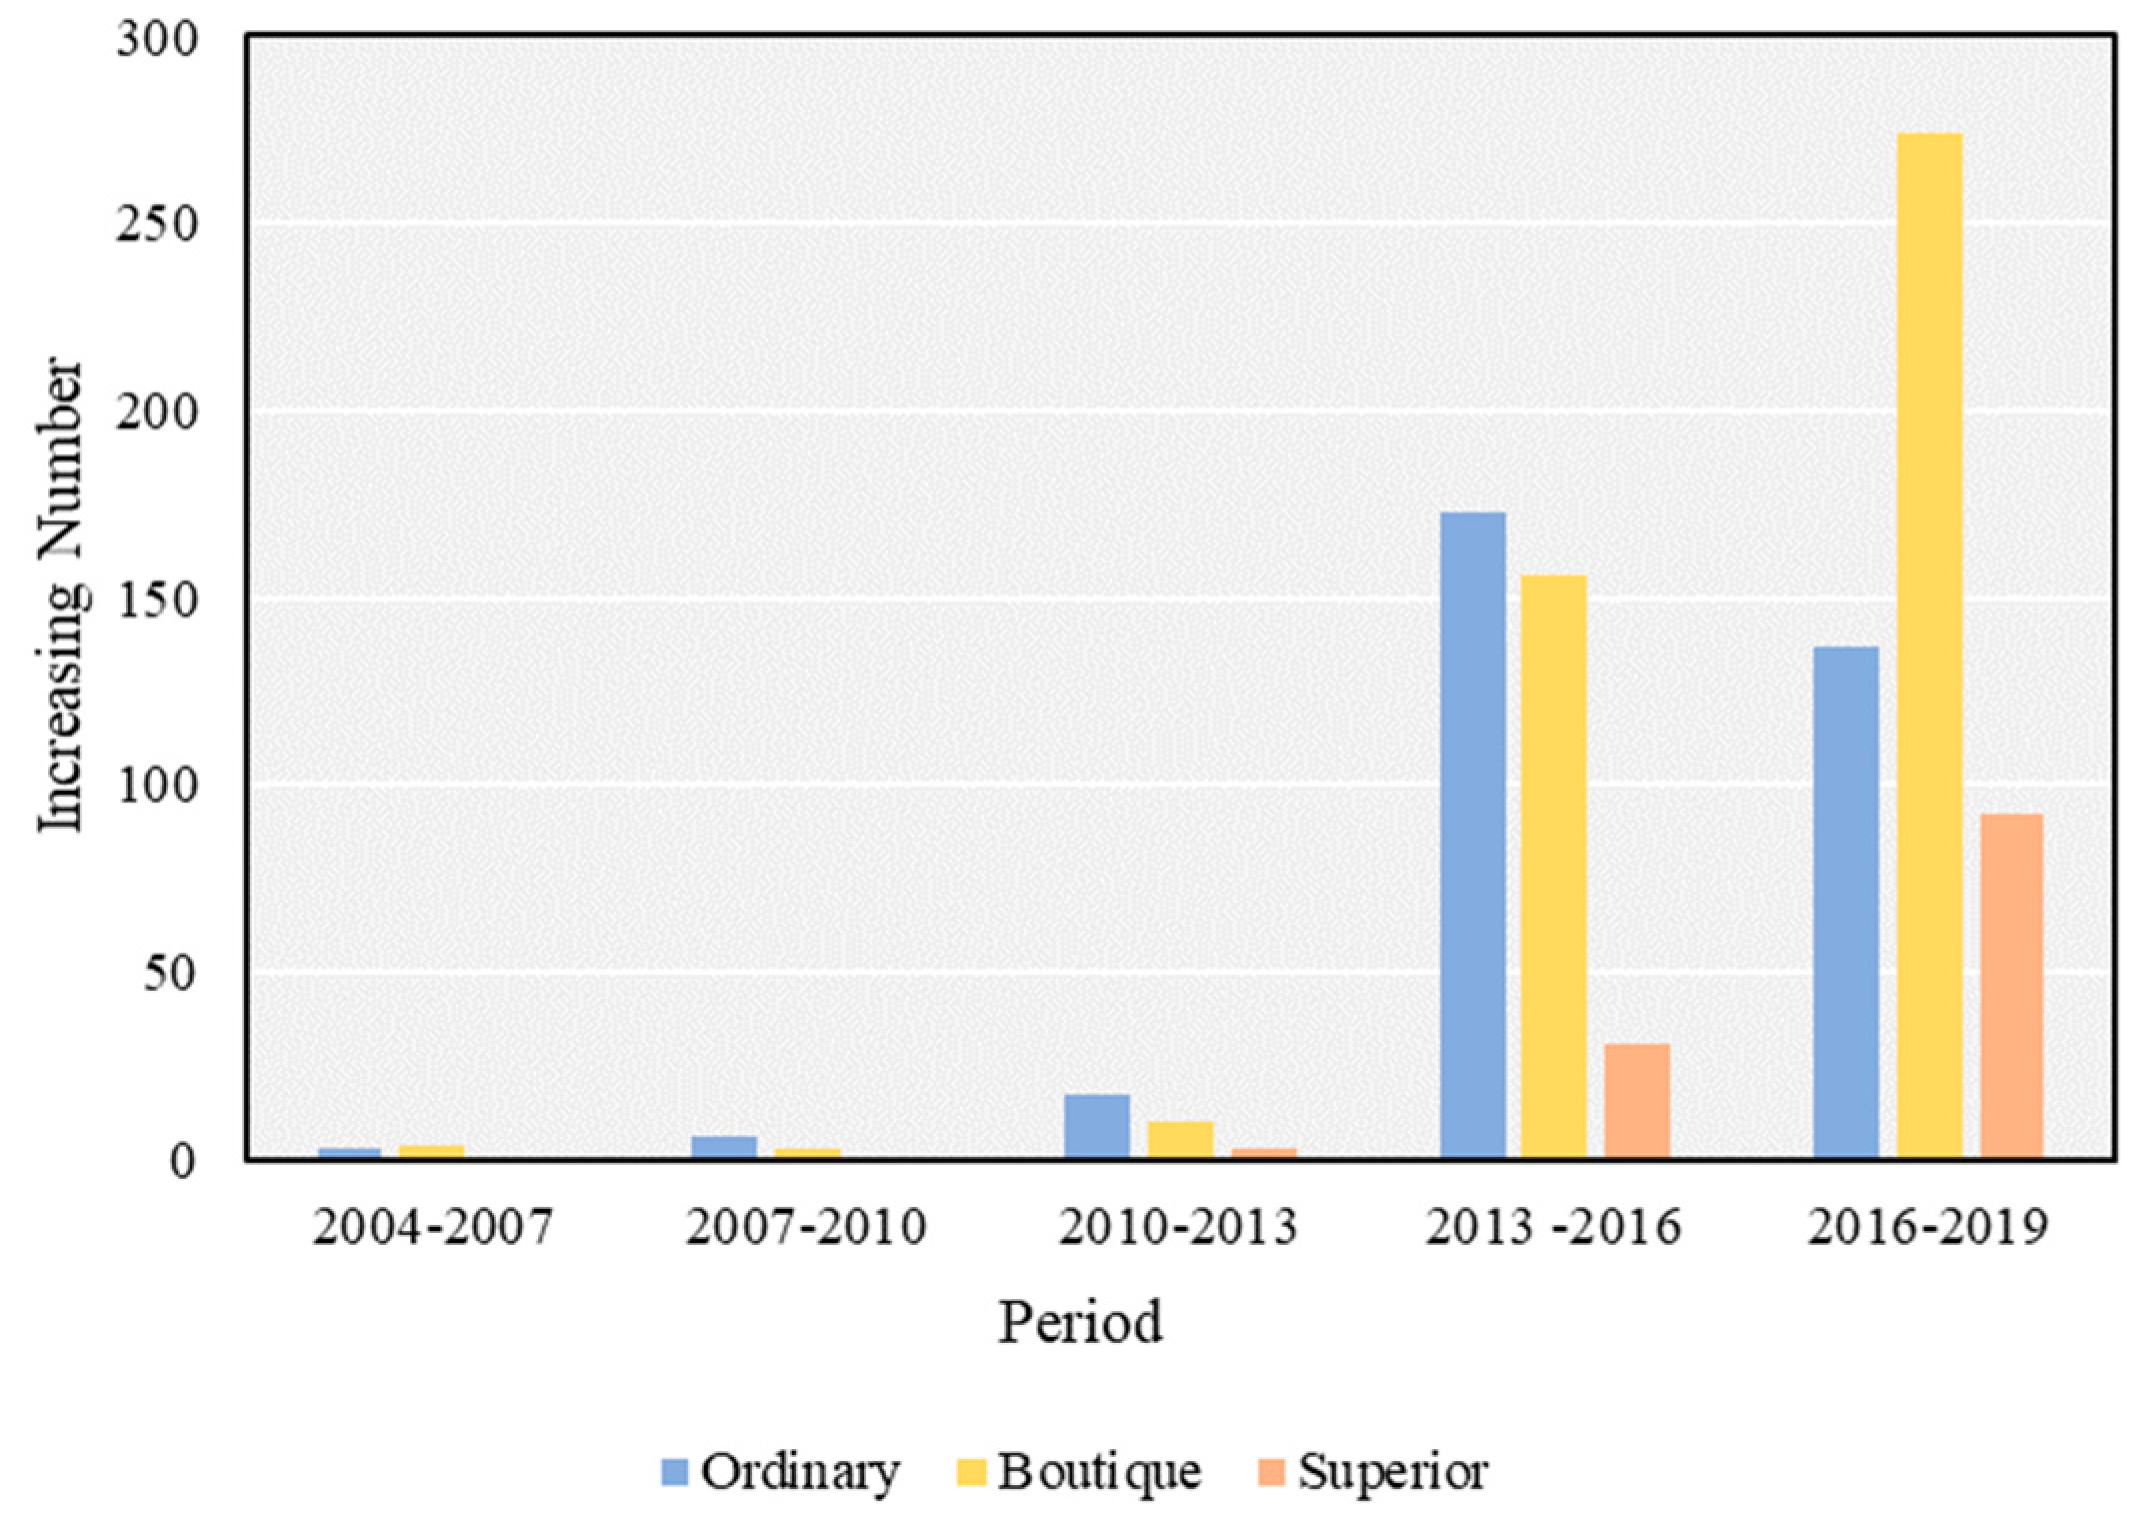
3.2.1. Quantity Growth of Rural Homestay Inns

The total number and GR of rural homestay inns in Moganshan between 2004 and 2019 are depicted in Figure 5. Generally, the total number of homestay inns increased considerably from 8 in 2004 to 916 in 2019. The period of homestay inn development falls into two phases: the slow-speed growth stage from 2004 to 2013 and the high-speed growth stage from 2014 to 2019. Specifically, between 2004 and 2013, newly operated homestay inns were rare, with an increasing number of fewer than 12 inns each year. It was found that 94.2% of homestay inns were newly opened during the period 2014–2019. In 2014, 69 new homestay inns were found, with the GR reaching 136.2%. Since 2015, the total number of newly expanded homestay inns has exceeded 100 each year. In particular, the total number of new homestay inns in 2016 and 2019 was as high as 180 and 186, respectively.
In terms of the temporal changes in different homestay inns, as shown in Figure 6, we found that both boutique homestay inns and superior homestay inns experienced continuous growth, especially in the two periods of 2013–2016 and 2016–2019. The number of new boutique homestay inns in the two periods reached 156 and 274, respectively. The number of newly operated superior homestay inns in 2016–2019 was three times that in 2013–2016. However, in terms of ordinary homestay inns, the increasing number showed a clear decline from 173 to 137 between the two periods.

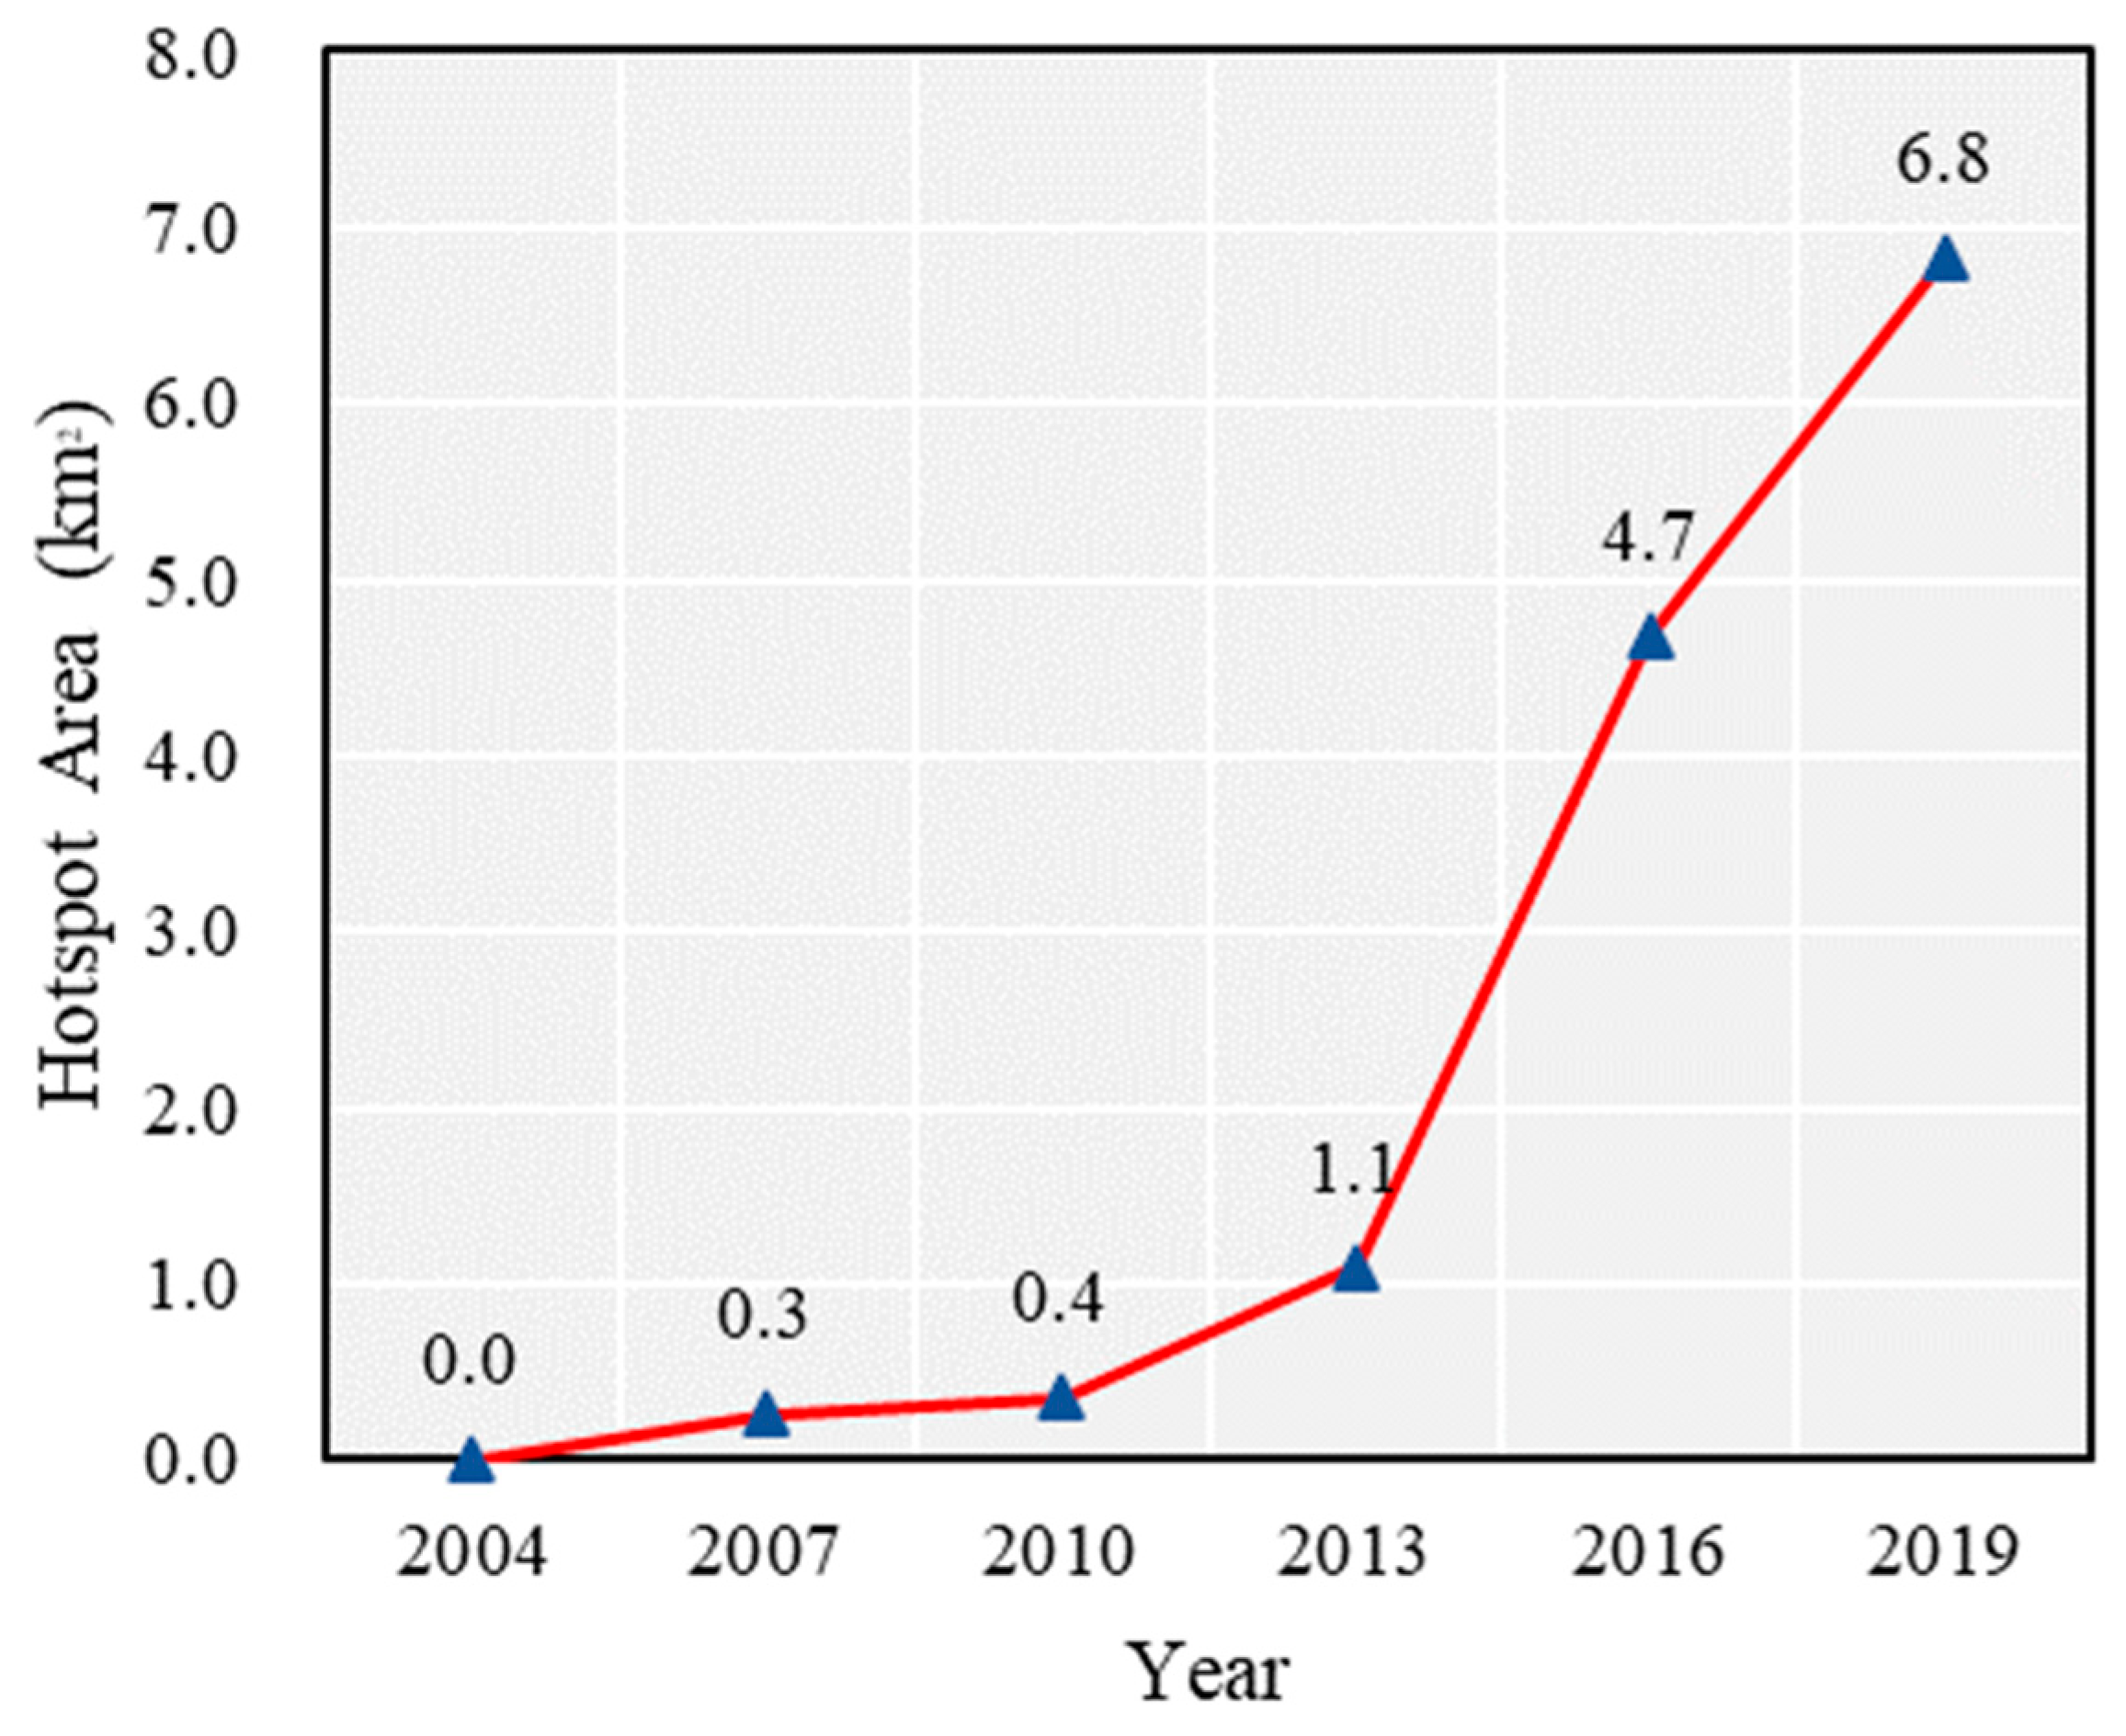
3.2.2. Spatial Evolution of Rural Homestay Inns

Figure 7 illustrates the homestay inn hotspot dynamics from 2004 to 2019. Figure 8 shows the total area of the hotspots. In 2004, no obvious hotspot emerged as the homestay inns of Moganshan were few in number and separately distributed in Moganshan National Park and its surrounding village, Houwu (Figure 7a). In 2007, a notable hotspot formed within Moganshan National Park with a total area of 0.3 km2 (Figure 7b and Figure 8). The hotspot extended westward to Houwu Village, and two significant hotspots were found in 2010 (Figure 7c). In 2013, new hotspots mainly occurred in Xiantan Village and Laoling Village (Figure 7d). Later, multiple hotspots had formed, and new hotspots were found in Ziling Village, Liaoyuan Village, and Sihe Village (Figure 7e). Moreover, the total area of hotspots noticeably increased from 1.1 km2 in 2013 to 4.7 km2 in 2016 (Figure 8). It shows that up to 2019, the total area of hotspots rapidly reached 6.8 km2 (Figure 8), and three homestay inn hotspot zones mainly emerged (Figure 7f), including the northern hotspot zone (Sihe-Xiantan), central hotspot zone (Houwu-Park-Liaoyuan), and southern hotspot zone (Ziling-Laoling-Lanshukeng). Notably, the hotspot areas in the villages of Xiantan, Houwu, and Liaoyuan were obviously larger than those elsewhere.

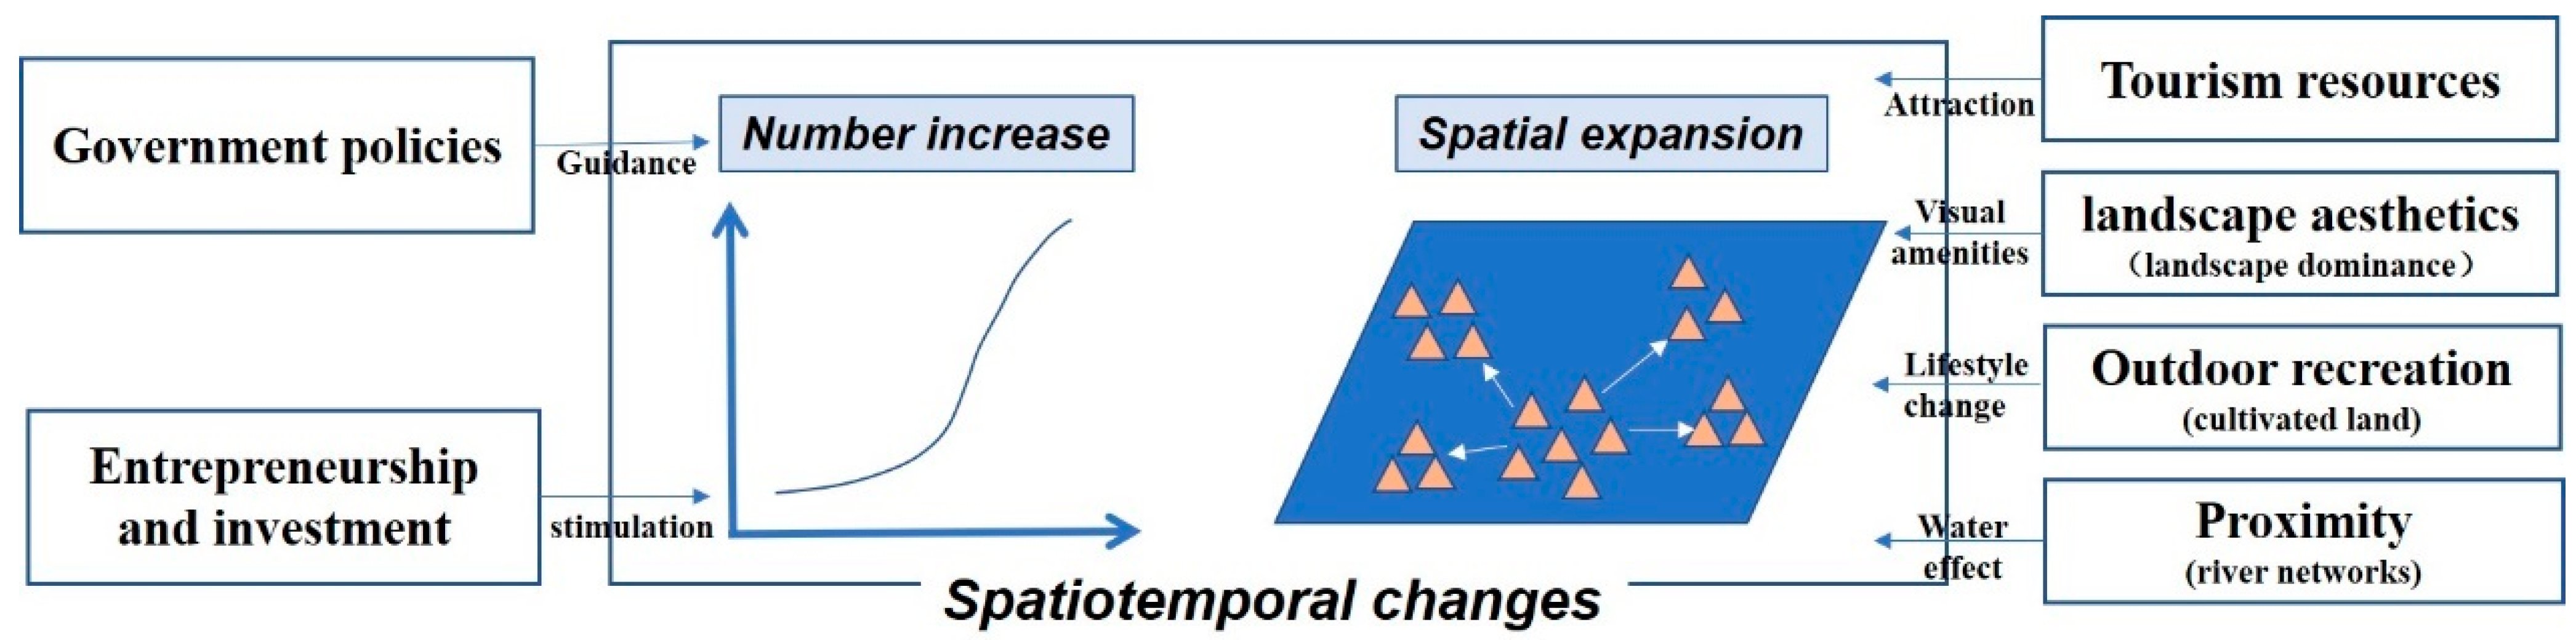
3.3. Multidimensional Determinants of the Spatiotemporal Patterns of Rural Homestay Inns

3.3.1. Key Determinants of the Quantity Growth of Rural Homestay Inns

Table 4 displays the fitting result of the multiple stepwise regression. Through modeling, the least important variables were rejected, including market demand and regional transportation facilities. According to the abovementioned findings, the regression equation can be expressed as follows:
Y = 103.188 + 3.404 G p o l i c y + 0.069 P i n v e s t
The adjusted R2 coefficient was high, with a value of 0.935. In the multicollinearity analysis, the tolerance value was greater than 0.1, and the VIF value was lower than 7.5, which implies that the selected variables passed the test. The MSR result for the increase in rural homestay inns indicates that the most important factor was government policy. Entrepreneurship and investment also showed a positive impact on quantity growth.

3.3.2. Key Determinants of the Spatial Evolution of Rural Homestay Inns

Explanatory variables, including topography, tourism resources, landscape aesthetics, outdoor recreation, and proximity, were incorporated to establish the LR model. The statistical results of the two indicators in Table 5 indicate that the LR model performed well in explaining the key determinants of the expansion of rural homestay inns. The PCP value was 81.0%, indicating that the model could correctly distinguish the total number of observations with a probability greater than 81.0%. The significance value of the H–L test was 0.485, implying that the model fits well.
The N-HNSS variable had a positive correlation with the expansion of rural homestay inns, while the D-CMNP variable showed a strong negative correlation with the expansion of rural homestay inns 2004–2019. These results indicate that rural homestay inns tended to emerge adjacent to scenic spots with abundant historical and natural tourism resources, particularly around Moganshan National Park.
The LDI variable had a negative association with the expansion of rural homestay inns, indicating that the composition ratio of landscape elements will affect the location selection of rural homestay inns.
The D-CL variable had a strong negative correlation with the expansion of rural homestay inns, which implies that homestay inns were likely to appear on parcels near cultivated land. A similar correlation was found between the D-river variable and rural homestay inn activities. The results indicate that parcels close to the river network had a higher probability of being transited to homestay inns.
However, other variables such as the topography, SWDI, D-OL, and D-Road variable, had no significant correlation with the expansion of rural homestay inns.

4. Discussion

4.1. Strengths of the Research Framework

The proposed framework successfully quantified the spatiotemporal dynamics of Moganshan homestay inns from 2004 to 2019 and identified the multifaced determinants that influence its quantity growth and spatial expansion. This framework has several advantages. First, the data sources used have low acquisition limitations, i.e., strong substitutability, easy access for practitioners, and low costs. The homestay datasets freely assessed from the online travel agency Ctrip are timely updated, which implies that homestay inn changes can be continuously monitored by tracking the dataset updates in the future. Second, hotspot detection based on KDE and spatial autocorrelation can provide a detailed perspective on where homestay hotspots are located and how the hotspots are spreading at a fine scale. The method is repeatable and serves as a foundation for future spatiotemporal pattern research pertaining to the homestay industry in other destinations. Third, we have established a comprehensive framework to identify the key determinants of spatiotemporal dynamics. It incorporates the macroenvironmental determinants and microenvironmental determinants, which have barely been examined together in other studies. The MSR model and LR model were employed to quantifiably investigate the underlying mechanism. This framework can not only reveal the key determinants that boost the continuous increase in homestay inns regionally but also indicates the significant determinants that play roles in the spatial layout of homestay inns locally.

4.2. Spatiotemporal Patterns of Rural Settlements and Homestay Inns

This study extracted multiperiod rural settlements and homestay inn information at a fine scale using remotely sensed imageries and free social network data and explored the evolution law from a spatiotemporal perspective.
The homestay inn development in Moganshan was in its infancy in early 2004, with a total number of only eight inns. As the study of [55] noted, the homestay inns at that time were Nongjiale. After Tiancheng Gao opened the first Yangjiale in 2007, the total number of homestay inns gradually increased in the following years and reached 53 in 2013. This can be explained by the fact that compared with Nongjiale, Yangjiale encourages the protection of the natural environment and ancient buildings, the revitalization of the local culture, and the provision of high-end accommodation services, which are strongly attractive to middle- and upper-class urban households [39,56]. A considerable number of entrepreneurs joined to develop Yangjiale in Moganshan through the selective imitation and duplication of this novel economic activity [57,58], thereby supporting the initial growth of rural homestay inns. Our results show that 94.2% of homestay inns were opened between 2014 and 2019, and the total number of new homestay inns has exceeded 100 each year since 2015. During the 2014–2019 period, the implementation of various rural homestay inn management policies and criteria such as the Management Strategies of Homestay Inns of Deqing County (2014), the Service Quality Classification and Evaluation of Rural Homestay Inns in Deqing County (2015), and the Basic Requirements and Evaluation for Homestay Inns in Zhejiang Province (2017) provided official guidance for the legitimate development and excellent management of rural homestay inns, and, consequently, stimulated the long-term prosperity of rural homestay inns.
In terms of the spatial changes in rural homestay inn hotspots, it was found that the first hotspot was detected within Moganshan National Park and then spread to the surrounding villages. This indicates that a well-known scenery spot plays a significant role in the tourism development of surrounding villages. The hotspot distributions showed conspicuous regional disparities as the hotspots in the villages of Xiantan, Houwu, and Liaoyuan were much larger than those in other villages, mainly due to the strong local entrepreneurial atmosphere and awareness of ecological and environmental protection, as well as the geographical clustering effect. For instance, local peasants in Xiantan Village have attempted to successively open their own homestay inns in their vacant settlements and factories since 2007. Guided by the conviction that clear waters and lush mountains are invaluable assets, Xiantan also implemented environmental projects such as the Beautiful Village Project and the Five Water Co-treatment Project to enhance its living environment [59,60]. Along with the clustering of homestay inns, more advanced infrastructure, full knowledge sharing, and intensive management can greatly improve the competitiveness of the homestay industry in this region.
With respect to the changes in different homestay inns, our result reveals that boutique homestay inn was the dominant type in the region and superior homestay inn grew at a relatively high pace. However, ordinary homestay inns showed a clear drop in number. This phenomenon indicates that more attention has been given to the high-quality development of homestay inns. This is consistent with the objectives mentioned in the issued plans and suggestions, such as the Suggestion on Comprehensively Promoting Rural Homestay Inns (2014) and the Plan of Homestay Inns Improvement in Western Deqing County (2016). These official documents emphasized the development focuses, namely, increasing the quality of homestay inns, eliminating low-end homestay inns, and strictly evaluating new homestay projects to maintain the sustainable development of the Moganshan homestay industry.

4.3. Multidimensional Determinants of the Spatiotemporal Patterns

By employing the MSR model, this study first investigated the key determinants of a temporal increase in rural homestay inns. Government policy was the essential determinant for the increase in rural homestay inns. In recent years, rural tourism policies issued have demonstrated an obvious increase which is in line with the trend of an increasing number of Moganshan homestay inns. A total of 107 rural tourism policies were promulgated during the Twelfth Five-Year Plan, and the number increased twice during the Thirteenth Five-Year Plan, as reported [40]. Entrepreneurship and investment also show a positive effect on quantity growth. It has been reported that the number of homestay inns invested by external capital accounted for more than 50% of the total number of inns in villages such as Laoling village. These results are understandable since sufficient financial capital for entrepreneurs would contribute to the establishment and growth of new businesses [61].
Based on the LR model, we further explored the multifaceted determinants of the spatial expansion of rural homestay inns. The number of scenic spots had a positive effect on the expansion of rural homestay inns, while the accessibility to Moganshan National Park had a strong negative effect. This result is expected and in line with previous studies [62]. As tourists tend to stay in places close to areas where the main sights and other tourist attractions are situated, there is a strong spatial association between the location of Airbnb accommodations and tourist attractions [29]. The majority of scenic spots of the town are concentrated in the core area of Moganshan National Park, and a few are dispersedly located in the surrounding villages [63]. From the perspective of tourists’ preferences, it is more convenient for homestay inns to capitalize on the advantages of proximity to the main sights of Moganshan National Park.
Landscape dominance had a negative correlation with the expansion of rural homestay inns, which suggests that heterogeneous landscapes are preferred when selecting sites and executing landscape design for homestay inns. This finding could be explained by the significant positive correlations between landscape preferences and land type heterogeneity, which have previously been mentioned by other authors [64,65]. For instance, it is noted that visual appeal was highest for heterogeneous landscapes and lowest for homogenous landscapes [65].
The accessibility to river networks had a strong negative effect on the expansion of rural homestay inns, which suggests that homestay inns tend to expand in areas close to river networks. Here, rivers not only provide irrigation and maintain ecological balance but also act as one of the indispensable elements of rural landscape because of their dynamic, approachable, and diverse spatial forms. It is found that in terms of visual amenities, the general public has the strongest preference for landscapes with water-related features [66]. This preference for water-related landscapes also mirrors findings from other studies [53,67]. Consequently, river networks had a strong correlation with homestay inn development in Moganshan.
The accessibility to cultivated land also had a strong negative correlation with the expansion of rural homestay inns, implying that homestay inns tend to be located in areas close to cultivated land. This result could be explained by the fact that traditional farming landscapes tend to have great diversity, color contrast, and cultural identities, which the general public finds attractive [67]. Agroenvironment can positively influence the aesthetic quality of a region, which might, in turn, have a positive impact on tourism [68].
Based on the MSR and LR models, this study investigated the key determinants of the spatiotemporal changes, i.e., quantity growth and spatial expansion, respectively. The mechanism map is shown in Figure 9. To sum up, in terms of the macroenvironment, the policies issued by the central and local government provided a good institutional environment for the Moganshan homestay industry, whilst the continuous investment by entrepreneurs in the homestay industry offered a stable guarantee to operate homestay inns, fostering the formation of a friendly business environment. The high benefits obtained by operating homestay inns, in turn, stimulated more entrepreneurs to participate in this work, resulting in an increase in the number of homestay inns. In terms of the microenvironment, tourism resources, landscape heterogeneity, and rural landscape elements (e.g., river networks, cultivated land) are essential determinants that further shaped the spatial pattern of newly expanded homestay inns.

4.4. Implications for This Study

The spatiotemporal pattern analysis method of rural homestay inns proposed in this study has offered detailed information and understanding of rural homestay industry development in Moganshan. The key determinant identification also provides policy makers and planners a new insight into rural homestay industry management and optimization. For future sustainable and high-quality development of the rural homestay industry, several suggestions are given as follows:
(1) The government should focus on the innovation of tourism policies. Proper guidance and support, in terms of land use, finance, infrastructure, brand propaganda, etc., could be provided to build a good institutional environment for rural the homestay inn tourism development;
(2) A relatively developed external economy is required to develop a distinctive homestay industry. It is essential to encourage local peasants to set up businesses and create a good environment to attract external investment in the homestay industry. A diversified investment system (e.g., foreign investment, government funds, and professional cooperative investment) could be established to support the homestay industry development;
(3) Scientific plans should be arranged based on the natural environment, local landscape resources, and cultural heritage. It is suggested that full use should be made of locally well-known scenic spots, diverse tourism resources, and rural landscape elements (e.g., river network, cultivated land). Notably, moderately integrating outdoor recreation activities with rural tourism development could also be encouraged as this may provide a new attraction for citizens.

5. Conclusions

By integrating multisource open datasets, our study comprehensively investigated the spatiotemporal changes in rural settlements and homestay inns and introduced a comprehensive framework to analyze the key determinants. Several points are highlighted as follows:
(1) The period of homestay inn increases falls into two phases: the slow-speed growth stage (2004–2013) and the high-speed growth stage (2014–2019). The Yangjiale established by Tiancheng Gao and its unique characteristics triggered the initial growth of homestay inns from 2007 to 2013, and 94.2% of homestay inns were newly opened during the period between 2014 and 2019. The implementation of various rural homestay inn management policies and criteria stimulated the long-term prosperity of rural homestay inns. Moreover, it is found that superior homestay inns grew at a relatively high pace, while ordinary homestay inns showed a clear drop in number, implying that more attention has been given to the high-quality development of homestay inns;
(2) Through hotspot detection, it is found that the first hotspot was detected within Moganshan National Park and then spread to the surrounding villages, indicating that a well-known scenery spot can play a significant role in tourism development of surrounding villages. The hotspots in the villages of Xiantan, Houwu, and Liaoyuan were much larger than those in other villages, mainly because of the strong local entrepreneurial atmosphere, awareness of environmental protection, and geographical clustering effect;
(3) Regarding the key determinants, government policy, entrepreneurship, and investment were essential determinants for the increase in rural homestay inns, as the policies provided a good institutional environment for the homestay industry, whilst the continuous investment by entrepreneurs offered a stable guarantee to operate homestay inns. In terms of spatial distribution, homestay inns were more likely to occur in settlements close to scenic spots, river networks, and cultivated land. Heterogeneous landscapes were also preferred when selecting sites and executing landscape design for homestay inns.
This study contributes to the lodging literature by presenting a long-term spatiotemporal pattern analysis method of rural homestay inns at a fine scale and a comprehensive framework to investigate the underlying mechanism of the spatiotemporal patterns. Our empirical findings advance the understanding of the spatiotemporal dynamics of Moganshan homestay inns and offer practical insights for policy makers, entrepreneurs, and planners for the future sustainable homestay industry development.

Author Contributions

Conceptualization, J.Z.; methodology, J.Z. and L.H.; software, L.H.; validation, L.H.; formal analysis, L.H. investigation, J.Z. and L.H.; resources, J.Z.; data curation, J.Z. and L.H.; writing—original draft preparation, J.Z. and L.H.; writing—review and editing, J.Z. and L.H.; visualization, L.H.; supervision, L.H.; project administration, J.Z.; funding acquisition, J.Z. and L.H. All authors have read and agreed to the published version of the manuscript.

Funding

This work was supported by the Philosophy and Social Science Planning Project of Zhejiang Province (No.22NDQN289YB) and the National Social Science Foundation Project (No.20BYJ100).

Institutional Review Board Statement

Not applicable.

Informed Consent Statement

Informed consent was obtained from all subjects involved in the study.

Data Availability Statement

Not applicable.

Conflicts of Interest

The authors declare no conflict of interest.

References

  1. Liu, Y.; Li, Y. Revitalize the World’s Countryside. Nature 2017, 548, 275–277. [Google Scholar] [CrossRef] [PubMed]
  2. Long, F.; Liu, J.; Zhu, H.; Li, T. Spatial Distribution of Homestay and Its Influencing Factors in the Yangtze River Delta of China. Geogr. Res. 2019, 38, 950–960. [Google Scholar] [CrossRef]
  3. Yang, J.; Yang, R.; Chen, M.H.; Su, C.H.; Zhi, Y.; Xi, J. Effects of Rural Revitalization on Rural Tourism. J. Hosp. Tour. Manag. 2021, 47, 35–45. [Google Scholar] [CrossRef]
  4. Gao, J.; Wu, B. Revitalizing Traditional Villages through Rural Tourism: A Case Study of Yuanjia Village, Shaanxi Province, China. Tour. Manag. 2017, 63, 223–233. [Google Scholar] [CrossRef]
  5. Yu, P.; Zhang, J.; Wang, Y.; Wang, C.; Zhang, H. Can Tourism Development Enhance Livelihood Capitals of Rural Households? Evidence from Huangshan National Park Adjacent Communities, China. Sci. Total Environ. 2020, 748, 141099. [Google Scholar] [CrossRef] [PubMed]
  6. Guo, J. Blue Book of Homestay: Annual Report on Homestay in China (2019); Social Science Literature Press: Beijing, China, 2020. [Google Scholar]
  7. Jones, D.L.; Guan, J.J. Bed and Breakfast Lodging Development in Mainland China: Who Is the Potential Customer? Asia Pac. J. Tour. Res. 2011, 16, 517–536. [Google Scholar] [CrossRef]
  8. Liu, F.; Wu, X.; Xu, J.; Chen, D. Examining Cultural Intelligence, Heritage Responsibility, and Entrepreneurship Performance of Migrant Homestay Inn Entrepreneurs: A Case Study of Hongcun Village in China. J. Hosp. Tour. Manag. 2021, 48, 538–550. [Google Scholar] [CrossRef]
  9. Ministry of Culture and Tourism of PRC. Basic Requirements and Evaluation for Homestay Inn; Ministry of Culture and Tourism of PRC: Beijing, China, 2019. [Google Scholar]
  10. Ahmad, S.Z.; Jabeen, F.; Khan, M. Entrepreneurs Choice in Business Venture: Motivations for Choosing Home-Stay Accommodation Businesses in Peninsular Malaysia. Int. J. Hosp. Manag. 2014, 36, 31–40. [Google Scholar] [CrossRef]
  11. Gao, C.; Cheng, L. Tourism-Driven Rural Spatial Restructuring in the Metropolitan Fringe: An Empirical Observation. Land Use Policy 2020, 95, 104609. [Google Scholar] [CrossRef]
  12. Kamisan Pusiran, A.; Xiao, H. Challenges and Community Development: A Case Study of Homestay in Malaysia. Asian Soc. Sci. 2013, 9, 1–17. [Google Scholar] [CrossRef] [Green Version]
  13. Tsai, K.T.; Lin, T.P.; Hwang, R.L.; Huang, Y.J. Carbon Dioxide Emissions Generated by Energy Consumption of Hotels and Homestay Facilities in Taiwan. Tour. Manag. 2014, 42, 13–21. [Google Scholar] [CrossRef]
  14. Li, J.; Bai, Y.; Alatalo, J.M. Impacts of Rural Tourism-Driven Land Use Change on Ecosystems Services Provision in Erhai Lake Basin, China. Ecosyst. Serv. 2020, 42, 101081. [Google Scholar] [CrossRef]
  15. Zhang, H.; Lu, L.; Zhang, D.; Yu, H.; Zhang, X. Spatial Pattern and Contributing Factors of Homestay Inns in the Area around Mogan Mountain. Geogr. Res. 2019, 38, 2695–2715. [Google Scholar] [CrossRef] [Green Version]
  16. Yanwu, C.; Wei, F. Spatial Relations and Coordinated Development of Characteristic Villages and A-Level Scenic Spots in Guangxi. Trib. Tour. 2020, 35, 113–126. [Google Scholar] [CrossRef]
  17. Yoshimura, N.; Hiura, T. Demand and Supply of Cultural Ecosystem Services: Use of Geotagged Photos to Map the Aesthetic Value of Landscapes in Hokkaido. Ecosyst. Serv. 2017, 24, 68–78. [Google Scholar] [CrossRef]
  18. Jiao, J.; Bai, S. An Empirical Analysis of Airbnb Listings in Forty American Cities. Cities 2020, 99, 102618. [Google Scholar] [CrossRef]
  19. Fan, T.; Guo, N.; Ren, Y. Consumer Clusters Detection with Geo-Tagged Social Network Data Using DBSCAN Algorithm: A Case Study of the Pearl River Delta in China. GeoJournal 2021, 86, 317–337. [Google Scholar] [CrossRef]
  20. Lin, Y.; Chen, X.; Huang, L.; Zhu, C.; Shahtahmassebi, A.R.; Zhang, J.; Shen, S.; Peng, R.; Deng, J.; Wang, K.; et al. Fine-Scale Mapping of Urban Ecosystem Service Demand in a Metropolitan Context: A Population-Income-Environmental Perspective. Sci. Total Environ. 2021, 781, 146784. [Google Scholar] [CrossRef]
  21. Adamiak, C. Mapping Airbnb Supply in European Cities. Ann. Tour. Res. 2018, 71, 67–71. [Google Scholar] [CrossRef]
  22. Domènech, A.; Zoğal, V. Geographical Dimensions of Airbnb in Mountain Areas: The Case of Andorra. J. Rural Stud. 2020, 79, 361–372. [Google Scholar] [CrossRef]
  23. Gyódi, K. Airbnb in European Cities: Business as Usual or True Sharing Economy? J. Clean. Prod. 2019, 221, 536–551. [Google Scholar] [CrossRef]
  24. Adamiak, C. Current State and Development of Airbnb Accommodation Offer in 167 Countries. Curr. Issues Tour. 2019. [Google Scholar] [CrossRef] [Green Version]
  25. Lagonigro, R.; Martori, J.C.; Apparicio, P. Understanding Airbnb Spatial Distribution in a Southern European City: The Case of Barcelona. Appl. Geogr. 2020, 115, 102136. [Google Scholar] [CrossRef]
  26. Adamiak, C.; Szyda, B.; Dubownik, A.; García-Álvarez, D. Airbnb Offer in Spain-Spatial Analysis of the Pattern and Determinants of Its Distribution. ISPRS Int. J. Geo-Inf. 2019, 8, 155. [Google Scholar] [CrossRef] [Green Version]
  27. Rosalina, P.D.; Dupre, K.; Wang, Y. Rural Tourism: A Systematic Literature Review on Definitions and Challenges. J. Hosp. Tour. Manag. 2021, 47, 134–149. [Google Scholar] [CrossRef]
  28. Ma, X.; Jin, Y. The Characteristics and Mechanism of Land Selection under Zhangjiajie Tourism Development. Areal Res. Dev. 2016, 35, 127–131. [Google Scholar]
  29. Gutiérrez, J.; García-Palomares, J.C.; Romanillos, G.; Salas-Olmedo, M.H. The Eruption of Airbnb in Tourist Cities: Comparing Spatial Patterns of Hotels and Peer-to-Peer Accommodation in Barcelona. Tour. Manag. 2017, 62, 278–291. [Google Scholar] [CrossRef] [Green Version]
  30. Zhou, L.; Wall, G.; Zhang, D.; Cheng, X. Tourism and the (Re)Making of Rural Places: The Cases of Two Chinese Villages. Tour. Manag. Perspect. 2021, 40, 100910. [Google Scholar] [CrossRef]
  31. Zhou, L.; Chan, E.; Song, H. Social Capital and Entrepreneurial Mobility in Early-Stage Tourism Development: A Case from Rural China. Tour. Manag. 2017, 63, 338–350. [Google Scholar] [CrossRef]
  32. Li, Y.; Westlund, H.; Zheng, X.; Liu, Y. Bottom-up Initiatives and Revival in the Face of Rural Decline: Case Studies from China and Sweden. J. Rural Stud. 2016, 47, 506–513. [Google Scholar] [CrossRef]
  33. Liu, R. The State-Led Tourism Development in Beijing’s Ecologically Fragile Periphery: Peasants’ Response and Challenges. Habitat Int. 2020, 96, 102119. [Google Scholar] [CrossRef]
  34. Liu, C.; Dou, X.; Li, J.; Cai, L.A. Analyzing Government Role in Rural Tourism Development: An Empirical Investigation from China. J. Rural Stud. 2020, 79, 177–188. [Google Scholar] [CrossRef]
  35. Hall, C.M. The Role of Government in the Management of Tourism: The Public Sector and Tourism Policies; Sage Publications: Thousand Oaks, CA, USA, 2005; ISBN 9781446214961. [Google Scholar]
  36. Yang, Y.; Mao, Z. Location Advantages of Lodging Properties: A Comparison between Hotels and Airbnb Units in an Urban Environment. Ann. Tour. Res. 2020, 81, 102861. [Google Scholar] [CrossRef]
  37. Rymarzak, M.; Siemińska, E. Factors Affecting the Location of Real Estate. J. Corp. Real Estate 2012, 14, 214–225. [Google Scholar] [CrossRef]
  38. Wang, C.; Lv, J.; Xu, Q.; Yang, G.; Fei, M. Research on Homestay Inns of Deqing, Zhejiang Province: A Case Study of French Mountain Homestay. In China Tourism Homestay Development Report (2019); Social Science Literature Press: Beijing, China, 2019. [Google Scholar]
  39. Zhang, H.; Lu, L.; Sun, F. Changing Role of Lifestyle in Tourism Entrepreneurship: Case Study of Naked Retreats Enterprise. Tour. Manag. 2021, 84, 104259. [Google Scholar] [CrossRef]
  40. Shu, B.; Ma, J. Evolution and Trend of Rural Tourism Policy System in China: An Empirical Analysis Based on 30 Years Data. Agric. Econ. Probl. 2019, 94–107. [Google Scholar] [CrossRef]
  41. Erwig, M. Toward Spatio-Temporal Patterns. In Spatio-Temporal Databases; Springer: Berlin/Heidelberg, Germany, 2004; pp. 29–53. [Google Scholar]
  42. Hu, Y.; Wang, F.; Guin, C.; Zhu, H. A Spatio-Temporal Kernel Density Estimation Framework for Predictive Crime Hotspot Mapping and Evaluation. Appl. Geogr. 2018, 99, 89–97. [Google Scholar] [CrossRef]
  43. Silverman, B.W. Density Estimation for Statistics and Data Analysis; Routledge: New York, NY, USA, 2018. [Google Scholar]
  44. Xie, Z.; Yan, J. Detecting Traffic Accident Clusters with Network Kernel Density Estimation and Local Spatial Statistics: An Integrated Approach. J. Transp. Geogr. 2013, 31, 64–71. [Google Scholar] [CrossRef]
  45. Ord, J.K.; Getis, A. Local Spatial Autocorrelation Statistics: Distributional Issues and an Application. Geogr. Anal. 1995, 27, 286–306. [Google Scholar] [CrossRef]
  46. Anselin, L. Local Indicators of Spatial Association—LISA. Geogr. Anal. 1995, 27, 93–115. [Google Scholar] [CrossRef]
  47. Kuo, P.-F.; Zeng, X.; Lord, D. Guidelines for Choosing Hot-Spot Analysis Tools Based on Data Characteristics, Network Restrictions, and Time Distributions. In Proceedings of the 91 Annual Meeting of the Transportation Research Board, Washington, DC, USA, 22–26 January 2012. [Google Scholar]
  48. Huang, L.; Wu, Y.; Zheng, Q.; Zheng, Q.; Zheng, X.; Gan, M.; Wang, K.; Shahtahmassebi, A.R.; Deng, J.; Wang, J.; et al. Quantifying the Spatiotemporal Dynamics of Industrial Land Uses through Mining Free Access Social Datasets in the Mega Hangzhou Bay Region, China. Sustainability 2018, 10, 3463. [Google Scholar] [CrossRef] [Green Version]
  49. Liu, Y.; Heuvelink, G.B.M.; Bai, Z.; He, P.; Xu, X.; Ding, W.; Huang, S. Analysis of Spatio-Temporal Variation of Crop Yield in China Using Stepwise Multiple Linear Regression. Field Crops Res. 2021, 264, 108098. [Google Scholar] [CrossRef]
  50. Truchet, S.; Piguet, V.; Aubert, F.; Callois, J.M. Spatial Influence of Attractions on Tourism Development. Tour. Geogr. 2016, 18, 539–560. [Google Scholar] [CrossRef] [Green Version]
  51. Kerebel, A.; Gélinas, N.; Déry, S.; Voigt, B.; Munson, A. Landscape Aesthetic Modelling Using Bayesian Networks: Conceptual Framework and Participatory Indicator Weighting. Landsc. Urban Plan. 2019, 185, 258–271. [Google Scholar] [CrossRef]
  52. Komossa, F.; van der Zanden, E.H.; Schulp, C.J.E.; Verburg, P.H. Mapping Landscape Potential for Outdoor Recreation Using Different Archetypical Recreation User Groups in the European Union. Ecol. Indic. 2018, 85, 105–116. [Google Scholar] [CrossRef] [Green Version]
  53. Faggi, A.; Breuste, J.; Madanes, N.; Gropper, C.; Perelman, P. Water as an Appreciated Feature in the Landscape: A Comparison of Residents’ and Visitors’ Preferences in Buenos Aires. J. Clean. Prod. 2013, 60, 182–187. [Google Scholar] [CrossRef]
  54. Nainggolan, D.; de Vente, J.; Boix-Fayos, C.; Termansen, M.; Hubacek, K.; Reed, M.S. Afforestation, Agricultural Abandonment and Intensification: Competing Trajectories in Semi-Arid Mediterranean Agro-Ecosystems. Agric. Ecosyst. Environ. 2012, 159, 90–104. [Google Scholar] [CrossRef]
  55. Su, B. Rural Tourism in China. Tour. Manag. 2011, 32, 1438–1441. [Google Scholar] [CrossRef]
  56. Cunha, C.; Kastenholz, E.; Carneiro, M.J. Entrepreneurs in Rural Tourism: Do Lifestyle Motivations Contribute to Management Practices That Enhance Sustainable Entrepreneurial Ecosystems? J. Hosp. Tour. Manag. 2020, 44, 215–226. [Google Scholar] [CrossRef]
  57. Walter, P.; Regmi, K.D.; Khanal, P.R. Host Learning in Community-Based Ecotourism in Nepal: The Case of Sirubari and Ghalegaun Homestays. Tour. Manag. Perspect. 2018, 26, 49–58. [Google Scholar] [CrossRef]
  58. Long, F.; Liu, J.; Zhang, S.; Yu, H.; Jiang, H. Development Characteristics and Evolution Mechanism of Homestay Agglomeration in Mogan Mountain, China. Sustainability 2018, 10, 2964. [Google Scholar] [CrossRef] [Green Version]
  59. Su, Y.; Qian, K.; Lin, L.; Wang, K.; Guan, T.; Gan, M. Identifying the Driving Forces of Non-Grain Production Expansion in Rural China and Its Implications for Policies on Cultivated Land Protection. Land Use Policy 2020, 92, 104435. [Google Scholar] [CrossRef]
  60. Dou, H. Xiantan Village: Great Mountain, Good Water, Nice Day. Available online: http://paper.people.com.cn (accessed on 10 August 2020).
  61. Guo, Q.; Yin, S.; Liu, Y.; Yan, F.; Jiang, H. Research on the Impact of Initial Resources and Social Capital on the Growth of Small Tourism Enterprises: A Case Study of the Hongcun Village. Tour. Trib. 2019, 34, 36–47. [Google Scholar] [CrossRef]
  62. Xu, F.; Hu, M.; La, L.; Wang, J.; Huang, C. The Influence of Neighbourhood Environment on Airbnb: A Geographically Weighed Regression Analysis. Tour. Geogr. 2020, 22, 192–209. [Google Scholar] [CrossRef]
  63. Long, F.; Dai, X.; Zhang, S. The Development Model of Homestay Tourism Agglomeration in Yangtze River Delta from the L-R-D Perspective. J. Nat. Resour. 2021, 36, 1302–1315. [Google Scholar] [CrossRef]
  64. Dramstad, W.E.; Tveit, M.S.; Fjellstad, W.J.; Fry, G.L.A. Relationships between Visual Landscape Preferences and Map-Based Indicators of Landscape Structure. Landsc. Urban Plan. 2006, 78, 465–474. [Google Scholar] [CrossRef]
  65. Khachatryan, H.; Rihn, A.; Hansen, G.; Clem, T. Landscape Aesthetics and Maintenance Perceptions: Assessing the Relationship between Homeowners’ Visual Attention and Landscape Care Knowledge. Land Use Policy 2020, 95, 104645. [Google Scholar] [CrossRef]
  66. Howley, P. Landscape Aesthetics: Assessing the General Publics’ Preferences towards Rural Landscapes. Ecol. Econ. 2011, 72, 161–169. [Google Scholar] [CrossRef]
  67. Arriaza, M.; Cañas-Ortega, J.F.; Cañas-Madueño, J.A.; Ruiz-Aviles, P. Assessing the Visual Quality of Rural Landscapes. Landsc. Urban Plan. 2004, 69, 115–125. [Google Scholar] [CrossRef]
  68. Lindemann-Matthies, P.; Briegel, R.; Schüpbach, B.; Junge, X. Aesthetic Preference for a Swiss Alpine Landscape: The Impact of Different Agricultural Land-Use with Different Biodiversity. Landsc. Urban Plan. 2010, 98, 99–109. [Google Scholar] [CrossRef]
Figure 1. Location of the study area.
Sustainability 14 07242 g001
Figure 2. Research framework.
Sustainability 14 07242 g002
Figure 3. Representative examples of rural settlement delineation (2004–2019): (a,b) are partial views in Fatou village in 2004 and 2019, respectively; (c,d) are partial views in XianTan village in 2004 and 2019, respectively.
Sustainability 14 07242 g003
Figure 4. Rural settlements changes from 2004 to 2019.
Sustainability 14 07242 g004
Figure 5. Total number and growth rate of rural homestay inns from 2004 to 2019 in Moganshan.
Sustainability 14 07242 g005
Figure 6. The increasing number of different homestay inn types from 2004 to 2019.
Sustainability 14 07242 g006
Figure 7. The kernel density maps (up line) and hotspot maps (bottom line) of rural homestay inns from 2004 to 2019 (af) in Moganshan.
Sustainability 14 07242 g007
Figure 8. The area of hotspots from 2004 to 2019.
Sustainability 14 07242 g008
Figure 9. The mechanism map of the spatiotemporal changes of rural homestay inns.
Sustainability 14 07242 g009
Table 1. Macroenvironmental variables index system.
VariableDescriptionSources
Government policy
GpolicyNumber of rural tourism policies issued by government [40]
Entrepreneurship and investment
EinvestTertiary industry investment and funds from the private and individual economyZhejiang Statistical Yearbook
Market demand
MdemandPer capita consumption expenditure of urban residentsZhejiang/Shanghai/Jiangsu/Anhui Statistical Yearbook
Regional transportation facilities
TroadArea of urban roadsZhejiang/Shanghai/Jiangsu/Anhui Statistical Yearbook
Note: Based on the field surveys and in-depth interviews with local entrepreneurs, we can see that visitors to Moganshan homestay inns mainly come from Shanghai (50%), Jiangsu (20%), Zhejiang (15%), and Anhui (15%). Therefore, two variables M d e m a n d and T r o a d were measured using the weighted average method.
Table 2. Microenvironmental variables index system.
VariableDescriptionSources
Topography
ElevationElevationDEM at 30 m spatial resolution
SlopeSlopeDEM at 30 m spatial resolution
Tourism resources
N-HNSSNumber of historical and natural scenic spotsNumber of historical and natural scenic spots
Landscape aesthetics
SWDILandscape diversityDigital land use map at 1:10,000 scale
LDILandscape dominanceDigital land use map at 1:10,000 scale
Outdoor Recreation
D-CLDistance to the cultivated landDigital land use map at 1:10,000 scale
D-OLDistance to the orchard landDigital land use map at 1:10,000 scale
Proximity
D-CMNPDistance to the core Moganshan National ParkDigital map of Moganshan National Park
D-RiverDistance to the nearest riverDigital land use map at 1:10,000 scale
D-RoadDistance to the nearest roadDigital land use map at 1:10,000 scale
Table 3. The total area of the rural settlement of each village in Moganshan.
Zone TypeVillage2004 (ha)2019 (ha)2004–2019 (ha)
Core ZoneNational Park15.215.60.4
Inner zoneHouwu (HW)32.337.14.8
Xiantan (XT)40.950.810.0
Liaoyuan (LY)44.155.211.1
Laoling (LL)28.735.16.4
Ziling (ZL)17.722.14.4
Miaoqian (MQ)18.020.22.2
Periphery zoneYaowu (YW)14.314.90.6
Dazaowu (DZW)17.919.31.4
Nanlu (NL)48.352.84.5
Sihe (SH)47.155.68.4
Gaofeng (GF)29.639.910.3
Hecun (HC)35.041.06.0
Lanshukeng (LSK)26.127.51.4
Fatou (FAT)37.556.619.2
Fotang (FOT)26.128.32.1
Dongshen (DS)27.830.52.7
Qinlao (QL)20.525.95.4
Shang aowu (SAW)29.330.81.5
Sum556.2659.0102.8
Table 4. The results of homestay inn growth in Moganshan based on MSR.
VariablesUnstandardized CoefficienttSignificantMulticollinearity Analysis
BStandard Error ToleranceVIF
Intercept−103.18828.748−3.5890.003
Government policy3.4041.3612.5020.027 *0.195.274
Entrepreneurship and investment0.0690.0174.0550.001 **0.195.274
Note: Significance is indicated with ** and * for p < 0.01 and p < 0.05, respectively.
Table 5. The results of homestay inn expansion in Moganshan based on LR.
VariableRegression CoefficientResidualpExp (β)
Elevation0.6340.4560.1641.886
Slope−0.2750.3450.4260.76
N-HNSS1.8280.8630.034 *6.218
SWDI−0.9470.590.1080.388
LDI−1.2830.6180.038 *0.277
D-CL−1.6090.6010.007 **0.2
D-OL−0.0280.3380.9330.972
D-CMNP−1.130.4020.005 **0.323
D-River−0.7020.3050.021 *0.495
D-Road−0.5110.3210.1120.6
Constant parameter−0.0640.3230.8430.938
n100
PCP (%)81
H–L test P0.485
Note: Significance is indicated with ** and * for p < 0.01 and p < 0.05, respectively.
Publisher’s Note: MDPI stays neutral with regard to jurisdictional claims in published maps and institutional affiliations.

