Article

Potential Use of Wastewater Treatment Plant Sludge in Fabrication of Burnt Clay Bricks

1
Department of Civil Engineering, Lahore Leads University, Lahore 53101, Pakistan
2
Civil Engineering Department, University of Engineering and Technology, Lahore 54890, Pakistan
3
Department of Civil Engineering, College of Engineering, Prince Sattam bin Abdulaziz University, AlKharj 16273, Saudi Arabia
4
Department of Civil Engineering, Khwaja Fareed University of Engineering and Information Technology, Rahim Yar Khan 64200, Pakistan
5
School of Civil Engineering, Southeast University, Nanjing 210096, China
6
Architectural Engineering, Faculty of Engineering and Technology, Future University in Egypt, New Cairo 11745, Egypt
*
Author to whom correspondence should be addressed.
Sustainability 2022, 14(11), 6711; https://doi.org/10.3390/su14116711
Submission received: 4 April 2022 / Revised: 2 May 2022 / Accepted: 9 May 2022 / Published: 31 May 2022
(This article belongs to the Special Issue Recycling of Concrete Wastes toward Sustainable Building Materials)

Abstract

:
Water treatment plants produce a huge amount of sludge, which are ultimately disposed to the nearest water channel, leading to harmful effects. This unmanaged wastewater treatment plant sludge (WTS) results in social and environmental concerns. Therefore, the utilization of WTS in construction activities can be a viable option for the management of waste sludge, leading to sustainable infrastructures. The main aim of this study was to investigate the potential of WTS in the manufacturing of clay bricks at an industrial scale. WTS was procured from the Rawal Lake water treatment plant, Pakistan. Clay was collected from a local industrial brick kiln site. Brick specimens with varying percentages of WTS (i.e., 5%, 10%, 15%, 20%, 30% and 40%) were casted and their mechanical and durability characteristics were evaluated. It was observed that the bricks incorporating WTS showed higher compressive and flexural strengths compared to that of the normal clay bricks. For instance, brick specimens incorporating 5% WTS by weight of clay showed a 10% increase in compressive strength. Furthermore, brick specimens incorporating 20% of WTS by clay weight satisfied the strength requirements as per local building codes for masonry construction. Scanning electronic microscopic (SEM) images confirm the porous microstructure of brick specimens manufactured with WTS, which results in 12% lighter clay bricks as compared to conventional clay bricks. Moreover, the durability characteristics of brick specimens incorporating WTS showed better performance. It can be concluded that bricks fabricated with a high proportion of WTS (i.e., 20%) will minimize the environmental overburden and lead to more durable and economical masonry construction.

1. Introduction

Sludge is produced during the process of wastewater treatment and separated before discharging this water to nearby streams. A huge amount of sludge from water treatment plants is being generated all around the globe. For instance, 8.7 million tons of dry sludge/year in Europe [1], about 7.18 million tons of dry sludge/year in the USA [2], 6.25 million tons of dry sludge/year in China [3], and 3.19 million tons of dry sludge in Pakistan [4]. This generation of huge amounts of waste may cause serious threats to human health. This sludge is hazardous to the environment; hence, its safe disposal is a big concern. It is observed that this sludge is discharged into nearby streams or rivers, which is not acceptable according to the allowable stream standards [5]. The disposal of water treatment plant sludge (WTS) into water bodies causes an increase in aluminum concentration in water, which may lead to detrimental effects on natural resources and the general environment.
Filtering is becoming a useful technique to allow the recycling of different wastes in Pakistan. Over the last decade, much research has been conducted to investigate the characterization of different sanitary waste materials. These materials include bottom ash, solid waste ash, sludge ash, dam sediments, sludge from water treatment plants, and different other inorganic wastes [6,7,8]. The potential use of this waste includes the manufacturing of tiles, and lightweight aggregates for concrete and brick production.
Brick is the main building unit in masonry construction. Over the last decade, the brick manufacturing industry has moved towards reducing the weight of bricks and increasing its thermal insulation properties. In this study, lightweight bricks were manufactured by mixing clay as the main constituent and WTS as a productive agent to control the pores, similar to the studies conducted in Egypt, Taiwan, and the USA to use WTS in different industrial manufacturing units [9]. Several studies of using WTS in the fabrication of brick, cement, and artificial aggregate have been reported in previous studies [10,11,12]. These studies determined that favorable results can be achieved by using water treatment plant sludge (WTS) at a 15% to 25% replacement level.
Another similar waste product is waste marble powder (WMP), which is produced during regular operations of the quarries. About 72% of marble is wasted while processing and polishing. This waste is disposed of in water bodies and/or in open lands. Several studies have reported the use of WMP in brick manufacturing [13,14]. In a similar study, it was reported that by using 10% WMP in the manufacturing of clay bricks, satisfactory compressive strength can be achieved, as specified by ASTM C-67 [14]. The use of waste sludge for the manufacturing of fired clay bricks has been investigated [15]. The beneficial effects of brick specimens incorporating waste sludge on various engineering properties were reported, and as an alternative to the disposal of sludge, waste can be adopted [16]. Waste sludge as a non-conventional material with the 0% to 30% replacement of clay has been reported, and an optimized water treatment sludge of 15% can be utilized for brick manufacturing [17]. Razvi et al. [18] have conducted research on the utilization of waste sewage sludge in brick production. It has been reported that 30% of sewage sludge can be used in the replacement of clay for brick fabrication and the better disposal of waste material. Nithiya et al. [19] presented the study on bricks using different recycled materials, i.e., granite waste, egg shells, and coconut fiber [19]. Brick manufactured using dry sludge in combination with fly ash lime showed better strength characteristics than conventional and fly ash bricks [20]. It has been reported that the disposal of sewage waste in the construction industry can be a viable option as a clay replacement in brick production [21,22]. Sewage treatment plant sludge and sugarcane press mud, along with lime and fly ash in the production of brick, have been investigated for better compressive and binding properties. Ecofriendly bricks without the emission of CO2 could be obtained with waste sludge and pressed sugarcane mud [23]. Compressive strength, unit weight, water absorption, and other aspects of brick incorporating sewage sludge have also been reported [24]. The disposal of wastewater or water treatment plant sludge into streams and rivers causes serious health hazards. Therefore, it is essential to stabilize the water treatment plant sludge (WTS) and utilize it in construction applications.

2. Research Motivation

The disposal of waste material is a universal issue that disturbs the natural ecosystem and threatens human health if dumped in an open landfill. For instance, a huge amount of waste discharge in the River Nile has been a major cause of Alzheimer’s disease in Egypt, due to water treatment plant sludge [25]. Therefore, the safe disposal of wastes is essential for an ecofriendly system. The traditional methods of wastewater sludge disposal include discharging directly into streams and disposition in open lands. The sludge deposition in water channels may lead to an increased concentration of aluminum in water, which directly affects aquatic organisms and indirectly affects the human body. Therefore, utilizing waste sludge in the manufacturing of brick can be a viable approach. The decrease in the use of clay as a prime component of brick manufacturing may address this problem. The main aim of the current research work was to manufacture burnt clay bricks with the use of various dosages of water treatment plant sludge (WTS) and analyze their mechanical and durability properties.

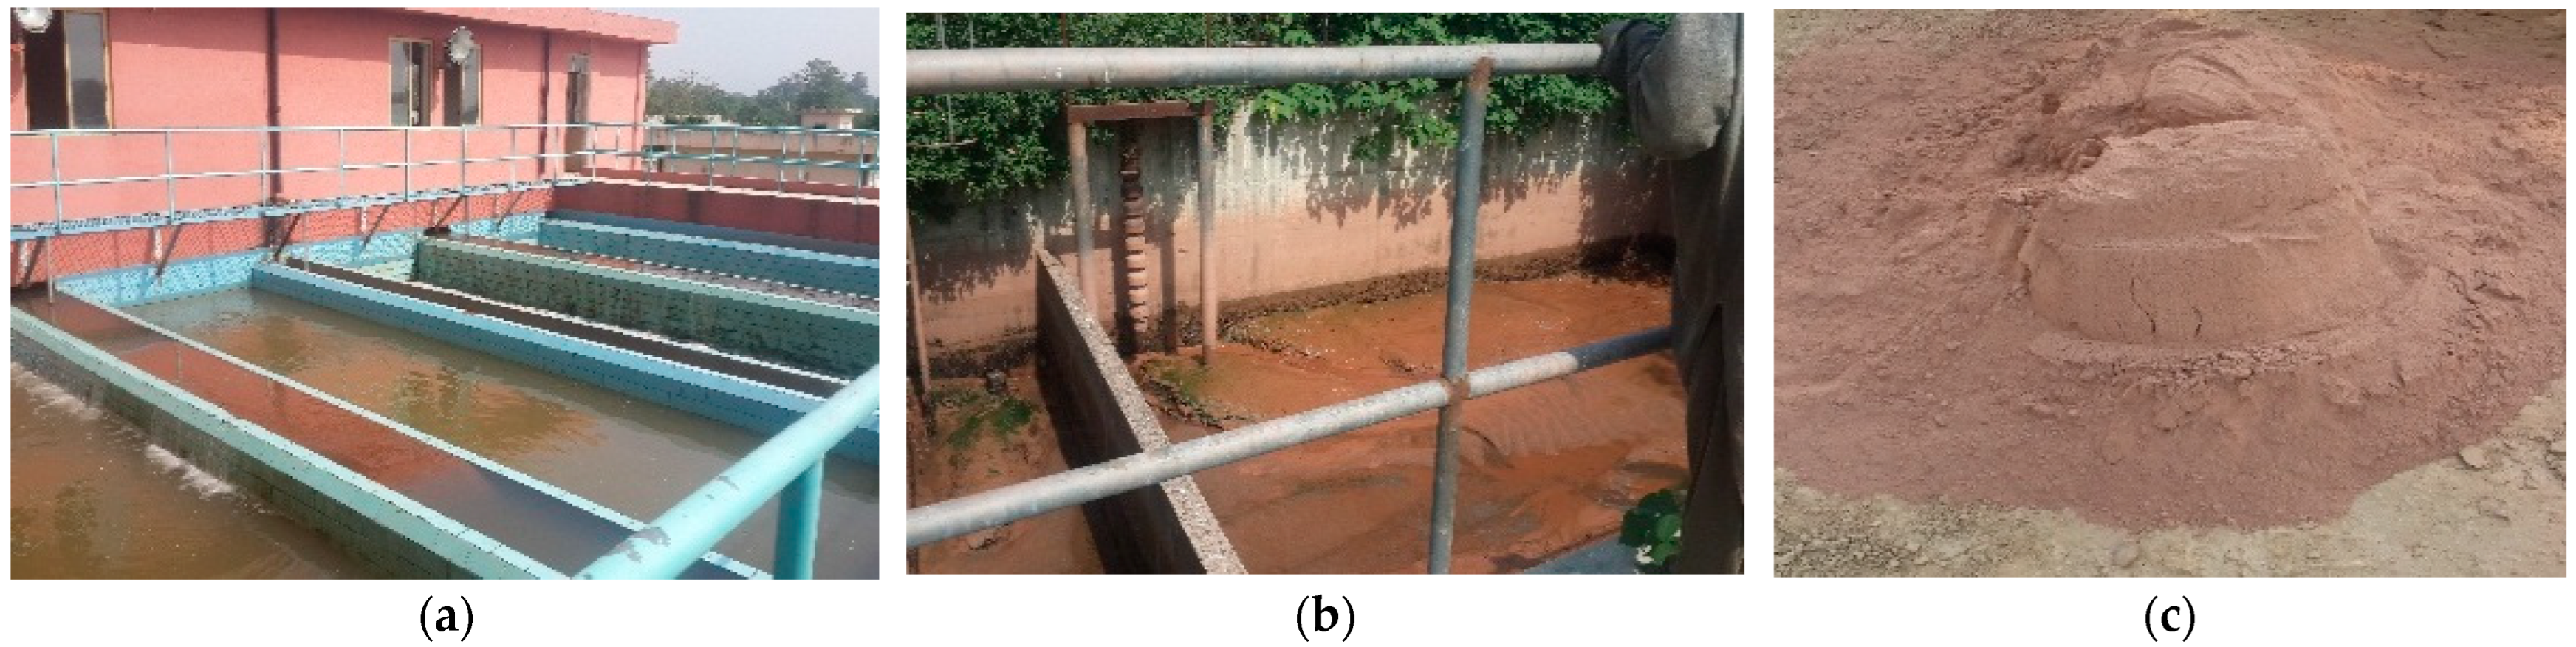
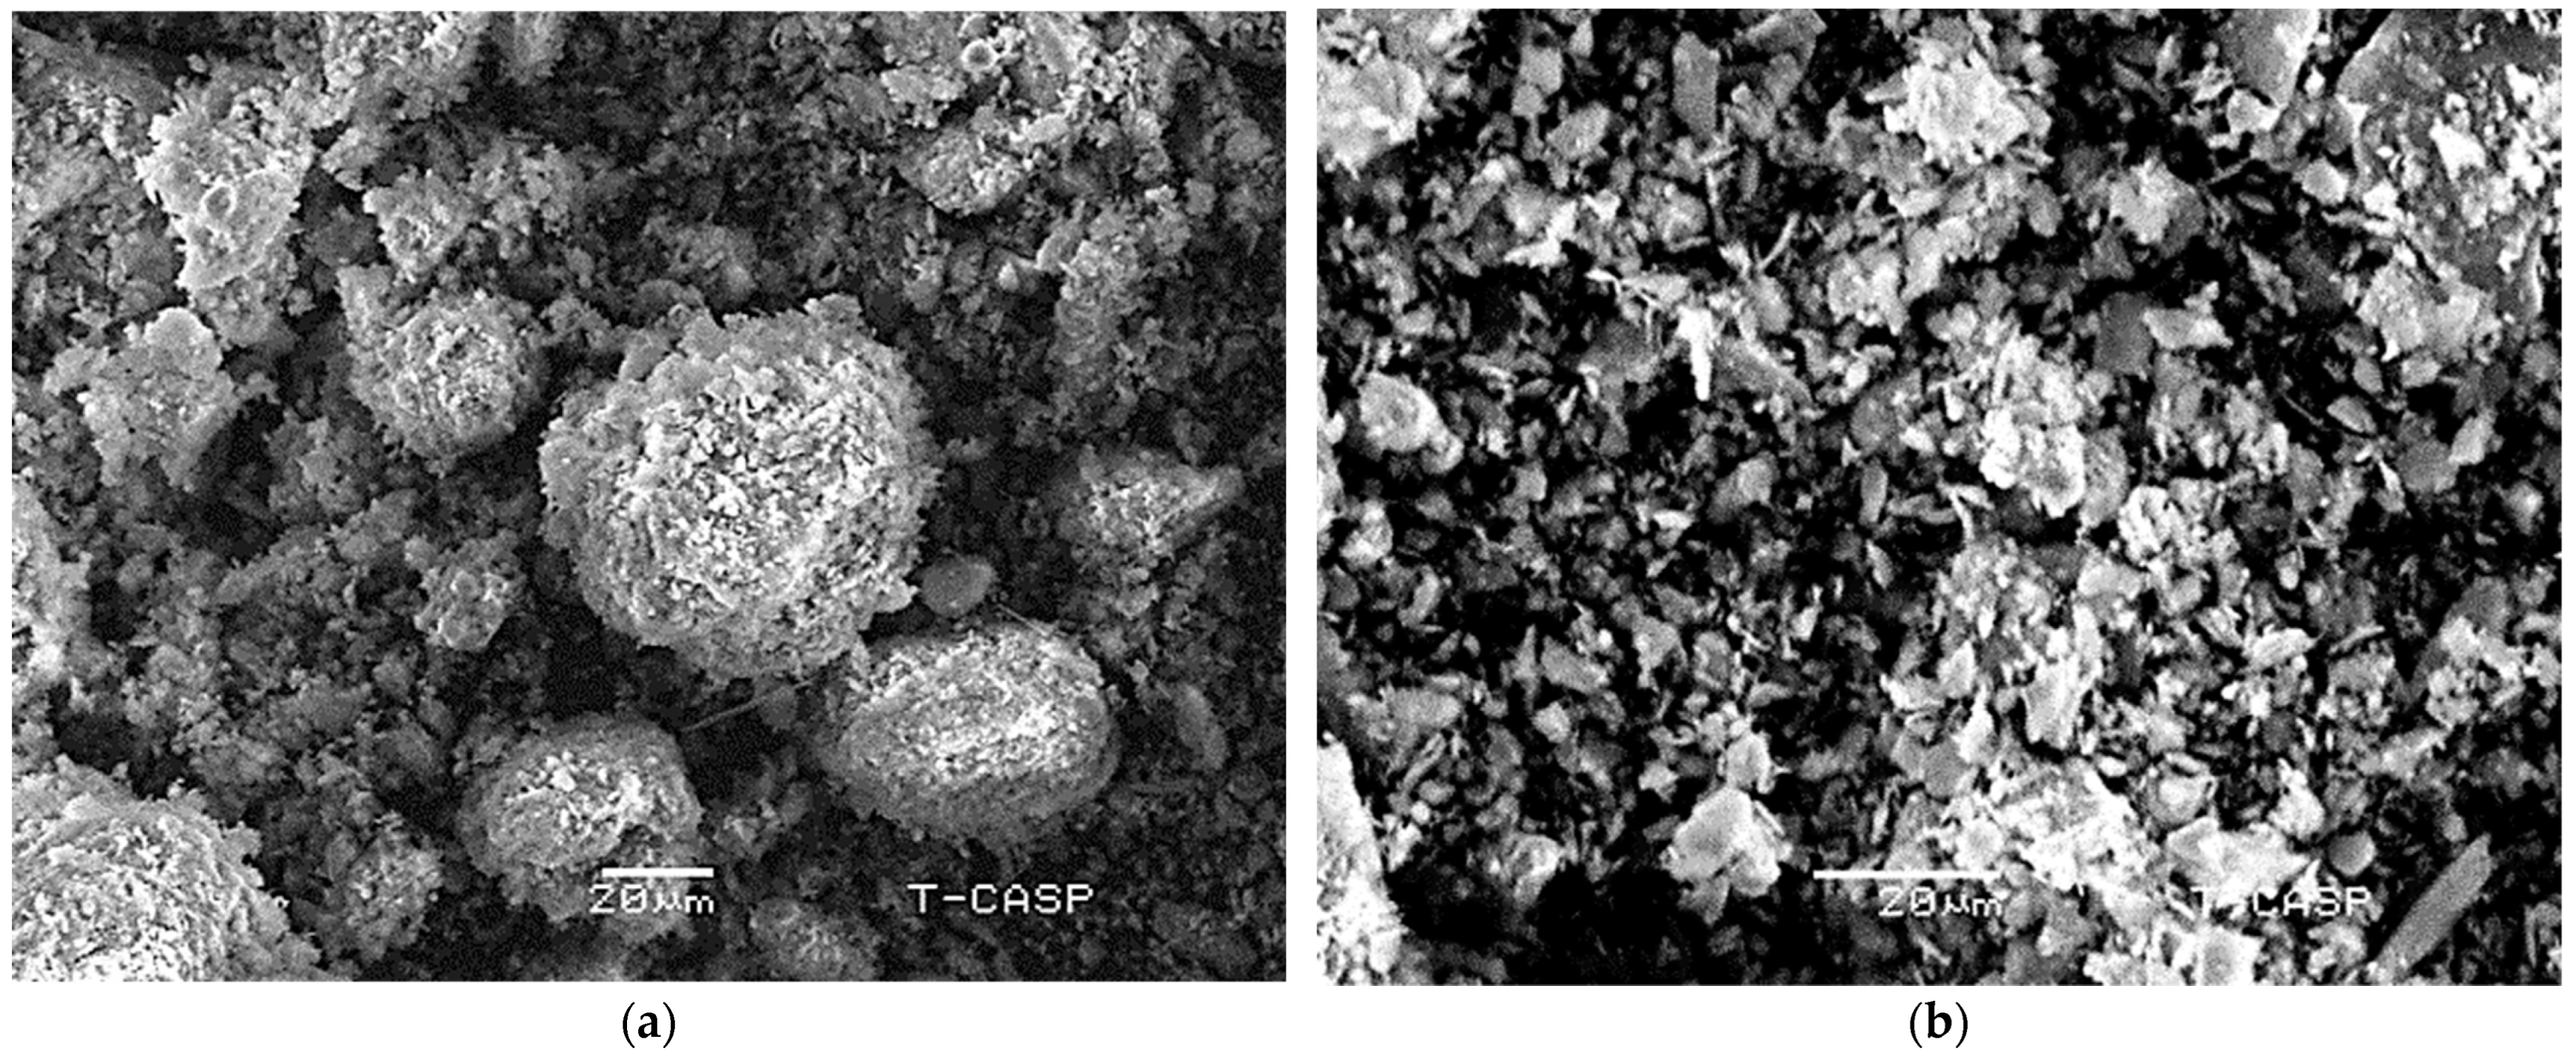
3. Materials and Methods

Bricks were manufactured at a local brick kiln using various proportions of WTS (Table 1). X-ray fluorescence (XRF) spectrometry was performed. It was clearly observed that the main constituents of clay were silica, aluminum, and ferric oxides, as shown in Table 1. Furthermore, X-ray diffraction (XRD) diffractometer was conducted to determine the phase composition of clay (Figure 1). WTS was obtained from the Rawal Lake treatment plant, located at Rawalpindi, Pakistan. The chemical composition of water treatment plant sludge (WTS) was identified by using the X-ray fluorescence (XRF) spectrometer, as shown in Table 2. The main constituents of the sludge were iron, aluminum, and silicon oxides. The phase composition of WTS was identified by XRD analysis (Figure 2). To reduce the concentration of suspended solids below 20%, dewatering of sludge was carried out using sand filtering technique. Filtered sludge was subjected to air-drying under sunlight for at least 15 days. Figure 3 shows the sand filter and spreading of WTS on drying bed. The dried WTS was pulverized using pestle. The powder was then sieved using ASTM designated sieve set. Figure 4 exhibits scanning electronic microscopic (SEM) images of WTS and clay. These images show that the particles of clay and WTS were irregular in shape. The clay particles were found to be lesser than 100 µm in size. Table 3 shows the results of presence of leaching toxicity in Clay and WTS samples. The leachate was determined via atomic absorption spectrometry (AAS). Results show that the content of Cu, Pb, Cr, Zn, and Ni present in WTS samples was higher compared to clay. The content of these heavy metals present in clay and WTS samples was within threshold limits specified by USEPA.

4. Preparation of Brick Specimens

The brick specimens were prepared to incorporate different proportions of WTS. The proportion varied from 5% to 40% by the weight of clay (i.e., 5%, 10%, 15%, 20%, 30% and 40%). The quantities of materials used to prepare the mixture are shown in Table 4.
The mixture containing clay, WTS, and water was poured into molds of conventional sizes, which had dimensions of 228 × 114 × 76 mm. The freshly molded bricks were then left in the open to dry for a couple of days. During this process, these bricks were turned over to facilitate uniform drying from all surfaces. After two days of sun drying, the bricks were fired in a kiln at a temperature of 1000 °C for a duration of 36 h. Further, after 45 days, the specimens were taken out from the kiln. Figure 5 shows the mixing process while Figure 6 shows the fabrication process of bricks in an industrial kiln.

5. Testing on Brick Specimens

Compressive strength and weight per unit area of bricks were evaluated according to the ASTM C67. Dried specimens were weighed and their dimensions were measured. Specimens were capped with gypsum for applying the load uniformly over the entire specimen. Bricks were placed in the compression testing machine along the depth direction of the brick. The flexural strength of the bricks was determined by a three-point loading test. The frog of the brick was kept on the compression side to simulate the worst conditions.
In order to determine water absorption, brick specimens were oven-dried for 24 h at 110 °C. Afterward, they were submerged in a container of water for 24 h. Afterward, brick specimens were removed and weighed after wiping their surfaces with a clean cloth. Water absorption for each specimen was determined using Equation (1).
Water   absorption = ( Ws Wd ) Wd × 100
The apparent porosity was determined in accordance with ASTM C20 [26]. The dry weight (D) of the specimens was measured after drying in the oven for 24 h. The specimens were then boiled for 2 h in water. The complete immersion of the specimen in water was ensured during the boiling phase. Furthermore, it was ensured that no specimen was in contact with the container during the boiling process. Specimens were cooled at an ambient temperature for 12 h. Afterward, suspended weight ‘S’ was measured by suspending the specimen, as per ASTM C20. The specimens were surface dried and their saturated weights ‘W’ were measured. Apparent porosity and the specific gravity were calculated using Equation (2).
V = W D
The resistance against the freeze and thaw cycles of brick specimens was evaluated on half-brick specimens subjected to 50 cycles of minimum and maximum temperatures. The freezing temperature was kept at around −16 °C, while for thawing, specimens were placed in water at room temperature. Bricks were placed in freeze and thaw conditions for 20 h and 4 h, respectively. After every week, the samples were visually examined and cracks were recorded, if there were any. Bricks were also weighed in order to evaluate any loss in the weight due to the continuous freeze–thaw cycles.
The durability of specimens was also examined by fully dipping the bricks in a sulfate solution (Figure 7). The sulfate solution was prepared by mixing 50 g of sodium sulfate per liter of water. After 30 days, bricks were taken out from the solution and oven-dried at 110 °C. After 24 h, they were taken out of the oven and weighed again. Bricks were then capped and tested to determine the compressive strength variation. Furthermore, a simple regression analysis has been carried out on the experimental results.

6. Results and Discussion

6.1. Weight per Unit Area

The weight per unit area of the brick specimens incorporating WTS is shown in Figure 8a. The unit weight of the control specimen of the brick with clay was 127 kg/m2. The results revealed that the unit weight of bricks decreased with the increased level of replacement of clay by WTS, leading to the manufacturing of lighter bricks. For example, 20% by clay weight of WTS in clay bricks resulted in approximately 7% less weight compared to that of the control bricks. This reduction in weight per unit area of bricks incorporating WTS may be due to the lesser weight of WTS as compared to clay. Lighter-weight bricks reduced the cost of transportation from plant to construction site, as well as labor cost, and ultimately produced a reduction in the overall dead load of the structure.
In order to evaluate the comparison between experimental and empirical findings, an empirical Equation (3) was developed between the weight per unit area of the bricks and the WTS content, as shown in Figure 8b. The correlation coefficient (R2) value is 98%, indicating that the empirical findings are in excellent agreement with the experimental data.
y = 0.0006 x 2 0.3544 x + 127.56

6.2. Specific Gravity

The lower specific gravity of used WTS was observed compared to that of the clay. The specific gravity of WTS and clay were measured to be 1.62 and 2.20, respectively. Therefore, it can be argued that bricks incorporating WTS will lead to lighter bricks compared to the bricks without WTS.

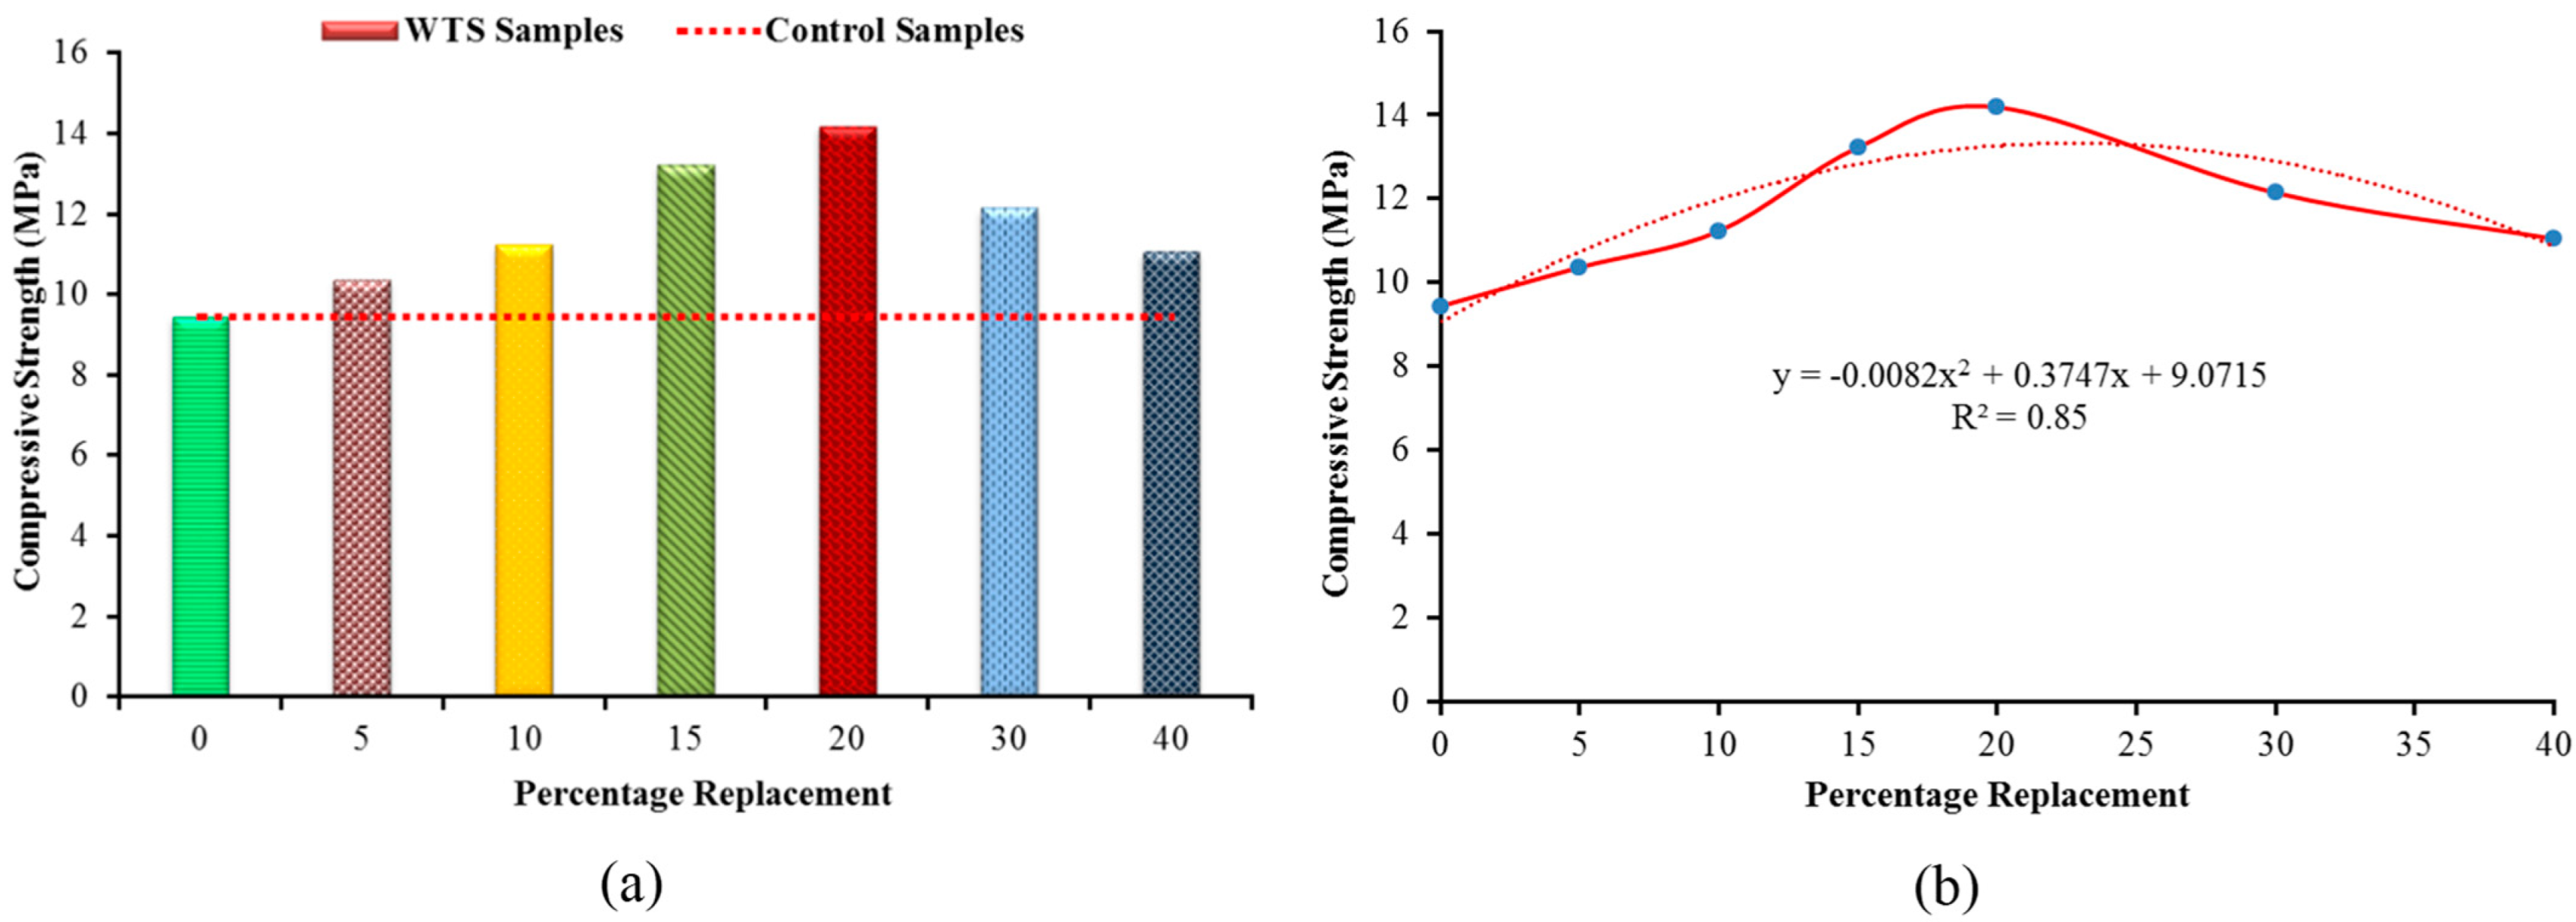
6.3. Compressive Strength

Figure 9a shows the experimental results of the compressive strength of tested bricks. The reported values are the average of five specimens with a coefficient of variation (COV) less than 3%. This COV value is similar to that reported in an earlier study [27]. Control brick specimens showed a compressive strength of approximately 9.5 MPa. An increasing trend with the increasing percentage of WTS was observed. For example, an approximately 10% increase in the compressive strength of bricks manufactured using 5% WTS by weight of clay was observed compared to the control specimen. The increase in strength may be attributed to the crystallization process that might be ensured by an increased firing process, which closes the open pores in the brick specimen incorporating WTS. In specimens beyond 20% of WTS, a reduction in compressive strength was also observed (Figure 9a). This reduction was due to a higher amount of WTS, which reduced the adhesiveness of the mud/clay, leading to an increase in the internal porosity of bricks.
The brick specimen incorporating 20% of WTS had shown a compressive strength of 14.18 MPa. A minimum of 8 MPa compressive strength should be maintained for masonry construction according to the Building Code of Pakistan [28]. Hence, it can be established that economical and sustainable bricks can be produced by utilizing 20% WTS.
As shown in Figure 9b, the empirical Equation (4) is used to calculate the compressive strength of the bricks in relation to the WTS content (%). The R2 value is 85%, indicating that the empirical findings and experimental data are in good relation.
y = 0.00826 x 2 0.3747 x + 9.0715

6.4. Modulus of Rupture

Figure 10a shows the flexural strength results of tested brick specimens. All results reported showed a COV less than 4%. Results reported in Figure 10a revealed that the specimens incorporating WTS had higher flexural strength as compared to the control specimen. The brick specimen incorporating 20% of WTS showed maximum flexural strength (i.e., 6.02 MPa).
The empirical findings of the modulus of rupture of the WTS-integrated bricks are shown in Figure 10b by Equation (5). The R2 is equal to 76%, indicating that the empirical findings are in good agreement with the experimental data.
y = 0.0027 x 2 + 0.1011 x + 4.6515

6.5. Apparent Porosity Test

Figure 11a shows the apparent porosity results for brick specimens incorporating WTS. The results revealed that porosity decreased with an increase in the percentage of WTS up to 20%. For instance, the incorporation of 5% to 20% WTS by weight of clay decreased around 6% porosity in the brick specimen. The pure clay specimen and the specimen incorporating 40% WTS showed a higher porosity. Porosity increased with an increase in the replacement level of WTS beyond 20%. Porosity is generally related to biomass residual combustion and carbonates decomposition.
An empirical Equation (6) was established to assess the apparent porosity findings of the WTS brick specimens, as shown in Figure 11b.
y = 0.0026 x 2 0.1052 x + 36.28

6.6. Water Absorption Test

Water absorption is the main parameter that controls the durability performance of bricks. Water absorption depends upon the porosity of bricks. The more the number of voids, the more will be the water absorption. The experimental values of water absorption for different brick specimens are shown in Figure 12a. The results revealed that water absorption for tested bricks decreased with a higher percentage of WTS. For instance, 11% water absorption was observed for mixtures incorporating 20% WTS, whereas it was 13% for brick specimens without WTS. An increasing trend in the water absorption was observed when bricks were incorporating 30% and 40% WTS as compared to that of 20%. The decrease in the porosity is due to the lower amount of CaO present in the WTS as compared to clay (shown in Table 1). According to ASTM C62, water absorption in bricks needs to be less than 22% for moderate weathering resistance. Furthermore, in the case of severe weathering, it should be less than 17%. Therefore, it can be established that bricks manufactured utilizing WTS (i.e., 20%) can effectively be used in the construction industry, leading to a durable construction.
As illustrated in Figure 12b, an empirical Equation (7) is created to evaluate the water absorption capacity in relation to the WTS content utilized in the bricks. The R2 value is 73%, indicating that the empirical findings are in good agreement with the experimental findings.
y = 0.0058 x 2 0.2371 x + 13.81

6.7. Initial Rate of Absorption

The initial rate of absorption (IRA) is the water absorbed by a brick bed area (762 mm2) in 60 seconds, according to ASTM C67. The water absorption capacity of bricks and mortar layers affects the bond strength between the brick layers. The high water absorption capacity of bricks can lead to a deficiency of water needed for the hydration of mortar. This may lead to a deficient bond between brick layers. Figure 13a shows the experimental findings of the initial rate of absorption for bricks containing WTS. A lesser initial rate of absorption was evident for brick specimens with WTS compared to the control specimen. For instance, an IRA of approximately 0.34 gm/min/cm2 was observed for brick specimens incorporating 20% WTS, whereas an IRA of 0.40 gm/min/cm2 for brick specimens without WTS was observed.
The minimum and maximum values for the IRA for bricks generally are 0.025 to 0.15 gm/min/cm2. For all tested specimens, IRA was higher than the normal range, with the maximum value of 0.39 gm/min/cm2 for all replacements of WTS with clay. Hence, it can be established that bricks should be well saturated with water before laying to achieve an efficient bond between mortar and bricks.
Experimental values are used to produce the empirical findings shown in Figure 13b. The initial rate of absorption for each proportion of WTS used in brick manufacturing was calculated using an empirical Equation (6). The R2 value is equal to 80%, indicating that the empirical findings are in excellent agreement with the experimental data.
y = 0.0001 x 2 0.0047 x + 0.3996

6.8. Efflorescence

Slight efflorescence was detected on specimens without WTS after 7 days, whereas no efflorescence was exhibited by brick specimens with WTS. Specimens were examined after 45 days for checking the efflorescence after a longer period. The control specimen, as compared to WTS bricks (without efflorescence), exhibited minor efflorescence after 45 days. The main cause of efflorescence in bricks is due to presence of CaO and Fe2O3. The used clay has approximately 4.25% of CaO, whereas in WTS it is only 3.72%. After replacing clay with WTS, the reduced content of CaO may cause improved behavior against efflorescence. Moreover, one of the main causes of efflorescence can be ferric oxide Fe2O3, and the recommended value of ferric oxide Fe2O3 is less than 10%. It was observed that 1.65% of Fe2O3 was present in the used clay, which caused slight efflorescence in the control specimen. In the WTS specimen, the quantity of Fe2O3 was reduced by up to 0.084%, which resulted in no efflorescence in the brick specimens incorporating WTS. Previous studies had also shown similar results. It can be established that bricks incorporating WTS were very effective against efflorescence.

6.9. Sulfate Attack Test

Figure 14a presents the experimental results of the reduction in compressive strength and the gain in weight of the specimens with WTS exposed to the sulfate environment. The compressive strength of the bricks was reduced after sulfate exposure. For instance, a 12% reduction in compressive strength was noted in control brick specimens without WTS, whereas it ranged from 11% to 9% for different replacement levels of clay with WTS brick specimens, respectively. This decrease in compressive strength may be due to the fact that sulfate salts present in the small pores generate pressure, which leads to micro-cracking. Furthermore, the results revealed that the brick specimens incorporating 20% WTS showed more sulfate resistance as compared to the control bricks. It was observed that the weight gained by the control specimen was 17%, whereas it ranged from 12% to 16% for the WTS specimens, respectively. Weight gain by the brick specimens can be through the partial filling of pores with sulfate crystals. The results showed that the replacement of bricks with 20% of WTS improved the resistance against the sulfate environment.
Figure 14b,c demonstrate the empirical results of the loss in compressive strength and gain in weight, respectively, of the WTS bricks. The empirical Equations (9) and (10) are given below. For the compressive strength reduction of the brick samples, the R2 is equal to 96%, and for the gain in weight, the R2 is 81%, respectively, confirming the good compliance of the obtained empirical results with the experimental results.
y = 0.0055 x 2 0.2839 x + 12.519
y = 0.0069 x 2 0.3295 x + 17.512

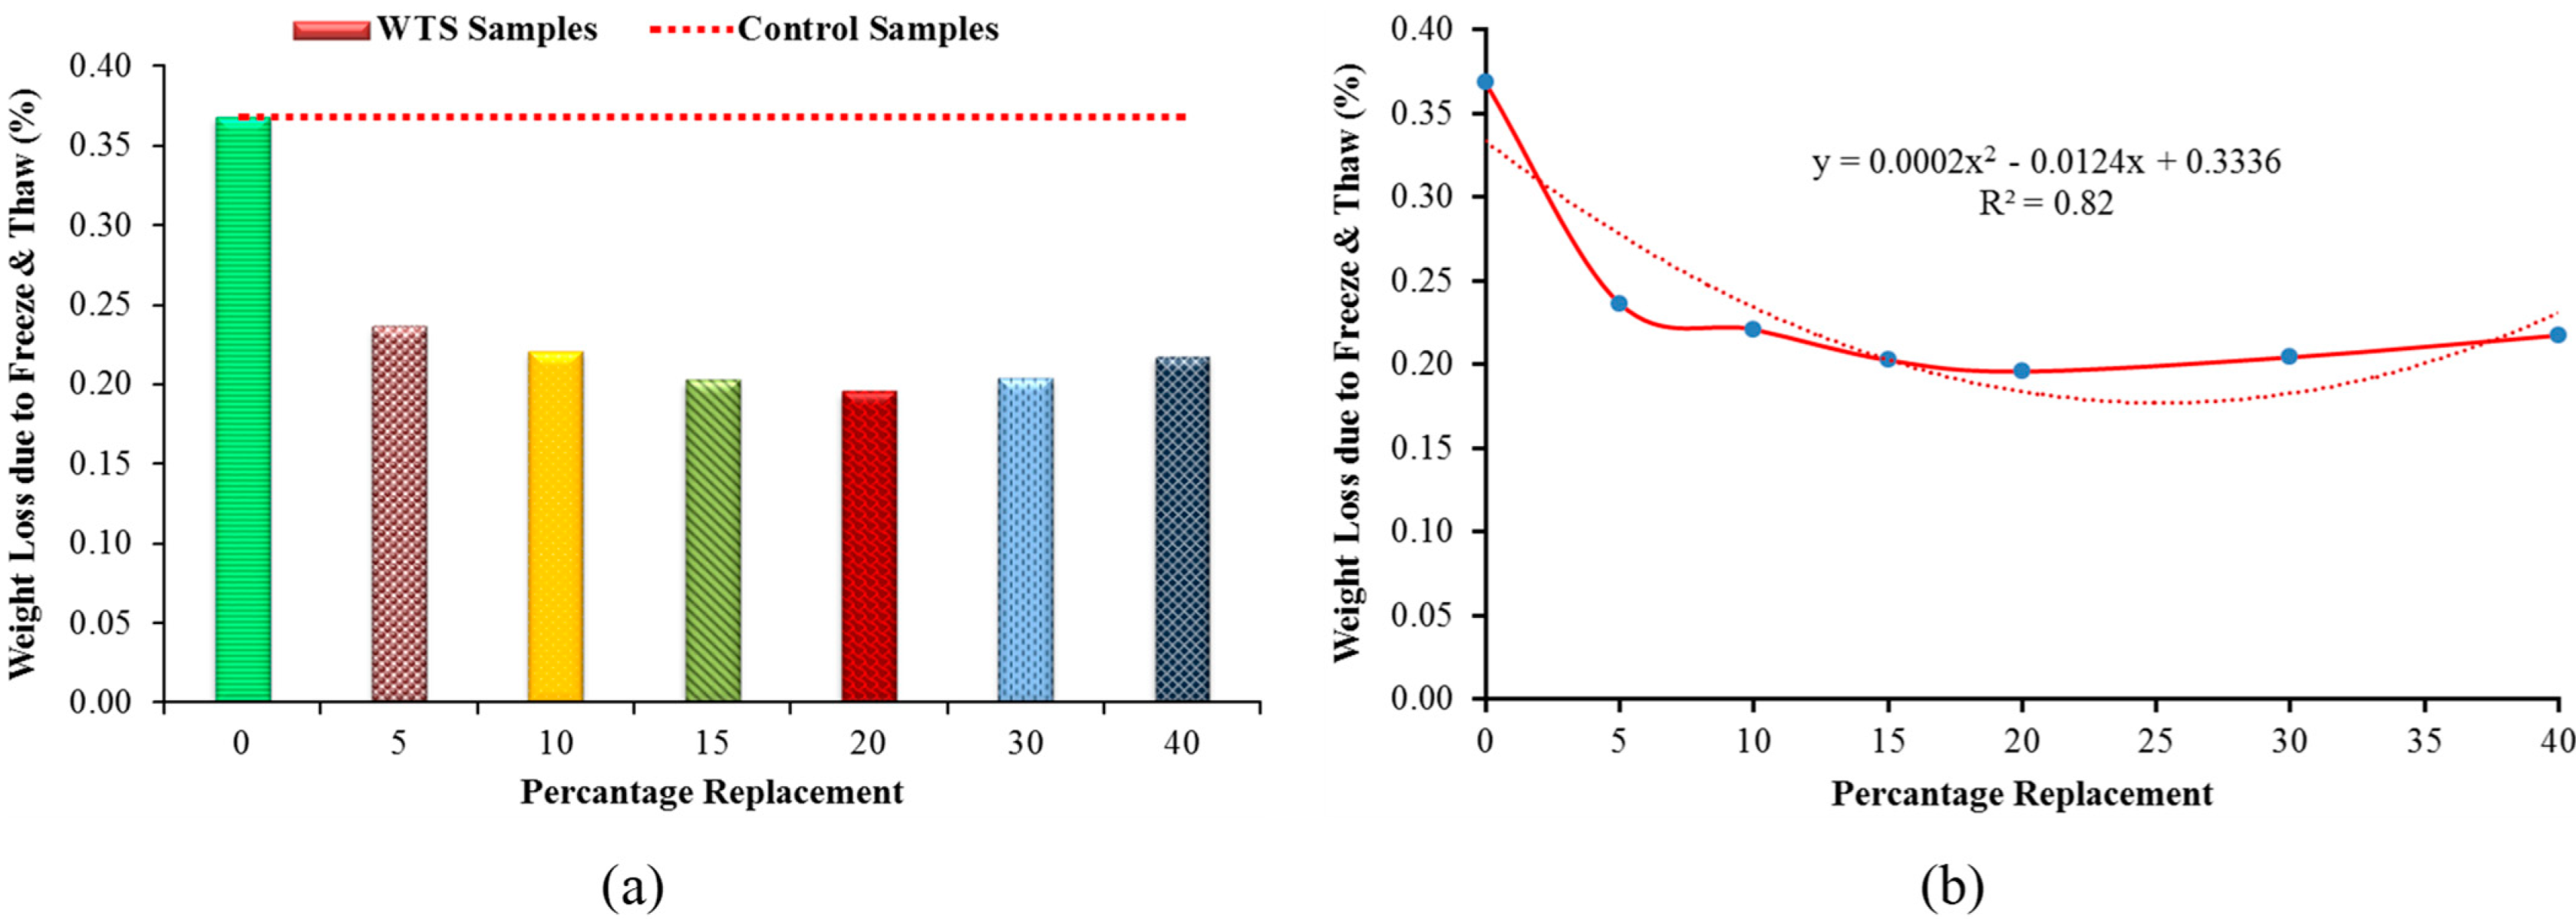
6.10. Freeze and Thaw

The freeze and thaw durability of bricks is influenced by the interaction of used materials and climatic conditions. During the freeze–thaw cycle, the water present in pores freezes and tends to expand. As a result of this expansion, damage to the brick is occurs if the volume of the pores that are expanding is more than the volume of the pores that it is contained within. The experimental outcomes of the weight loss of brick specimens with different dosages of WTS due to freeze and thaw cycles are shown in Figure 15a. It is indicated that the percentage of weight loss decreases with an increase in the percentage of WTS. For all the samples, the percentage of weight loss was less than one. No cracking was observed in any specimen after 50 freeze and thaw cycles. All the brick specimens showed that weight loss was under the ASTM C67 range of 3%. A specimen may be considered a failure if weight loss increments by 3% or it cracks during the freeze and thaw cycle in accordance with ASTM C67. Damage due to freeze and thaw is dependent upon the porosity of the brick specimen. High pore volume specimens exhibited higher stresses, leading to the decreased durability-related properties of the brick.
An empirical Equation (11) was established to assess the weight loss of WTS brick specimens owing to freeze and thaw cycles, as shown in Figure 15b. The R2 is equal to 82%, indicating that the empirical findings are in excellent agreement with the experimental data.
y = 0.0002 x 2 0.0124 x + 0.3336

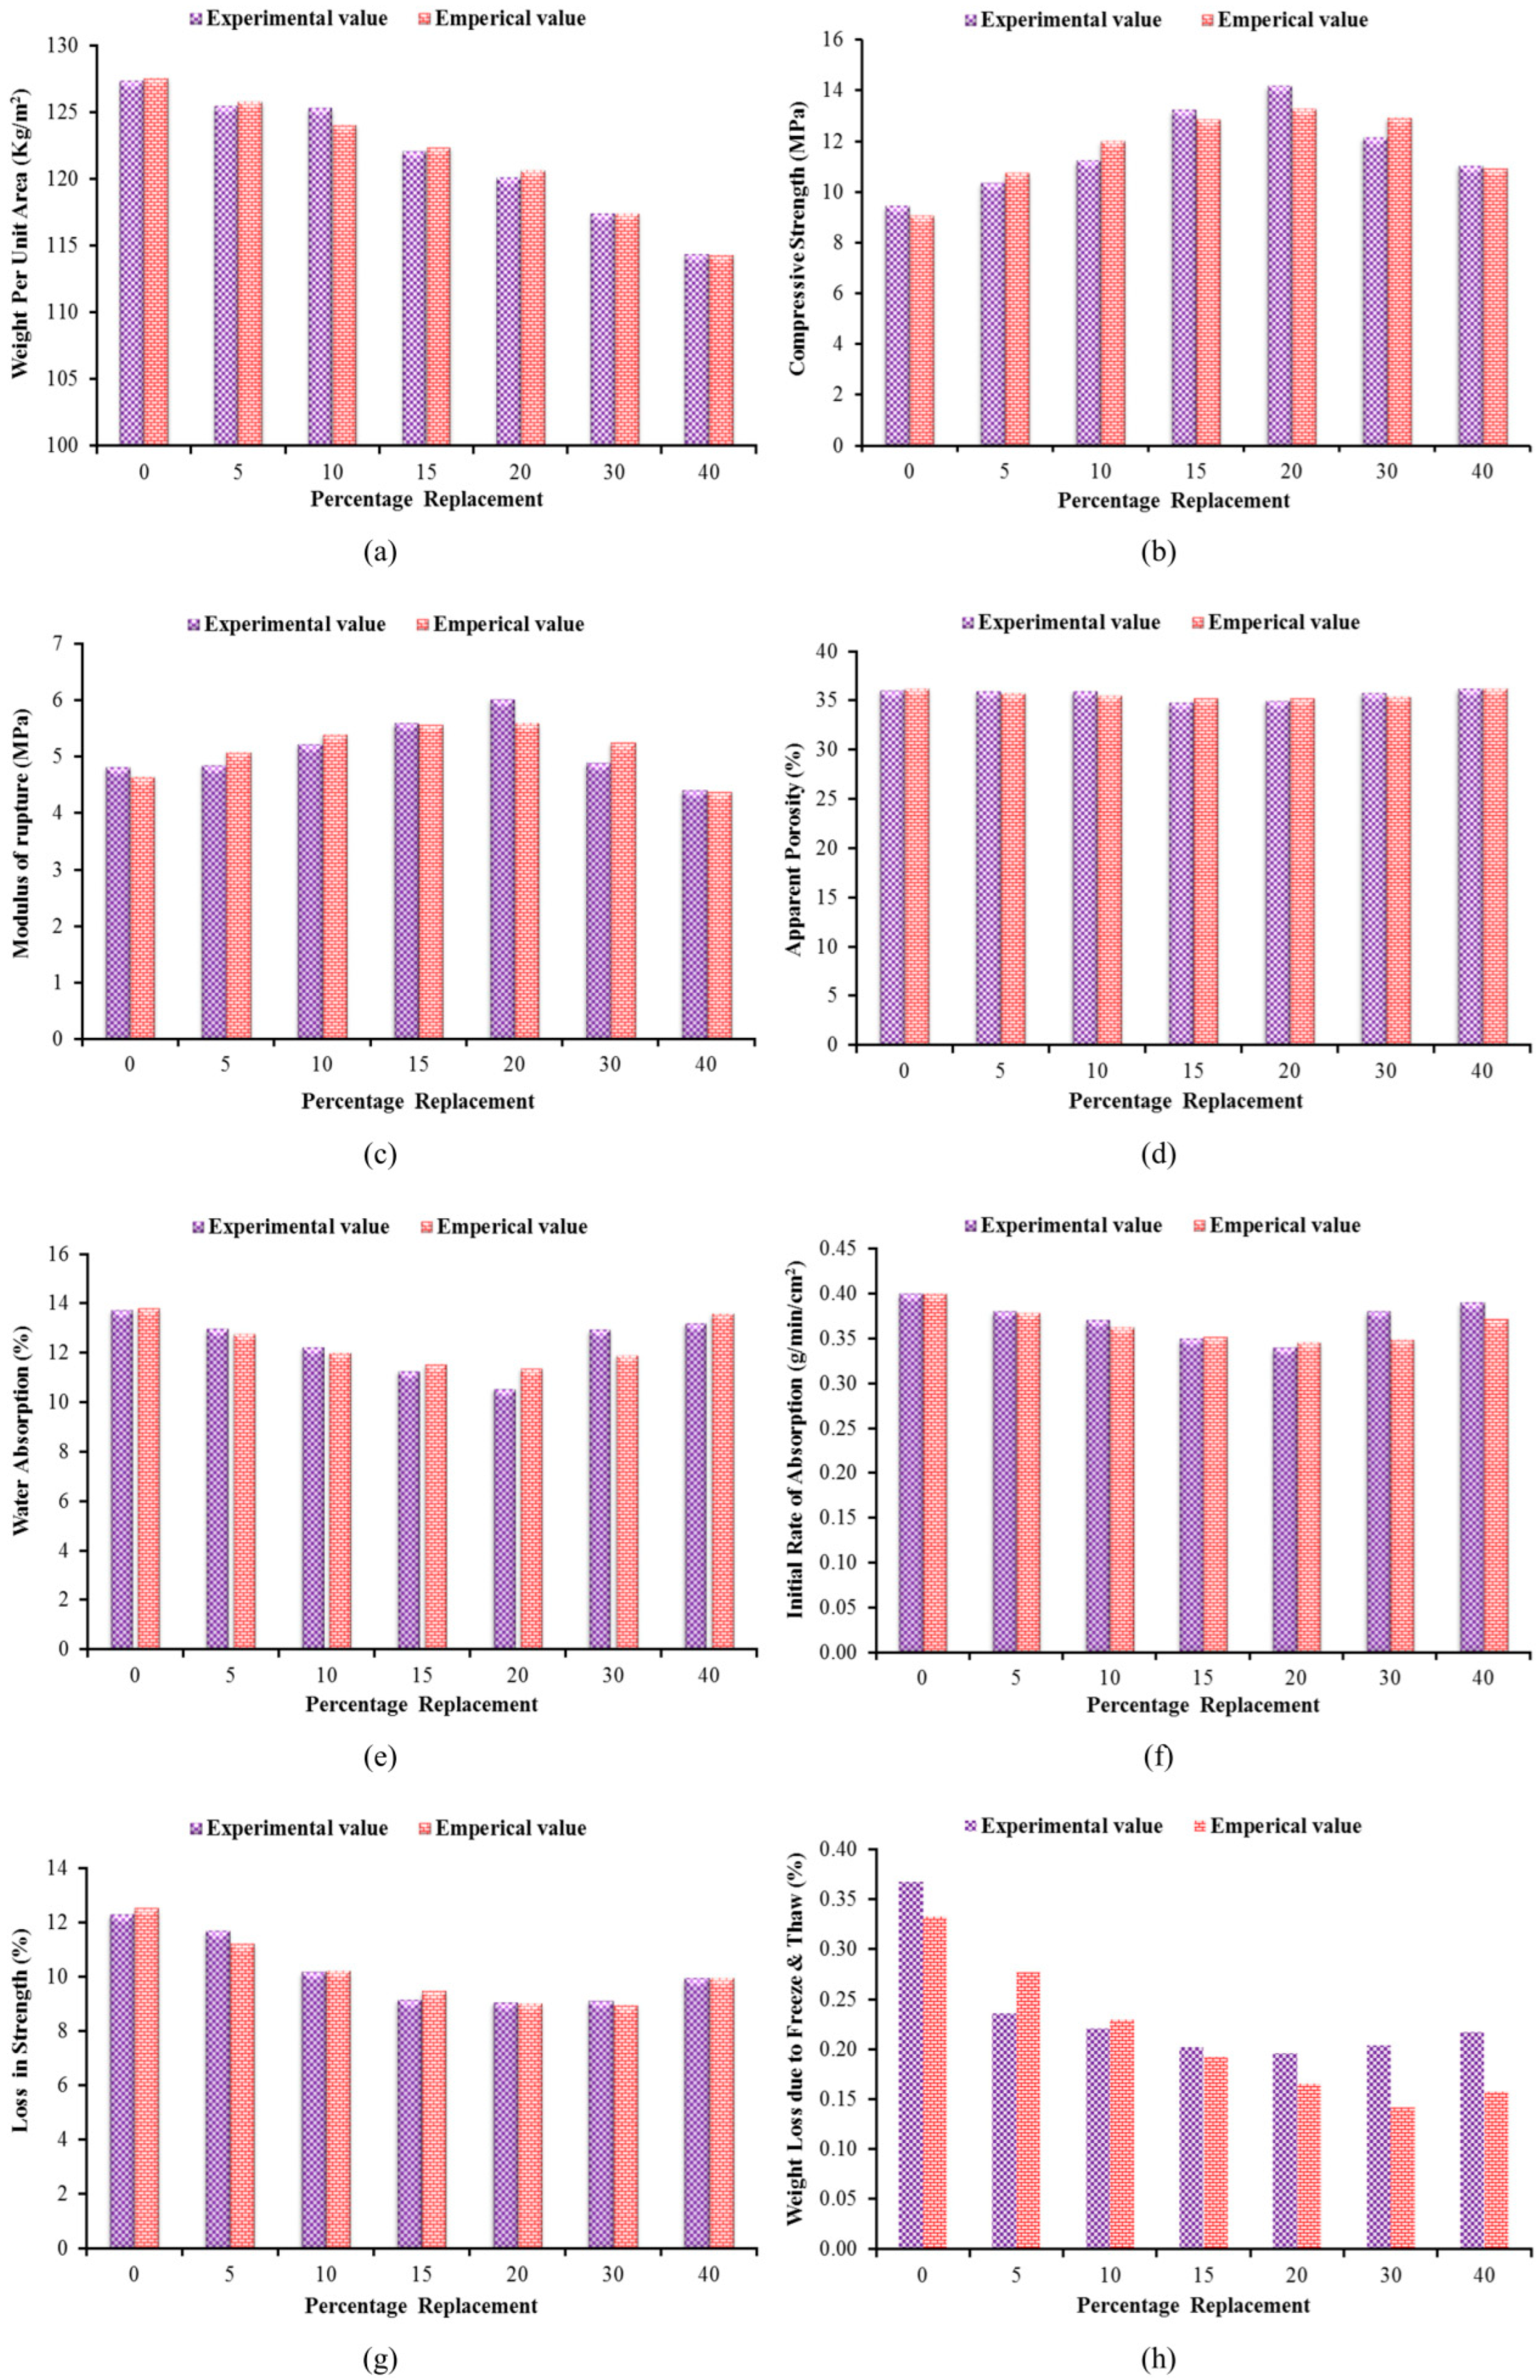
7. Experimental versus Empirical Results

The experimental and empirical results were compared to evaluate the properties of the WTS-incorporated bricks. Figure 16a shows a graphical representation of the weight per unit area results. Statistical errors of −0.99% to 0.49% was observed. The comparison of the experimental results and empirical results of the compressive strength of WTS bricks is given in Figure 16b. Errors ranged from −6.34% to 6.80%. The weight per unit area and compressive strength results calculated from the empirical equations were very good based on the experimental results. The modulus of rupture of the WTS bricks, which were obtained experimentally and empirically, is shown in Figure 16c. Errors ranged from −7.08% to 7.45%. Figure 16d presents the results comparison of the apparent porosity of the WTS bricks and the difference in the results ranged from −1.31% to 7.73%. The experimental and empirical results of the comparison of the water absorption capacity of WTS bricks are presented in Figure 16e. The difference between the results ranges from −7.90% to 1.24%. Figure 16f illustrated the experimental and empirical results of the initial rate of absorption of the WTS bricks. The difference in the results ranged from −8.26% to 1.64%. Figure 16g shows the comparison of the experimental and empirical results of the compressive strength reduction of the WTS-incorporated bricks due to the sulfate attack. The difference in results for strength reduction ranges from −3.95% to 3.46%. The experimental results of weight loss due to the freeze and thaw action of WTS bricks are compared with the empirical results in Figure 16h. Overall, the empirical equations’ findings were extremely close to the experimental results, as shown by the highest error level.

8. Conclusions

In the current study, various properties for the characterization of burnt clay bricks produced using different dosages of WTS were explored. The potential use of WTS to partly replace conventional clay in the manufacturing process of burnt clay brick can be an efficient method of utilizing the final disposal of abundantly available waste. The use of recycled waste will lead to the protection of fertile soil and an improvement in the characteristics of burnt clay bricks. Furthermore, the experimental results of this study were compared and we found similar results to the experimental results of other papers.
  • The WTS can act as a filler material for the fabrication of recycled lightweight bricks. It was evident from the results that 5% to 12% lightweight bricks can be produced utilizing 20% WTS as a replacement for clay. The total dead load of the structure can be decreased due to a decrease in the weight of clay bricks, which would reduce the cost of the finished structure;
  • The compressive and flexural strengths of bricks increased with the increased replacement level of WTS up to 20% by clay weight. Clay bricks incorporating WTS satisfied the limits suggested by the local building code. Furthermore, all the brick specimens incorporated with WTS satisfied the lower threshold value of the modulus of rupture (i.e., >0.65 MPa);
  • The porosity of brick specimens incorporating WTS was reduced as compared to the control brick specimen, leading to a reduction in water absorption capacity. The water absorption showed by bricks incorporating 5% of WTS was determined to be less than 14%; therefore, these bricks can be used as a severe-weather-resistant material. The IRA shown by all the tested bricks was higher than 0.15 g/min/cm2; therefore, these bricks require saturation before their use in construction;
  • The use of WTS (20% replacement) increased the resistance against sulfate attacks. Furthermore, the efflorescence properties were also enhanced due to the incorporation of WTS in the production of bricks. Additionally, experiments revealed that the freeze and thaw resistance was improved for bricks with WTS.
Based on the conducted experimental results, it can be argued that the incorporation of WTS in burnt clay bricks can enhance the engineering properties of bricks. For effective results, a 20% replacement of clay with WTS can be considered as the optimum replacement level. Furthermore, it is recommended to conduct a future study on the behavior of structural components (i.e., wall panels) fabricated with WTS bricks for the confirmation of more durable and economical masonry construction.

Author Contributions

F.A. and S.A.: conceptualization, original draft writing, and validation; S.A.: supervision; W.A., S.A., A.S., A.A., D.S., M.S. and M.M.S.: review and editing, data curation, and review; S.A. and W.A.: project administration and supervision; D.S. and F.A.: formal analysis and investigation; M.S.: analysis; M.M.S.: analysis and investigation. All authors have read and agreed to the published version of the manuscript.

Funding

This research received no external funding.

Institutional Review Board Statement

Not applicable.

Informed Consent Statement

Not applicable.

Conflicts of Interest

The authors declare no conflict of interest.

References

  1. EurEau. Wastewater Treatment-Sludge Management. 2021, pp. 1–32. Available online: https://www.eureau.org/resources/briefing-notes/5629-briefing-note-on-sludge-management/file (accessed on 12 March 2021).
  2. Venkatesan, A.K.; Done, H.Y.; Halden, R.U. United States National Sewage Sludge Repository at Arizona State University—A New Resource and Research Tool for Environmental Scientists, Engineers, and Epidemiologists. Environ. Sci. Pollut. Res. 2015, 22, 1577–1586. [Google Scholar] [CrossRef] [Green Version]
  3. Yang, G.; Zhang, G.M.; Wang, H.C. Current state of sludge production, management, treatment and disposal in China. Water Res. 2015, 78, 60–73. [Google Scholar] [CrossRef] [PubMed]
  4. Murtaza, G.; Zia, M.H. Wastewater Production, Treatment and Use in Pakistan. In Proceedings of the Second Regional Workshop of the Project ‘Safe Use of Wastewater in Agriculture, New Delhi, India, 16–18 May 2012. [Google Scholar]
  5. Ramadan, M.O.; Fouad, H.A.; Hassanain, A.M. Reuse of Water Treatment Plant Sludge in Brick Manufacturing. J. Appl. Sci. Res. 2008, 4, 1223–1229. [Google Scholar]
  6. Mageed, A.A.; Rizk, S.A.; Abu-Ali, M.H. Utilization of water treatment plants sludge ash in brick making. J. Eng. Sci. 2011, 39, 195–206. [Google Scholar] [CrossRef]
  7. Djangang, C.N.; Kamseu, E.; Elimbi, A.; Lecomte, G.L.; Blanchart, P. Net-Shape Clay Ceramics with Glass Waste Additive. Mater. Sci. Appl. 2014, 5, 592–602. [Google Scholar] [CrossRef] [Green Version]
  8. Liang, C.; Le, X.; Fang, W.; Zhao, J.; Fang, L.; Hou, S. The Utilization of Recycled Sewage Sludge Ash as a Supplementary Cementitious Material in Mortar: A Review. Sustainability 2022, 14, 4432. [Google Scholar] [CrossRef]
  9. Chiang, K.Y.; Chien, K.L.; Hwang, S.J. Study on the characteristics of building bricks produced from reservoir sediment. J. Hazard. Mater. 2008, 159, 499–504. [Google Scholar] [CrossRef]
  10. Heniegal, A.M. Study on properties of clay brick incorporating sludge of water treatment plant and agriculture waste. Case Stud. Constr. Mater. 2020, 13, e00397. [Google Scholar] [CrossRef]
  11. Weng, C.H.; Lin, D.F.; Chiang, P.C. Utilization of sludge as brick materials. Adv. Environ. Res. 2003, 7, 679–685. [Google Scholar] [CrossRef]
  12. Bubalo, A.; Vouk, D.; Stirmer, N.; Nad, K. Use of Sewage Sludge Ash in the Production of Innovative Bricks—An Example of a Circular Economy. Sustainability 2021, 13, 9330. [Google Scholar] [CrossRef]
  13. Saboya, F.; Xavier, G.C.; Alexandre, J. The use of the powder marble by-product to enhance the properties of brick ceramic. Constr. Build. Mater. 2007, 21, 1950–1960. [Google Scholar] [CrossRef]
  14. A. C67-18, Standard Test Methods for Sampling and Testing Brick and Structural Clay Tile, ASTM Int. West Conshohocken, PA, USA. 2009, Volume 04, pp. 1–12. Available online: https://www.astm.org/c0067_c0067m-21.html (accessed on 10 January 2022).
  15. Tay, J. Bricks Manufactured from Sludge. J. Environ. Eng. 1987, 113, 278–284. [Google Scholar] [CrossRef]
  16. Singh, S.K.; Kulkarni, S.; Kumar, V.; Vashistha, P. Sustainable utilization of deinking paper mill sludge for the manufacture of building bricks. J. Clean. Prod. 2018, 204, 321–333. [Google Scholar] [CrossRef]
  17. Basic Search—ProQuest. 2013. Available online: https://www.proquest.com/?accountid=135034 (accessed on 12 March 2021).
  18. Azrizal, M.F.; Noorsuhada, M.N.; Latif, M.F.P.M.; Arshad, M.F.; Sulaiman, H. The properties of wastepaper sludge ash and its generic applications. J. Phys. 2019, 1349, 012087. [Google Scholar] [CrossRef]
  19. Nithiya, R.; Chris, A.L.; Vinodh, K.R.; Anbalagan, C. Experimental investigation on bricks by using various waste materials. IJLTET 2016, 6, 395–402. Available online: https://scholar.google.com/scholar?hl=en&as_sdt=0%2C5&q=Experimental+investigation+on+bricks+by+using+various+waste+materials&btnG= (accessed on 3 December 2021).
  20. Liew, A.G.; Idris, A.; Wong, C.H.K.; Samad, A.A.; Noor, M.J.M.M.; Baki, A.M. Incorporation of sewage sludge in clay brick and its characterization. Waste Manag. Res. 2004, 22, 226–233. [Google Scholar] [CrossRef]
  21. Martínez-García, C.; Eliche-Quesada, D.; Pérez-Villarejo, L.; Iglesias-Godino, F.J.; Corpas-Iglesias, F.A. Sludge valorization from wastewater treatment plant to its application on the ceramic industry. J. Environ. Manag. 2012, 95, S343–S348. [Google Scholar] [CrossRef]
  22. Lin, D.-F.; Weng, C.-H. Use of Sewage Sludge Ash as Brick Material. J. Environ. Eng. 2001, 127, 922–927. [Google Scholar] [CrossRef]
  23. Vashistha, P.; Kumar, V.; Singh, S.K.; Dutt, D.; Tomar, G.; Yadav, P. Valorization of paper mill lime sludge via application in building construction materials: A review. Constr. Build. Mater. 2019, 211, 371–382. [Google Scholar] [CrossRef]
  24. Shakir, A.; Naganathan, S. Development of bricks from waste material: A review paper. Aust. J. Basic Appl. Sci. 2013, 812–818. Available online: https://www.researchgate.net/publication/306279418 (accessed on 12 March 2021).
  25. Hidalgo, A.M.; Murcia, M.D.; Gómez, M.; Gómez, E.; García-Izquierdo, C.; Solano, C. Possible Uses for Sludge from Drinking Water Treatment Plants. J. Environ. Eng. 2017, 143, 04016088. [Google Scholar] [CrossRef]
  26. ASTM C20. Standard Test Methods for Apparent Porosity, Water Absorption, Apparent Specific Gravity, and Bulk Density of Burned Refractory Brick and Shapes by Boiling Water. Am. Soc. Test. Mater. 2015, 1–3. Available online: https://www.astm.org/c0020-00r15.html (accessed on 3 December 2021).
  27. Eliche-Quesada, D.; Corpas-Iglesias, F.A.; Pérez-Villarejo, L.; Iglesias-Godino, F.J. Recycling of sawdust, spent earth from oil filtration, compost and marble residues for brick manufacturing. Constr. Build. Mater. 2012, 34, 275–284. [Google Scholar] [CrossRef]
  28. National Engineering Services of Pakistan. Building Code of Pakistan. Available online: https://scholar.google.com/scholar?hl=en&as_sdt=0%2C5&q=National+Engineering+Services+of+Pakistan.+Building+code+of+Pakistan++Seismic+evaluation+studies.+Ministry+of+Housing+and+works%2C+Government+of+Pakistan+2007%2C+Pakistan.+&btnG= (accessed on 3 December 2021).
Figure 1. XRD pattern of the clay.
Sustainability 14 06711 g001
Figure 2. XRD pattern of the WTS.
Sustainability 14 06711 g002
Figure 3. Water treatment plant (a) Sand filter, (b) drying bed, and (c) powder form of WTS.
Sustainability 14 06711 g003
Figure 4. SEM images of clay and WTS (20 µm). (a) SEM images of WTS, (b) SEM images of clay.
Sustainability 14 06711 g004
Figure 5. Mixing of raw materials. (a) Clay mixed with WTS, (b) addition of water, (c) wet mixing, (d) wooden mold.
Sustainability 14 06711 g005
Figure 6. Brick fabrication process. (a) Marked bricks, (b) drying of casted bricks.
Sustainability 14 06711 g006
Figure 7. Immersion of bricks in a sulfate solution.
Sustainability 14 06711 g007
Figure 8. Weight per unit area of bricks producing WTS. (a) Experimental results, (b) emperical results.
Sustainability 14 06711 g008
Figure 9. Effect of WTS waste on compressive strength of bricks. (a) Experimental results, (b) emperical results.
Sustainability 14 06711 g009
Figure 10. Modulus of rupture test for bricks producing WTS. (a) Experimental result, (b) emperical results.
Sustainability 14 06711 g010
Figure 11. Apparent porosity test results for bricks producing WTS. (a) Experimental results, (b) emperical resuts.
Sustainability 14 06711 g011
Figure 12. Effect of WTS on water absorption. (a) Experimental results, (b) emperical results.
Sustainability 14 06711 g012
Figure 13. Initial rate of absorption for tested bricks. (a) Experimental results, (b) emperical results.
Sustainability 14 06711 g013
Figure 14. Reduction in strength and weight gain due to sulfate attack. (a) Experimental results, (b) emperical results of strength loss, (c) emperical results of weight gain.
Sustainability 14 06711 g014
Figure 15. Weight loss due to freeze and thaw after 50 cycles. (a) Experimental results, (b) emperical results.
Sustainability 14 06711 g015
Figure 16. A comparison of the experimental results and empirical results for: (a) weight per unit area, (b) compressive strength, (c) modulus of rupture, (d) apparent porosity, (e) water absorption, (f) initial absorption rate, (g) loss in compressive strength due to sulfate attack, (h) weight gain due to sulfate attack.
Sustainability 14 06711 g016
Table 1. Tested WTS mixtures.
Sr. #WTS ProportionsNumber of Specimens
10%60
25%60
310%60
415%60
520%60
630%60
740%60
Table 2. Chemical composition of used clay and WTS.
ElementSiO2MgOCaOAl2O3Fe2O3ClSO4LOISpecific Gravity
Clay (%)84.440.8304.253.100.0840.00140.01104.782.20
WTS (%)76.5302.1803.7205.9101.650.00170.001606.481.62
Table 3. Heavy metal analysis of clay and WTS.
Element mg/LClayWTPSUSEPA Limits (USEPA 1992)
Pb0.9151.6435
Ni0.7252.34515
Cr0.6350.4235
Zn4.455.1725
Cu1.020.75315
Table 4. Quantities of materials required.
Sludge PercentageClay (kg)Water Treatment Plant Sludge (kg)
0%2100
5%199.510.5
10%18921
15%178.531.5
20%16842
30%147.263
40%12684
Publisher’s Note: MDPI stays neutral with regard to jurisdictional claims in published maps and institutional affiliations.

