Article

Prediction of the Height of Water-Conductive Fractured Zone under Continuous Extraction and Partial Backfill Mining Method—A Case Study

1
Key Laboratory of Deep Coal Resources Mining, China University of Mining and Technology, Ministry of Education, Xuzhou 221116, China
2
School of Energy, Xi’an University of Science and Technology, Xi’an 710054, China
*
Author to whom correspondence should be addressed.
Sustainability 2022, 14(11), 6582; https://doi.org/10.3390/su14116582
Submission received: 11 April 2022 / Revised: 24 May 2022 / Accepted: 25 May 2022 / Published: 27 May 2022
(This article belongs to the Topic Green Mining)

Abstract

:
Longwall backfill mining effectively mitigates the height of water-conductive fractured zone (HWCFZ), preventing it from reaching the overlying aquifer and thus preserving the groundwater. However, it has the disadvantages of insufficient filling time and space as well as the mutual constraints between filling and mining. A novel continuous extraction and partial backfill (CEPB) water-preserving mining method was therefore proposed. The analytic hierarchy process (AHP) method was employed to identify the factors affecting the HWCFZ of CEPB, and five main factors, namely, the hard-rock lithology ratio, mining height and depth, and the width of the Wongawilli and protective block, were determined based on the weight distribution. UDEC software was used to establish a numerical model to simulate the HWCFZ under five factors. By using a multiple linear regression analysis of the numerical simulation results, a model for predicting the HWCFZ was established. It was applied in a colliery of the Yu-Shen mining area, and the HWCFZ was 57.7 m, 9% higher than that of borehole television logging of 53.1 m from the field measurement, indicating its rationality. Subsequently, the model was generalized and applied to the whole mining area, and the thematic map of the HWCFZ and the protective zone thickness of CEPB and longwall caving mining were obtained. The criterion for water-preserving mining based on the equivalent permeability coefficient of the protective zone is then proposed, which can provide guidance for the mining parameters optimization of the CEPB.

1. Introduction

Because the coal resources in eastern regions are on the verge of depletion, the focus of coal extraction has gradually shifted to the ecologically fragile mining areas in Northwest China [1,2,3]. The coal reserves in northwest regions make up nearly 70% of the country’s total, while the water resources are scarce, accounting for only 3.9% of the country’s total. Large-scale and high-intensity mining activities have resulted in severe migration and breakage of overburden and the development and propagation of water-conductive fractures. When it reaches the overlying aquifer, a series of ecological environment degradation problems such as water-table lowering, vegetation withering, and land desertification will occur [4,5,6,7]. Discerning how to predict the HWCFZ accurately and realize the coordinated development of coal resources exploitation and water resources preservation presents an urgent problem to be solved [8,9].
Several water-preserving mining methods have been put into implementation to lower the HWCF and block water-diversion channels, such as longwall backfill mining, strip mining, room and pillar mining, curtain grouting, and overburden bed-separation grouting [10,11,12,13,14]. The first one is currently the most effective mining method to control overburden movement and fractures development [15]. However, it is confronted with insufficient filling time and filling space as well as the mutual restrictions between extraction and backfill. The roof of the mined-out area subsides and collapses quickly with the coal body being extracted, while it takes a long time for the backfill to reach the designed strength. Hence, the roof cannot be supported in time, and the overburden migration and the fractures development are inevitable, bring difficulty to safe and high-efficiency coal extraction beneath the underground aquifer. In addition, there are mutual constraints between mining and filling processes. In other words, the filling speed affects the process of coal extraction, while the mining equipment maintenance delays the filling process [16,17,18]. It is arduous for them to operate in parallel. Therefore, some authors have put forward a novel continuous extraction and continuous backfill mining method [19,20]. It features a multi-roadway layout as well as parallel operation between extraction and backfill. The method uses roadway skip mining and filling to ensure that there are always coal bodies or filling bodies to support the roof at any moment, contributing to the mitigation of the migration and breakage of the overlying layers and thereby the HWCFZ, and is therefore an effective way to realize coal extraction under water bodies [21,22].
However, during the process of generalizing and applying the mining method in Northwest China, we found that if the distance between the coal seam and the overlying aquifer is great enough, with a relatively thick water-resisting layer between them, the CEPB may also maintain the stability of the hard and thick layer (key stratum) beneath the aquiclude despite the bed separation between the key stratum and its underlying layer occurring. Under this circumstance, the fractures stop developing upward at the key stratum, and the overlying aquifuge can maintain integrity and water-resisting capability [23]. In other words, under certain geological conditions, the CEPB can not only effectively constrain the HWCFZ and realize water-preserving coal mining but also ameliorate the problems of scarce filling materials and high filling cost to a certain extent [24]. However, the mining-induced disturbance and overburden migration intensifies with the decreasing filling rate, and the probability of overburden failure and instability increases, which will also promote the development of the water-diversion fractures. If the water-flowing fractures develop to the overlying aquifer, it will not only lead to water resources loss, but also may trigger mine water inrush disaster. Hence, it is crucial to accurately predict the HWCFZ under various engineering and hydrogeological conditions as well as different mining parameters of CEPB, so as to realize water-preserving coal mining in the dual sense of ecology and economy.
In-depth research on the WCFZ and water-preserving coal mining has been conducted at home and abroad. Although foreign experts have not defined the concept of water-preserving mining systematically, they have done large amounts of work on coal extraction under water bodies and argued that the surface and groundwater should be regarded as environmental constraints of longwall coal mining [25,26,27]. Water environments and the hydrologic effects induced by coal extraction have been investigated and assessed in various foreign collieries [28,29,30,31,32,33]. Research on sustainable development and management of groundwater resources for water-preserving mining is also popular among coal mines abroad [34,35]. In addition, they have divided the overburden into the caved zone, the interconnected fractured zone, the unconnected fractured zone, the micro-fracture zone, and the fracture-free zone. The combined range of the caved zone and the interconnected fractured zone is named WCFZ, where water can percolate and flow through from the overlying aquifer to the gob [36,37]. They have also illustrated the characteristics of WCFZ from the perspectives of permeability, water flow, and the height of destressed zone [38,39].
Domestic experts have studied the developing mechanism of water-flowing fractures and water-preserving coal mining by means of analogue simulation, mechanical modeling, and mathematical method. Fan Limin put forward the concept of water-conservation coal mining and believed that the groundwater level can be preserved by mitigating the mining disturbance of overburden and lowering the HWCFZ. If the sufficient thickness of the protective zone between the overlying water bodies and WCFZ can be guaranteed, the groundwater can be blocked and prevented from penetrating into the gob [40,41]. Liu Shiliang et al. studied the HWCFZ in shallow and deep coal seams by means of multiple regression analysis, GIS, and borehole television logging [42,43,44,45,46,47,48,49]. Huang Qingxiang put forward the concepts of upward and downward fracture and studied the formation, distribution, and evolution of fractures [50,51]. Miao Xiexing et al. investigated the HWCFZ in extremely thick coal seams from the perspectives of key stratum, arch structure, overburden lithology, and soil–rock composite structure [52,53,54,55,56,57]. Zhang Jixiong et al. studied the relationships among the HWCFZ, the filling rate, and the mining height under longwall solid backfill mining and proposed a formula for estimating the HWCFZ [58,59,60]. Guo Wenbing analyzed the failure transmission process of overburden in high-intensity mining and established a mechanical model of unsupported rock and cantilever rock for predicting the HWCFZ [61]. Wu Qiang et al. obtained the prediction formula of the HWCFZ with due regard to different mining parameters, including the inclination, mining height, the buried depth of coal seam, the length and advancing length of working face, as well as the overburden lithology [62,63]. Wang Fangtian and Xu Zhimin studied the development law of mining-induced water-conductive fractures under gullies and reservoirs, respectively [64,65]. Zhang Yun and Deng Xuejie studied the development mechanism of WCFZ under the conditions of shortwall block mining and upward slicing longwall-roadway cemented backfill mining by using UDEC software and mechanical analysis, respectively [66,67,68]. Hou enke proposed a predicting formula for WCFZ based on genetic-algorithm support-vector-machine method [69]. Lian analyzed the main geological and mining factors affecting the development of ground cracks [70].
The above research has laid a solid foundation and enriched the framework for the investigation of HWCFZ. However, the research object is the HWCFZ in longwall working face, and the prediction of the HWCFZ of CEPB mining method has not been reported. There are many factors affecting the HWCFZ of CEPB. To establish an estimation model for the HWCFZ under the influence of multiple factors, the main controlling factors must be determined, and the minor factors should be laid aside. The comprehensive evaluation methods, including the AHP, Delphi method, weighted averages, fuzzy comprehensive evaluation, principal component analysis, and BP neural network method, are the most commonly employed methods to tackle complex problems affected by various indicators [15,71].
The AHP is widely employed to conduct multi-criteria decision analyses and thus evaluate the groundwater potentiality in low desert lands and semi-arid regions [72,73]. The AHP is usually used by combining other methods such as GIS, frequency ratio, and certainty factor models to plot the zoning map of groundwater probability index [74,75,76,77]. It is also of great significance to identify the potential groundwater recharge sites [78]. AHP combined with geospatial techniques can be employed to delineate the potential zones of groundwater [79]. Moreover, it can be utilized to assess the impact of hydro-geological environment on availability of groundwater [80]. On top of being used to evaluate the hydrochemical characteristics and water quality of groundwater [81], AHP can also be employed to assess the development of macro- and micro-cracks and fractures under different conditions by combining it with other research methods [82]. For instance, it can be used to predict the ground fracturing and compound-mode crack propagation law of the roadway under impact loading [83,84,85]. Furthermore, water-conductive fractures of overlying strata are induced by the fact that the deformation and stress of the stratum exceed its critical values. AHP can also be utilized to assess the mining-induced stress field and the movement of overburden, so as to better study the water-conducting fracture [86,87,88,89].
In this paper, AHP will be employed to construct a triple-level model to identify the factors affecting the HWCFZ of CEPB and obtain the main controlling factors. The influencing mechanisms of hard-rock lithology ratio, mining height and buried depth of coal seam, and the width of Wongawilli block and protective block on the HWCFZ will be illustrated by utilizing UDEC numerical simulation software. A prediction model of the HWCFZ of CEPB will be then established by using multiple regression analysis of the numerical results. Subsequently, the model will be generalized and applied in the whole Yu-Shen mining area after its rationality and validity is verified by field measurement. The thematic map of the HWCFZ and the thickness of protective zone will be obtained. Moreover, based on the equivalent permeability coefficient of the protective zone, a criterion for water-preserving mining will be proposed. The research results can provide theoretical basis and guidance for the layout of working face and the optimization of mining parameters of CEPB, which is conducive to realizing water-preserving coal mining on the premise of economic maximization.

2. CEPB Water-Preserving Coal Mining Method

The CEPB water-conservation mining method is proposed by combining the advantages of Wongawilli fast mining and roadway skip mining. The three-dimensional conceptual diagram is shown in Figure 1. Taking the protective block with three mining phases as an example, the specific mining process of CEPB is illustrated in Figure 2.
Prior to coal extraction and filling, the entire mining panel is firstly divided into several mutually spaced protective blocks (P1, P2, P3,…, Pn) and Wongawilli mining blocks (m1, m2, m3,…, mn) along the strike direction. As shown in Figure 2b,d, in order to overcome the problems of mutual restrictions and achieve parallel operations between extraction and backfill, the mining roadways (MRs) in the protective block are extracted and backfilled at intervals. The MR is filled immediately once it is extracted, and the MR in the next protective block is mined at the same time, forming a parallel operation mode of mining and filling. After all coal bodies in the MRs of the first stage are replaced with filling bodies, the MRs in the second phase will be extracted and backfilled. Coal extraction of the Wongawilli mining block is then carried out after all coal bodies in the protective block are replaced with filling bodies, as shown in Figure 2e,g. It is worth noting that the Wongawilli block is only extracted without being backfilled. At the moment, the filling body of the protective block that has reached the design strength acts as the isolation coal pillar to support the roof and constrain the migration of the overlying layers. Bolt support, which is indispensable for the MRs of the protective block, is unnecessary for the chambers of the Wongawilli block. Therefore, the width of the protective block is usually narrower than that of Wongawilli block, since the support process will delay the mining progress and lower the mining efficiency.
The coal-extracting technology and the equipment for CEPB are illustrated in Figure 3. As Figure 3a shows, coal mining and loading of the Wongawilli and protective block are completed by the continuous mining machine, and then the coal is transported to the continuous conveyor using shuttle car by intermittent transportation. After that, the coal body is shifted to the shaft station by scraper conveyor. Additionally, the bolt installation of roof of the MR in the Wongawilli and protective block is completed by hydraulic drill. The sealing of MRs in the protection block, the layout of filling pipeline, and the filling effect of MR are shown in Figure 3b. The equipment employed for the coal extraction of Wongawilli mining block is the same as that for the protection block, as illustrated in Figure 3c.

3. Factors Identification and Weights Determination of the HWCFZ of CEPB

3.1. Identification of the Influencing Indicators

The AHP method establishes the judgment matrix by comparing the relative importance of two indexes and then obtains the weights distribution by calculating the maximum eigenvalue and corresponding eigenvector of the judgment matrix. It combines qualitative and quantitative analysis methods and can identify the main controlling factors from many complicated indicators on the basis of the weights distribution [4]. The influential factors of HWCFZ of CEPB are complex and hierarchical, reaching a good agreement with the features of AHP capable of resolving many multi-leveled problems. Therefore, they were employed to construct a triple-leveled model so as to identify the indicators affecting the HWCFZ and discern their degrees of importance. In the AHP model, 3 factors were selected as secondary indicators, i.e., overburden system, mining system, and backfill system. Meanwhile, 10 indexes, namely, hard-rock lithology ratio, the thickness and the buried depth of coal seam, the width of the Wongawilli and protective block, and the compression amount of the backfill, were chosen as tertiary factors, as illustrated in Figure 4 [90,91].
(1)
Overlying strata system
The overburden lithology exerts significant impact on the development of water-diversion fractures. For the overlying stratum with hard-rock lithology, the sudden overburden migration is prone to causing the development and propagation of cracks in a wide range, since it is brittle and tends to be broken easily. By contrast, the soft rock formation is liable to sink as a whole with the advance of mining, which is conducive to the compaction and closure of the fractures and thereby lowering the HWCFZ.
The estimation of HWCFZ using empirical formulas from the current norms needs to classify the overburden rocks into hard, medium-hard, weak, and extremely weak ahead of time based on uniaxial compressive strength, which is complex and cannot reflect the stratigraphic structure. Hence, the hard-rock lithology ratio Rh proposed by Hu Xiaojuan was modified to represent them [63]. In this paper, the Rh is defined as the ratio of the thickness of the hard-rock strata to the overburden’s total. Hard rock refers to fine sandstone, medium sandstone, coarse sandstone, migmatite, igneous rock, etc.
R h = i = 0 i = m h i / H
In this equation, H is the total thickness of the overburden, m; hi is the thickness of the ith overlying layer, m; m is the number of the hard rock.
Note that Rh ranges from 0 to 1. Rh = 0 suggests that the overburden lithology is extremely soft, while Rh = 1 indicates extremely stiff overlying strata. The index Rh can be calculated and determined by borehole histogram.
Additionally, when water-softened rocks are soaked by water, their strength becomes lower and the plastic strain property is enhanced and tends to argillization, giving rise to fracture closure and the improvement of capability of resisting water seepage. Furthermore, the argillized and fragmented particles of soft rocks are inclined to migrate with the water flow, which is advantageous to blocking the water-conducted channel generated by the underlying strata and prevent the water-flowing fractures from developing upward. On the other hand, the soft rock formation with good dilatability expands significantly when encountering water, and it is beneficial to the re-closing of the fractures. Hence, although mining-induced water-diversion fractures go through the entire stratum, it may become unconnected and non-penetrating due to dilatability.
(2)
Coal mining system
Mining height is one of the most crucial factors affecting the development of HWCFZ of CEPB. A higher mining height denotes a greater degree of mining-induced disturbance of the overlying layers and thereby a higher HWCFZ. Moreover, the breakage of basic roof and the degree to which water-conducted fractures develop depends directly on the width of the Wongawilli block, and it is therefore an indispensable indicator for estimating the HWCFZ. The large span of the Wongawilli block is prone to causing the maximum stress or deformation of a basic roof by exceeding its ultimate values, contributing to overburden breakage and the growth of HWCFZ. Furthermore, the protective block is divided into several MRs, and the mining-induced disturbance of overlying layers from each MR is small due to its limit span. The greater the number of MRs is, the smaller the overburden loading shared by the filling body in the protective block, which is more conducive to mitigating the overburden movement and the propagation of water-diversion fractures. As a result, the span of the protective block is also a vital indicator that should be taken into consideration during the investigation of HWCFZ. In addition, the MRs in the protective block need anchoring support, while it is unnecessary for the chambers in the Wongawilli block to be bolted. Therefore, in order to improve the mining efficiency and lower the mining costs, the span of the protection block is generally much smaller than that of the Wongawilli block. Moreover, it is universally acknowledged that the root cause of the fractures’ emergence may be the maximum stress on the rock stratum being greater than its ultimate stress due to stress concentration of the in situ stress. The original rock stress increases with the increasing buried depth, giving rise to the increasing stress grade of the overlying strata. Therefore, the mining depth also makes a significant difference to the development of the HWCFZ.
(3)
Backfill system
The final height of protective block is of great significance for ameliorating roof movement and thereby fractures’ development. The filling body of MRs in different mining phases of the protection block gradually bears the loading and deforming. The ultimate height refers to the mining height minus the final compaction of the filling body and plus the swelling rate of the backfill. As a result, it is primarily affected by the strength of the filling body, the roof subsidence after extraction and before backfill, and the expansion rate of the backfill.

3.2. Weights Distribution

Experts and scholars engaged in water-preserving coal mining method and HWCFZ prediction were invited to assign the weight of each factor based on a scale of 1–9 and the reciprocal scaling method proposed by Thomas. L. Saaty [4]. The following judgment matrixes were constructed according to the feedback given by the experts:
W A B = [ 1 1 / 4 2 4 1 8 1 / 2 1 / 8 1 ] W B 1 C = [ 1 2 4 1 / 2 1 2 1 / 4 1 / 2 1 ] W B 2 C = [ 1 2 4 1 / 2 1 2 1 / 4 1 / 2 1 ] W B 3 C = [ 1 2 3 1 / 2 1 3 / 2 1 / 3 2 / 3 1 ]
Taking an overlying strata system whose matrix is W B 1 C as an example, its maximum eigenvalue was calculated to be 3.0000, and the corresponding eigenvector was W = [0.5714, 0.2857, 0.1429]. Then, the consistency test was conducted by using Equations (2) and (3):
C . I . = ( λ max n ) / ( n 1 )
where C.I. refers to the consistency index; λmax refers to the largest eigenvalue; n refers to the number of elements in the matrix W B 1 C .
C . R . = ( C . I . ) / ( R . I . )
In this equation, C.R. is the consistency ratio; R.I. is the average consistency index.
The relative weights of elements in the matrix should be redistributed under the condition of C.R. ≥ 0.1. Otherwise, the weights distribution was acceptable. The C.R. of the matrix W B 1 C was 0, which is much less than 0.1, indicating the relative weights assigned by the experts were reasonable and scientific.
The weight of the overlying strata is 0.1818. Therefore, the weights of the three third-level indicators included in the overlying strata system are 0.1039, 0.0519, and 0.0259, respectively. The consistency tests of the other matrixes were conducted in the same way, and the final calculation results are listed in Table 1. After finishing the consistency test, the weights distribution of all the influencing factors was obtained, as shown in Table 2.

4. Prediction Model of the HWCFZ While Using CEPB Mining

4.1. Construction of Numerical Calculation Model of the HWCFZ

Universal Discrete Element Program (UDEC), a software program for discrete element modeling, is widely utilized to simulate the behavior of discontinuous media such as fractures or jointed rock masses. Therefore, it was employed to establish a numerical calculation model to simulate the evolution law and distribution characteristics of WCFZ of CEPB under different mining and filling schemes, as shown in Figure 5.
Based on the drilling data of a colliery in Yu-Shen mining area, the overlying layers with similar lithology were merged, and 13 strata were determined from bottom to top. With due consideration of the boundary effect and full mining, the dimensions of the numerical simulation model were designed to be 300 m × 107 m (X × Y). The length of the CEPB mining panel was 120 m, with 90 m coal pillars left unmined on each side of the working face. The left and right sides of the model were fixed in the X direction, and the bottom boundary was fixed in the Y direction. The Mohr-Coulomb model was selected for the coal seam and its underlying and overlying strata, while the double-yield model was employed for the gangue backfill. The mechanical parameters of each stratum were calibrated in 3 steps. Firstly, preliminary assignment was conducted according to the existing mechanical parameters of strata. Subsequently, the stress–strain curves obtained from the laboratory tests of uniaxial compressive strength and numerical simulations of rock specimens of various strata, as well as the failure modes of the specimens in the laboratory tests and the plastic zone distribution of the numerical simulation, were compared. Thirdly, the parameters of the specimen of each stratum were reassigned and optimized repeatedly until the results from indoor test and numerical calculation reached good agreement. The mechanical parameters of the strata are shown in Table 3 and Table 4.
During the simulation process, the height of overburden remains unchanged. For different mining heights, the mining height ascends by appropriately reducing the thickness of floor. The increase in coal seam buried depth is obtained by compensating for the initial stress at the top of the numerical model. According to the in situ stress gradient, the in situ stress grows by 0.25 MPa for every 100 m lower.
The hard-rock lithology ratio is obtained by changing the mechanical parameters of blocks and joints of the overlying layers. The “crack” code was used to set virtual vertical joints every 5 m in the coal seam, and then the “zone model null” code was utilized to extract the coal body in the MR of the protective block. The “zone model dy” code was immediately employed to simulate the strain-hardening property of the gangue backfill of the MR after extraction. The cap pressure and other parameters of the double-yield model are calibrated by the universally acknowledged Terzaghi’s model [71].
σ = E 0 α ( e α ε 1 )
In this equation, E0 is the initial elastic modulus of the solid backfill, and σ and ε are the stress and strain of the gangue backfill, respectively; α is a dimensionless constant.
Note that coal extraction and the previously mined-out area’s backfill are carried out simultaneously during the simulation process. The extracting and filling time and the roof subsidence after excavation and before backfill are not taken into account.

4.2. Distribution Characteristics of the Water-Diversion Fractures

Based on the five main controlling indicators affecting the HWCFZ of CEPB, the HWCFZ was simulated under various mining heights, mining depths, hard-rock lithology ratios, and the width of the Wongawilli and protective block. The orthogonal simulation schemes were listed in Table 5.
The developing mechanism of the water-flowing fractures of CEPB mining is essentially different from that of longwall mining, since their working face layout and mining process are totally distinct. Furthermore, since the filling bodies in various mining phases of the protective block bear the load gradually and are compressed asynchronously, the support role that the protective block plays also differs from that of the protective pillars in strip mining and room and pillar mining [11,12]. A scheme from Table 5 provides an example to illustrate the development and distribution characteristics of water-diversion fractures under CEPB mining. The concrete mining and filling parameters are as follows: the width of the Wongawilli block and protective block are 25 and 15 m, respectively; the hard-rock lithology ratio is 0.4; the mining height and depth is 4.0 and 100 m, respectively. The numerical simulation results for the WCFZ of CEPB are shown in Figure 6.
Based on the analysis illustrated in Figure 6, from bottom to top, the whole overlying strata system can be divided into several zones according to the degree of fractures development, i.e., the connected fractures zone (22 m), the unconnected fractures zone (37 m), and the no-fracture zone (16 m). During the process of numerical simulation, two codes were used, “plot open red” and “plot slip red”. The first code aims to plot the two types of open fractures. The first kind consists of open fractures that occur in the interface between two adjacent overlying layers, owing to the vertical displacement of the lower stratum exceeding the upper one. These sorts of fracture are what are called bed-separation fractures. The second sort consists of open fractures that emerge inside each stratum, due primarily to the tensile stress of interior joints being greater than their ultimate stress. Furthermore, as the word “slip” indicates, the aim of the second code is to plot the internal slip fractures or joints in each rock formation, owing mainly to the shear stress being greater than its shear strength. Moreover, it is interesting that the open fractures are usually in horizontal direction, while the slip fractures are prone to developing in the perpendicular direction. The connected fractures zone refers to the section where the transverse and vertical fractures intersect or, even if there is no intersection and merging, are extremely close to each other. Therefore, the interconnected fractures zone makes it feasible for overlying water bodies to flow through, which is similar to the function of the WCFZ. Under this circumstance, the HWCFZ of CEPB can be defined as the thickness of the connected fractures zone. Hence, the HWCFZ of CEPB is 22 m, 5.5 times the mining height. Moreover, the distance between the overlying aquifer and the top boundary of WCFZ, which is known as a protective zone, makes a crucial difference to water-preserving coal mining. It can be seen that the protective zone, with thickness being 59 m (15 M), includes the aquifuge, the integral strata, and the strata with unconnected fractures.

4.3. Regression Analysis of Single Factors Affecting the HWCFZ

(1)
The HWCFZ corresponding to various mining heights (M)
Figure 7 shows the variation of the HWCFZ with various mining heights. The HWCFZ increases linearly with the growing mining height. The HWCFZ corresponding to the 2.0 m mining height is 30 m, while it ascends to 50 m at 5.5 m mining height, indicating that the rising mining height will further contribute to the development of water-diversion fractures.
(2)
The HWCFZ corresponding to different mining depths (H)
The relationship between the HWCFZ and the burial depth of the coal seam is illustrated in Figure 8. The HWCFZ rises approximately linearly with the increasing mining depth, but the growth rate is limited and restricted. When the mining depth is 100 m, the HWCFZ is 33 m, and it only develops to 38 m with the mining depth rising to 500 m. This suggests that the increase in buried depth will promote the development of WCFZ, while the influence exerted on the HWCFZ is minor. The main reason for this is that the deep buried depth with high in situ stress is liable to result in horizontal unloading of the stratum, contributing to the propagation of fractures. In contrast, the horizontal unloading occurs in a small range, and its influence on the cracks propagation is thus restrained.
(3)
The HWCFZ corresponding to various hard-rock lithology ratios (Rh)
The variation in the HWCFZ with the hard-rock lithology ratio Rh is shown in Figure 9. The HWCFZ grows linearly with the increasing Rh. The HWCFZ rises from 32 m to 46 m, with the Rh varying from 0.2 to 1.0. This indicates that with the Rh rising, vertical and horizontal fractures are inclined to be generated under the joint actions of tensile and shear, contributing to the development of cracks.
(4)
The HWCFZ corresponding to different widths of Wongawilli block (wm)
The relationship between the HWCFZ and the width of the Wongawilli block is shown in Figure 10. The HWCFZ rises with the increase in the span of the Wongawilli block wm, but the growth rate tapers off until reaching a constant. It is obvious that the relation curve between the HWCFZ and wm is nearly a logarithmic function. The HWCFZ ascends sharply when the wm ranges from 15 to 30 m, and subsequently, the rising rate slows down when it varies from 30 to 75 m. Therefore, the adjustment of wm can directly affect the movement of the overlying strata and the development law of the water-conductive fractures when it is small, while it makes nearly no difference to the HWCFZ, since the span is wide enough and similar to the longwall caving mining.
(5)
The HWCFZ corresponding to various widths of the protective block (wp)
As illustrated in Figure 11, the HWCFZ decreases from 62 to 7 m, with the wp rising from 5 to 25 m. There is a negative correlation between the HWCFZ and the width of protective block, suggesting that the width of the filling bodies in the protective block is significant enough to mitigate the overburden movement and lower the HWCFZ.

4.4. Prediction Model of the HWCFZ of CEPB Mining Method

According to the numerical simulation results of the HWCFZ, the relationships between 5 main controlling factors and the HWCFZ were separately fitted, and the 5 functions were obtained. Therefore, a multiple nonlinear regression model was established [63,66]:
H d = φ 0 + φ 1 M + φ 2 H + φ 3 R h + φ 4 ln w m + φ 5 w p ,
where Hd is the HWCFZ of CEPB; M is the mining height, m; H refers to the buried depth of coal seam, m; Rh denotes the hard-rock lithology ratio; wm and wp represent the width of Wongawilli and protective block, m; φ 0 , φ 1 , φ 2 , φ 3 , φ 4 , φ 5 are constants.
Here, let M = x 1 , H = x 2 , R h = x 3 , ln ( w m ) = x 4 , w p = x 5 . Then, the multiple nonlinear regression model in Equation (5) was be converted into a multiple linear regression model:
H d = φ 0 + φ 1 x 1 + φ 2 x 2 + φ 3 x 3 + φ 4 x 4 + φ 5 x 5 ,
The regression coefficient φ 0 , φ 1 , φ 2 , φ 3 , φ 4 , φ 5 was calculated by the least square method, and the process was as follows:
f ( x i ) = ( H i H ^ i ) 2 = ( H i φ 0 φ 1 x 1 i φ 2 x 2 i φ 3 x 3 i φ 4 x 4 φ 5 x 5 i ) 2 = min ,
where the independent variables x 1 i , x 2 i , , x n i and the dependent variables y i are all specific known observed values. In order to obtain the regression coefficient, the derivative of φ 0 , φ 1 , φ 2 , φ 3 , φ 4 , φ 5 was taken, and its first derivative was set to 0, allowing us to obtain the following:
{ G 11 φ 1 + G 12 φ 2 + G 13 φ 3 + G 14 φ 4 + G 15 φ 5 = G 1 y G 21 φ 1 + G 22 φ 2 + G 23 φ 3 + G 24 φ 4 + G 25 φ 5 = G 2 y G 31 φ 1 + G 32 φ 2 + G 33 φ 3 + G 34 φ 4 + G 35 φ 5 = G 3 y G 41 φ 1 + G 42 φ 2 + G 43 φ 3 + G 44 φ 4 + G 45 φ 5 = G 4 y G 51 φ 1 + G 52 φ 2 + G 53 φ 3 + G 54 φ 4 + G 55 φ 5 = G 5 y ,
where, G i j = G j i = ( x i j x ^ i ) ( x i j x ^ j ) , G i y = ( x i j x ^ i ) ( y i y ^ i ) .
Because G i 1 ,   G i 2 ,   G i 3 ,   G i 4 ,   G i 5 ,   G i y ( i = 1 ,   2 ,   3 ,   4 ,   5 ) were obtained according to the numerical calculation results, x i j ,   y i ,   x ¯ j ,   x ¯ i ,   y ¯ i   ( i = 1 ,   2 ,   3 ,   4 ,   5 ) are known, and φ 0 ,   φ 1 ,   φ 2 ,   φ 3 ,   φ 4 ,   φ 5 are 5 unknowns with 5 equations. φ 1 ,   φ 2 ,   φ 3 ,   φ 4 ,   φ 5 were solved by the determinant or elimination method, and then φ 0 was obtained.
Moreover, when judging the closeness of the linear relationship between variables in the regression equation, we needed a quantitative index, namely the correlation coefficient:
R [ R 2 ( y , 1 , 2 , 3 , 4 , 5 ) = ( ( y ^ i y ¯ ) 2 ) / ( ( y i y ¯ ) 2 ) ] ,
The closer R is to 1, the more accurate the regression equation is.
Based on the simulation results and the aforementioned procedure, SPSS software was employed to conduct multiple linear regression analysis of the HWCFZ under 5 main controlling factors, namely, the mining height and depth, hard-rock lithology ratio, and the width of the Wongawilli and protective block. The prediction model for HWFZ of CEPB is:
H d = 5.60 M + 0.013 H + 17.86 R h + 29.02 ln w m 2.68 w p 61.6 R 2 = 0.92 ,

5. Verification and Field Implementation of the Prediction Model

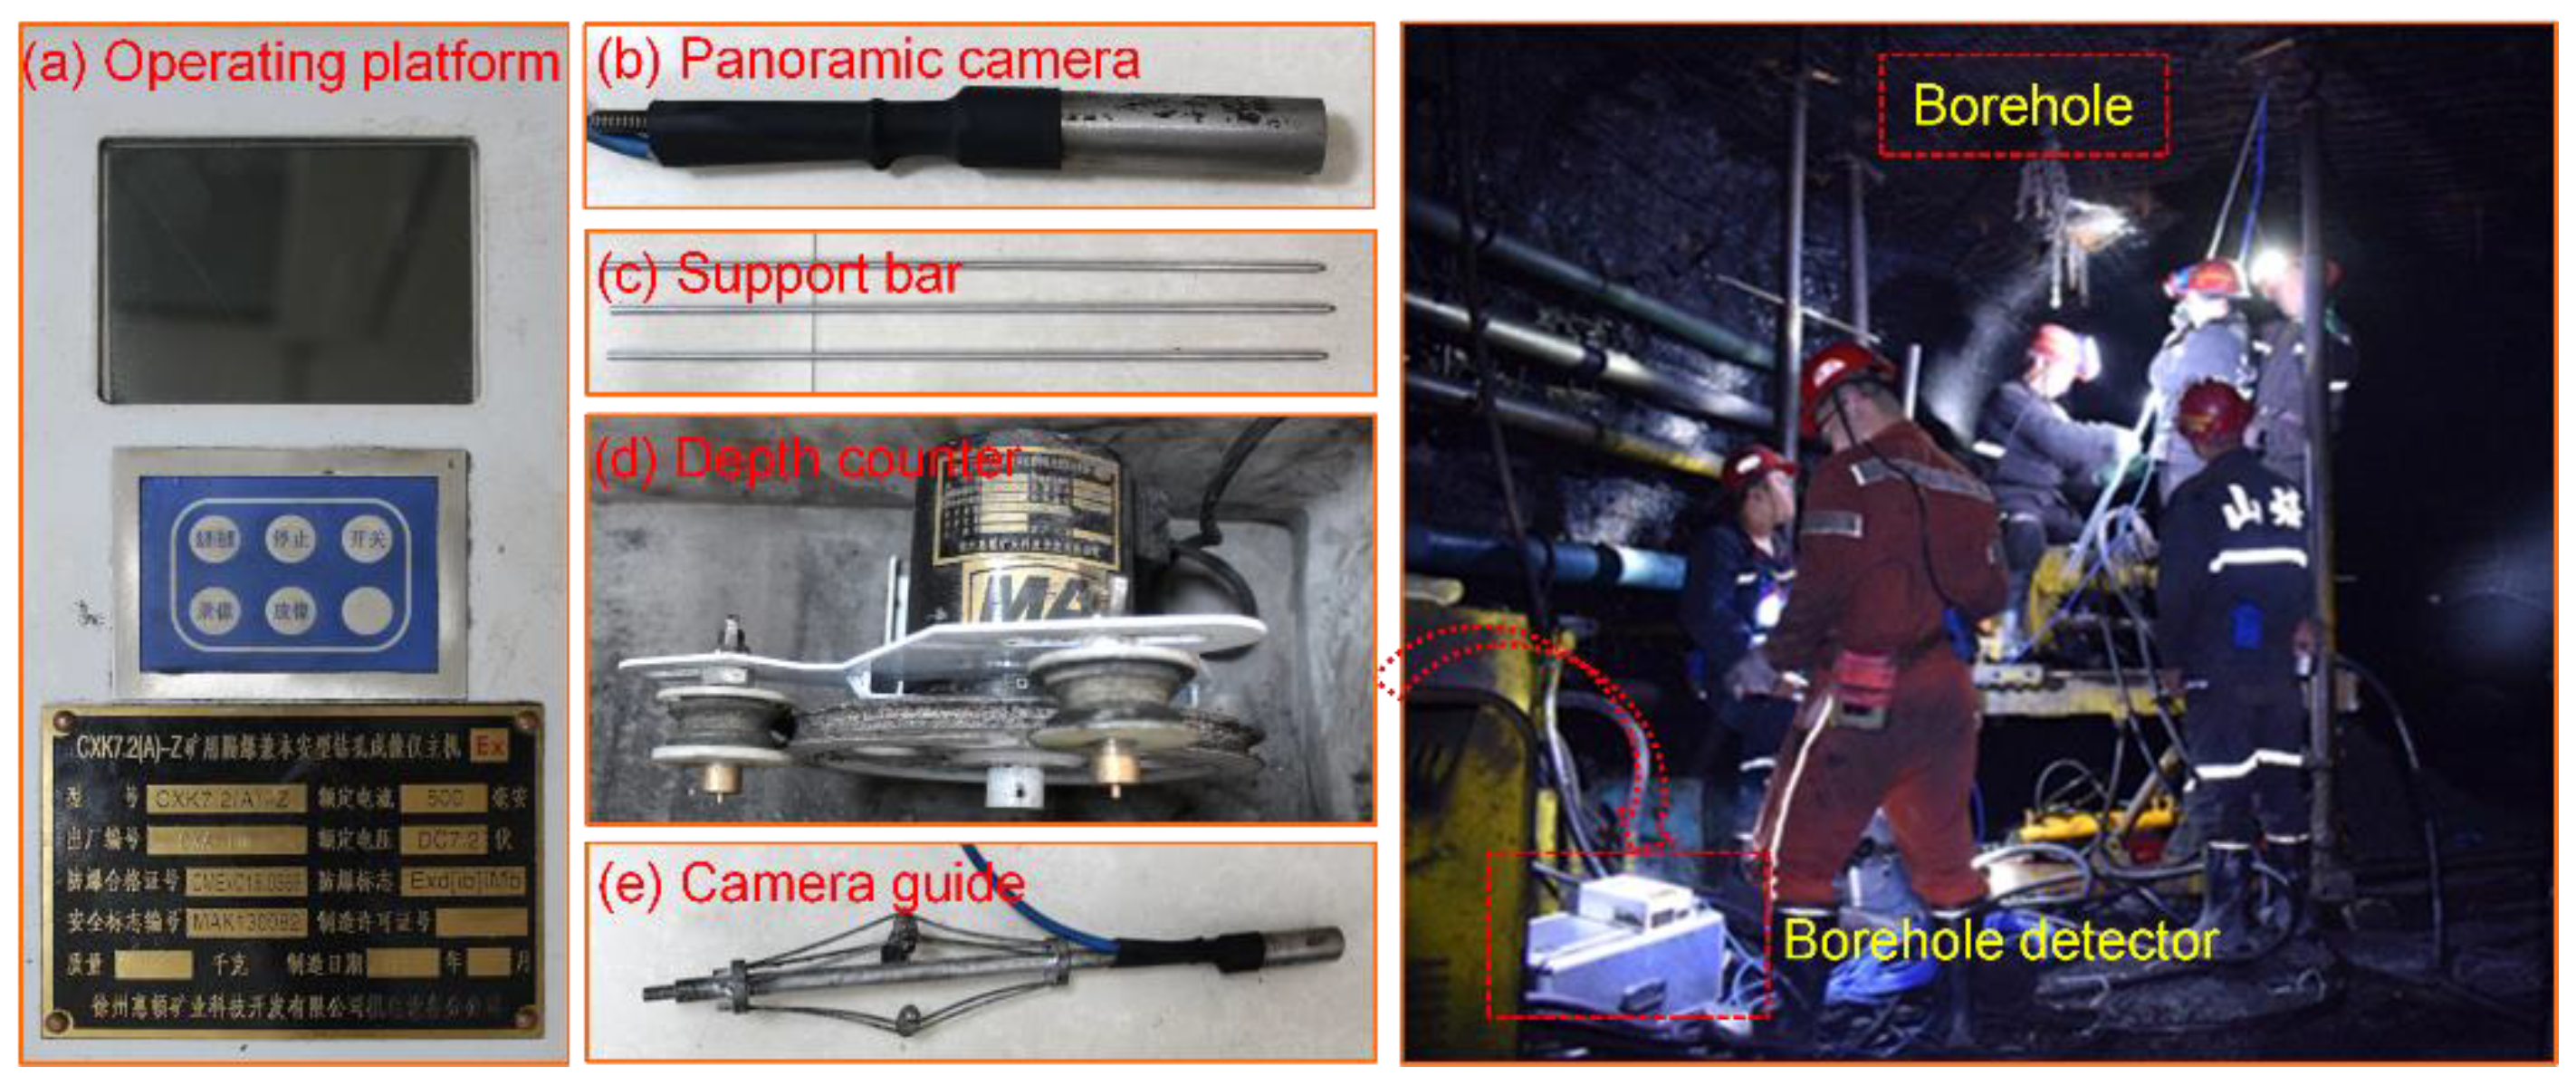
5.1. Verification of the Prediction Model of HWCFZ

A colliery employing the CEPB mining method in the Yu-Shen mining area was selected to estimate the HWCFZ using the model, so as to verify its reliability and rationality. The mining height and the buried depth of the coal seam are 4 and 240 m, respectively. Additionally, the hard-rock lithology ratio is 0.6, and the widths of the Wongawilli and protective block are 70 and 15 m, respectively. By employing the predicting formula, the HWCFZ was calculated to be 57.7. Subsequently, CXK7.2 (A) mine borehole imager was chosen to implement the borehole television logging, as shown in Figure 12. The detection results of HWCFZ are shown in Figure 13.
Based on the results of borehole peeping illustrated in Figure 13, that the following can be observed: (1) A large number of longitudinal and oblique fractures are developed with vertical height varying from 5.6 to 15.1 m, resulting in the fragmentation of surrounding rock. (2) Peeling occurs on the borehole wall in the range of 21.6–24.4 m, which lowers the aperture and makes it difficult for the probe to pass through. (3) Transverse cracks appear with height ranging from 27.3 to 38.5 m, indicating a bed separation occurring here. (4) There is a longitudinal fissure of around 1.9 m from 40.4 to 42.3 m. (5) The surrounding rock at 52.6 m breaks to a large extent, and it is dislocated on the right side of the borehole wall. (6) There are multiple longitudinal fissures whose lengths are approximately 0.5 m between 52.6 and 53.1 m. (7) The lateral and vertical micro-cracks emerge with the height varying from 53.6 to 55.9 m, and the surrounding rock of the wall is slightly peeled off. (8) The wall in the range of 57.7–68.7 m is relatively rough, but there is no obvious vertical or lateral fissure. (9) The surrounding rock of the borehole wall above 68.7 m is relatively smooth and integral without any fractures.
To sum up, the fractures are relatively developed in the range of 5.6–53.1 m, and the cracks gradually change from macroscopic fissures to micro-fissures with the vertical height ranging from 53.1 to 57.7 m. Therefore, when the height exceeds 53.1, the overlying strata belong to the non-penetrating fracture zone, so the HWCFZ can be determined to be 53.1 m. The error between the results of HWCFZ from the prediction model and the borehole television logging is 9%, verifying the rationality and validity of the model.

5.2. Generalization and Application of the Model

The model was generalized and applied to the whole Yu-Shen mining area on the basis of verifying its rationality and validity. Based on the data on the thickness and burial depth of the first-mined coal seam and the stratigraphic structure from 400 hydrogeological boreholes, the HWCFZ of 400 boreholes under various widths of Wongawilli and protective block were obtained. Subsequently, the thickness of the protective zone of each borehole was calculated by subtracting the HWCFZ from the distance between the aquifer and the first-mined coal seam. The thematic map of the HWCFZ and the thickness of protective zone were plotted by using Kriging interpolation method, so as to provide guidance for the field application of the CEPB in the Yu-Shen mining area.

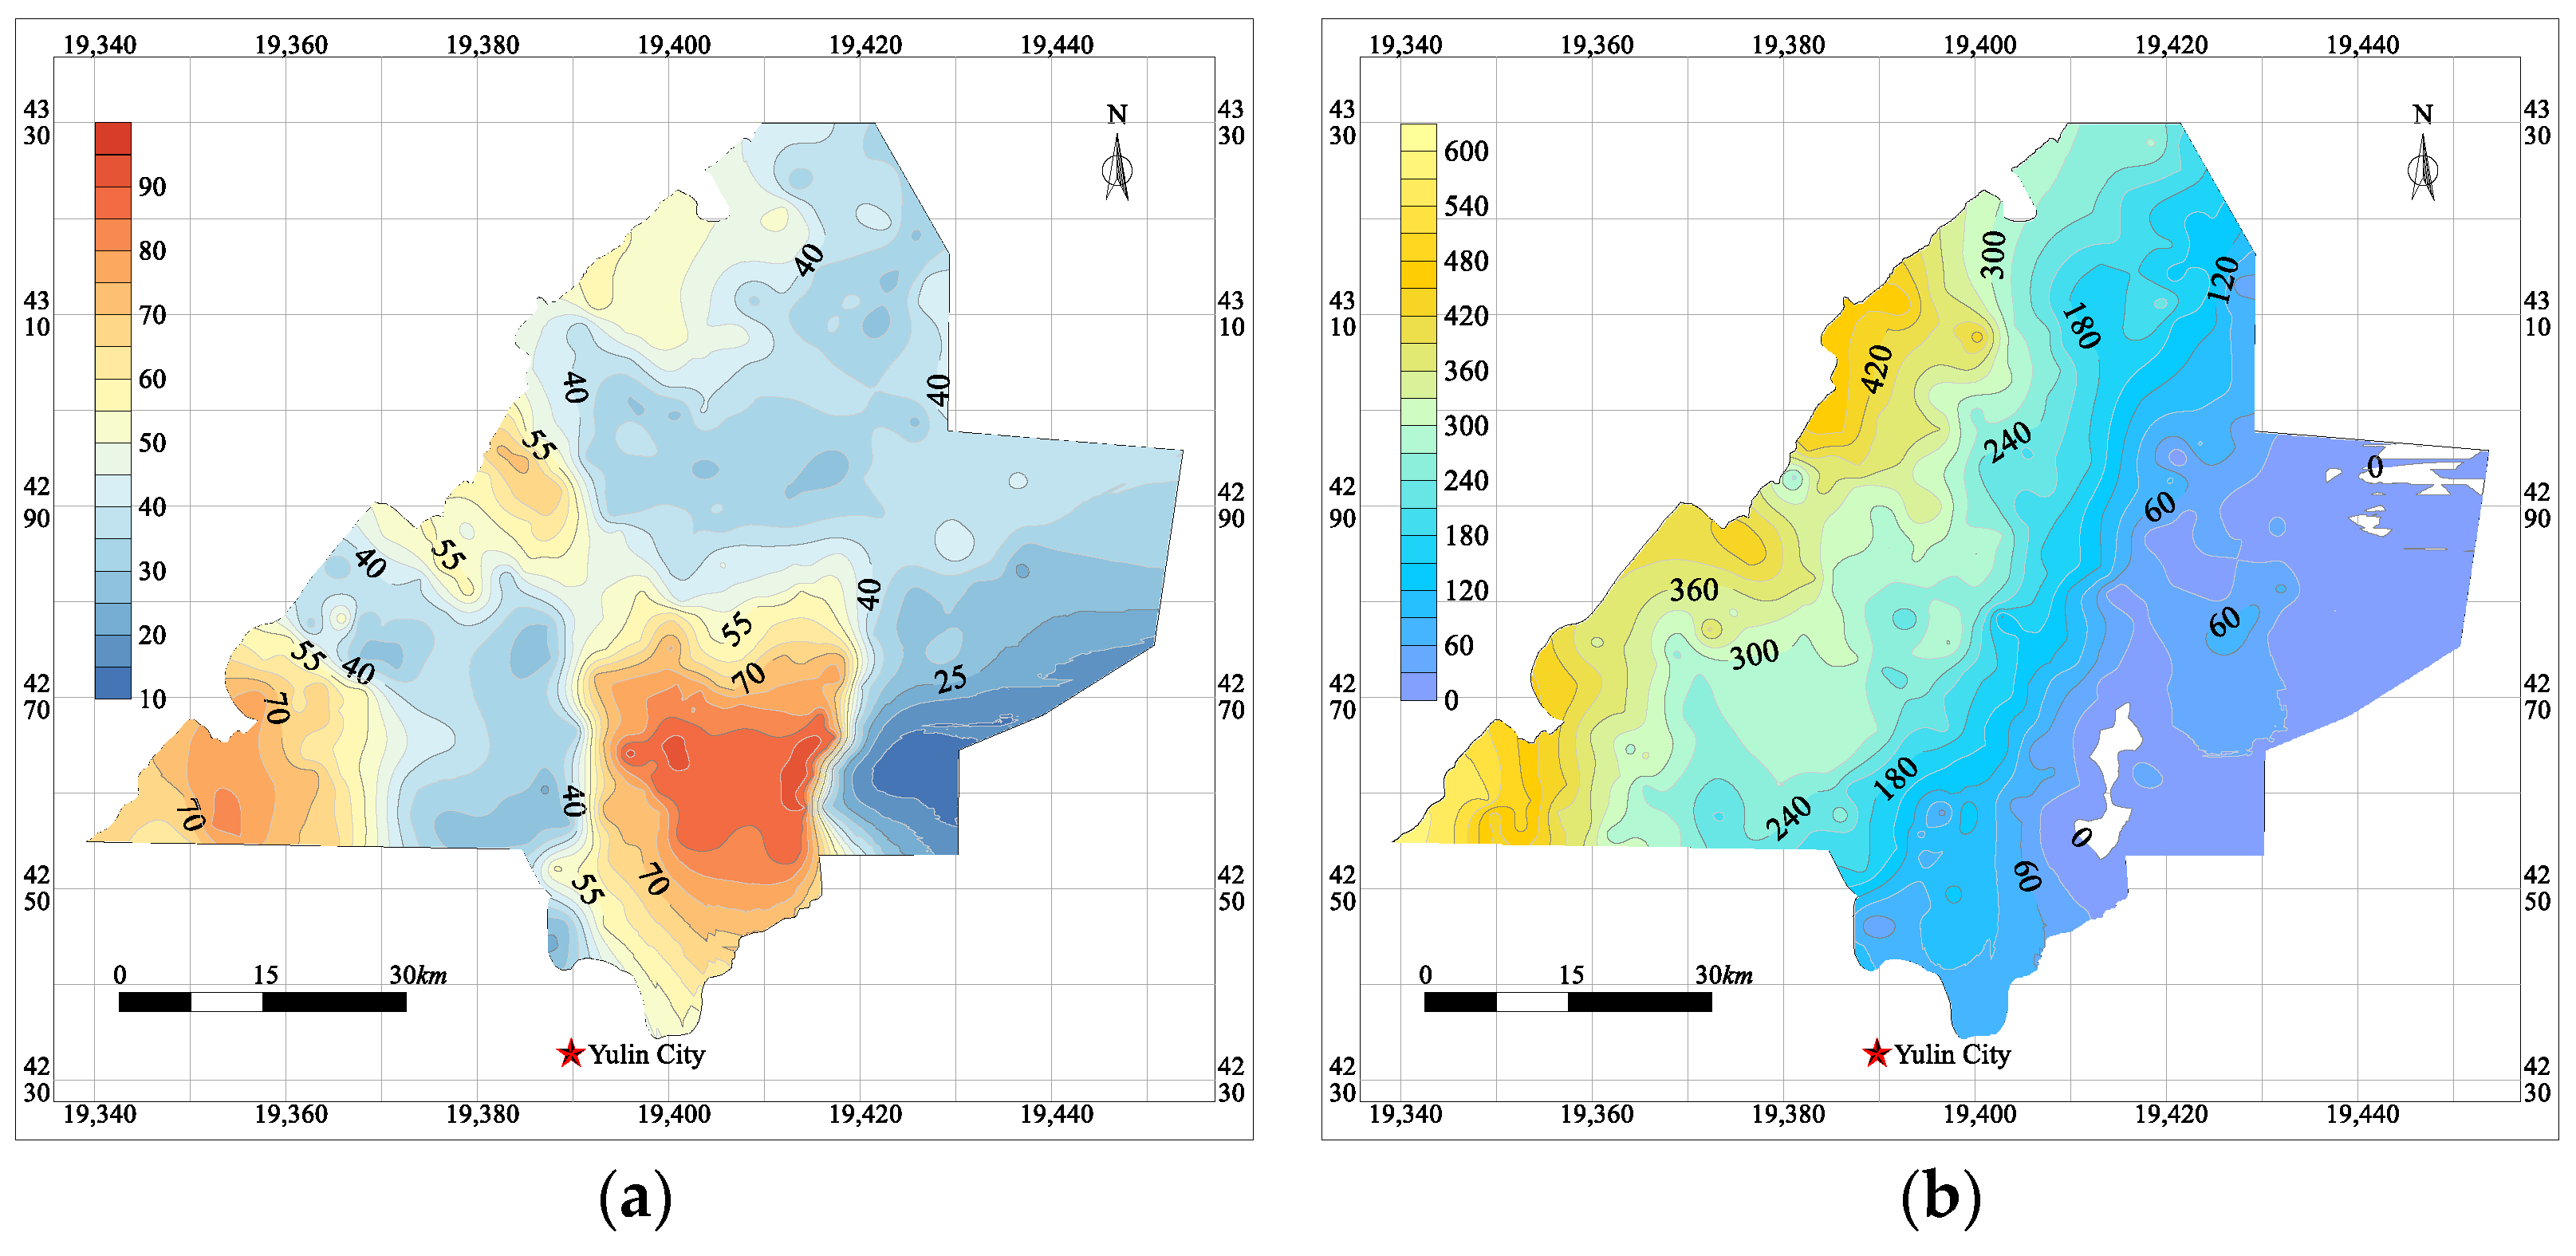
5.2.1. Thickness and Burial Depth of the First-Mined Coal Seam

The coal-bearing strata in the Yu-Shen coal area are the Jurassic Yan’an Formation strata. There are five main mineable coal seams, i.e., 1−2, 2−2, 3−1, 4−2, 5−2 coal seams from top to bottom, with the overall dip angle varying from 1 to 3°. The contour map of the thickness of the first-mined coal seam is illustrated in Figure 14a. Moreover, the lithology of the overlying layers whose thickness ranges between 0 and 650 m from the east to the west is dominated by mudstone, sandy mudstone, and sandstone. The contour map of the buried depth of the first-mined coal seam was drawn and shown in Figure 14b.

5.2.2. Zoning Map of Hard-Rock Lithology Ratio

Based on the characteristics of the spatial combination relationship of the overlying strata, the stratigraphic structure in the Yu-Shen coal area can be classified into five types, including sand–soil–bedrock, sand-bedrock, bedrock, soil–bedrock and burnt rock. Firstly, sand–soil–bedrock consists of sand strata, aquifuge, and bedrock, covering an area of more than 80% of its territory. According to the drilling data, the hard-rock lithology Rh of this structure can be set to 0.6. The sand-bedrock is composed of sand layers and bedrock, and the Rh of this structure is 0.8. The Salawusu aquifer lies on the structure directly, without a continuous water-resisting layer separating them. Thirdly, the bedrock overburden is exposed to the earth’s surface directly, and the Rh is 1.0. It is unnecessary to take this structure into account during the process of water-preserving mining due to its extremely low water-richness property. In addition, the soil-bedrock overburden is composed of aquifuge and bedrock, and the Rh is determined to 0.4 based on the overburden lithology. Burnt rock, with thickness ranging from 30 to 50 m, is the product of rock alteration resulting from the spontaneous combustion of coal seams. Since the strata are fragmented and broken and the rock is brittle with low ultimate stress, the water-diversion fractures develop directly to the shallow aquifer, contributing to water resources loss and water table lowering. Hence, the Rh of this structure is determined to be 1.0. The distribution of Rh based on the five stratigraphic structures is shown in Figure 15.

5.2.3. Characteristics of Underground Aquifer

From first-mined coal seam to the surface, the underground aquifer in the Yu-Shen mining area is composed of the confined aquifer of porous bedrock, burnt-rock phreatic aquifer, Salawusu formation aquifer, and the unconsolidated porous phreatic aquifer. The unconsolidated porous phreatic aquifer with extremely thin thickness is primarily recharged from precipitation, and it tends to form a complete and uniform aquifer with its underlying Salawusu Formation aquifer. The porous-bedrock-confined aquifer with little porosity and weak water yield property is distributed in restricted range. The burnt-rock phreatic aquifer is mainly recharged by its overlying Salawusu aquifer and it is not an aquifer in essence, since it itself cannot form a water-storing structure. The Salawusu Formation aquifer is widely distributed in the mining area, with thickness varying from 0 to 67.3 m. The maximum water table depth of Salawusu aquifer is 15 m, while it is generally less than 10 m in most regions in the Yu-Shen coal area. It provides the major supply source for domestic and ecological water demand. Hence, it is the primary source that needs to be taken into consideration while investigating water-preserving coal mining. Furthermore, the thickness of the protective zone can quantitatively characterize the spatial relationship between the HWCFZ and the water level of the Salawusu aquifer to a certain extent. The emphasis should be put on it, since it is indispensable for realizing water-preserving mining in the coal area.

5.2.4. HWCFZ and Protective Zone Thickness under CEPB and Longwall Caving Mining

(1)
HWCFZ of the CEPB mining method
According to the occurrence of the first-mined coal seam and the zoning map of the hard-rock lithology ratio obtained by 400 geological drilling holes in the study area, the HWCFZ of each borehole was calculated under CEPB mining using Equation (10). Adjusting the ratio of the width of the Wongawilli block to that of the protective block with due regard to the actual situation on site, three schemes listed in Table 6 were designed to illustrate the controlling effects of extracting and filling parameters on the HWCFZ and the thickness of the protective zone.
By employing the Kriging interpolation method, the thematic map of the HWCFZ and the thickness of the protective zone under various schemes were plotted, as shown in Figure 16, Figure 17 and Figure 18.
(2)
HWCFZ of the longwall caving mining
The majority of the main mineable coal seams in the eastern mining area of China belong to the Permian system, which is different from that of Jurassic coal seams in the Yu-Shen coal area. Furthermore, the hydrogeological and engineering conditions in this area differ from those in the eastern mining area significantly [4]. Hence, the traditional formulae for predicting HWCFZ of longwall caving mining are inapplicable to the Yu-Shen mining area. With due regard to various stratigraphic structures, i.e., the sand soil bedrock, sand bedrock, bedrock, soil-bedrock, the author once established a HWCFZ prediction model under longwall caving mining in the study area [30]. It was employed in this paper to compare the HWCFZ between the CEPB and the longwall caving mining [4,30]. Based on the drilling data and Equation (11), the thematic map of HWCFZ and the thickness of the protective zone under longwall caving mining were drawn using Kriging method, as illustrated in Figure 19.
{ H f = 21.75 M + 28.28 R 2 = 0.99 ( Sand - soil - bedrock ) H f = 22.20 M + 37.13 R 2 = 0.97 ( Sand - bedrock ) H f = 16.70 M + 30.80 R 2 = 0.97 ( Bedrock ) H f = 21.97 M + 28.42 R 2 = 0.98 ( Soil - bedrock ) ,
where Hf is the HWCFZ under longwall caving mining; M is the mining height.
(3)
The HWCFZ and protective zone thickness of CEPB and longwall caving mining
It can be seen from Figure 16, Figure 17, Figure 18 and Figure 19 that the HWCFZ of CEPB in the Yu-Shen mining area increases from northwest to southeast. The maximum values of the three schemes are 85 m, 100 m, and 135 m, respectively, located in the southeastern boundary. Our analysis is that the stratigraphic structure here is burnt rock. The overlying stratum develops fissures and cavities due to the roof collapse and later weathering induced by the spontaneous combustion of coal seam, and the rock mass is relatively fragmented. Hence, in this area, the water-conducted fractures go up rapidly and connect the Salawusu aquifer with the underground mined-out area, triggering water level drop and mine water inrush. Therefore, CEPB mining method is also unsuitable for the burned-rock area, and mining activities should be strictly prohibited in this area. The HWCFZ gradually decreases around the burned-rock region, and the minimum is in the soil-bedrock area in the eastern border of the Yu-Shen coal area. However, there is no Salawusu aquifer in this area, so the investigation on the HWCFZ is insignificant.
Additionally, the HWCFZ is not the only influencing factor for water-preserving mining. The thickness of the protective zone is also of great significance for conserving the overlying aquifer. In contrast to the HWCFZ, as a whole, the thickness of the protective zone of boreholes in the east area is generally lower than for those in the west, with the maximum values of the three schemes being 700 m, 630 m, and 570 m, respectively. As the ratio of the width of the Wongawilli block to that of the protective block increases, the HWCFZ grows while the thickness of the protective zone decreases. The maximum value of the HWCFZ of the scheme III of CEPB is 135 m, which is far less than that of 330 m of the longwall caving mining. Furthermore, the maximum thickness of the protective zone is 570 and 500 m, respectively, in scheme III of CEPB and longwall mining. Both the maximum of HWCFZ and the thickness of the protective zone indicate that even narrow protective block can effectively mitigate the overburden migration and thereby the development of water-flowing fractures, implying that the CEPB is more effective in water-preserving mining than longwall caving mining.

5.3. Criterion for Realizing Water-Preserving Coal Mining

5.3.1. Equivalent Permeability of the Protective Zone

The thickness of the protective zone is an indispensable index to evaluate its water-blocking ability. Generally, the thicker the protective zone is, the lower the risk that groundwater percolates through it. However, the water-resisting property of the overlying strata varies with varying lithology in the Yu-Shen coal area. The water-seepage-resisting capabilities of different strata of the protective zone are characterized by the permeability coefficient, as listed in Table 7.
During the previous research on water-preserving coal mining in the Yu-Shen mining area, the authors found that a protective zone composed of 12 m clay can effectively ameliorate water infiltration from the overlying Salawusu aquifer to the mined-out area, while an overlying layer with 30 m clay can completely eradicate water seepage. The water-resisting ability of the overlying layer with lithology of sandstone, sandy mudstone, shale, and mudstone is lower than that of clay stratum. In order to quantitatively characterize the water-blocking capability of the protective zone, the equivalent permeability coefficient of the protective zone was calculated:
k e = ( i = p q H i ) / [ i = p q ( H i k i ) ] ,
where ke denotes the equivalent permeability of the protective zone, m/d; Hi is the ith overlying stratum thickness, m; ki is the permeability coefficient of the ith overlying stratum, m/d; p and q are the number of the lowest and highest rock stratum in the protective zone, respectively.
Broadly speaking, for the stratigraphic structure with soil aquiclude existing, such as sand–soil–bedrock and soil–bedrock structure, the lithological compositions of the protective zone can be classified into three types: (1) If the distance between the Salawusu aquifer and the first-mined coal seam is large enough, the protective zone consists of the aquiclude and its underlying integral bedrock as well as the bedrock without connected fractures. (2) As the distance become short, the water-conductive fractures may develop into the Salawusu aquifer, and the protective zone is composed of a part or the entire of the aquifuge. (3) When the coal–water spacing is further reduced, the WCFZ may directly penetrate the aquiclude and reach the Salawusu aquifer. At the moment, the thickness of the protection zone is negative, indicating that it does not exist. In addition, as far as the sand–bedrock and bedrock overburden is concerned, there are two types of components of the protective zone: (1) If the coal–water spacing is large, the protection zone is composed of the lower intact bedrock or the bedrock with non-penetrating fractures. (2) When the distance is short, the fissure develops through the bedrock to the Salawusu aquifer, and the protective zone does not exist at this time.
The main aquiclude in the Yu-Shen coal area includes the loess in the Lishi Formation and the adjacent red soil in the Pliocene Baode Formation. The Lishi Formation is composed of grayish-yellow sandy loam and silty clay, with thickness varying from 0 to 110 m and 23 m on average. The Baode Formation consists of brown-red clay and silty clay, with an average thickness of 30 m. Furthermore, the lithology of bedrock is primarily sandy mudstone, siltstone, fine sandstone, etc., with an average permeability of 10−4 cm/s after coal extraction. Hence, Formula (12) was employed to calculate the equivalent permeability of the protective zone and the thematic maps under various mining methods, and mining parameters are illustrated in Figure 20.
It can be seen from Figure 20 that the equivalent permeability of the protective zone of the boreholes in the southwest and north is greater than that in other places. This indicates that there is no aquifuge beneath the Salawusu aquifer, or the thickness of the aquiclude in these two regions is far thinner than that in the south and east. Meanwhile, the permeability of bedrock is far greater than that of clay, leading to the large equivalent permeability of the protective zone. In addition, the water-conducting fissures in the vicinity of the eastern and southern boundary are highly developed, and the HWCFZ is higher than the level of the aquiclude (if it exists) and reaches the overlying aquifer, contributing to the absence of the protective zone, as shown in the blank and unfilled area in Figure 20. Therefore, the equivalent permeability of the protective zone here is absent instead of equal to 0, and water-preserving mining is difficult in these two areas.
As illustrated in Figure 20a–c, as the ratio of the span of the Wongawilli block to that of protective block increases, the blank and unfilled area also increases. Compared with scheme III of CEPB mining, the blank area extends to the mideast part while using longwall caving mining. It is worth noting that the northeastern border of the mining area belongs to the soil–bedrock structure, without Salawusu aquifer occurring over the aquifuge. There are extremely few drilling data in this area, since it makes no difference to water-preserving mining. Due to the limitations of Kriging interpolation method, as the blank and unfilled area shifts to the west, the northeastern border of scheme III of CEPB and the longwall caving mining is also interpolated, as shown in Figure 20c,d.

5.3.2. Criterion for Realizing Water-Preserving Mining

Assuming that the vertical water flow in the protective zone of each borehole follows the Darcy’s law, the criterion of whether water-preserving coal mining can be realized is proposed on the basis of comparing the equivalent permeability (equivalent water seepage rate) of the protective zone to the recharge rate of the Salawusu Formation aquifer:
k e Δ H V s i = p q H i ,
where Δ H is the hydraulic head pressure difference between the upper and lower boundary of the protective zone; ke is the equivalent permeability coefficient of the protective zone; Hi is the thickness of the ith overlying layer of the protective zone; p and q are the number of the lowest and highest stratum of the protective zone, respectively; Vs is the recharge rate of the Salawusu formation aquifer.
According to the field measurement results of the recharge rate of the Salawusu aquifer, in the vicinity of the central regions of Yu-Shen mining area, the vertical seepage velocity of the water in the protective zone is much lower than the recharge velocity of the aquifer, contributing to the full realization of water-preserving coal mining under CEPB mining. In addition, in a small part of the midwest area, the longwall fully mechanized mining can also realize water-preserving coal mining. Hence, the CEPB mining in this area is not optimal compared with longwall mining, which has high mining efficiency and recovery rate. Note that in the vicinity of the burnt-rock area on the eastern boundary where the overlying strata are fragmented and broken, water-preserving coal mining cannot be achieved despite employing CEPB mining method.

6. Discussion

(1)
AHP is a subjective weighting method. Since the identification of indexes and the determination of the relative weight in the paper was mainly provided by scholars engaged in HWCFZ prediction and water-preserving mining in Northwest China, we will further our study to confirm whether the indicators and the weights distribution are applicable to other mining areas.
(2)
The prediction result of HWCFZ is consistent with the field test results, indicating it is scientific, reasonable, and reliable. Moreover, the model can not only accurately predict the HWCFZ in the Yu-Shen coal area but also be generalized and employed in other mining areas situated in Northwest China, as long as they share the occurrence of coal seam, overlying aquifer, and the stratigraphic structure in common. However, the prediction model with due consideration of five main controlling factors is only applicable to ordinary mining areas in Northwest China. For mining areas with coal seam thickness up to 100 m in Xinjiang province, it is obviously inapplicable.
(3)
When the overlying aquifer is extremely close to the coal seam, the Wongawilli block should be backfilled in the same way as the protective block, since the water-flowing fractures always reach the water body, regardless of how to optimize the mining parameters. In this context, the CEPB has shifted to the continuous extraction and continuous backfill mining method. Moreover, the Wongawilli and the protective block share equipment requirements such as filling pipeline in common, and additional improvement is unnecessary for filling Wongawilli block, contributing to a simple and convenient transformation of mining methods.
(4)
The field industrial test shows that the filling cost per ton of coal when both the Wongawilli and protective block are backfilled is less than 120 yuan, which is slightly higher than that of the longwall backfill mining of 100 yuan. In addition, the maximum annual output of CEPB can reach 600,000 tons, being similar to that of longwall backfill mining. If the mining method only backfills the protective block, while leaving the Wongawilli block unbackfilled, the filling cost per ton of coal of CEPB will be further reduced. It can also lower the requirements for large-scale raw filling material sources and cut down the filling cost in order to realize water-preserving coal mining. On the other hand, in order to separate the chamber and support the roof for a short term and prevent stress concentration at the edge of the Wongawilli block, a small amount of narrow coal pillars have been discarded and left unmined. The recovery rate of CEPB mining is approximately 85%. However, compared with the recovery rate of 40% of partial mining methods, such as room and pillar mining, strip mining, and height-limiting mining, CEPB can still be regarded as an ideal water-preserving mining method with high recovery rate. This method has been currently applied to Yuyang, Suncun, and Wangtaipu collieries, and dual benefits of economy and ecology have been achieved, indicating its good prospects for generalization and application.
(5)
When using UDEC to simulate the HWCFZ of CEPB, the selection of the constitutive model is the crucial procedure, since different types of filling materials correspond to various constitutive models. The double-yield constitutive model is ideal for simulating the strain-hardening mechanical behavior of the compressed gangue after it is conveyed to the MRs of the protective block. Considering that there is no cohesion between gangue particles, the tensile and shear effects in the double-yield model are therefore ignored, and only the volumetric yield effect is considered. In order to make the simulation results closer to the actual situation, Terzaghi’s model, an ideal model to simulate the relationship between stress and strain of the gangue, was employed to correct the cap pressure of filling bodies in the MRs. On the other side, if the MR is injected with paste filling materials, the strain-softening constitutive model is the most suitable one to be chosen. The cohesion, friction, expansion and tensile strength of the model may soften after the beginning of plastic yield, while these properties are assumed to remain unchanged in the Mohr–Coulomb model. The softening behavior of cohesion, friction, and dilatation based on plastic shear strain is given in the form of specified table value, and it is assumed that the two consecutive parameters in the table command are linear. As a function of plastic tensile strain, the tensile strength is also given by the specified table value.

7. Conclusions

The following conclusions are drawn from the above research:
(1)
The CEPB mining method was proposed for water-preserving coal mining by combining the advantages of Wongawilli rapid mining method with the roadway skip mining. This method overcomes the problems of high filling cost and insufficient source of raw filling materials caused by high filling rate of the continuous extraction and continuous backfill mining. Based on the characteristics of overburden as well as the distance between coal seam and the overlying aquifer, the mining and filling parameters, such as the width of the Wongawilli and the protective block, can be flexibly adjusted, so as to control the HWCFZ and realize water-conservation mining in order to maximize the economic benefits.
(2)
A triple-leveled structure model, with 3 sub-factors and 10 third-tier indicators, was established by employing the analytic hierarchy process (AHP) method to identify the influencing factors of the HWCFZ of CEPB mining. According to the weight distribution, among the second-level influencing factors, the coal mining system is the most significant one, with a weight of 0.7273. The mining height, whose weight is 0.3112, is the most important indicator among the third-tier factors. Based on the weight distribution, five main controlling factors affecting the HWCFZ were determined, i.e., the hard-rock lithology ratio, the mining height and depth and the width of Wongawilli and protective block.
(3)
UDEC software was employed to construct the numerical calculation models, and the orthogonal numerical simulation scheme including five main controlling factors was designed. The HWCFZ of CEPB under the conditions of different mining parameters was simulated by adopting control variable method, and the linear and nonlinear fitting of single factor were carried out. Then, by using the multiple linear regression function embedded in SPSS software, the prediction model of HWCFZ of CEPB was obtained: H d = 5.60 M + 0.013 H + 17.86 R h + 29.02 ln w m 2.68 w p 61.6 R 2 = 0.92 .
(4)
The estimation model was employed with a colliery in Yu-Shen mining area, and the HWCFZ was calculated to be 57.7 m, 9% higher than that of 53.1 m from the borehole television logging, verifying its rationality and reliability. It was then generalized and applied to the whole Yu-Shen coal area. According to the hydrogeological characteristics of 400 boreholes in the mining area, the thematic map of the HWCFZ and the thickness and equivalent permeability of the protective zone under CEPB and longwall caving mining were drawn, respectively. A criterion for achieving water-preserving coal mining was proposed on the basis of the equivalent permeability coefficient of the protective zone and the recharge rate of its upper Salawusu aquifer. The research results can provide theoretical guidance to optimize the mining parameters of CEPB for water-preserving and water-conservation mining in Northwest China.
(5)
Further in-depth study on mining-induced permeability deterioration under CEPB will be conducted. In this paper, the average permeability coefficient after coal extraction is used when calculating the equivalent permeability coefficient of the protective zone above the WCFZ. In the future research process, it is necessary to obtain the mining-induced permeability coefficient of each specific stratum, so as to more accurately predict whether water-conservation and water-preserving coal mining can be realized under different mining and filling parameters while using CEPB mining method.

Author Contributions

Conceptualization, Y.X.; methodology, Y.X.; software, Y.X. and J.Z.; validation, I.N. and J.Z.; formal analysis, Y.X.; investigation, Y.X.; data curation, I.N.; writing—original draft preparation, Y.X.; writing—review and editing, L.M.; supervision, L.M.; project administration, L.M.; funding acquisition, L.M. All authors have read and agreed to the published version of the manuscript.

Funding

This paper was funded by the National Natural Science Foundation of China (51874280) and the Fundamental Research Funds for the Central Universities (2021ZDPY0211).

Institutional Review Board Statement

Not applicable.

Informed Consent Statement

Not applicable.

Data Availability Statement

Not applicable.

Conflicts of Interest

The authors declare that they have no competing financial interests in connection with the work submitted.

References

  1. Zhang, D.S.; Fan, G.W.; Ma, L.Q.; Wang, X.F. Aquifer protection during longwall mining of shallow coal seam: A case study in the Shendong Coalfield of China. Int. J. Coal Geol. 2011, 86, 190–196. [Google Scholar] [CrossRef]
  2. Wang, S.M.; Huang, Q.X.; Fan, L.M.; Yang, Z.Y.; Shen, T. Study on overburden aquclude and water protection mining regionazation in the ecological fragile mining area. J. China Coal Soc. 2010, 35, 7–14. [Google Scholar]
  3. Ma, L.Q.; Zhang, D.S.; Jin, Z.Y.; Wang, S.K.; Yu, Y.H. Theories and methods of efficiency water conservation mining in short-distance coal seams. J. China Coal Soc. 2019, 44, 727–738. [Google Scholar]
  4. Xu, Y.J. Study on “Five Maps, Three Zones and Two Zoning Plans” Water Conservation Mining Method in Yushen Mining Area. Master’s Thesis, China University of Mining Science & Technology, Xuzhou, Jiangsu, China, 2019; p. 6. [Google Scholar]
  5. Sun, K.; Fan, L.M.; Xia, Y.C.; Li, C.; Chen, J.P.; Gao, S.; Wu, B.Y.; Peng, J.; Ji, Y.W. Impact of coal mining on groundwater of Luohe Formation in Binchang mining area. Int. J. Coal Sci. Technol. 2021, 8, 88–102. [Google Scholar] [CrossRef]
  6. Li, W.P.; Wang, Q.Q.; Liu, S.L.; Pei, Y.B. Study on the creep permeability of mining-cracked N2 laterite as the key aquifuge for preserving water resources in Northwestern China. Int. J. Coal Sci. Technol. 2018, 5, 315–327. [Google Scholar] [CrossRef] [Green Version]
  7. Guo, J.S.; Ma, L.Q.; Zhang, D.S. Management and utilization of high-pressure floor-confined water in deep coal mines. Mine Water Environ. 2019, 38, 780–797. [Google Scholar] [CrossRef]
  8. Ma, L.Q.; Guo, J.S.; Liu, W.P.; Zhang, D.S.; Yu, Y.H. Water conservation when mining multiple, thick, closely-spaced coal seams: A case study of mining under weishan lake. Mine Water Environ. 2019, 38, 643–657. [Google Scholar] [CrossRef]
  9. Ma, L.Q.; Jin, Z.Y.; Liang, J.M.; Sun, H.; Zhang, D.S.; Li, P. Simulation of water resource loss in short-distance coal seams disturbed by repeated mining. Environ. Earth Sci. 2015, 74, 5653–5662. [Google Scholar] [CrossRef]
  10. Wang, S.K.; Ma, L.Q. Characteristics and control of mining induced fractures above longwall mines using backfilling. Energies 2019, 12, 4604. [Google Scholar] [CrossRef] [Green Version]
  11. Gao, W.; Ge, M. Stability of a coal pillar for strip mining based on an elastic-plastic analysis. Int. J. Rock Mech. Min. Sci. 2016, 87, 23–28. [Google Scholar] [CrossRef]
  12. Gian, F.N.C.; Tais, R.C.; Vidal, F.N.T. Optimization of room-and-pillar dimensions using automated numerical models. Int. J. Min. Sci. Tech. 2019, 29, 797–801. [Google Scholar]
  13. Yuan, S.C.; Han, G.L. Combined drilling methods to install grout curtains in a deep underground mine: A case study in Southwest China. Mine Water Environ. 2020, 39, 902–909. [Google Scholar] [CrossRef]
  14. Wang, X.Y.; Wu, W.D.; Wu, B.W. Grouting of bed separation spaces to control sliding of the high-located main key stratum during longwall mining. Q. J. Eng. Geol. Hydrogeol. 2020, 53, 569–578. [Google Scholar] [CrossRef]
  15. Xu, Y.J.; Ma, L.Q.; Khan, N.M. Prediction and maintenance of water resources carrying capacity in mining area-a case study in the Yu-Shen mining area. Sustainability 2020, 12, 7782. [Google Scholar] [CrossRef]
  16. Huang, P.; Spearing, A.J.S.; Feng, J.; Jessu, K.V.; Guo, S. Effects of solid backfilling on overburden strata movement in shallow depth longwall coal mines in West China. J. Geophys. Eng. 2018, 15, 2194–2208. [Google Scholar] [CrossRef] [Green Version]
  17. Zhang, Y.; Cao, S.; Zhang, N.; Zhao, C. The application of short-wall block backfill mining to preserve surface water resources in northwest China. J. Clean. Prod. 2020, 261, 121232. [Google Scholar] [CrossRef]
  18. Zhang, J.X.; Sun, Q.; Zhou, N.; Jiang, H.Q.; Deon, G.; Sami, A. Research and application of roadway backfill coal mining technology in western coal mining area. Arab. J. Geosci. 2016, 9, 1–10. [Google Scholar] [CrossRef]
  19. Ma, L.; Xu, Y.; Zhang, D.S.; Lai, X.; Huang, K.; Du, H. Characteristics of aquiclude and surface deformation in continuous mining and filling with wall system for water conservation. J. Min. Saf. Eng. 2019, 36, 30–36. [Google Scholar]
  20. Ma, L.Q.; Jin, Z.Y.; Liu, W.; Zhang, D.S.; Zhang, Y. Wongawilli roadway backfilling coal mining method-a case study in Wangtaipu coal mine. Int. J. Oil Gas Coal Technol. 2019, 20, 342–359. [Google Scholar] [CrossRef]
  21. Ma, L.Q.; Zhang, D.S.; Wang, S.K.; Xie, Y.S.; Yu, Y.H. Water-preserved mining with the method named “backfilling while mining”. J. Chin. Coal Soc. 2018, 43, 62–69. [Google Scholar]
  22. Yu, Y.H.; Ma, L.Q.; Zhang, D.S. Characteristics of roof ground subsidence while applying a continuous excavation continuous backfill method in longwall mining. Energies 2020, 13, 95. [Google Scholar] [CrossRef] [Green Version]
  23. Yu, Y.H.; Ma, L.Q. Application of roadway backfill mining in water-conservation coal mining: A case study in northern Shaanxi, China. Sustainabiltity 2019, 11, 3719. [Google Scholar] [CrossRef] [Green Version]
  24. Wang, A.L.; Ma, L.Q.; Wang, Z.W.; Zhang, D.S.; Li, K.; Zhang, Y.; Yi, X.J. Soil and water conservation in mining area based on ground surface subsidence control: Development of a high-water swelling material and its application in backfilling mining. Environ. Earth Sci. 2016, 75, 779. [Google Scholar] [CrossRef]
  25. Gandhe, A.; Venkateswarlu, V.; Gupta, R.N. Extraction of coal under a surface water body-a strata control investigation. Rock Mech. Rock Eng. 2005, 38, 399–410. [Google Scholar] [CrossRef]
  26. Booth, C.J. Groundwater as an environmental constraint of longwall coal mining. Environ. Earth Sci. 2006, 49, 796–803. [Google Scholar] [CrossRef]
  27. Winters, W.R.; Capo, R.C. Ground water flow parameterization of an Appalachian coal mine complex. Ground Water 2004, 42, 700–710. [Google Scholar] [CrossRef]
  28. Howladar, M.F. Coal mining impacts on water environs around the Barapukuria coal mining area, Dinajpur, Bangladesh. Environ. Earth Sci. 2012, 70, 215–226. [Google Scholar] [CrossRef]
  29. Hill, J.G.; Price, D.R. The impact of deep mining on an overlying aquifer in western pennsylvania. Ground Water Monit. R 1983, 3, 138–143. [Google Scholar] [CrossRef]
  30. Stoner, J.D. Probable hydrologic effects of subsurface mining. Ground Water Monit. R 1983, 3, 128–137. [Google Scholar] [CrossRef]
  31. Arkoc, O.; Ucar, S.; Ozcan, C. Assessment of impact of coal mining on ground and surface waters in Tozakli coal field, Kırklareli, northeast of Thrace, Turkey. Environ. Earth Sci. 2016, 75, 514. [Google Scholar] [CrossRef]
  32. Newman, C.; Agioutantis, Z.; Leon, G.B.J. Assessment of potential impacts to surface and subsurface water bodies due to longwall mining. Int. J. Min. Sci. Tech. 2017, 27, 57–64. [Google Scholar] [CrossRef]
  33. Booth, C.J. The effects of longwall coal mining on overlying aquifers. Geol. Soc. 2002, 198, 17–45. [Google Scholar] [CrossRef]
  34. Raghavendra, N.S.; Deka, P.C. Sustainable development and management of ground water resources in mining affected area: A review. Procedia Earth Planet. Sci. 2015, 11, 598–604. [Google Scholar] [CrossRef] [Green Version]
  35. Robertson, J. Challenges in sustainably managing groundwater in the Australian Great Artesian Basin: Lessons from current and historic legislative regimes. Hydrogeol. J. 2020, 28, 343–360. [Google Scholar] [CrossRef] [Green Version]
  36. Palchik, V. Formation of fractured zones in overburden due to longwall mining. Environ. Geol. 2003, 44, 28–38. [Google Scholar] [CrossRef]
  37. Majdi, A.; Hassani, F.P.; Nasiri, M.Y. Prediction of the height of destressed zone above the mined panel roof in longwall coal mining. Int. J. Coal Geol. 2012, 98, 62–72. [Google Scholar] [CrossRef]
  38. Adhikary, D.P.; Guo, H. Measurement of longwall mining induced strata permeability. Geotech. Geol. Eng. 2014, 32, 617–626. [Google Scholar] [CrossRef]
  39. Adhikary, D.P.; Guo, H. Modelling of longwall mining-induced strata permeability change. Rock Mech. Rock Eng. 2015, 48, 345–359. [Google Scholar] [CrossRef]
  40. Fan, L.M.; Ma, X.D. A review on investigation of water-preserved coal mining in western China. Int. J. Coal Sci. Technol. 2018, 5, 411–416. [Google Scholar] [CrossRef] [Green Version]
  41. Fan, L.M.; Ma, L.Q.; Yu, Y.H.; Wang, S.K.; Xu, Y.J. Water-conserving mining influencing factors identification and weight determination in northwest China. Int. J. Coal Sci. Technol. 2019, 6, 95–101. [Google Scholar] [CrossRef] [Green Version]
  42. Wang, G.; Wu, M.M.; Wang, R.; Xu, H.; Song, X. Height of the mining-induced fractured zone above a coal face. Eng. Geol. 2017, 216, 140–152. [Google Scholar] [CrossRef]
  43. Liu, S.L.; Li, W.P.; Wang, Q.Q. Height of the water-flowing fractured zone of the jurassic coal seam in Northwestern China. Mine Water Environ. 2018, 37, 312–321. [Google Scholar] [CrossRef]
  44. Guo, W.; Zou, Y.; Hou, Q. Fractured zone height of longwall mining and its effects on the overburden aquifers. Int. J. Min. Sci. Technol. 2012, 22, 603–606. [Google Scholar] [CrossRef]
  45. Shi, L.Q.; Xin, H.Q.; Zhai, P.H.; Li, S.C.; Liu, T.B.; Yan, Y.; Wei, W.X. Calculating the height of water flowing fracture zone in deep mining. J. Chin. Univ. Min. Technol. 2012, 41, 37–41. [Google Scholar]
  46. Liu, X.S.; Tan, Y.L.; Ning, J.G.; Tian, C.L.; Wang, J. The height of water-conducting fractured zones in longwall mining of shallow coal seams. Geotech. Geol. Eng. 2015, 33, 693–700. [Google Scholar] [CrossRef]
  47. Liu, Y.; Yuan, S.C.; Yang, B.B.; Liu, J.W.; Ye, Z.Y. Predicting the height of the water-conducting fractured zone using multiple regression analysis and GIS. Environ. Earth Sci. 2019, 78, 422. [Google Scholar] [CrossRef]
  48. Wang, H.Z.; Zhang, D.S.; Wang, X.F.; Zhang, W. Visual exploration of the spatiotemporal evolution law of overburden failure and mining-induced fractures: A case study of the Wangjialing coal mine in China. Miner. Basel 2017, 7, 35. [Google Scholar] [CrossRef] [Green Version]
  49. Wu, W.D.; Bai, J.B.; Wang, X.Y.; Zhu, Z.J.; Yan, S. Field investigation of fractures evolution in overlying strata caused by extraction of the jurassic and carboniferous coal seams and its application: Case study. Int. J. Coal Geol. 2019, 208, 12–23. [Google Scholar] [CrossRef]
  50. Huang, Q.; Han, J.B. Study on fracture evolution mechanism of shallow-buried close coal seam mining. J. Min. Safe. Eng. 2019, 36, 706–711. [Google Scholar]
  51. Huang, Q.; Du, J.W.; Hou, E.K.; Yang, F. Research on overburden and ground surface cracks distribution and formation mechanism in shallow coal seams group mining. J. Min. Safe Eng. 2019, 36, 7–15. [Google Scholar]
  52. Miao, X.X.; Cui, X.M.; Wang, J.N.; Xu, J.L. The height of fractured water-conducting zone in undermined rock strata. Eng. Geol. 2011, 120, 32–39. [Google Scholar] [CrossRef]
  53. Zhang, Y.X.; Tu, S.H.; Bai, Q.S.; Li, J.J. Overburden fracture evolution laws and water-controlling technologies in mining very thick coal seam under water-rich roof. Int. J. Min. Sci. Technol. 2013, 23, 693–700. [Google Scholar] [CrossRef]
  54. Wang, F.; Xu, J.L.; Chen, S.J.; Ren, M.Z. Method to predict the height of the water conducting fractured zone based on bearing structures in the overlying strata. Mine Water Environ. 2019, 38, 767–779. [Google Scholar] [CrossRef]
  55. Wang, F.; Xu, J.L.; Xie, J.L. Effects of arch structure in unconsolidated layers on fracture and failure of overlying strata. Int. J. Rock Mech. Min. Sci. 2019, 114, 141–152. [Google Scholar] [CrossRef]
  56. Bai, H.Y.; Li, W.P.; Chen, X.J.; Huang, X. Development rules of water flowing and fracture zone at deep buried soil-rock interface during mining. J. Eng. Geol. 2017, 25, 1322–1327. [Google Scholar]
  57. Liu, Y.; Liu, Q.M.; Li, W.P.; Li, T.; He, J.H. Height of water-conducting fractured zone in coal mining in the soil-rock composite structure overburdens. Environ. Earth Sci. 2019, 78, 242. [Google Scholar] [CrossRef]
  58. Zhang, J.X.; Jiang, H.Q.; Deng, X.J.; Ju, F. Prediction of the height of the water-conducting zone above the mined panel in solid backfill mining. Mine Water Environ. 2014, 33, 317–326. [Google Scholar] [CrossRef]
  59. Li, L.; Li, F.M.; Zhang, Y.; Yang, D.M.; Liu, X. Formation mechanism and height calculation of the caved zone and water-conducting fracture zone in solid backfill mining. Int. J. Coal Sci. Technol. 2020, 7, 208–215. [Google Scholar] [CrossRef] [Green Version]
  60. Zhao, B.C.; Liu, Z.R.; Tong, C.; Wang, C.L. Relation between height of water flowing fractured zone and mining parameters. J. Min. Safe Eng. 2015, 32, 634–638. [Google Scholar]
  61. Guo, W.B.; Zhao, G.B.; Lou, G.; Wang, S. A new method of predicting the height of the fractured water-conducting zone due to high-intensity longwall coal mining in China. Rock Mech. Rock Eng. 2019, 52, 2789–2802. [Google Scholar] [CrossRef]
  62. Wu, Q.; Shen, J.J.; Liu, W.T.; Wang, Y. A RBFNN-based method for the prediction of the developed height of a water-conductive fractured zone for fully mechanized mining with sublevel caving. Arab. J. Geosci. 2017, 10, 172. [Google Scholar] [CrossRef]
  63. Hu, X.J.; Li, W.P.; Cao, D.T.; Liu, M.C. Index of multiple factors and expected height of fully mechanized water flowing fractured zone. J. China Coal Soc. 2012, 37, 613–620. [Google Scholar]
  64. Wang, F.T.; Tu, S.H.; Zhang, C.; Zhang, Y.W.; Bai, Q.S. Evolution mechanism of water-flowing zones and control technology for longwall mining in shallow coal seams beneath gully topography. Environ. Earth Sci. 2016, 75, 1309. [Google Scholar] [CrossRef]
  65. Xu, Z.M.; Sun, Y.J.; Dong, Q.H.; Zhang, G.W.; Li, S. Predicting the height of water-flow fractured zone during coal mining under the Xiaolangdi reservoir. Int. J. Min. Sci. Technol. 2010, 20, 434–438. [Google Scholar] [CrossRef]
  66. Zhang, Y.; Cao, S.G.; Guo, S.; Wan, T.; Wang, J.J. Mechanisms of the development of water-conducting fracture zone in overlying strata during shortwall block backfill mining: A case study in Northwestern China. Environ. Earth Sci. 2018, 77, 543. [Google Scholar] [CrossRef]
  67. Deng, X.J.; Zhang, J.X.; Zhou, N.; de Wit, B.; Wang, C.T. Upward slicing longwall-roadway cemented backfilling technology for mining an extra-thick coal seam located under aquifers: A case study. Environ. Earth Sci. 2017, 76, 789. [Google Scholar] [CrossRef]
  68. Deng, X.J.; Yuan, Z.X.; Lan, L.X.; de Wit, B.; Zhang, J.W. Roof Movement and Failure Behavior When Mining Extra-Thick Coal Seams Using Upward Slicing Longwall-Roadway Cemented Backfill Technology. Adv. Mater. Sci. Eng. 2020, 2020, 5828514. [Google Scholar] [CrossRef] [Green Version]
  69. Hou, E.K.; Wen, Q.; Ye, Z.N.; Chen, W.; Wei, J.B. Height prediction of water-flowing fracture zone with a genetic-algorithm support-vector-machine method. Int. J. Coal Sci. Technol. 2020, 7, 740–751. [Google Scholar] [CrossRef]
  70. Lian, X.G.; Hu, H.F.; Li, T.; Hu, D.S. Main geological and mining factors affecting ground cracks induced by underground coal mining in Shanxi Province, China. Int. J. Coal Sci. Technol. 2020, 7, 362–370. [Google Scholar] [CrossRef] [Green Version]
  71. Sun, Q.; Zhang, J.X.; Zhou, N.; Qi, W.Y. Roadway backfill coal mining to preserve surface water in western China. Mine Water Environ. 2018, 37, 366–375. [Google Scholar] [CrossRef]
  72. El-Magd, S.A.A.; Eldosouky, A.M. An improved approach for predicting the groundwater potentiality in the low desert lands; El-Marashda area, Northwest Qena City, Egypt. J. Afr. Earth Sci. 2021, 179, 104200. [Google Scholar] [CrossRef]
  73. Masoud, A.M.; Pham, Q.B.; Alezabawy, A.K.; El-Magd, S.A.A. Efficiency of geospatial technology and multi-criteria decision analysis for groundwater potential mapping in a Semi-Arid region. Water 2022, 14, 882. [Google Scholar] [CrossRef]
  74. Saranya, T.; Saravanan, S. Groundwater potential zone mapping using analytical hierarchy process (AHP) and GIS for Kancheepuram District, Tamilnadu, India. Model. Earth Syst. Env. 2020, 6, 1105–1122. [Google Scholar] [CrossRef]
  75. Razandi, Y.; Pourghasemi, H.R.; Neisani, N.S.; Rahmati, O. Application of analytical hierarchy process, frequency ratio, and certainty factor models for groundwater potential mapping using GIS. Earth Sci. Inform. 2015, 8, 867–883. [Google Scholar] [CrossRef]
  76. Rahmati, O.; Nazari, S.A.; Mahdavi, M.; Pourghasemi, H.R.; Zeinivand, H. Groundwater potential mapping at Kurdistan region of Iran using analytic hierarchy process and GIS. Arab. J. Geosci. 2015, 8, 7059–7071. [Google Scholar] [CrossRef]
  77. Jothibasu, A.; Anbazhagan, S. Modeling groundwater probability index in Ponnaiyar River basin of South India using analytic hierarchy process. Model. Earth Syst. Environ. 2016, 2, 1–14. [Google Scholar] [CrossRef] [Green Version]
  78. Sandoval, J.A.; Tiburan, J.C.L. Identification of potential artificial groundwater recharge sites in Mount Makiling Forest Reserve, Philippines using GIS and Analytical Hierarchy Process. Appl. Geogr. 2019, 105, 73–85. [Google Scholar] [CrossRef]
  79. Murmu, P.; Kumar, M.; Lal, D.; Sonkerb, I.; Singhc, S.K. Delineation of groundwater potential zones using geospatial techniques and analytical hierarchy process in Dumka district, Jharkhand, India. Groundw. Sustain. Dev. 2019, 9, 100239. [Google Scholar] [CrossRef]
  80. Ghosh, D.; Mandal, M.; Banerjee, M.; Karmakar, M. Impact of hydro-geological environment on availability of groundwater using analytical hierarchy process (AHP) and geospatial techniques: A study from the upper Kangsabati river basin. Groundw. Sustain. Dev. 2020, 11, 100419. [Google Scholar] [CrossRef]
  81. Hao, Y.; Herong, G.; Honghai, Z.; Meichen, W.; Jun, L.; Hongxia, F.; Yaqi, J.; Yaru, Z. Hydrochemical characteristics and water quality evaluation of shallow groundwater in Suxian mining area, Huaibei coalfield, China. Int. J. Coal Sci. Technol. 2020, 7, 825–835. [Google Scholar]
  82. Hui, Y.; Housheng, J.; Shaowei, L.; Zhihe, L.; Baoyu, L. Macro and micro grouting process and the influence mechanism of cracks in soft coal seam. Int. J. Coal Sci. Technol. 2021, 8, 969–982. [Google Scholar]
  83. Jun, W.; Jingxuan, Y.; Fengfeng, W.; Tengfei, H.; al Shams, F. Analysis of fracture mechanism for surrounding rock hole based on water-filled blasting. Int. J. Coal Sci. Technol. 2020, 7, 704–713. [Google Scholar]
  84. Rui, G.; Tiejun, K.; Yanqun, Z.; Wenyang, Z.; Chunyang, Q. Controlling mine pressure by subjecting high-level hard rock strata to ground fracturing. Int. J. Coal Sci. Technol. 2021, 8, 1336–1350. [Google Scholar]
  85. Chengxiao, L.; Dongming, G.; Yuantong, Z.; Chen, A. Compound-mode crack propagation law of PMMA semicircular-arch roadway specimens under impact loading. Int. J. Coal Sci. Technol. 2021, 8, 1302–1315. [Google Scholar]
  86. Rui, W.; Penghui, Z.; Kulatilake, P.H.S.W.; Hao, L.; Qingyuan, H. Stress and deformation analysis of gob-side pre-backfill driving procedure of longwall mining: A case study. Int. J. Coal Sci. Technol. 2021, 8, 1351–1370. [Google Scholar]
  87. Jinfu, L.; Fuqiang, G.; Jinghe, Y.; Yanfang, R.; Jianzhong, L.; Xiaoqing, W.; Lei, Y. Characteristics of evolution of mining-induced stress field in the longwall panel: Insights from physical modeling. Int. J. Coal Sci. Technol. 2021, 8, 938–955. [Google Scholar]
  88. André, V. Various phases in surface movements linked to deep coal longwall mining: From start-up till the period after closure. Int. J. Coal Sci. Technol. 2021, 8, 412–426. [Google Scholar]
  89. Xiaolou, C.; Ke, Y.; Zhen, W. Breaking and mining-induced stress evolution of overlying strata in the working face of a steeply dipping coal seam. Int. J. Coal Sci. Technol. 2021, 8, 614–625. [Google Scholar]
  90. Xu, Y.J.; Ma, L.Q.; Yu, Y.H. Water preservation and conservation above coal mines using an innovative approach: A case study. Energies 2020, 13, 2818. [Google Scholar] [CrossRef]
  91. Xu, Y.J.; Ma, L.Q.; Ngo, I.H.; Zhai, J.T. Continuous extraction and continuous backfill mining method using carbon dioxide mineralized filling body to preserve shallow water in Northwest China. Energies 2022, 15, 3614. [Google Scholar] [CrossRef]
Figure 1. The three-dimensional overview of CEPB water-conservation coal mining method.
Sustainability 14 06582 g001
Figure 2. The sketch map of the extracting and filling process of CEPB mining. (a) Layout of the mining and protective block. (b) The MR in the first mining phase of protective block is being excavated. (c) The MR in the second mining phase of protective block is being excavated. (d) The MR in the third mining phase of protective block is being excavated. (e) The MR of Wongawilli block is being excavated. (f) The chamber of the Wongawilli block is being extracted. (g) All Wongawilli block is extracted.
Sustainability 14 06582 g002
Figure 3. The schematic diagram of the extracting and backfilling process and the corresponding equipment for CEPB mining method. (a) The mining process of the protective block. (b) The filling process of the protective block. (c) The mining process of the Wongawilli block.
Sustainability 14 06582 g003
Figure 4. The triple-leveled model of HWCFZ of CEPB mining method.
Sustainability 14 06582 g004
Figure 5. Numerical model to simulate the HWCFZ of the CEPB mining method.
Sustainability 14 06582 g005
Figure 6. Numerical simulation results of WCFZ distribution while using CEPB mining.
Sustainability 14 06582 g006
Figure 7. The relationship between the HWCFZ and various mining heights.
Sustainability 14 06582 g007
Figure 8. The relationship between the HWCFZ and different buried depths.
Sustainability 14 06582 g008
Figure 9. The relationship between the HWCFZ and various hard-rock lithology ratios.
Sustainability 14 06582 g009
Figure 10. The relationship between the HWCFZ and various widths of Wongawilli mining block.
Sustainability 14 06582 g010
Figure 11. The relationship between the HWCFZ and various widths of the protective block.
Sustainability 14 06582 g011
Figure 12. Field measurement of borehole television logging for determining the HWCFZ. (a) The operating platform for borehole television logging. (b) The panoramic camera. (c) The support bar to transport the camera to the detection position. (d) The depth counter to measure the distance from the starting point of the drillhole to the detection position. (e) The camera guide to make it easy for the camera to pass through.
Sustainability 14 06582 g012
Figure 13. The image of borehole television logging. Images (1) to (9) show the picture when the distance from the starting point of the borehole to the detection position is approximately 15, 22, 30, 41, 52.6, 53, 55, 62, and 68.7 m, respectively.
Sustainability 14 06582 g013
Figure 14. Thematic map of the occurrence conditions of the first-mined coal seam in the Yu-Shen mining area. (a) Contour map of the first-mined coal seam thickness; (b) Contour map of the buried depth of the first-mined coal seam.
Sustainability 14 06582 g014
Figure 15. Zoning map of the hard-rock lithology ratio (Rh) in the Yu-Shen mining area.
Sustainability 14 06582 g015
Figure 16. Thematic map of scheme I while using CEPB mining method in the Yu-Shen coal area. (a) Contour map of the HWCFZ; (b) Contour map of the thickness of protective zone.
Sustainability 14 06582 g016
Figure 17. Thematic map of scheme II while using CEPB mining method in the Yu-Shen coal area. (a) Contour map of the HWCFZ; (b) Contour map of the thickness of protective zone.
Sustainability 14 06582 g017
Figure 18. Thematic map of scheme III while using CEPB mining method in the Yu-Shen coal area. (a) Contour map of the HWCFZ; (b) Contour map of the thickness of the protective zone.
Sustainability 14 06582 g018
Figure 19. Thematic map of longwall caving mining in the Yu-Shen coal area. (a) Contour map of the HWCFZ; (b) Contour map of the thickness of protective zone.
Sustainability 14 06582 g019
Figure 20. Thematic maps of the equivalent permeability (×106) of the protective zone under different mining schemes. (a) Scheme I; (b) Scheme II; (c) Scheme III; (d) Longwall caving mining.
Sustainability 14 06582 g020aSustainability 14 06582 g020b
Table 1. Results of consistency test of the experts’ scores.
MatrixSort VectorλmaxC.I.R.I.C.R.
A~B[0.1818, 0.7273, 0.0909]3.000000.520
B1~C[0.5714, 0.2857, 0.1429]3.000000.520
B2~C[0.4285, 0.2142, 0.2142, 0.1432]4.00250.00250.890.0028
B3~C[0.5455, 0.2727, 0.1818]3.000000.520
Table 2. Weights distribution of various factors affecting the HWCFZ while using CEPB.
Weights of Layer BWeights of Layer C
Overlying strata B1
0.1818
The ratio of the hard rock to the total overburden C1
0.1039
Water softening of the overburden C2
0.0519
The dilatability of the overburden C3
0.0259
Mining parameters B2
0.7273
Mining height C4
0.3112
The width of the mining block C5
0.1558
The width of the protective block C6
0.1041
Mining depth C7
0.1562
Filling body B3
0.0909
The strength of filling body C8
0.0496
The compression of C9
0.0248
The dilation of the filling body C10
0.0165
Total weights of layer B
1.0000
Total weights of layer C
1.0000
Table 3. The physical and mechanical parameters of stratum (block).
No.StratumDensity
(kg/m3)
Bulk
Modulus (GPa)
Shear
Modulus (GPa)
Friction
Angle (°)
Cohesion
(MPa)
Tensile
Strength (MPa)
1Clay19000.280.09252.00.9
2Mudstone220013.511.7231.31.0
3Sandy mudstone226012.310.5221.51.3
4Sandstone252012.210.8422.53.6
5Fine sandstone254021.113.5423.21.3
6Coarse sandstone260015.38.3312.41.6
7Siltstone251010.88.1382.81.8
8Coal seam14002.51.7281.71.5
Table 4. The physical and mechanical parameters of stratum (contact).
No.StratumNormal Stiffness (GPa)Shear
Stiffness (GPa)
Cohesion
(MPa)
Friction
Angle (°)
Tensile
Strength (MPa)
1Clay322181.0
2Mudstone972101.8
3Sandy mudstone644103.2
4Sandstone758145.7
5Fine sandstone866136.3
6Coarse sandstone655255.4
7Siltstone1087204.3
8Coal seam423151.2
Table 5. The orthogonal schemes for simulating the HWCFZ of CEPB mining.
No.Mining HeightBuried DepthThe Hard-Rock Lithology RatioThe Width of the
Wongawilli Block
The Width of the Protective Block
12.0/3.0/4.0/5.0/5.53000.44515
23.0100/200/300/400/5000.44515
33.03000.2/0.4/0.6/0.8/1.04515
43.03000.415/30/45/60/7515
53.03000.4455/10/15/20/25
Table 6. The various extracting and filling schemes of CEPB mining method.
NumberWidth of Wongawilli BlockWidth of Protective Block
Scheme I2515
Scheme II4515
Scheme III7510
Table 7. Permeability coefficient of various lithology in the Yu-Shen coal area [4].
LithologyPermeability Coefficient (cm/s)
Clay1 × 10−11–5 × 10⁻⁹
Mudstone1 × 10−11–1 × 10⁻⁸
Sandy mudstone3 × 10−9–6 × 10⁻⁵
Siltstone1 × 10−9–2 × 10⁻⁵
Fine sandstone2 × 10−7–2 × 10⁻⁴
Medium sandstone9 × 10−7–5 × 10⁻⁴
Coarse sandstone9 × 10−7–6 × 10⁻³
Publisher’s Note: MDPI stays neutral with regard to jurisdictional claims in published maps and institutional affiliations.

