Article

The Environmental Patents, Changing Investment, Trade Landscape, and Factors Contributing to Sustainable GVCs Participation: Evidence from Emerging Market Countries

College of Economics and Management, Nanjing University of Aeronautics and Astronautics, Nanjing 210016, China
*
Author to whom correspondence should be addressed.
Sustainability 2022, 14(11), 6434; https://doi.org/10.3390/su14116434
Submission received: 4 March 2022 / Revised: 9 April 2022 / Accepted: 11 April 2022 / Published: 24 May 2022

Abstract

:
Over the last two decades, the global investment and trade landscape has been transformed to include emerging economies. Theoretical studies have shown that countries can benefit from various channels to participate/integrate into global value chains. However, little is known empirically about the factors that determine the country-level and bilateral participation of emerging market countries in global value chains. We apply the generalized method of moments and fixed-effects approaches to the Eora-MRIO global value chains database to fill this research gap for twenty-three emerging market countries from 1995 to 2018. Key findings indicate that the most important determinants of country-level participation in global value chains are the country’s environmental patents and its level of economic development. Other indicators are positively associated with global value chain participation, if not determinative. The results of a gravity model for bilateral global value chains participation show that geographic proximity and policy and environmental measures are positively associated with value-added trade. These results provide insights and lessons for investors and emerging economies in creating or joining sustainable value chain activities.

1. Introduction

The global value chains’ (GVCs) participation index has become the most widely used indicator of the segmentation of multinational enterprises’ production processes among countries. GVCs’ activities take place in numerous locations with a variety of value-added in the countries when commodities cross the border more than once, the source of a rapid increase in interconnections among the developing countries during the last two decades. Multinational companies are the major source of the dispersion of production processes, so the share of intermediate inputs that cross the border more than once has increased in countries’ gross trade. As a result, the “trade in value-added” (TiVA) concept was introduced to designate the foreign and domestic value-added components in a country’s gross exports. The idea of participation in GVCs was explained by [1,2,3] further crystallized it to define countries’/sectors’ participation in simple and complex GVCs, along with its development and name change over time. Similarly [4,5] provided a comprehensive analysis of GVCs’ contribution to economic development, and [3,6] provided renewed concepts of participation in GVCs, a summary of activities under GVCs, and its scope and geographic implication across countries.
Several measures have been used to calculate the value of the countries’/firms’ participation in GVCs. Best-known among them is that of [1], later described by [7], for the MRIO database. In GVCs, it has two indexes: forward participation (domestic value-added (DVA)) in foreign exports that cross borders more than once and backward participation (or foreign value-added (FVA)) in final goods that cross borders more than once. The value of the GVCs participation index goes from 0 to 1; the higher the value of the index, the more the country’s participation in GVCs, that is, the trade in intermediate products that cross the border more than once. We can say that trade that crosses borders is prevalent, and its production is more fragmented.
The selected countries’ values of the GVC participation index differ, ranging from 0.0879 to 0.8961. Malaysia, Hungary, and the Czech Republic have the highest participation in GVCs, and Morocco, Pakistan, and Egypt have the lowest. Reasons for these differences include that some of the emerging market countries (EMCs) have very good pro-foreign trade interconnections and investment policies, and some countries have weak performance in creating value chain activities. This study is an attempt to gain insights into the common determinants of bilateral participation in GVCs across countries to help minimize these differences.
A number of recent studies have emphasized the factors that determine the level of countries’/sectors’ GVC participation [8,9,10,11]. However, none of these papers has discussed the inter-connections of EMCs in terms of their participation in GVCs. The motivation for this study is the lack of research on the macroeconomic factors that can determine the overall and bilateral participations in GVCs across EMCs. The determinants of participation in GVCs and the origins of value-added in exports arise from trade and investment flows across borders. Generally, the level of economic development, the amount of skilled labor, the financial structure, tariffs and trade barriers, domestic business and labor market regulations, whether people and capital can move across borders (i.e., the level of economic freedom), rule of law, and technological advancements, among others, have the potential to influence these countries’ overall and bilateral GVC trade.
The novelty of this paper lies in its attempt to find and evaluate the macroeconomic and standard gravity model determinants of GVCs among the EMCs and its selection of the countries under analysis, which is based on the criteria of the Morgan Stanley Capital International Emerging Market Index (the MSCI Index). GVCs have sharpened the interdependence of trade in intermediate products and foreign direct investment (FDI), and the MSCI index claims that its selection of countries as emerging markets is due to the long-captured imagination of investors that continued to transform the global investment and trade landscape to embrace these countries during last two decades. Early in the 2000s, most trade in intermediate goods took place between developed countries; until 2003, 69 percent of world exports excluded the EMCs [12]. However, by 2006, the exports of value-added trade from emerging economies realized a 25 percent average annual growth. Today, the value-added trade from emerging economies has overtaken the exports from developed countries. Another major component we consider with emerging markets’ integration into GVC participation is FDI. In recent years, emerging economies took a large share of the global investment of state-owned enterprises and multinational enterprises (MNEs) because of resource-seeking and the development of new markets for the dispersion of tasks and activities, respectively. According to UNCTAD (2016), the total value of FDI stock in emerging markets rose from $60 billion to some $2800 billion during the 2003–2015 period. The trends of value-added trade and FDI toward EMCs put them in the way of industrialization during the last two decades.
This study seeks the factors that determine the level of EMCs’ participation in GVCs in light of this investment and trade landscape as a fast track to industrialization. We use instrumental variables (IV) and fixed effects as econometric tools to check the robustness of our findings on 23 emerging markets’ annual data from 1995 to 2018. To the best of our knowledge, the selection of our macroeconomic variables for a GVC-augmented model while controlling for endogeneity is unique in the literature. Our model includes GDP per capita, human capital development, the real effective exchange rate, the economic freedom index, the share of high technology exports, profit tax, and research and development expenditures as explanatory variables for country-level participation in GVCs, with trade openness and FDI as our external instruments. To avoid omitted variables’ bias and endogeneity, we use trade openness and FDI as our instrument variables as they both met the conditions of exogeneity and relevance with GVCs. We know that GVCs are the function of both trade openness and FDI with other factors, as well, and the explanation of these variables is provided in Appendix C. For bilateral participation in GVCs, we use the structure of a standard gravity model with policy-related variables for GVCs trade among EMCs. Summary statistics, the correlation structure, and descriptions and data sources for variables are given in Appendix A, Appendix B and Appendix C, respectively.
This paper contributes to the literature by focusing not only on the presentation and discussion of emerging economies’ GVCs but also on the empirical analysis of the policy and non-policy macroeconomic factors that may determine EMCs’ overall and bilateral participation in GVCs. As recent empirical studies on participation in GVCs have not discussed the possibility of reverse causation, this paper contributes by using trade openness and FDI as external instruments to control for the problem of endogeneity. For the bilateral participation in GVCs, we regress the standard gravity model for GVCs trade to identify the demography and institutional variables that determine the integration of EMCs into bilateral GVCs trade. In a same way [13] determined some crucial factors for GVC participation at the macro-level for the ECOWAS countries, and [11,14] did the same for EU member states using micro- and macro-level data, respectively, to identify drivers of participation in GVCs. In contrast, this paper includes the demography and national economy variables of emerging markets to determine their overall and bilateral levels of participation in GVCs. The study’s findings can help the selected countries see where they stand in value-added production activities and find better opportunities to attract or fragment MNEs’ production processes, thereby increasing their level of participation in GVCs.
The rest of this paper is structured as follows: Section 2 provides a discussion of the literature review, while Section 3 discusses variables description and aggregate correlational relationships. Section 4 presents model construction and econometric methodology; Section 5 presents results and discussion; Section 6 concludes the study.

2. Literature Review

A plethora of studies has focused on the participation of firms, industries, and countries in GVCs. This paper focuses on trade in value-added (TiVA) that crosses borders more than once and does not consider gross trade but a contribution of the countries’ value-added to domestic and foreign exports. GVCs facilitate the dispersion of production processes across the globe, but some countries are known as GVCs’ factory hubs for their regions: China, Germany, and the United States are the factory hubs of Asia, Europe, and North America, respectively. Here China has emerged as a hub of simple GVCs, and Germany and the United States are hubs of complex GVCs (CGVCs).
Ref. [1] suggested the method by which the participation of firms/countries in GVCs is measured. This participation refers to the sum of DVA in intermediate exports and foreign value-added (FVA) in the production of final goods that cross the border more than once. The distribution of the value created by GVCs depends on their ability to produce and supply sophisticated and technologically sophisticated products and services to the value chains across the borders. Studies that analyze the selected countries’ participation in GVCs are lacking, although the factors that contribute to the participation of developed and developing countries in GVCs have been analyzed by, among others, (namely, [10,15,16,17,18,19,20]).
It has been found that economic development, infrastructure, and required skills for participation in GVCs are the preconditions for developing and emerging economies to integrate into GVCs and climb the value chain ladder. The study provided the basis for supportive public policies to increase their industrial competitiveness and industrial development to enable their participation in GVCs. The study also explores the structural change in selected countries that have emerged from participation in GVCs. Against the background of the rise of GVCs in Asia, the Ref. [21] documented the key factors of GVCs’ development in allowing the selected economies to reap the economic benefits from their participation. Key findings of the study are that the share of the GVCs’ value-added is associated with upstream positioning in the production process and the economic complexity of the countries. Other factors, such as enhancing the quality of the infrastructure, reducing trade barriers, developing human capital, increasing research and development, and improving the quality of institutions, can also foster and expand the share of Asian economies’ DVA. Ref. [15] found a wide range of factors that enhanced the productivity and sophistication of developing countries’ exports. Most of the countries in our selected panel are included in their sample. Their results indicate that structural factors, such as the size of a country’s market, its geography, and its level of economic development, are key factors in determining participation in GVCs. They also found that improvements in logistics and customs and reforms in trade and investment policies, infrastructure, and institutions can play a role in enhancing a country’s engagement in value chain activities.
In addition, [16] emphasized the Philippines’ involvement in value chain activities with vertical fragmented production that is measured by its participation index. The findings of the study indicate that the growing recognition of the value of GVCs has increased the drive to develop competitiveness so the country can increase its participation in GVCs’ activities and enjoy more gains by a way of higher value-added, more employment, greater productivity, and improved spillover effects. Whether in goods or services, value chains play an integral role in overall value chains, and participation and upgrading rely on competitiveness in the value added for both goods and services in the fragmentation of the production process. Ref. [17] found that, during the 1995–2011 period, South Korea radically internationalized its value chain activities. The study showed that the country continued widening the gap between gross exports and value-added exports with a change in employment structure while exacerbating wage inequality in domestic industries. Chung also found that the replacement of labor within the domestic manufacturing sector with skilled labor was another source of Korea’s active participation in GVCs. Ref. [18] provided empirical evidence of some technological features of Turkey’s participation in GVCs using the World Input-Output Database (WIOD) for the 1995–2011 period. They classified the manufacturing sector with respect to technology use and found that, in the 2000s, the country’s share of the mid- and high-technology sectors of manufacturing that participated in GVCs increased more rapidly than low-technology sectors’ participation did. They concluded that Turkey’s participation in GVCs might be better if done through technology-intensive sectors when the technology used in GVCs’ activities is imported from developed countries.
Regarding the drivers of Southern African Customs Union countries’ (including South Africa) participation in GVCs, ref. [19] summarized the general capabilities of these countries to participate in GVCs. Using a factor-content methodology, this study found that efficient logistics, proximity to markets, and strength of institutions are among the most important factors that can increase the capabilities of selected countries to participate in GVCs. However, the research also showed that each sector has unique requirements, such as fixed structural capabilities, that can limit the sectoral capabilities of a given country and that a country may be able to increase its competitiveness by reducing its policy-related gaps. Ref. [20] stated that size, age, and foreign ownership are the most important determinants of participation in GVCs for firms in the information technology sector (IT) sector. They also demonstrated that investment in IT and computer systems promote both forward and backward participation by firms and that firms’ research and development (R&D) expenditure has no impact on their participation in GVCs.
Ref. [21] analyzed the participation of new countries in East Europe and East Asia in GVCs as an important source of a rapid increase in the international production fragmentation process. Digital technologies can help small- and medium-sized enterprises participate in value chain activities [22]. The arrival of new technologies played an important role in the dispersion of production by reducing the environmental cost and its hazardous impact on sustainable value chain activities [23].
These studies make clear that the determinants of participation in GVCs by developed and developing countries differ. Some authors have argued that the quality of the infrastructure or some of its components are less important than other factors because of persistent heterogeneity in countries’ infrastructure as it relates to connectivity with international markets. Other authors have pointed to the role of technology use, the level of development, R&D expenditure, and the amount of skilled and educated workforce as the determinants of participation. The present paper seeks to include the indicators that reflect the above-mentioned objectives for EMCs in an isolated way.

3. Variables Description and Aggregate Correlational Linear Relationships

3.1. Measures of GVCs Participation and Other Variables

The idea of GVCs is challenging the views about the world economy, as production is increasing significantly while various parts of the production process (i.e., design to distribution) are increasingly segmented. Firms are focusing on complex production networks and collaborating with domestic and foreign firms to add diverse inputs to their goods and services. The discussion about GVCs is increasingly focused on new ideas and opportunities for its growth.
Ref. [24] developed two measures of vertical specialization from both import and export perspectives for an individual country. From an import perspective, vertical specialization (VS) is the import of intermediate input for export, which is measured as the amount of intermediate imported input multiplied by the ratio of gross exports to the output of each product for each country. The total vertical specialization (VS) is calculated by summing across the product for each country. This calculation estimates the actual intermediate input used for export by assuming that the ratio of intermediate input to output is the same for the output that is exported and sold domestically. This VS is also a measure of “backward participation”. From an export perspective, vertical specialization (VS1) is the exports of an individual country that are used for the production of another country for its exports. For each country, it is calculated as the sum of all products and exports’ destination of intermediate input multiplied by the ratio of export to gross output for that particular industry in the destination country. Again, here, it is also assumed that the use of each intermediate input is proportionately the same as that which is exported and sold domestically. This VS1 is a measure of “forward participation”. Vertical specialization (VS) is simply FVA (foreign value-added in exports), and VS1 is DVX (domestic value-added for other countries to re-export). If FVA and DVX are expressed as a percentage of exports, then we can calculate GVCs participation of an individual country as follows:
GVCs participation = FVA + DVX Gross   Exports
here we say that the larger the ratio, the greater the participation of an individual country in global value chains (GVCs), and we will use this measure of GVCs for the Eora-MRIO (Multi-Regional Input-Output) dataset to carry out our analysis.
Following earlier attempts to determine the factors that contribute to participation in GVCs (namely, [4,25,26,27]), our multi-country GVC participation model considers a few additional baseline explanatory variables. Moreover, we use FDI and trade openness to control for the endogenous nature of our explanatory variables and consider FDI and trade landscape transformation as our baseline argument. The data on GDP per capita from [20] capture the impact of economic development on participation in GVCs, while the data on human capital development from Penn World Table 9.0 capture the impact of a skilled and highly educated labor force. The data on the real effective exchange rate from World Bank’s World Development Indicators capture the impact of the volatility in the real effective exchange rate on sectors’/countries’ competitiveness. The data on financial development, which are taken from the IMF, capture the impact of the efficiency and ability of the financial system to assure the flow of capital for businesses across countries. The data on environmental patents, which are taken from the OECD, capture the impact of the use of sustainable innovations on the dispersion of production activities across the borders. The data on economic freedom from the Fraser Institute capture the impact of domestic institutional arrangements that determine countries’ responses to the constraints on and incentives for participating in GVCs. The data on tax on profit, also from World Bank’s World Development Indicators, capture the impact of tax rates on a business’s profit and are considered an important determinant of FDI across countries. Finally, the data on R&D expenditure as a percent of GDP, also taken from the World Bank’s World Development Indicators, are used to support the argument that the higher the R&D expenditure, the more sophisticated the production. Most recent studies favor the argument that sectors/countries with more sophisticated output participate more in GVCs.

3.2. Aggregate Correlational Linear Relationship

The economies of the selected countries expanded relatively quickly from 1995 to 2018, except for the 2008–2009 global financial crisis, which was followed by a slow-down and a speedy recovery after the crisis. We trace out the moderators of production activities that had complex value arrangements during this period. The trend of each determinant’s correlation with participation in GVCs is reported in Figure 1, Figure 2, Figure 3, Figure 4, Figure 5, Figure 6, Figure 7 and Figure 8. Most of the patterns are noteworthy. The theoretical literature has suggested that the positive/negative correlations between our possible determinants and GVCs could arise for several reasons, including policy and non-policy measures of the productivity effects of GVCs. However, the aggregate correlational and linear relationships among the variables that took place during the investment and trade landscape transformation over the period provide some useful insights.
Figure 1 presents the aggregate relationship between GDP per capita and the GVC participation index for 23 countries. The aggregate relationship suggests a positive relationship between GDP per capita and participation in GVCs since countries with a higher level of economic development enjoy a significantly higher participation rate. In particular, each additional percentage point increase in GDP per capita is associated with a 0.27 point increase in participation, which is statistically significant at the 1% level. The level of economic development (GDP per capita) explains about 48 percent of the cross-country variance in participation in GVCs.
Figure 2 plots the human capital development index against participation in GVCs for a base sample of countries to provide a preliminary estimate of this relationship. The aggregate relationship confirms a positive, robust link across countries. Each unit of increase in the level of human capital development is associated with a 0.06 percent unit increase in the GVC participation index. The estimated findings are significant at the 5% level, and the level of human capital development tends to explain 16 percent of GVC participation across countries.
Figure 3 presents the aggregate relationship between the real effective exchange rate and participation in GVCs. We can infer no significant relationship from these results.
Figure 4 shows a positive aggregate relationship between financial development and participation in GVCs since countries with a higher rate of financial development have an opportunity to participate in GVCs with a higher level of integration into value chain activities across borders. Each additional one-unit change in the financial development increases participation in GVCs by 0.09 percentage points. This estimate is statistically significant at the 1% level, and further, it explains 24 percent of the variance in GVC participation across countries.
Figure 5 shows the aggregate relationship between the economic freedom index (used as a measure of domestic institutional arrangements for participation in GVC) and participation in GVCs. The result suggests that a one-unit increase in economic freedom increases participation in GVCs by 0.02 percentage points across countries. These results are statistically significant at the 1% level. Well-functioning domestic institutional arrangements explain 33 percent of the variance in GVC participation across countries.
Figure 6 plots environmental patents against participation in GVCs to provide a preliminary analysis across the countries under analysis. The estimated results confirm a robust link between environmental patents and participation in GVCs. Each additional unit of environmental patent registration is associated with a 0.02 percentage point increase in GVC participation. The relationship is statistically significant at the 1% level, and it tends to explain 21 percent of the variance in participation in GVCs across countries.
Figure 7 plots the tax on profit against participation in GVCs to estimate an aggregate relationship across countries. The findings suggest that a 1 percent increase in tax on profit leads to a 10 point decrease in participation in GVCs in our 23 countries. This estimate is significant at the 1% level. The tax on profit explains 9 percent of the variance in GVC participation across countries.
Figure 8 shows a positive aggregate relationship between R&D expenditures and participation in GVCs across countries. The estimated coefficient suggests that a 1 percent increase in R&D expenditures increases participation in GVCs by 0.10 units across countries. This coefficient is significant at the 1 percent level. R&D expenditure explains 14 percent of the variation in GVC participation across countries.
The patterns of aggregate relationships in Figure 2, Figure 3, Figure 4, Figure 5, Figure 6, Figure 7 and Figure 8 suggest that these variables may have been drivers of EMCs’ participation in GVCs during transformations of the investment and trade landscape over the last two decades. A number of recent studies have examined possible macroeconomic indicators that can help countries participate in GVCs. However, none of these papers has suggested these policy and non-policy variables as the determinants of participation in GVCs while controlling for the problem of endogeneity for EMCs.

4. Model Construction and Econometric Methodology

Our empirical strategies rely on panel regressions using SYS-GMM to account for endogeneity concerns in GVC participation across countries and FE for bilateral GVC participation. Moreover, our GVC participation index (the sum of forward participation and backward participation) is measured in terms of annual value-added trade from 1995 to 2018 using the Eora-MRIO Global Supply Chain Database (EORA Global MRIO).

4.1. Model Construction

The regression to assess the impact of possible explanatory variables on countries’ participation in GVCs is based on the following specification from [11]:
GVCs it =   β 0 + β 1 GDPPC it + β 2 HC it + β 3 REER it + β 4 FD it + β 5 EF it + β 6 EP it + β 7 PTAX it + β 8 R & D it + ε it
where GVCs it is participation in GVCs, GDPPC it is GDP per capita, HC it is human capital development, REER it is the real effective exchange rate, FD it is financial development, EF it is economic freedom, EP it is the environmental patents, PTAX it is a tax on profit,   R & D it is the research and development expenditure of country i at time t for all variables, and ε it is a standard error term.
An empirical assessment of the determinants of GVCs in our panel dataset has some econometric issues that can be addressed with the following dynamic equation:
GVCs it GVCs it 1 =   β 0 GVCs it 1 + β 1 GDPPC it + β 2 HC it + β 3 REER it + β 4 FD it + β 5 EF it + β 6 HTE it + β 7 PTAX it + β 8 R & D it + μ t + η t + ε it
Δ GVCs it =   α GVCs it 1 +   θ X it +   μ t + η t + ε it   ,
where Δ GVCs it is the change in GVC participation in country i at time t. The terms μ t   and   η t denote all common factors that affect all of the countries and capture unobserved country-effects characteristics. The second equality defines Xit = (GDPPCit, HCit, REERit, FDit, EFit, EPit, PTAXit, R&Dit, FDIit) and θ = ( β 0   and   β 8   ) .

4.2. Econometric Methodology

Generalized Method of Moments

Dynamics equations like our Equation (2), when used with panel data, face the problem of endogeneity with their regressors. Generally, this problem will affect the causality of explanatory variables, such as GDP per capita, human capital, the real effective exchange rate, and so on. Further, it can be argued that the set of explanatory variables is jointly determined with other endogenous variables related to the economy and that they may be subject to reverse causation from the dependent variable (the GVC measure). Therefore, the correlation between the endogenous variable and the error term will cause simultaneity and endogeneity bias, and the ordinary least squares (OLS) regression in the presence of these issues will produce biased and unreliable results such that the resulting estimates will violate one of the assumptions of classical linear regression models. Considering these problems, we use the generalized method of moment (GMM) panel data estimation strategy that Arellano and Bond [28] introduced.
For efficiency with the GMM estimators, we developed a set of external instruments discussed in previous studies to rule out the possibility that invalid instruments drive explanatory variables’ effects. Hence, for this study, we drop the internal instruments (i.e., the explanatory variables’ lag values) and replace them with the current and lagged values of the external instruments (trade openness and FDI) during the regression process. To address this particular problem of endogeneity, trade openness and FDI are used as external instruments.
The GMM estimator is preferred over other panel data estimators, as it helps to counter cross-country effects through first-order differentiation and to control for possible endogeneity in the explanatory variables by using an orthogonal condition between the dependent variable’s lag value and the error term [11]. Therefore, we assume that the estimation result from SYS GMM using external instruments is sufficiently reliable to interpret.

5. Results and Discussion

The basic objective of this study is to analyze the impact of environmental patents and other macroeconomic variables on participation in global value chains in emerging market countries. The important thing from 
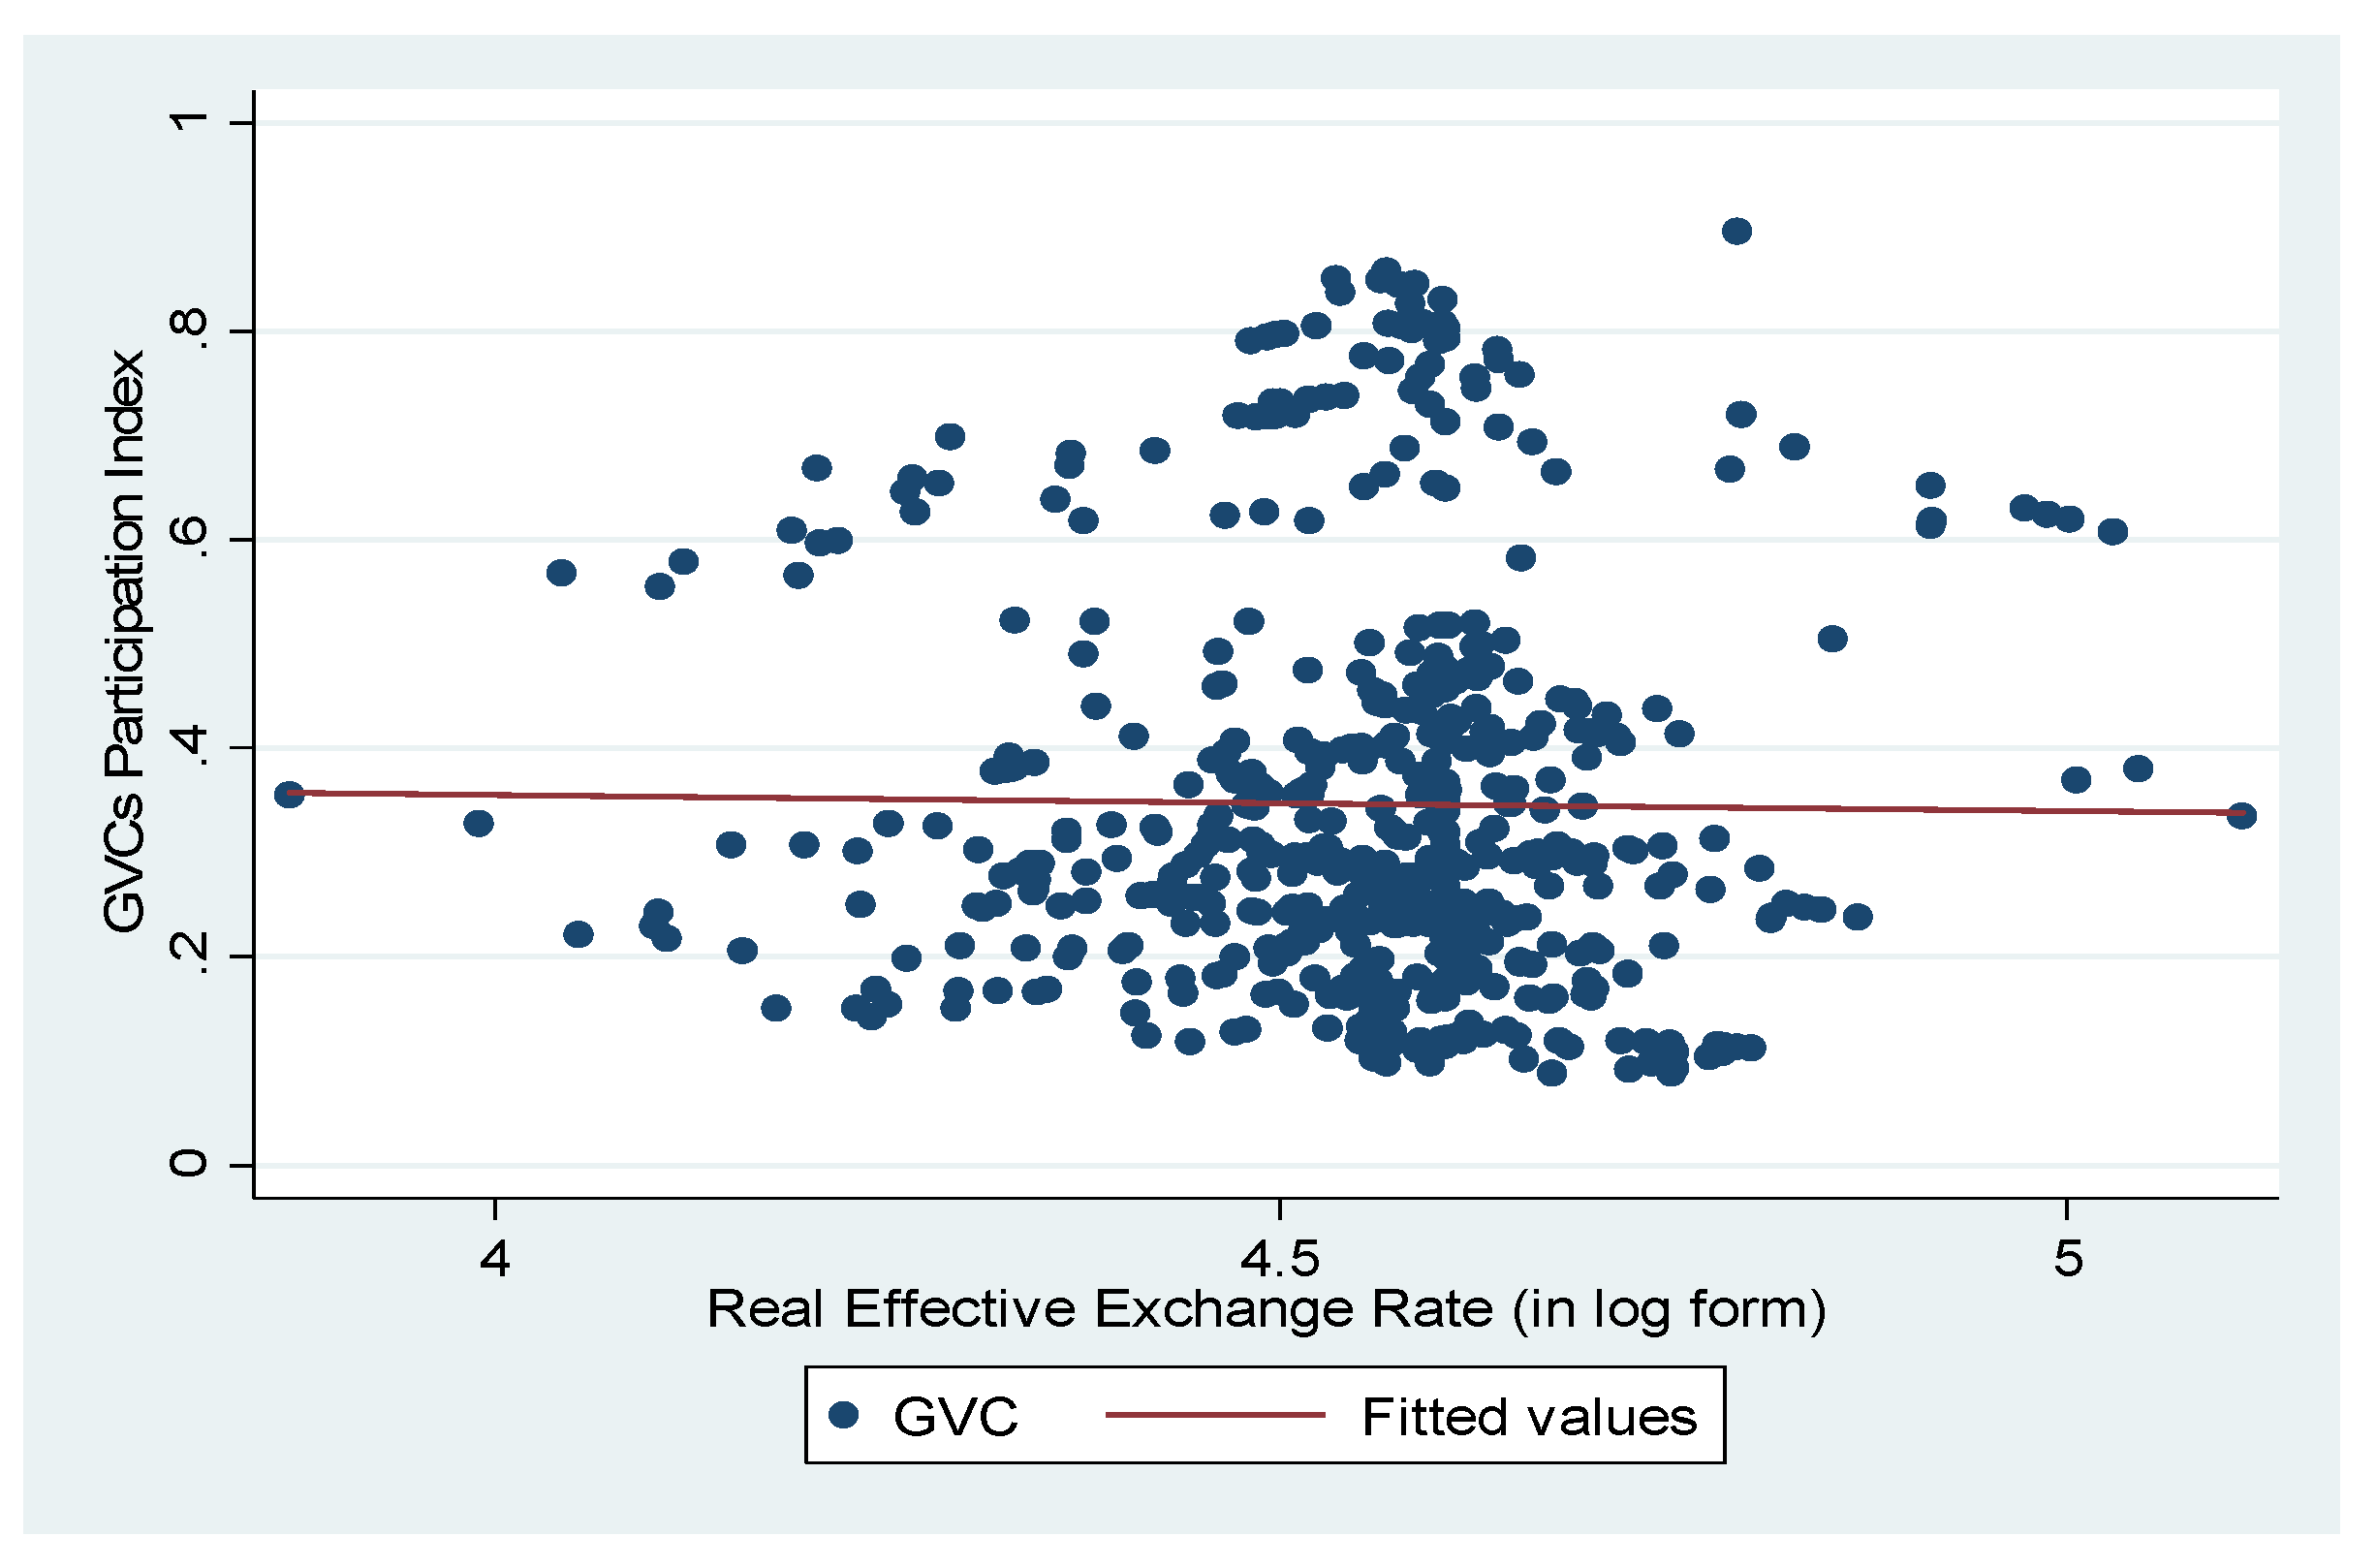
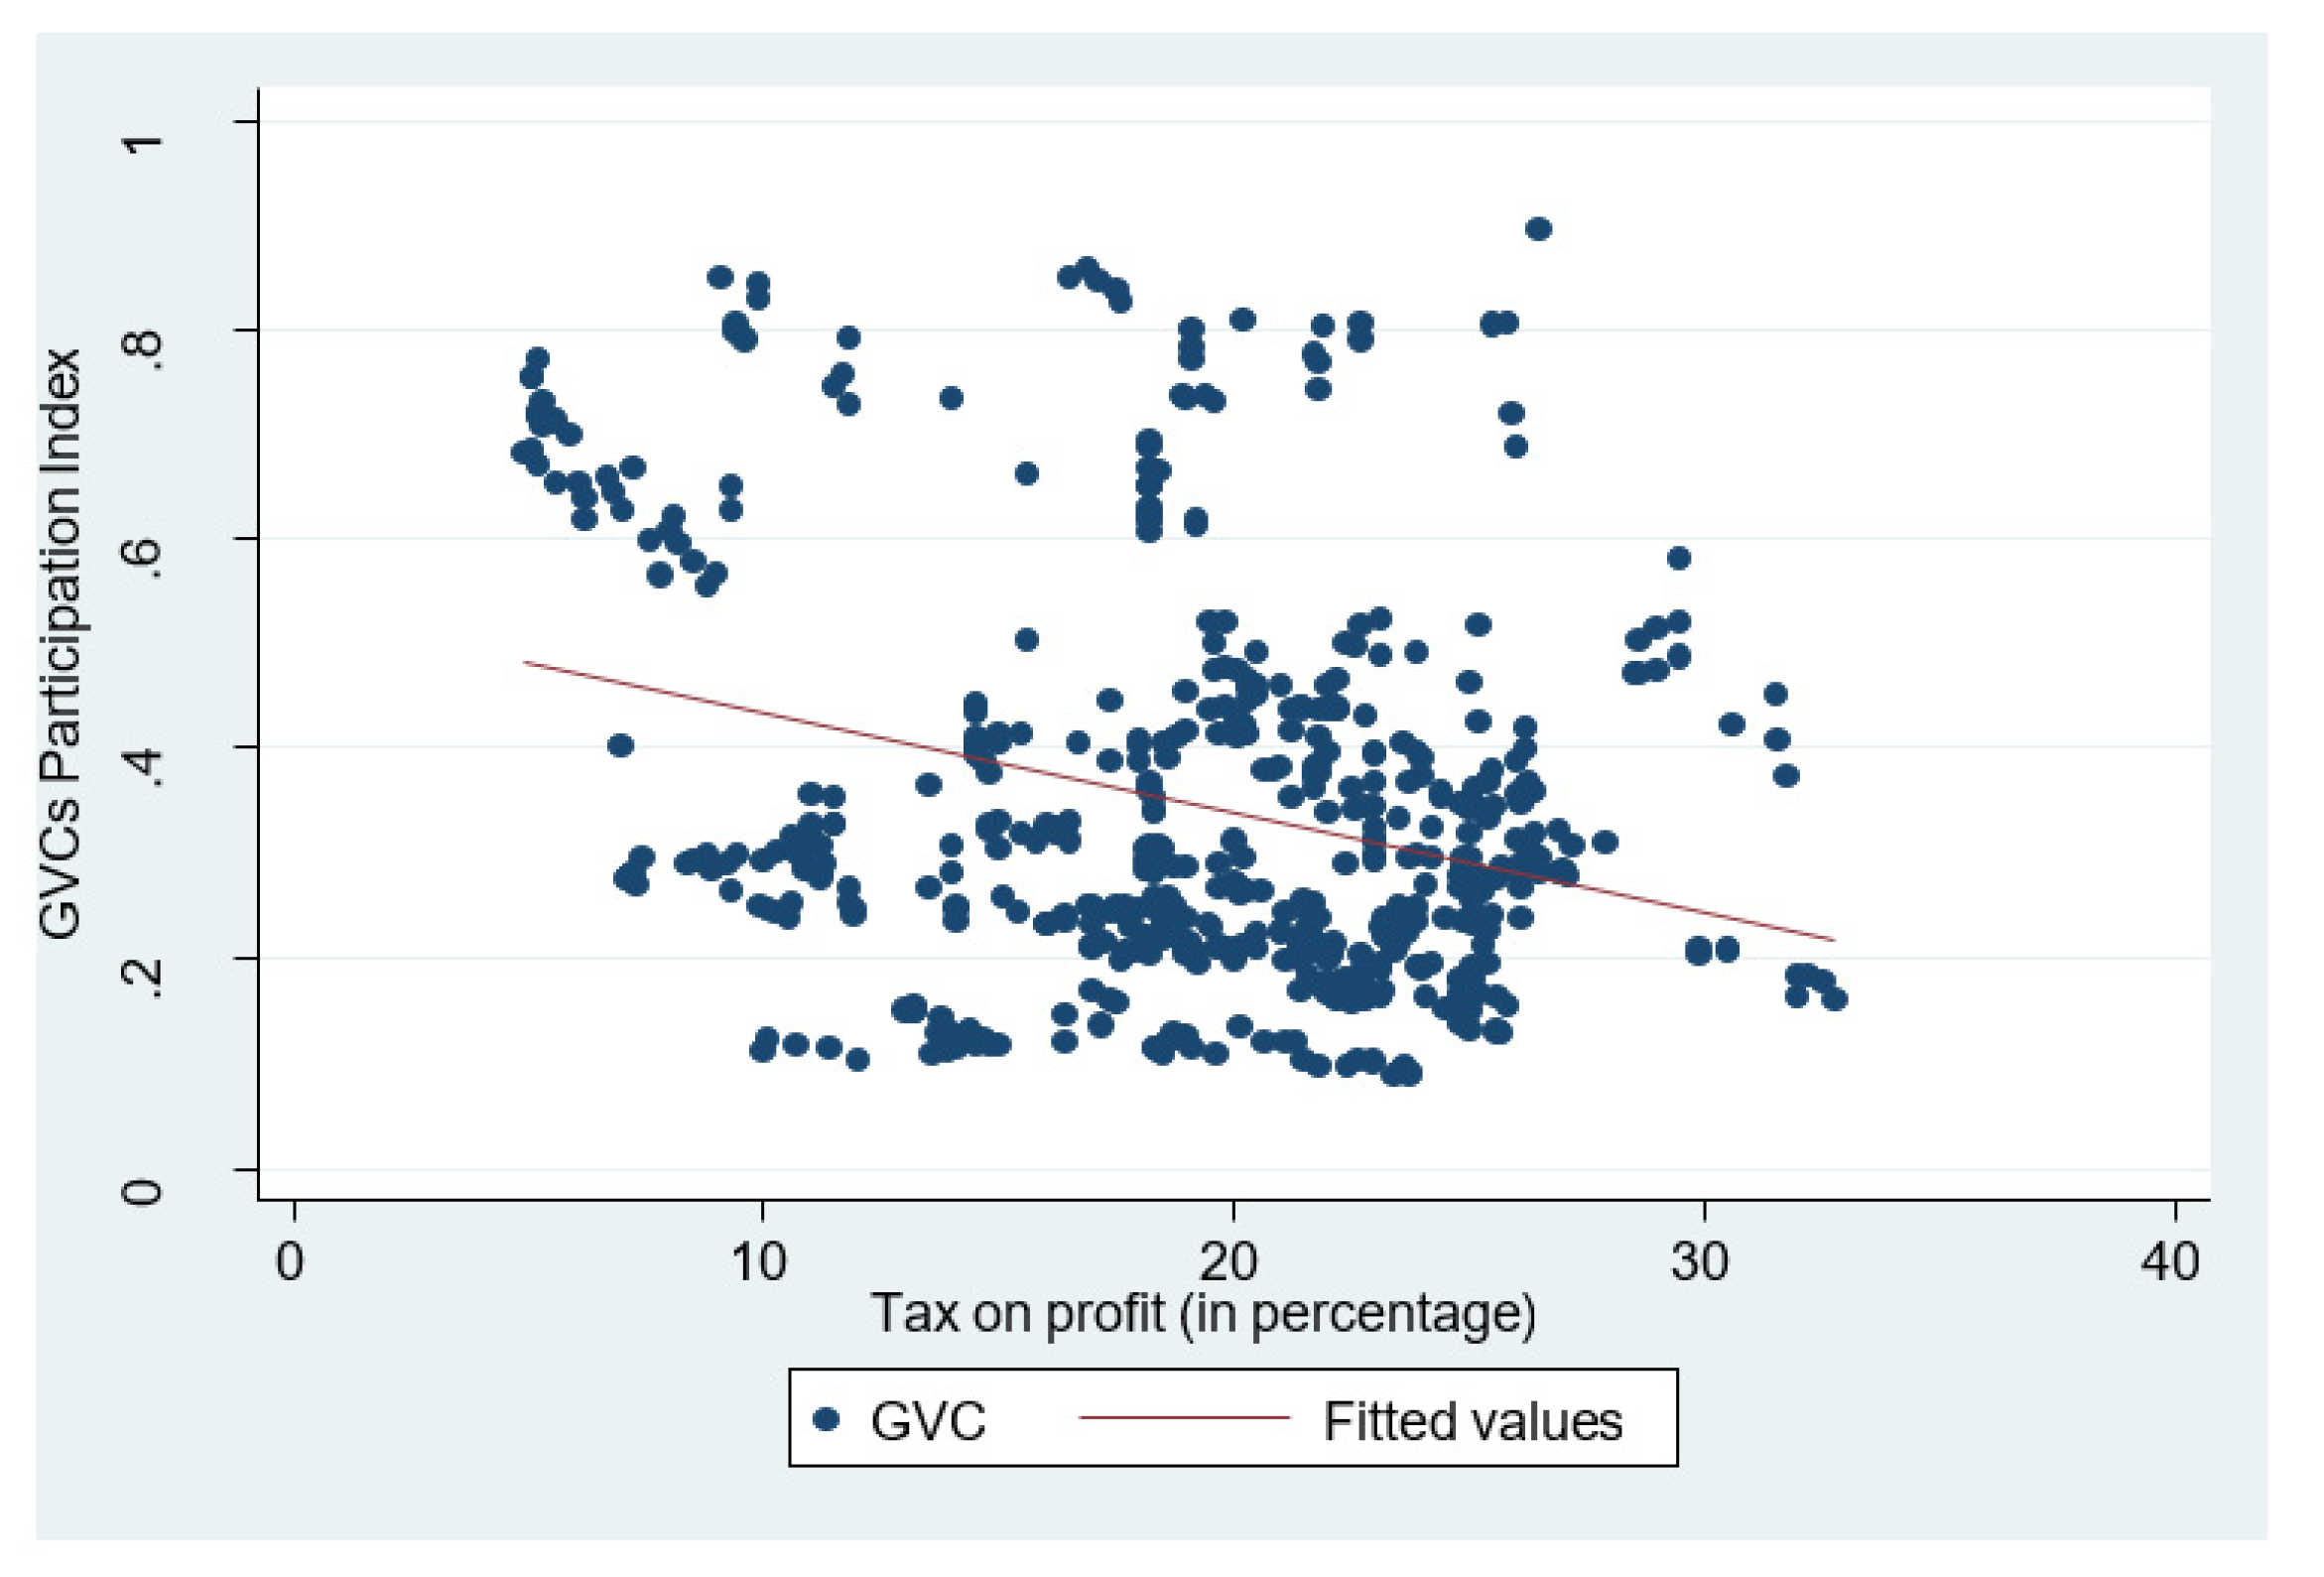
Table 1 is to note that with other determinants, the environmental patents have the highest positive correlation with GVCs participation. Further, a negative correlation between the real effective exchange rate and tax on profit is also notable for further analysis.
Empirical findings from the regression of our baseline specification model are presented in Table 2. The panel of 23 EMCs is unbalanced because of the missing values of some variables in the period from 1995 to 2018. Our regression process includes the lag value of the dependent or predetermined variable and two lags for the endogenous variables (internal instruments and external instruments) to deal with the problem of endogeneity.
Using various estimation methods, the model regression was augmented with possible determinants of participation in GVCs, as reported in Table 2. Table 2 shows the country effects and common-time effects. As for the standard determinants of participation in GVCs, the signs are according to expectations, with the tax on profit indicator, which carries a negative significant coefficient, the sole exception. On the other hand, the coefficients obtained through the use of time-effects are high, although their magnitude is close to within-group estimators. In both these estimators, the regressors’ potential endogeneity is ignored, so the potential endogeneity of the determinants is not corrected by these estimators. The GMM difference estimator has been employed in our model to address the endogeneity problem, as shown in Table 2. The table shows that most of the variables have the same result and significant and positive coefficients. In addition, the null hypothesis of over-identification restrictions, the Sargan test for Difference GMM, shows the null hypothesis can be rejected, and the second-order correlation (AR-2) does not show any indications of misspecifications.
As shown through our preferred estimate (SYS-GMM, along with external instruments used as robustness checks) in 
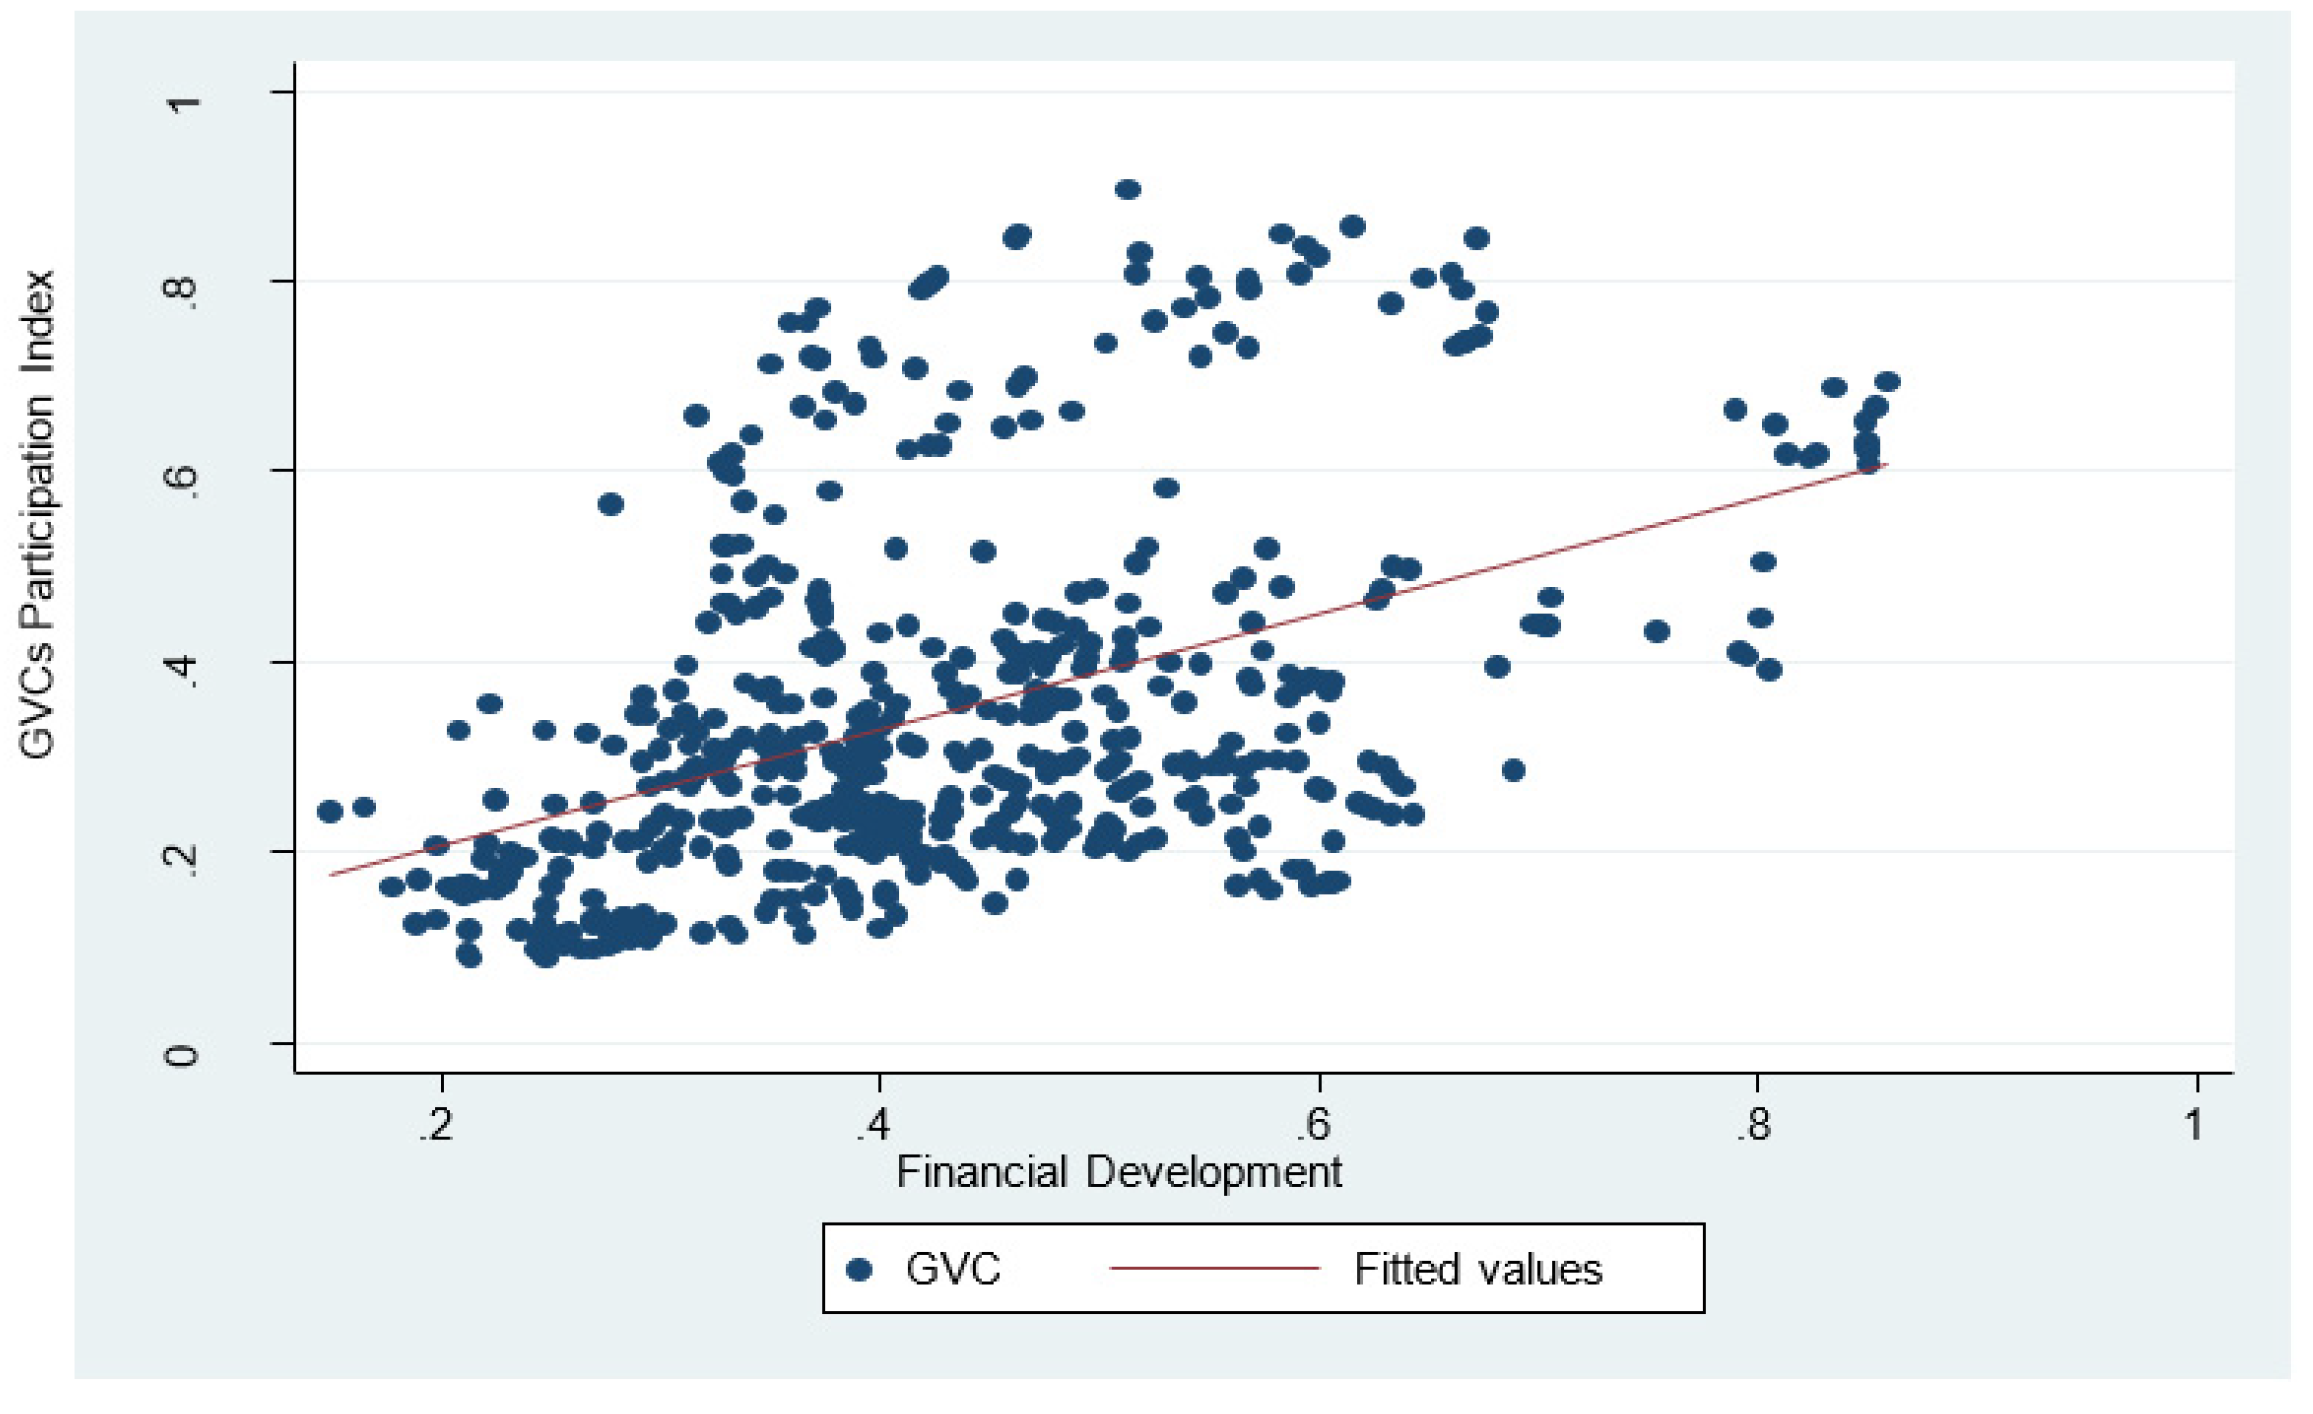
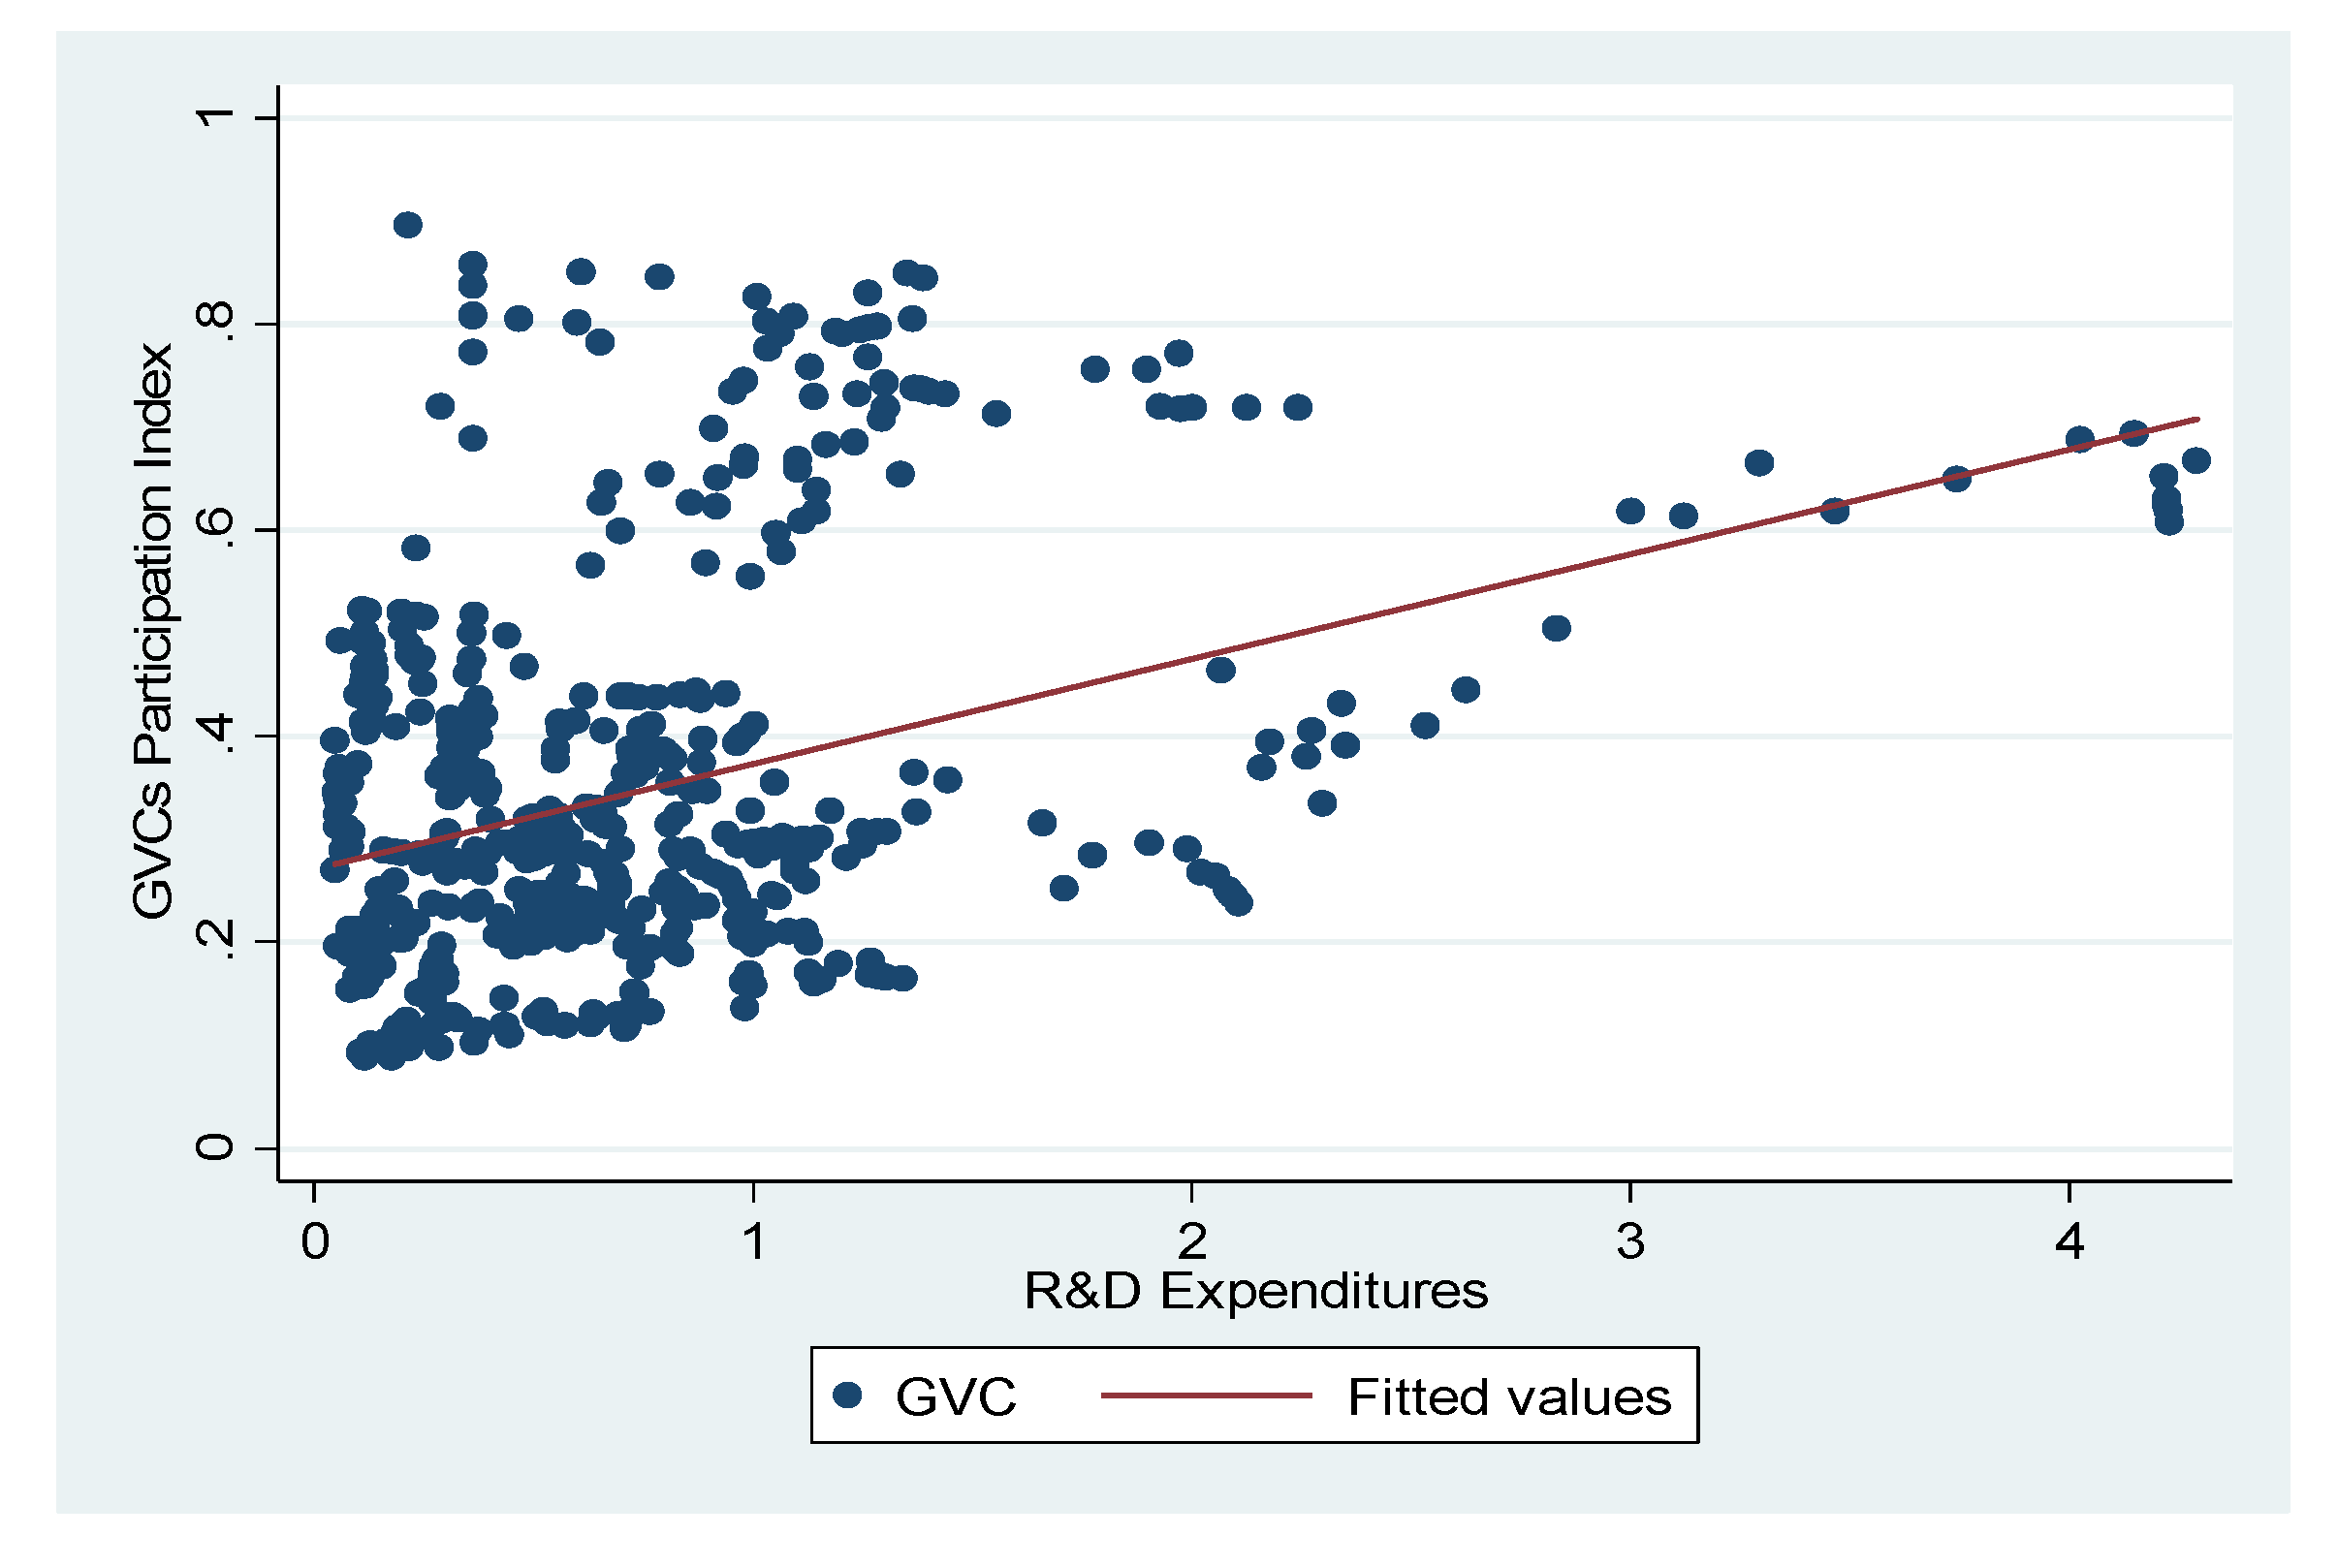
Table 2, the strongest and most significant influences on participation in GVCs are the lag of the dependent variable and the environmental patents. The coefficients for the other determinants are also according to our expectations. The question that arises concerns the contribution of these variables. For a positive and significant impact of GDP per capita on GVCs, there is evidence in the literature that economic growth (GDP per capita in our case) in emerging countries has led to shifting end markets in GVCs as more trade in value-added terms has occurred in these countries. After the 2000s, China, South Korea, India, and Mexico became major exporters of final and intermediate goods, and Brazil, Russia, and South Africa became major exporters of primary products. Human capital development has a weaker but still significant and positive impact, while the real effective exchange rate, financial development, economic freedom, and environmental patents have positive and significant impacts. The results for the real effective exchange are in accordance with our expectation that lower elasticity of REER would increase the manufacturing exports, which plays an important role in determining the countries’ competitiveness in the international trading system. The positive and significant coefficient of financial development is also in line with the argument that a sound financial structure helps to ensure that a country is compatible with the international business environment and increases its participation in value chain activities. The positive and significant coefficient of environmental patents is also in line with the argument that environment-friendly innovations are considered and regarded as a solution for sustainable value chain activities. The positive significance of the coefficient of economic freedom has some important implications for the analysis, as the impediments to a business-friendly environment and market openness affect a country’s ability to participate in GVCs. The trend of economic freedom in emerging economies is increasing over time, so the higher the value of the economic freedom index, the more integrity there is with which domestic legal and economic institutions can facilitate participation in GVCs. Rates for tax on profit have a negative and significant impact on participation in GVCs, so most EMCs are extending their tax networks and introducing tax barriers to cross-border trade and foreign investment to increase the competitiveness of their domestic firms and the development of GVCs. R&D expenditure has a positive significant impact, as it is the source of technological advancement and more sophisticated production to increase value-adding activities across the borders. As discussed in previous studies on participation in GVCs, these findings are in line with the economic theory.
These findings refer to national economies’ participation in GVCs, not to specific sectors of the countries under analysis, and are found to be robust in various types of regressions. The signs and significance of the coefficients of our selected variables are in keeping with economic theory. Environmental patents, the level of economic development, and the lag of GVC participation are the variables that determine participation in GVCs across countries. EMCs are known as the homes of MNEs, and the influence of most of the variables is robustly significant, so these findings are in line with the argument that MNEs’ activities in these countries have already taken place and that their businesses involve the purchase and production of intermediate products that cross the border more than once at a large scale. Therefore, MNEs increase the participation of most of our 23 countries in GVCs. The results also confirm that sustainable innovations, i.e., total patents registered for technology and innovation related to the environment, are an important driver of the comparative advantage of the location of production, which is in accordance with production theory. The sign of the coefficient of the real effective exchange rate is also positive, so an increase (or stability) in the real effective exchange rate increases GVC participation significantly, perhaps because MNEs prefer to invest in countries with stable exchange rates (which is in accordance with FDI theory). The positive impact of economic freedom can be explained by the increasing importance of the domestic institutional arrangements for value chain activities; the economic freedom index is increasing over time, or these countries have already built strong institutional systems to facilitate businesses that are involved in value chain activities. The negative coefficient of tax on profit indicates that countries with a high tax on profit have relatively less participation in GVCs, as a high rate of taxes on MNEs’ profits discourages the businesses and FDI.

Determinants of Bilateral Participation in GVCs

In the previous analysis, we used an aggregated “world level” measure of participation in GVCs and its determinants for EMCs. However, that analysis does not address how these countries integrate into bilateral sector/industry-level participation in GVCs with each other. For this purpose, we decompose our country-level GVCs participation index further by sources and destinations to reveal bilateral GVCs relationships for industries with major production-sharing partners across EMCs. Following ref. [29], we use FVA exports, also known as backward linkages, to capture the demand side of the intermediate inputs among EMCs for bilateral GVC integration. The best method to analyze bilateral trade is a structural gravity equation. Ref. [30] argues that the standard structural gravity equation does not explain bilateral trade flow across countries as it is unable to consider multilateral resistance terms. Another argument given by [31] against the use of the traditional gravity model in value-added trade is that purchases are now driven by both consumer demand, where income is the determinant of demand elasticity, and intermediate demand, where total production is the determinant of demand elasticity. However, the solution to these problems is to augment the standard gravity equation with importer and exporter fixed effects. Following the above arguments, our model for bilateral GVCs relationship is as follows:
FVA ij = α 0   Y i α 1 Y j α 2 PTA ij α 3 ENV ij α 4 EOD ij α 5 e θ i d i + θ j d j  
where α 0 ,   α 1 ,   α 2 ,   α 3 ,   α 4 ,   α 5 ,   θ i , and θ j are the parameters to be estimated, Y i   Y j is the income of the country i and country j, PTA ij is a preferential trade agreement between respective countries, ENV ij is the total number of environmental patents related to value-added trade, EOD ij is the ease of doing business in countries involved in bilateral GVCs trade, and d i and d j are the dummy characteristics of importer and exporter countries. It is also predicted that α 1 =   α 2 = 1 , which is the unit elasticity of income/GDP.
FVA ij = α 0   Y i   Y J PTA ij α 3 ENV ij α 4 EOD ij α 5 e θ i d i + θ j d j
The stochastic version of our gravity equation is:
E ( FVA ij | Y i ,   Y j ,   PTA ij ,   ENV ij , EOD ij ,   d i ,   d j ) = α 0   Y i   Y J PTA ij α 3 ENV ij α 4 EOD ij α 5 e θ i d i + θ j d j  
Here it is natural for the reader to raise a question about how this model deals with zero-value observations as we have countries with zero bilateral GVCs participation. The answer to this question is the presence of individual effects that we included in Equation (3), and we argue here that this may reduce the problem of zero-value observations of countries’ GVCs participation and selection bias, as well. However, whether that happens or not is an empirical issue, and we deal with it in our previous section when we calculated an individual country’s value-added trade using “backward linkages” and “forward linkages”. The analysis of this part also covers 23 countries over the 1995–2018 period, and the dataset consists of 12,144 observations of bilateral GVCs trade flows (23 × 22 × 24 country pairs with the 24-year time span, respectively). The list of variables and countries is reported in Appendix B and Appendix C.
We used a theory-grounded gravity model to evaluate the bilateral participation in GVCs among EMCs. The gravity model has been used extensively in the trade literature because of its empirical and theoretical usefulness, and we augmented it in accordance with valid arguments from different studies. Table 3 presents the results for the augmented gravity determinants and policy and the environment-related variables for EMCs’ insertion into GVCs, measured by backward integration. The Poisson Pseudo Maximum Likelihood (PPML) regression of Equation (5) reveals that for the positive GVCs sample, physical proximity (size of GDP) with other country-pair characteristics, such as distance and a common border and colonial history, are important determinants of bilateral participation in GVCs, measured by FVA among EMCs. These results suggest that a positive change in the intra-community GVCs trade between industrial sectors has a positive impact on EMCs’ participation in GVCs. The results of including policy-related variables in our standard gravity specification show that both preferential trade agreements and the ease of doing business increase countries’ bilateral participation in GVCs. The coefficient of the environmental technology in the partner country is also positively significant for bilateral participation in GVCs. GVC theory suggests that the industrial sector is positively related to FVA/backward linkages, so by using the backward linkages of EMCs’ industry-level participation in GVCs, we add to the theory that geographical proximity is relatively more important for the manufacturing industry than policy and environmental variables.
However, backward linkages capture the demand side of the value chains, so these results suggest for EMCs that growing industrialization increases demand for intermediate inputs for exports. As we argued earlier, the global investment and trade landscape has been transformed toward EMCs, so participation in bilateral GVCs is now more accessible to these countries from the demographic, policy, and institutional perspectives. On the basis of these findings, we can say that investment and foreign trade boost various manufacturing sectors, increase competitiveness, and improve the business environment for the expansion of value chain activities through backward linkages (demand side of the intermediate input) among these countries.

6. Conclusions and Policy Implications

Foreign direct investment and international trade remain a topic of interest because they constitute a strong weapon for countries’ economic development. Although trade using GVCs has rapidly developed since the 2000s, the empirical work on its links, determinants, and implications is not well perceived. This paper identifies the key determinants that affect the participation in GVCs of emerging market countries. The study also examines the bilateral participation of EMCs in GVCs by discussing the role of standard gravity determinants, policy, and environmental variables, using data from 23 countries from 1995 to 2018. To prevent potential endogeneity, we employed numerous instrumental variables (IV) techniques for the determinants of participation in GVCs. Although consensus has already been reached regarding the determinants of participation in GVCs across countries, the literature is divided between the choice of countries and empirical strategies.
Participation in GVCs of the emerging market countries is a fast track to industrialization. The findings of this study broaden the discussion of GVCs and their determinants. As FDI inflows and the share of foreign trade in EMCs have increased rapidly over the last two decades, we estimated the impact of various macroeconomic variables that affect multinational enterprises and other foreign investors’ decisions about the location/segmentation of their production processes and investments that determine value chain activities. The study’s findings led to useful insights into the extent and potential of EMCs’ policies, use of sustainable and environmentally friendly technologies, and geographical proximities of bilateral integration and participation in GVCs. We used an instrumental variables approach to avoid reverse causation, and the common findings are in accordance with our expectations, as the lags of GVCs participation, environmental patents, and level of development (GDP per capita) have the highest positive and significant impact on participation in GVCs; except for tax on profit, all variables have a positive influence on EMCs’ participation in GVCs. The findings are in line with economic theory and studies that have dealt with value-added trade across countries. Further, our findings show that geographical proximity and environmental patents have a positive and significant impact on bilateral participation in GVCs through backward linkages. These findings suggest that intra-regional and intra-community GVCs trade, backed by strong policy and institutional measures, is positively related to growing backward participation and that this backward integration can be a powerful instrument with which emerging market countries can insert themselves into the global trading system.
The results of the present research complement previous findings on the determinants of participation in GVCs at the aggregate/national level and provide insights and lessons for individual economies in creating or joining GVCs. In sum, emerging market countries must create an enabling environment for foreign investors and multinational enterprises to insert themselves into the GVCs, especially in the production of more sophisticated and environmentally friendly export bundles and in increasing the diversification of value-added exports. Guiding principles on foreign trade and investment policies that are conducive to bilateral and country-level value chain activities could also be developed and adopted in EMCs.

Author Contributions

Conceptualization, M.N. and L.X.; methodology, M.N.; software, M.N.; validation, L.X., M.N. and Z.W.; formal analysis, M.N.; investigation, L.X.; resources, M.N.; data collection, M.N. and L.X.; writing—original draft preparation, M.N.; writing—review and editing, M.N. and L.X.; visualization, L.X.; supervision, Z.W.; project administration, Z.W. All authors have read and agreed to the published version of the manuscript.

Funding

This research is funded by the National Social Science Foundation of China (18AGL028).

Institutional Review Board Statement

There was no any human involved for experiment purpose in this study.

Informed Consent Statement

Not applicable.

Data Availability Statement

Data is available with authors and can provided at demand.

Conflicts of Interest

The authors declare no conflict of interest.

Appendix A. Summary Statistics

VariablesObs.MeanStd. Dev.MinMax
GVCs Participation5520.34670.18820.08790.8961
GDP per capita (in log form)5528.81750.96616.433411.1937
Human Capital5522.56770.50481.42913.6573
Real Effective Exchange Rate55295.423914.063947.9533165.8772
Financial Development5520.43170.13520.14950.8592
Economic Freedom5526.67870.58964.337.91
Environmental Patents5526875.6432030.580146,789.8
Profit Tax55218.59116.05734.930.5
R&D Expenditure5521.18193.60580.0475631.5608
Source: Authors’ own calculation

Appendix B. Variables Description and Data Sources

VariablesDefinitionSources
GVCs Participation IndexCountry’s participation in global value chains is defined as the sum of both forward participation and backward participation divided by gross exports.Eora-MRIO Global Value Chain (GVC) database (2018)
GDP per CapitaIt measures a nation’s gross domestic product per capita. The variable is adjusted for purchasing power parity and is expressed in 1000s of US dollars. It has been used as a proxy to measure the level of economic development by many studies. World Bank, World Development Indicators (2018)
Human Capital Development IndexIt is based on the average years of schooling from Barro and Lee (BL, 2013) and an assumed rate of return to education, based on Mincer equation estimates around the world (Psacharopoulos, 1994).Penn World Table 9.0
Real Effective Exchange RateReal effective exchange rate is the nominal effective exchange rate (a measure of the value of a currency against a weighted average of several foreign currencies) divided by a price deflator or index of costs.World Bank, World Development Indicators (2018)
Environmental PatentsTotal Patents Registered for Technology Innovation Related to Environment.OECD, (2018)
OECD DATABASE
Economic Freedom Index EFI measures the degree of economic freedom in the nations using the scale from 1 to 10.The Fraser Institute (2018)
Financial Development It is based on the level of development of financial institutions and financial markets in terms of their efficiency, access, and depth. International Monetary Fund (2018)
Profit Tax (% of commercial profits)Profit tax is the amount of taxes on profits paid by the business. We included the data for 2005 to 2015 due to their availability. World Bank, World Development Indicators (2018)
Research and Development Expenditure (R&D)Gross domestic expenditure on research and development as percentage of GDP.World Bank, World Development Indicators (2018)
Foreign Direct Investment (FDI inflows)Foreign direct investment, net inflows in current US dollars has been used.World Bank, World Development Indicators (2018)
Trade Openness Trade openness is measured by the ratio between the sum of exports and imports and gross domestic product (GDP).World Bank, World Development Indicators (2018)
Preferential Trade AgreementsWe use a PTA variable based on the information provided by the WTO on trade agreements. We create a dummy variable that takes the value of one when the agreements is in force (for a given year) between a pair of countries.World Trade Organization (2018)
Ease of Doing BusinessA high ease of doing business ranking means the regulatory environment is more conducive to the starting and operation of a local firm. Economies are ranked on their ease of doing business, from 1–190.The World Bank (2018)

Appendix C. List of Emerging Market Countries (EMCs) under Analysis

BrazilMexico
ChileMorocco
ChinaPakistan
ColombiaPeru
Czech RepublicPhilippines
EgyptPoland
GreeceQatar
HungaryRussia
IndiaThailand
IndonesiaTurkey
South KoreaSouth Africa
Malaysia
According to MSCI of 2019, there are 26 emerging market countries (EMCs), but our analysis is focusing on 23 countries due to the non-availability of data of Argentina, Taiwan, Saudi Arabia, and UAE.

References

  1. Koopman, R.; Powers, W.; Wang, Z.; Wei, S.-J. Give Credit Where Credit is Due: Tracing Value Added in Global Production Chains; NBER Working Paper: New York, NY, USA, 2010; p. 16426. Available online: https://www.nber.org/papers/w16426 (accessed on 7 January 2017).
  2. Gereffi, G.; Fernandez-Stark, K. Global Value Chain Analysis: A Primer. Center on Globalization, Governance Competitiveness (CGGC); Duke University: Durham, NC, USA, 2011. [Google Scholar]
  3. Wang, Z.; Wei, S.J.; Yu, X.; Zhu, K. Measures of Participation in Global Value Chains and Global Business Cycles; (No. w23222); National Bureau of Economic Research: Cambridge, MA, USA, 2017. [Google Scholar]
  4. Taglioni, D.; Winkler, D. Making Global Value Chains Work for Development; The World Bank Group: Washington, DC, USA, 2016. [Google Scholar]
  5. Taguchi, H.; Li, J. Domestic value creation in the involvement in global value chains: The case of Chinese economy. Asian Dev. Policy Rev. 2018, 6, 155–168. [Google Scholar] [CrossRef] [Green Version]
  6. Hernández, V.; Pedersen, T. Global value chain configuration: A review and research agenda. Bus. Res. Q. 2017, 20, 137–150. [Google Scholar] [CrossRef]
  7. Aslam, A.; Novta, N.; Rodrigues-Bastos, F. Calculating Trade in Value Added; International Monetary Fund: Washington, DC, USA, 2017. [Google Scholar]
  8. Bamber, P.; Fernandez-Stark, K.; Gereffi, G.; Guinn, A. Connecting Local Producers in Developing Countries to Regional and Global Value Chains. 2014. Available online: https://www.oecd-ilibrary.org/trade/connecting-local-producers-in-developing-countries-to-regional-and-global-value-chains_5jzb95f1885l-en (accessed on 16 April 2020).
  9. Cheng, M.K.C.; Rehman, S.; Seneviratne, M.D.; Zhang, S. Reaping the Benefits from Global Value Chains; (No. 15-204); International Monetary Fund: Washington, DC, USA, 2015. [Google Scholar]
  10. Cattaneo, O.; Gereffi, G.; Miroudot, S.; Taglioni, D. Joining, Upgrading and Being Competitive in Global Value Chains: A Strategic Framework; The World Bank: Washington, DC, USA, 2013. [Google Scholar]
  11. Kersan-Škabić, I. The drivers of global value chain (GVC) participation in EU member states. Econ. Res.-Ekon. Istraživanja 2019, 32, 1204–1218. [Google Scholar] [CrossRef]
  12. Purdy, M.; Peppes, A.; Ovanessoff, A.; Wei, K. The Rise of E2E Integration: How Trade and Investment between Emerging Markets Is Reshaping Global Competition. 2012. Available online: https://www.criticaleye.com/inspiring/insights-servfile.cfm?id=3395w16426 (accessed on 7 January 2017).
  13. Tinta, A.A.; Sarpong, D.B.; Ouedraogo, I.M.; Al Hassan, R.; Mensah-Bonsu, A.; Onumah, E.E. The effect of integration, global value chains and international trade on economic growth and food security in ECOWAS. Cogent Food Agric. 2018, 4, 1465327. [Google Scholar] [CrossRef]
  14. Edvard, O.; Radicic, D.; Balavac, M. R&D and innovation policy in the Western Balkans: Are there additionality effects? Sci. Public Policy 2019, 46, 876–894. [Google Scholar]
  15. Kowalski, P.; Gonzalez, J.L.; Ragoussis, A.; Ugarte, C. Participation of Developing Countries in Global Value Chains: Implications for Trade and Trade-Related Policies. 2015. Available online: https://www.oecd-ilibrary.org/trade/participation-of-developing-countries-in-global-value-chains_5js33lfw0xxn-en (accessed on 23 September 2021).
  16. Serafica, R.B. APEC 2015: Global Value Chains and Services (No. 2015-11); PIDS Discussion Paper Series; Philippine Institute for Development Studies (PIDS): Makati City, Philippines, 2015. [Google Scholar]
  17. Chung, S. Korea’s Participation in Global Value Chains: Measures and Implications. KDI J. Econ. Policy 2016, 38, 45–76. [Google Scholar] [CrossRef] [Green Version]
  18. Gündoğdu, C.; Saracoğlu, D.Ş. Participation of Turkey in Global Value Chains: An Analysis Based on World Input Output Database; Economic Research Center, Department of Economics, Middle East Technical University: Ankara, Turkey, 2016. [Google Scholar]
  19. Pathikonda, V.; Farole, T. The capabilities driving participation in global value chains. J. Int. Commer. Econ. Policy 2017, 8, 1750006. [Google Scholar] [CrossRef]
  20. Pattnayak, S.S.; Chadha, A. India in Global Services Value Chain. J. Southeast Asian Econ. 2019, 36, 204–223. [Google Scholar] [CrossRef]
  21. Hillberry, R. Causes of international production fragmentation: Some evidence, Chapter 3. In Global Value Chains: Impacts and Implications; Sydor, A., Ed.; Department of Foreign Affairs and International Trade Canada (DFAIT): Ottawa, OA, Canada, 2011. [Google Scholar]
  22. Bretschger, L.; Pittel, K. Twenty key challenges in environmental and resource economics. Environ. Resour. Econ. 2020, 77, 725–750. [Google Scholar] [CrossRef] [PubMed]
  23. Hummels, D.; Ishii, J.; Yi, K.M. The nature and growth of vertical specialization in world trade. J. Int. Econ. 2001, 54, 75–96. [Google Scholar] [CrossRef]
  24. Patel, N.; Wang, Z.; Wei, S.-J. Global value chains and effective exchange rates at the country-sector level. J. Money Credit Bank. 2019, 51, 7–42. [Google Scholar] [CrossRef] [Green Version]
  25. Gehl Sampath, P.; Bertha, V. Trade, global value chains and upgrading: What, when and how? Eur. J. Dev. Res. 2018, 30, 481–504. [Google Scholar] [CrossRef]
  26. Nadeem, M.; Juan, Y.; Niazi, M.; Tian, Y.; Subhan, S. Paths of economic development: A global evidence for the mediating role of institutions for participation in global value chains. Econ. Res. -Ekon. Istraživanja 2021, 687–708. [Google Scholar] [CrossRef]
  27. Arellano, M.; Bond, S. Some tests of specification for panel data: Monte Carlo evidence and an application to employment equations. Rev. Econ. Stud. 1991, 58, 277–297. [Google Scholar] [CrossRef] [Green Version]
  28. Ms Faezeh, R.; Ignatenko, A.; Mircheva, M. Global Value Chains: What Are the Benefits and Why Do Countries Participate? International Monetary Fund: Washington, DC, USA, 2019. [Google Scholar]
  29. Anderson, J.E.; Van Wincoop, E. Gravity with gravitas: A solution to the border puzzle. Am. Econ. Rev. 2003, 93, 170–192. [Google Scholar] [CrossRef] [Green Version]
  30. Baldwin, R.; Taglioni, D. Gravity Chains: Estimating Bilateral Trade Flows When Parts and Components Trade Is Important; No. w16672; National Bureau of Economic Research: Cambridge, MA, USA, 2011. [Google Scholar]
  31. World Bank. World Development Indicators. 2017. Available online: http://databank.worldbank.org/data/ (accessed on 29 May 2021).
Figure 1. GDP per capita and GVCs across countries. Constant = 1.311, Coef = 0.2761, t-stat = 3.21, p-value = 0.002, R-sqaured = 0.48, N = 552.
Sustainability 14 06434 g001
Figure 2. Human Capital Development and GVCs across countries. Constant = 0.471, Coef = 0.0664, t-stat = 2.16, p-value = 0.033, R-squared = 0.16, N = 552.
Sustainability 14 06434 g002
Figure 3. Real Effective Exchange Rate and GVCs. Constant = 0.420, Coef = −0.0162, t-stat = −0.93, p-value = 0.351, R-squared= 0.06, N = 552.
Sustainability 14 06434 g003
Figure 4. Financial development and GVCs across countries. Constant = 0.262, Coef = 0.0946, t-stat = 6.70, p-value = 0.000, R-squared = 0.24, N = 552.
Sustainability 14 06434 g004
Figure 5. Economic Freedom and GVCs across countries. Constant = 0.202, Coef = 0.0215, t-stat = 4.08, p-value = 0.000, R-squared = 0.33, N = 552.
Sustainability 14 06434 g005
Figure 6. Environmental Patents and GVCs across countries. Constant = −0.230, Coef = 0.0268, t-stat = 12.19, p-value = 0.000, R-squared = 0.21, N = 552.
Sustainability 14 06434 g006
Figure 7. Profit Tax and GVCs across countries. Constant = −0.529, Coef = −0.0951, t-stat = −7.51, p-value = 0.000, R-squared = 0.09, N = 552.
Sustainability 14 06434 g007
Figure 8. R&D Expenditure and GVCs across countries. Constant = 0.271, Coef = 0.1019, t-stat = 9.62, p-value = 0.000, R-sqaured = 0.14, N = 552.
Sustainability 14 06434 g008
Table 1. Correlations Structure.
Variables123456789
GVCs Participation 1.0000
GDP per capita 0.36981.0000
Human Capital Development0.31810.7491 1.0000
Real Effective Exchange Rate–0.00410.07930.12871.0000
Financial Development0.44640.55580.38960.32921.0000
Economic Freedom0.46090.46190.62120.19670.20221.0000
Environmental Patents0.47050.24730.37060.27150.57140.10291.0000
Profit Tax–0.3126–0.3973–0.5576 0.1356–0.0134–0.1217–0.14881.0000
R&D Expenditure0.38170.15510.13500.04450.09210.2690–0.0607–0.0687 1.0000
Source: Authors’ own calculation.
Table 2. Dependent Variable: Global Value Chains (GVCs). Sample of 23 countries, 1995–2018 (annual data). External Instrument: Trade Openness (in log form), FDI (in log form).
Variables/MethodCountry-Effects
(1)
Time-Effects
(2)
GMM (Diff)
(3)
GMM (SYS)
With Internal Instruments
(4)
GMM (SYS)
With External Instruments
(5)
L1.GVCs-----------0.7514 ***
(0.036)
0.9309 ***
(0.041)
0.9155 ***
(0.195)
GDP per capita 0.5664 ***
(0.222)
0.5942 **
(0.251)
0.1283 *
(0.078)
0.1291 *
(0.088)
0.2551 *
(0.140)
Human Capital0.1141 ***
(0.020)
0.0377
(0.016)
0.0081 **
(0.003)
0.0164 *
(0.009)
0.0269 *
(0.015)
Real Effective Exchange Rate0.2168 **
(0.117)
0.1676 **
(0.082)
0.0748 ***
(0.026)
0.0322
(0.029)
0.0645 *
(0.048)
Financial Development0.2449*
(0.168)
0.2243 ***
(0.072)
0.0883 *
(0.055)
0.0539 ***
(0.018)
0.1171 **
(0.046)
Economic Freedom0.4848 ***
(0.112)
0.3771 *
(0.251)
0.5385 **
(0.236)
0.3414 **
(0.193)
0.2477 *
(0.135)
Environmental Patents 0.5432 **
(0.266)
0.6422 ***
(0.222)
0.3346 **
(0.191)
0.3348 ***
(0.097)
0.4501 ***
(0.112)
Profit Tax−0.1843 *
(0.083)
−0.2203 *
(0.140)
−0.2142 *
(0.155)
−0.1419
(0.061)
−0.2265
(0.112) **
R&D Expenditure0.1267
(0.072) **
0.1666
(0.104) *
0.094
(0.081)
0.1107 **
(0.197)
0.0732 *
(0.042)
Constant 3.8213 ***
(0.678)
4.5844 ***
(1.482)
0.5888 **
(0.281)
0.4196 *
(0.300)
0.6214 **
(0.365)
R 2 0.52210.5050---------
No. of Observations552552497524531
Significance Test (p-value)--------
-Sargan Test--------0.21
(0.139)
--------
-Hansen Test 6.53
(0.578)
4.04
(0.653)
-Second Order Correlation --------−0.55
(0.589)
−1.52
(0.140)
−1.08
(0.314)
Note: The coefficients are rounded to four decimals. Numbers in parenthesis are corrected standard errors. First- and second-generation unit root results were used for fixed effects. The SYS-GMM estimation results are presented in columns (4) and (5) by using internal and external instruments. In column (5), for endogeneity, we use actual, lagged levels and lagged differences of trade openness and FDI as our external instruments, and the reason for exogeneity of these instruments is given in the footnotes. *** denotes significance level with p < 0.01, ** denotes significance level with p < 0.05, and * denotes significance level with p < 0.10.
Table 3. Determinants of Bilateral (Industry-Level) GVCs Participation among EMCs: Backward Linkages (FVA). Poisson Pseudo Maximum Likelihood (PPML) Regression.
Variables PPML  
F V A i j   >   0
PPML
F V A i j
PPML
F V A i j   >   0
PPML
F V A i j
Size of GDP 0.1352 **
(0.033)
0.0821 **
(0.020)
0.1197 *
(0.058)
0.1137 **
(0.038)
Distance (in log form)0.0594 **
(0.005)
0.0153 **
(0.008)
0.1053 *
(0.142)
0.0810 *
(0.042)
Common Border0.1071 **
(0.037)
0.1001 *
(0.066)
0.1672 **
(0.042)
0.1057 *
(0.081)
Colonial History0.0578 *
(0.014)
0.0243 *
(0.011)
0.0067
(0.001)
0.0506 **
(0.007)
Preferential Trade Agreements 0.1553 ***
(0.007)
0.0681 *
(0.029)
Ease of Doing Business 0.1003 **
(0.020)
0.1061 *
(0.041)
Environmental Patents 0.1232 ***
(0.009)
0.0704 **
(0.021)
Constant 0.3375 *
(0.071)
0.2440 **
(0.088)
0.3721 *
(0.118)
0.2818 ***
(0.071)
No. of observation 12,14412,14412,14412,144
Source country-sector fixed effectsYesYesYesYes
Destination country-sector fixed effectsYesYesYesYes
RESET Test p-values0.1440.1910.2390.108
Source: Authors’ own calculations. *** denotes significance level with p < 0.01, ** denotes significance level with p < 0.05, and * denotes significance level with p < 0.10. Numbers in parenthesis are corrected standard errors. GVC ij > 0 is positive value-added trade, and GVC ij includes zero-value and positive value-added trade.
Publisher’s Note: MDPI stays neutral with regard to jurisdictional claims in published maps and institutional affiliations.

