Article

Syndromic Surveillance among Evacuees at a Houston “Megashelter” following Hurricane Harvey

by
Lauren M. Leining
1,2,3,4,
Kirstin Short
5,
Timothy A. Erickson
1,2,3,
Sarah M. Gunter
1,2,3,
Shannon E. Ronca
1,2,3,
Joann Schulte
5 and
Kristy O. Murray
1,2,3,*
1
National School of Tropical Medicine, Baylor College of Medicine, Houston, TX 77030, USA
2
Department of Pediatrics, Texas Children’s Hospital, Houston, TX 77030, USA
3
William T. Shearer Center for Human Immunobiology, Texas Children’s Hospital, Houston, TX 77030, USA
4
Division of Epidemiology, Human Genetics, and Environmental Sciences, School of Public Health, The University of Texas Health Science Center at Houston, Houston, TX 77030, USA
5
Houston Health Department, Houston, TX 77030, USA
*
Author to whom correspondence should be addressed.
Sustainability 2022, 14(10), 6018; https://doi.org/10.3390/su14106018
Submission received: 12 January 2022 / Revised: 5 April 2022 / Accepted: 11 April 2022 / Published: 16 May 2022
(This article belongs to the Special Issue The Socioecology of Disasters and Infectious Disease)

Abstract

:
In the aftermath of Hurricane Harvey in 2017, thousands of residents in the Houston area sought refuge at a convention center “megashelter”. Out of concern for the possibility of communicable diseases spreading rapidly in the crowded shelter, we conducted syndromic surveillance to monitor the health of evacuees using a digital drop-in cot-survey. The cot-to-cot survey design rapidly assessed evacuees to determine if they were experiencing any symptoms of illness each night from 1–7 September 2017. While no outbreak of a specific infection was identified during the surveillance period, runny nose, congestion, cough, achy muscles and joints, anxiety, and depression were the most commonly reported symptoms. Out of the total shelter population, 38% of adults reported symptoms compared to 25% of children (≤18 years). The cot survey took a median of 5.2 min per interview, and the daily participation rate increased throughout the surveillance period starting at 89% and ending at 96% on the last day. The success of this public health response was due, in part, to the effectiveness of survey design and the dissemination of real-time data to the health departments. Digital cot surveys can improve emergency response sustainability, interoperability among emergency responders, and improve evacuee participation.

1. Introduction

Hurricane Harvey was one of the most destructive hurricanes to ever hit the United States [1,2]. Harvey made landfall in Rockport and Fulton, Texas in Aransas County, on 25 August 2017 as a category four hurricane with 130 mph wind speeds. After landfall, the hurricane slowly moved northeast along the Texas coast towards Houston, the 4th largest city in the U.S. The hurricane then stalled for several days, bringing record-breaking rainfall and extensive flooding to the metropolitan area resulting in 30,000 water rescues, displacing 40,000 Houstonians, flooding over 300,000 structures and 500,000 cars, and costing an estimated $135 billion in damages [1,3,4,5]. A total of 68 people died, with almost all (n = 65) dying as a result of fresh water flooding; 36 of these deaths occurred in the Houston metropolitan area [5].
Hurricanes, also known as typhoons or tropical cyclones, are devastating disasters responsible for widespread morbidity, mortality, disease outbreaks, psychological trauma, environmental devastation, population displacement, and more [6]. The US Gulf Coast is prone to many natural and man-made hazards, with flooding events, tropical storms, and hurricanes occurring annually [7].
Rapid and timely syndromic surveillance for detecting emerging pathogens or outbreaks, illnesses, or injuries in a post-disaster setting can save lives and facilitate a faster recovery period [8]. In emergencies or disasters, epidemiological data are critical for an effective public health response. Rapid capture and analysis of data are imperative for those needing emergency aid as well as distributing life-saving resources like transportation, shelter, food and water, healthcare, and other critical supplies [9,10]. Specifically, the collection of epidemiological data through syndromic surveillance can prevent and control communicable disease outbreaks in crowded emergency shelters [10].
Although there are many socioeconomic, political, and cultural challenges to data collection during emergency responses, the largest challenge with syndromic surveillance is accurate and rapid data collection that is generalizable to the population being assessed. Data collection in an emergency response can be inefficient, prone to error, and labor intensive, limiting the quality and timeliness of results. It is time consuming to download individual records from handheld devices into a server or manually enter paper records into an electronic database for analysis [9,11]. Additionally, public health responders who are directly and indirectly affected by a disaster cannot be available for the response period, resulting in a reduced workforce [12,13].
The psychological stress of experiencing a traumatic event combined with responding to these disasters can lead to mistakes. This occurred among workers using paper-based surveys in response to the Great East Japan Earthquake in 2011. Over 55% of staff (10/18) admitted to making mistakes when hand-tabulating data from their post-disaster questionnaire and digitizing it [14]. Collecting inaccurate data in an emergency can have catastrophic consequences on the safety and well-being of communities.
Modern technologies in syndromic disease surveillance are needed to ensure the rapid and accurate collection of quality data in post-disaster settings. Web-based surveys with automated analyses can improve efficiency and timeliness. Additionally, ready-to-use access to a validated survey tool can eliminate the burden on the emergency and epidemiology workforce to create a new survey tool after each disaster occurs, especially when emergency responder personnel are short-staffed or overwhelmed.
Previously, syndromic surveillance rapidly detected and helped stop the spread of a norovirus outbreak at the Houston Astrodome “megashelter” housing 27,000 Hurricane Katrina evacuees from Louisiana in 2015 [9]. Once again, the spread of communicable diseases were also a concern for the more than 10,000 Hurricane Harvey evacuees who sought refuge in a downtown Houston convention center megashelter in 2017 [4,15]. To respond to this concern, we conducted daily syndromic surveillance using a digital “cot survey” method as previously described [9] in order to quickly identify infectious disease threats in real time while relaying key messages to health departments related to emergency relief resources. The main aim of this study was to identify syndromic trends over time during the surveillance period to mitigate any disease outbreaks. Our secondary aim was to evaluate the performance of a drop-in digital cot survey tool in a densely populated and dynamic shelter setting for the value in the application in future disaster responses.

2. Materials and Methods

The study was a cross-sectional cot-to-cot survey of all shelter residents conducted nightly for the purpose of syndromic surveillance. The goal was to employ a previously designed cot survey tool to rapidly detect communicable diseases of concern to allow proper health management among the shelter population to prevent disease transmission. This survey was approved for emergency authorization of public health surveillance activities by the City of Houston Health Department and was deemed exempt as human subject research by the Baylor College of Medicine Institutional Review Board (H-42026). The shelter opened to evacuees on 27 August 2017 [3,4], and surveillance was conducted between 1 September and 7 September. Verbal informed consent was obtained from all subjects involved in the study.

2.1. Cot Survey Tool

A digital survey tool was created to evaluate the daily health status of shelter residents. We used a modified tally-based cot survey previously described by Murray et al. [9]. The cot survey was designed and modified on Google Forms (Google LLC, Mountain View, CA, USA) for efficient administration by volunteers. Syndromic surveillance survey questions were asked every night (shown in Appendix A). On the first night of the survey, questions about zip code of residence and number and type of pets the evacuee brought into the shelter were added. Zip code data was collected to allow identification of geospatial trends. Data on pet ownership and animal interaction were collected to assess veterinary needs of the evacuees and optimize shelter accommodations for those with pets. Starting from the second night of surveillance, shelter residents were asked about duration of their stay at the shelter, since it opened seven days prior. They were also asked about living arrangements prior to the storm, including whether they were experiencing homelessness. This helped the City of Houston, the American Red Cross (ARC), and Federal Emergency Management Agency (FEMA) understand what types of relocation resources and other services were needed by evacuees.
On each night of the surveillance period, we assessed every available evacuee for their age and any symptoms experienced. Shelter residents age was recorded based on categories of: <1 year, 1–5 years, 6–10 years, 11–18 years, 19–25 years, 26–40 years, 41–64 years, 65 years and older. These categories were selected to help preserve anonymity and identify any syndromic trends belonging to vulnerable age groups such as young children and the elderly [9,10]. Initially, the survey started with asking the participant’s age. On the 5th day, we decided to reverse the questions and ask how they were feeling first to help the participant feel more comfortable with being approached (Table 1). Volunteers documented symptoms reported by residents as listed in the survey tool (Appendix A), which covered a broad range of non-specific somatic and mental health symptoms as well as potential exposures to zoonotic diseases. Responses outside of this predetermined syndrome list were also recorded as text in order to capture any issues the evacuees were experiencing or deemed relevant about the shelter or resources they needed. All questions and responses on the cot survey were translated into Spanish for non-native English speakers, and each survey team had a Spanish-speaking interviewer. No identifiable information was collected on evacuees apart from zip code of residence.

2.2. Cot Survey Administration

Survey volunteers were recruited from Baylor College of Medicine and The University of Texas Health Science Center at Houston School of Public Health in Houston, TX by the Student Epidemic Intelligence Society (SEIS), an applied epidemiology student organization. Before entering the shelter, volunteers received just-in-time (JIT) training on how to conduct a survey, cot survey design, survey administration, the incident command structure (ICS), layout and culture of the shelter, how to triage symptomatic shelter residents and ensure access to medical assistance, and our role in conducting syndromic surveillance.
After the JIT training, all volunteers were divided into groups by hall. Each hall group had one to two Spanish speakers as surveyors to aid non-English speaking evacuees. Returning volunteers were assigned to the same hall to provide familiarity for shelter residents. Team leads would text the Google Forms cot survey link to their daily hall group volunteers through personal smartphones. Surveys were administered cot-to-cot each evening between 1–7 September 2017 after the ARC served dinner and before the lights dimmed for sleeping. Parents or guardians answered the survey on behalf of minors. Only one survey was completed per person. Survey refusals were documented, and an empty survey was submitted to denote the refusal. Upon completion, all active cots (including those unoccupied) were counted to quantify the total number of evacuees housed within the shelter.
Volunteers were instructed to not probe shelter residents about any symptoms they might be experiencing in order to prevent reporting biases and maintain survey validity. Shelter residents who reported symptoms were referred to the health clinic within the convention center for evaluation. Survey volunteers would assist shelter residents in traveling to the clinic on an as-needed basis. If the resident had serious symptoms such as fever, nausea, vomiting, chills, open or bleeding wounds, high blood pressure or low blood sugar, the volunteer would notify their team lead who would request medical assistance with the ARC. In rare cases when travel to the health clinic within the shelter was difficult for a sick evacuee, the ARC would “open a chart” at the cot bedside and render aide. At the end of each night, we held a debriefing with volunteers to assess the efficiency of the survey design and administration, as well as to request any additional information or observations from the interviews related to the well-being of evacuees, types of resources shelter residents were requesting, and other topical issues.

2.3. Survey Metrics and Data Analysis

To evaluate cot survey performance, we calculated participation rates, cumulative daily survey administration, and average time per interview. Participation rate was calculated by people who verbally consented to be surveyed divided by the total number of people approached. The daily average time per interview by day was calculated by subtracting the final interview timestamp from the timestamp from the first interview, multiplied by the number of volunteers, then divided by the total number of people interviewed.
daily   average   time   per   interview = ( last   interview first   interview )   *   number   of   volunteers total   number   of   people   surveyed
Data from the cot surveys were automatically uploaded via Google Surveys into a digital dashboard that displayed aggregated data and trends of reported symptoms. The data analysis report was emailed to the Houston Health Department within an hour after survey completion allowing for real-time symptoms to inform decision making.
All data were downloaded into Microsoft Excel (Microsoft, Redmond, WA, USA) for analysis. Specific analyses related to hypotheses testing did not occur due to the descriptive nature and purpose of syndromic surveillance data. As a result, summary statistics such as means, counts, percentages, and rates are reported.

2.4. Geospatial Analysis

Evacuee zip codes were collected on the first day of the syndromic surveillance (1 September 2017). Zip code analyses were conducted in ArcGIS Pro v2.7 (Esri, West Redlands, CA, USA). Count data at the zip code level were joined to a polygon layer containing zip code boundaries and their respective populations [16]. Rates of shelter residents per 100,000 population were calculated for each zip code.

3. Results

3.1. Cot Survey Performance

The metrics of the survey tool are reported in Table 1. The cot surveys were performed over a period of seven days, with a total of 4156 evacuees approached and 3843 (92%) agreeing to participate. The density of shelter residents was highest on the first night of syndromic surveillance with 682 total people approached and lowest on the final night of surveillance with 515 people approached. In total, our nightly surveys took 131 min (~2 h and 11 min) for 594 cot surveys, with each interview lasting a little more than 5 min. Overall, participation increased throughout the surveillance period, with 89% agreeing to participate on the first night to 96% agreeing to participate on the last night. Participation rate improved slightly by the 5th night of the surveillance period, which coincided with our reversing the order of the survey questions (first asking how evacuees were feeling, followed by asking their age).

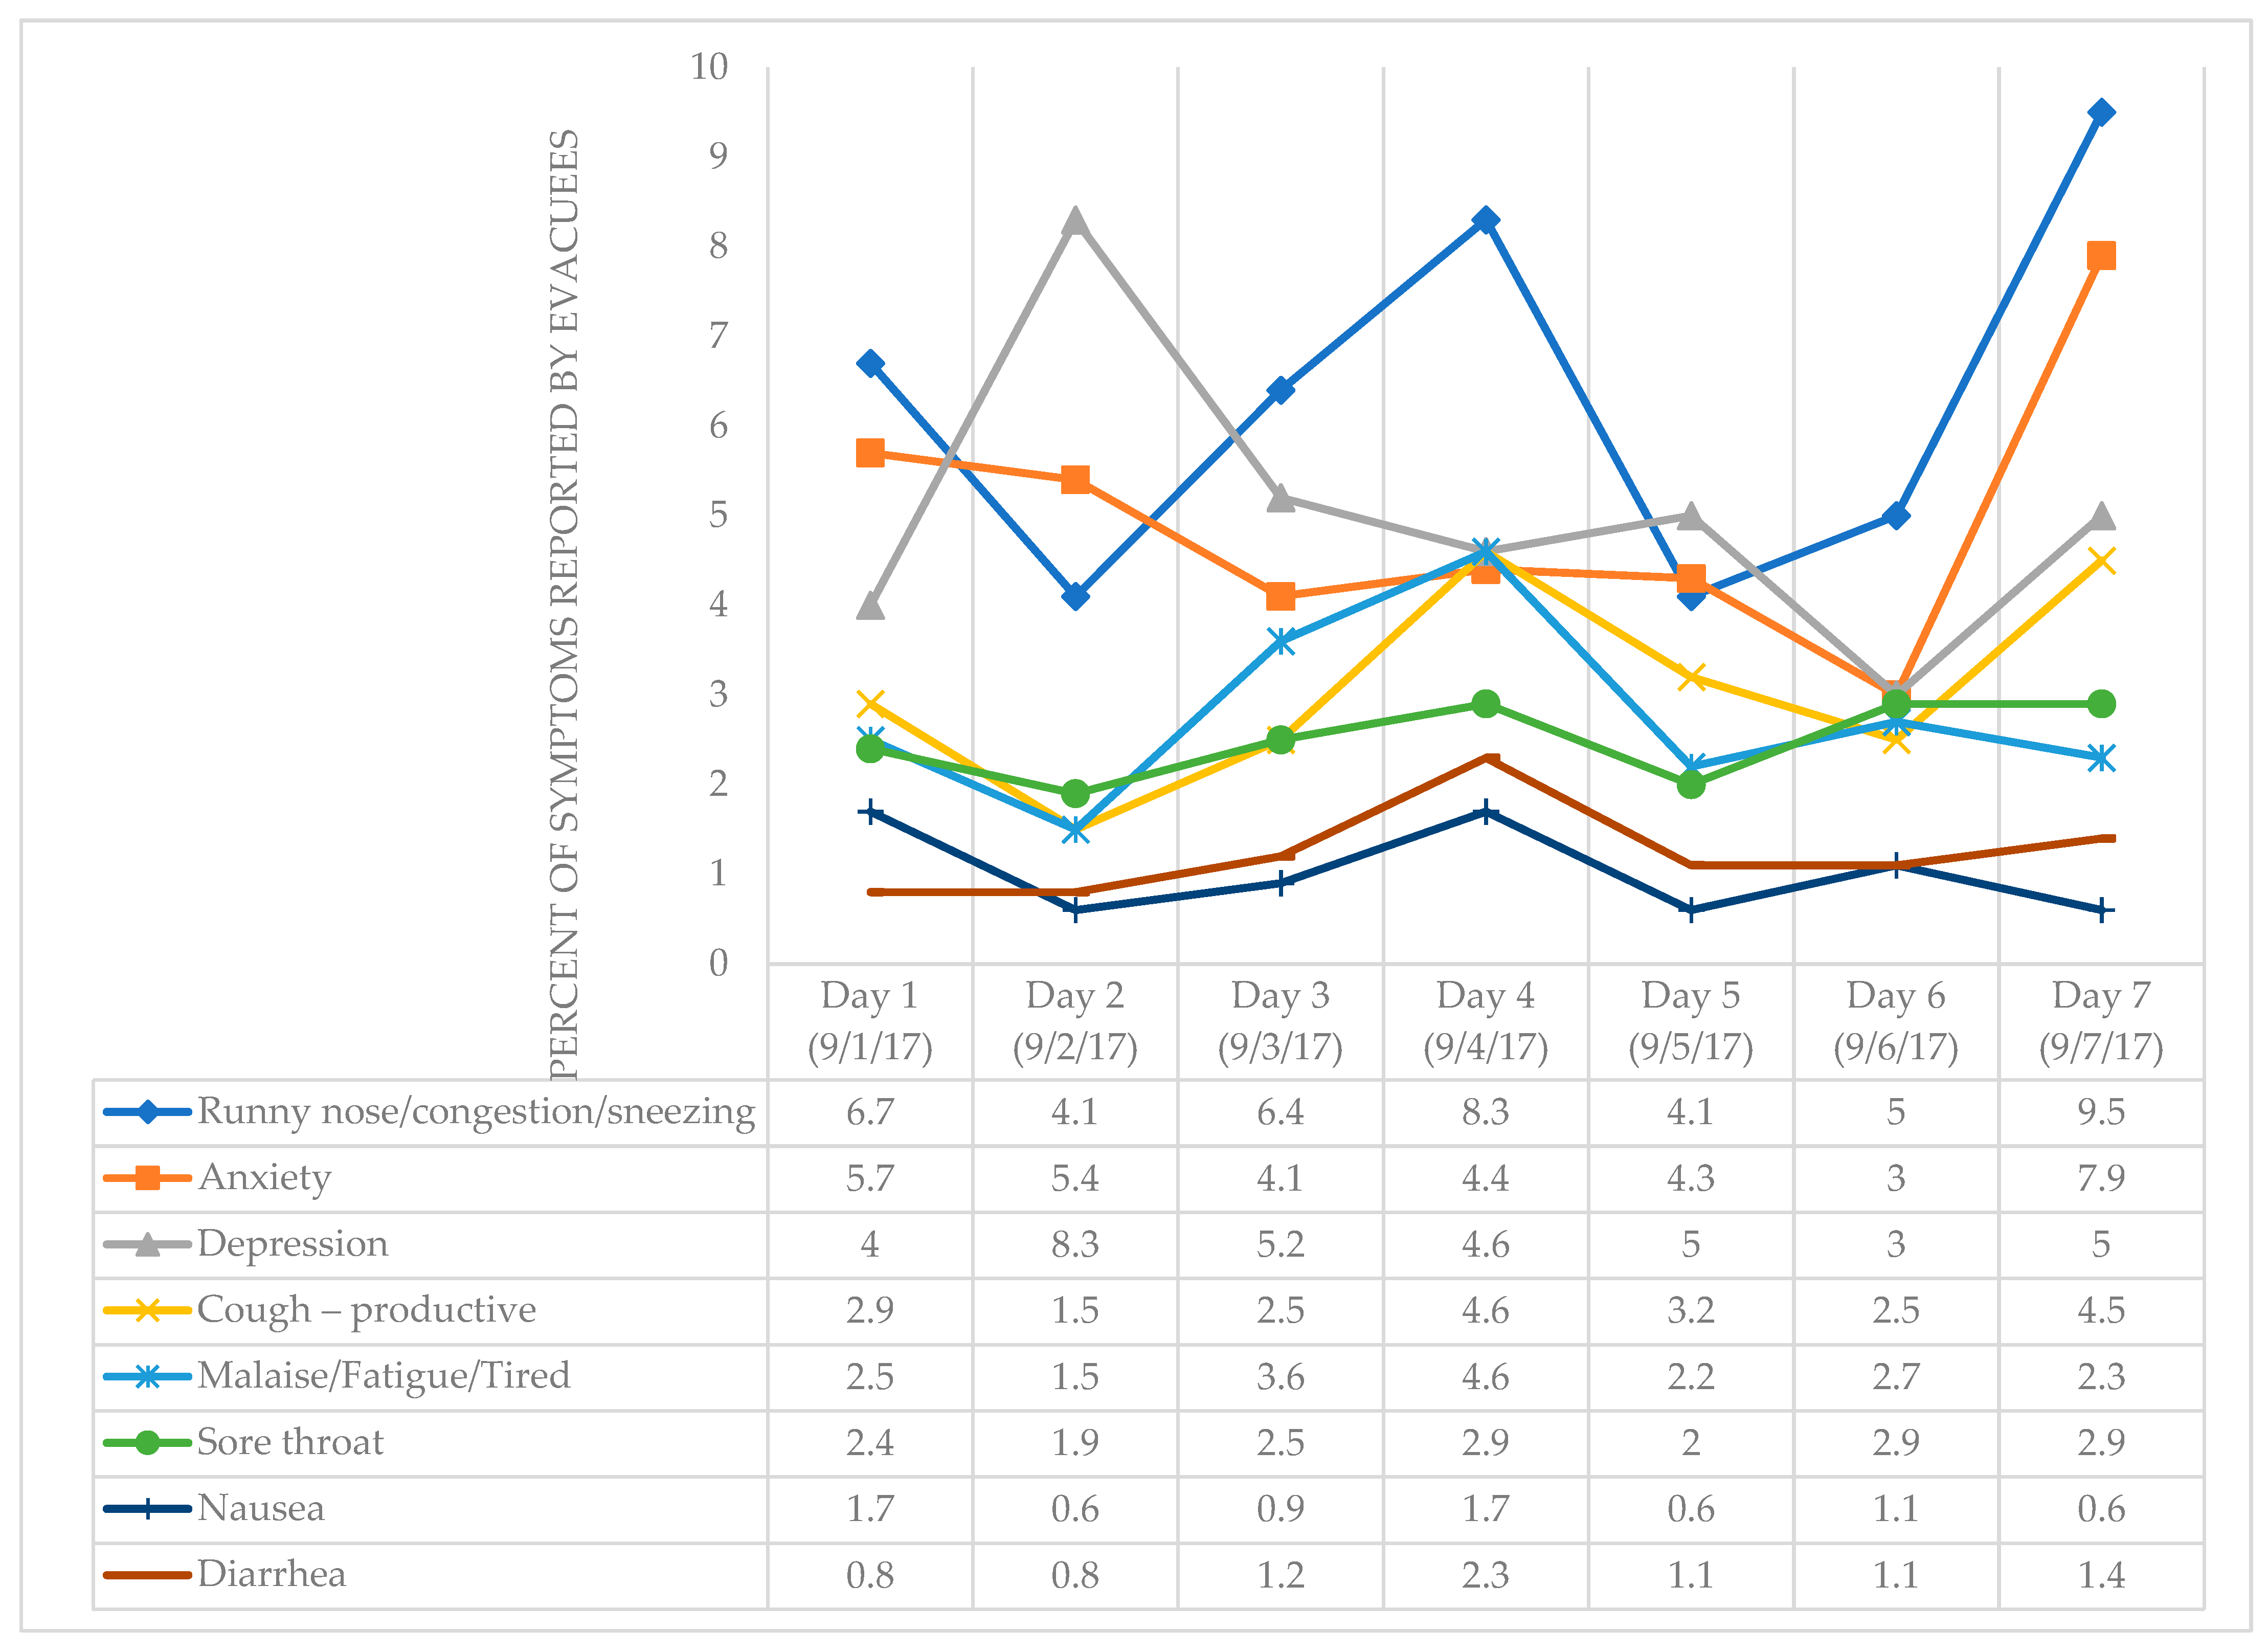
3.2. Syndromic Surveillance

Population data, including reported age range and syndromic surveillance on the 3843 evacuees who were approached and agreed to participate, are displayed in Table 2. The age groups remained consistent over the course of the syndromic surveillance period. The largest age demographic of the response period were people between 41–64 years old (range: 222 people on 2 September (min) to 271 people on 6 September (max)), followed be people aged 26–40 (range: 105 people on 2 September (min) to 139 people on 1 September (max)). Over the surveillance period, the average number of daily participants per age group were: 7 infants less than one year old, 26 children aged 1–5 years, 21 children aged 6–10, 37 children aged 11–18, 38 adults aged 19–25, 127 adults aged 26–40, 245 adults aged 41–64, and 35 adults aged 65 and older.
On the first night of surveillance, the most prevalent somatic symptom reported was runny nose, congestion, and sneezing (6.7%), followed by achy muscles and achy joints (6.2%), anxiety (5.7%), headache (4.5%), and depression (4.0%) (Table 2, Figure 1). These symptoms decreased on the second night, but runny nose, congestion, and sneezing and anxiety increased at the end of the surveillance period to 9.5% and 7.9%, respectively.
Diarrhea and malaise, fatigue, and tired increased slightly during the middle of the surveillance period, then decreased. One case of scabies was reported in an infant on the first night of surveillance, and the child and their family were removed from the shelter for emergency care.
Psychological symptoms were also prevalent, with 6% and 4% reporting anxiety and depression, respectively, on the first night (Figure 1). Prevalence of depression then increased to 8% on the second night. After the second night, the prevalence of anxiety and depression modestly decreased over the next several days, then increased on the last day to 8% and 5%, respectively.
Overall, the highest prevalence of symptoms reported over the surveillance period, in order, were: runny nose, congestion, and sneezing; depression; anxiety; achy muscles and joints; headache; productive and non-productive cough; malaise/fatigue/tired; sore throat; and stomach pain and cramping (Table 3). Overall, adults were significantly more likely than children to report symptoms of illness (OR = 1.87; 95% confidence interval (CI): 1.53–2.28, p < 0.0001) (Table 3), with 38% of adults reporting one or more symptoms over the course of the surveillance period compared to only 25% of children. Adults were four times more likely to report anxiety than children (OR = 4.09; 95% CI: 2.09–9.17; p < 0.0001), 8.5 times more likely to report malaise, fatigue, or being tired (OR= 8.46; 95% CI: 2.26-71.24; p = 0.0004), and 10 times more likely to report achy muscles and joints (OR = 10.3; 95% CI: 3.43-50.60, p < 0.0001). None of the children reported depression, injury or skin wounds, or nausea.

3.3. Geospatial Analysis

Reported zip codes of where evacuees said they lived prior to Hurricane Harvey are presented in Figure 2. A total of 83 zip codes were reported, with eight (10%) having 20 or more evacuees. The highest rates of evacuees in the shelter came from the central, east, and northeast corridors of Harris County. On the 2nd night of surveillance, we asked about living arrangements prior to coming to the shelter. Out of 537 survey respondents, 129 (24%) reported experiencing homelessness including living on the streets, in tents, in homeless shelters, or other types of temporary shelters prior to the hurricane.

4. Discussion

4.1. Syndromic Surveillance

In this study, we evaluated the performance of a digital “cot survey” to quickly identify emerging disease threats in a densely crowded emergency megashelter housing Hurricane Harvey evacuees. Our findings demonstrate the success of using a digital cot survey to efficiently collect data in real time and accelerate communications with health authorities about the physical and mental health needs of shelter residents.
In our study, adults commonly reported experiencing symptoms of anxiety and depression. Previous studies have shown flood and hurricane victims commonly suffer from acute and long-term mental health effects [17,18]. Research has shown socioeconomic and psychological stress is common and disproportionately affects women, children, adolescents, and the elderly who are dependent on care-giving or have special needs [19,20]. King et al. (2016) demonstrated that 10% of Hurricane Katrina evacuees suffered from disaster-related post-traumatic stress disorder and 15% developed major depressive disorder. In our cot survey, we found that anywhere between 3–8.2% of Hurricane Harvey evacuees also reported anxiety or depression on any given day. This rate was higher than the physical symptoms reported by evacuees. Additionally, anxiety and depression increased on the final day of the shelter being open. This increase could reflect concerns over housing availability and the need to move to a new location. Throughout the surveillance period, we were able to refer participants experiencing depression and anxiety to mental health care providers present at the shelter for evaluation and care. Inclusion of anxiety and depression in the symptoms assessment was a result of encountering these concerns during the Hurricane Katrina cot surveys in 2005 [9], hence our understanding the importance of capturing these concerns from the beginning.
Our shelter population was primarily older adults ranging in age from 41–64 years old, and approximately a quarter reported being homeless. These findings are consistent with data reported by the Houston-based Red Cross Shelters during Hurricanes Gustav, Ike, and Harvey [21]. We found that evacuees wanted to discuss with surveyors their health and non-health needs, including the need for displacement assistance, food and dietary concerns, the need for non-medical supplies such as reading glasses, and concerns over chronic health problems related to diabetes or cardiovascular disease. Evacuees with chronic diseases require extensive healthcare management. As a result, shelters and emergency planning teams should be prepared to address these needs [22,23].
Within the megashelter, we did not identify any increasing trends among symptoms that would have been indicative of an outbreak. In a prior study, syndromic surveillance identified an acute gastroenteritis outbreak attributed to norovirus, with over 1100 cases identified in a Houston megashelter for Hurricane Katrina evacuees from New Orleans in 2005 [24]. These findings support the importance of establishing drop-in syndromic surveillance during large-scale emergency events that result in displacement, which is expected to become more common as a result of climate change and severe weather events [25].
By swiftly implementing this cot survey, we were able to successfully monitor the megashelter for communicable disease outbreaks or other physical and mental health conditions. The simplicity of the design allowed us to use volunteers with limited training and experience to immediately assist in a disaster response, which is critical when the local public health workforce is limited and diverted for an incident command disaster response. The cot-to-cot syndromic surveillance survey was critical for the Houston Health Department because they were short staffed in responding to hurricane damage and flooding in areas throughout Houston.

4.2. Strengths of the Digital Drop-In Cot Survey

This digital drop-in cot survey tool has several advantages that make it adaptable and easy to implement in natural or man-made emergencies and among diverse shelter populations. The most notable success of the cot surveys was the high percentage of participation of evacuees throughout the response period, with all but the first night exceeding 90% participation. In fact, the participation rate continued to increase even as the shelter population decreased throughout the study period. We hypothesize this is related to the survey design, rapport, and relationships established between the interviewers and the evacuees in the shelter.
The Google Forms platform had key advantages over a paper-based survey form. No supplies were needed and no costs were accrued since volunteers performed the survey on their personal smartphones. The survey had a downloadable link provided to volunteers which eliminated paper records all together. No credentials were required to access the survey and multiple users could access the survey at once without concerns over platform performance. All submitted records and locations were timestamped for record-keeping. This helped us monitor the length of the survey period and identify volunteers’ locations for follow up on specific cases in need of attention.
The Google Forms platform made our survey design simple and adaptable. Evolving the survey from night to night enabled us to capture time-sensitive data at the request of the health departments. When we added new questions, changed the format of the questions, or rearranged the question order, the survey was updated automatically. The data analytics in Google Forms allowed for real-time observations and organized data trends for immediate dissemination to public health authorities and stakeholders. This automated back-end analysis reduced the workload on epidemiologists and eliminated the need to enter data into a database or perform additional analyses. The survey data was securely stored as responses were kept in a password-protected account. Furthermore, survey responses entered were anonymized to protect participant confidentiality.
The open-ended question regarding health and well-being on the survey form brought attention to important issues voiced by evacuees. Survey volunteers were debriefed to identify: survey efficiencies, safety concerns, displacement issues, food or dietary concerns, medication or medical supply needs, questions about the shelter or shelter resources, mental health and chronic health problems, and any other needs. After the debriefings, structural and organizational improvements were made in the shelter related to feedback collected from volunteers and evacuees. Such changes included keeping dinner lines open longer for evacuees coming in and out of the shelter, providing diabetes-friendly meals and snacks, and opening a separate hall for single mothers and their children.

4.3. Limitations of the Digital Drop-In Cot Survey

Notably, the generalizability of our syndromic surveillance findings are limited. Our findings cannot be generalized to another shelter or another shelter population. Selection bias could also be a factor considering this City of Houston megashelter was located downtown and presumably housed a higher proportion of impoverished individuals compared to other shelters run by non-profits or churches near affluent neighborhoods. Although income information was not collected, on the 2nd night we discovered a quarter of participants were experiencing homelessness prior to the hurricane.
A second noteworthy limitation was that surveillance could not be initiated until five days following the opening of the megashelter. With Hurricane Harvey’s widespread flooding on the Houston metropolitan area, local volunteers were unable to commute to the shelter due to high water and closed roads. This gap in response time meant we were unable to survey the population in the immediate aftermath of the disaster and did not capture baseline syndromic data when the shelter was at maximum capacity. Therefore, we would not have prevented any outbreaks before they happened.
Third, the calculation for the average time per survey assumed all volunteers worked the entire time from the beginning of the surveillance period to the end. We feel this assumption is representative of current practices but it is a potential source of imprecision.
Lastly, self-reported surveillance data can contain recall bias and social desirability bias. All symptoms were self-reported and could be impacted by concealment of symptoms. Evacuees could have given the volunteers an expected response. This would be considered a social desirability bias, concerning private, sensitive, or stigmatizing topics including mental health, abuse, and safety concerns [26]. We attempted to reduce social desirability bias by keeping the survey responses anonymous and maintaining confidentiality throughout the surveillance period. We also believe any potential recall bias was mitigated by conducting the surveys daily. Despite these limitations, we were able to assess the health of a high percentage of evacuees each night, providing crucial data for public health authorities. We do not believe self-reporting impedes the validity of a post-disaster needs assessment or emergency shelter syndromic surveillance.

4.4. Implications in Disaster Epidemiology

Climate change and weather-related disasters are a threat to global health security and safety [27]. Between 2000 and 2010, over 83% of all disasters were climate and extreme weather events [28]. Record breaking storms, specifically flooding events and hurricanes, were the most frequent and powerful ever recorded in 2020 [29]. The continental United States and their respective territories suffer from wildfires, floods, storms, and hurricanes [28]. In 2020, the National Oceanic and Atmospheric Association (NOAA) noted 7 tropical cyclones and 13 billion-dollar severe weather events in the U.S. alone [30].
The greater Houston area is particularly prone to environmental disasters and climate-related emergencies such as hurricanes, storms, and flooding [31]. More severe and continuous weather threats are expected for many decades to come [25]. Impending weather disasters are also expected in succession without much time to recover between events; these “impounding shocks” would further hinder emergency response and recovery efforts [28]. As weather events increase, we should expect to see an increase in vulnerable populations seeking shelter during disaster-related emergencies. Identifying these vulnerable populations is critical for assessing community needs and risks. Our results offer some insight into who sought shelter following Hurricane Harvey. Our shelter population was composed of individuals who were predominately middle-aged, living along flood plains and/or in impoverished neighborhoods, or were homeless living in and around downtown Houston.
Disease outbreaks in emergency shelters are well documented. Transmission of infectious diseases occur because of crowding and exposure to communicable diseases. Communicable diseases such as norovirus and influenza have historically caused outbreaks in mass shelters [9,32]. Homeless populations are commonly exposed to communicable and infectious diseases such as sexually transmitted diseases, blood-borne infections, respiratory diseases such as tuberculosis, and ectoparasites such as scabies [33]. These pathogens can be easily transmitted in dense emergency shelter settings and are a public health priority to contain.
Finding sustainable tools for syndromic surveillance in the face of disaster epidemiology is of the utmost importance for future emergency responses. Improving timeliness of syndromic surveillance data collection is an established priority of the Centers for Disease Control and Prevention (CDC) [34,35]. Disease surveillance systems have been fraught with barriers related to coordination and interoperability among personnel and communication systems [36]. These delays and barriers in disaster epidemiology have serious consequences. For instance, a breakdown in communication among health officials and first responders during Hurricane Katrina extended the response time and put more people at risk for severe health events [36]. Additionally, in the aftermath of the 2017 Hurricane Maria in Puerto Rico, breakdowns in communication led to the rapid spread of misinformation, confusion about death tolls, and weakened government credibility and response [37].
Minimal controversy exists in data collection methods of disaster epidemiology and emergency response, however, controversy could result in challenging the status quo. Historically, the gold standard of syndromic surveillance data collection in shelters has been paper-based tally forms [9,38,39,40,41,42]. Health departments and public health authorities have had repeated success with paper-based record collecting, especially during widespread power outages or unreliable power sources [39]. However, paper-based forms can lead to inefficiencies, delayed analysis, delayed communication of findings, and are prone to errors and missing data [14,21,39,43]. Additionally, the process of manually entering written data into a database is demanding of resources, time, and personnel.
New technology for disease surveillance and critical evaluation of survey collection tools are essential for future sustainable responses in widespread natural disasters and emergencies [34,44]. Other health departments and emergency response teams have begun incorporating new technologies such as cloud-based platforms with success. For example, the Colorado’s Emergency Operations Center in Eagle County uses Google Workspace for identifying hazards and communicating needs for essential resources and personnel during wildfire response efforts [45]. Also, during Hurricane Sandy in 2012, health officials at the CDC and New Jersey Department of Health used cell phone technology to transmit morbidity surveillance data to the ARC [46]. Innovative tools that can improve timeliness and efficiency should continue to be developed and validated as technology advances.

5. Conclusions

In summary and to the best of our knowledge, we are the first to use a cloud-based platform to conduct drop-in syndromic surveillance exclusively using cell phones for data entry and real-time analysis using a student volunteer workforce.
A syndromic surveillance tool that is efficient, user-friendly, prepared in advance, and easy to implement can save valuable time and resources during disasters. Swift data collection and real-time analysis are critical for alerting health authorities to impending outbreaks in emergency shelter settings. This is especially important in the era of COVID-19 and other emerging infectious and communicable diseases that threaten the health of vulnerable populations. The implementation of digital sharing platforms, cloud-based storage systems, and smart-phone technologies can facilitate greater interoperability among stakeholders responding to disasters [47].
Syndromic surveillance planning should be included in disaster management and preparedness plans to ensure rapid implementation, coordination, and communication among stakeholders. Reducing these inefficiencies through capacity building and training can produce a more consistent and time-sensitive response to help protect the public’s health and safety. Our cot survey adds to the sustainability of future disaster responses by providing a cloud-based syndromic surveillance model deployable in emergency shelters with the goals of improved efficiency, time-sensitive communication and coordination, and increased participation of evacuees throughout an emergency response period.

Author Contributions

Study conceptualization by L.M.L., K.O.M., K.S. and J.S.; methodology by K.O.M., L.M.L., T.A.E., S.E.R. and S.M.G.; analysis and software by L.M.L., K.O.M., T.A.E., S.E.R. and S.M.G.; writing—original draft preparation by L.M.L.; writing—review and editing by L.M.L., K.O.M., T.A.E., S.M.G., S.E.R., K.S. and J.S.; cot-to-cot survey supervision by K.S., J.S. and K.O.M. All authors have read and agreed to the published version of the manuscript.

Funding

This research received no external funding.

Institutional Review Board Statement

The study was conducted according to the guidelines of the Declaration of Helsinki, approved for emergency authorization of public health surveillance activities by the City of Houston Health Department, and was deemed exempt as human subject research by the Baylor College of Medicine Institutional Review Board (H-42026).

Informed Consent Statement

Informed consent was obtained from all subjects involved in the study.

Data Availability Statement

This dataset is not publicly available.

Acknowledgments

Our syndromic surveillance efforts could not have been possible without the support of the American Red Cross and the City of Houston Health Department. We would like to thank the University of Texas Health Science Center at Houston School of Public Health (UTHealth School of Public Health) faculty for their support in recruiting volunteers and participating in the cot surveys. This syndromic surveillance activity would not have been possible without the dedication and sacrifice of our volunteers and Student Epidemic Intelligence Society (SEIS) members and officers at UTHealth School of Public Health.

Conflicts of Interest

The authors declare no conflict of interest.

Appendix A

Table A1. The “cot survey” tool used at the Hurricane Harvey megashelter in Houston, TX, 1–7 September 2017.
Night Question Was AskedQuestion Response Options
English/Spanish
All nightsHello, my name is [enter name], and we are working with the City of Houston to monitor the health of everyone in the shelter. May we ask you a couple of questions to see how you are feeling?

Hola, mi nombre es [tu nombre] y estamos trabajando con la Ciudad de Houston para monitorear la salud de todos que usan este refugio. ¿Podemos preguntarle un poco para ver cómo se siente?
Yes/No/Sí/No
All nightsAgree to participate?
Yes/No/Sí/No
All nights 1How old are you?

¿Cuantos años tiene usted?
<1 year/menos un años
1 to 5 years/uno a cinco años
6 to 10 years/seis a diez años
11 to 18 years/once a dieciocho años
19 to 25 years/diecinueve a veinte y cinco años
26 to 40 years/veinte y seis a cuarenta años
41 to 64 years/cuarenta y uno a sesenta y cuatro años
65 and older/sesenta y cinco años o más
All nightsHow are you feeling? Any symptoms of illness? If yes, what are your symptoms?

¿Siente algún síntoma de enfermedad? ¿Cuáles son sus síntomas?
No symptoms of illness/No tiene síntomas
Fever/fiebre
Vomiting/vómitos
Nausea/náusea
Diarrhea/diarrea
Stomach pain/cramping/dolor de estómago
Headache/dolor de cabeza
Rash or skin infection/erupción o infección de la piel
Runny nose/congestion/sneezing/secreción nasal/congestión/estornudos/rinorrea
Cough (productive)/tos (productiva)
Cough (non-productive)/tos seca
Sore throat/dolor de garganta
Pink eye/conjunctivitis/conjuntivitis
Achy muscles or joints/dolor muscular o de articulaciones
Injury or open wounds/lesiones o heridas abiertas
Animal or insect bites/picaduras de animales o insectos
Malaise/fatigue/fatiga, malestar
Anxiety/ansiedad
Depression/depresión
Suicidal thoughts/pensamientos suicidas
Not willing to participate in survey/no quiere participar
Other/otras sintomas: ___________
Night 1What zip code are you from?

¿Cuál es su código postal?
(open-ended response with text entry)
Night 1Do you have any pets with you?

¿Tiene mascotas con usted?
Yes/No/Sí/No
Night 1If yes, what type of pet and how many?

Si sí, ¿qué tipos de mascotas y cuántos?
(open-ended response with text entry)
Night 2 How many nights have you stayed at the shelter?

¿Cuantas noches ha pasado en el refugio?
1–8 (una a ochas noches)
Night 2What type of living arrangement did you have before Hurricane Harvey?

¿Dónde vivió antes de venir al refugio por el huracán Harvey?
House/casa
Apartment/townhouse/condo/apartamento/condominio
Live with friend/vivió con un/a amigo/a
Homeless/sin casa
Other/otro: ____________________
All nightsAny questions or concerns raised by the evacuee?

¿Tiene algunas preguntas o dudas?
(open-ended response with text entry)
All nightsThank you for your time. We appreciate your help.

Gracias por su tiempo. Apreciamos su ayuda.

{End of participant survey. Move to next evacuee.}
Location of survey
GRB Hall A
GRB Hall B
GRB Hall C
GRB Hall D
GRB Hall E
Other: __________
Initials of interviewer: _________
1 Question on age was asked first in rapid assessment on nights one (1 September 2017) through 4 (4 September 2017), then asked last on nights five (5 September 2017) to seven (7 September 2017).

References

  1. Watson, K.M.; Harwell, G.R.; Wallace, D.S.; Welborn, T.L.; Stengel, V.G.; McDowell, J.S. Characterization of Peak Streamflows and Flood Inundation of Selected Areas in Southeastern Texas and Southwestern Louisiana from the August and September 2017 Flood Resulting from Hurricane Harvey; U.S. Geological Survey Scientific Investigations Report 2018–5070; U.S. Department of the Interior, U.S. Geological Survey, Texas Water Science Center: Reston, VA, USA, 2018.
  2. OAA National Weather Service. Major Hurricane Harvey—August 25–29, 2017. U.S. Department of Commerce. National Oceanic and Atmospheric Administration, National Weather Service: Silver Spring, MD, USA. Available online: https://www.weather.gov/crp/hurricane_harvey (accessed on 23 June 2021).
  3. Blinder, A.; Healy, J. Coffee and Cots as Houston Houses Thousands in a Convention Center. The New York Times. 28 August 2017. Available online: https://www.nytimes.com/2017/08/28/us/harvey-evacuations-texas.html (accessed on 9 October 2021).
  4. Gale, C. 22 Days at George R. Brown. PCMA Convene. 1 December 2017. Available online: https://www.pcmaconvene.org/convene-magazine/22-days-george-r-brown/ (accessed on 9 October 2021).
  5. Blake, E.S.; Zelinsky, D.A. Tropical Cyclone Report: Hurricane Harvey (17 August–1 September 2017); AL092017; 77p, National Hurricane Center; U.S. Department of Commerce, National Oceanic and Atmospheric Administration, National Weather Service: Silver Spring, MD, USA, 2018. Available online: https://www.nhc.noaa.gov/data/tcr/AL092017_Harvey.pdf (accessed on 23 June 2021).
  6. Waddell, S.; Jayaweera, D.; Mirsaeidi, M.; Beier, J.; Kumar, N. Perspectives on the Health Effects of Hurricanes: A Review and Challenges. Int. J. Environ. Res. Public Health 2021, 18, 2756. [Google Scholar] [CrossRef] [PubMed]
  7. City of Houston. Houston’s Hazards—Office of Emergency Management. Available online: https://www.houstonoem.org/houstons-hazards/ (accessed on 18 February 2022).
  8. Henning, K.J. Overview of Syndromic Surveillance What is Syndromic Surveillance? MMWR Morb. Mortal. Wkly. Rep. 2004, 53, 5–11. [Google Scholar]
  9. Murray, K.O.; Kilborn, C.; Desvignes-Kendrick, M.; Koers, E.; Page, V.; Selwyn, B.J.; Shah, U.; Palacio, H. Emerging Disease Syndromic Surveillance for Hurricane Katrina Evacuees Seeking Shelter in Houston’s Astrodome and Reliant Park Complex. Public Health Rep. 2009, 124, 364–371. [Google Scholar] [CrossRef] [PubMed]
  10. Rasmussen, S.A.; Goodman, R.A. The CDC Field Epidemiology Manual, 4th ed.; Oxford University Press: New York, NY, USA, 2019. [Google Scholar]
  11. Caillouet, L.P.; Paul, P.J.; Sabatier, S.M.; Caillouet, K.A. Eye of the storm: Analysis of shelter treatment records of evacuees to Acadiana from Hurricanes Katrina and Rita. Am. J. Disaster Med. 2012, 7, 253–271. [Google Scholar] [CrossRef]
  12. Hurricane Ike Rapid Needs Assessment—Houston, Texas, September 2008. Available online: https://www.cdc.gov/mmwr/preview/mmwrhtml/mm5838a3.htm (accessed on 18 February 2022).
  13. Stone, G.; Lekht, A.; Burris, N.; Williams, C. Data Collection and Communications in the Public Health Response to a Disaster: Rapid Population Estimate Surveys and the Daily Dashboard in Post-Katrina New Orleans. J. Public Health Manag. Pract. 2007, 13, 453–460. [Google Scholar] [CrossRef]
  14. Bathaei, S.A.; Abolghasem-Gorji, H.; Delgoshaei, B.; Khankeh, H.R. Emergency health evaluation of affected population during disasters: Are there new approaches? J. Educ. Health Promot. 2019, 8, 2. [Google Scholar]
  15. Llamas, T.; Shapiro, E.; Jacobo, J. Inside the Houston convention center where Harvey evacuees are double the capacity. ABC News. 30 August 2017. Available online: https://abcnews.go.com/US/inside-houston-convention-center-harvey-evacuees-double-capacity/story?id=49487937 (accessed on 9 October 2021).
  16. Esri. United States ZIP Code Boundaries 2020—Overview. Available online: https://esri.maps.arcgis.com/home/item.html?id=46b350fa939149debfd9cc71566b43b4 (accessed on 2 November 2021).
  17. Tunstall, S.; Tapsell, S.; Green, C.; Floyd, P.; George, C. The health effects of flooding: Social research results from England and Wales. J. Water Health 2006, 4, 365–380. [Google Scholar] [CrossRef]
  18. Taioli, E.; Tuminello, S.; Lieberman-Cribbin, W.; Bevilacqua, K.; Schneider, S.; Guzman, M.; Kerath, S.; Schwartz, R.M. Mental health challenges and experiences in displaced populations following Hurricane Sandy and Hurricane Harvey: The need for more comprehensive interventions in temporary shelters. J. Epidemiol. Community Health 2018, 72, 867–870. [Google Scholar] [CrossRef]
  19. Makwana, N. Disaster and its impact on mental health: A narrative review. J. Fam. Med. Prim. Care 2019, 8, 3090–3095. [Google Scholar] [CrossRef]
  20. Peek, L. Children and Disasters: Understanding Vulnerability, Developing Capacities, and Promoting Resilience—An Introduction. Child. Youth Environ. 2008, 18, 1–29. [Google Scholar]
  21. Schnall, A.H.; Hanchey, A.; Nakata, N.; Wang, A.; Jeddy, Z.; Alva, H.; Tan, C.; Boehmer, T.; Bayleyegn, T.; Casey-Lockyer, M. Disaster-Related Shelter Surveillance during the Hurricane Harvey Response—Texas 2017. Disaster Med. Public Health Prep. 2020, 14, 49–55. [Google Scholar] [CrossRef] [PubMed]
  22. Travia, K.R.; Kahkoska, A.R.; Igudesman, D.; Souris, K.J.; Beasley, C.; Mayer-Davis, E.J. Impact of Hurricane Matthew on Diabetes Self-Management and Outcomes. North Carol. Med. J. 2021, 82, 100–107. [Google Scholar] [CrossRef] [PubMed]
  23. Malik, S.; Lee, D.C.; Doran, K.M.; Grudzen, C.R.; Worthing, J.; Portelli, I.; Goldfrank, L.R.; Smith, S.W. Vulnerability of Older Adults in Disasters: Emergency Department Utilization by Geriatric Patients After Hurricane Sandy. Disaster Med. Public Health Prep. 2018, 12, 184–193. [Google Scholar] [CrossRef] [PubMed]
  24. Centers for Disease Control and Prevention (CDC). Norovirus outbreak among evacuees from hurricane Katrina—Houston, Texas, September 2005. MMWR Morb. Mortal. Wkly. Rep. 2005, 54, 1016–1018. [Google Scholar]
  25. Neilson-Gammon, J.; Escobedo, J.; Ott, C.; Dedrick, J.; Van Fleet, A. Assessment of Historic and Future Trends of Extreme Weather in Texas, 1900–2036. Office of the Texas State Climatologist, Texas A&M University. Available online: https://texas2036.org/weather/ (accessed on 15 October 2021).
  26. Althubaiti, A. Information bias in health research: Definition, pitfalls, and adjustment methods. J. Multidiscip. Healthc. 2016, 9, 211–217. [Google Scholar] [CrossRef] [Green Version]
  27. Hicks, K. Deputy Secretary of Defense Dr. Kathleen H. Hicks’ Remarks at Worldwide Logistics Symposium 2022: “Global Security Implications of Climate Change”. Available online: https://www.defense.gov/News/Transcripts/Transcript/Article/2959502/deputy-secretary-of-defense-dr-kathleen-h-hicks-remarks-at-worldwide-logistics/ (accessed on 18 March 2022).
  28. International Federation of Red Cross and Red Crescent Societies. World Disasters Report 2020. Available online: https://oldmedia.ifrc.org/ifrc/world-disaster-report-2020/ (accessed on 18 March 2022).
  29. Frank, T. 2020 Is a Record Year for Disaster Shelters, Red Cross Says. Scientific American. 2 December 2020. Available online: https://www.scientificamerican.com/article/2020-is-a-record-year-for-disaster-shelters-red-cross-says/ (accessed on 18 March 2022).
  30. Smith, A.B. U.S. Billion-Dollar Weather and Climate Disasters, 1980–present (NCEI Accession 0209268); NOAA National Centers for Environmental Information: Asheville, NC, USA, epub ahead of printing; 2022. [CrossRef]
  31. Understanding Houston. Natural Disaster Risks in Houston. Available online: https://www.understandinghouston.org/topic/disasters/disaster-risks#flooding_risks (accessed on 18 March 2022).
  32. Liu, L.; Haynie, A.; Jin, S.; Zangeneh, A.; Bakota, E.; Hornstein, B.D.; Beckham, D.; Reed, B.C.; Kiger, J.; McClendon, M.; et al. Influenza A (H3) Outbreak at a Hurricane Harvey Megashelter in Harris County, Texas: Successes and Challenges in Disease Identification and Control Measure Implementation. Disaster Med. Public Health Prep. 2019, 13, 97–101. [Google Scholar] [CrossRef]
  33. Fazel, S.; Geddes, J.R.; Kushel, M. The health of homeless people in high-income countries: Descriptive epidemiology, health consequences, and clinical and policy recommendations. Lancet 2014, 384, 1529–1540. [Google Scholar] [CrossRef] [Green Version]
  34. Centers for Disease Control and Prevention. Surveillance Strategy Repot—Syndromic Reporting. Public Health Surveillance and Data. Available online: https://www.cdc.gov/surveillance/initiatives/symptoms-signal.html (accessed on 14 March 2022).
  35. Centers for Disease Control and Prevention (CDC). A Primer for Understanding the Principles and Practices of Disaster Surveillance in the United States, 1st ed.; CDC: Atlanta, GA, USA, 2016.
  36. Comfort, L.K.; Haase, T.W. Communication, Coherence, and Collective Action: The Impact of Hurricane Katrina on Communications Infrastructure. Public Work. Manag. Policy 2006, 10, 328–343. [Google Scholar] [CrossRef]
  37. Santos-Burgoa, C.; Goldman, A.; Andrade, E.; Barrett, N.; Colon-Ramos, U.; Edberg, M.; Garcia-Meza, A.; Goldman, L.; Roess, A.; Sandberg, J.; et al. Ascertainment of the Estimated Excess Mortality from Hurricane María in Puerto Rico; The George Washington University: Washington, DC, USA, 2018. [Google Scholar]
  38. Schnall, A.H.; Roth, J.; Ekpo, L.L.; Guendel, I.; Davis, M.; Ellis, E.M. Disaster-Related Surveillance Among US Virgin Islands (USVI) Shelters During the Hurricanes Irma and Maria Response. Disaster Med. Public Health Prep. 2019, 13, 38–43. [Google Scholar] [CrossRef]
  39. Surveillance in Hurricane Evacuation Centers—Louisiana, September–October 2005. Available online: https://www.cdc.gov/mmwr/preview/mmwrhtml/mm5502a3.htm (accessed on 14 March 2022).
  40. CDC Shelter Assessment Tool | Emergency Preparedness and Response. Available online: https://emergency.cdc.gov/shelterassessment/ (accessed on 14 March 2022).
  41. New Hampshire Department of Health and Human Services. Shelter Surveillance in Emergency Shelters. Available online: https://www.dhhs.nh.gov/esu/shelter-surveillance.htm (accessed on 14 March 2022).
  42. Public Health Assessment and Surveillance|Natural Disasters and Severe Weather|CDC. Available online: https://www.cdc.gov/disasters/surveillance/index.html (accessed on 14 March 2022).
  43. Fleischauer, A.; Young, S.; Mott, J.; Ratard, R. Disaster Surveillance Revisited: Passive, Active and Electronic Syndromic Surveillance during Hurricane Katrina, New Orleans, LA–2005. Corpus ID: 57880136. Available online: https://www.semanticscholar.org/paper/Disaster-Surveillance-Revisited%3A-Passive%2C-Active-LA-Fleischauer-Young/8723a2ed07af8dce43f7cc0c3a4312012b7317be (accessed on 18 March 2022).
  44. Stoto, M.A. Syndromic Surveillance. Available online: https://issues.org/stoto/ (accessed on 14 March 2022).
  45. Customer Story, Google Workspace. Eagle County, Colorado: Powering Real-Time Emergency Response through Cloud Collaboration. Available online: https://workspace.google.com/customers/eagle-county.html (accessed on 18 March 2022).
  46. Shumate, A.M.; Yard, E.E.; Casey-Lockyer, M.; Apostolou, A.; Chan, M.; Tan, C.; Noe, R.S.; Wolkin, A.F. Effectiveness of Using Cellular Phones to Transmit Real-Time Shelter Morbidity Surveillance Data After Hurricane Sandy, New Jersey, October to November, 2012. Disaster Med. Public Health Prep. 2016, 10, 525–528. [Google Scholar] [CrossRef]
  47. Zhang, M.W.; Ho, C.S.; Fang, P.; Lu, Y.; Ho, R.C. Usage of social media and smartphone application in assessment of physical and psychological well-being of individuals in times of a major air pollution crisis. JMIR Mhealth Uhealth 2014, 2, e16. [Google Scholar] [CrossRef] [PubMed] [Green Version]
Figure 1. The syndromic surveillance results (in percent per day) of the cot survey showing the daily physical and mental health symptom trends reported by evacuees from 1–7 September 2017.
Sustainability 14 06018 g001
Figure 2. Reported zip codes of Hurricane Harvey evacuees inside of the Houston George R. Brown Convention Center megashelter on 1 September 2017.
Sustainability 14 06018 g002
Table 1. The cot survey metrics among Hurricane Harvey evacuees residing in the City of Houston George R. Brown megashelter from 1–7 September 2017 (n = 4156 participants approached over seven days).
Survey DraftDate UsedNumber of
Survey
Questions
Number of
Volunteers
Number of
Spanish-Speaking
Volunteers
Total
Participants
Approached
Cumulative Daily Survey Duration (Minutes)Average Time per Interview (in Minutes)Participation Rate (%)
19/1/1752466821315.1889.0%
29/2/1742065371937.9490.5%
39/3/172316624955.1791.3%
9/4/1722156211706.2192.6%
4 *9/5/1721355751433.3995.3%
9/6/172308602995.2593.9%
9/7/172268515874.5995.5%
Mean 32465941315.292.6%
* On the 5th night of surveillance, we reversed the order of the two questions to start with asking how the participant was feeling first, then asking their age.
Table 2. Digital drop-in cot survey metrics, population characteristics, and syndromic surveillance results reported daily by evacuees throughout the duration of the response period. Reported symptoms listed from highest rank to lowest reported symptom.
1-September2-September3-September4-September5-September6-September7-September
CountPercentCountPercentCountPercentCountPercentCountPercentCountPercentCountPercent
Cot Survey Participation
  Total active cots2016-1067---1460-------
  Agreed to participate607-486-570-575-548-565-492-
Reported Age Range
  Total *594 482 563 521 538 559 484
  <1 year91.530.671.271.371.361.191.9
  1–5 years366.1245.0223.9285.4285.2254.5224.5
  6–10 years193.2193.9244.3234.4264.8193.4193.9
  11–18 years437.2285.8437.6295.6468.6397.0316.4
  19–25 years437.2387.9325.7366.9458.4397.0306.2
  26–40 years13923.410521.813423.812824.612723.613123.411223.1
  41–64 years26544.622246.126246.524046.122642.027148.523147.7
  ≥65 years406.7438.9396.9305.8336.1295.2306.2
Reported Symptoms 1
  Runny nose/congestion/sneezing406.7204.1366.4438.3224.1285.0469.5
  Achy muscles/joints376.2234.8274.8173.3142.6142.5163.3
  Anxiety345.7265.4234.1234.4234.3173.0387.9
  Headache274.5153.1234.1163.1183.3122.1173.5
  Depression244.0408.3295.2244.6275.0173.0245.0
  Cough—productive172.971.5142.5244.6173.2142.5224.5
  Stomach pain/cramping142.4102.161.1101.991.761.171.4
  Sore throat142.491.9142.5152.9112.0162.9142.9
  Cough—non-productive122.0153.1132.3234.4142.6162.991.9
  Injury/Skin wounds122.040.891.651.030.630.530.6
  Malaise/Fatigue/Tired152.571.5203.6244.6122.2152.7112.3
  Fever101.781.750.951.000.020.430.6
  Nausea101.730.650.991.730.661.130.6
  Rash81.391.961.120.420.450.920.4
  Diarrhea50.840.871.2122.361.161.171.4
  Animal or insect bites20.320.450.961.220.410.210.2
  Vomiting20.330.620.430.610.230.520.4
* Differences in reported age range and people who agreed to participate declined to report age (n = 102, 3%). 1 Not reported in table: pink eye (conjunctivitis), suicidal thoughts.
Table 3. Cumulative differences in the most commonly reported symptoms between adults and children over the entire surveillance period.
All Participants with Age Reported (n = 3741)Adults 18 and Older (n = 3100)Children under 18 Years (n = 641)Statistical Differences between Children and Adults
n%n%n%OR 195% CI 2p-Value
Reported Symptoms134736118738160251.87[1.53, 2.28]<0.0001
Mental Health
   Anxiety18051716914.09[2.09, 9.17]<0.0001
   Depression1835183600undefinedundefinedN/A
Physical Health
   Runny nose/congestion/sneezing 2306163567100.48[0.35, 0.65]<0.0001
   Achy muscles/joints146414353010.3[3.43, 50.60]<0.0001
   Headache126310941731.34[0.79, 2.40]0.2697
   Cough—productive11439032440.77[0.48, 1.27]0.2595
   Cough—non-productive9637122540.58[0.36, 0.96]0.019
   Stomach pain/cramping622542811.4[0.66, 3.43]0.3726
   Sore throat9127721421.14[0.64, 2.20]0.6538
   Injury/Skin wounds35135100undefinedundefinedN/A
   Rash311251610.86[0.34, 2.58]0.7418
   Malaise/Fatigue/Tired822803208.46[2.26, 71.24]0.0004
   Fever301231710.68[0.28, 1.88]0.3656
   Nausea39139100undefinedundefinedN/A
   Diarrhea4613411220.58[0.29, 1.24]0.1049
   Vomiting160130300.9[0.25, 4.91]0.8635
1 Odds Ratio; 2 Confidence Interval.
Publisher’s Note: MDPI stays neutral with regard to jurisdictional claims in published maps and institutional affiliations.

