
Resident Perceptions of Mosquito Problems Are More Influenced by Landscape Factors than Mosquito Abundance

 , , ,
, , ,
Abstract
:1. Introduction
2. Materials and Methods
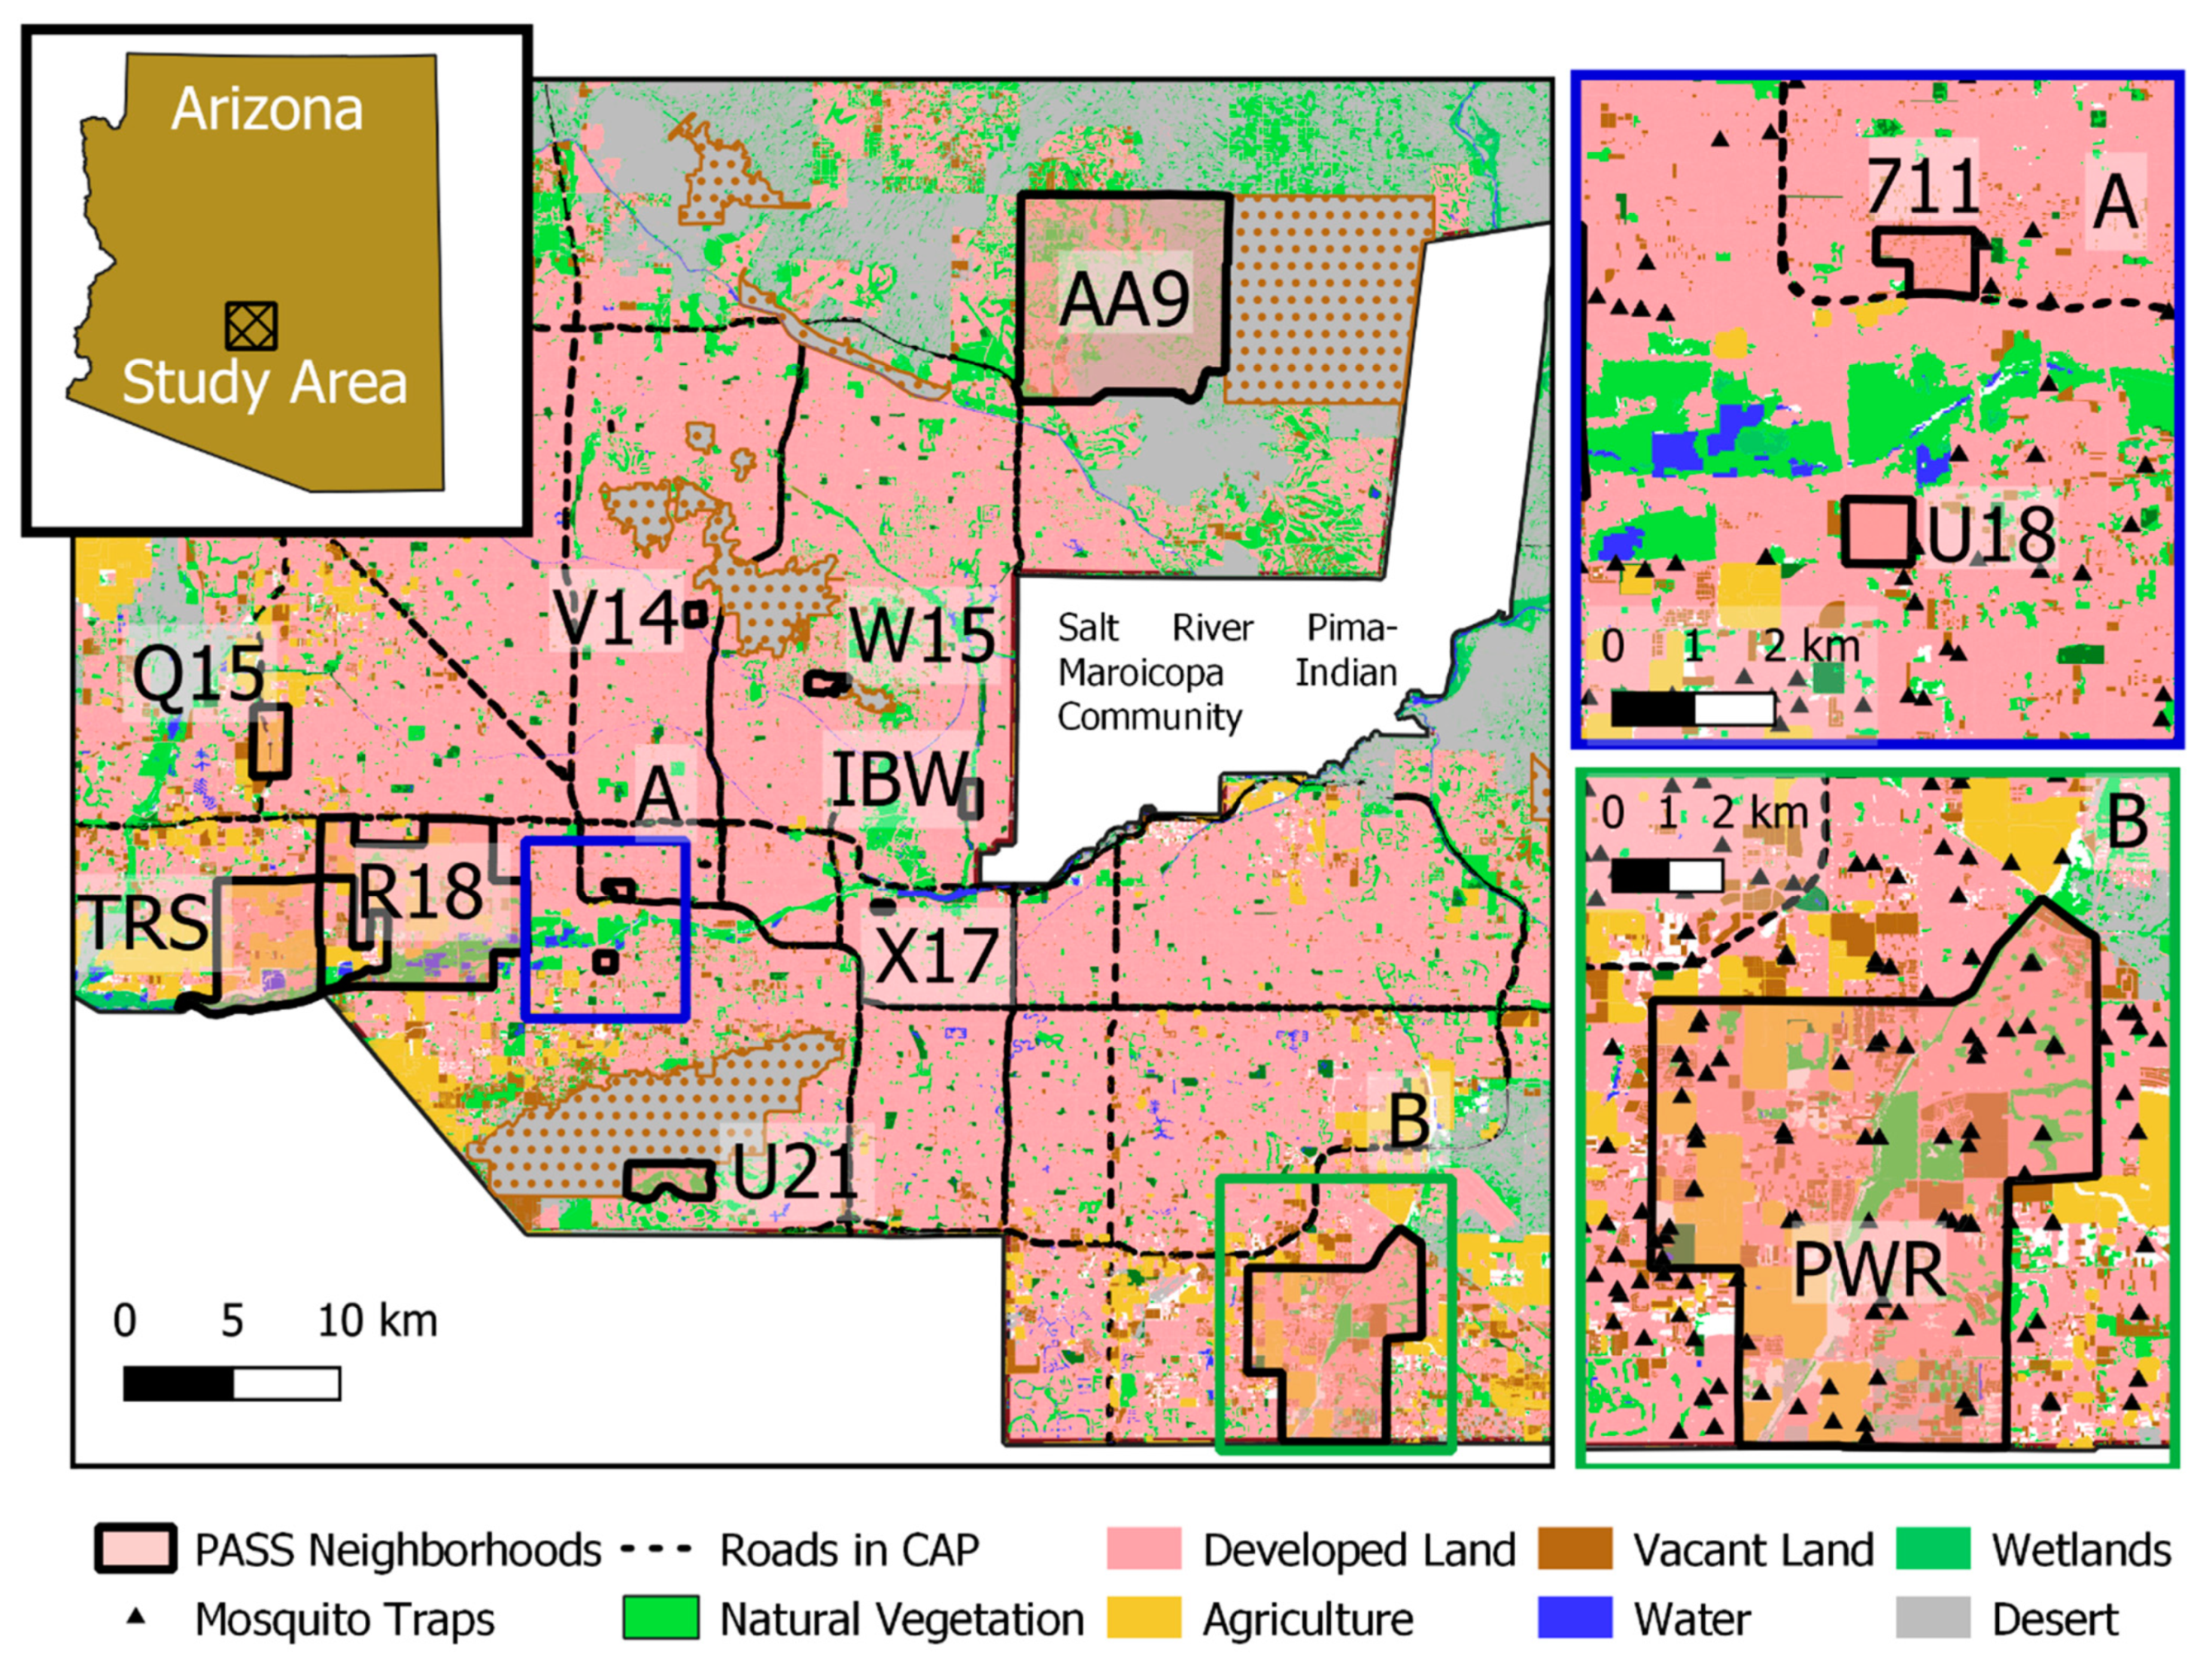
2.1. Study Area
2.2. Mosquito Abundance
2.3. Environmental Variables
2.4. Social Variables
2.5. Boosted Regression Tree
3. Results
4. Discussion
5. Conclusions
Author Contributions
Funding
Institutional Review Board Statement
Informed Consent Statement
Data Availability Statement
Acknowledgments
Conflicts of Interest
Appendix A

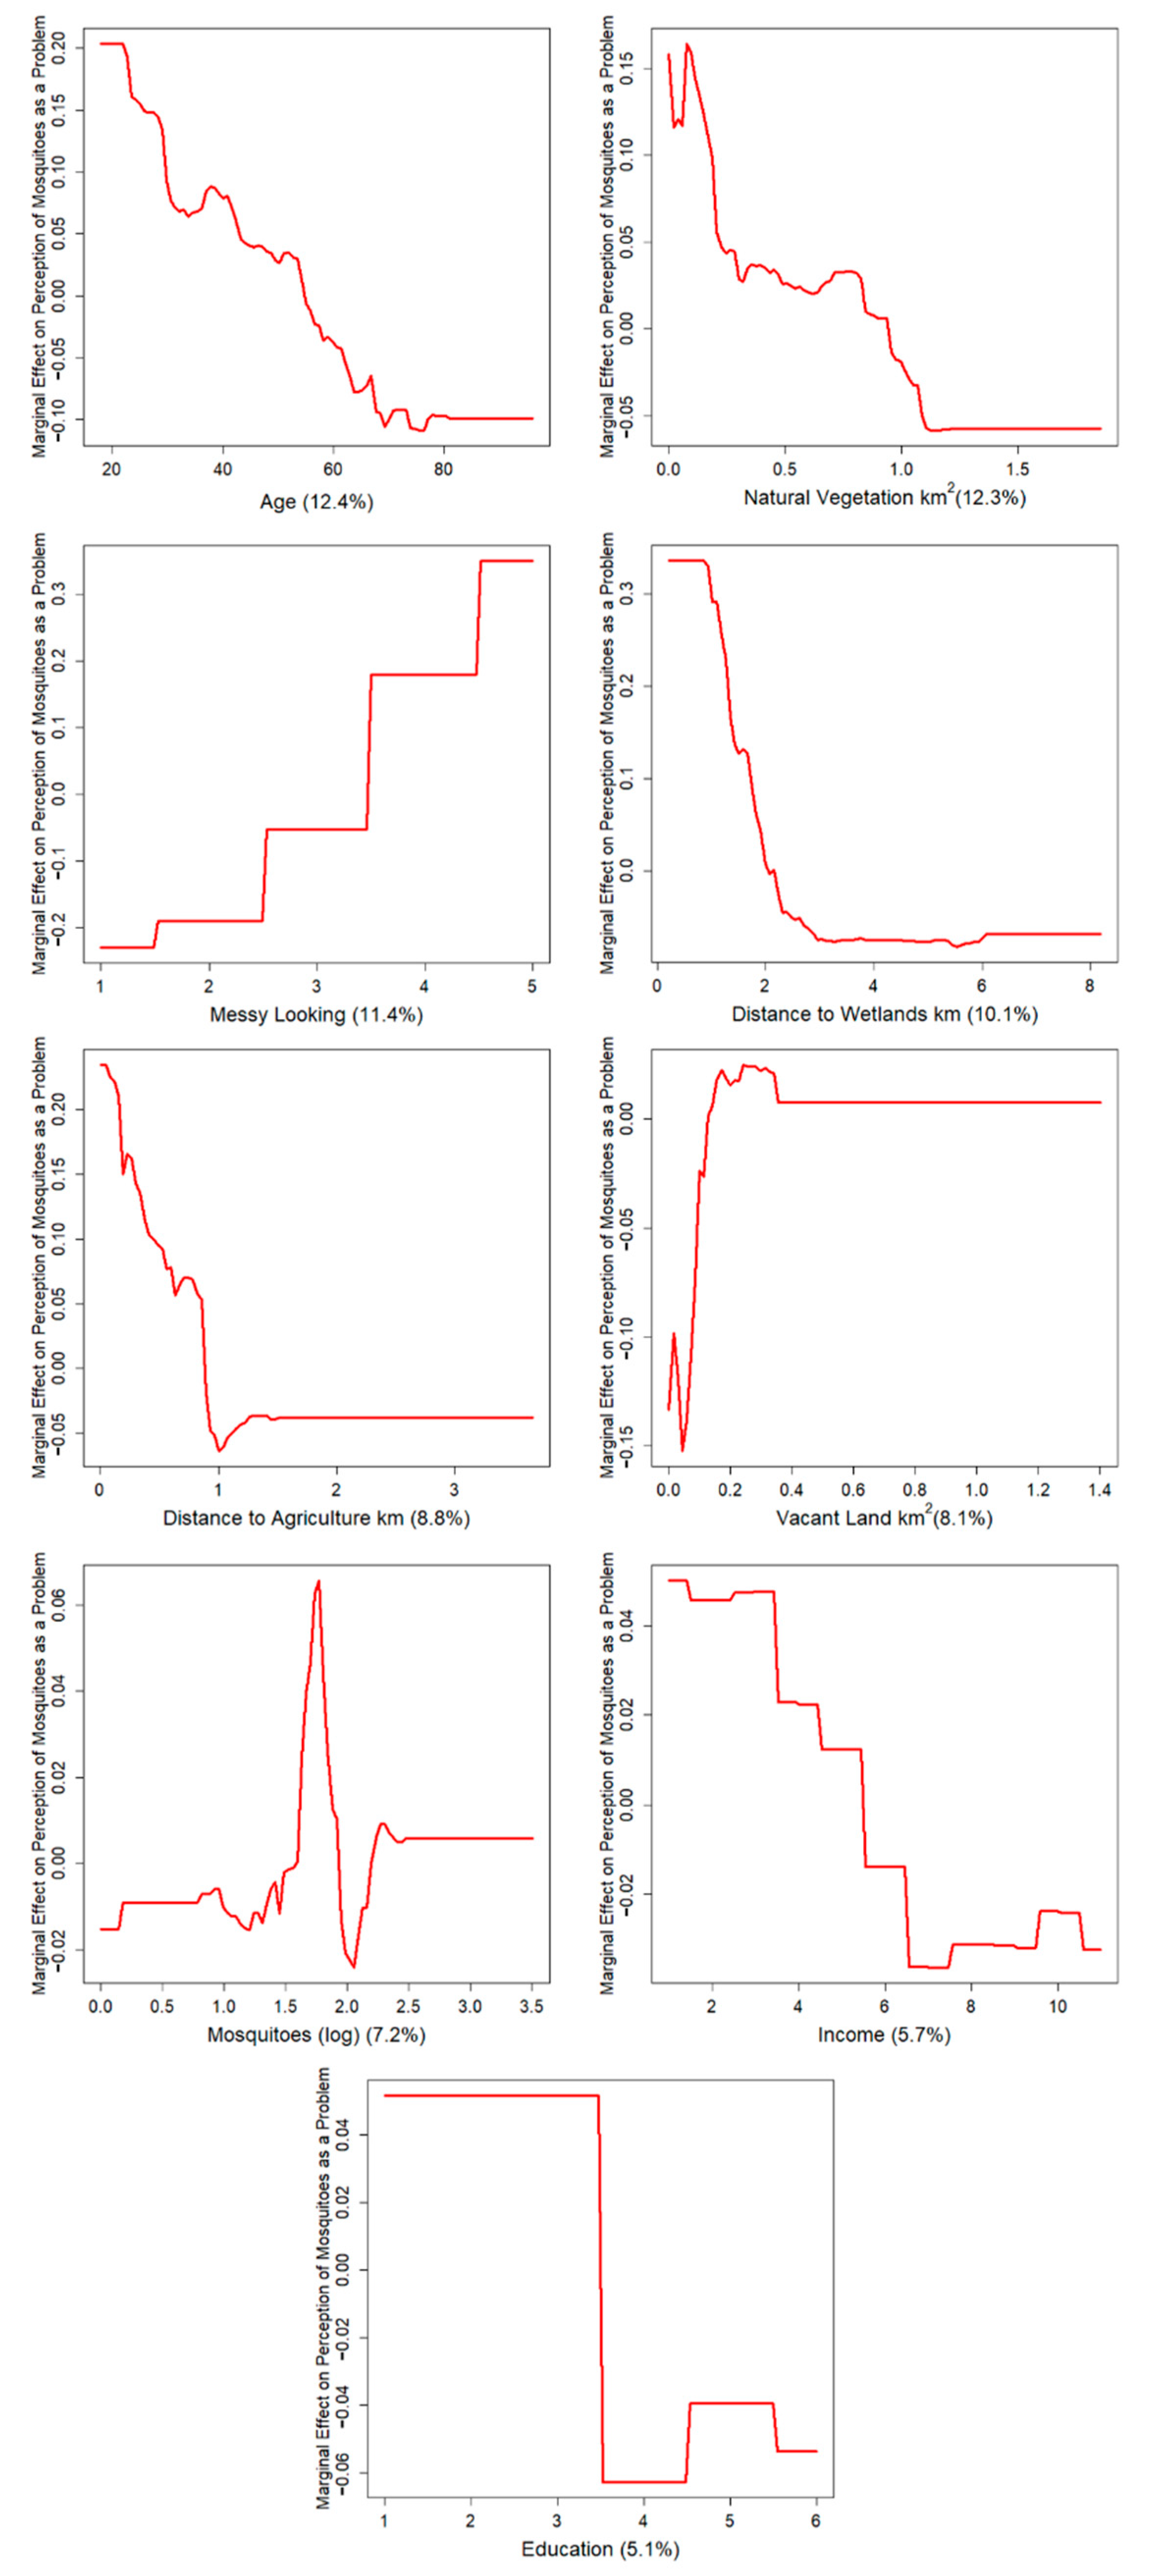
| Variable | Relative Influence | Variable Measurement |
|---|---|---|
| Age | 12.4 | Reported Age (Continuous) |
| Amount of Natural Vegetation | 12.3 | Km2 (continuous) |
| Messy Looking Landscape | 11.4 | Likert (1–5) Disagree to Agree |
| Distance from Wetlands | 10.1 | Km (continuous) |
| Distance to Agriculture | 8.8 | Km (continuous) |
| Amount of Vacant Land | 8.1 | Km2 (continuous) |
| Number of Mosquitoes (log) | 7.2 | Count (Continuous) |
| Income | 5.7 | Likert-Like (1–11) Increasing |
| Education | 5.1 | Likert-Like (1–7) Low to High Levels of Education |
| Local Landscape Flooding | 4.8 | Likert (1–5) Disagree to Agree |
| Distance to Water | 4.5 | Km (continuous) |
| Distance to Desert Parks | 4.3 | Km (continuous) |
| Gender | 2.2 | Binary (female or male) |
| LatinX | 2.1 | Binary (no or yes) |
| Natural Looking Landscape | 1.5 | Likert (1–5) Disagree to Agree |
References
- Gubler, D.J. The Global Emergence/Resurgence of Arboviral Diseases As Public Health Problems. Arch. Med. Res. 2002, 33, 330–342. [Google Scholar] [CrossRef] [Green Version]
- Wilcox, B.A.; Colwell, R.R. Emerging and Reemerging Infectious Diseases: Biocomplexity as an Interdisciplinary Paradigm. EcoHealth 2005, 2, 244. [Google Scholar] [CrossRef]
- Woolhouse, M.E.J.; Gowtage-Sequeria, S. Host Range and Emerging and Reemerging Pathogens. Emerg. Infect. Dis. 2005, 11, 1842–1847. [Google Scholar] [CrossRef] [PubMed]
- Morens, D.M.; Fauci, A.S. Dengue and Hemorrhagic FeverA Potential Threat to Public Health in the United States. JAMA 2008, 299, 214–216. [Google Scholar] [CrossRef] [PubMed]
- Grandadam, M.; Caro, V.; Plumet, S.; Thiberge, J.-M.; Souarès, Y.; Failloux, A.-B.; Tolou, H.J.; Budelot, M.; Cosserat, D.; Leparc-Goffart, I.; et al. Chikungunya Virus, Southeastern France. Emerg. Infect. Dis. 2011, 17, 910–913. [Google Scholar] [CrossRef] [PubMed]
- Healy, K.; Hamilton, G.; Crepeau, T.; Healy, S.; Unlu, I.; Farajollahi, A.; Fonseca, D.M. Integrating the Public in Mosquito Management: Active Education by Community Peers Can Lead to Significant Reduction in Peridomestic Container Mosquito Habitats. PLoS ONE 2014, 9, e108504. [Google Scholar] [CrossRef] [Green Version]
- Gubler, D.J. Dengue and Dengue Hemorrhagic Fever. Clin. Microbiol. Rev. 1998, 11, 480–496. [Google Scholar] [CrossRef] [Green Version]
- Patterson, G. The Mosquito Wars: A History of Control in Florida; University Press of Florida: Gainesville, FL, USA, 2004. [Google Scholar]
- Lopes, G.; Reis-Castro, L. A Vector in the (Re)Making: A History of Aedes aegypti as Mosquitoes that Transmit Diseases in Brazil. In Framing Animals as Epidemic Villains: Histories of Non-Human Disease Vectors; Lynteris, C., Ed.; Medicine and Biomedical Sciences in Modern History; Springer: Cham, Switzerland, 2019; pp. 147–175. ISBN 978-3-030-26795-7. [Google Scholar]
- Rochlin, I.; Dempsey, M.E.; Iwanejko, T.; Ninivaggi, D.V. Aquatic Insects of New York Salt Marsh Associated with Mosquito Larval Habitat and Their Potential Utility as Bioindicators. J. Insect Sci. 2011, 11, 172. [Google Scholar] [CrossRef] [Green Version]
- Samy, A.M.; Elaagip, A.H.; Kenawy, M.A.; Ayres, C.F.J.; Peterson, A.T.; Soliman, D.E. Climate Change Influences on the Global Potential Distribution of the Mosquito Culex Quinquefasciatus, Vector of West Nile Virus and Lymphatic Filariasis. PLoS ONE 2016, 11, e0163863. [Google Scholar] [CrossRef]
- Nguyen-Tien, T.; Lundkvist, Å.; Lindahl, J. Urban Transmission of Mosquito-Borne Flaviviruses—A Review of the Risk for Humans in Vietnam. Infect. Ecol. Epidemiol. 2019, 9, 1660129. [Google Scholar] [CrossRef] [Green Version]
- Mariconti, M.; Obadia, T.; Mousson, L.; Malacrida, A.; Gasperi, G.; Failloux, A.-B.; Yen, P.-S. Estimating the Risk of Arbovirus Transmission in Southern Europe Using Vector Competence Data. Sci. Rep. 2019, 9, 17852. [Google Scholar] [CrossRef]
- Sutherst, R.W. Pest Species Distribution Modelling: Origins and Lessons from History. Biol. Invasions 2014, 16, 239–256. [Google Scholar] [CrossRef]
- Pickett, S.T.A.; Cadenasso, M.L.; Grove, J.M.; Boone, C.G.; Groffman, P.M.; Irwin, E.; Kaushal, S.S.; Marshall, V.; McGrath, B.P.; Nilon, C.H.; et al. Urban Ecological Systems: Scientific Foundations and a Decade of Progress. J. Environ. Manag. 2011, 92, 331–362. [Google Scholar] [CrossRef]
- LaDeau, S.L.; Leisnham, P.T.; Biehler, D.; Bodner, D. Higher Mosquito Production in Low-Income Neighborhoods of Baltimore and Washington, DC: Understanding Ecological Drivers and Mosquito-Borne Disease Risk in Temperate Cities. Int. J. Environ. Res. Public Health 2013, 10, 1505–1526. [Google Scholar] [CrossRef] [Green Version]
- Fritz, M.L.; Walker, E.D.; Miller, J.R.; Severson, D.W.; Dworkin, I. Divergent Host Preferences of Above- and below-Ground Culex Pipiens Mosquitoes and Their Hybrid Offspring. Med. Vet. Entomol. 2015, 29, 115–123. [Google Scholar] [CrossRef]
- Romeo-Aznar, V.; Paul, R.; Telle, O.; Pascual, M. Mosquito-Borne Transmission in Urban Landscapes: The Missing Link between Vector Abundance and Human Density. Proc. R. Soc. B Biol. Sci. 2018, 285, 826. [Google Scholar] [CrossRef]
- Schmidt, N.D.V.; Kovach, T.; Kilpatrick, A.M.; Oviedo, J.L.; Huntsinger, L.; Hruska, T.; Miller, N.L.; Beissinger, S.R. Integrating Social and Ecological Data to Model Metapopulation Dynamics in Coupled Human and Natural Systems. Ecology 2019, 100, e02711. [Google Scholar] [CrossRef] [PubMed]
- Goodman, H.; Egizi, A.; Fonseca, D.M.; Leisnham, P.T.; LaDeau, S.L. Primary Blood-Hosts of Mosquitoes Are Influenced by Social and Ecological Conditions in a Complex Urban Landscape. Parasites Vectors 2018, 11, 218. [Google Scholar] [CrossRef] [PubMed]
- Okogun, G.R.A.; Anosike, J.C.; Okere, A.; Nwoke, B.; Esekhegbe, A. Epidemiological Implications of Preferences of Breeding Sites of Mosquito Speciesin Midwestern Nigeria. Ann. Agric. Environ. Med. 2003, 10, 217–222. [Google Scholar] [PubMed]
- Becker, B.; Leisnham, P.T.; LaDeau, S.L. A Tale of Two City Blocks: Differences in Immature and Adult Mosquito Abundances between Socioeconomically Different Urban Blocks in Baltimore (Maryland, USA). Int. J. Environ. Res. Public Health 2014, 11, 3256–3270. [Google Scholar] [CrossRef] [PubMed] [Green Version]
- Wilke, A.B.B.; Beier, J.C.; Benelli, G. Filariasis Vector Control Down-Played Due to the Belief the Drugs Will Be Enough—Not True! Entomol. Gen. 2020, 40, 15–24. [Google Scholar] [CrossRef]
- Larson, E.K.; Grimm, N.; Gober, P.; Redman, C. The Paradoxical Ecology and Management of Water in the Phoenix, USA Metropolitan Area. Ecohydrol. Hydrobiol. 2005, 5, 287–296. [Google Scholar]
- Keating, J.; Macintyre, K.; Mbogo, C.M.; Githure, J.I.; Beier, J.C. Characterization of Potential Larval Habitats for Anophelesmosquitoes in Relation to Urban Land-Use in Malindi, Kenya. Int. J. Health Geogr. 2004, 3, 9. [Google Scholar] [CrossRef] [Green Version]
- Townroe, S.; Callaghan, A. British Container Breeding Mosquitoes: The Impact of Urbanisation and Climate Change on Community Composition and Phenology. PLoS ONE 2014, 9, e95325. [Google Scholar] [CrossRef] [Green Version]
- Akhtar, R.; Gupta, P.T.; Srivastava, A.K. Urbanization, Urban Heat Island Effects and Dengue Outbreak in Delhi. In Climate Change and Human Health Scenario in South and Southeast Asia; Akhtar, R., Ed.; Advances in Asian Human-Environmental Research; Springer: Cham, Switzerland, 2016; pp. 99–111. ISBN 978-3-319-23684-1. [Google Scholar]
- Armstrong, P.M.; Andreadis, T.G.; Shepard, J.J.; Thomas, M.C. Northern Range Expansion of the Asian Tiger Mosquito (Aedes Albopictus): Analysis of Mosquito Data from Connecticut, USA. PLoS Negl. Trop. Dis. 2017, 11, e0005623. [Google Scholar] [CrossRef] [Green Version]
- Thuilliez, J.; Bellia, C.; Dehecq, J.-S.; Reilhes, O. Household-Level Expenditure on Protective Measures Against Mosquitoes on the Island of La Réunion, France. PLoS Negl. Trop. Dis. 2014, 8, e2609. [Google Scholar] [CrossRef] [PubMed] [Green Version]
- Gaillard, B.; Simard, F.; Dormont, L.; Jay-Robert, P.; de Lurbe, D.D.; Etienne, M.; Baudin, A.; Raude, J. Is Perceived Exposure to Mosquitoes Associated with Actual Exposure? Results from Studies in High-Risk and Low-Risk Geographic Areas. Am. J. Trop. Med. Hyg. 2019, 101, 976–979. [Google Scholar] [CrossRef] [Green Version]
- Murindahabi, M.M.; Takken, W.; Misago, X.; Niyituma, E.; Umupfasoni, J.; Hakizimana, E.; van Vliet, A.J.H.; Poortvliet, P.M.; Mutesa, L.; Murindahabi, N.K.; et al. Monitoring Mosquito Nuisance for the Development of a Citizen Science Approach for Malaria Vector Surveillance in Rwanda. Malar. J. 2021, 20, 36. [Google Scholar] [CrossRef] [PubMed]
- Fonseca, D.M.; Unlu, I.; Crepeau, T.; Farajollahi, A.; Healy, S.P.; Bartlett-Healy, K.; Strickman, D.; Gaugler, R.; Hamilton, G.; Kline, D.; et al. Area-Wide Management of Aedes Albopictus. Part 2: Gauging the Efficacy of Traditional Integrated Pest Control Measures against Urban Container Mosquitoes. Pest. Manag. Sci. 2013, 69, 1351–1361. [Google Scholar] [CrossRef] [PubMed]
- Unlu, I.; Farajollahi, A.; Strickman, D.; Fonseca, D.M. Crouching Tiger, Hidden Trouble: Urban Sources of Aedes Albopictus (Diptera: Culicidae) Refractory to Source-Reduction. PLoS ONE 2013, 8, e77999. [Google Scholar] [CrossRef] [PubMed] [Green Version]
- Rose, R.I. Pesticides and Public Health: Integrated Methods of Mosquito Management. Emerg. Infect. Dis. 2001, 7, 17–23. [Google Scholar] [CrossRef] [PubMed] [Green Version]
- Benelli, G.; Maggi, F.; Pavela, R.; Murugan, K.; Govindarajan, M.; Vaseeharan, B.; Petrelli, R.; Cappellacci, L.; Kumar, S.; Hofer, A.; et al. Mosquito Control with Green Nanopesticides: Towards the One Health Approach? A Review of Non-Target Effects. Environ. Sci. Pollut. Res. 2018, 25, 10184–10206. [Google Scholar] [CrossRef] [PubMed]
- Baptista, C.; Ong, A. The All-Natural Solution to Mosquito Control. Int. Pest. Control 2010, 52, 215–216. [Google Scholar]
- Kem, W.H. Some Small Native Freshwater Fish Recommended for Mosquito and Midge Control in Ornamental Ponds. EDIS 2005, 2005, 1. [Google Scholar]
- Scott, T.; Takken, W.; Knols, B.; Boëte, C. The Ecology of Genetically Modified Mosquitoes. Science 2002, 298, 117–119. [Google Scholar] [CrossRef]
- Beisel, U.; Boëte, C. The Flying Public Health Tool: Genetically Modified Mosquitoes and Malaria Control. Sci. Cult. 2013, 22, 38–60. [Google Scholar] [CrossRef]
- Mutero, C.M.; Schlodder, D.; Kabatereine, N.; Kramer, R. Integrated Vector Management for Malaria Control in Uganda: Knowledge, Perceptions and Policy Development. Malar. J. 2012, 11, 21. [Google Scholar] [CrossRef] [Green Version]
- Hlongwana, K.W.; Mavundza, E.J.; Mohapi, E.P.; Kruger, P.; Urbach, J.; Mukaratirwa, S.; Maharaj, R. Vector-Control Personnel’s Knowledge, Perceptions and Practices towards Insecticides Used for Indoor Residual Spraying in Limpopo Province, South Africa. Parasites Vectors 2013, 6, 118. [Google Scholar] [CrossRef] [Green Version]
- Brown, Z.S.; Kramer, R.A.; Ocan, D.; Oryema, C. Household Perceptions and Subjective Valuations of Indoor Residual Spraying Programmes to Control Malaria in Northern Uganda. Infect. Dis. Poverty 2016, 5, 100. [Google Scholar] [CrossRef] [Green Version]
- Halasa, Y.A.; Shepard, D.S.; Wittenberg, E.; Fonseca, D.M.; Farajollahi, A.; Healy, S.; Gaugler, R.; Strickman, D.; Clark, G.G. Willingness-to-Pay for an Area-Wide Integrated Pest Management Program to Control the Asian Tiger Mosquito in New Jersey. Moco 2012, 28, 225–236. [Google Scholar] [CrossRef]
- Duman-Scheel, M.; Eggleson, K.K.; Achee, N.L.; Grieco, J.P.; Hapairai, L.K. Mosquito Control Practices and Perceptions: An Analysis of Economic Stakeholders during the Zika Epidemic in Belize, Central America. PLoS ONE 2018, 13, e0201075. [Google Scholar] [CrossRef] [PubMed]
- Lull, R.B.; Akin, H.; Hallman, W.K.; Brossard, D.; Jamieson, K.H. Modeling Risk Perceptions, Benefit Perceptions, and Approval of Releasing Genetically Engineered Mosquitoes as a Response to Zika Virus. Environ. Commun. 2020, 14, 933–953. [Google Scholar] [CrossRef]
- Capurro, M.L.; Carvalho, D.O.; Garziera, L.; Pedrosa, C.; Damasceno, I.; Lima, I.; Duarte, B.; Fernandes, J.; Lees, R.S.; Malavasi, A. Description of Social Aspects Surrounding Release of Transgenic Mosquitoes in Brazil. Int. J. Recent Sci. Res. 2016, 4, 10363–10369. [Google Scholar]
- Decker, D.J.; Evensen, D.T.N.; Siemer, W.F.; Leong, K.M.; Riley, S.J.; Wild, M.A.; Castle, K.T.; Higgins, C.L. Understanding Risk Perceptions to Enhance Communication about Human-Wildlife Interactions and the Impacts of Zoonotic Disease. ILAR J. 2010, 51, 255–261. [Google Scholar] [CrossRef] [PubMed] [Green Version]
- Ghosh, A.; Mukherjee, S.; Dutta, T.; Roy, S.; Mondal, F.B. Community Perceptions Regarding Mosquito Borne Diseases in Some Selected Localitities of Bankura, a Peri-Urban Area of West Bengal, India. J. Mosq. Res. 2013, 3, 54–57. [Google Scholar] [CrossRef] [Green Version]
- Jordan, R.C.; Sorensen, A.E.; Ladeau, S. Citizen Science as a Tool for Mosquito Control. Moco 2017, 33, 241–245. [Google Scholar] [CrossRef]
- Richards, S.L.; Balanay, J.A.G.; Byrd, B.D.; Reiskind, M.H.; Styers, D.M. Regional Survey of Mosquito Control Knowledge and Usage In North Carolina. Moco 2017, 33, 331–339. [Google Scholar] [CrossRef]
- Kumar, K.R.; Gururaj, G. Community Perception Regarding Mosquito-Borne Diseases in Karnataka State, India. J. Mosq. Res. 2005, 29, 8. [Google Scholar]
- Hutchinson, R.; Lindsay, S. Perceived Nuisance of Mosquitoes on the Isle of Sheppey, Kent, UK. J. Biosoc. Sci. 2006, 38, 707–712. [Google Scholar] [CrossRef]
- Onwujekwe, O.; Hanson, K.; Fox-Rushby, J. Inequalities in Purchase of Mosquito Nets and Willingness to Pay for Insecticide-Treated Nets in Nigeria: Challenges for Malaria Control Interventions. Malar. J. 2004, 3, 6. [Google Scholar] [CrossRef] [Green Version]
- Dickinson, K.; Paskewitz, S. Willingness to Pay for Mosquito Control: How Important Is West Nile Virus Risk Compared to the Nuisance of Mosquitoes? Vector-Borne Zoonotic Dis. 2012, 12, 886–892. [Google Scholar] [CrossRef] [Green Version]
- Manfredo, M.J. Who Cares about Wildlife? In Who Cares about Wildlife? Social Science Concepts for Exploring Human-Wildlife Relationships and Conservation Issues; Manfredo, M.J., Ed.; Springer: New York, NY, USA, 2008; pp. 1–27. ISBN 978-0-387-77040-6. [Google Scholar]
- Kretser, H.E.; Curtis, P.D.; Francis, J.D.; Pendall, R.J.; Knuth, B.A. Factors Affecting Perceptions of Human–Wildlife Interactions in Residential Areas of Northern New York and Implications for Conservation. Hum. Dimens. Wildl. 2009, 14, 102–118. [Google Scholar] [CrossRef]
- Brown, J.A.; Larson, K.L.; Lerman, S.B.; Childers, D.L.; Andrade, R.; Bateman, H.L.; Hall, S.J.; Warren, P.S.; York, A.M. Influences of Environmental and Social Factors on Perceived Bio-Cultural Services and Disservices. Front. Ecol. Evol. 2020, 8. [Google Scholar] [CrossRef]
- Foley, E.W.; Morreale, R.L.; Hoel, D.F.; Lloyd, A.M. Area-Wide Mosquito Management in Lee County, Florida, USA. In Area-Wide Integrated Pest Management; CRC Press: Boca Raton, FL, USA, 2020; ISBN 978-1-00-316923-9. [Google Scholar]
- Trimble, M. Arizoniana: Stories from Old Arizona; Golden West Publishers: Phoenix, AZ, USA, 2002. [Google Scholar]
- Kane, K.; York, A.M. Prices, Policies, and Place: What Drives Greenfield Development? Land Use Policy 2017, 68, 415–428. [Google Scholar] [CrossRef]
- Larson, K.L.; Gustafson, A.; Hirt, P. Insatiable Thirst and a Finite Supply: An Assessment of Municipal Water-Conservation Policy in Greater Phoenix, Arizona, 1980–2007. J. Policy Hist. 2009, 21, 107–137. [Google Scholar] [CrossRef] [Green Version]
- Larson, E.K.; Grimm, N.B. Small-Scale and Extensive Hydrogeomorphic Modification and Water Redistribution in a Desert City and Implications for Regional Nitrogen Removal. Urban. Ecosyst. 2012, 15, 71–85. [Google Scholar] [CrossRef]
- Martin, C.A. Landscape Water Use in Phoenix, Arizona. In CALS Publications Archive; The University of Arizona: Tucson, AZ, USA, 2015. [Google Scholar]
- Childers, D.L.; Bois, P.; Hartnett, H.E.; McPhearson, T.; Metson, G.S.; Sanchez, C.A. Urban Ecological Infrastructure: An Inclusive Concept for the Non-Built Urban Environment. Elem. Sci. Anthr. 2019, 7, 46. [Google Scholar] [CrossRef] [Green Version]
- Shaw, I.G.R.; Robbins, P.F.; Jones, J.P. A Bug’s Life and the Spatial Ontologies of Mosquito Management. Ann. Assoc. Am. Geogr. 2010, 100, 373–392. [Google Scholar] [CrossRef]
- Kunzweiler, C. West Nile Virus in Maricopa County, Arizona: Investigating Human, Vector, and Environmental Interactions; Arizona State University: Tucson, AZ, USA, 2013. [Google Scholar]
- Hemme, R.R.; Thomas, C.L.; Chadee, D.D.; Severson, D.W. Influence of Urban Landscapes on Population Dynamics in a Short-Distance Migrant Mosquito: Evidence for the Dengue Vector Aedes Aegypti. PLoS Negl. Trop. Dis. 2010, 4, e634. [Google Scholar] [CrossRef] [Green Version]
- Tsuda, Y.; Komagata, O.; Kasai, S.; Hayashi, T.; Nihei, N.; Saito, K.; Mizutani, M.; Kunida, M.; Yoshida, M.; Kobayashi, M. A Mark–Release–Recapture Study on Dispersal and Flight Distance of Culex Pipiens Pallens in an Urban Area of Japan. Moco 2008, 24, 339–343. [Google Scholar] [CrossRef]
- Larson, K.; York, A.; Andrade, R.; Wittlinger, S. Phoenix Area Social Survey (PASS): 2017; Arizona State University: Tucson, AZ, USA, 2020. [Google Scholar]
- Verdonschot, P.F.M.; Besse-Lototskaya, A.A. Flight Distance of Mosquitoes (Culicidae): A Metadata Analysis to Support the Management of Barrier Zones around Rewetted and Newly Constructed Wetlands. Limnologica 2014, 45, 69–79. [Google Scholar] [CrossRef]
- Brown, J.; Larson, K.; Lerman, S.; Childers, D.; Andrade, R.; Bateman, H.; Hall, S.; Warren, P.; York, A. Urban Ecological Infrastructure (UEI) in the Greater Phoenix, Arizona Metropolitan Area and Surrounding Sonoran Desert Region (2010–2017); Arizona State University: Tucson, AZ, USA, 2021. [Google Scholar]
- Zhang, Y.; Li, X. Land Cover Classifications of CAP LTER Study Area at Five-Year Intervals; Central Arizona–Phoenix Long-Term Ecological Research, Arizona State University: Tucson, AZ, USA, 2017. [Google Scholar]
- Yang, L.; Jin, S.; Danielson, P.; Homer, C.; Gass, L.; Bender, S.M.; Case, A.; Costello, C.; Dewitz, J.; Fry, J.; et al. A New Generation of the United States National Land Cover Database: Requirements, Research Priorities, Design, and Implementation Strategies. ISPRS J. Photogramm. Remote Sens. 2018, 146, 108–123. [Google Scholar] [CrossRef]
- Smith, J.P.; Li, X.; Turner, B.L. Lots for Greening: Identification of Metropolitan Vacant Land and Its Potential Use for Cooling and Agriculture in Phoenix, AZ, USA. Appl. Geogr. 2017, 85, 139–151. [Google Scholar] [CrossRef]
- Matthys, B.; N’Goran, E.K.; Koné, M.; Koudou, B.G.; Vounatsou, P.; Cissé, G.; Tschannen, A.B.; Tanner, M.; Utzinger, J. Urban Agricultural Land Use and Characterization of Mosquito Larval Habitats in a Medium-Sized Town of Côte d’Ivoire. J. Vector Ecol. 2006, 31, 319–333. [Google Scholar] [CrossRef]
- Yadav, P.; Foster, W.A.; Mitsch, W.J.; Grewal, P.S. Factors Affecting Mosquito Populations in Created Wetlands in Urban Landscapes. Urban Ecosyst. 2012, 15, 499–511. [Google Scholar] [CrossRef]
- Smith, V.K.; Larson, K.L.; York, A. Using Quality Signaling to Enhance Survey Response Rates. Appl. Econ. Lett. 2020, 27, 951–954. [Google Scholar] [CrossRef]
- Murdock, C.C.; Evans, M.V.; McClanahan, T.D.; Miazgowicz, K.L.; Tesla, B. Fine-Scale Variation in Microclimate across an Urban Landscape Shapes Variation in Mosquito Population Dynamics and the Potential of Aedes Albopictus to Transmit Arboviral Disease. PLoS Negl. Trop. Dis. 2017, 11, e0005640. [Google Scholar] [CrossRef] [PubMed] [Green Version]
- Slovic, P. The Feeling of Risk: New Perspectives on Risk Perception; Routledge: London, UK, 2010; ISBN 978-1-84971-149-4. [Google Scholar]
- Wai, K.T. Gender, Mosquitos and Malaria: Implications for Community Development Programs in Laputta, Myanmar. Southeast. Asian J. Trop. Med. Public Health 2001, 32, 588–894. [Google Scholar]
- Sreetheran, M.; van den Bosch, C.C.K. A Socio-Ecological Exploration of Fear of Crime in Urban Green Spaces—A Systematic Review. Urban For. Urban Green. 2014, 13, 1–18. [Google Scholar] [CrossRef]
- Larson, K.L.; Ibes, D.C.; White, D.D. Gendered Perspectives about Water Risks and Policy Strategies: A Tripartite Conceptual Approach. Environ. Behav. 2011, 43, 415–438. [Google Scholar] [CrossRef]
- Avolio, M.; Blanchette, A.; Sonti, N.F.; Locke, D.H. Time Is Not Money: Income Is More Important Than Lifestage for Explaining Patterns of Residential Yard Plant Community Structure and Diversity in Baltimore. Front. Ecol. Evol. 2020, 8, 85. [Google Scholar] [CrossRef] [Green Version]
- Yasuoka, J.; Mangione, T.W.; Spielman, A.; Levins, R. Impact of Education on Knowledge, Agricultural Practices, and Community Actions for Mosquito Control and Mosquito-Borne Disease Prevention in Rice Ecosystems in Sri Lanka. Am. J. Trop. Med. Hyg. 2006, 74, 1034–1042. [Google Scholar] [CrossRef]
- Reyburn, H.; Mbatia, R.; Drakeley, C.; Bruce, J.; Carneiro, I.; Olomi, R.; Cox, J.; Nkya, W.M.M.M.; Lemnge, M.; Greenwood, B.M.; et al. Association of Transmission Intensity and Age with Clinical Manifestations and Case Fatality of Severe Plasmodium Falciparum Malaria. JAMA 2005, 293, 1461–1470. [Google Scholar] [CrossRef] [Green Version]
- Zielinski-Gutierrez, E.C.; Hayden, M.H. A Model for Defining West Nile Virus Risk Perception Based on Ecology and Proximity. EcoHealth 2006, 3, 28–34. [Google Scholar] [CrossRef]
- McCullagh, P.; Nelder, J.A. Generalized Linear Models, 2nd ed.; Routledge: Boca Raton, FL, USA, 2019; ISBN 978-0-203-75373-6. [Google Scholar]
- Hastie, T.; Tibshirani, R. Varying-Coefficient Models. J. R. Stat. Soc. Ser. B 1993, 55, 757–779. [Google Scholar] [CrossRef]
- Elith, J.; Leathwick, J.R.; Hastie, T. A Working Guide to Boosted Regression Trees. J. Anim. Ecol. 2008, 77, 802–813. [Google Scholar] [CrossRef]
- De’ath, G. Boosted Trees for Ecological Modeling and Prediction. Ecology 2007, 88, 243–251. [Google Scholar] [CrossRef]
- Breiman, L. Random Forests. Mach. Learn. 2001, 45, 5–32. [Google Scholar] [CrossRef] [Green Version]
- Greenwell, B.; Boehmke, B.; Cunningham, J. Package “Gmb”. Available online: https://cran.r-project.org/web/packages/gbm/gbm.pdf (accessed on 1 May 2021).
- Shwartz, A.; Turbé, A.; Simon, L.; Julliard, R. Enhancing Urban Biodiversity and Its Influence on City-Dwellers: An Experiment. Biol. Conserv. 2014, 171, 82–90. [Google Scholar] [CrossRef]
- Pett, T.J.; Shwartz, A.; Irvine, K.N.; Dallimer, M.; Davies, Z.G. Unpacking the People–Biodiversity Paradox: A Conceptual Framework. BioScience 2016, 66, 576–583. [Google Scholar] [CrossRef] [Green Version]
- Slovic, P. Perception of Risk. Science 1987, 236, 280–285. [Google Scholar] [CrossRef]
- Brown, H.; Diuk-Wasser, M.; Andreadis, T.; Fish, D. Remotely-Sensed Vegetation Indices Identify Mosquito Clusters of West Nile Virus Vectors in an Urban Landscape in the Northeastern United States. Vector-Borne Zoonotic Dis. 2008, 8, 197–206. [Google Scholar] [CrossRef] [PubMed] [Green Version]
- Yang, L.; Turo, K.J.; Riley, C.B.; Inocente, E.A.; Tian, J.; Hoekstra, N.C.; Piermarini, P.M.; Gardiner, M.M. Can Urban Greening Increase Vector Abundance in Cities? The Impact of Mowing, Local Vegetation, and Landscape Composition on Adult Mosquito Populations. Urban Ecosyst. 2019, 22, 827–839. [Google Scholar] [CrossRef]
- Elwell, T.L.; Gelcich, S.; Gaines, S.D.; López-Carr, D. Using People’s Perceptions of Ecosystem Services to Guide Modeling and Management Efforts. Sci. Total Environ. 2018, 637–638, 1014–1025. [Google Scholar] [CrossRef] [Green Version]
- Lincoln, N.K.; Ardoin, N.M. Cultivating Values: Environmental Values and Sense of Place as Correlates of Sustainable Agricultural Practices. Agric. Hum. Values 2016, 33, 389–401. [Google Scholar] [CrossRef]
- Cottet, M.; Piégay, H.; Bornette, G. Does Human Perception of Wetland Aesthetics and Healthiness Relate to Ecological Functioning? J. Environ. Manag. 2013, 128, 1012–1022. [Google Scholar] [CrossRef]
- Thomson, J.S.; Kelvin, R.E. Suburbanites’ Perceptions About Agriculture: The Challenge for Media. J. Appl. Commun. 1996, 80, 1339. [Google Scholar] [CrossRef] [Green Version]
- Gouge, D.H.; Li, S.; Walker, K.; Sumner, C.; Nair, S.; Olson, C. Mosquitoes: Biology and Integrated Mosquito Management. In CALS Publications Archive; The University of Arizona: Tucson, AZ, USA, 2016. [Google Scholar]
- Hayden, M.H.; Uejio, C.K.; Walker, K.; Ramberg, F.; Moreno, R.; Rosales, C.; Gameros, M.; Mearns, L.O.; Zielinski-Gutierrez, E.; Janes, C.R. Microclimate and Human Factors in the Divergent Ecology of Aedes Aegypti along the Arizona, U.S./Sonora, MX Border. EcoHealth 2010, 7, 64–77. [Google Scholar] [CrossRef]
- Chapter 37 Water. Article 1. In General. Sec. 37-27. Waste of Water; Failure of Consumer to Make Repairs to Pipes, Valves, and Fixtures; Municipal Codes of Ordinance: Phoenix, AZ, USA, 2016.
- Bateman, H.L.; Brown, J.A.; Larson, K.L.; Andrade, R.; Hughes, B. Unwanted Residential Wildlife: Evaluating Social-Ecological Patterns for Snake Removals. Glob. Ecol. Conserv. 2021, 27, e01601. [Google Scholar] [CrossRef]
- McKenzie, E. Homeowner Associations and California Politics: An Exploratory Analysis. Urban Aff. Rev. 1998, 34, 52–75. [Google Scholar] [CrossRef]
- Read, N.R.; Rookert, J.R. Public Perception of MOsquito Annoyance Measured by a Survey and Simultaneous Mosquito Sampling. J. Am. Mosq. Control Assoc. 1994, 10, 79–87. [Google Scholar]
- Goerres, A. Why Are Older People More Likely to Vote? The Impact of Ageing on Electoral Turnout in Europe. Br. J. Polit. Int. Relat. 2007, 9, 90–121. [Google Scholar] [CrossRef] [Green Version]
- Godbey, G.; Blazey, M. Old People in Urban Parks: An Exploratory Investigation. J. Leis. Res. 1983, 15, 229–244. [Google Scholar] [CrossRef]
- Sheridan, S.C. A Survey of Public Perception and Response to Heat Warnings across Four North American Cities: An Evaluation of Municipal Effectiveness. Int J. Biometeorol. 2007, 52, 3–15. [Google Scholar] [CrossRef] [PubMed]
- Hondula, D.M.; Davis, R.E.; Leisten, M.J.; Saha, M.V.; Veazey, L.M.; Wegner, C.R. Fine-Scale Spatial Variability of Heat-Related Mortality in Philadelphia County, USA, from 1983–2008: A Case-Series Analysis. Environ. Health 2012, 11, 16. [Google Scholar] [CrossRef] [PubMed] [Green Version]
- Dike, N.; Onwujekwe, O.; Ojukwu, J.; Ikeme, A.; Uzochukwu, B.; Shu, E. Influence of Education and Knowledge on Perceptions and Practices to Control Malaria in Southeast Niger. Soc. Sci. Med. 2006, 63, 103–106. [Google Scholar] [CrossRef]
- Patel, A.; Rathod, H.; Shah, P.; Garsondiya, J.; Sharma, R. Perceptions Regarding Mosquito Borne Diseases in an Urban Area of Rajkot City. Natl. J. Med. Res. 2011, 1, 45–47. [Google Scholar]
- Morse, W.; Izenour, K.; McKenzie, B.; Lessard, S.; Zohdy, S. Perceptions and Practices of Mosquito-Borne Diseases in Alabama–Is Concern Where It Should Be? BMC Public Health 2019, 19, 987. [Google Scholar] [CrossRef] [Green Version]
- McGinley, S. This Mosquito Loves Tucson: Monsoon Conditions Support Carrier of Dengue Fever. Univ. Ariz. Univ. Libr. 2001, 1, 1–3. [Google Scholar]
- Leslie, T.E.; Carson, M.; van Coeverden, E.; Klein, K.D.; Braks, M.; Krumeich, A. An Analysis of Community Perceptions of Mosquito-Borne Disease Control and Prevention in Sint Eustatius, Caribbean Netherlands. Glob. Health Action 2017, 10, 1350394. [Google Scholar] [CrossRef] [Green Version]


| Neighborhood | Total Number of Unique Traps | Total Number of Respondents | Average Number of Traps within 1 km or Respondent (SD) | Average Number of Mosquitoes within 1 km of Respondents (SD) |
|---|---|---|---|---|
| 711 | 4 | 17 | 3.05 (0.62) | 40.84 (31.12) |
| AA9 | 27 | 26 | 3.77 (1.42) | 44.68 (74.94) |
| IBW | 6 | 37 | 2.38 (0.59) | 35.31 (21.26) |
| PWR | 45 | 60 | 2.66 (1.28) | 381.82 (580.03) |
| Q15 | 8 | 34 | 2.32 (1.22) | 26.21 (26.11) |
| R18 | 9 | 26 | 1.42 (0.50) | 63.71 (48.88) |
| TRS | 13 | 26 | 1.62 (0.70) | 110.23 (78.44) |
| U18 | 3 | 34 | 1.18 (0.39) | 47.66 (42.13) |
| U21 | 5 | 52 | 1.34 (0.60) | 9.63 (16.07) |
| V14 | 3 | 50 | 1.68 (0.55) | 64.55 (23.53) |
| W15 | 13 | 56 | 8.13 (1.89) | 45.55 (26.67) |
| X17 | 3 | 39 | 2.28 (0.46) | 154.00 (82.10) |
Publisher’s Note: MDPI stays neutral with regard to jurisdictional claims in published maps and institutional affiliations. |
© 2021 by the authors. Licensee MDPI, Basel, Switzerland. This article is an open access article distributed under the terms and conditions of the Creative Commons Attribution (CC BY) license (https://creativecommons.org/licenses/by/4.0/).
Share and Cite
Brown, J.A.; Larson, K.L.; Lerman, S.B.; Cocroft, A.; Hall, S.J. Resident Perceptions of Mosquito Problems Are More Influenced by Landscape Factors than Mosquito Abundance. Sustainability 2021, 13, 11533. https://doi.org/10.3390/su132011533
Brown JA, Larson KL, Lerman SB, Cocroft A, Hall SJ. Resident Perceptions of Mosquito Problems Are More Influenced by Landscape Factors than Mosquito Abundance. Sustainability. 2021; 13(20):11533. https://doi.org/10.3390/su132011533
Chicago/Turabian StyleBrown, Jeffrey A., Kelli L. Larson, Susannah B. Lerman, Alexandreana Cocroft, and Sharon J. Hall. 2021. "Resident Perceptions of Mosquito Problems Are More Influenced by Landscape Factors than Mosquito Abundance" Sustainability 13, no. 20: 11533. https://doi.org/10.3390/su132011533