
Research on Mechanical Behavior and Energy Evolution of Coal and Rocks with Different Thin Spray-On Liners Thickness under Uniaxial Compressive Loading

Abstract
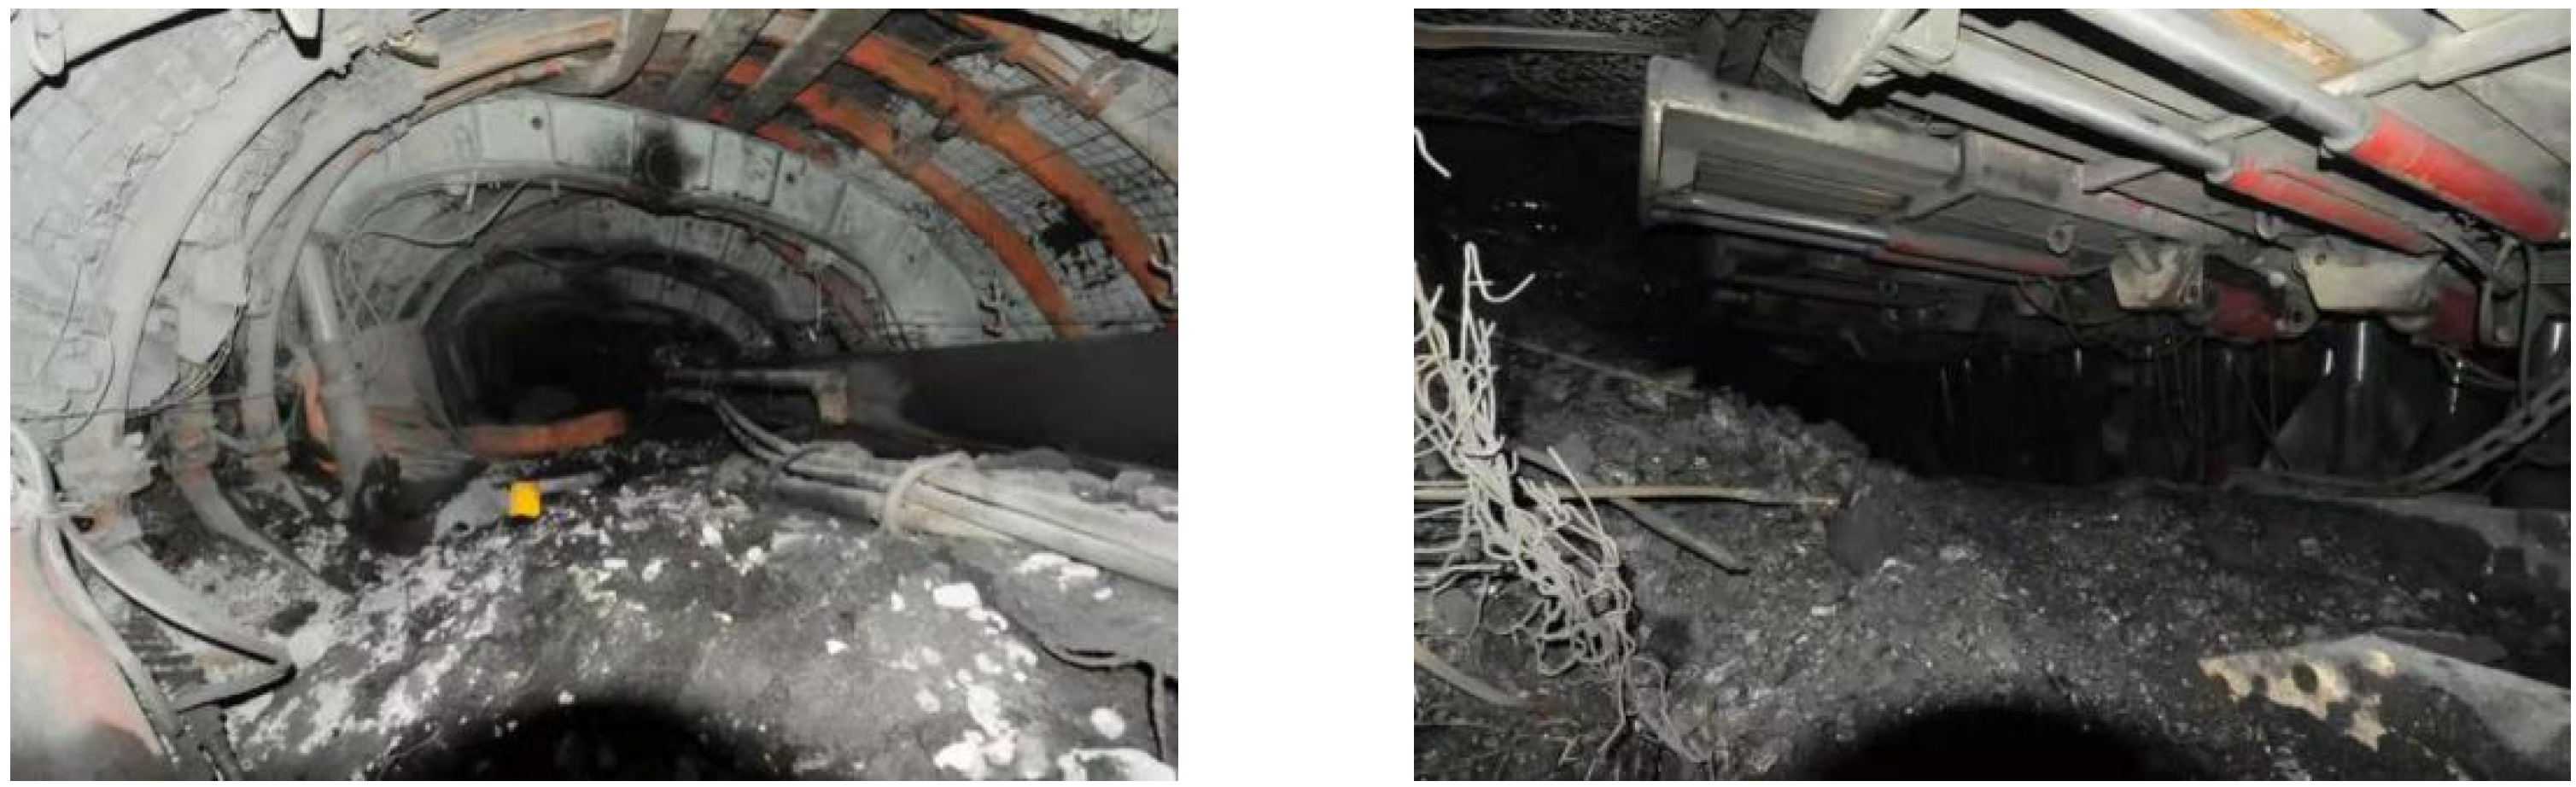
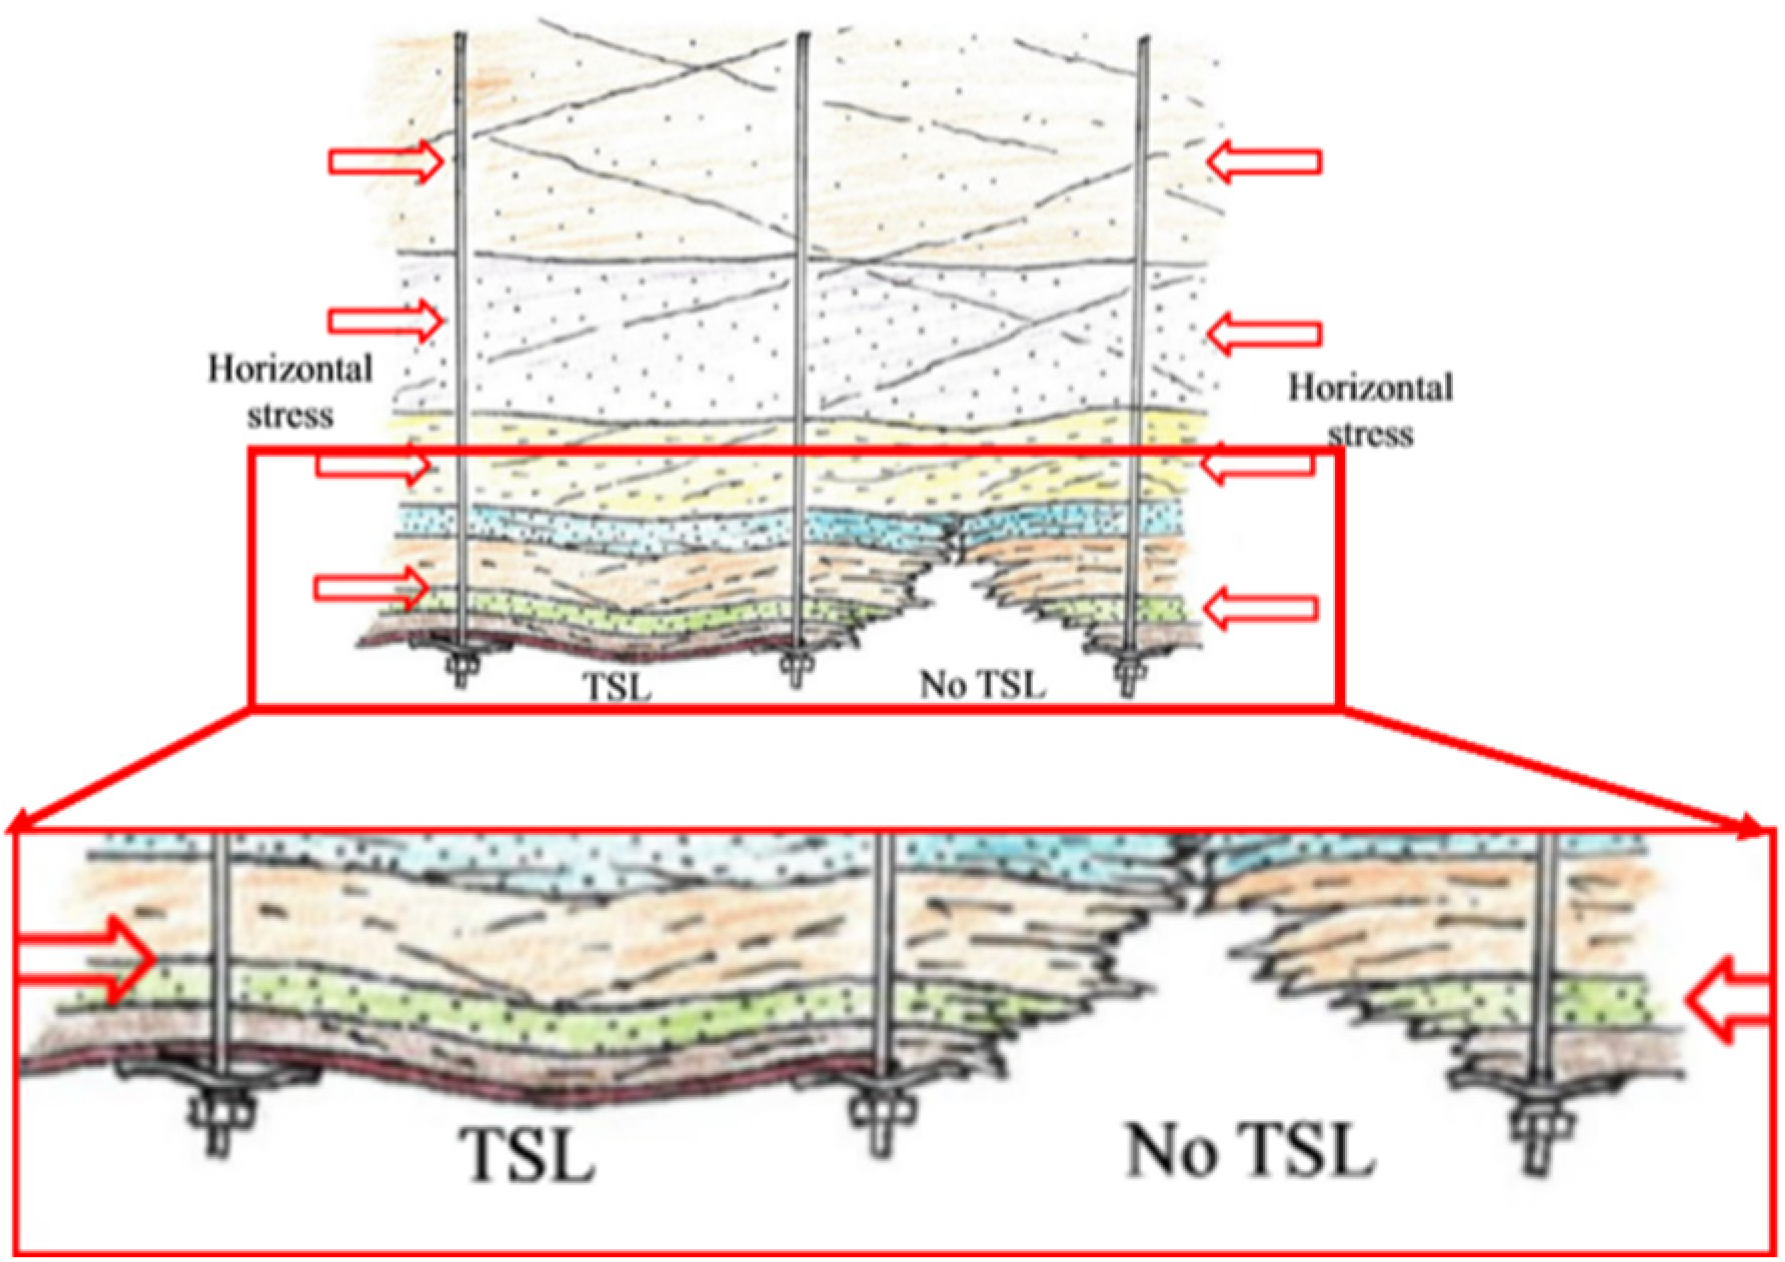
:1. Introduction
2. Mechanical Analysis of TSLs
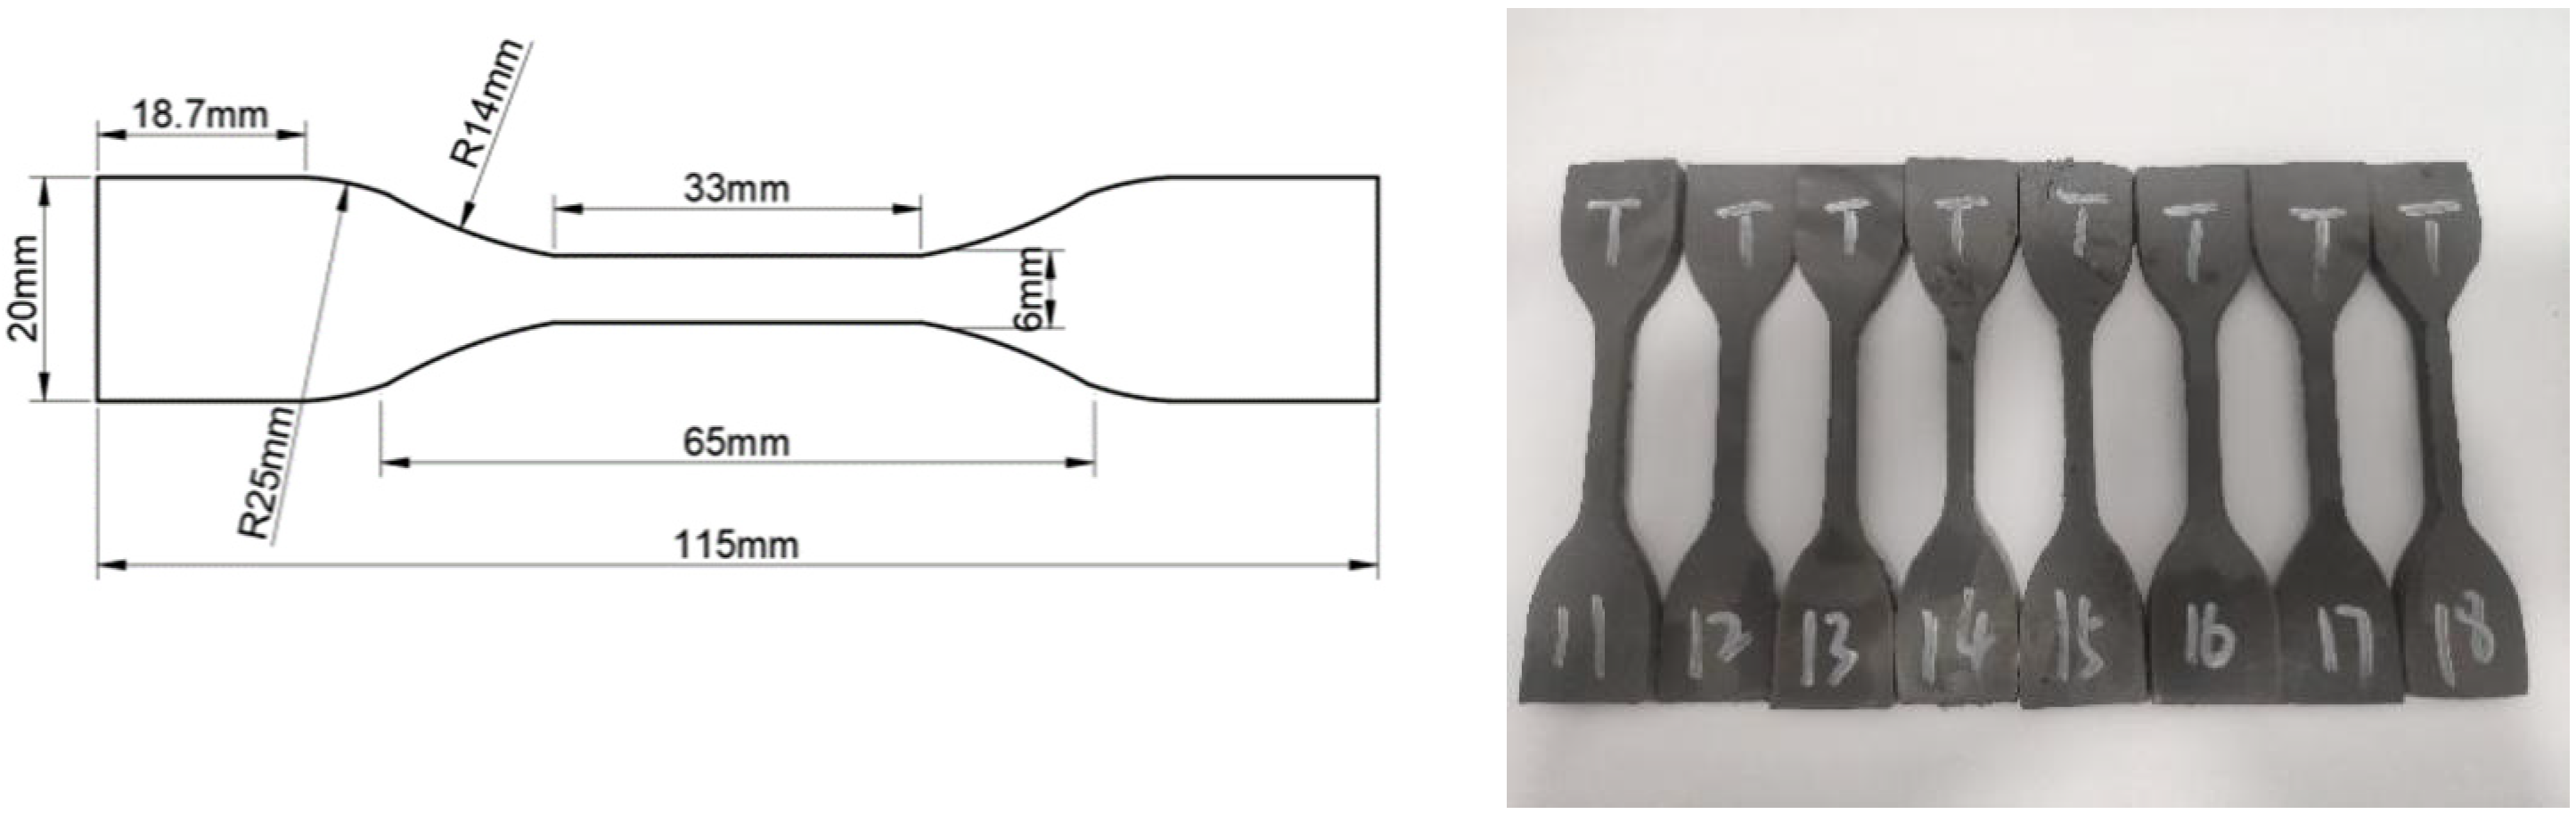
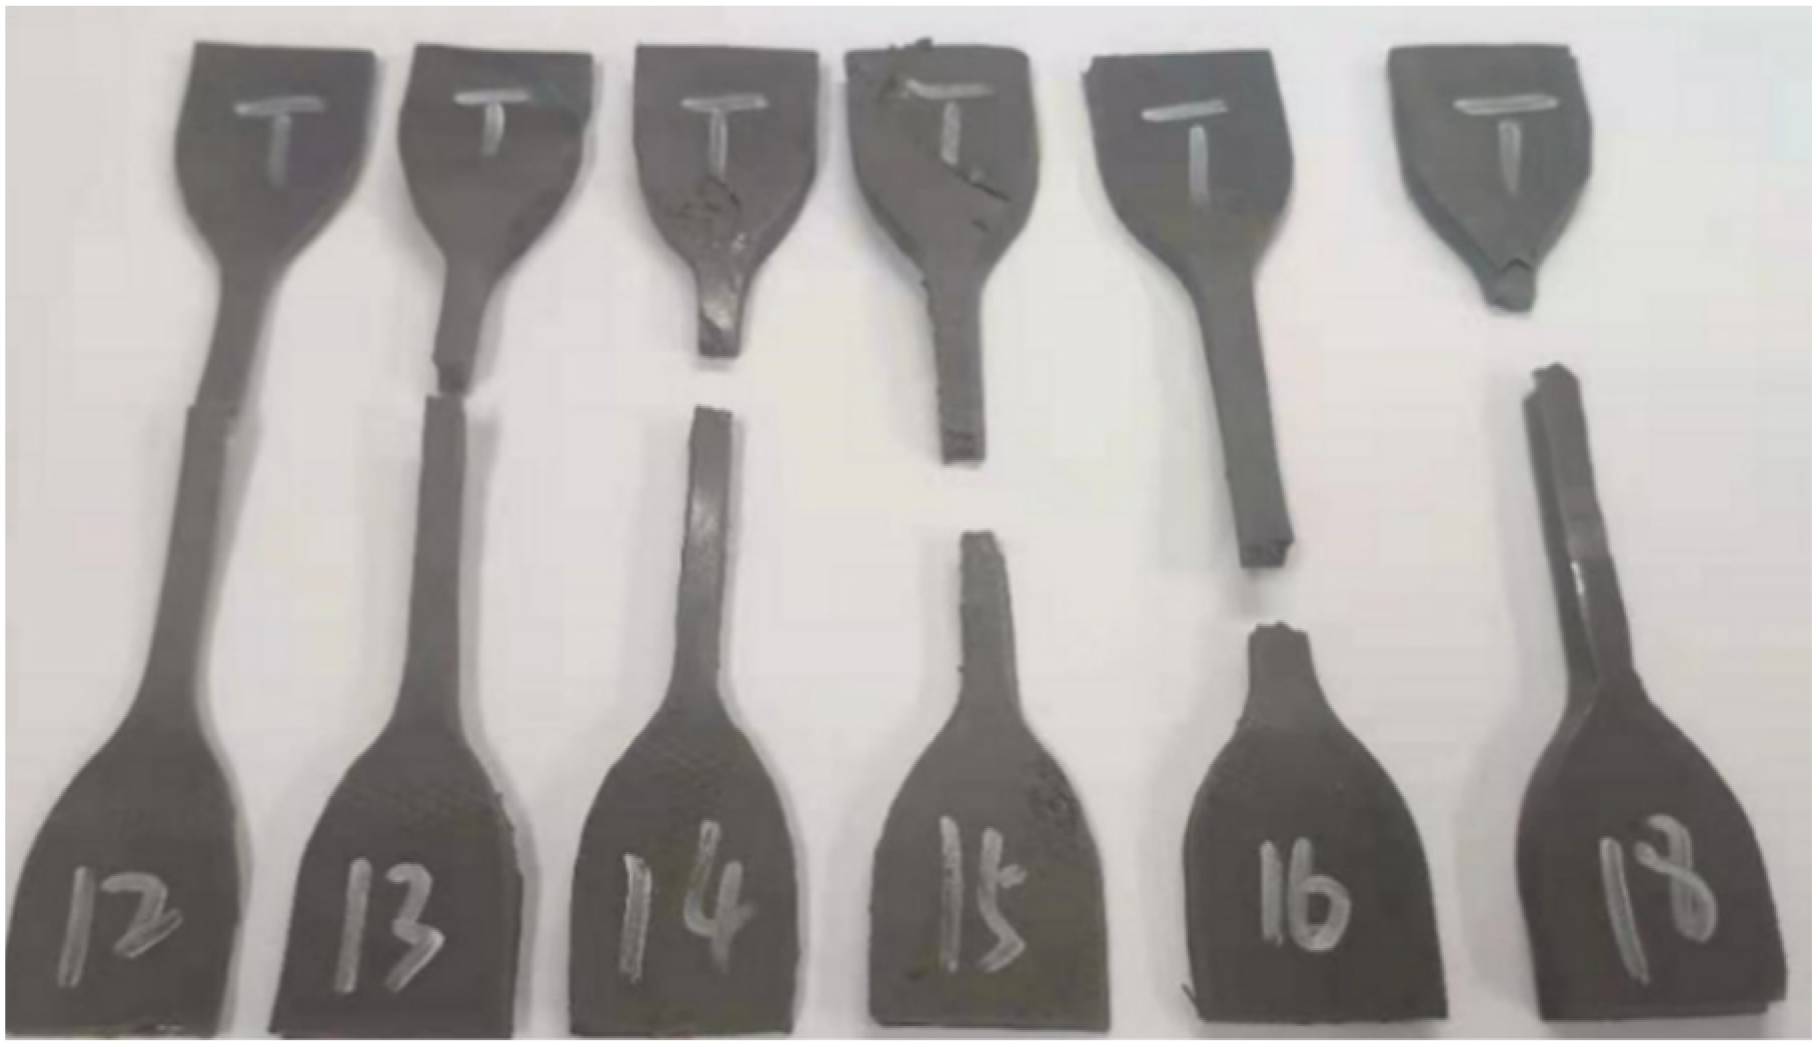
2.1. Preparation and Tensile Testing of the TSLs
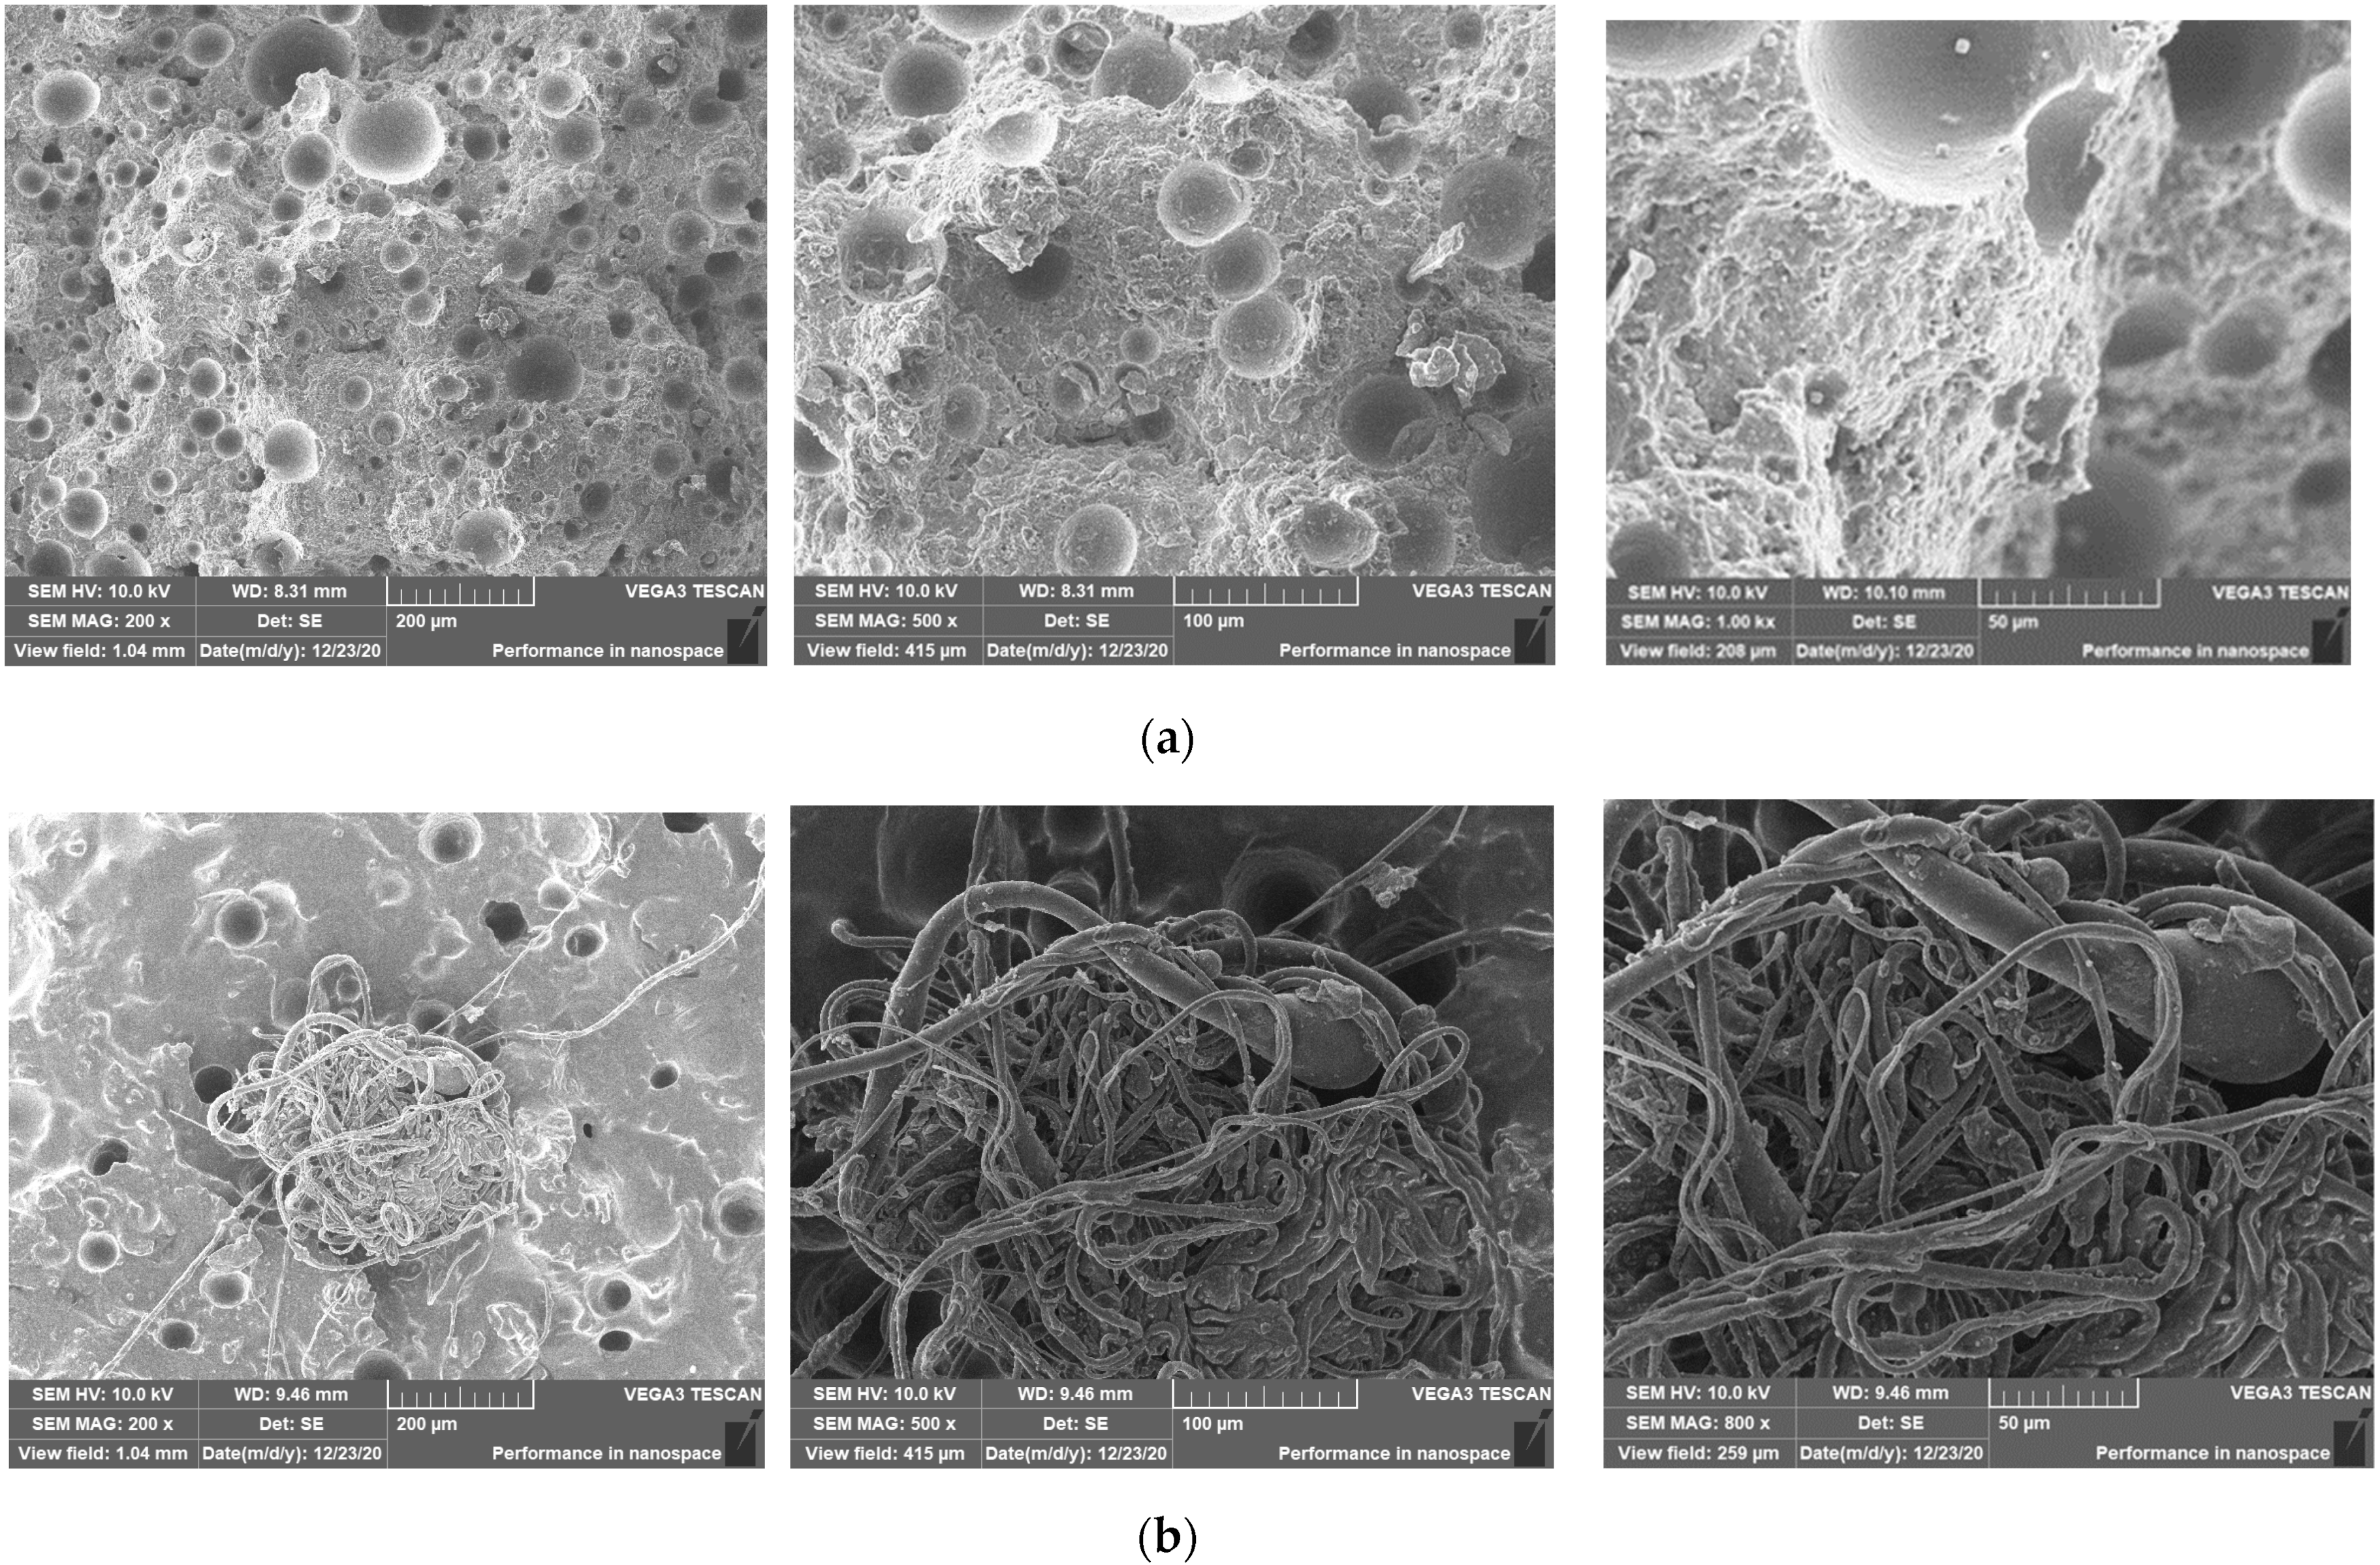
2.2. SEM Analysis of the TSLs
3. Compression Test of the Combination of TSLs and Coal and Rock
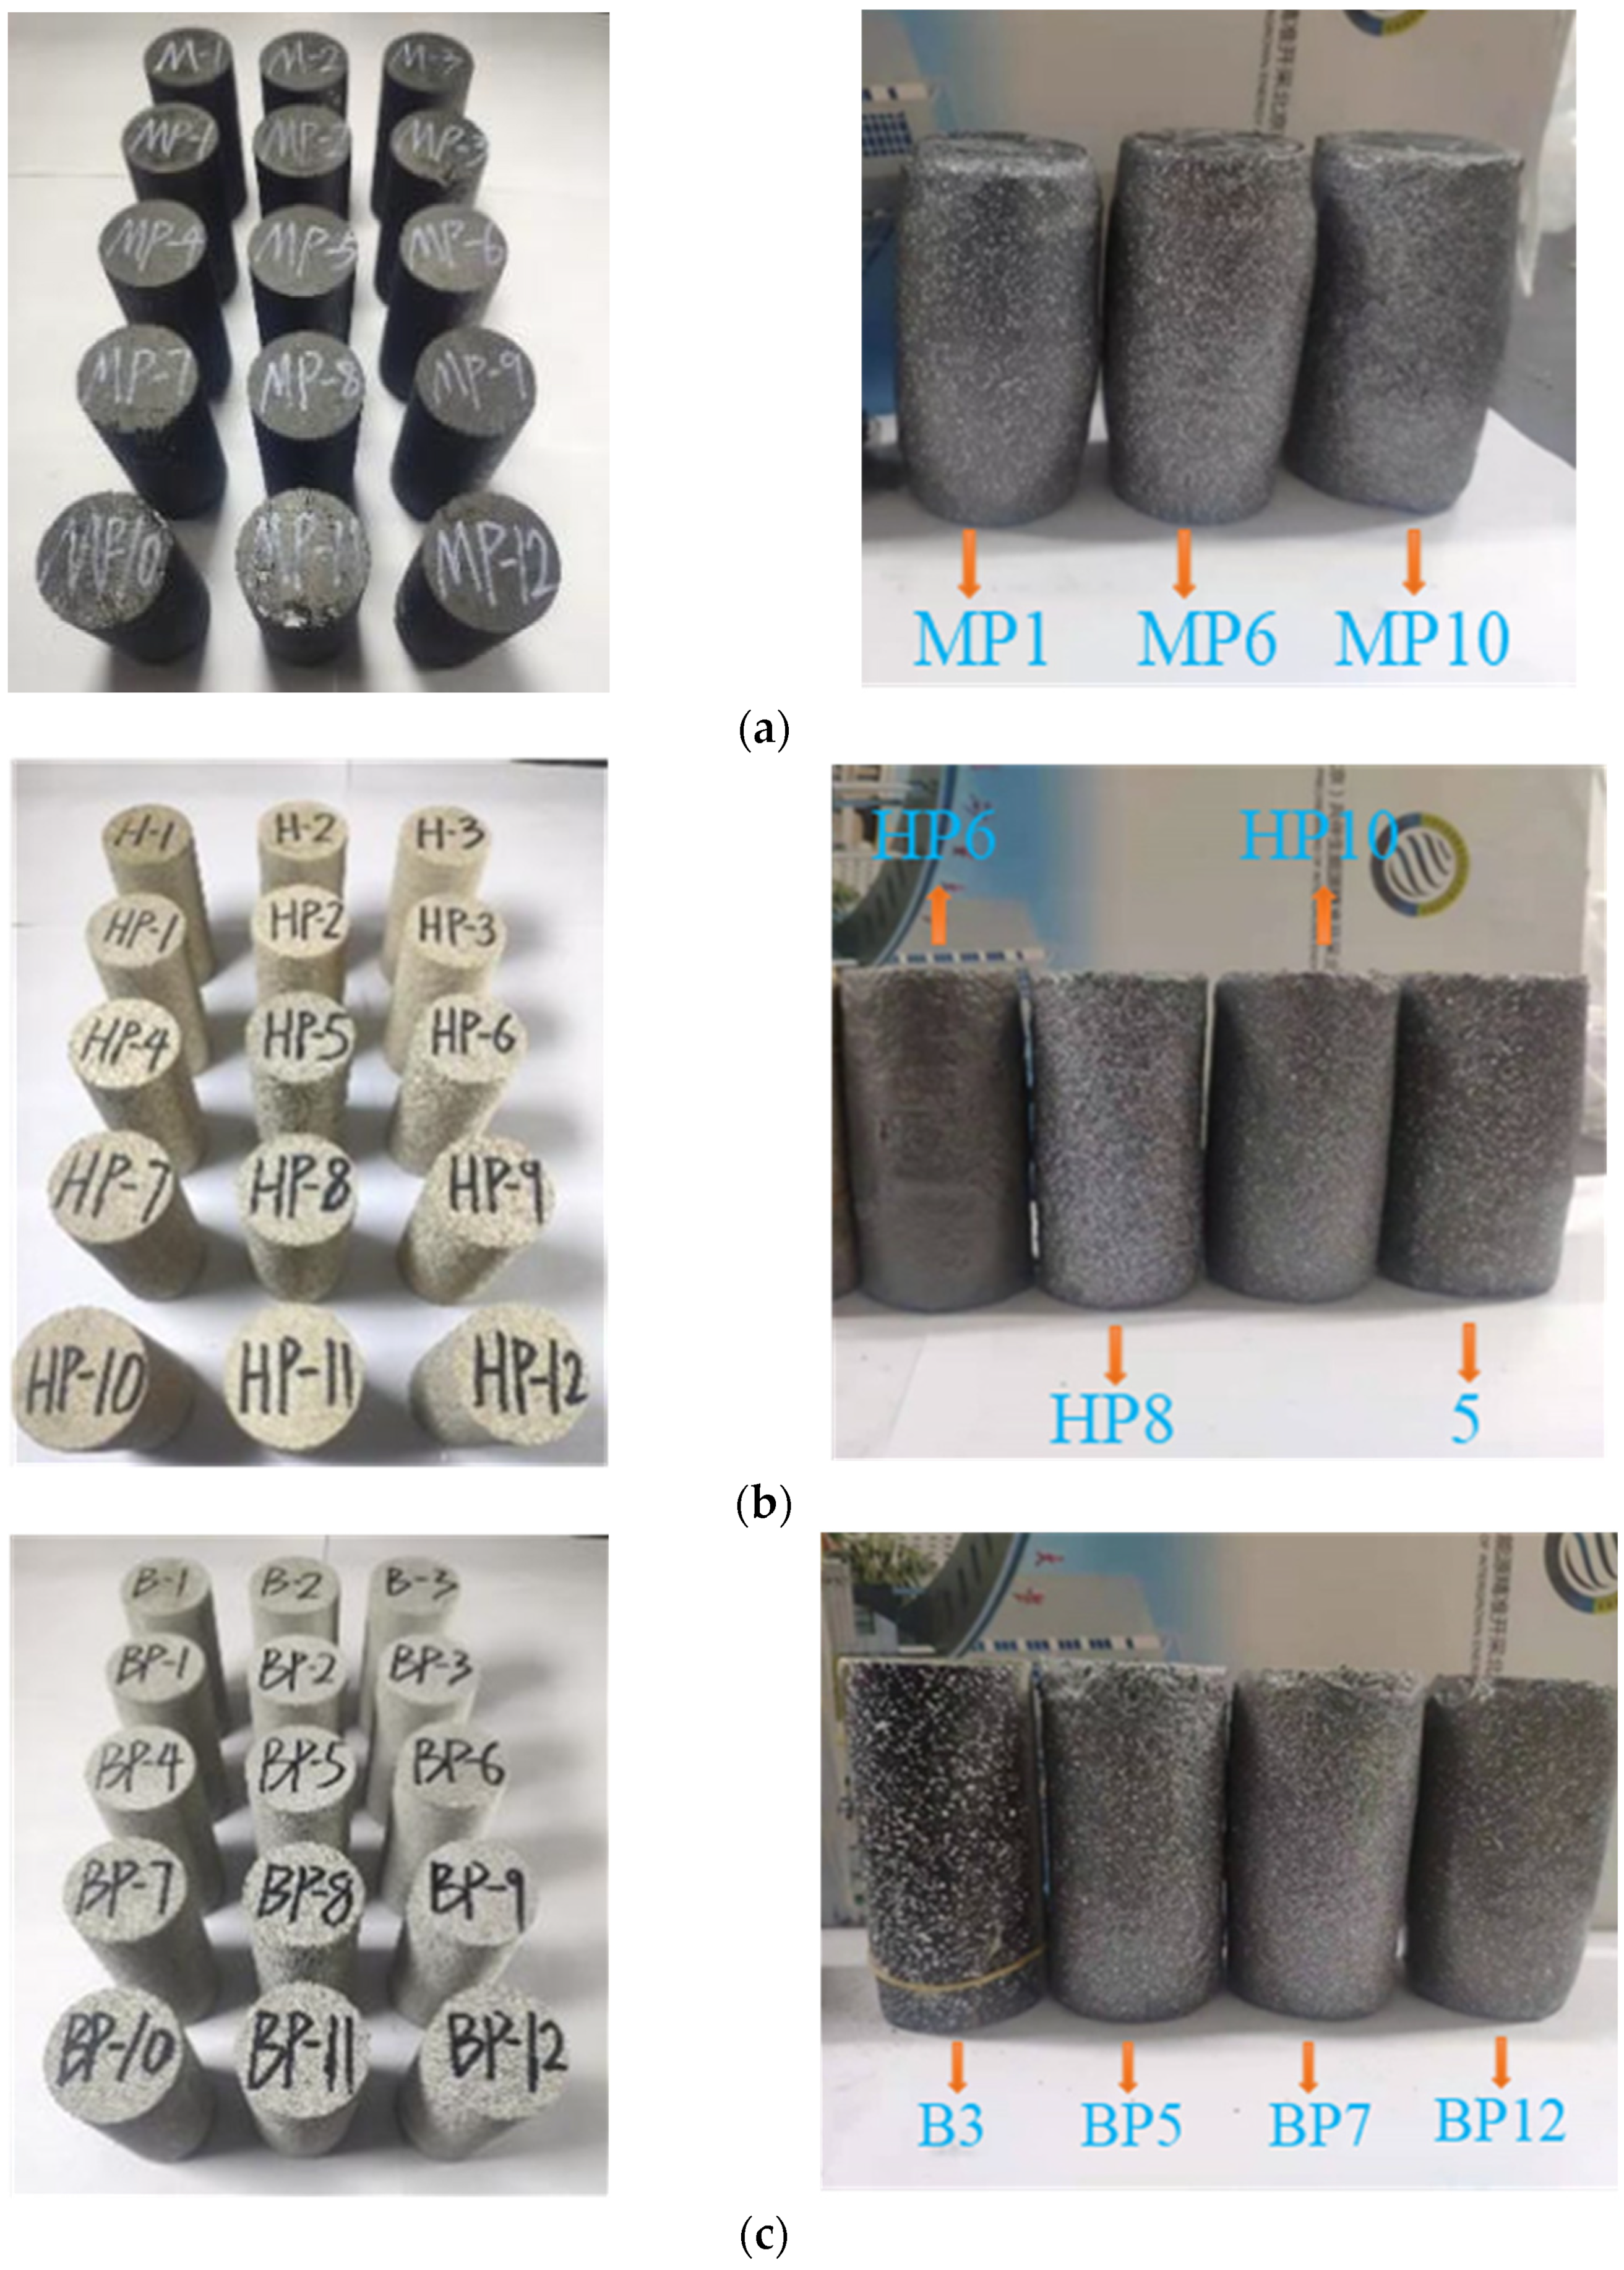
3.1. Preparation of the Combination of TSLs and Coal-Rock
3.2. Primary Parameter Analysis
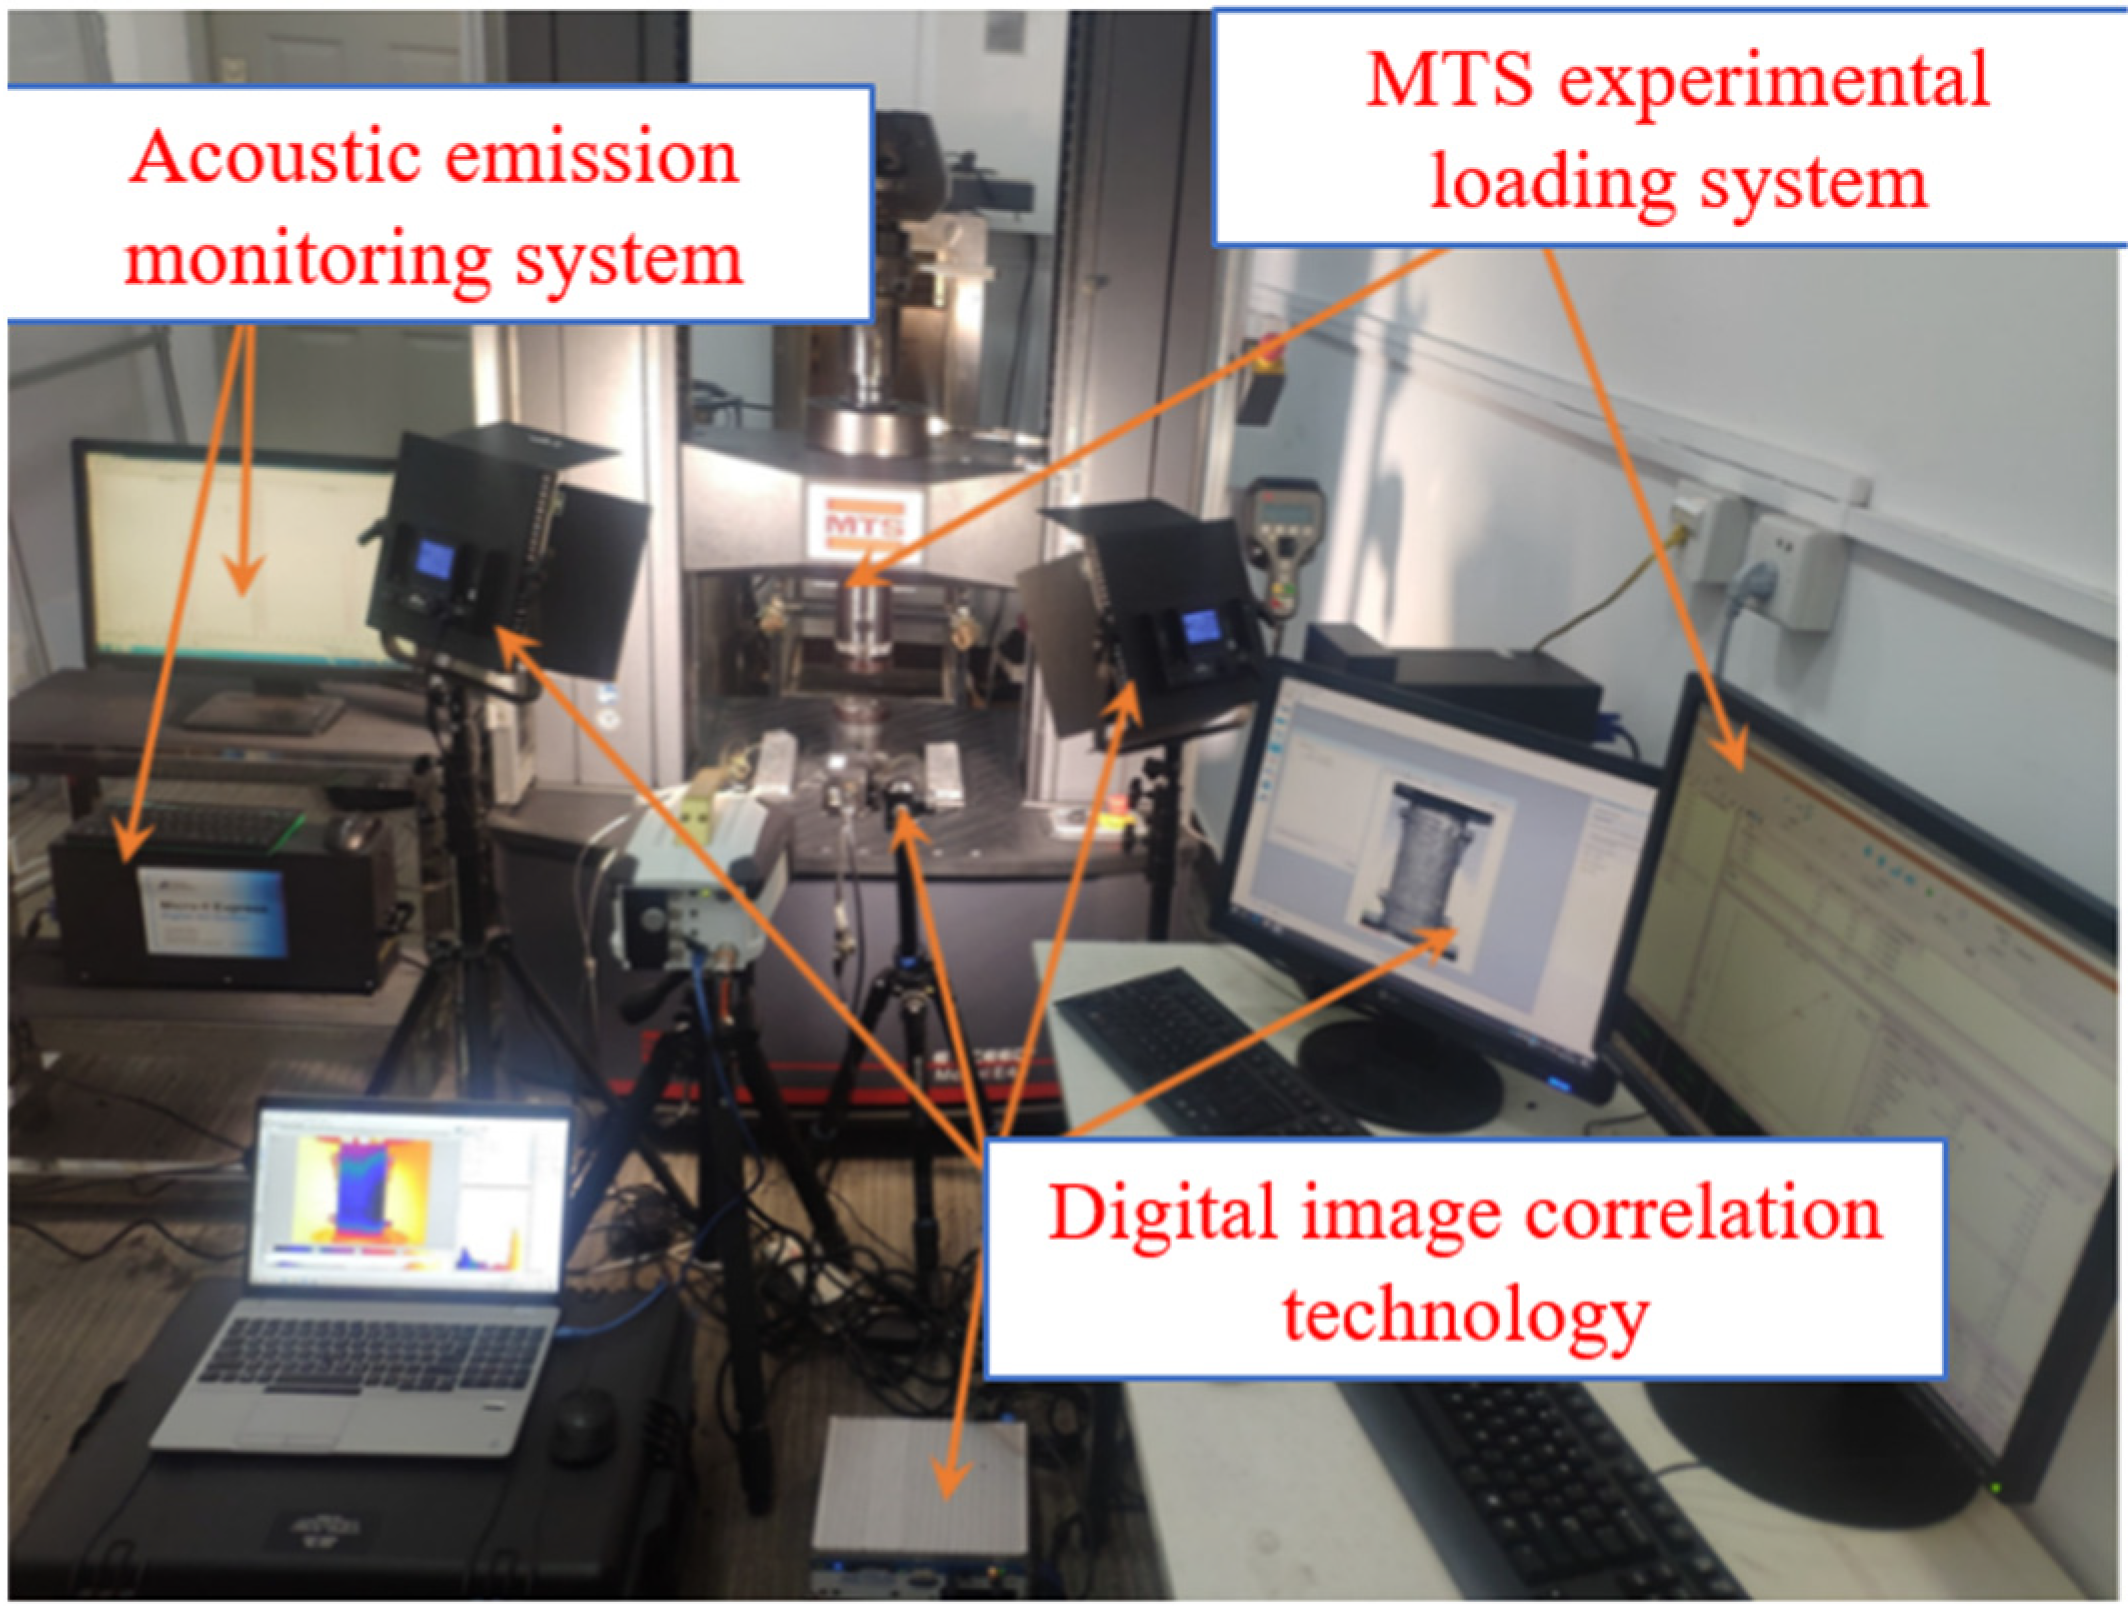
3.3. Loading System
4. Compression Test Results and Analysis
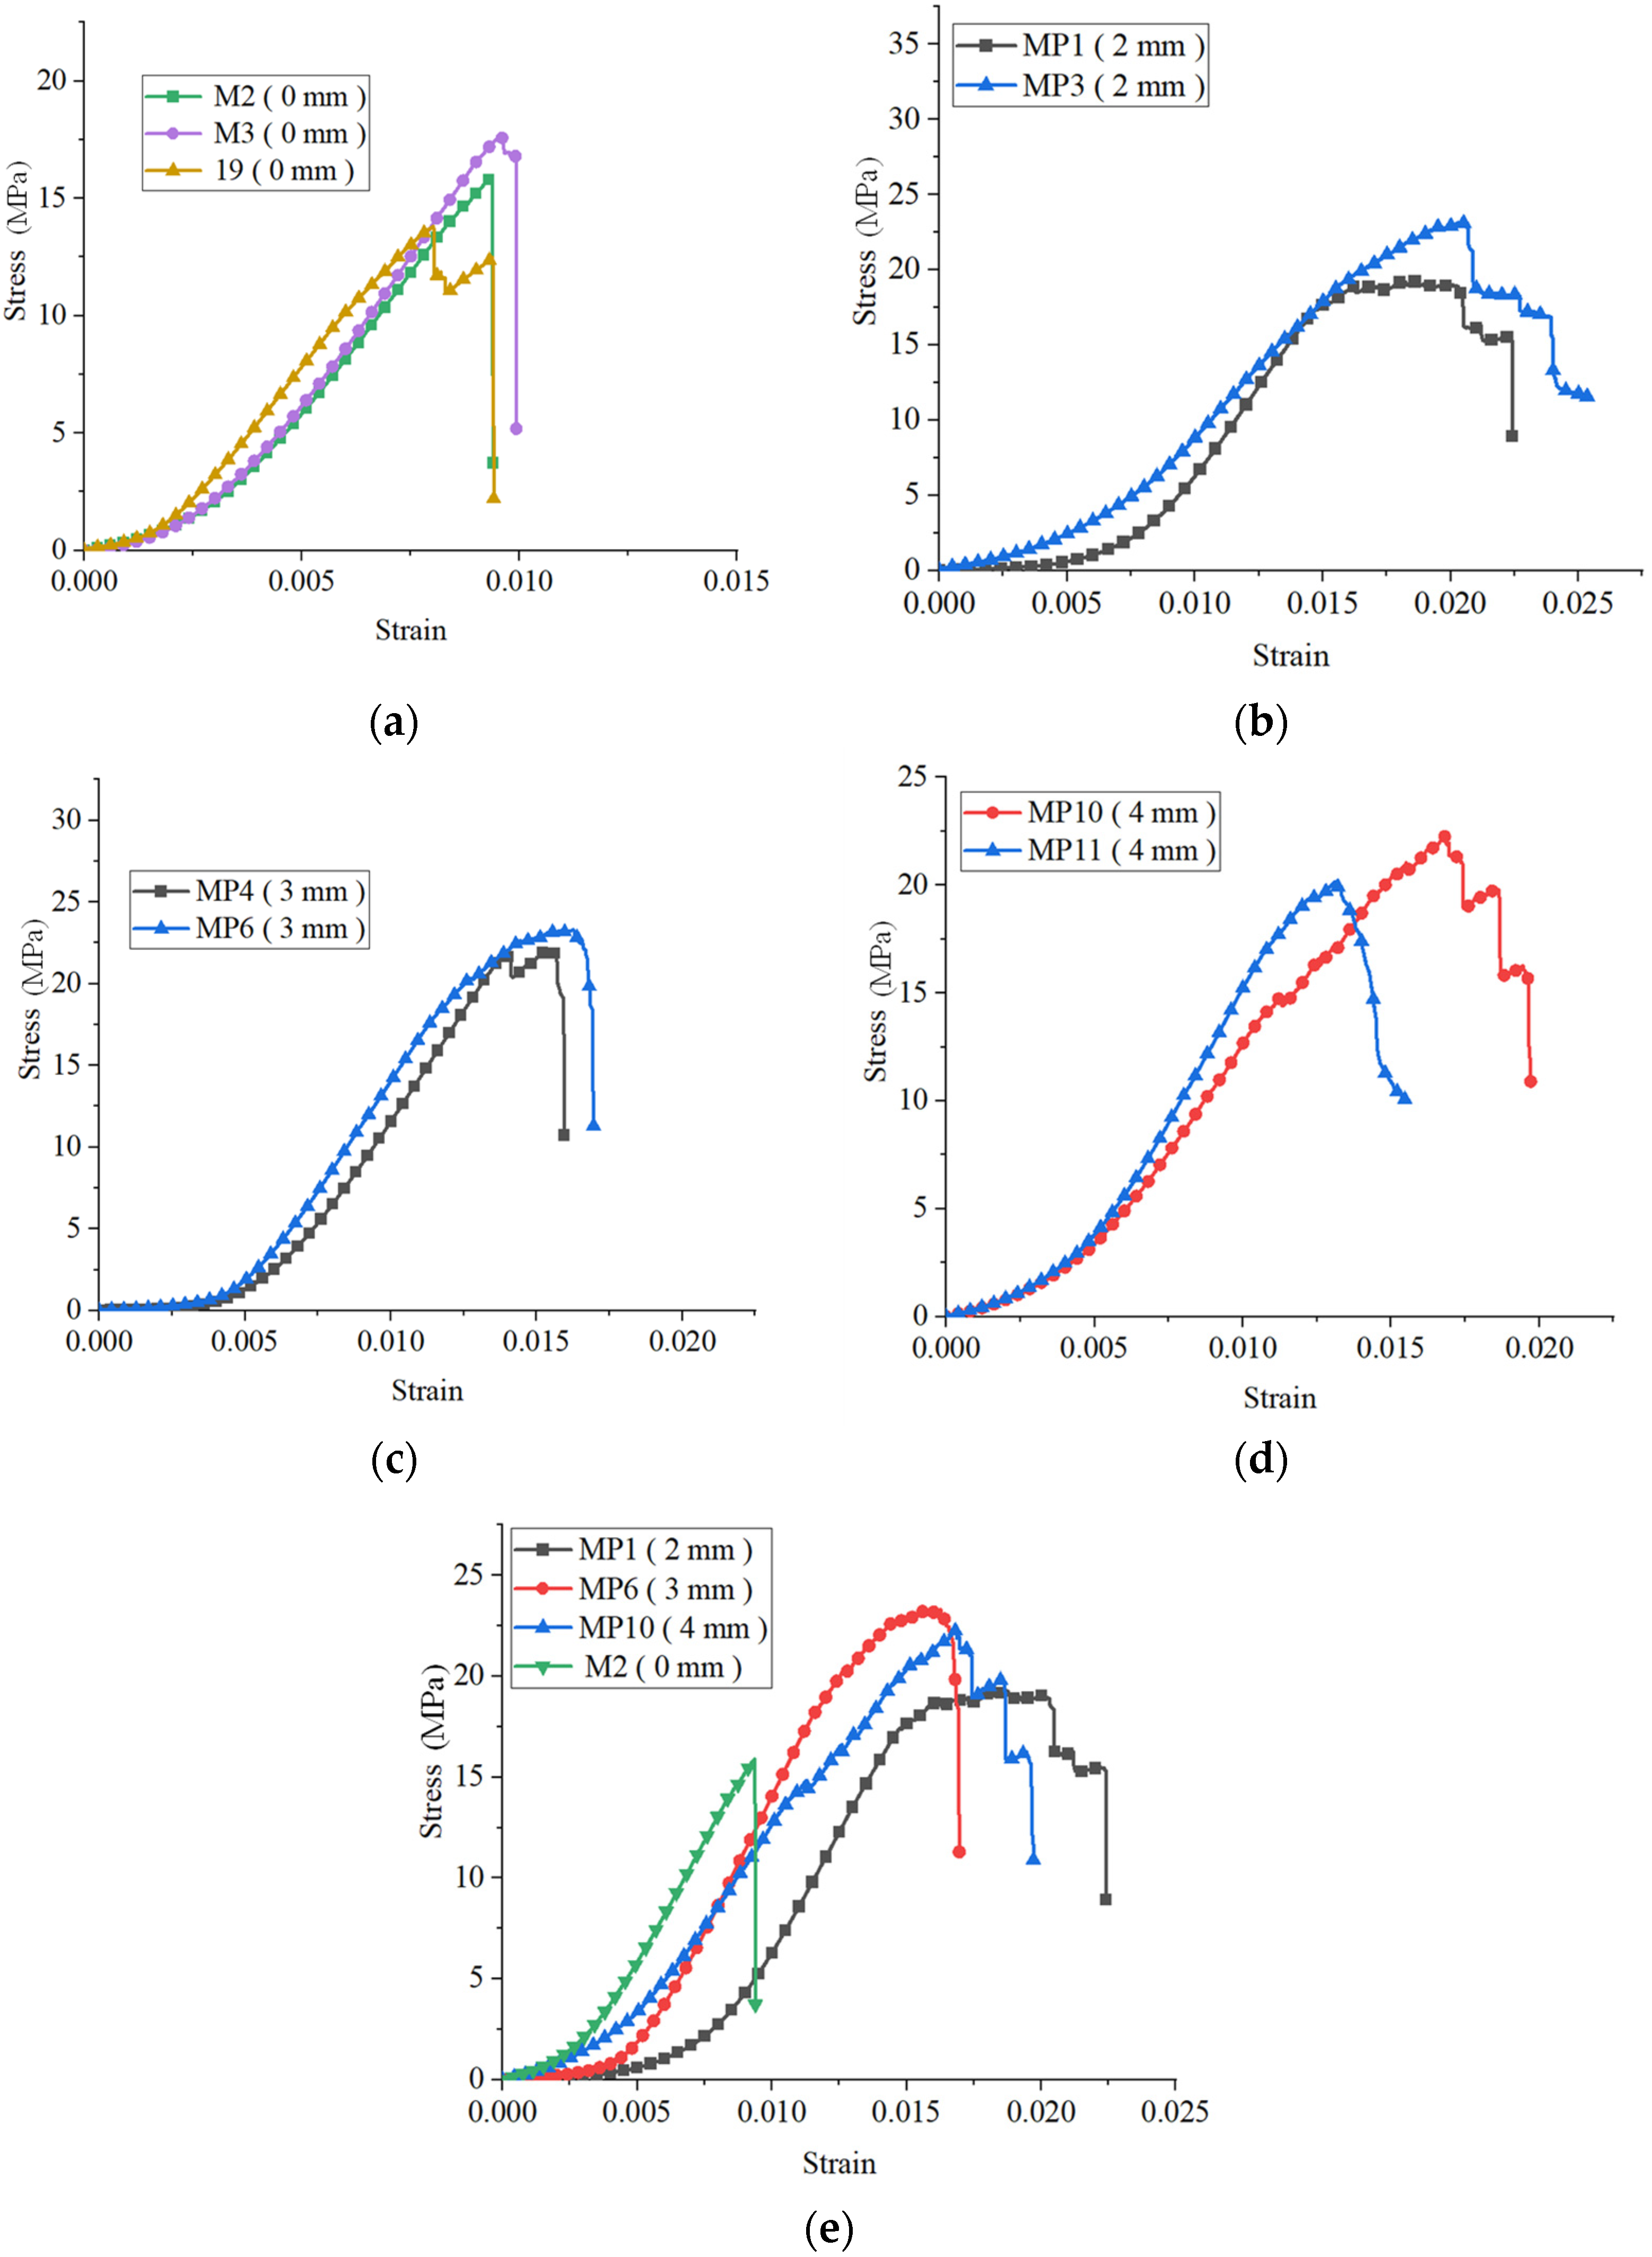
4.1. Analysis of Compressive Mechanical Properties of Specimens
- Mechanical behavior of coal specimen coated with TSL.
- 2.
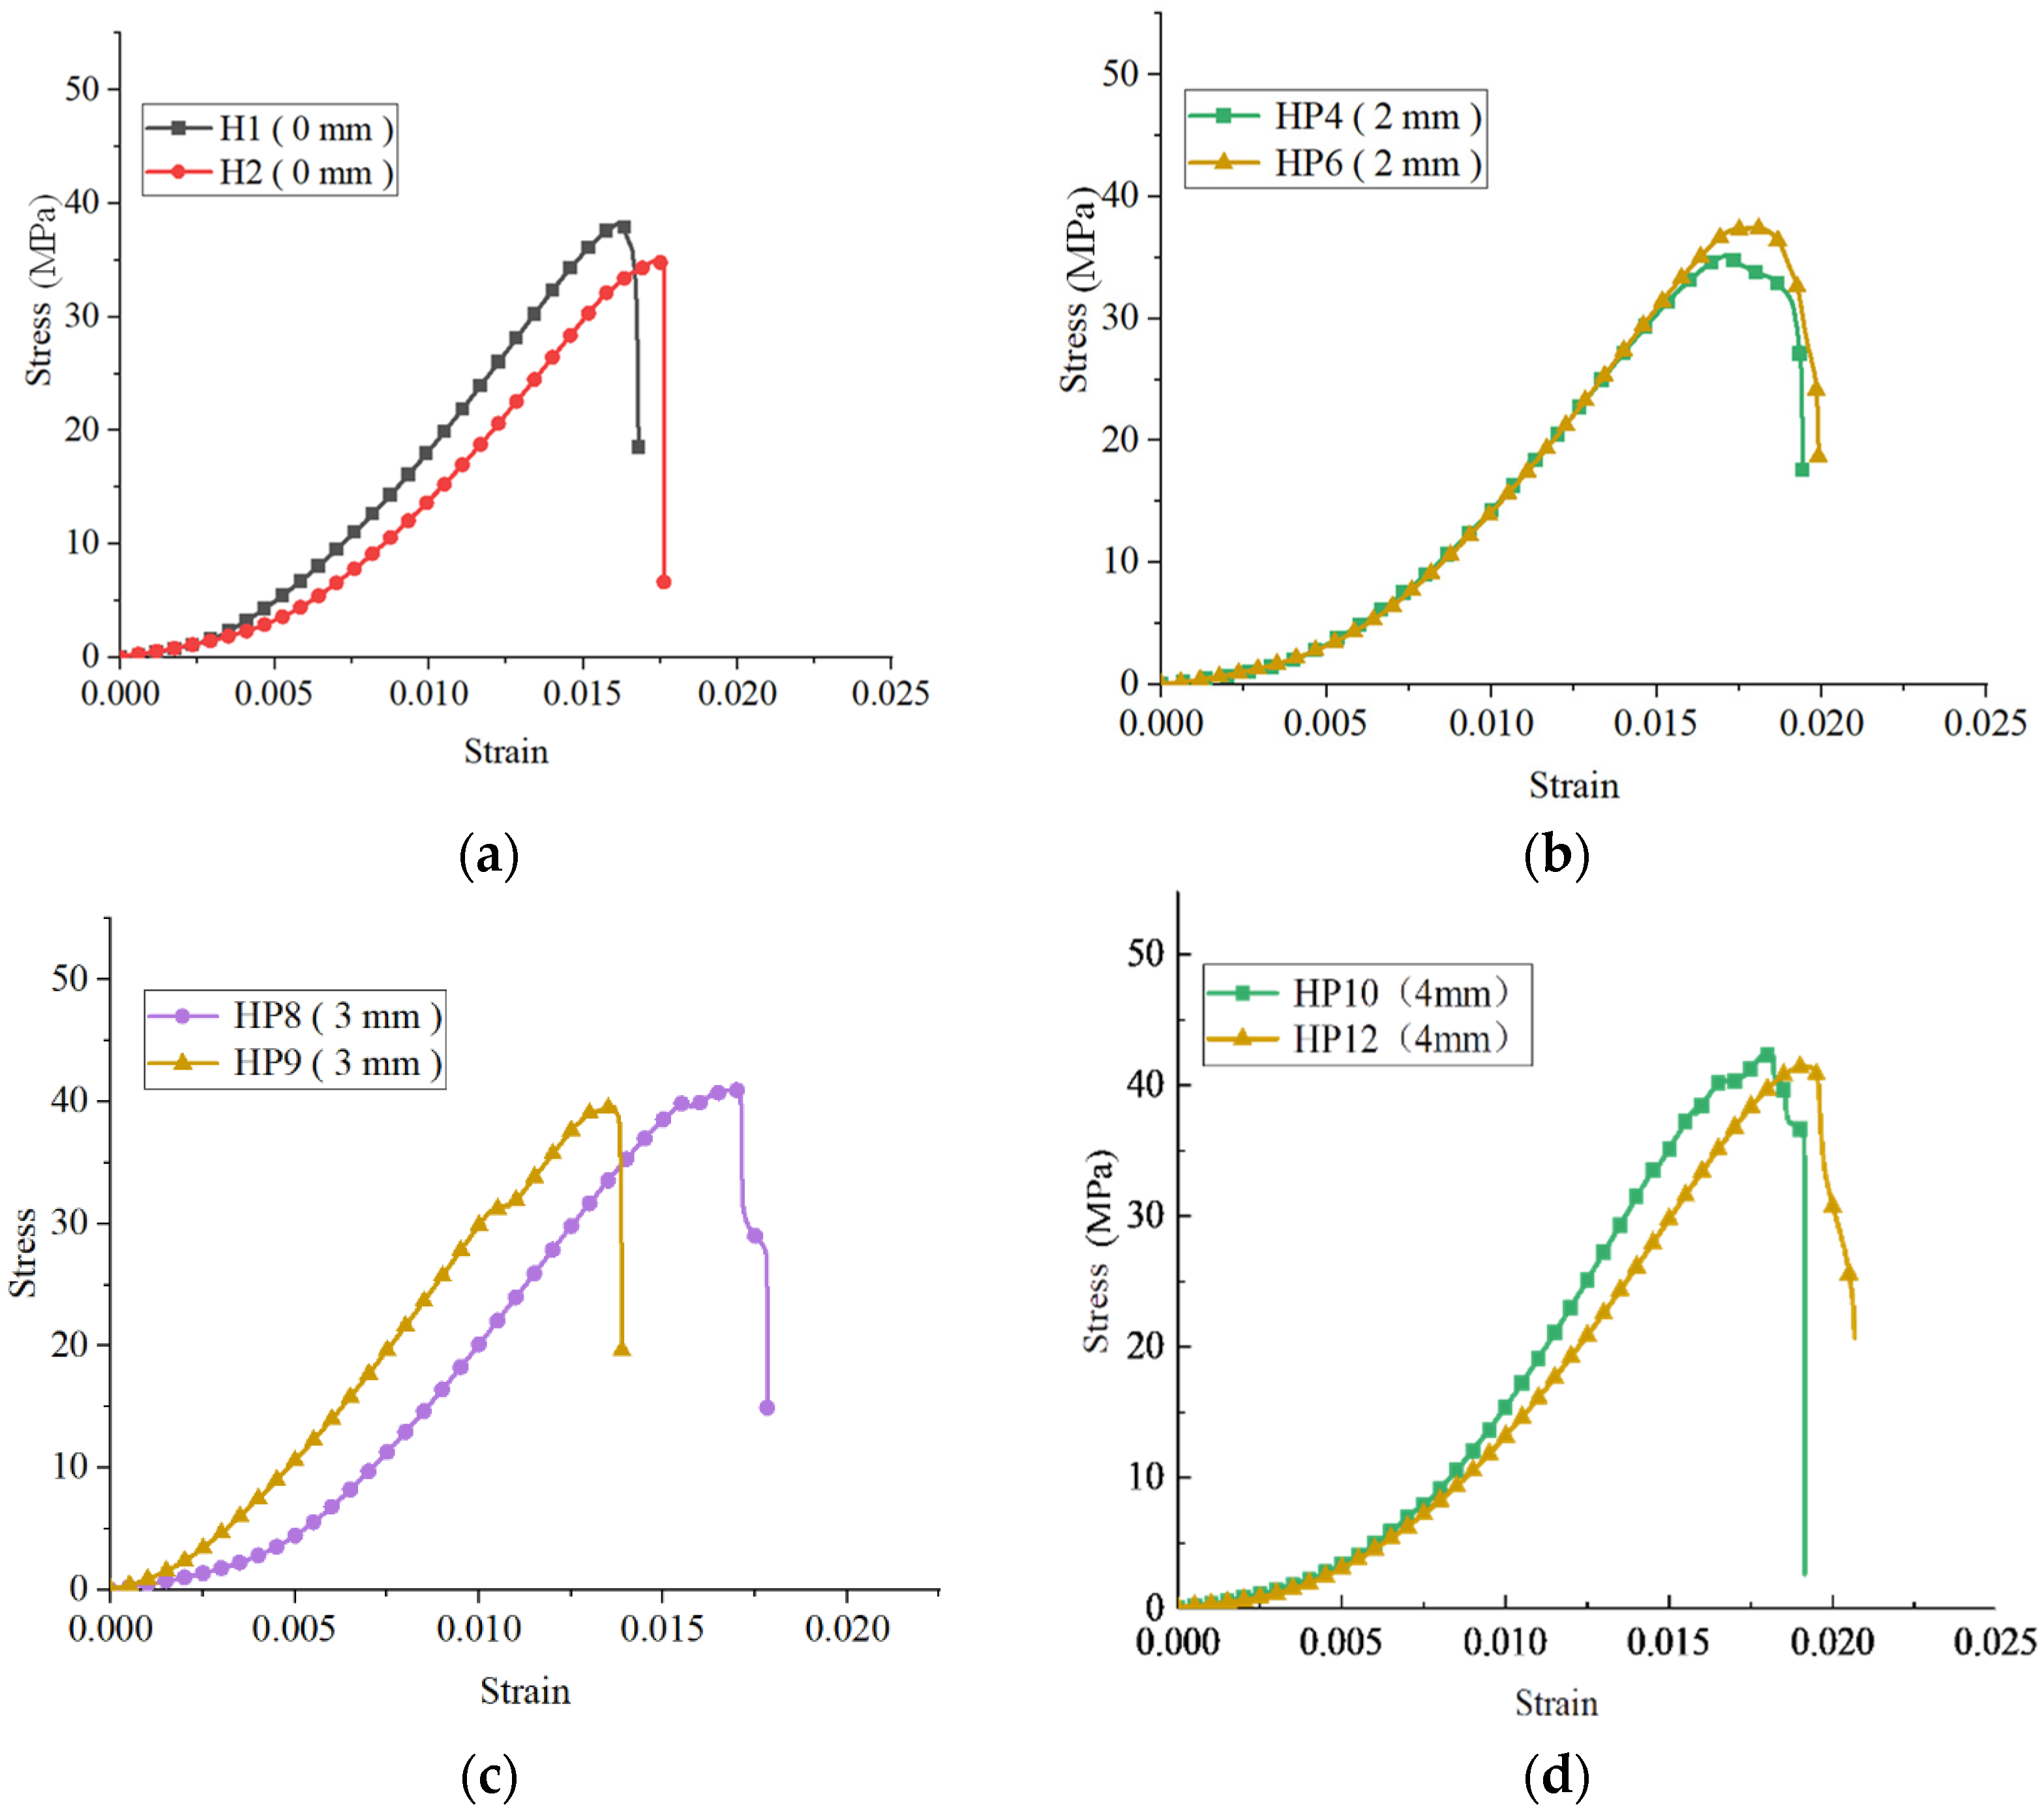
- Mechanical behavior of yellow sandstone specimen coated with TSL.
- 3.
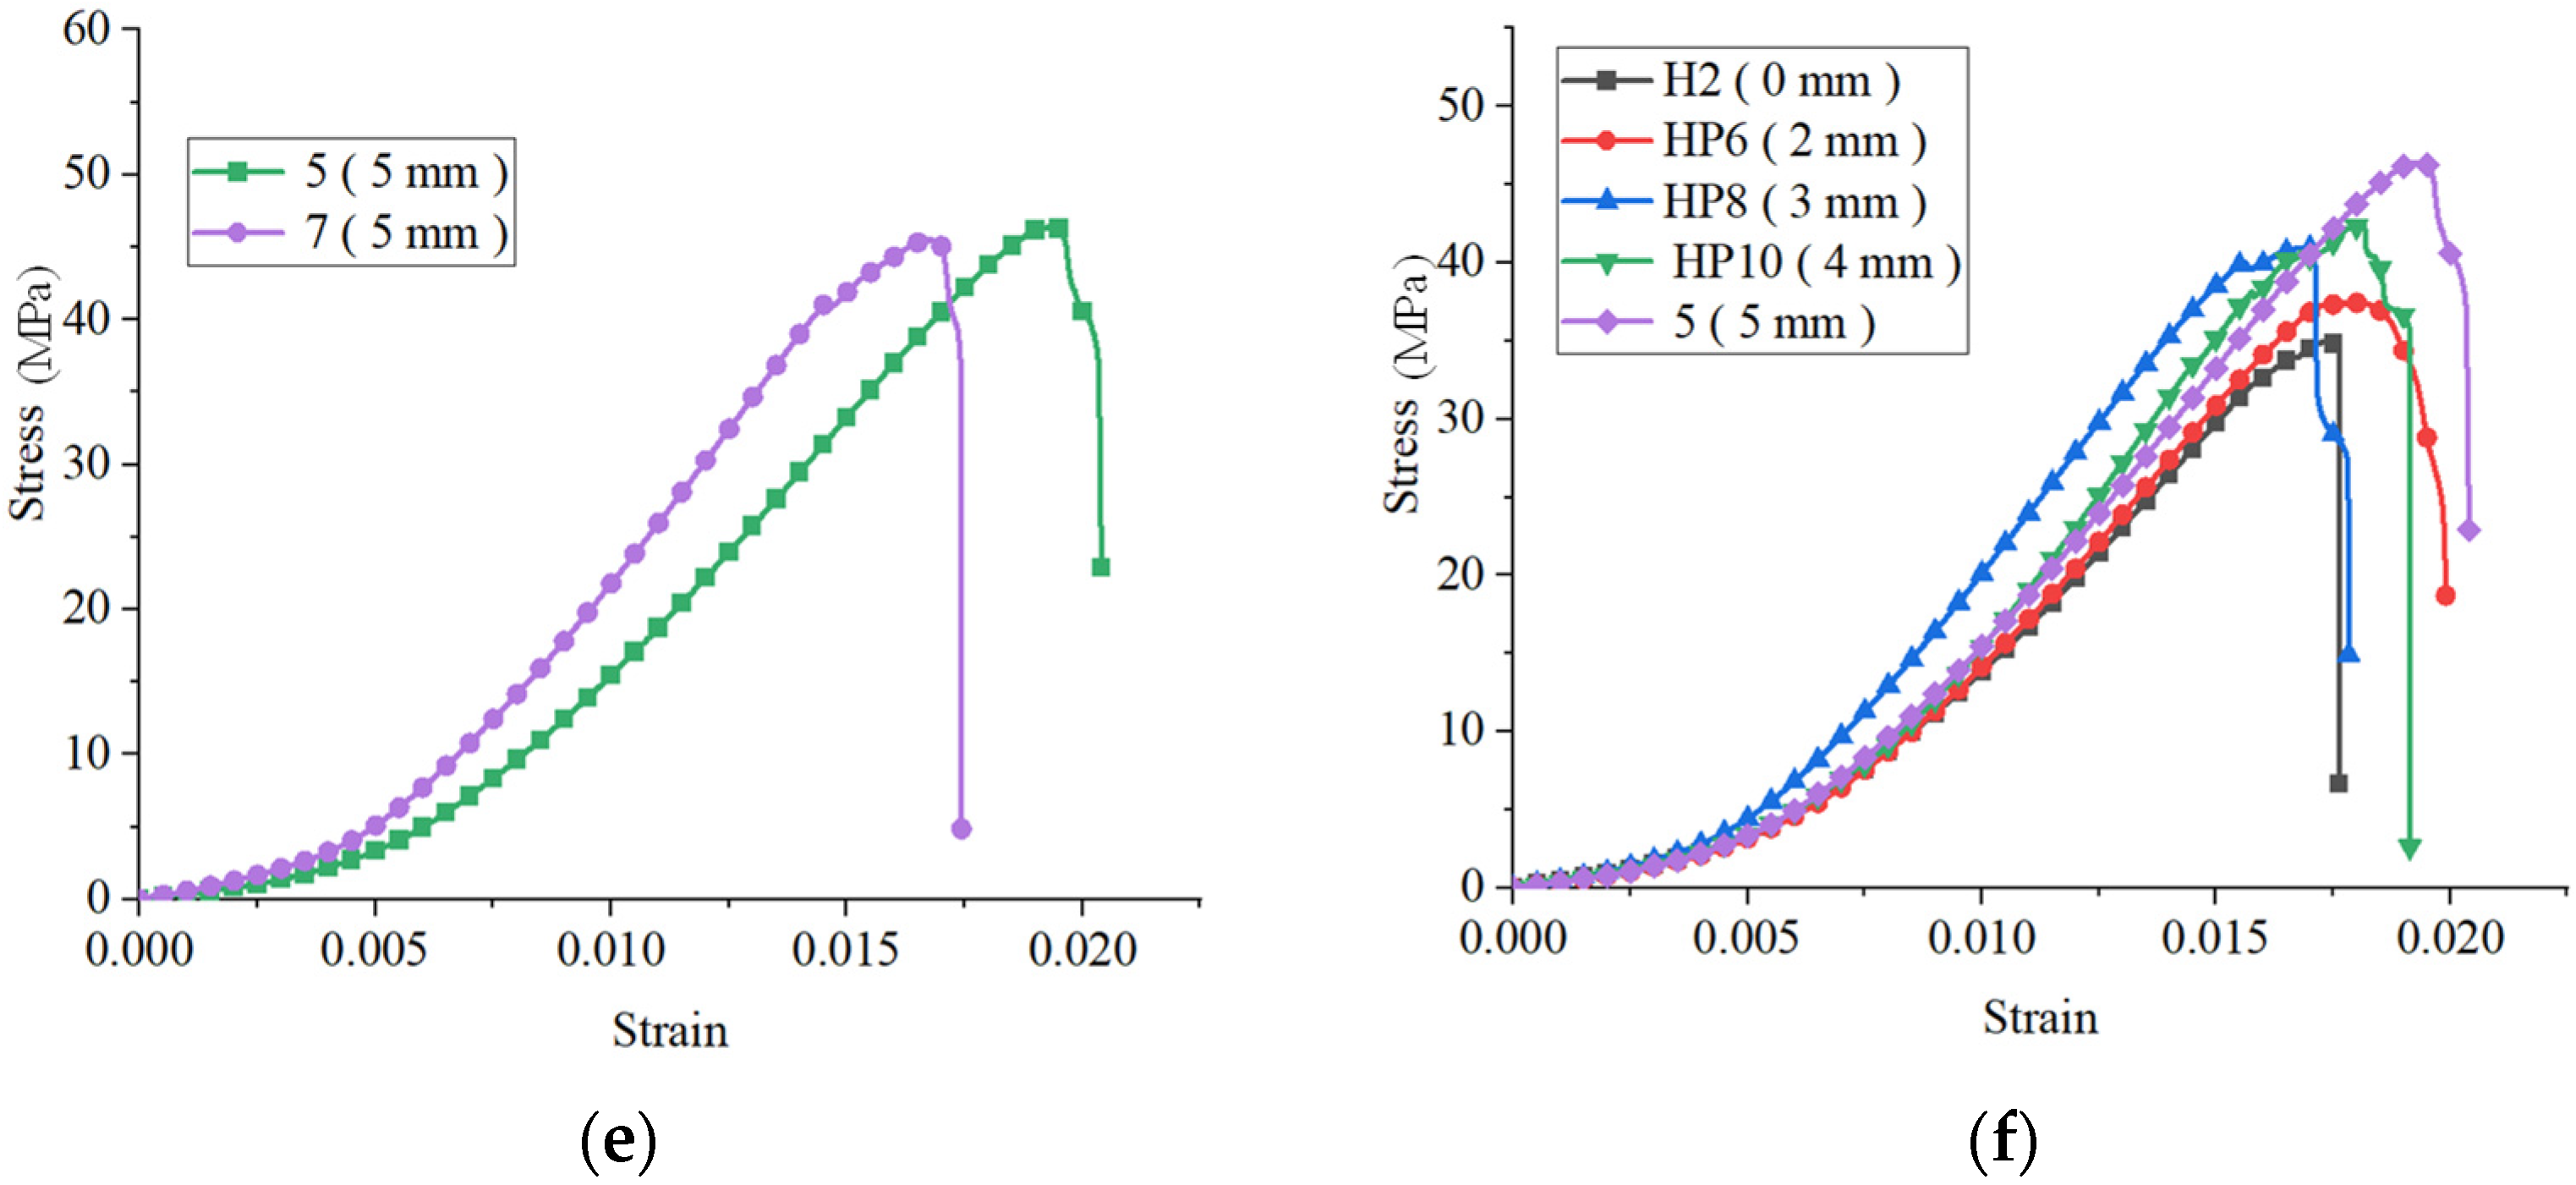
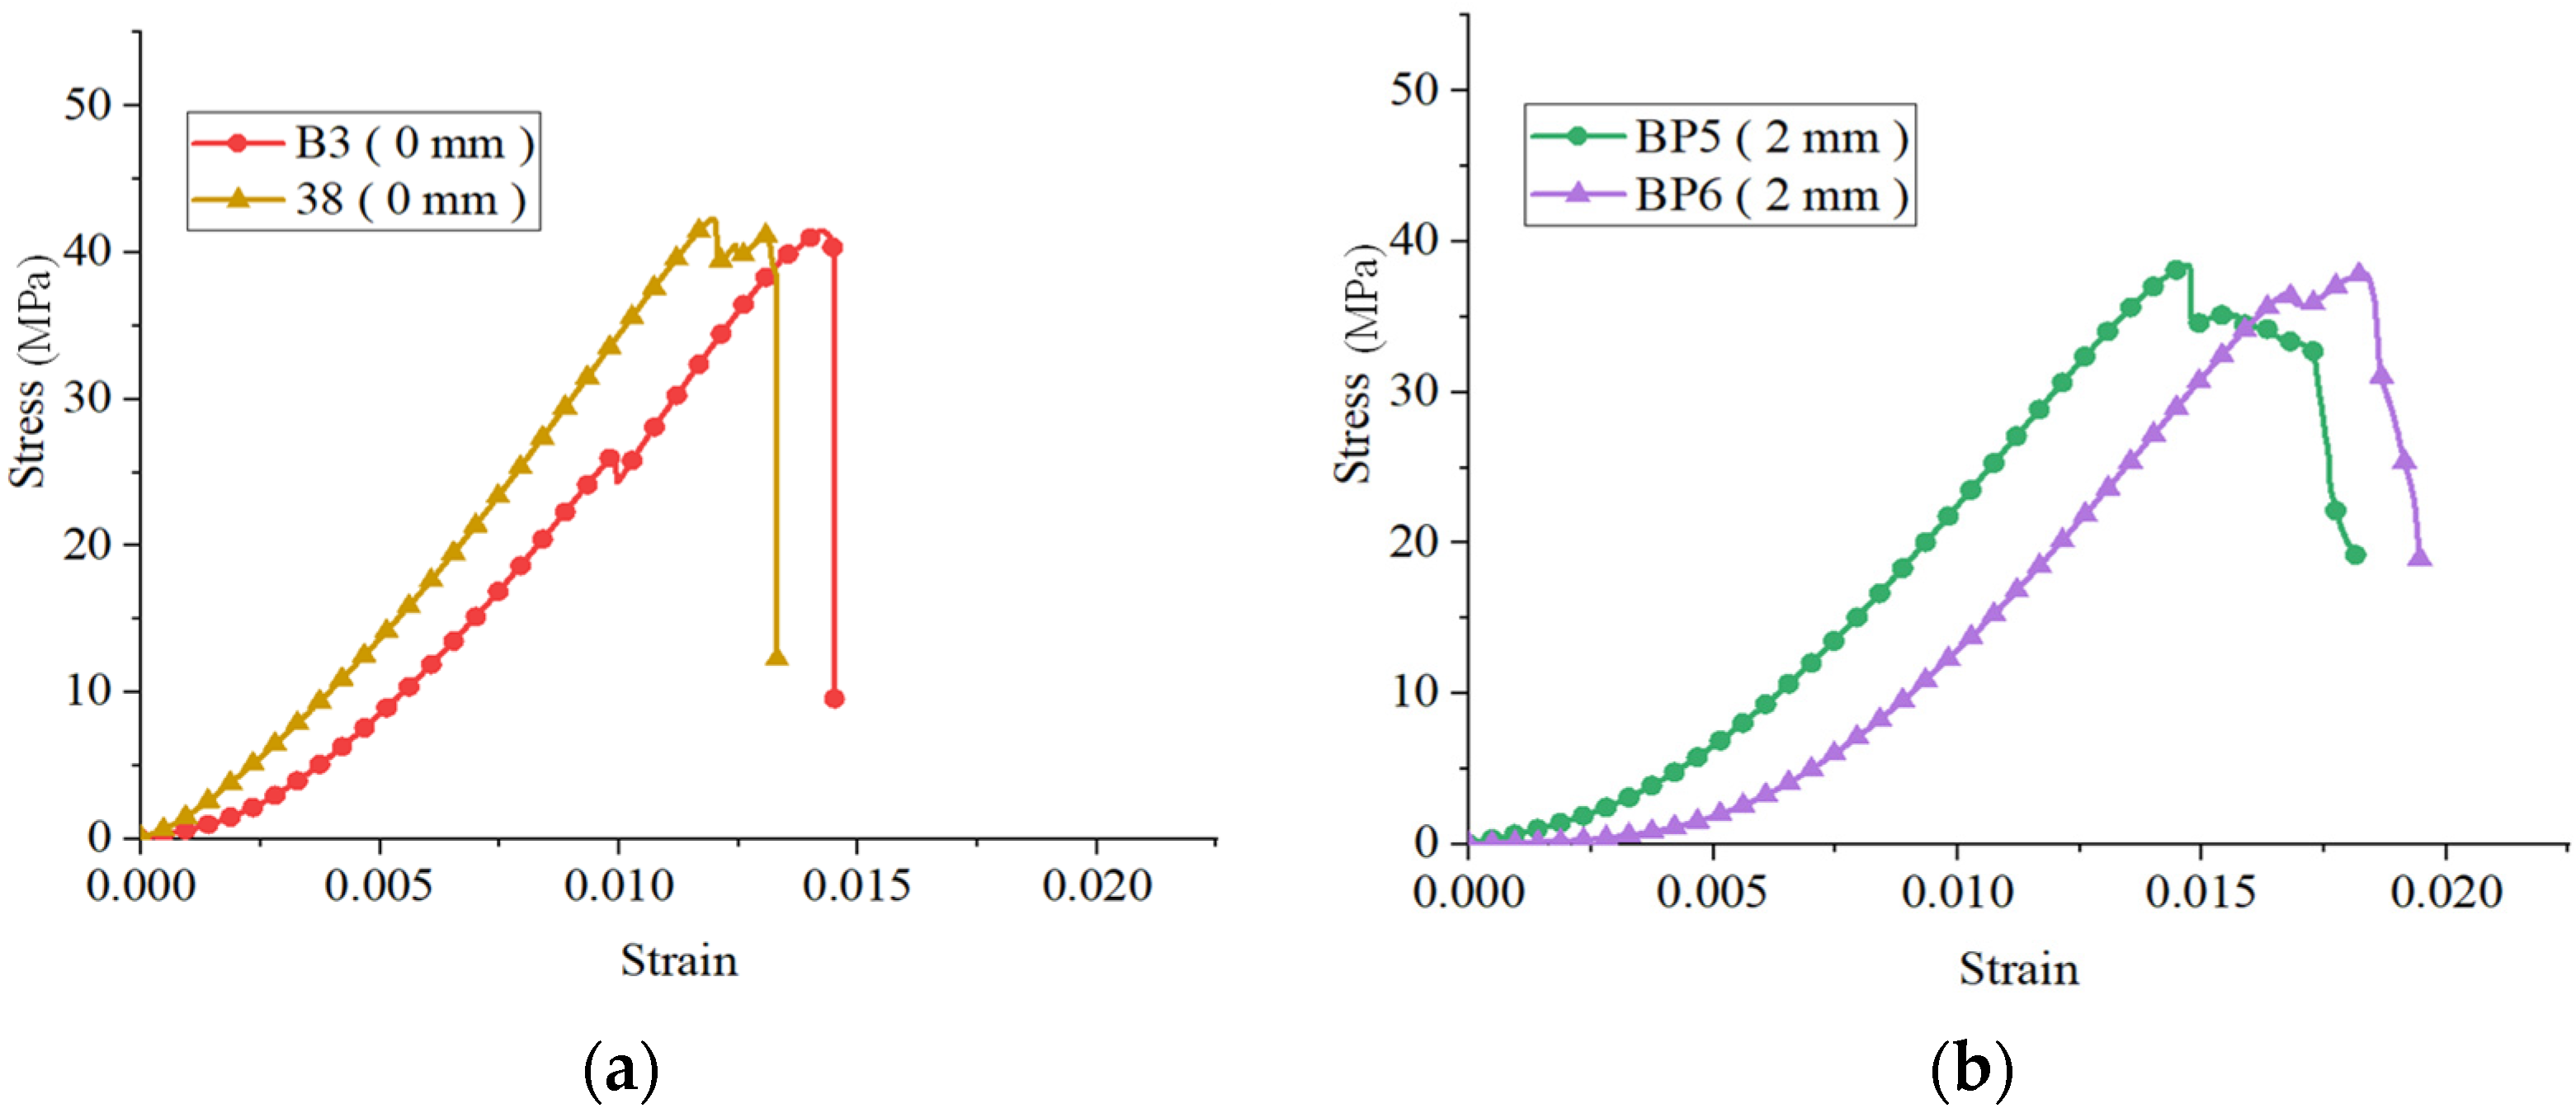
- Mechanical behavior of white sandstone specimen coated with TSL.
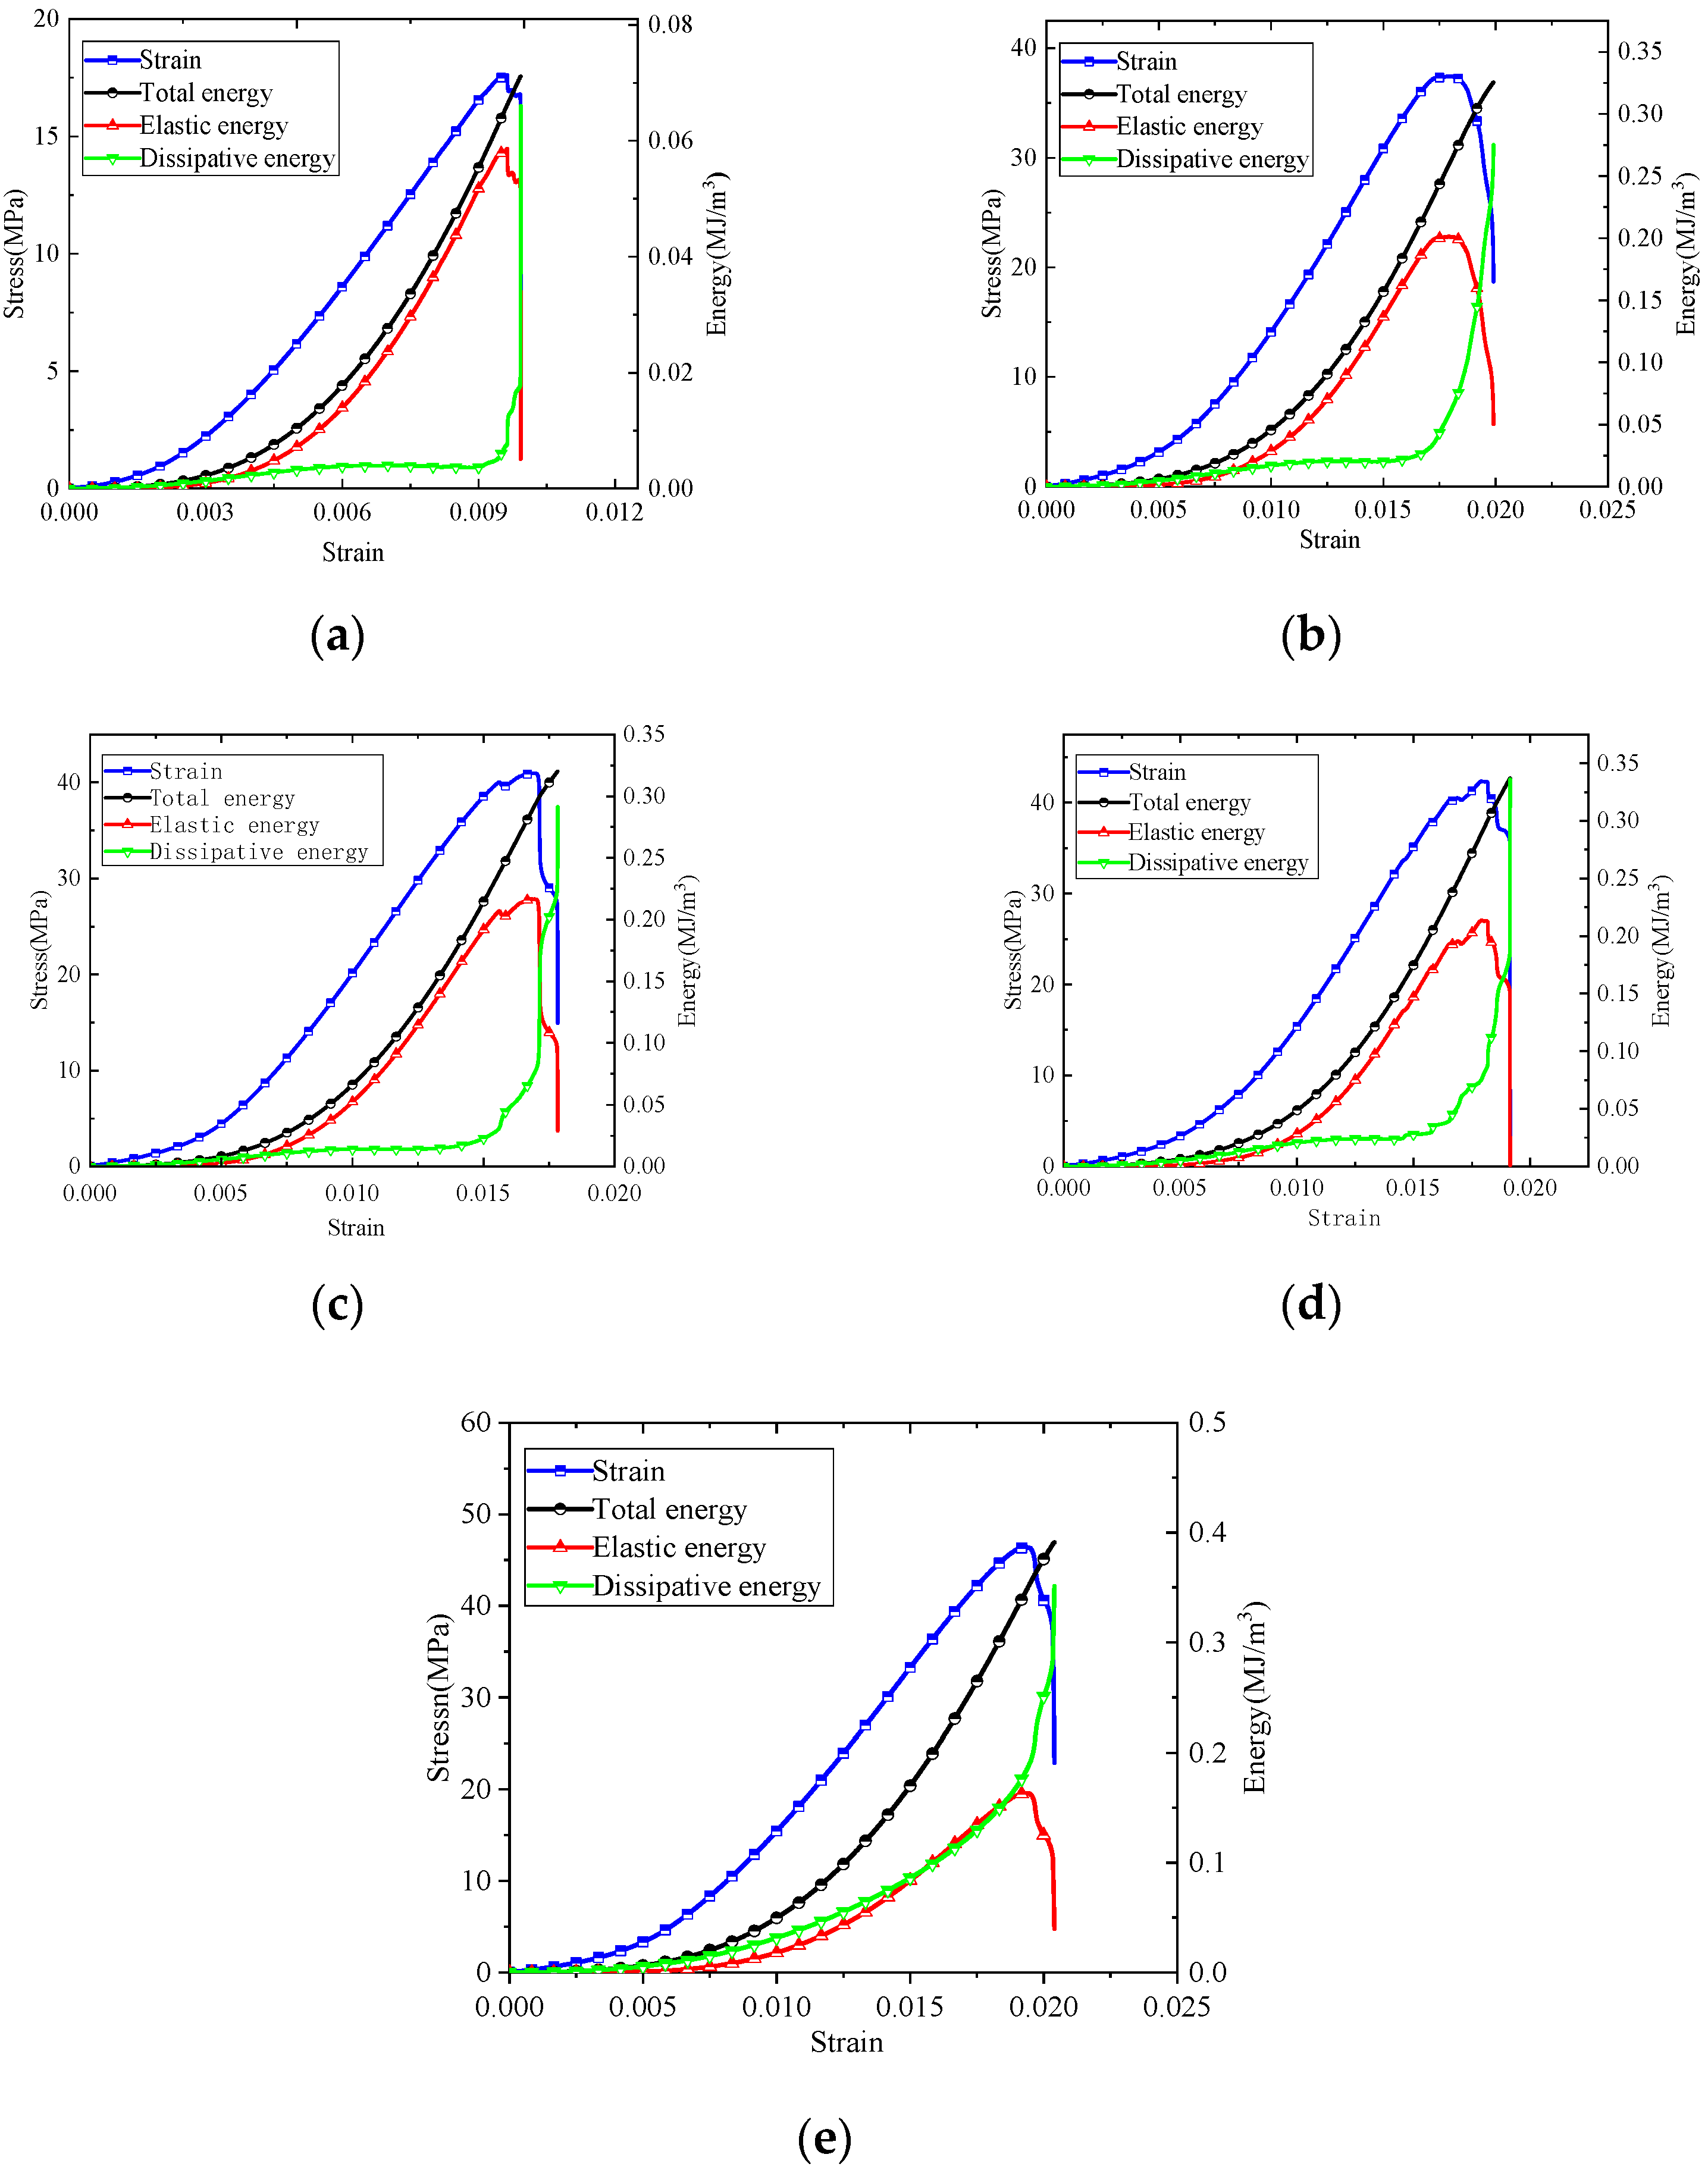
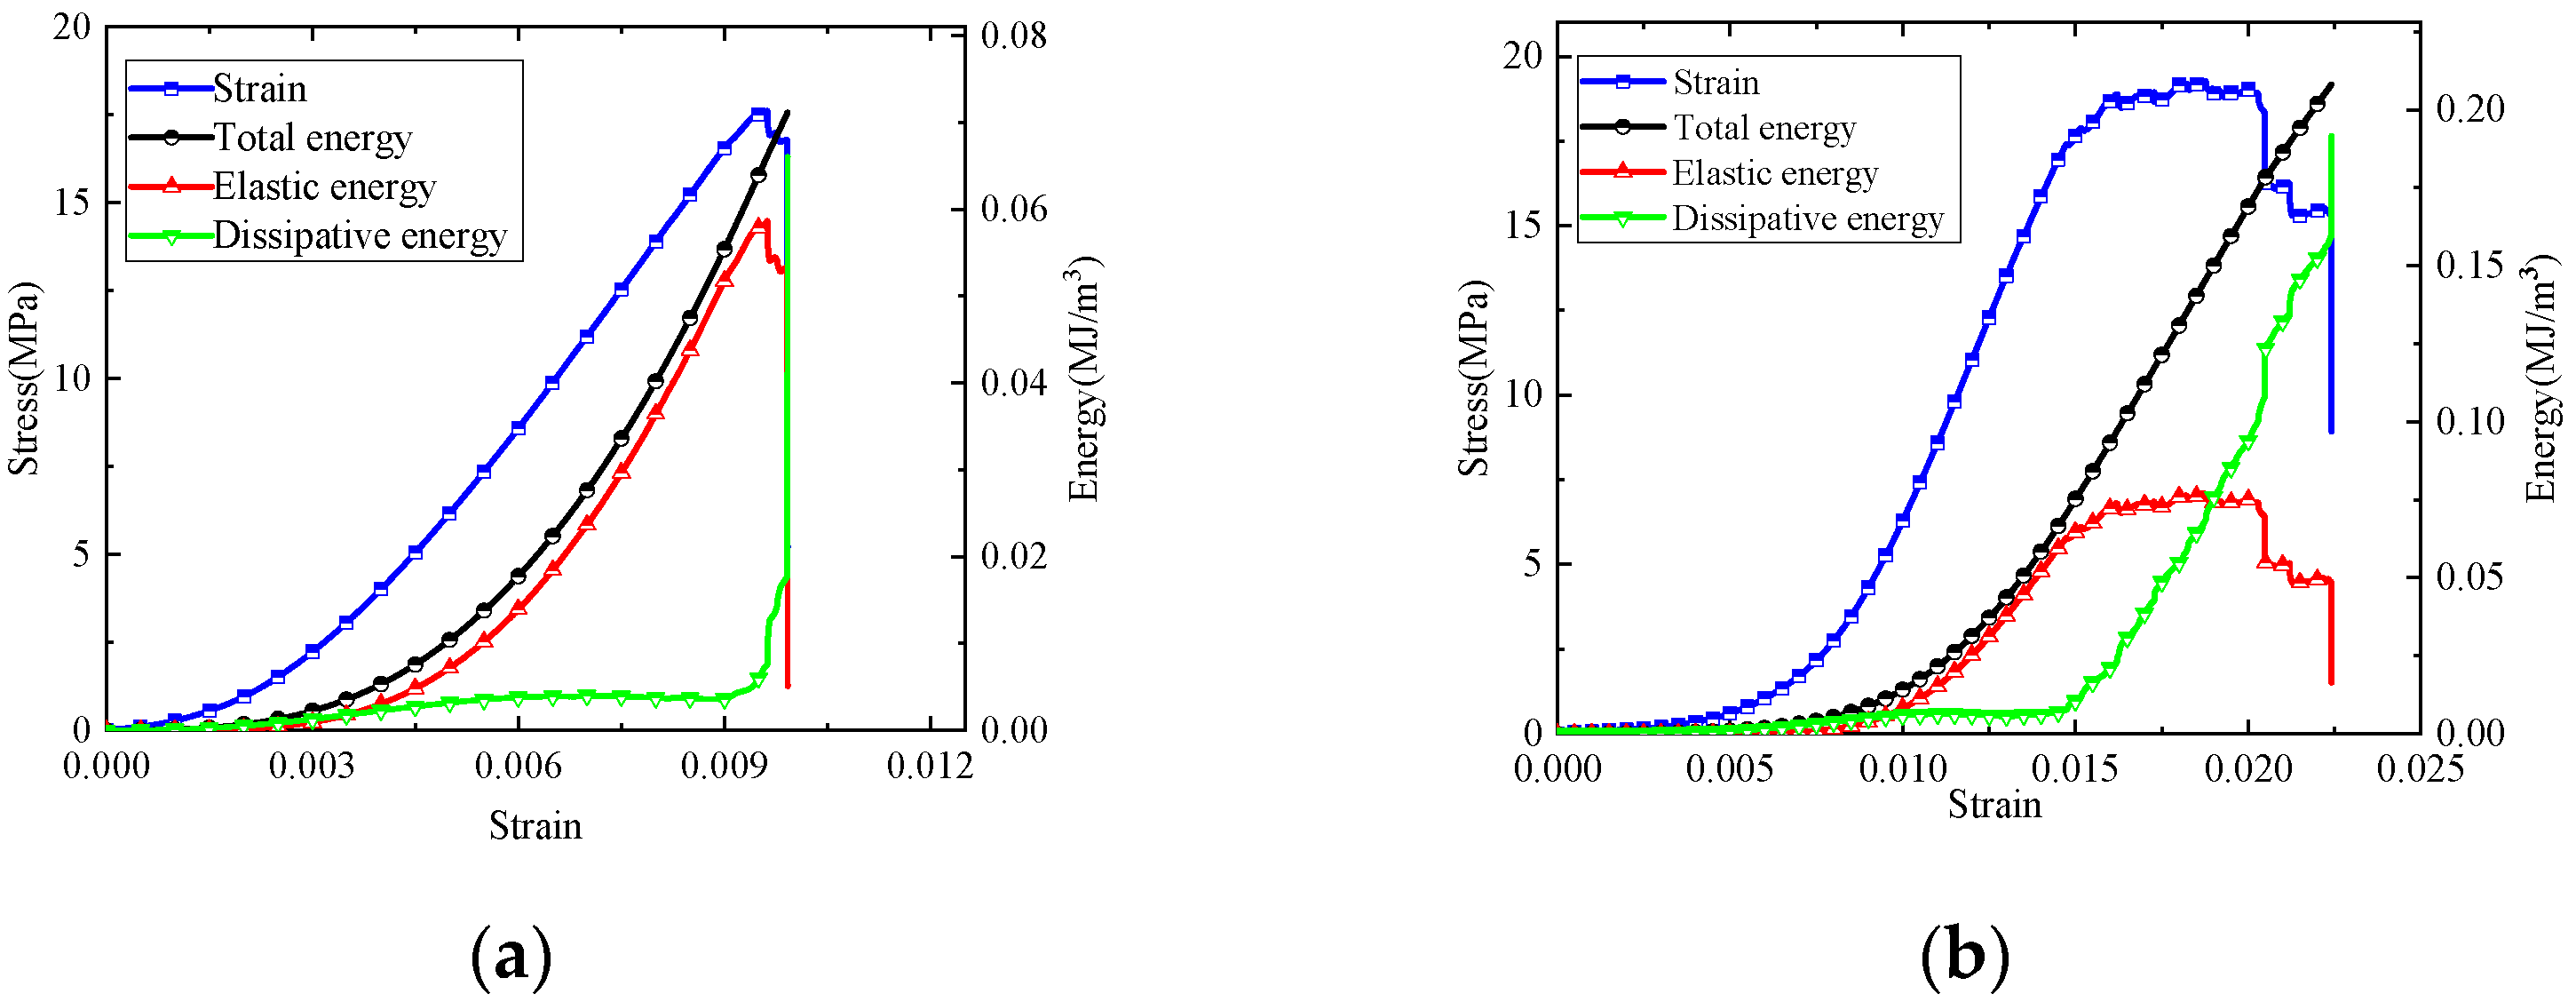
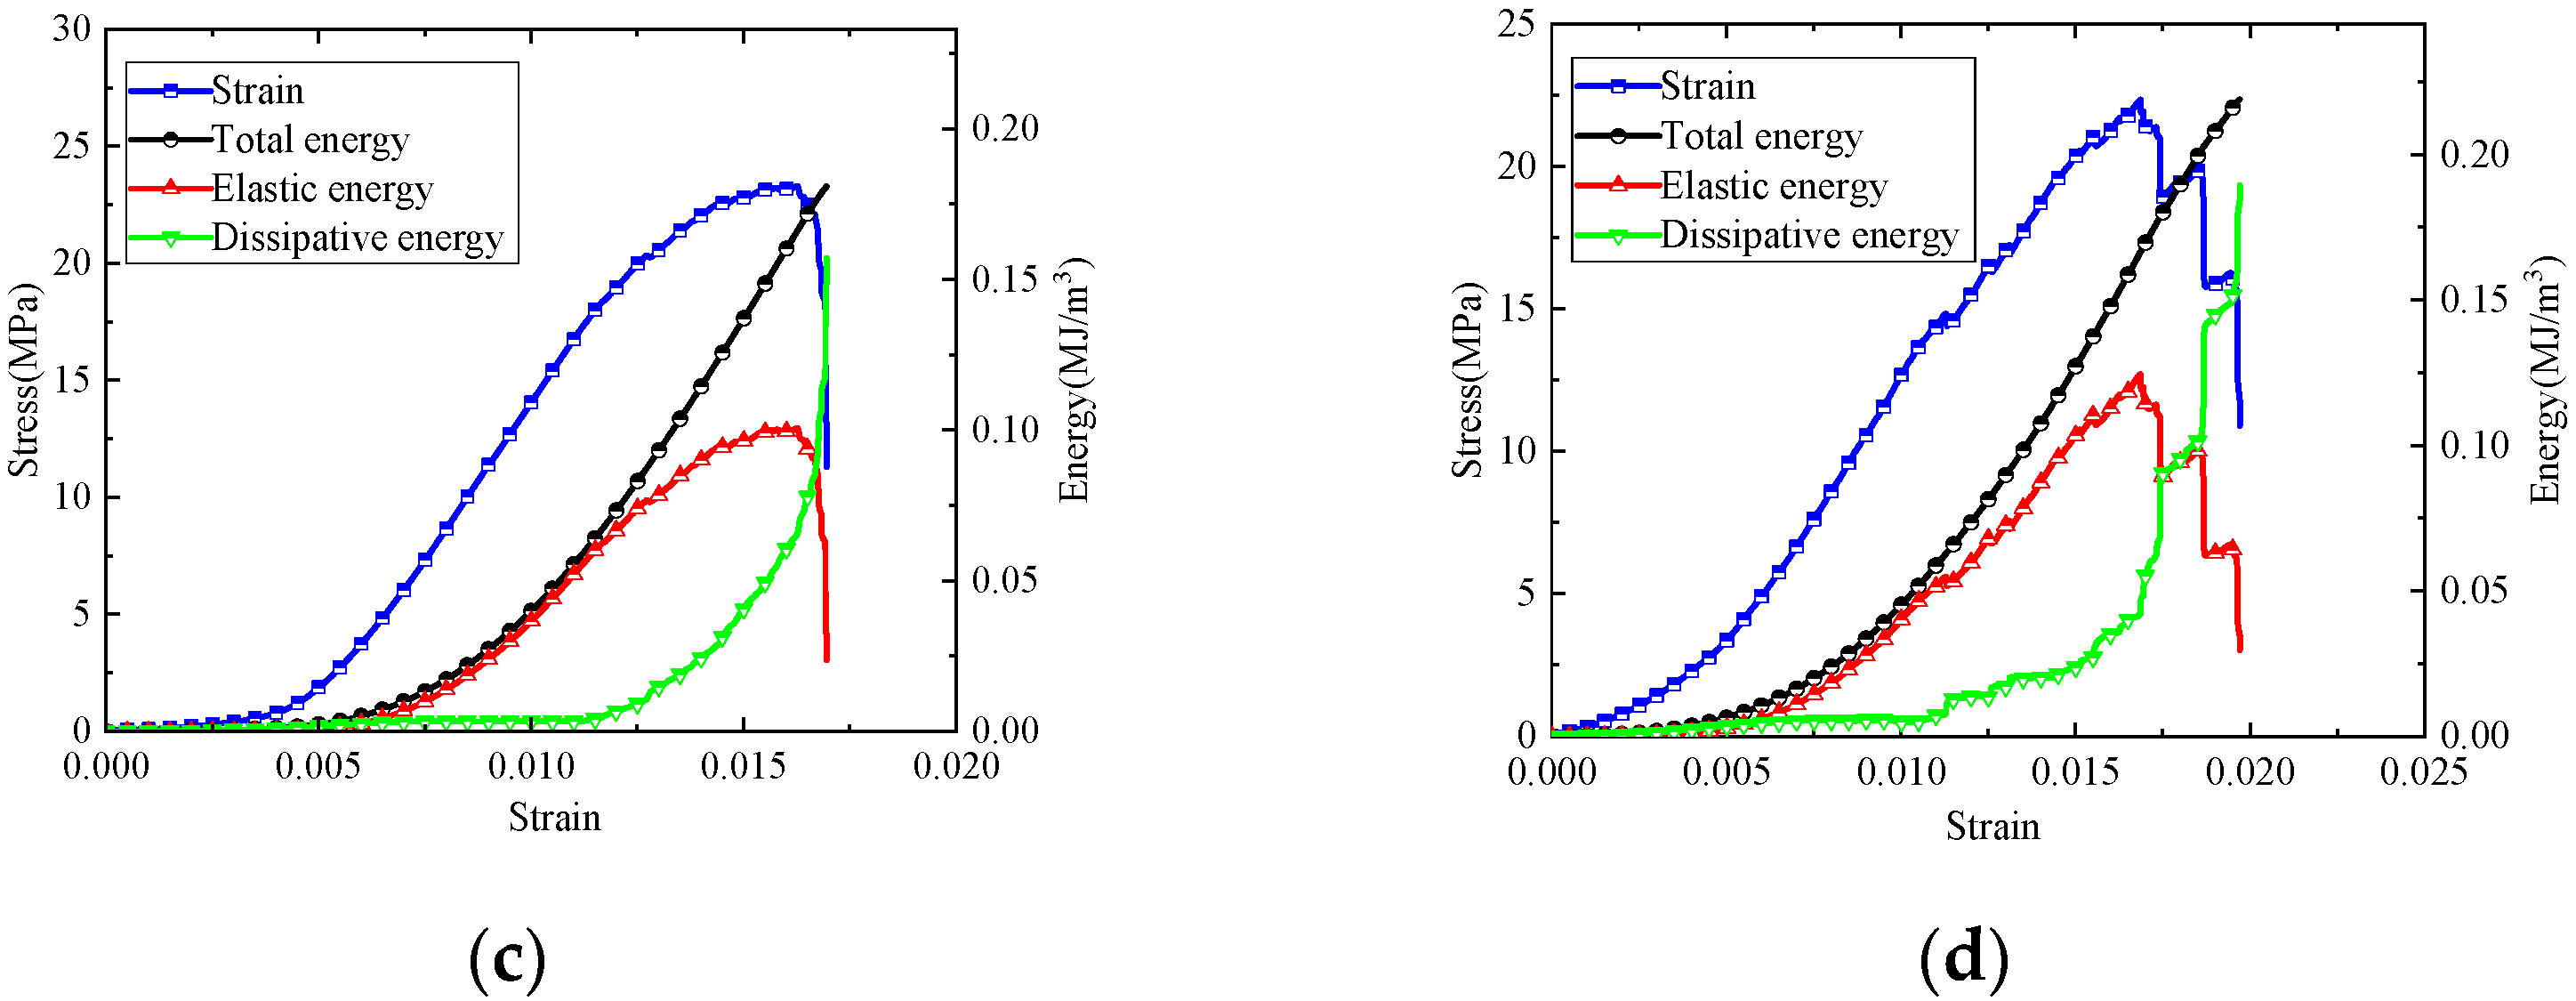
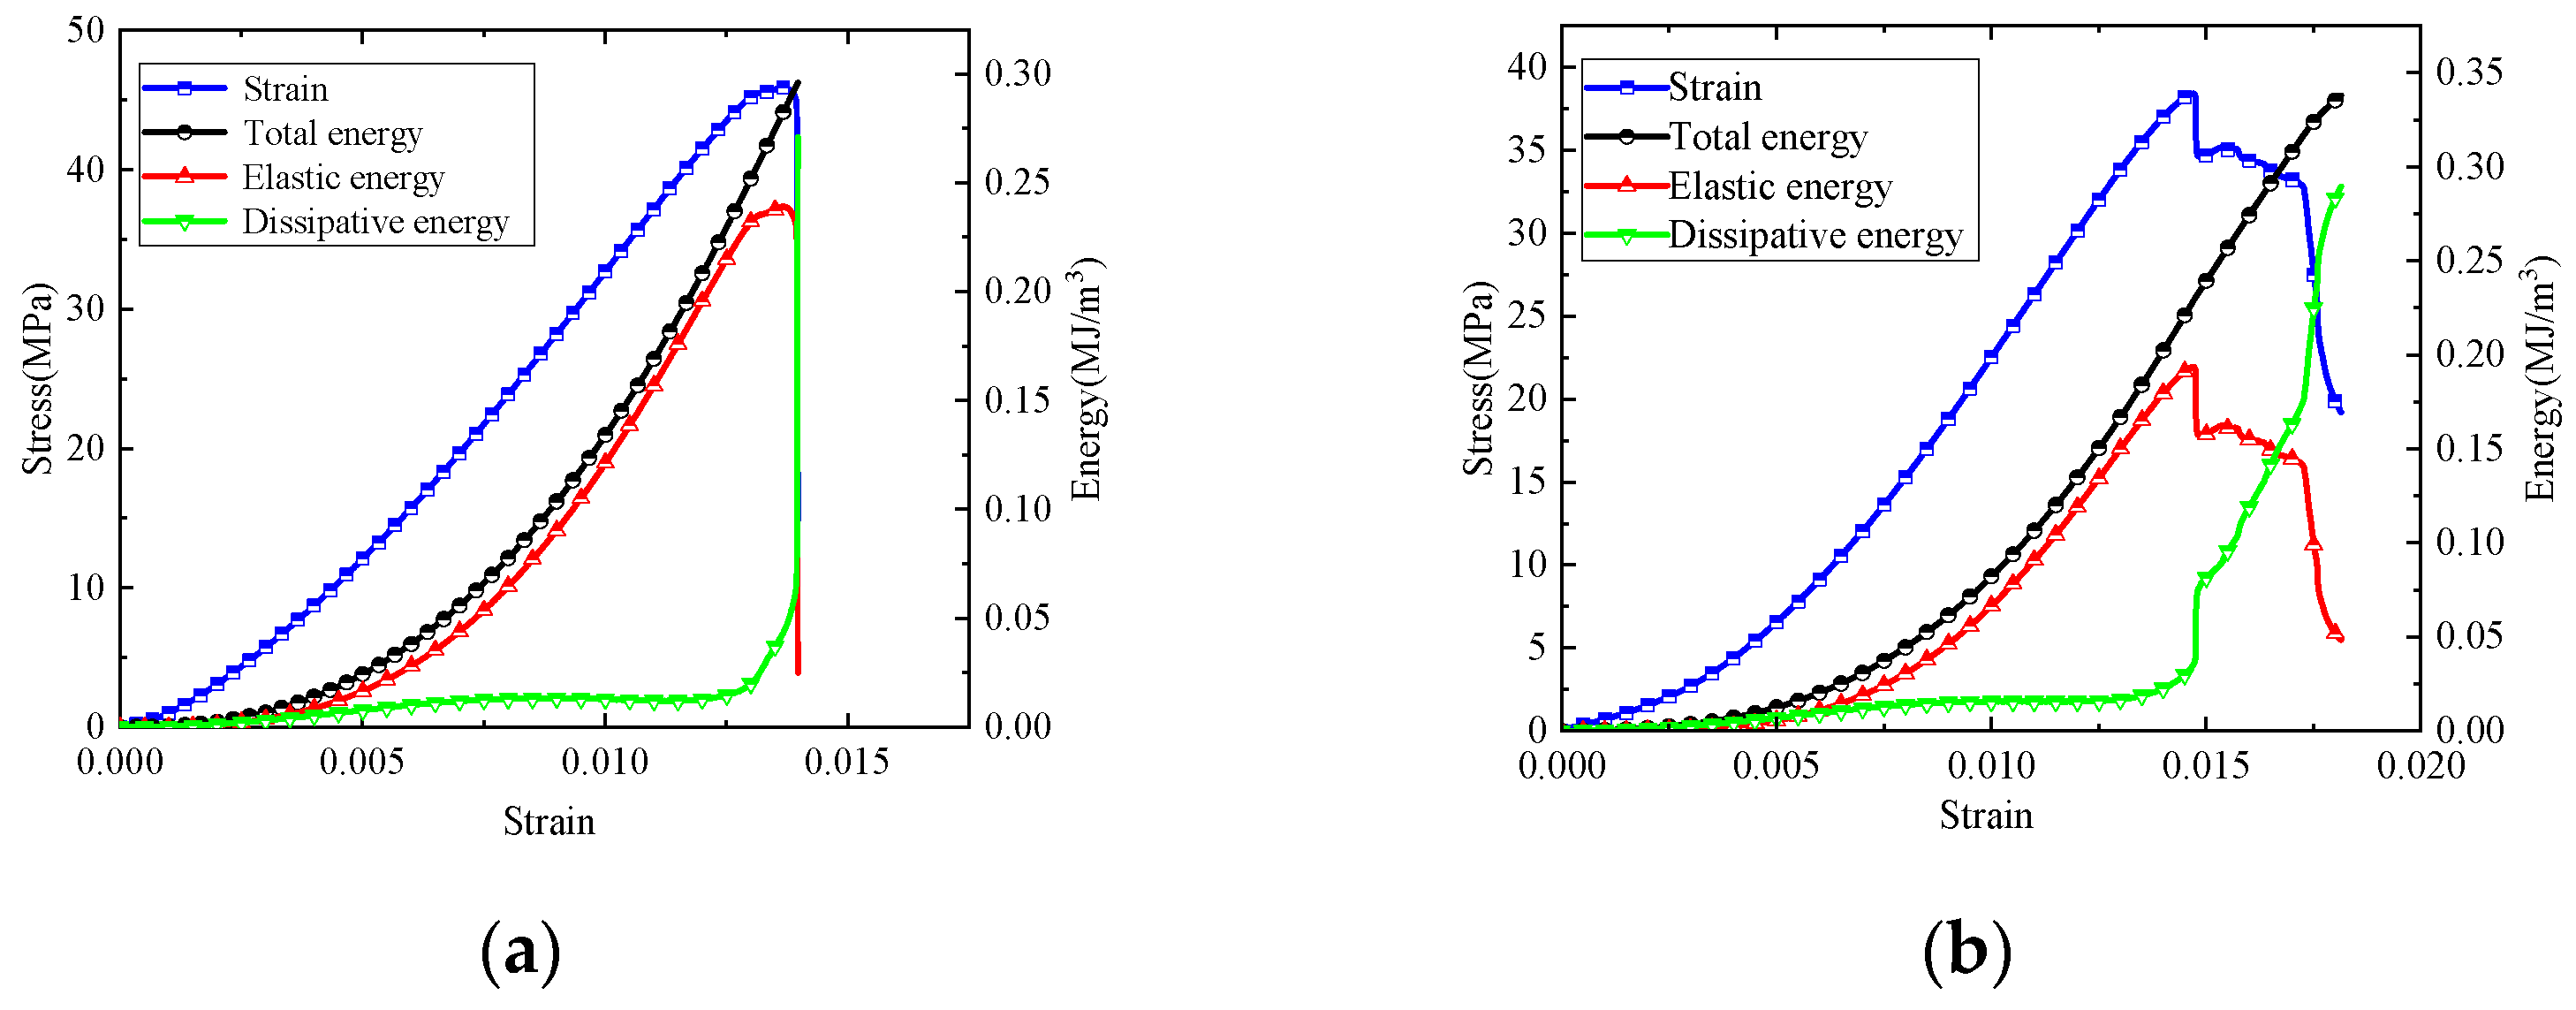
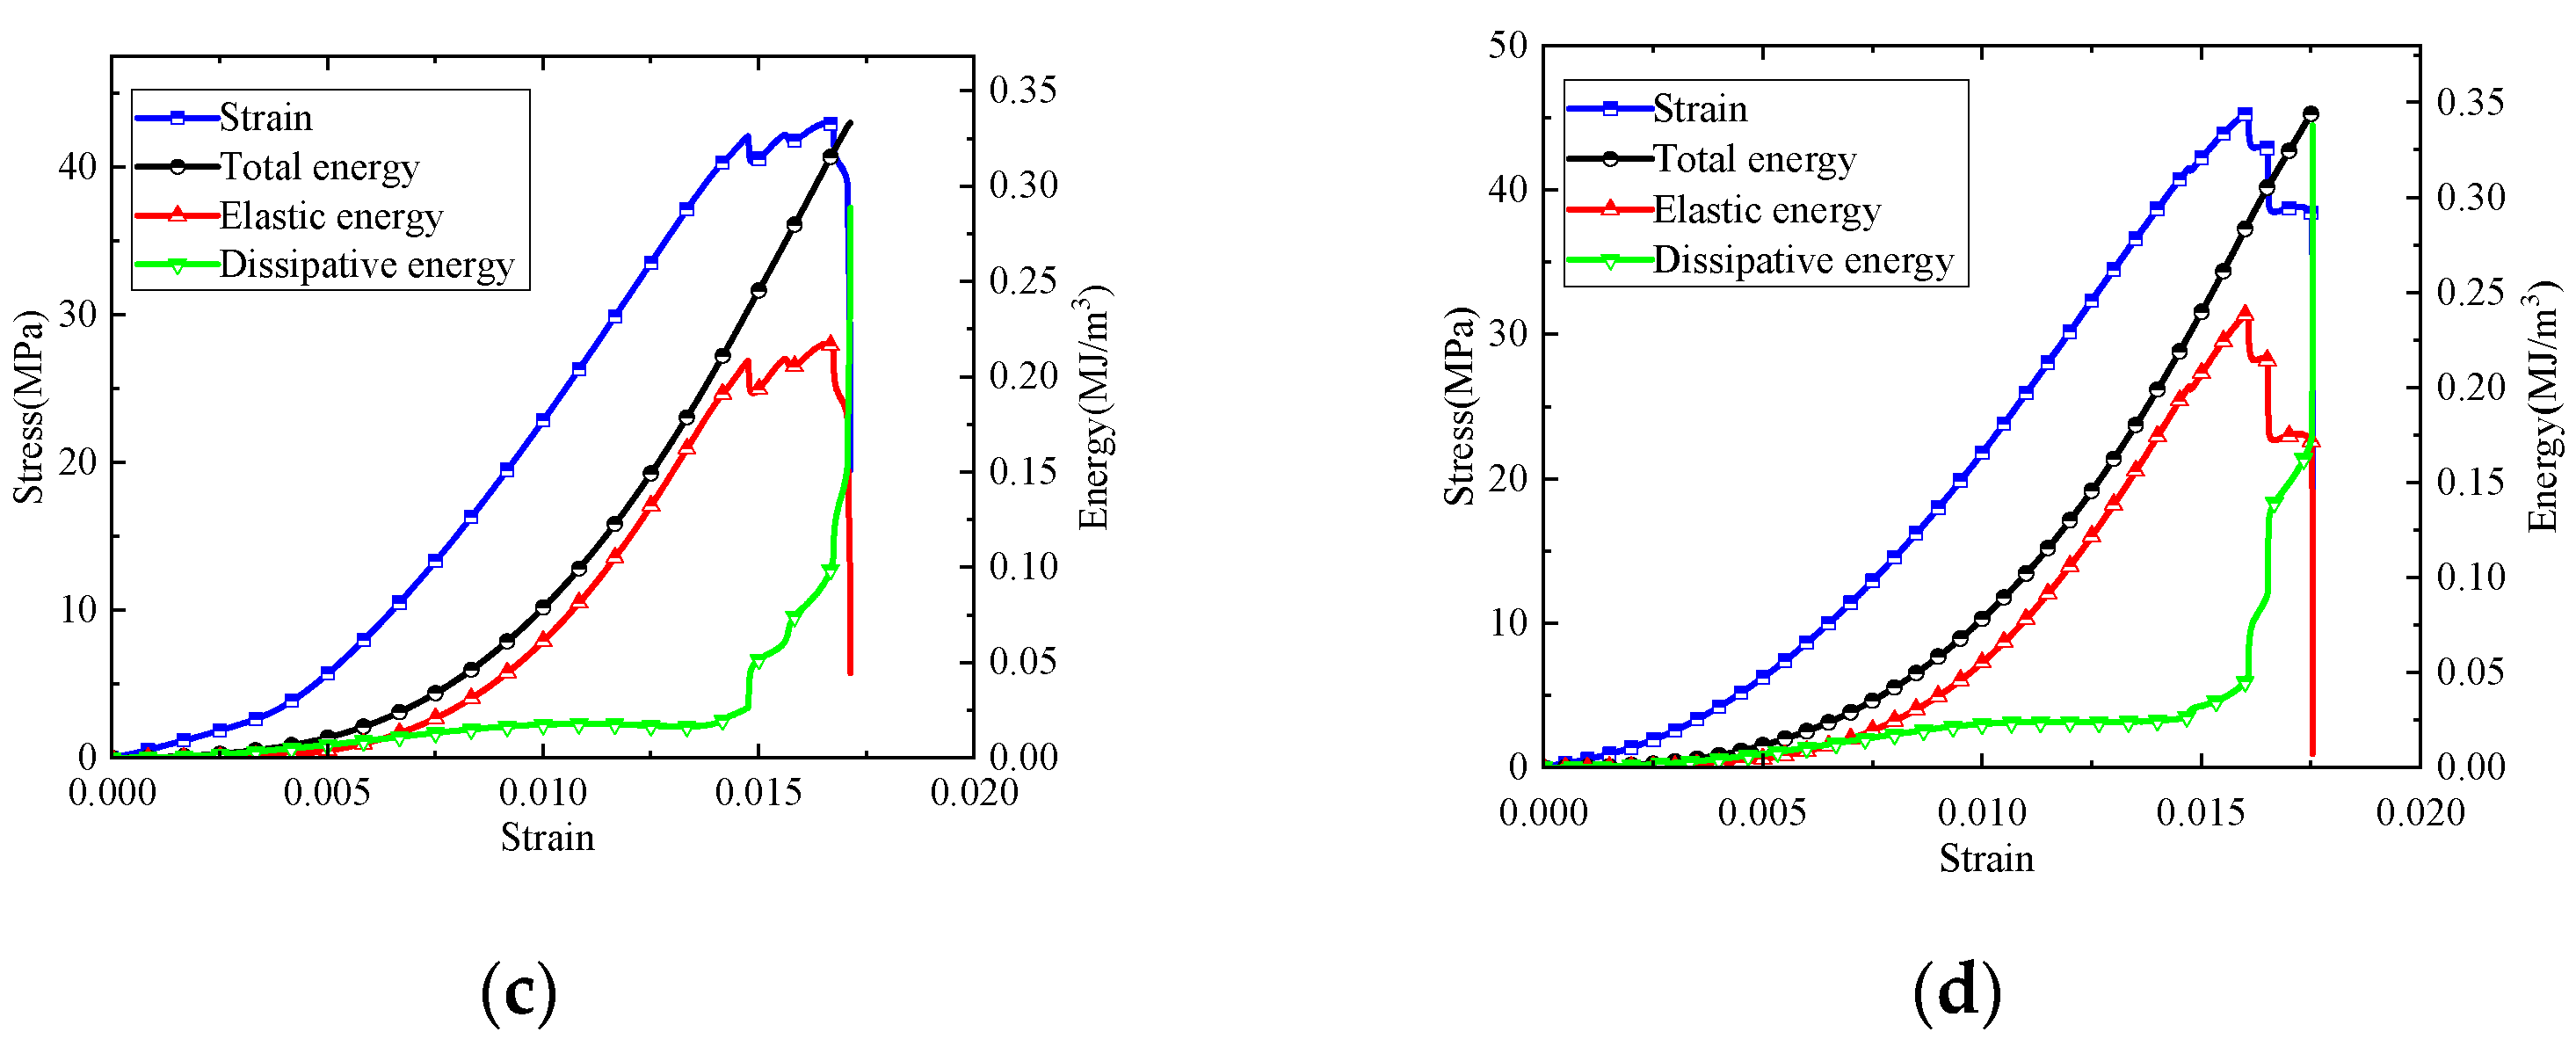
4.2. Specimen Energy Evolution Analysis
- Energy evolution analysis method
- 2.
- Energy evolution analysis of yellow sandstone
- 3.
- Energy evolution analysis of coal
- 4.
- Energy evolution analysis of white sandstone
5. Discussion
6. Conclusions
- (1)
- The hard and soft segments of TSLs cause microphase separation and form the physical cross-linking, as seen in their microscopic images. The hard segment was dispersed evenly in the soft segment, which improved the mechanical strength of the TSL.
- (2)
- The UCS improved with an increased thickness of TSL coating on coal, yellow sandstone, and white sandstone, and the improvements were more obvious because UCS was minimal. The UCS increment was 4.6%, 25.51%, and 43.75% in white sandstone, yellow sandstone, and coal, respectively. The confining pressure was affected by the TSL-coated coal and rocks, which improved the mechanical strength of the rocks and coal under UCS loading.
- (3)
- Compared with the uncoated coal, the maximal stress resistance of coal coated with 2 mm, 3 mm, and 4 mm of TSLs improved 34.56%, 43.75%, and 34.75%, respectively. The post-peak pressure curves of TSL-coated coal and rocks were more gradual than that of their uncoated counterpart, and they had a step-like pattern, which indicated that the TSL significantly improved the residual strength of the coal and rocks, and increased the reinforcement effect of the confining pressure exerted by the TSL on the coal specimen. The reinforcement of TSLs will be weakened if they are debonded or delaminated from the coal and rock.
- (4)
- With an increment in the coating thickness, the maximal total, and dissipative energies of yellow sandstone specimen were gradually increased, and the maximal elastic energy was nearly unchanged; The maximal total, elastic, and dissipative energies of TSL-coated coal increased 2–3 times than that of uncoated coal; thus, the increment in coated coal was significant. For the white sandstone, the maximal elastic energy was nearly unchanged, and the maximal total and dissipative energies increased. The energy-absorbing capacity of the coated rocks gradually reduced as the rock strength decreased, and it was higher in coal than that in the yellow and white sandstone. Because coal is an anisotropic material, its total energy is weaker than that of yellow and white sandstones. The TSL reinforcement was significantly more effective for coal.
Author Contributions
Funding
Institutional Review Board Statement
Informed Consent Statement
Data Availability Statement
Acknowledgments
Conflicts of Interest
References
- He, M.C.; Xie, H.P.; Peng, S.P.; Jiang, Y.D. Study on rock mechanics in deep mining engineering. Chin. J. Rock Mech. Eng. 2005, 24, 2803–2813. [Google Scholar]
- Xu, Z.M.; Huang, R.Q. Relationship between rock burst and blasting. Chin. J. Rock Mech. Eng. 2003, 22, 414–419. [Google Scholar]
- Zhang, N.; Han, C.L.; Xie, Z.Z. Theory of continuous beam control and high efficiency supporting technology in coal roadway. J. Min. Strat. Control Eng. 2019, 1, 1–8. [Google Scholar]
- Chen, Y.G.; Lu, S.L. Coal Mining Ground Control of China; China University of Mining and Technology Press: Xuzhou, China, 1994. [Google Scholar]
- Robertson, S.B.; Molinda, G.M.; Dolinar, D.R.; Pappas, D.M. Best Practices and Bolting Machine Innovations for Roof Screening. Available online: https://www.cdc.gov/niosh/mining/UserFiles/works/pdfs/bpabm.pdf (accessed on 3 March 2019).
- Ozturk, H.; Guner, D. Failure analysis of thin spray-on liner coated rock cores. Eng. Fail. Anal. 2017, 79, 7925–7933. [Google Scholar] [CrossRef]
- Stacey, T.R. Review of membrane support mechanisms, loading mechanisms, desired membrance performance, and appropriate test methods. J. South. Afr. Inst. Min. Metall. 2001, 101, 343–351. [Google Scholar]
- Kanda, M.J.; Stacey, T.R. Review of the practical effectiveness of thin spray-on liners based on information from suppliers and observations from the mining industry. In MGR 2019, Proceedings of the First International Conference on Mining Geomechanical Risk, Perth, Australia, 9–11 April 2019; Australian Centre for Geomechanics: Perth, Australia, 2019; pp. 443–458. [Google Scholar] [CrossRef] [Green Version]
- Manson, D.P.; Stacey, J.R. Support to rock excavations provided by sprayed liners. Int. J. Rock Mech. Min. Sci. 2008, 45, 773–788. [Google Scholar] [CrossRef]
- Yilmaz, H. Shear-bond strength testing of thin spray-on liners. J. South. Afr. Inst. Min. Metall. 2007, 107, 519–530. [Google Scholar]
- Archibald, J.F.; DeGagné, D.O. Spray-on lining support in Canadian underground mining-a research summary. CIM Bull. 2001, 94, 49–56. [Google Scholar]
- Shan, Z.J.; Porter, I.; Nemcik, J.; Zhang, Z.Y. Investigation on the Rock Surface Support Performance of Welded Steel Mesh and Thin Spray-On Liners Using Full-Scale Laboratory Testing. Rock Mech. Rock Eng. 2020, 53, 171–183. [Google Scholar] [CrossRef]
- Lau, V.; Saydam, S.; Cai, Y.; Mitra, R. Laboratory Investigation of Support Mechanism for Thin Spray-on Liners. In Proceedings of the 12th International Conference of International Association for Computer Methods and Advances in Geomechanics, Goa, India, 1–6 October 2008; pp. 1381–1388. [Google Scholar]
- Shi, L. Development of study on support mechanism of sprayed concrete liners in tunneling and caving engineering. Chin. J. Undergr. Space Eng. 2011, 7, 759–763. [Google Scholar]
- Tannant, D.D. Thin spray-on liners for underground rock support. In Proceedings of the 17th International Mining Congress and Exhibition of Turkey—IMCET, Ankara, Turkey, 19–22 June 2001; pp. 57–73. [Google Scholar]
- Almusallam, A.A.; Khan, F.M.; Dulaijian, S.U.; Al-Amoudi, O.S.B. Effectiveness of surface coatings in improving concrete durability. Cem. Concr. Compos. 2003, 25, 473–481. [Google Scholar] [CrossRef]
- Archibald, J.F.; Lausch, P. Thin spray-on linings for rock failure stabilization. In Proceedings of the Vail Rocks 1999, The 37th US Symposium on Rock Mechanics (USRMS), Vail, CO, USA, 7–9 June 1999. [Google Scholar]
- Espley, S.; Langille, C.; McCreath, D.R. Innovative liner support trials in underground hardrock mines. CIM Bull. 1995, 88, 66–74. [Google Scholar]
- Ozturk, H.; Guner, D. Laboratory and distinct element analysis of the deformability behaviour of thin spray-on liners. Int. J. Rock Mech. Min. Sci. 2019, 123, 1–10. [Google Scholar] [CrossRef]
- Ozturk, H. Work of adhesion of thin spray-on liners. Rock Mech. Rock Eng. 2012, 45, 1095–1102. [Google Scholar] [CrossRef]
- Ozturk, H. Fracture mechanics interpretation of thin spray-on liner adhesion tests. Int. J. Adhes. Adhes. 2012, 34, 17–23. [Google Scholar] [CrossRef]
- Ozturk, H.; Tannant, D.D. Thin spray-on liner adhesive strength test method and effect of liner thickness on adhesion. Int. J. Rock Mech. Min. Sci. 2010, 47, 808–815. [Google Scholar] [CrossRef]
- Yilmaz, H. Development of Testing Methods for Comparative Assessment of Thin Spray-On Liner Shear and Tensile Properties; University of the Witwatersrand: Johannesburg, South Africa, 2011. [Google Scholar]
- Stacey, T.; Yu, X. Investigations into mechanisms of rock support provided by sprayed liners. In Ground Support in Mining and Underground Construction, Proceedings of the Fifth International Symposium on Ground Support, Perth, Australia, 28–30 September 2004; Villaescusa, E., Potvin, Y., Eds.; Taylor and Francis Group: London, UK, 2004; pp. 565–569. [Google Scholar]
- Goodman, R.E. Introduction to Rock Mechanics; Wiley Press: Toronto, ON, Canada, 1980. [Google Scholar]
- Li, Z.C.; Tenney, J.; Chalmers, D.; Mitra, R.; Saydam, S. Application of thin spray on liners to enhance the pre-drained coal seam gas quality. Energy Explor. Exploit. 2016, 34, 746–765. [Google Scholar] [CrossRef] [Green Version]
- Li, Z.C.; Saydam, S.; Mitra, R.; Chalmers, D. Potential use of thin spray-on liners for gas management in underground coal mines. J. South. Afr. Inst. Min. Metall. 2016, 116, 1091–1100. [Google Scholar] [CrossRef] [Green Version]
- Hussain, F.; Saydam, S.; Mitra, R.; Cinar, Y. Experimental study for reducing gas inflow by use of thin spray-on liners in underground coal mines. Min. Technol. 2012, 121, 61–67. [Google Scholar] [CrossRef]
- Li, Z.C.; Hussain, F.; Mitra, R.; Saydam, S. Effectiveness of thin spray-on liners as a gas management tool in underground coal mines. Int. J. Coal Geol. 2016, 168, 193–201. [Google Scholar] [CrossRef]
- ASTM-638; Standard Test Method for Tensile Properties of Plastic. ISTM: West Conshohocken, PA, USA, 2012. Available online: https://www.astm.org/d0638-03.html?msclkid=65946ecaced411ecbd0f70fe066c6785 (accessed on 15 May 2019).
- Rinaldi, R.G.; Boyce, M.C.; Weigand, S.J.; Londono, D.J.; Guise, M.W. Microstructure evolution during tensile loading histories of a polyurea. J. Polym. Sci. Part B Polym. Phys. 2011, 49, 1660–1671. [Google Scholar] [CrossRef]
- Iqbal, N.; Tripathi, M.; Parthasarathy, S.; Kumar, D.; Roy, P.K. Polyurea coating for enhanced blast-mitigation: A review. R. Soc. Chem. Adv. 2016, 6, 109706–109717. [Google Scholar] [CrossRef]
- Gong, S.Y.; Dou, L.M.; Xu, X.J.; He, J. Experimental study on the correlation between stress and P-wave velocity for burst tendency coal-rock samples. J. Min. Saf. Eng. 2012, 29, 67–71. [Google Scholar]
- Zeng, H.; Lv, Y.Z.; Tang, X.M.; Zou, G.G. Relationship between P-wave & S-wave and density of coal and rock in Sihe mining area. Coal Technol. 2017, 36, 101–103. [Google Scholar]
- Liu, B.; Zhao, Y.X.; Zhang, C.; Zhou, J.L.; Li, Y.T.; Sun, Z. Characteristic strength and acoustic emission properties of weakly cemented sandstone at different depths under uniaxial compression. Int. J. Coal Sci. Technol. 2021, 8, 1351–1370. [Google Scholar] [CrossRef]
- Guo, Y.X.; Zhao, Y.H.; Wang, S.W.; Feng, G.R.; Zhang, Y.J.; Ran, H.Y. Stress-strain-acoustic responses in failure process of coal rock with different height to diameter ratios under uniaxial compression. J. Cent. South Univ. 2021, 28, 1724–1736. [Google Scholar] [CrossRef]
- Hou, Y.L.; Lv, X.Y.; Zheng, G.; Huo, J.F. Stress-strain relationship of recycled aggregate concrete under uniaxial compression. Bull. Chin. Ceram. Soc. 2015, 34, 3102–3105. [Google Scholar]
- Zhang, Z.Z.; Gao, F. Experimental research on energy evolution of red sandstone samples under uniaxial compression. Chin. J. Rock Mech. Eng. 2012, 31, 953–962. [Google Scholar] [CrossRef]
- Zhang, Z.Z.; Gao, F. Experimental investigations on energy evolution characteristics of coal, sandstone and granite during loading process. J. Chin. Univ. Min. Technol. 2015, 44, 416–422. [Google Scholar]
- Liu, J.W.; Huang, B.X.; Wei, M.T. Influence of cyclic uniaxial loading on coal elastic-plastic properties and energy accumulation and dissipation. J. Liaoning Tech. Univ. 2012, 31, 26–30. [Google Scholar]


| Specimen Number | Curing Time/d | Tensile Strength/MPa | Average Tensile Strength/MPa | Elongation/% | Shore A | Shore D |
|---|---|---|---|---|---|---|
| IV-TSL12 | 7 | 23.79 | 24.44 | 526.49 | 91.5 | 45.5 |
| IV-TSL13 | 7 | 25.53 | 434.71 | 91 | 46 | |
| IV-TSL14 | 7 | 23.63 | 313.89 | 92 | 45 | |
| IV-TSL15 | 7 | 21.84 | 228.19 | 91.5 | 45 | |
| IV-TSL16 | 7 | 27.41 | 401.09 | 92 | 45.5 | |
| IV-TSL18 | 7 | NA | NA | NA | NA |
| Thickness TSL Coated mm | No. | M/g | Velocity m/s | Elastic Modulus GPa | Uniaxial Compressive Strength MPa | Density g/cm3 | |
|---|---|---|---|---|---|---|---|
| Coal | 0 | M2 | 275.5 | 1847.22 | 2.476 | 15.89 | 1.467 |
| 0 | M3 | 274.0 | 1344.86 | 2.647 | 17.62 | 1.446 | |
| 0 | 19 | 279.0 | 1837.61 | 2.356 | 13.80 | 1.467 | |
| 2 | MP1 | 276.0 | 1892.34 | 2.411 | 19.28 | 1.467 | |
| 2 | MP2 | 287.0 | 1742.40 | NA | NA | 1.470 | |
| 2 | MP3 | 271.0 | 1929.65 | 1.743 | 23.15 | 1.456 | |
| 3 | MP4 | 275.0 | 1821.82 | 2.715 | 22.03 | 1.462 | |
| 3 | MP5 | 287.0 | 1728.45 | NA | NA | 1.468 | |
| 3 | MP6 | 276.5 | 1869.53 | 2.696 | 23.31 | 1.484 | |
| 4 | MP8 | 279.5 | 1668.48 | NA | NA | 1.490 | |
| 4 | MP10 | 269.5 | 1920.42 | 2.003 | 22.34 | 1.456 | |
| 4 | MP11 | 279.0 | 1804.20 | 2.521. | 20.16 | 1.466 | |
| White Sandstone | 0 | B1 | 469.3 | 2339.52 | NA | NA | 2.433 |
| 0 | B3 | 471.0 | 2267.32 | 4.546 | 41.51 | 2.434 | |
| 0 | 38 | 471.0 | 2180.94 | 4.388 | 42.30 | 2.440 | |
| 2 | BP4 | 467.9 | 2187.54 | NA | NA | 2.436 | |
| 2 | BP5 | 466.0 | 2184.88 | 3.811 | 38.42 | 2.430 | |
| 2 | BP6 | 469.3 | 2253.59 | 3.763 | 37.92 | 2.418 | |
| 3 | BP7 | 467.9 | 2200.44 | 4.252 | 42.99 | 2.426 | |
| 3 | BP8 | 471.4 | 2275.45 | 3.879 | 40.98 | 2.452 | |
| 3 | BP9 | 472.1 | 2227.99 | 3.570 | 45.18 | 2.453 | |
| 4 | BP10 | 472.2 | 2185.14 | 4.198 | 42.36 | 2.446 | |
| 4 | BP11 | 470.2 | 2258.71 | NA | NA | 2.455 | |
| 4 | BP12 | 472.1 | 2241.89 | 4.294 | 45.30 | 2.438 | |
| Yellow Sandstone | 0 | H1 | 428.3 | 1793.17 | 3.448 | 38.28 | 2.289 |
| 0 | H2 | 428.2 | 1728.80 | 3.344 | 34.94 | 2.290 | |
| 0 | H3 | 441.7 | 1702.78 | NA | NA | 2.278 | |
| 2 | HP-4 | 427.5 | 1741.35 | 3.357 | 35.24 | 2.276 | |
| 2 | HP-5 | 448.0 | 1639.02 | NA | NA | 2.362 | |
| 2 | HP-6 | 429.5 | 1717.28 | 3.481 | 37.45 | 2.287 | |
| 3 | HP7 | 439.3 | 1717.79 | NA | NA | 2.344 | |
| 3 | HP8 | 449.4 | 1717.24 | 3.872 | 40.98 | 2.357 | |
| 3 | HP-9 | 440.0 | 1868.12 | 4.016 | 39.61 | 2.350 | |
| 4 | HP10 | 451.1 | 1718.00 | 4.197 | 42.36 | 2.361 | |
| 4 | HP-11 | 429.5 | 1725.17 | NA | NA | 2.287 | |
| 4 | HP12 | 430.5 | 1784.26 | 3.432 | 41.46 | 2.292 | |
| 5 | 5 | 440.5 | 1900.44 | 3.762 | 46.40 | 2.371 | |
| 5 | 7 | 442.5 | 2244.93 | 4.384 | 45.50 | 2.351 | |
| 5 | 20 | 444.0 | 2107.28 | NA | NA | 2.358 |
Publisher’s Note: MDPI stays neutral with regard to jurisdictional claims in published maps and institutional affiliations. |
© 2022 by the authors. Licensee MDPI, Basel, Switzerland. This article is an open access article distributed under the terms and conditions of the Creative Commons Attribution (CC BY) license (https://creativecommons.org/licenses/by/4.0/).
Share and Cite
Zhao, Y.; Fu, X.; Shi, Y.; Zhao, B.; Fu, X.; Zhang, X.; Chen, Y. Research on Mechanical Behavior and Energy Evolution of Coal and Rocks with Different Thin Spray-On Liners Thickness under Uniaxial Compressive Loading. Sustainability 2022, 14, 5909. https://doi.org/10.3390/su14105909
Zhao Y, Fu X, Shi Y, Zhao B, Fu X, Zhang X, Chen Y. Research on Mechanical Behavior and Energy Evolution of Coal and Rocks with Different Thin Spray-On Liners Thickness under Uniaxial Compressive Loading. Sustainability. 2022; 14(10):5909. https://doi.org/10.3390/su14105909
Chicago/Turabian StyleZhao, Yixin, Xiang Fu, Yangyang Shi, Bowen Zhao, Xingyu Fu, Xiufeng Zhang, and Yang Chen. 2022. "Research on Mechanical Behavior and Energy Evolution of Coal and Rocks with Different Thin Spray-On Liners Thickness under Uniaxial Compressive Loading" Sustainability 14, no. 10: 5909. https://doi.org/10.3390/su14105909