Article

Socioeconomic Status of University Students as a Limiting Factor for Various Forms of Distance Education during COVID-19 Measures

by
Vlastimil Chytrý
1,*,
Milan Kubiatko
1,
Romana Šindelářová
2 and
Janka Medová
3,*
1
Department of Preschool and Primary Education, Faculty of Education, University of Jan Evangelista Purkyně in Ústí nad Labem, 400 01 Ústí nad Labem, Czech Republic
2
Department of Orthodontics, Institute of Dental Medicine, University Hospital and First Medical Faculty of Charles University, 120 00 Prague, Czech Republic
3
Department of Mathematics, Faculty of Natural Sciences and Informatics, Constantine the Philosopher University in Nitra, Tr. A. Hlinku 1, 949 01 Nitra, Slovakia
*
Authors to whom correspondence should be addressed.
Sustainability 2022, 14(10), 5898; https://doi.org/10.3390/su14105898
Submission received: 23 March 2022 / Revised: 8 May 2022 / Accepted: 11 May 2022 / Published: 12 May 2022
(This article belongs to the Special Issue Economic and Social Consequences of the COVID-19 Pandemic)

Abstract

:
The aim of this study was to determine the influences and impacts of the socioeconomic status (SES) of families on university students and their studies during anti-pandemic measures resulting from the COVID-19 pandemic. Another aspect of the study was to investigate the various educational elements used during the course of distance teaching. This research was performed on a sample of 1280 respondents. Statistically significant differences in the case of SES grades were observed only with the following variables: (i) difficulty factor for the combined education form, (ii) age, and (iii) the duration of the teaching practice ( p < 0.05 ). The post-hoc analysis (LSD test) did not show a linear trend in the sense that the values of the respective variables also increased as the SES increased. These data proved that the higher the economic status of the family, the lower the value of the variable.

1. Introduction

Socioeconomic status (SES) is a variable expressing the position held by every person or a group of people in the structure of society (on the social ladder), and so their social stratification [1]. Socioeconomic status not only affects the factors described below, but also affects overall quality of life, which is also reflected in life expectancy [2]. The quality of life associated with SES also reflects perceptions of the school environment (with regards to the research sample, the school environment is understood as the university environment) and this can have direct and indirect impacts on a student’s achievements while studying. It is assumed that students with a low level of SES are under more pressure to meet their needs compared to students with higher levels of SES, who are mainly supported by their parents. Students with lower SES often have to work part-time while studying. Their work can also affect the learning outcomes and thus affect their perception of not only the school environment, but also of all subjects entering into mutual interactions with them. Therefore, SES is one of the main factors that can limit students’ school achievements and their perception of the school environment.
In the social sphere there are many factors, such as socioeconomic factors and political participation, that influence levels of apathy among youths in education [3]. Socioeconomic status (SES) is understood by [4] as a “status attainment model” that describes the stratification process: “inequalities in the family lead to the educational attainment inequalities that result in inequalities in employment status” (p. 441). The SES level of the family has a positive correlation with the student’s own success [5].
Students with the high level of SES have better results than those from the middle class. However, middle-class students have better results than students from low-SES families [6]. It is worth adding here that, according to other research sources, it appears to be very common for marriages (meaning married couples) to occur within the same level of education and socioeconomic background [7]. For this reason, only the head of the family is considered in several instruments. This aspect can be measured both objectively (using appropriate tools that we continue to address) and subjectively (self-rating of own position), and the result is a kind of subjective inclusion of an individual into a particular social group or class. Farooq, Chaudhry, Shafiq and Berhanu [8], and Kirkup [6] have described the influence of SES on the educational success of students. As well as other demographic factors, there are effects of SES that are still prevalent at the individual level [9]. For this reason, we consider it necessary to address this issue, although we are aware of the fact that some variables, e.g., looking at the achieved educational level of parents (this would be a very limited concept) have several flaws not only in terms of their definition but above all in their conception. For example, Caplan [10] mentions that multiple regression analysis shows no impact of parental SES on children’s school performance. In our study, the sample of university students was not only composed of full-time students (not yet being parents themselves), but also of students who were parents (often students involved in distance/combined forms of education). The findings of some studies have also suggested that not all aspects of the involvement of parents correlate with planned outcomes. For example, Henderson and Mapp [11] found that there are some forms of cooperation that have only small impacts on students’ success (communication, volunteering, some form of cooperation at school events). These studies are rather unique, as they investigate the issue of quality of education while the definition or better definition of the quality of education is almost impossible—mainly due to the constantly changing values of different attributes [8]. Parents’ educational background comprises only one third of the SES, while the other two are wealth and employment [12]. The impact of the COVID-19 epidemic on the socioeconomic status of countries around the world should not be underestimated [13]. This impact—including the impact of various sanctions—on socioeconomic status and other factors such as fragility and social participation has been studied in various parts of the world, e.g., among Afghans in Iran [14], senior citizens in Japan [15], left hijra individuals in Bangladesh [16], and the economic situation and food security of rural households in India [17]. Basu and Sen [18] tried to predict the influence of individual socioeconomic factors and to analyze country clustering on the basis of influential explanatory variables in order to find intra-cluster and inter-cluster characteristics.
The pandemic situation has caused changes in higher education globally. This situation has influenced the teaching process, resulting in the implementation of different tools of information and communication technologies (ICT) in the educational process. Teachers were forced to learn to use different virtual platforms. As Kara [19] quoted, it was possible to observe the uptake of blended learning as a new kind of teaching in higher education. Institutions required capacity-building in online learning, higher financial investment in digital infrastructure, and improvements in e-learning quality. Similar trends were mentioned in the study of Madiope and Mendy [20]; they also wrote about the importance of establishing discussion boards, developing video conferencing, and using social media in innovative ways. According to the authors, students are more motivated to learn when teachers are willing and able to use not only virtual platforms, but also if they are active on social media such as Instagram, YouTube, or Facebook. Similar results were found in other studies [21,22,23].
To measure the SES of families, it was first necessary to map which tools could be used.
The aim of our research was to identify variables that have significant impacts on SES levels. An additional aspect of our study was to determine the most popular educational elements used in distance education.
On the basis of these aims, the following research questions were established:
1. Which variables (F1–F12—see Section 2) have a significant effect on the SES level of students?
2. What is the most popular educational element in distance education according to students?

2. Materials and Methods

2.1. Measuring Socioeconomic Status

We focused primarily on the objective possibility of measuring the socioeconomic status of households. It should be noted that a number of tools for mapping SES require some specific information that the involved respondents may be reluctant to share. This issue was closely followed by Hauser and Carr [24], who found that in order to map SES, researchers surveyed the following aspects: (i) education (81%), (ii) income (73%), (iii) labour market position (46%), and (iv) prestige of profession (24%). Keidl and Hošková [25] addressed the issue of the percentage distribution and numbers of cases of particular variables such as education, social class, professional prestige, labor market position, income, poverty, financial distress, and wealth.
Obviously, the instruments analyzed here are highly varied, making the identification of SES more demanding and complicated. Therefore, it is necessary to work with some tools comprised of a limited number of input variables that can be credibly queried, for example, over the phone. However, this has shown that the most commonly used socioeconomic indicators such as income, education, and occupation may not adequately describe socioeconomic status [26,27]. There is a consensus that wealth is an essential and probably the most appropriate indicator of SES, but only for older adults, as in this age group wealth may not correspond to income, which decreases over time [28]. Different SES benchmarks are differently related to the age trend of social inequalities in health, as they take into account different aspects of the social stratification process [29]. Therefore, we have continued working with the ABCDE classification described below. The basis of the ABCDE classification, according to the Nielsen Admosphere specification, is the so-called socioeconomic score of the household. It is an aggregation of input household information as a continuous score (index), expressing an expected (based on the mentioned input household information) level of household income in relation to its composition. Variables such as the reference income gradually enter this classification, where the income index is calculated in conjunction with the household income in the end. The ABCDE classification, according to Nielsen Admosphere Corp., is defined as the categorization of the socioeconomic scores of households. It contains the following eight categories: A, B, C1, C2, C3, D1, D2, and E, defined as octiles of the socioeconomic score in the population of all Czech households. This calculation is based on the respondents’ answers to a total of 7 multiple-choice questions: (i) number of household members, (ii) number of household members aged 0–18, (iii) region of the household, (iv) highest completed education of the head of household, (v) professional status of the head of household, (vi) number of economically active household members, and (vii) household equipment.

2.2. Data Processing

Data processing was performed on the basis of online tools, where individual students were approached both in the course of teaching and also through a bulk email (using students’ university email addresses). Overall, 1283 respondents were included in the data matrix (men 259; 20%, women 1024; 80%) who studied in both full-time and combined forms of study. If one of the students did not answer all the questions within each of the instruments, they were excluded from the data matrix. The primary focus was put on mapping their socioeconomic status, and so, universities were selected from regions with the maximum diversity of citizens relative to their area. Table 1 shows how the socioeconomic score of the household was mapped using the ABCDE classification, as mentioned above.
The differences between the different groups of respondents were always observed in terms of comparing multiple independent groups according to the ABCDE classification only. Due to the scope of the file, the nature of the data, and the assumed validity of the central limit sentence, we performed analyses using parametric statistical methods. The data evaluation was carried out by compiling a regression model including the following 12 factors: F1—Satisfaction with distance learning, F2—Difficulty factor for the full-time form, F3—Evaluation factor for the full-time form, F4—Activity factor for the full-time form, F5—Difficulty factor for the combined form, F6—Evaluation factor for the combined form, F7—Activity factor for the combined form, F8—Perception of the distance learning through negatives, F9—Perception of distance learning through positives, F10—Socio-economic status, F11—Age, F12—Duration of the educational practice.
In total, five tools were piloted prior to testing. These tools were based on the Likert scale [30] or the semantic differential. Due to this reason, the coefficient of Cronbach α [31,32] was calculated, detecting the intrinsic consistency of the instrument—achieving values at an interval of ⟨0,1⟩ with generally acceptable coefficient values of between 0.7 and 0.95 [33]. The split-half reliability can also be used.
The values calculated for each instrument were as follows: (a) Satisfaction with distance form of instruction ( α cr = 0.829 , split half = 0.838 ), (b) Perception of distance learning through positives ( α cr = 0.802 , split half = 0.874 ), (c) Perception of distance learning through negatives ( α cr = 0.840 , split half = 0.0861 ), (d) Relationship to the full-time study form ( α cr = 0.677 , split half = 0.773 ), (e) Relationship to the combined study form ( α cr = 0.732 , split half = 0.854 ), (f) Socioeconomic household score (reliability is not measured here). The code in SPSS provided by Nielsen Admosphere Corp. used for calculation is in the Appendix A.
The analysis used both descriptive and inductive analyses, where we worked primarily with Parametric Scale Analysis (ANOVA) due to the validity of the central limit theorem. The statistical significance values were supplemented by material significance values and confidence intervals. All the statistical analyses were performed using Statistica 13.3 (StatSoft Inc., Tulsa, OK, USA) and SPSS 15.0 (SPSS Inc., Chicago, IL, USA).

3. Results

The data were evaluated both descriptively and inductively. First, we proceeded by working with all the variables (total data matrix), and then we carried out more precise analyses according to the significance of the conclusions. The basic descriptive analysis for these variables is summarised in Table 2.
Based on the parametric analysis of variance, we came to the conclusions given in Table 3. This table is supplemented by material significance values (partial eta-squared) as well as confidence intervals. As part of the calculations, we always proceeded so that if it was possible to generalize the conclusions to at least a 5% materiality level ( p < 0.05 ), the post-hoc analysis values (LSD test) comparing all the options were then calculated.
According to the values in Table 4, statistically significant differences for the different grades of SES were observed for the variables: (i) difficulty factor for the combined form, (ii) age, and (iii) the duration of the educational practice. As the intensity factor (F5) was crucial in this context, the analysis is supplemented by a quartilation chart (Figure 1).
The data displayed in the chart (Figure 1) show that although the average values were almost comparable, the biggest differences occurred mainly in the upper quartile. In the case of the last group (E), the degradation in the area of the lower quartile was also noticeable, resulting in an expansion of the interquartile range. The SES affected only one of the variables, but it also remained significant in terms of material significance. If we were working on a 10% level of significance, then it was possible to work with the variables F2—Characteristics factor for the attendance form, and F7—Activity factor for the combined form. In both cases, the effect was medium sized in terms of material significance. The difficulty factor thus appears to be a crucial factor influenced by the respondent’s SES. For a more detailed description of the post-hoc analysis, the descriptive analysis values demonstrating dependence for variables where the difference was significant at least at the 10% materiality level (F2) were reported. F5, F7, F11, and F12 are presented (Table 4).
Based on this descriptive analysis, it was possible to adjust the post-hoc analysis using inequalities as follows:
  • F2—LSD test: 2 < 4 **, 3 > 5 **, 4 > 5 ***, 5 < 6 **, 5 < 7 **
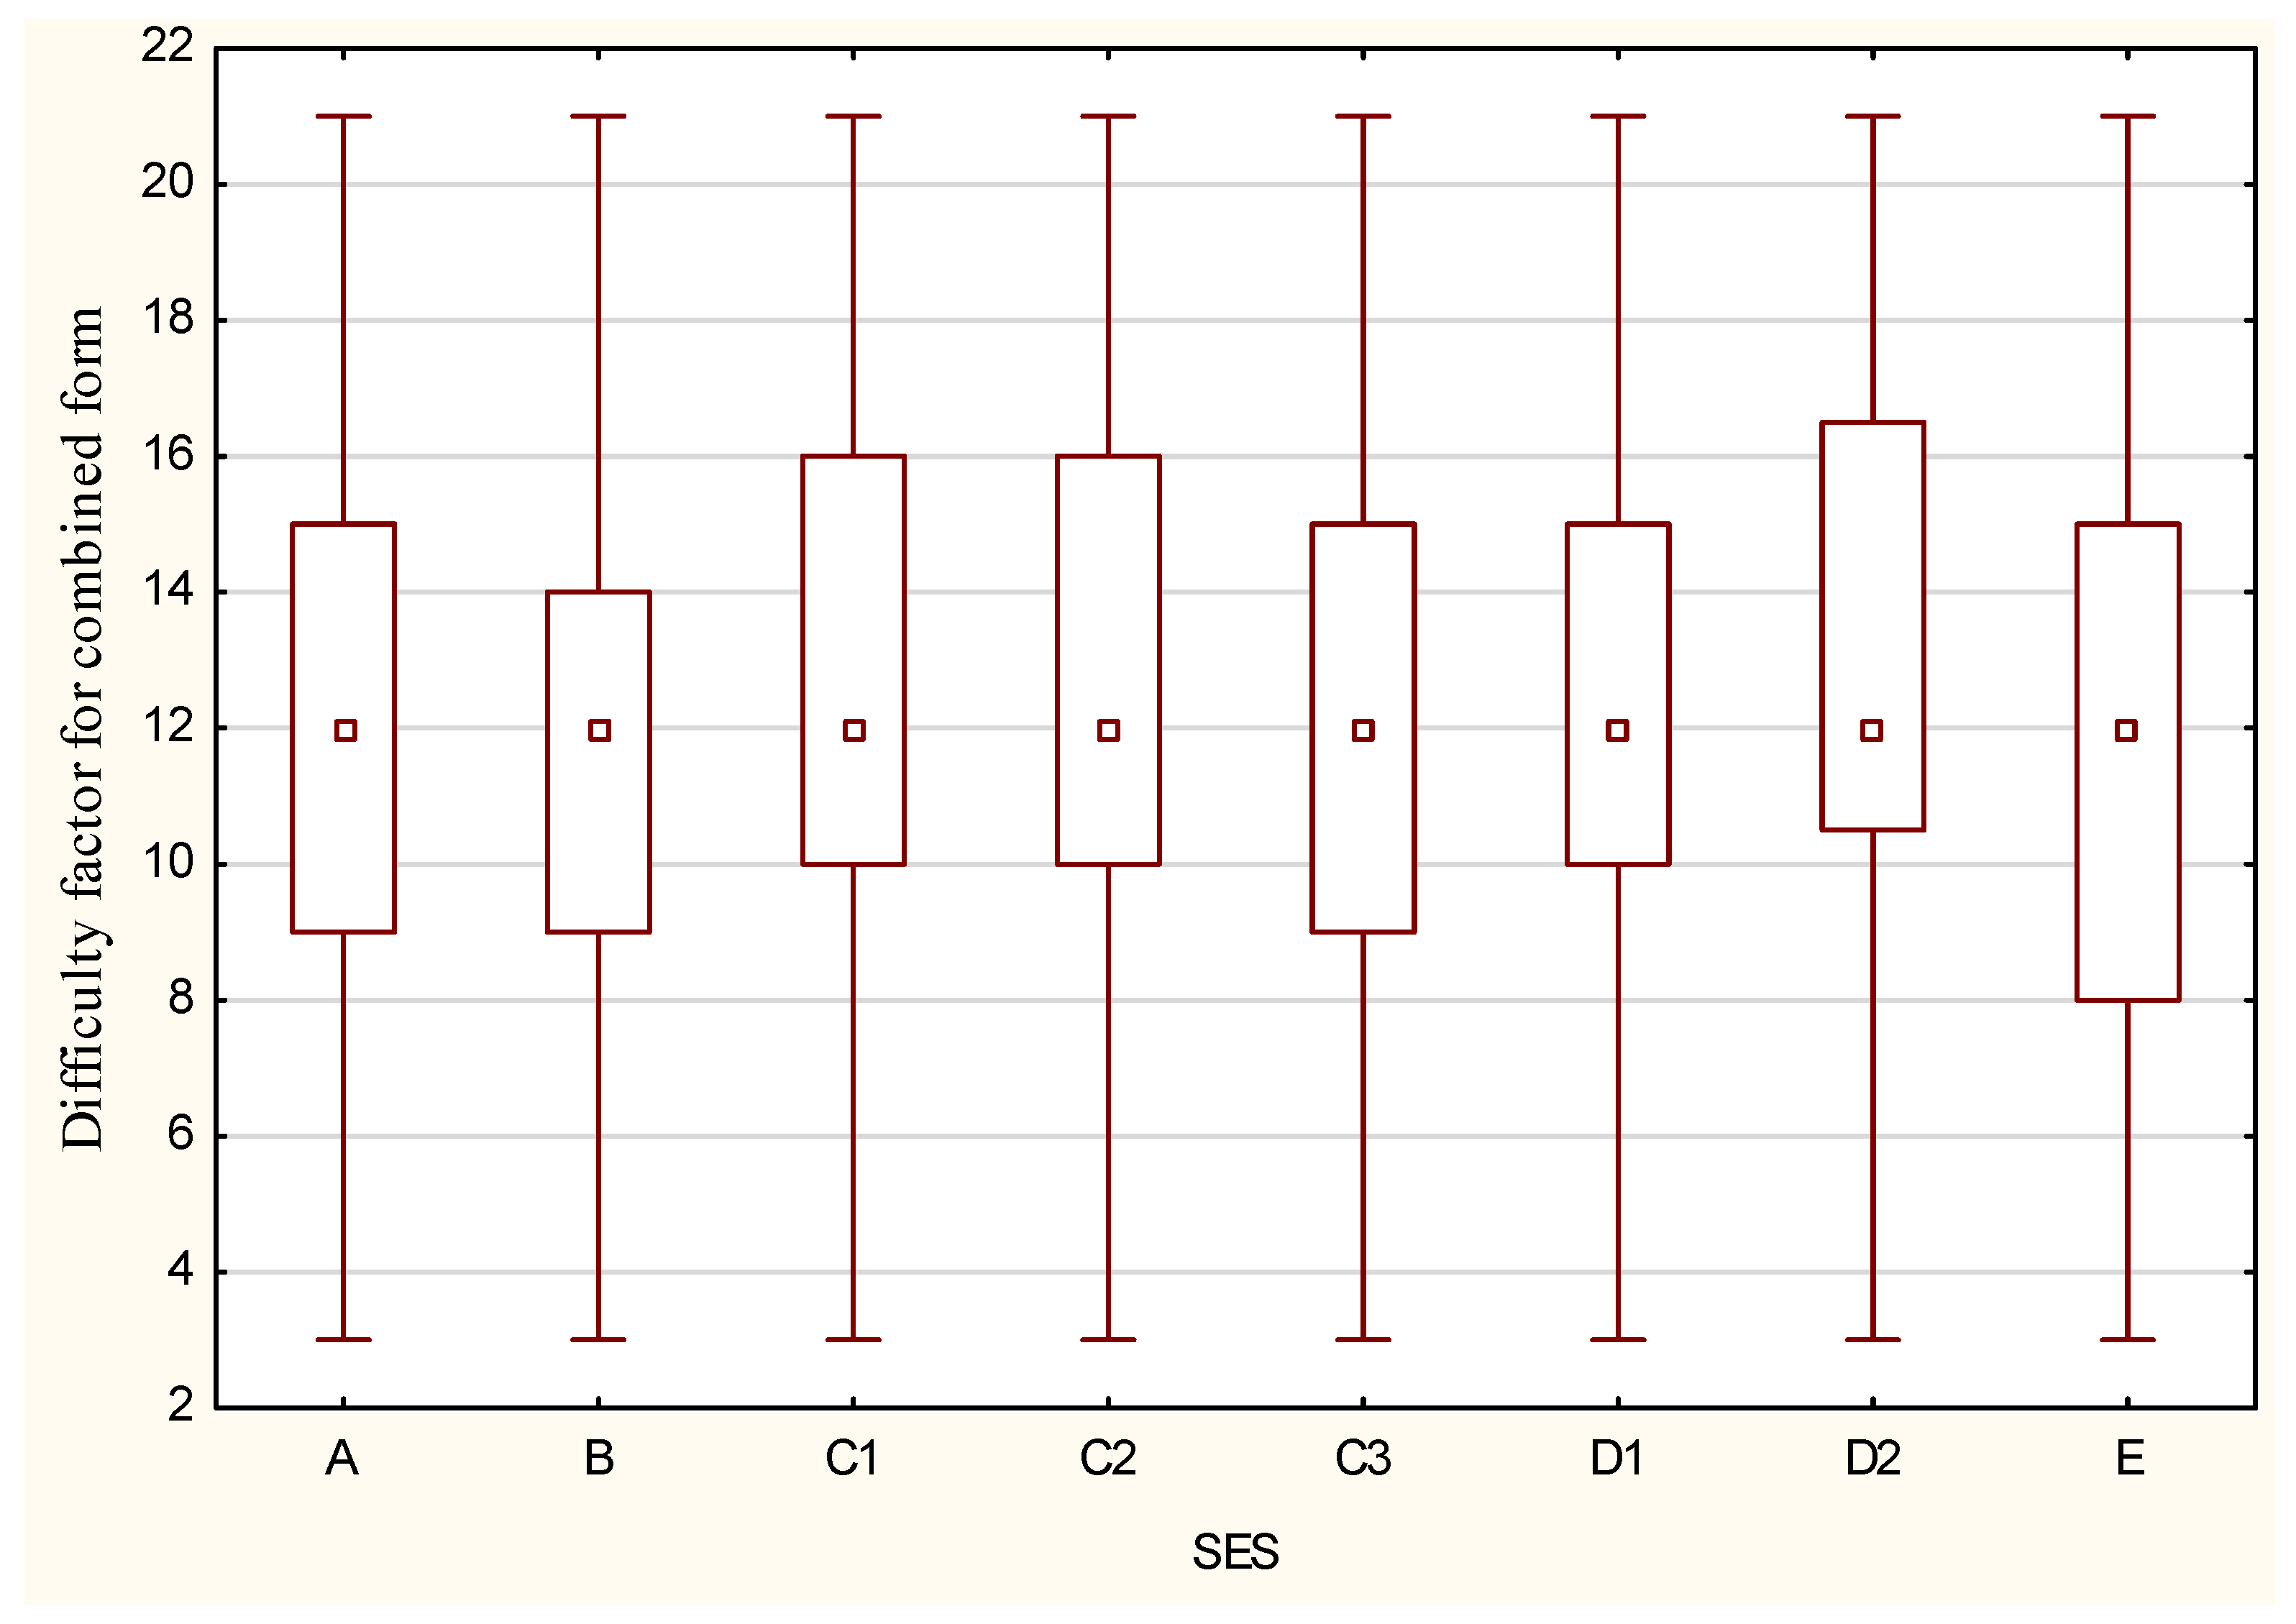
  • F5—LSD test: 1 < 3 ***, 1 < 4 **, 1 < 5 **, 1 < 6 **, 1 < 7 ***, 2 < 3 **, 2 < 7 ***, 2 < 4 *, 2 < 6 *, 3 > 8 *
  • F7—LSD test: 1 < 3 **, 2 < 3 ***, 2 < 7 **, 3 > 5 **, 3 > 6 **
  • F11—LSD test: 2 > 4 ***, 2 > 5 **, 2 > 6 **, 2 > 8 ***, 7 > 8 **, 2 > 3 *, 4 < 7 *, 1 > 8 *
  • F12—LSD test: 1 > 3 **, 1 > 6 ***, 2 > 6 **, 3 < 5 **, 4 > 6 **, 5 > 6 ***, 6 < 7 **, 2 > 3 *, 3 < 7 *
It was not possible to follow a purely linear trend in either of these areas. In the case of the most closely investigated variable, F5, the trend changed only between ratings of 3–8 in terms of SES. For this variable, it was possible to read from the data that the higher the economic status of the family, the lower the value of the variable F5—Difficulty factor for the combined form. For other variables, there was a change in inequalities, and so it was not possible to attribute individual differences to the linear form of the trend.
In addition to the aforementioned issue, the possibility of participants working with supporting material, as defined in the table below, was also tested. Respondents on a scale of 1–5 chose which elements they considered innovative (1—very innovative, 5—not innovative at all). Option N meant that they did not encounter this element during the distance form of education. The combination of two answers, e.g., 1N means that while they have not encountered the element, they consider it innovative.
The data displayed in Table 5 show that the vast majority of respondents did not encounter many of the educational tools supporting distance education at all, which is alarming to some extent, since the assumptions for the distance form of education due to the COVID-19 pandemic were declared well in advance. Moreover, this form of education ran for a longer time. For this reason, this issue developed, and the respondent had the opportunity to comment on the appropriateness of including aids in their course. Again, on a scale of 1–5, students chose which elements they would include in their future teaching (1—suitable for teaching, 5—not suitable for teaching). Option N means that the students did not encounter the tool during the distance form of education. It is possible to choose two options such as 1N, meaning that respondent considered the platform suitable for education, but their teachers did not use it during distance education.
Based on the data in Table 6, the respondents listed more technological tools than those listed in the questionnaire. The tool considered most necessary by students was the involvement of a practitioner through online tools such as MS Teams, which is probably because this tool is the most used in primary and secondary schools in the Czech Republic.

4. Discussion

Socioeconomic status (SES), in terms of satisfaction in higher education schemes during the pandemic period related to the COVID-19 disease and its variations, may have been associated with the perception of distance education through various factors (presented in the methodological and outcome parts of the study). The aim of this research was to identify variables that had a significant impact on SES levels. An additional objective was to find out which educational elements have been used in the distance learning mode. The reason for the inclusion of this objective can be found in its indirect relationship with SES.
Among these factors, age was significant. Younger respondents achieved significantly higher SES scores, and additionally, this could be also translated into some satisfaction with distance learning. On the other hand, younger respondents achieved higher levels of SES compared to older respondents. This variable is only complementary because it is a variable that has an unrelated effect in this context, because the respondents carry out economic activity only to a limited extent, and their expression of SES is that defined by their household—which they share with other members of their household. Similar findings have been reported by other authors [34,35,36,37,38]. As mentioned above, all authors—not only those mentioned, but also others who work with age as a variable—thus relate younger respondents’ SES to other people, and cite as a limitation that the economic situation of their parents has a direct impact on their SES level.
Another important factor affecting SES was the duration of the educational practice. The reason for introducing this variable into the research survey was that the research sample consisted not only of students in the full-time form of studying, but also in the combined form. Moreover, many full-time students were involved in some form of employment at the time of completing the research instrument. The results are inconsistent, sometimes with higher levels of SES by respondents with shorter periods of experience and sometimes with longer periods of work experience. The reason why there is incoherence in the results may be due both to the age of the respondents and who the respondents live with. For respondents who had a short period of experience and achieved a higher level of SES than respondents with a longer period of experience, the presence of other family members in the household could be a limiting factor. As the asset targeted by the questionnaire item was a part of a household, respondents included the household SES, which could cause a higher level of SES compared to respondents with a longer work experience; this is because respondents with longer work experience are likely to have become independent from their parents, and therefore their SES level was low. Respondents with the longest periods of work experience had a higher level of SES compared to the respondents who already have a certain amount of work experience, but as in the previous case, respondents who had only a certain amount of work experience and had recently become independent had a lower SES level. There are a small number of studies dealing with similar issues, but even so, the authors mention similar findings to those mentioned above [39,40].
The last factor that emerged as significant for SES levels was the difficulty factor for the combined form of learning. Respondents who rated the combined form as less demanding thus achieved a higher level of SES than respondents who perceived a higher intensity. These findings may also be related to the availability of information and communication technology equipment required for distance learning. This rationale can also be supported by the work of the Chiao and Chiu [41], who stated that it is the ability of students to work with ICT technology that is of higher value—or not, with the standard equipment of students using teaching aids—that has a positive effect on the success of students in coping with their studies; but also, the students who possess this ability are more positive about the teaching process and perceive it to be less demanding. Ortiz-Jimenez et al. [42] reported that respondents with better equipment achieved higher scores in perceived intensity, which in this context should be the opposite. On the other hand, Trung et al. [43] also addressed the issue of SES and the complexity of teaching in a combined form, presenting a similar result as is found in our work. Therefore, it is possible to confirm what has been suggested in other communication channels, that if students do not have adequate equipment, or if they have problems connecting to online education, they do not receive adequate information and their satisfaction with lessons is at a low level.
In the results presented, attention was also paid to the various educational elements that were used in teaching. The highest scores were achieved by elements such as Microsoft Teams, BigBlueButton, Zoom, and Google Meet. The listed applications were also among the most frequently used. This is also mentioned in other research papers that have addressed similar issues [44,45,46]. The authors cited simple usage, information sharing, and student satisfaction with the apps as the reasons for their use. It is clear in the research results that elements such as MOOC, Ted Talks, or others, are used to a small extent. Related to this may be the ignorance of these applications and how they can be used with respect to distance learning. Alternatively, a certain intensity in using these less-used apps, as well as their financial availability, may indirectly affect their use.
Even though we focus primarily on socioeconomic scores in this study, there were more domains negatively impacted by the COVID-19 pandemic, e.g., work with international students [47], research [48], and sports activities [49]. Besides this, students encountered depression, anxiety, and stress caused by learning with technology [50,51]. A lot of adolescent students struggled to adapt psychosocially during the pandemic [52].

5. Conclusions

Socioeconomic status is one of the variables that often features in research investigations, not only in socio-science research, but also in research in medical sciences. SES has proved particularly important in terms of the duration of work experience, but much more significant is the effect of the perceived intensity of combined teaching that indirectly suggests that ICT household equipment or internet access is crucial in managing distance learning, and this is also linked to perceived difficulties. Therefore, based on these findings, interventions at the state level, or the lower municipal level, could come into consideration. These would allow access to adequate technology used in the distance form of instruction for all students—especially those from backgrounds with limited financial resources, which limit them in the distance form of education.

Author Contributions

Conceptualization, V.C., M.K. and J.M.; methodology, V.C. and M.K.; software, V.C.; validation, V.C., M.K. and J.M.; formal analysis, V.C.; investigation, V.C.; data curation, V.C. and M.K.; writing—original draft preparation, V.C. and M.K.; writing—review and editing, R.Š. and J.M.; visualization, V.C. and M.K.; supervision, V.C. and M.K.; project administration, V.C. and M.K.; funding acquisition, V.C. and M.K. All authors have read and agreed to the published version of the manuscript.

Funding

The research was supported by the Smart City—Smart Region—Smart Community project OP VVV, PO1, N. CZ.02.1.01/0.0/0.0/17_048/0007435.

Institutional Review Board Statement

The study was conducted in accordance with the Declaration of Helsinki, and approved by the or Ethics Committee of Jan Evangelista Purkyne University in Usti nad Labem, Czech Republic (reference number 3/2022/01, 21 March 2022).

Informed Consent Statement

Informed consent was obtained from all subjects involved in the study.

Data Availability Statement

Data presented in the study are available on demand from the first author (V.C.).

Conflicts of Interest

The authors declare no conflict of interest.

Appendix A. SPSS Code Used for Calculation of Socio-Economic Status

  • if (work_status = 1) score = −4078.
  • if (work_status = 2) score = −2384.
  • if (work_status = 3) score = 499.
  • if (work_status = 4) score = 0.
  • if (work_status = 5) score = 3598.
  • if (work_status = 6) score = 8101.
  • if (work_status = 7) score = 16,224.
  • if (work_status = 8) score = 6021.
  • if (work_status = 9) score = 8925.
  • if (work_status = 10) score = 16,224.
  • compute score = score + 5159 + 5713 × (cnt_all − cnt0_18) + 1394 × cnt0_18 + 5465 × cnt + econ.
  • compute score = score + 2851 × car10 + 1712 × cottage + 1425 × internet + 968 × drill + 230 × micro.
  • compute score = score/(9000 + 9000 × (cnt_all − cnt0_18) + 4500 × cnt0_18) × 1.0102
  • if (education = 1) score = score × 0.8965.
  • if (education = 2) score = score × 0.9521.
  • if (education = 3) score = score × 1.0000.
  • if (education = 4) score = score × 1.0893.
  • if (education = 5) score = score × 1.2336.
  • if (region = 1) score = score × 1.1050.
  • if (region = 2) score = score × 0.9977.
  • if (region = 3) score = score × 0.9598.
  • if (region = 4) score = score × 0.9819.
  • if (region = 5) score = score × 0.9430.
  • if (region = 6) score = score × 0.9621.
  • if (region = 7) score = score × 0.9686.
  • if (region = 8) score = score × 0.9627.
  • if (region = 9) score = score × 0.9534.
  • if (region = 10) score = score × 0.9616.
  • if (region = 11) score = score × 0.9875.
  • if (region = 12) score = score × 0.9561.
  • if (region = 13) score = score × 0.9528.
  • if (region = 14) score = score × 0.9689.
  • execute.

References

  1. Mueller, C.W.; Parcel, T.L. Measures of socioeconomic status: Alternatives and recommendations. Child Dev. 1981, 52, 13–30. [Google Scholar] [CrossRef]
  2. Hnilica, K. Influences of socio-economic status and natural disaster on health and life satisfaction. Cesk. Psychol. 2006, 5, 16–35. [Google Scholar]
  3. Ahmad, S.; Maqsood, F.; Waseer, W.A. The role of apathy, personal insecurity, and socio-economic status in formation of risk-taking behavior among university students. J. Hum. Behav. Soc. Environ. 2017, 28, 221–239. [Google Scholar] [CrossRef]
  4. Sieben, I.J.P.; Graaf, P. Testing the modernization hypothesis and the socialist ideology hypothis: A comparative sibling analysis of educational attainment and occupational status. Br. J. Sociol. 2001, 52, 441–467. [Google Scholar] [CrossRef] [PubMed] [Green Version]
  5. Jeynes, W.H. Examining the effects of parental absence on the academic achievement of adolescents: The challenge of controlling for family income. J. Fam. Econ. Iss. 2002, 23, 56–65. [Google Scholar] [CrossRef]
  6. Kirkup, J. Middle-Class Children Resentful at Being Pushed to Succeed, Poll Shows. 2008. Available online: http://www.telegraph.co.uk/education/3330301/Middleclasschildren-resentful-at-being-pushed-to-succeedpoll-shows.html (accessed on 30 November 2019).
  7. Fortado, D.; Theodoropoulos, N. Interethnic marriage: A choice between ethnic and educational similarities. J. Popul. Econ. 2011, 24, 1257–1279. [Google Scholar] [CrossRef] [Green Version]
  8. Farooq, M.S.; Chaudhry, A.H.; Shafiq, M.; Berhanu, G. Factors affecting students’ quality of academic performance: A case of secondary school level. J. Qual. Technol. Manag. 2011, 7, 1–14. [Google Scholar]
  9. Capraro, M.M.; Capraro, R.M.; Wiggins, B.B. An Investigation of the Effect of Gender, Socioeconomic Status, Race and Grades on Standardized Test Scores. 2000. Available online: https://eric.ed.gov/?id=ED444867 (accessed on 15 August 2019).
  10. Caplan, N.; Choy, M.; Whitmore, J. Indochinese refugee families and academic achievement. Sci. Am. 1992, 266, 36–42. [Google Scholar] [CrossRef]
  11. Henderson, A.; Mapp, K. A New Wave of Evidence: The Impact of School, Family, and Community Connections on Student Achievement. 2002. Available online: https://files.eric.ed.gov/fulltext/ED474521.pdf (accessed on 8 August 2019).
  12. Rindermann, H.; Baumeister, A.E.E. Parents’ SES vs. parental educational behavior and children’s development: A reanalysis of the Hart and Risley study. Learn. Individ. Differ. 2015, 37, 133–138. [Google Scholar] [CrossRef]
  13. Oshinubi, K.; Rachdi, M.; Demongeot, J. Modeling of COVID-19 Pandemic vis-à-vis Some Socio-Economic Factors. Front. Appl. Math. Stat. 2022, 7, 786983. [Google Scholar] [CrossRef]
  14. Shafaei, A.; Block, K. COVID-19 and Sanctions Affecting Afghans in Iran. J. Immigr. Refug. Stud. 2022, 1–13. [Google Scholar] [CrossRef]
  15. Ozone, S.; Goto, R.; Kawada, S.; Yokoya, S. Frailty and social participation in older citizens in Japan during the COVID-19 pandemic. J. Gen. Fam. Med. 2022, 1–6. [Google Scholar] [CrossRef]
  16. Sifat, R.I.; Ahmed, F.; Miah, M.R.A.; Khisa, M. Effects of COVID-19 on Livelihood, Health, and Psychology of Hijra Population: Insights from Dhaka, Bangladesh. J. Homosex. 2022, 1–17. [Google Scholar] [CrossRef] [PubMed]
  17. Suresh, V.; Fishman, R.; von Lieres, J.S.; Rao, B.R. Impact of the COVID-19 lockdown on the economic situation and food security of rural households in India. J. Agribus. Dev. Emerg. Econ. 2022, 12, 491–509. [Google Scholar] [CrossRef]
  18. Basu, S.; Sen, S. COVID 19 Pandemic, Socio-Economic Behaviour and Infection Characteristics: An Inter-Country Predictive Study Using Deep Learning. Comput. Econ. 2022, 1–32. [Google Scholar] [CrossRef]
  19. Kara, A. COVID-19 Pandemic and Possible Trends for the Future of Higher Education: A Review. J. Educ. Educ. Dev. 2021, 8, 9–26. [Google Scholar] [CrossRef]
  20. Madiope, M.; Mendy, J.; Pool, B.; Lincoln, L. Analysis Of Current Trends In Distance Education During Covid-19: A South African Higher Education Context. Online J. Distance Educ. E-Learn. 2021, 9, 1–7. [Google Scholar]
  21. Mok, K.H.; Montgomery, C. Remaking higher education for the post-COVID-19 era: Critical reflections on marketization, internationalization and graduate employment. High. Educ. Q. 2021, 75, 373–380. [Google Scholar] [CrossRef]
  22. Mishra, S.; Sahoo, S.; Pandey, S. Research trends in online distance learning during the COVID-19 pandemic. Distance Educ. 2021, 42, 494–519. [Google Scholar] [CrossRef]
  23. Cesco, S.; Zara, V.; De Toni, A.F.; Lugli, P.; Betta, G.; Evans, A.C.; Orzes, G. Higher Education in the First Year of COVID-19: Thoughts and Perspectives for the Future. Int. J. High. Educ. 2021, 10, 285–294. [Google Scholar] [CrossRef]
  24. Hauser, R.M.; Carr, D. Measuring Poverty and Socioeconomic Status in Studies of Health and Well-Being; Working Paper; University of Wisconsin: Madison, WI, USA; Center for Demography and Ecology: Madison, WI, USA, 1994; Available online: http://www.ssc.wisc.edu/cde/cdewp/94-24.pdf (accessed on 24 January 2008).
  25. Kreidl, M.; Hošková, L. Strategie měření socioekonomického statusu a zdraví v sociologických publikacích. Data A Výzkum 2008, 2, 131–154. [Google Scholar]
  26. Allin, S.; Masseria, C.; Mossialos, E. Measuring socioeconomic differences in use of health care service by wealth versus income. Am. J. Public Health 2009, 99, 1849–1855. [Google Scholar] [CrossRef] [PubMed]
  27. Grundy, E.; Holt, G. The socioeconomic status of older adults: How should we measure it in studies of health inequalities? J. Epidemiol. Commun. Health 2001, 55, 895–904. [Google Scholar] [CrossRef] [PubMed] [Green Version]
  28. Duncan, G.J.; Daly, M.C.; McDonough, P.; Williams, D.R. Optimal indicators of socioeconomic status for health research. Am. J. Public Health 2002, 92, 1151–1157. [Google Scholar] [CrossRef] [PubMed]
  29. Acciai, F. The age pattern of social inequalities in health at older ages: Are common measures of socio-economic status interchangeable? Public Health 2018, 157, 135–141. [Google Scholar] [CrossRef]
  30. Likert, R. A technique for the measurement of attitudes. Arch. Psychol. 1932, 22, 5–55. [Google Scholar]
  31. Cronbach, L.J.; Meehl, P.E. Construct validity in psychological tests. Psychol. Bull. 1955, 52, 281–302. [Google Scholar] [CrossRef] [Green Version]
  32. Rubio, D.M. Alpha reliability. In Encyclopedia of Social Measurement, 1st ed.; Kempf-Leonard, K., Ed.; Elsevier: Amsterdam, The Netherlands, 2005; pp. 59–63. [Google Scholar]
  33. Tavakol, M.; Dennick, R. Making sense of Cronbach’s alpha. Int. J. Med. Educ. 2011, 2, 53–55. [Google Scholar] [CrossRef]
  34. Cueto, S.; Guerrero, G.; Leon, J.; Zapata, M.; Freire, S. The relationship between socioeconomic status at age one, opportunities to learn and achievement in mathematics in fourth grade in Peru. Oxf. Rev. Educ. 2014, 40, 50–72. [Google Scholar] [CrossRef]
  35. Spengler, M.; Brunner, M.; Damian, R.I.; Lüdtke, O.; Martin, R.; Roberts, B.W. Student characteristics and behaviors at age 12 predict occupational success 40 years later over and above childhood IQ and parental socioeconomic status. Dev. Psychol. 2015, 51, 1329. [Google Scholar] [CrossRef]
  36. Butler, Y.G.; Le, V.N. A longitudinal investigation of parental social-economic status (SES) and young students’ learning of English as a foreign language. System 2018, 73, 4–15. [Google Scholar] [CrossRef]
  37. Li, W.; Zeng, X.; Wang, Y.; Curtis, R.; Sparks, E. Does school matter for students’ self-esteem? Associations of family SES, peer SES, and school resources with Chinese students’ self-esteem. Res. Soc. Stratif. Mobil. 2021, 71, 100565. [Google Scholar] [CrossRef]
  38. Li, S.; Xu, Q.; Xia, R. Relationship between SES and academic achievement of junior high school students in China: The mediating effect of self-concept. Front. Psychol. 2020, 10, 2513. [Google Scholar] [CrossRef] [PubMed]
  39. Ayalon, L. Subjective socioeconomic status as a predictor of long-term care staff burnout and positive caregiving experiences. Int. Psychogeriatr. 2008, 20, 521–537. [Google Scholar] [CrossRef] [PubMed]
  40. Ferro, R.; Besostri, A.; Olivieri, A.; Stellini, E.; Denotti, G.; Campus, G. Caries experience in 14-year-olds from Northeast Italy. Is socioeconomic-status (SES) still a risk factor? Eur. J. Paediatr. Dent. 2012, 13, 46–52. [Google Scholar]
  41. Chiao, C.; Chiu, C.H. The mediating effect of ICT usage on the relationship between students’ socioeconomic status and achievement. Asia-Pac. Educ. Res. 2018, 27, 109–121. [Google Scholar] [CrossRef]
  42. Ortiz-Jiménez, L.; Figueredo-Canosa, V.; Castellary López, M.; López Berlanga, M.C. Teachers’ perceptions of the use of ICTs in the educational response to students with disabilities. Sustainability 2020, 12, 9446. [Google Scholar] [CrossRef]
  43. Trung, T.; Hoang, A.D.; Nguyen, T.T.; Dinh, V.H.; Nguyen, Y.C.; Pham, H.H. Dataset of Vietnamese student’s learning habits during COVID-19. Data Brief 2020, 30, 105682. [Google Scholar] [CrossRef]
  44. Kristóf, Z. International trends of remote teaching ordered in light of the coronavirus (COVID-19) and its most popular video conferencing applications that implement communication. Cent. Eur. J. Educ. Res. 2020, 2, 84–92. [Google Scholar] [CrossRef]
  45. Nguyen, H.U.N.; Duong, L.N.T. The challenges of e-learning through Microsoft Teams for EFL students at Van Lang University in COVID-19. AsiaCALL Online J. 2021, 12, 18–29. [Google Scholar]
  46. Sidpra, J.; Gaier, C.; Reddy, N.; Kumar, N.; Mirsky, D.; Mankad, K. Sustaining education in the age of COVID-19: A survey of synchronous web-based platforms. Quant. Imaging Med. Surg. 2020, 10, 1422. [Google Scholar] [CrossRef] [PubMed]
  47. Firang, D.; Mensah, J. Exploring the Effects of the COVID-19 Pandemic on International Students and Universities in Canada. J Int Stud. 2021, 12, 1–18. [Google Scholar] [CrossRef]
  48. Pavlíková, M.; Sirotkin, A.; Králik, R.; Petrikovičová, L.; Martin, J.G. How to Keep University Active during COVID-19 Pandemic: Experience from Slovakia. Sustainability 2021, 13, 10350. [Google Scholar] [CrossRef]
  49. Harangi-Rákos, M.; Pfau, C.; Bácsné Bába, É.; Bács, B.A.; Kőmíves, P.M. Lockdowns and Physical Activities: Sports in the Time of COVID. Int. J. Environ. Res. Public Health 2022, 19, 2175. [Google Scholar] [CrossRef]
  50. Al-Wesabi, F.N.; Alsolai, H.; Hilal, A.M.; Hamza, M.A.; Duhayyim, M.A. Machine learning based depression, anxiety, and stress predictive model during covid-19 crisis. Comput. Mater. Contin. 2022, 70, 5803–5820. [Google Scholar] [CrossRef]
  51. Vojteková, J.; Tirpáková, A.; Gonda, D.; Žoncová, M.; Vojtek, M. GIS Distance Learning during the COVID-19 Pandemic (Students’ Perception). Sustainability 2021, 13, 4484. [Google Scholar] [CrossRef]
  52. Wang, M.T.; Henry, D.A.; Scanlon, C.L.; Del Toro, J.; Voltin, S.E. Adolescent Psychosocial Adjustment during COVID-19: An Intensive Longitudinal Study. J. Clin. Child Adolesc. Psychol. 2022, 1–16. [Google Scholar] [CrossRef]
Figure 1. Difficulty factor values for the combined form, depending on SES.
Sustainability 14 05898 g001
Table 1. Assessment of the household socioeconomic score.
CategoriesSocioeconomic Score
of Household
Number of Students
FromTo
A1.379-----94
B1.1831.378191
C11.0641.182148
C20.9661.063182
C30.8660.965194
D10.7390.865244
D20.6310.738144
E-----0.63082
Table 2. Basic Descriptive Analysis.
AverageMedianModeSDMaxMin
F1 Satisfaction with distance learning23.2624.0030.008.1940.008.00
F2 Difficulty factor for the full-time form11.9212.0012.004.2121.003.00
F3 Evaluation factor for the full-time form10.4911.0012.004.1321.003.00
F4 Activity factor for the full-time form10.6611.0012.003.821.003.00
F5 Difficulty factor for the combined form12.3912.0012.004.3821.003.00
F6 Evaluation factor for the combined form11.1412.0012.004.1921.003.00
F7 Activity factor for the combined form11.4412.0012.003.2721.003.00
F8 Perception of the distance learning through negatives31.3230.0027.009.8360.0012.00
F9 Perception of distance learning through positives16.7116.008.007.2940.008.00
F11 Age26.7223.0021.008.5259.0019.00
F12 Duration of the educational practice3.710.000.006.0045.000.00
Table 3. Analysis of variance with post-hoc analysis.
SS EffectMS EffectSS ErrorMS ErrorFpPartial
Eta-Squared
Conf. Int.
Lower L.
Conf. Int.
Upper L.
F1566.8080.9785,355.5067.161.210.300.007S0.0000.012
F2243.0234.7222,346.1017.581.970.06 *0.011M0.0000.019
LSD test2–4 **, 3–5 **, 4–5 ***, 5–6 **, 5–7 **
F380.2611.4721,667.4017.050.670.700.004S0.0000.007
F452.087.4412,048.409.480.780.600.003S0.0000.008
F5355.0050.7124,146.4019.002.670.01 **0.014L0.0010.025
LSD test1–3 ***, 1–4 **, 1–5 **, 1–6 **, 1–7 ***, 2–3 **, 2–7 ***, 2–4 *, 2–6 *, 3–8 *
F694.6613.5222,339.6017.580.770.610.003S0.0000.008
F7146.3120.9013,563.1010.671.960.06*0.011M0.0000.019
LSD test1–3 **, 2–3 ***, 2–7 **, 3–5 **, 3–6 **
F8191.0627.29123,313.6097.020.280.960.002S0.0000.001
F9637.6991.1067,292.6052.941.720.100.009M0.0000.017
F111183.15169.0291,604.7072.072.350.02 **0.013M0.0000.022
LSD test2–4 ***, 2–5 **, 2–6 **, 2–8 ***, 7–8 **, 2–3 *, 4–7 *, 1–8 *
F12622.9789.0045,514.1035.812.490.02 **0.014L0.0000.023
Notes: * 10 percent materiality level, ** 5 percent materiality level, *** 1 percent materiality level. In the case of Partial eta-squared we use the following interpretations: 0.01: Small effect size (S), 0.06: Medium effect size (M), 0.14 or higher: Large effect size (L).
Table 4. Basic descriptive analysis of significant variables.
FrequencyF2F5F7F11F12
AvgMedAvgMedAvgMedAvgMedAvgMed
A9411.7112.0011.3212.0011.0712.0026.9423.004.692.00
B19111.4111.0011.7712.0010.9311.0028.3924.004.071.00
C114812.2512.0012.9112.0012.1112.0026.6523.002.921.00
C218212.4612.0012.4612.0011.5512.0025.8122.003.910.50
C319411.2412.0012.4512.0011.3012.0026.3623.004.390.50
D124412.0812.0012.5212.0011.4111.0026.4123.002.640.50
D214412.2412.0013.2212.0011.6612.0027.6524.004.210.50
E8212.2313.0011.8712.0011.8712.0024.7321.003.570.50
Table 5. Characteristics of the perception of the innovativeness of approaches for distance education.
Monitored SupportUsed in Distance EducationNot used in Distance Education
123451N2N3N4N5NN
MOOC (Massive Online Open Courses)776679101544242752926
TED Talks9082102231970382372821
Problem-based method learning104145143262150282632727
Case study and good practice examples162167133312645281255660
Webinar2941911684427352212112469
Involvement of practitioners in teaching31616612044267831863473
Smart/ICT usage35224415155214010922381
Flipped classroom726194322539141685909
Table 6. Characteristics of the perception of the appropriateness of the inclusion of innovative approaches.
Monitored SupportUsed in Distance EducationNot Used in Distance Education
123451N2N3N4N5NN
MOOC (Massive Online Open Courses)835184181250445048873
TED Talks1258995268694550115749
Problem-based method learning175133126241177472682647
Case study and good practice examples266147106201184322030588
Webinar3451751334520613723128407
Involvement of practitioners in teaching44713475232213034744387
Smart/ICT usage376183140311752211661428
Flipped classroom83741073122462746198812
MS Teams596214128524628101655167
Google Classroom3191601223941513028189452
Zoom4262081858368341313611225
Google Meet465200114585229201997300
Big Blue Button457193127787813512810290
Skype155911401321542422202458451
Moodle6202341488662101264377
Publisher’s Note: MDPI stays neutral with regard to jurisdictional claims in published maps and institutional affiliations.

