Article

Incorporating Vegetation Type Transformation with NDVI Time-Series to Study the Vegetation Dynamics in Xinjiang

1
School of Economics and Management, University of Chinese Academy of Sciences, Beijing 100190, China
2
Altay District Administration Office of Ili Autonomous Prefecture, Altay City 836599, China
*
Author to whom correspondence should be addressed.
Sustainability 2022, 14(1), 582; https://doi.org/10.3390/su14010582
Submission received: 18 November 2021 / Revised: 1 January 2022 / Accepted: 3 January 2022 / Published: 5 January 2022
(This article belongs to the Section Sustainability in Geographic Science)

Abstract

:
Time-series normalized difference vegetation index (NDVI) is commonly used to conduct vegetation dynamics, which is an important research topic. However, few studies have focused on the relationship between vegetation type and NDVI changes. We investigated changes in vegetation in Xinjiang using linear regression of time-series MOD13Q1 NDVI data from 2001 to 2020. MCD12Q1 vegetation type data from 2001 to 2019 were used to analyze transformations among different vegetation types, and the relationship between the transformation of vegetation type and NDVI was analyzed. Approximately 63.29% of the vegetation showed no significant changes. In the vegetation-changed area, approximately 93.88% and 6.12% of the vegetation showed a significant increase and decrease in NDVI, respectively. Approximately 43,382.82 km2 of sparse vegetation and 25,915.44 km2 of grassland were transformed into grassland and cropland, respectively. Moreover, 17.4% of the area with transformed vegetation showed a significant increase in NDVI, whereas 14.61% showed a decrease in NDVI. Furthermore, in areas with NDVI increased, the mean NDVI slopes of pixels in which sparse vegetation transferred to cropland, sparse vegetation transferred to grassland, and grassland transferred to cropland were 9.8 and 3.2 times that of sparse vegetation, and 1.97 times that of grassland, respectively. In areas with decreased NDVI, the mean NDVI slopes of pixels in which cropland transferred to sparse vegetation, grassland transferred to sparse vegetation were 1.75 and 1.36 times that of sparse vegetation, respectively. The combination of vegetation type transformation NDVI time-series can assist in comprehensively understanding the vegetation change characteristics.

1. Introduction

Vegetation is an important component of terrestrial ecosystems, connecting ecological elements, such as water, soil, and the atmosphere [1,2,3]. It plays an important role in stabilizing ecosystem services and is often regarded as a sensitive indicator of the ecological environment [4]. Vegetation dynamics is a key issue in ecological research and studying the laws and characteristics of vegetation dynamics will help understand the trend of regional environmental changes, provide data support for scientifically formulated development policies, and serve the sustainable management of the ecological environment in the region [5,6].
Remote sensing provides long-term, large-scale, and continuous spatiotemporal data sets, which are the main means to explore changes in vegetation dynamics [7,8]. Normalized difference vegetation index (NDVI), net primary productivity (NPP), and leaf area index (LAI) are widely adopted as indicators of vegetation growth status to assess dynamic changes in vegetation [9,10,11,12]. Among them, NDVI is the most widely used because of its advantages of rich data accumulation, long periods, and easy availability [5]. NDVI has strong intra- and inter-annual fluctuations [13,14] that reflect the growth of plants in different phenological stages [15]. The inter-annual changes in NDVI, obtained from the peak growth period, can effectively indicate the degradation and restoration of vegetation. Therefore, when using NDVI to explore the inter-annual variation in vegetation, it is necessary to adjust for the seasonal variation in NDVI. Generally, the maximum value composite (MVC) method is used to synthesize the annual maximum NDVI (NDVImax) and characterize the vegetation growth status throughout the year [16], construct the NDVImax time series, and calculate the slope of the time series to study the vegetation dynamics [10,17].
The positive, negative, and numeric values of the NDVI slope reflect the direction and severity of vegetation change, and changes in vegetation type will affect the NDVI slope value. The relationship between vegetation-type change and NDVI change can be understood from two perspectives. First, when the vegetation type is stable and the NDVI changes, a significant change in NDVI directly indicates a change or trend in vegetation. Second, the NDVI slope value of the pixels with vegetation-type change increases (decreases) significantly. In this case, ignoring the description of the vegetation-type change may make it difficult to fully reflect the actual vegetation change. When studying vegetation dynamics, incorporating vegetation type transformation with time-series NDVI is helpful for gaining an in-depth understanding of the vegetation change process and determining the detailed characteristics of vegetation change. Some studies have focused on the change in different vegetation types. For example, Guli et al. [9] analyzed the LAI of different vegetation types and revealed that the magnitude of change of cropland in Xinjiang is the largest, and grassland is the most sensitive vegetation type prone to change. Du et al. [1] observed that the adjustment of the planting structure will significantly decrease crop NDVI. Meng et al. [18] indicated that there are significant differences in NDVI changes among different vegetation types. Chu et al. [19] revealed that different vegetation types have different feedback on climate change, resulting in the spatial difference of NDVI change. Liu et al. [4] reported that NDVI cannot reflect the changes in the vegetation types and the degradation succession of grassland. In areas with degraded- grassland, NDVI increased and did not decrease. Currently, most studies use NDVI to explore the spatiotemporal characteristics of vegetation changes; however, little attention has been given to the changes in vegetation type and its relationship with the NDVI [1,9]. Moreover, few studies have focused on the impact of vegetation-type changes on NDVI slope values.
Xinjiang is located in northwest China, far from the sea. Affected by the temperate continental arid and semi-arid climate, the vegetation distribution is sparse, and the ecological environment is fragile [20]. Xinjiang is located in the core area of the Silk Road Economic Belt, and urbanization will be further accelerated with the implementation of the Belt and Road Initiative [21]. Some studies have indicated that under the background of global climate change, Xinjiang is experiencing a transition from warm dry to warm wet [22]. Vegetation in arid areas is sensitive to changes in the combination of moisture and temperature climatic conditions [23,24]. Research on vegetation change in Xinjiang has become a hot topic in recent years [14,24]. The regional ecological environment is an important foundation for social and economic development. Exploring vegetation changes is conducive to the protection of the ecological environment, and it promotes a coordinated development of the social economy and ecological environment in Xinjiang.
To explore the relationship between vegetation-type changes and the NDVI slope, this study selected Xinjiang as the study area and used linear regression and coefficients of variation to analyze the vegetation changes in Xinjiang from 2001 to 2020, based on the time series MOD13Q1 NDVI data. Subsequently, based on MCD12Q1 vegetation-type data, changes in the vegetation type and corresponding transfer characteristics were analyzed by a transfer matrix. Finally, the influence of vegetation type transformation on the NDVI slope was analyzed.

2. Materials and Methods
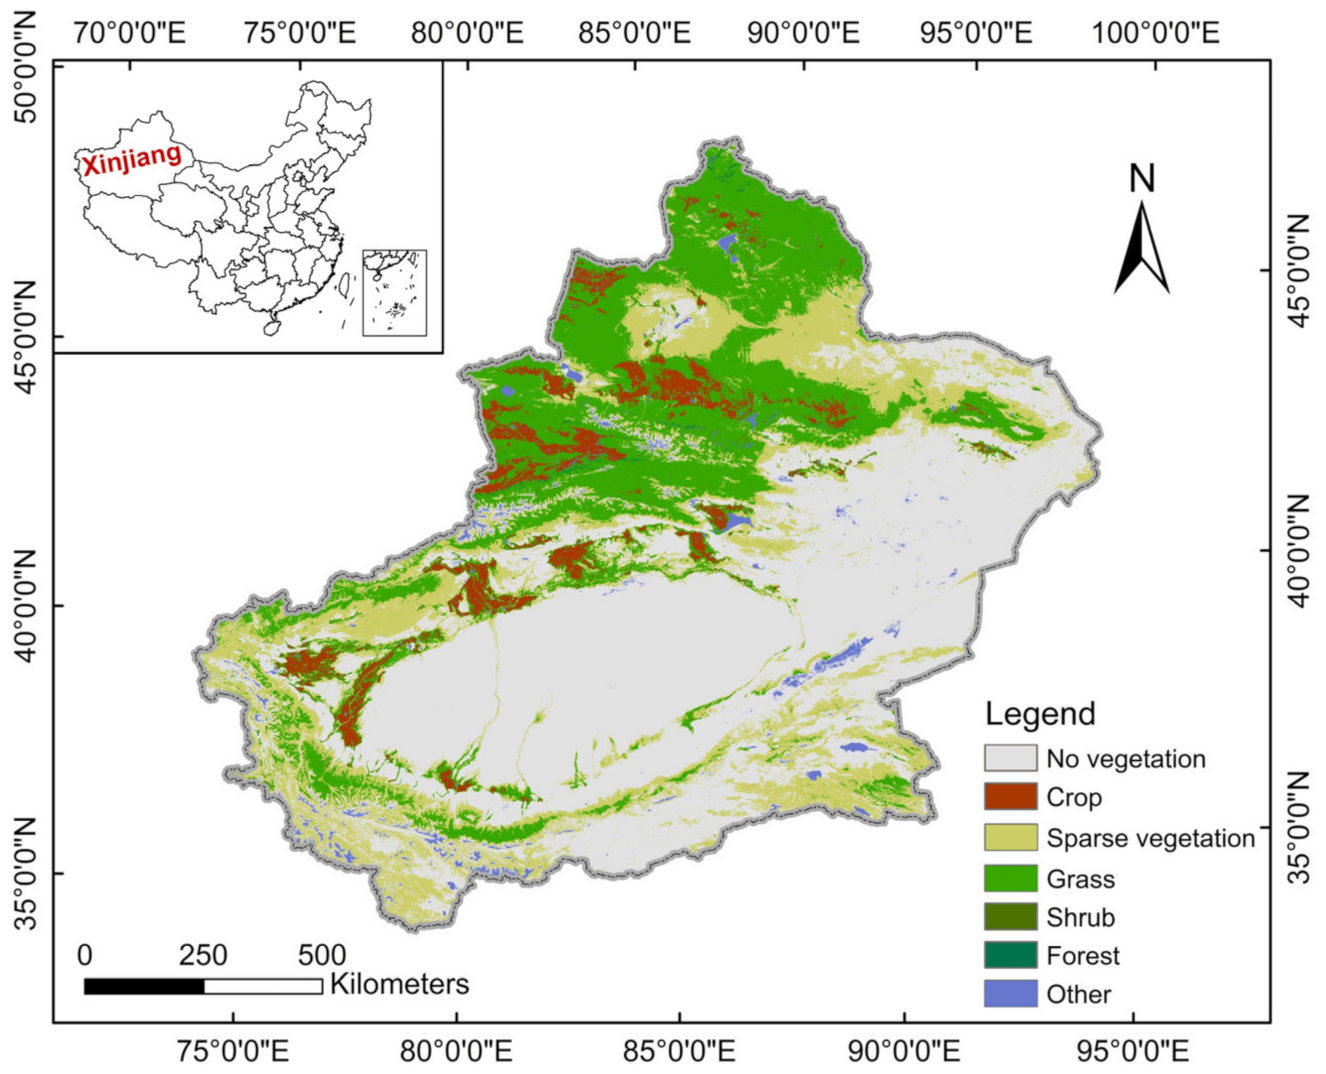
2.1. Study Area

Xinjiang is located in northwestern China, with geographic coordinates of 73°20–96°25 E, 34°15–49°10 N (Figure 1) and an administrative area of approximately 1.66 × 10⁶ km2. It is far from the ocean and has an annual average precipitation of approximately 145 mm [9], and is classified as having a temperate continental arid and semi-arid climate. Xinjiang has various landforms, mainly consisting of three mountains and two basins [25], namely, from south to north: the Altay Mountains, Junggar Basin, Tianshan Mountains, Tarim Basin, and the Kunlun Mountains. Xinjiang is generally divided into northern Xinjiang and southern Xinjiang, with the central Tianshan Mountains as the boundary. Affected by water resource shortages, desertification, low vegetation cover, and other factors, Xinjiang’s ecosystem is fragile.

2.2. Data

2.2.1. MOD13Q1 NDVI Data

The NDVI data used in this study were derived from the MOD13Q1 dataset, which is a 16-d NDVI product with a spatial resolution of 250 m synthesized by the maximum value composite (MVC) method, based on daily NDVI. There were 23 images per year, and the study site was covered by six tile images. First, on the Google Earth Engine platform, 23 images of each year from 2001 to 2020 were composited to an annual NDVImax image using the MVC method. Later, Envi 5.3 software was used to perform the layer stacking operation that stacked the 20 images of NDVImax into a single file. In the layer stacking step, the map projection was set to Universal Transverse Mercator (UTM), the geographic datum was set to WGS-1984, the UTM zone was set to 44° N, and the pixel size was set to 250 m.

2.2.2. MCD12Q1 Vegetation-Type Data

The MCD12Q1 product was created using a supervised classification of MODIS reflectance data [26,27]. The original MCD12Q1 dataset included six classification schemes with a 500 m spatial resolution. The International Geosphere-Biosphere Programme classification data that were selected for analysis in this study included 17 vegetation types (Table 1). To facilitate the subsequent analysis, we reclassified the 17 vegetation types into forests, shrubs, grasslands, crops, sparse vegetation, and non-vegetation land types, and resampled their spatial resolution to 250 m. Subsequently, the vegetation-type transfer matrix was created using two vegetation-type images from 2001 to 2019.
We calculated the mean of the time-series NDVImvc from 2001 to 2020, and by referring to previous studies [28], we used 0.1 as the threshold value for differentiating vegetation and non-vegetation areas. In the MCD12Q1 vegetation-type data, the vegetation areas with low coverage (FVC < 0.1) were classified as bare land. To ensure consistency between the vegetation range of MCD12Q1 data and that of MOD13Q1 data, the areas with FVC less than 0.1 and NDVI greater than 0.1 were classified as sparse vegetation.

2.3. Methods

2.3.1. Linear Regression Analysis

The relationship between NDVI and time was analyzed by linear regression, and the slope of the regression was calculated using the least-squares method [3,12]. A positive slope indicates that NDVI increases, while a negative slope indicates that NDVI decreases, and the greater the absolute value of the slope, the more severe the change [29].
Slope = n × i = 1 n i × NDVI i i = 1 n i i = 1 n NDVI i n × i = 1 n i 2 i = 1 n i 2
where slope represents the slope of the linear regression equation, n represents the study period (year), and NDVIi represents the NDVI observation value in year i.

2.3.2. F-Test

F-test determines the level of statistical confidence for the slope of the calculated time-series NDVI [30]. It is usually used to determine the level of significance of NDVI changes [29].
F was calculated as:
F = U Q n 2
U = i = 1 n s ^ i s ¯ 2
Q = i = 1 n S i s ^ i 2
where U represents the sum of squared error, Q represents the regression of square sum, s ^ i represents the fitting value of pixel NDVI in year i, s ¯ represents the mean of NDVI time series of pixels, and S i represents the observed value of NDVI in year i.

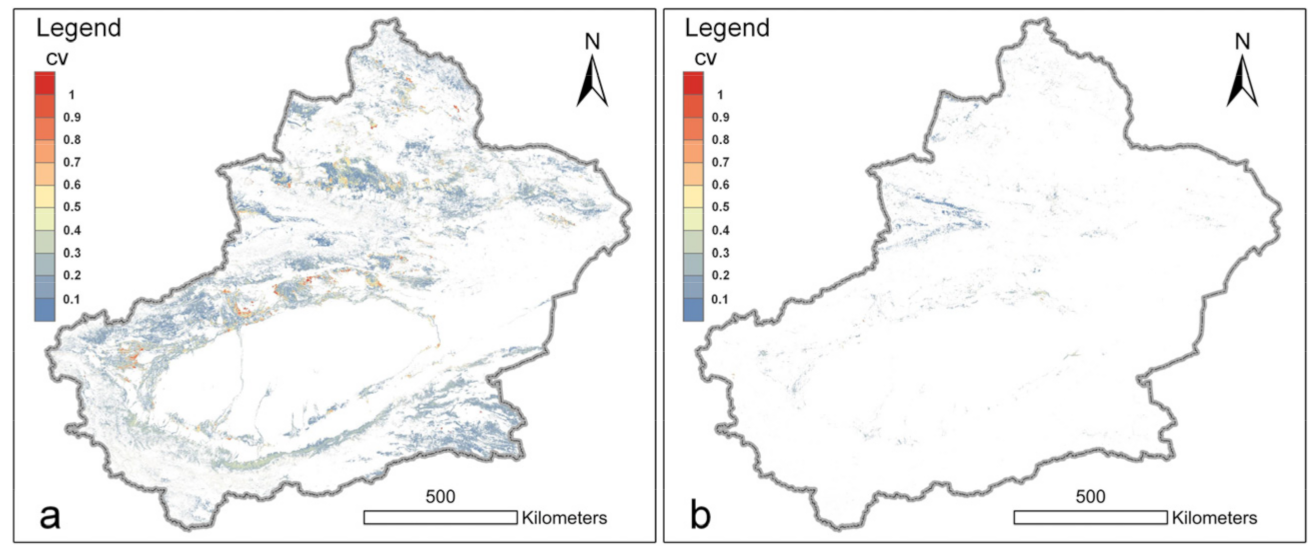
2.3.3. Coefficient of Variation of NDVI

The coefficient of variation (CV) is defined as the ratio of the standard deviation of samples to the mean of samples and is also known as the dispersion coefficient. It is one of the commonly used methods in statistics to judge the degree of dispersion of sample values [4,31]. Therefore, the inter-annual fluctuation of vegetation change can be analyzed by observing the CV of NDVI.
CV = σ μ
where σ represents the standard deviation of the sample, and μ represents the mean of the samples.

3. Results

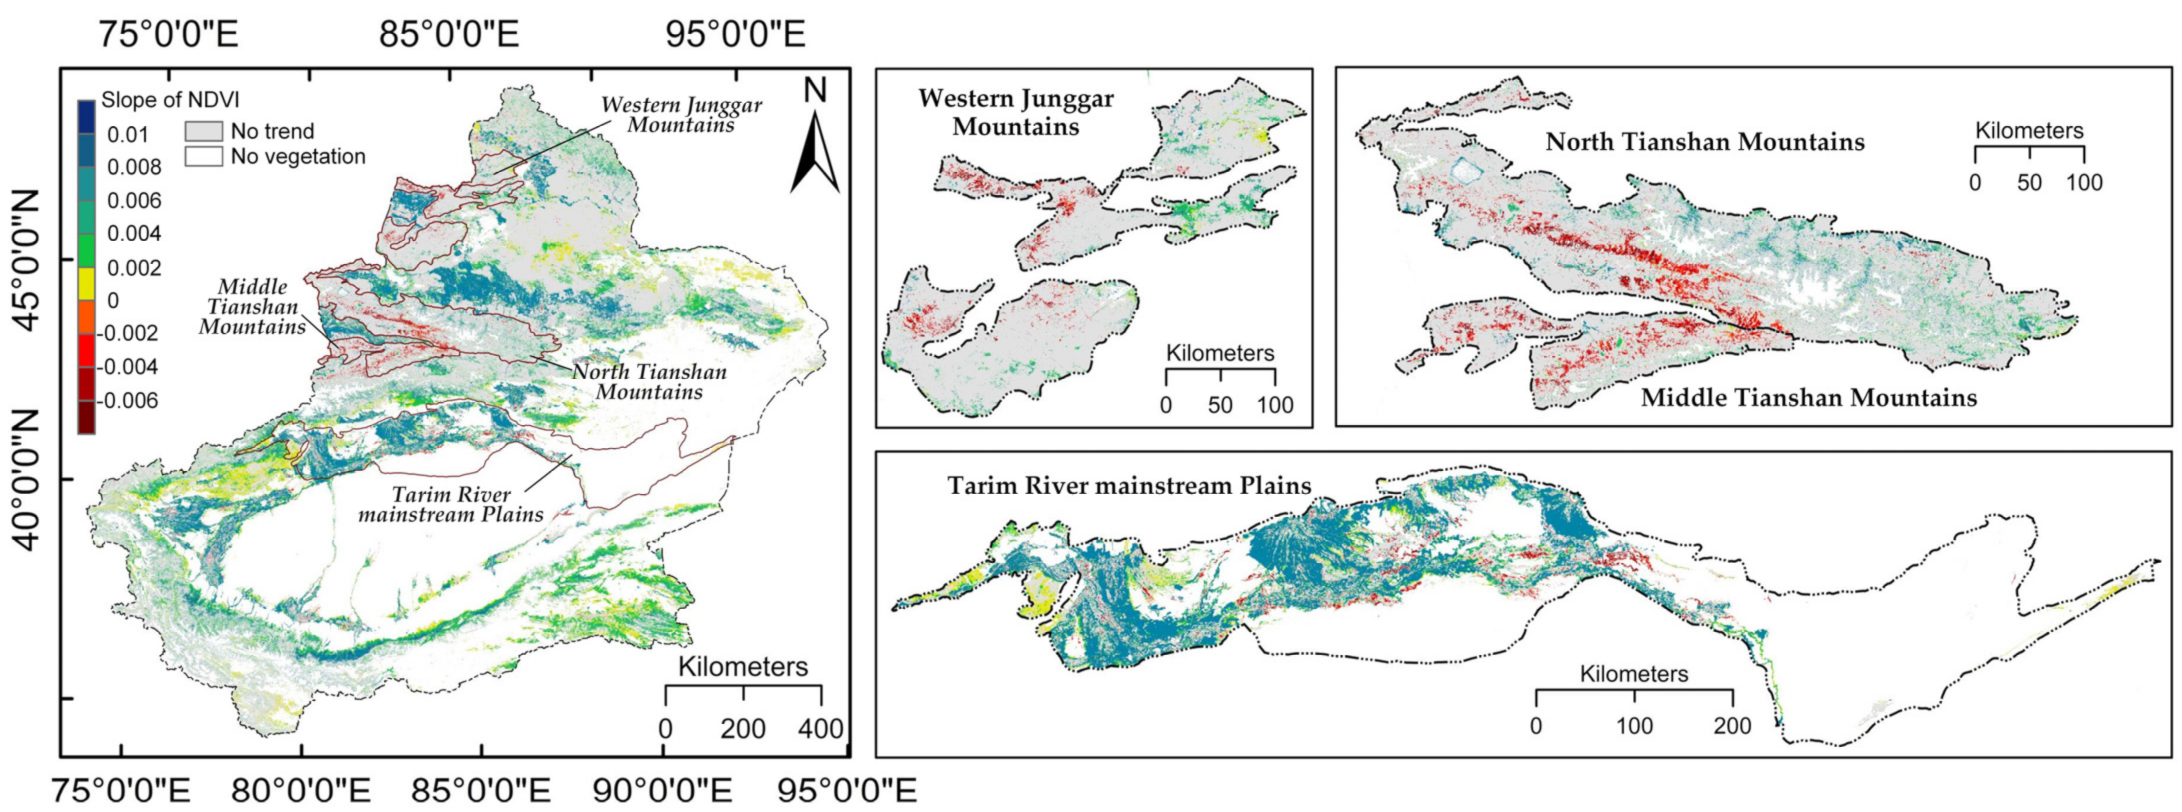
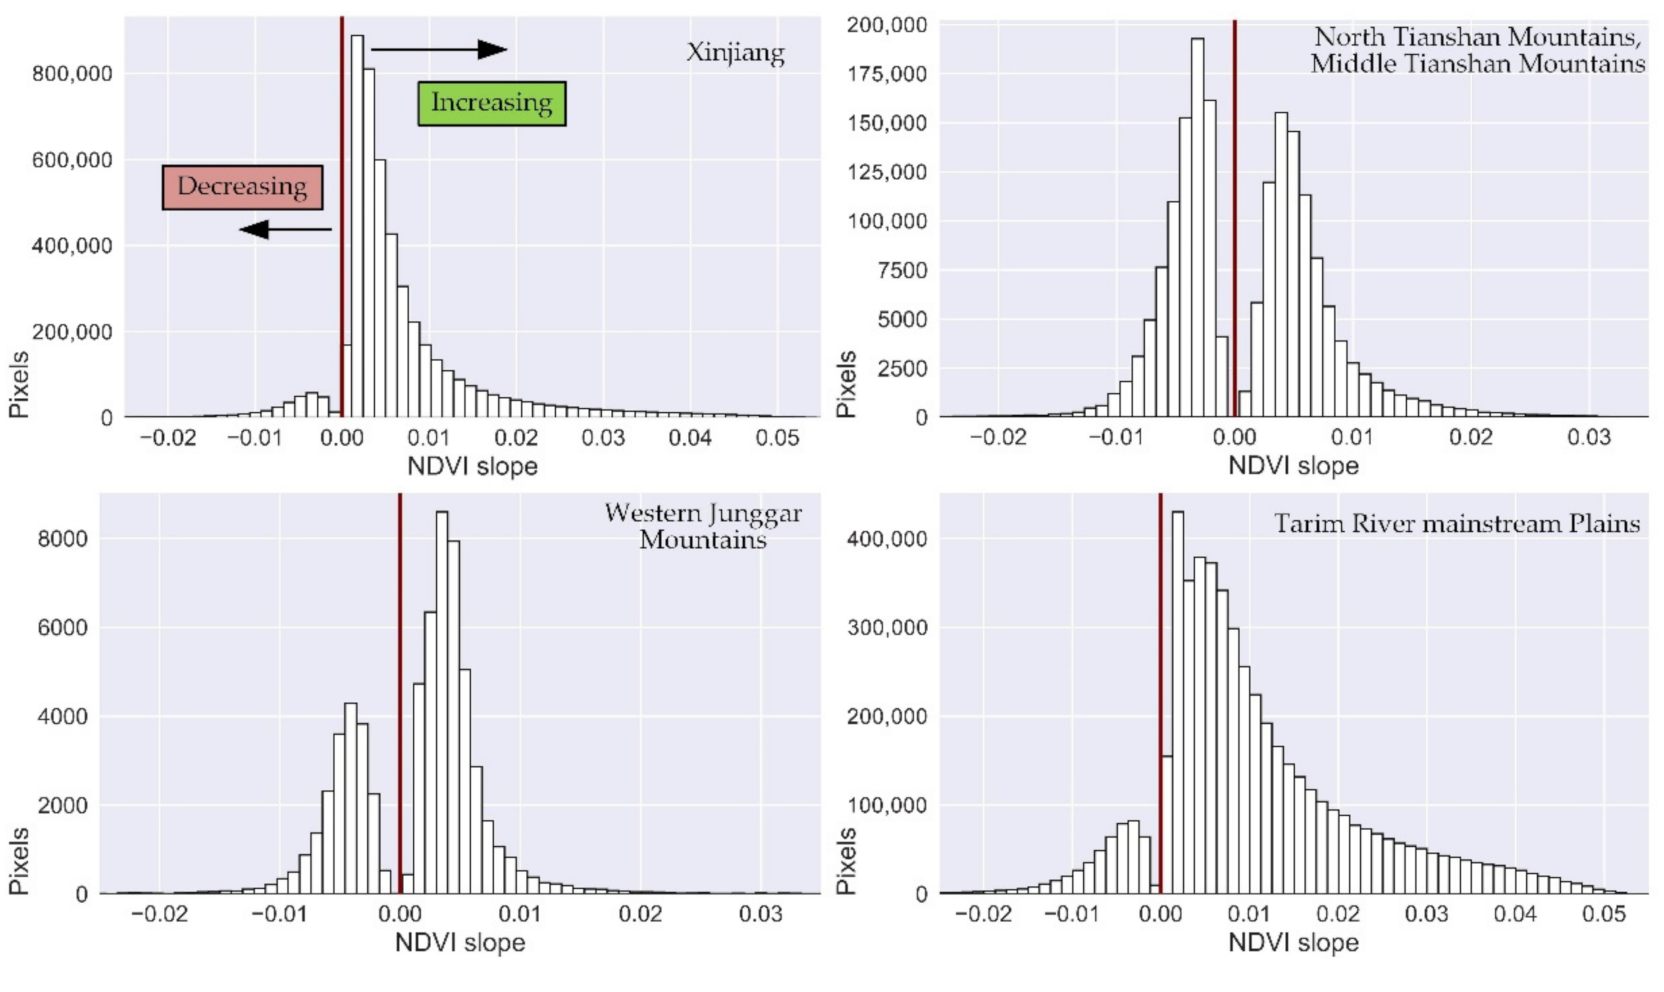
3.1. Spatio-Temporal NDVI Changes

The results (Figure 2) showed that approximately 63.29% of vegetation pixels did not pass the significance test, indicating that the vegetation did not change significantly and was in a stable state. About 36.71% of the vegetation pixels passed the significance test, indicating that the vegetation had changed significantly. In the vegetation areas with significant changes, approximately 93.88% of the vegetation increased significantly and was in a state of restoration, while approximately 6.12% of the vegetation decreased significantly and was in a state of degradation.
The variation in NDVI exhibited typical spatial heterogeneity (Figure 3). Increases in the NDVI were more intense in the plain region, while decreases were more intense in the mountain region. Regarding geomorphic units, 29.37% of the pixels with a decrease in the NDVI in Xinjiang were distributed in the northern and middle Tianshan Mountains, and 7% were distributed in the western Junggar Mountains. The NDVI of 48.46% pixels in northern and middle Tianshan, 32.99% of pixels in the western Junggar Mountains, and 9.49% of pixels in the Tarim River plain were decreasing.
The slope of NDVI was graded with reference to previous studies [10], and the proportions of pixels at different grades of the slope were counted (Table 2). The results showed that the proportion of vegetation increasing at high slopes was approximately 26.23%, the proportion that increased at medium slopes was approximately 51.32%, and the proportion that increased at low slopes was only 16.33%. The proportion that decreased at low, medium, and high slopes was 0.56%, 4.11%, and 1.44%, respectively. Overall, the increase in NDVI mainly occurred at a medium slope, and the decrease in NDVI occurred mainly at a low slope. This indicated that the slope of greening vegetation was higher than that of degrading vegetation.
The mean CV in the area with reduced NDVI was 0.16, while that in the area with increased NDVI was 0.23, indicating that the variability in the area with reduced NDVI was significantly lower than that in the area with increased NDVI, and the vegetation in Xinjiang was in a state of low variability (Figure 4).

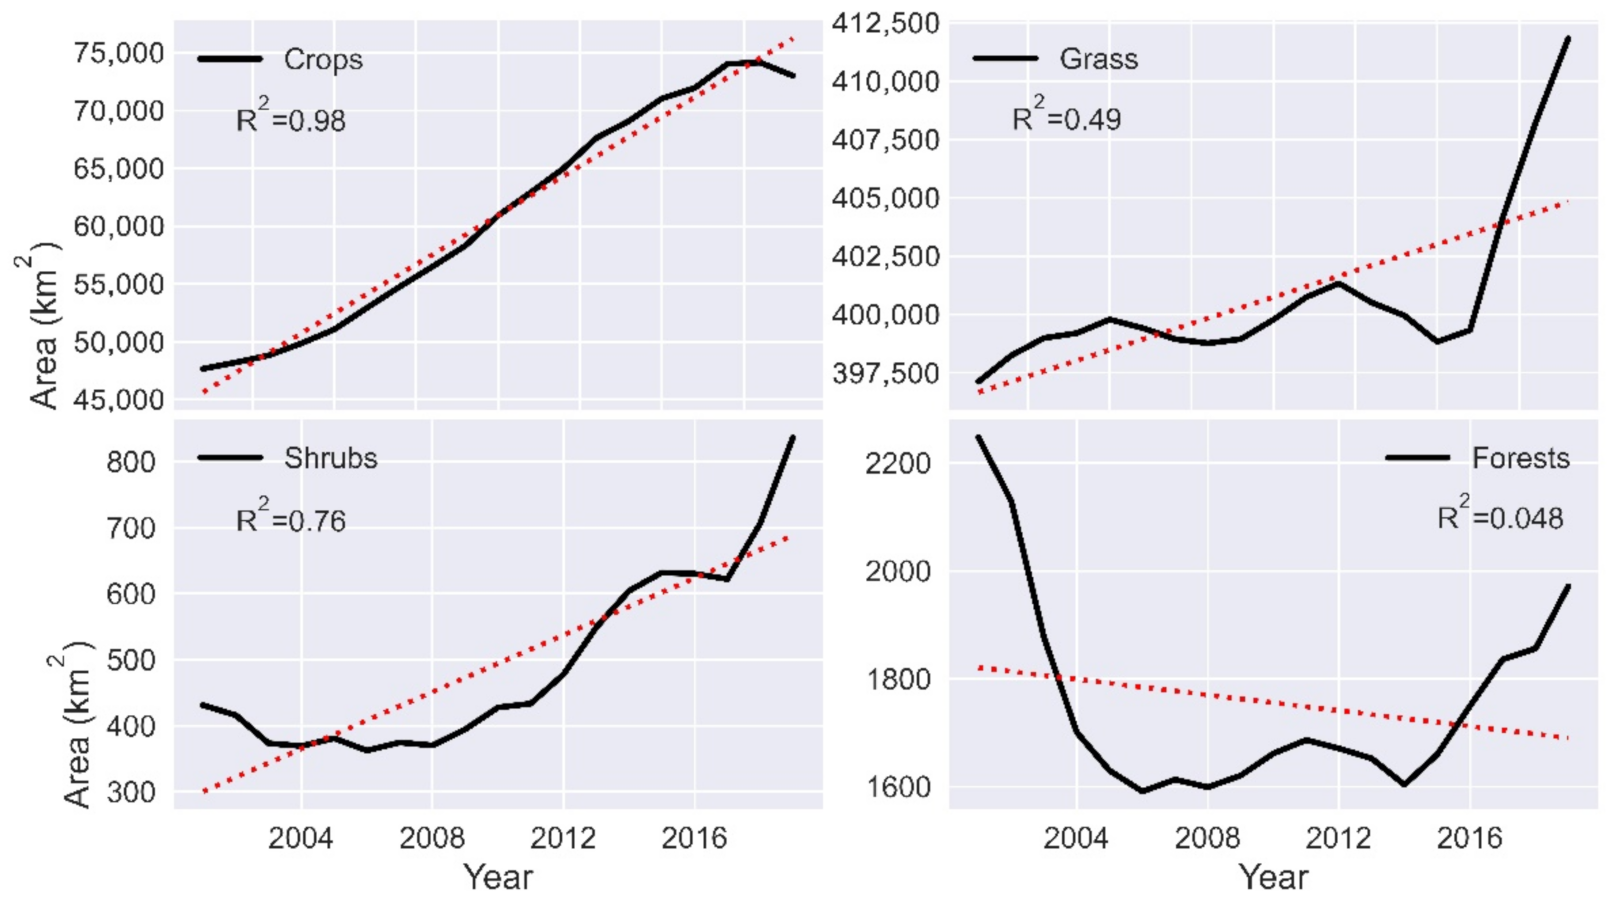
3.2. Changes in Vegetation-Types

The area of crops increased linearly, the areas of grassland and shrubs increased intermittently, and the area of forests decreased (Figure 5). The area of crops increased the most from 2001 to 2019, followed by grassland and shrubs, with shrubs and crops having the greatest magnitudes of change (Table 3). The area of sparse vegetation was greatly reduced, and the area of forests reduced slightly. Considering the forest subclass, the area of broadleaf forests and mixed forests decreased, while the area of needle-leaf forests increased. Specifically, the area of crops increased by 24,558.02 km2 (an increase of 53.1%), the area of grassland increased by 15,186.62 km2 (an increase of 4%), shrubs increased by 415.41 km2 (an increase of 92.23%), forests decreased by 274.51 km2 (a decrease of 12.9%), and sparse vegetation decreased by 40,169.94 km2 (a decrease of 9.93%).
The transfer characteristics among vegetation types were analyzed based on the transfer matrix of vegetation types (Table 4). From 2001 to 2019, the transfer of sparse vegetation to grassland amounted to 43,382.82 km2, accounting for 90% of the land area transferred to grassland; the area of grassland transferred to crops amounted to 25,915.44 km2, accounting for 90.82% of the land area transferred to crops. The area of sparse vegetation transferred to shrubs amounted to 499.16 km2, accounting for 78.14% of the land area transferred into shrubs, and the area of forests transferred to grasslands amounted to 559.66 km2, accounting for 93.43% of the total area transferred out of forests. Thus, the increase in grassland area was mainly due to the transfer-in of sparse vegetation, the increase in cropland was mainly due to the transfer-in of grassland, and the increase in shrub area was mainly due to the transfer-in of sparse vegetation. Further, local forests degenerated into grassland.
In general, the changes in vegetation types were concentrated in sparse vegetation, grassland, and crops; that is, the transformation of sparse vegetation to grassland and grassland to crop were the main patterns of vegetation changes in Xinjiang. In terms of area, the most drastic changes were the transfer of sparse vegetation to grassland, followed by the transfer of grassland to crops and the transfer of grassland to sparse vegetation.

3.3. Relationship between Vegetation Type and NDVI Change

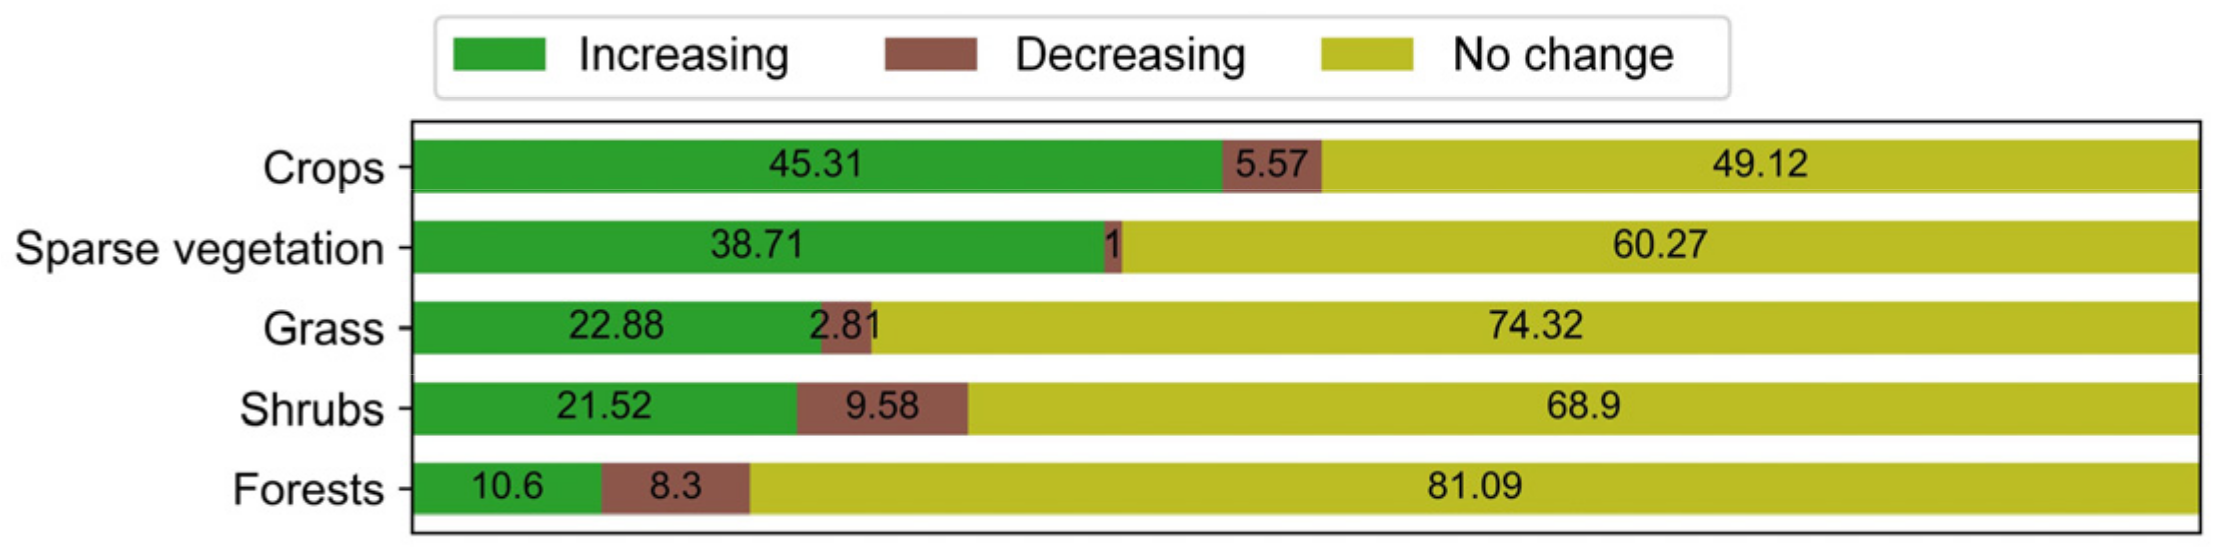
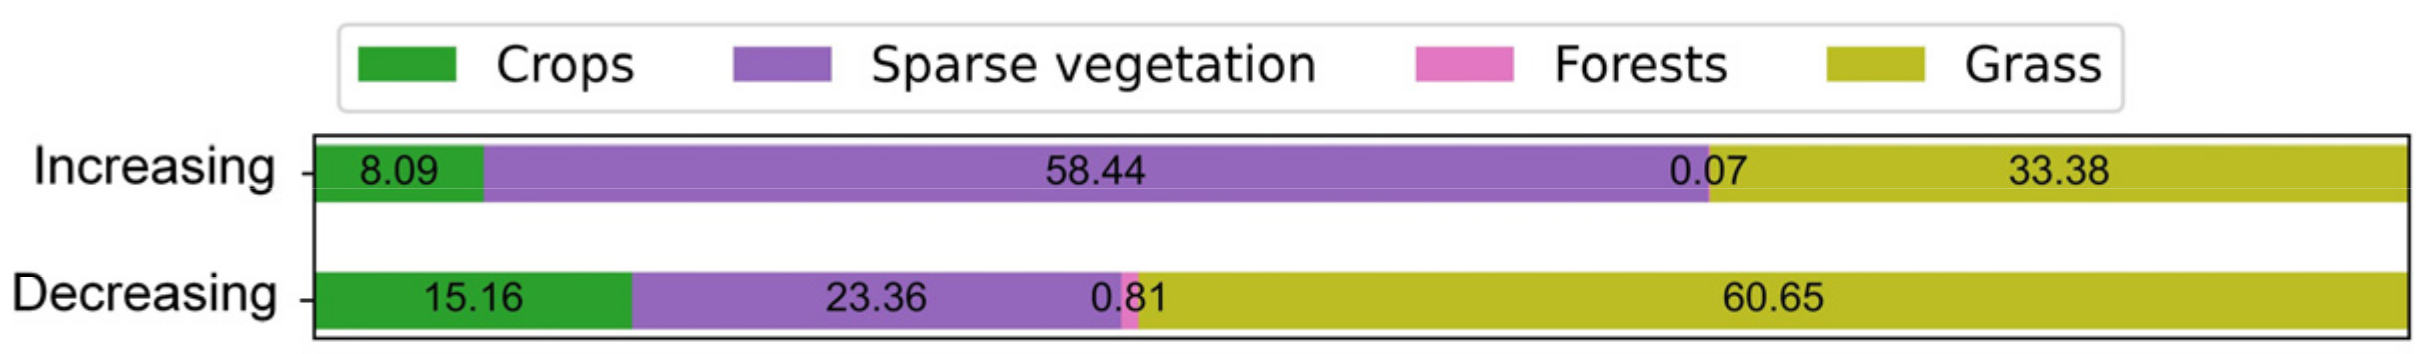
3.3.1. NDVI Changes in Different Vegetation Types

The NDVI of forest pixels had good stability, with no NDVI change observed in 81.09% of the forest pixels, followed by grassland (74.32%) and shrubs (68.9%); further, the NDVI of crop and sparse vegetation pixels were most prone to change (Figure 6). Sparse vegetation accounted for the highest proportion of pixels in which the NDVI increased, followed by grass. Grass accounted for the highest proportion of pixels in which the NDVI decreased, followed by sparse vegetation (Figure 7).

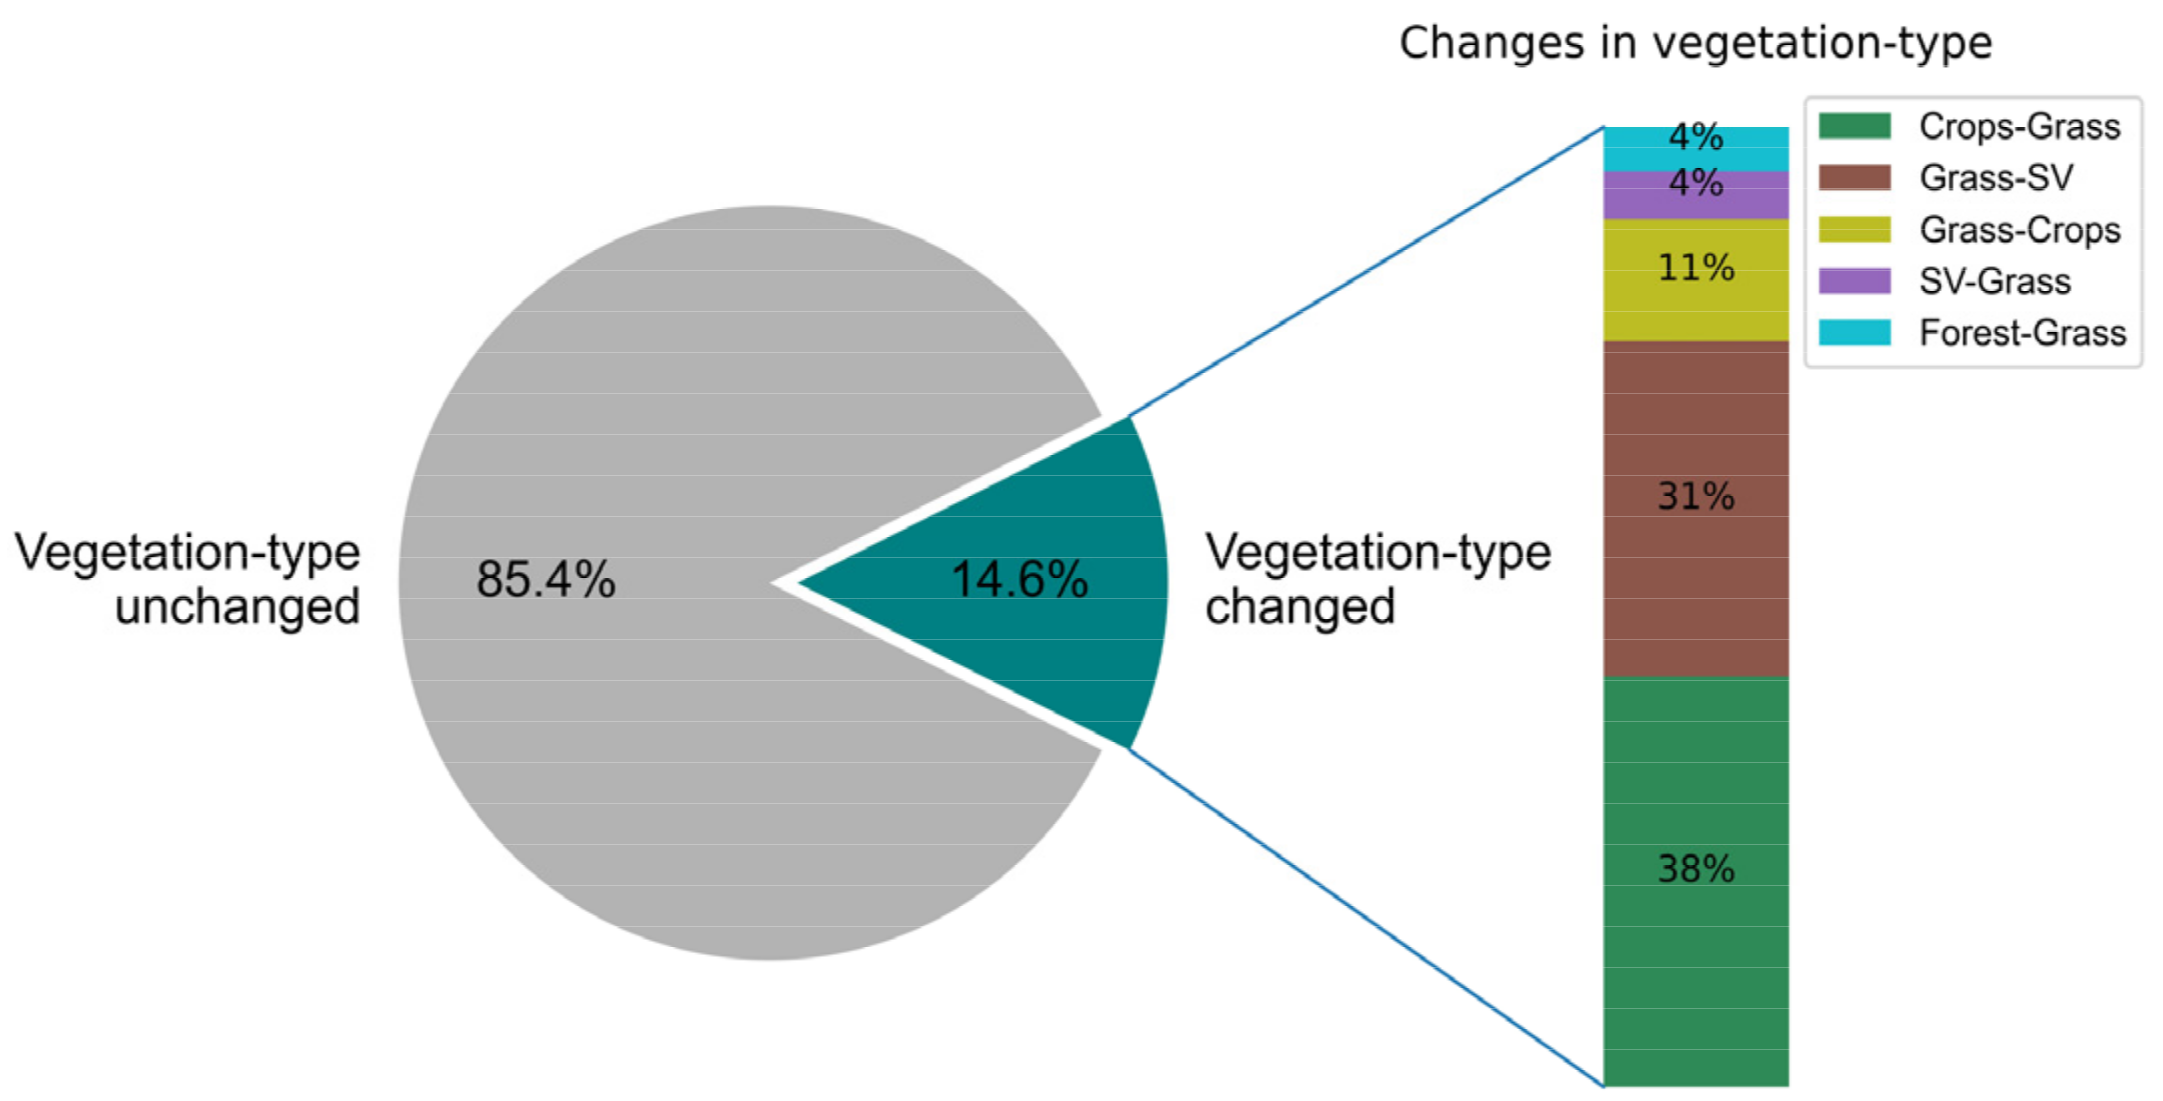
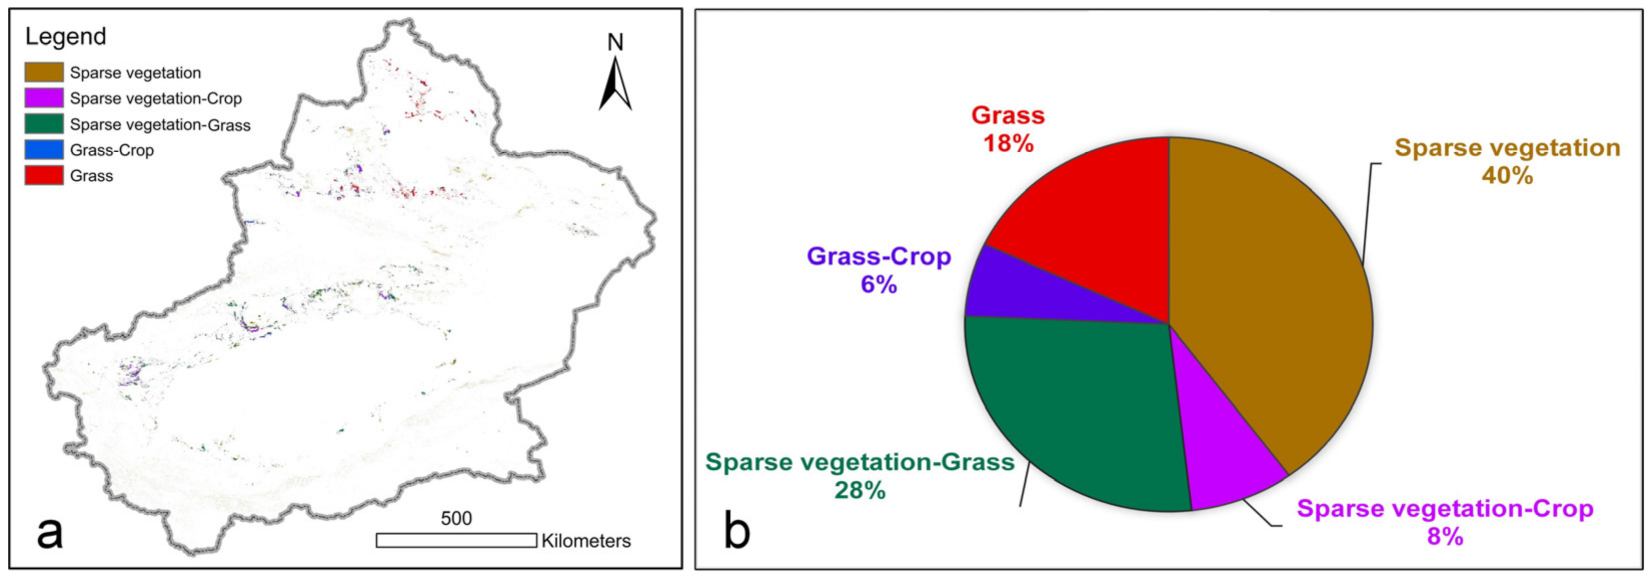
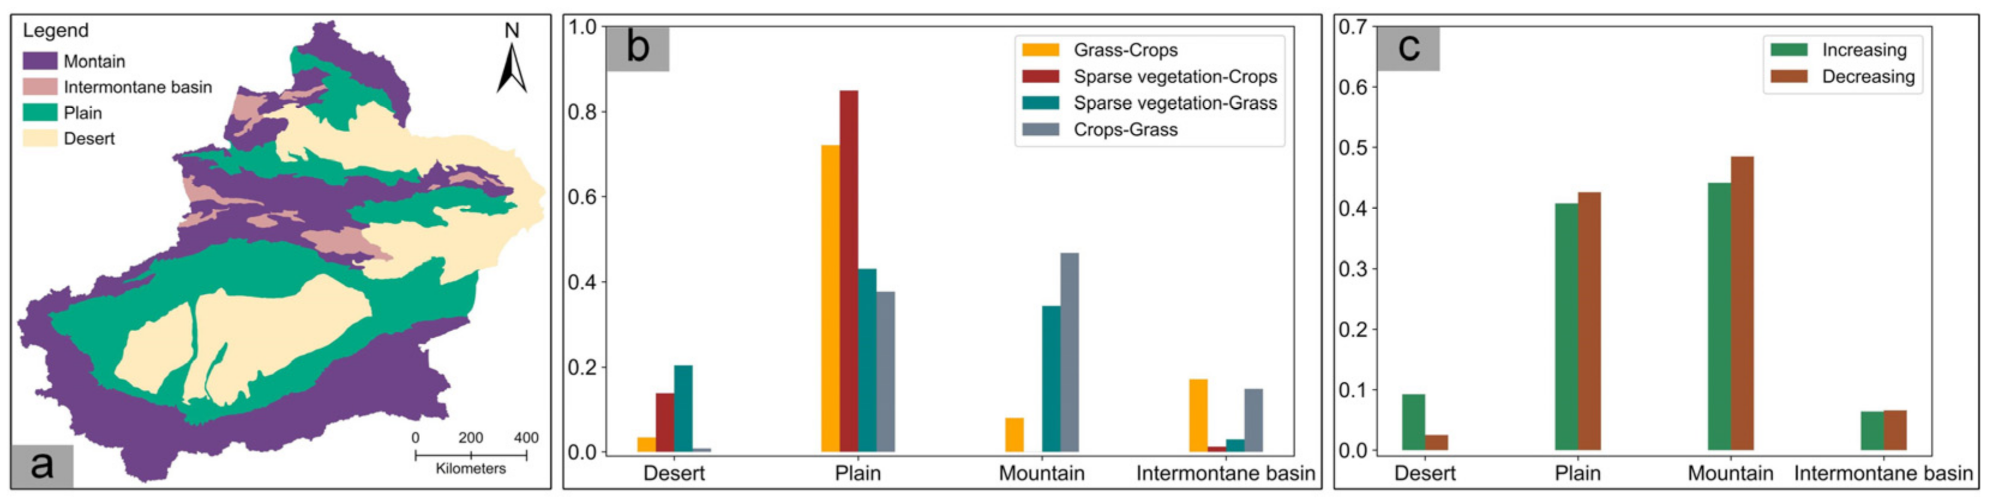
3.3.2. Share of Vegetation-Type Changes

A significant increase in NDVI indicated that the vegetation was in a state of restoration (slope > 0, p < 0.05), and a significant decrease in NDVI indicated that the vegetation was in a state of deterioration. Changes in vegetation as measured by the NDVI can be divided into two categories. First, when the growth status of vegetation changes but the vegetation type remains unchanged. The other is an increase or decrease in NDVI caused by the transformation of vegetation type. To explore the relationship between the change in NDVI and the change in vegetation-type, the data for NDVI slope and vegetation-type transfer were combined; subsequently, the amount of vegetation-type transferred was summed when the NDVI slope was greater than 0, and when the NDVI slope was less than 0 (Figure 8).
In the region where NDVI increased, the pixels of unchanged vegetation-type accounted for 82.6% of the total pixels with increased NDVI, while the pixels that resulted from the transformation of vegetation type accounted for approximately 17.4% (Figure 8). Specifically, among the pixels with no change in vegetation type, the pixels with sparse vegetation accounted for 58.09%, the proportion of grass was 33.18%, and the proportion of cropland was 8.04%. In the pixels with a change in vegetation type, the proportion of sparse vegetation transferred to grassland was approximately 50.19% and the proportion of grassland transferred to crops was approximately 39.91%. In summary, changes in vegetation type were important contributors to increases in NDVI.
In the region where NDVI decreased, the pixels with no change in vegetation type accounted for approximately 85.39% of the total pixels with decreased NDVI, while the pixels that resulted from the transformation of vegetation type accounted for 14.61% (Figure 9). Specifically, among the pixels with no change in vegetation type, the pixels of grassland accounted for 58.69%, the proportion of sparse vegetation was 22.6%, and the proportion of cropland was 14.67%. Among the pixels with a change in vegetation type, the proportion of crops transferred to grassland was 38.85% and the proportion of grassland transferred to sparse vegetation was 31.74%. This indicated that the decrease in NDVI was mainly due to the changes in grassland, followed by the changes in crop NDVI. In addition, changes in vegetation type were important contributors to decreases in NDVI.
When the CV was greater than 0.5, the vegetation type was extracted (Figure 10). The results showed that where high fluctuation of NDVI occurred (CV > 0.5), the proportion of pixels with unchanged vegetation-type was approximately 58%, of which sparse vegetation accounted for 40% and grassland accounted for 18%. The proportion of pixels with changed vegetation type was 42%, of which the transfer of sparse vegetation to grassland accounted for 28%, the transfer of sparse vegetation to crop accounted for 8%, and the transfer of grassland to crops accounted for 6%.

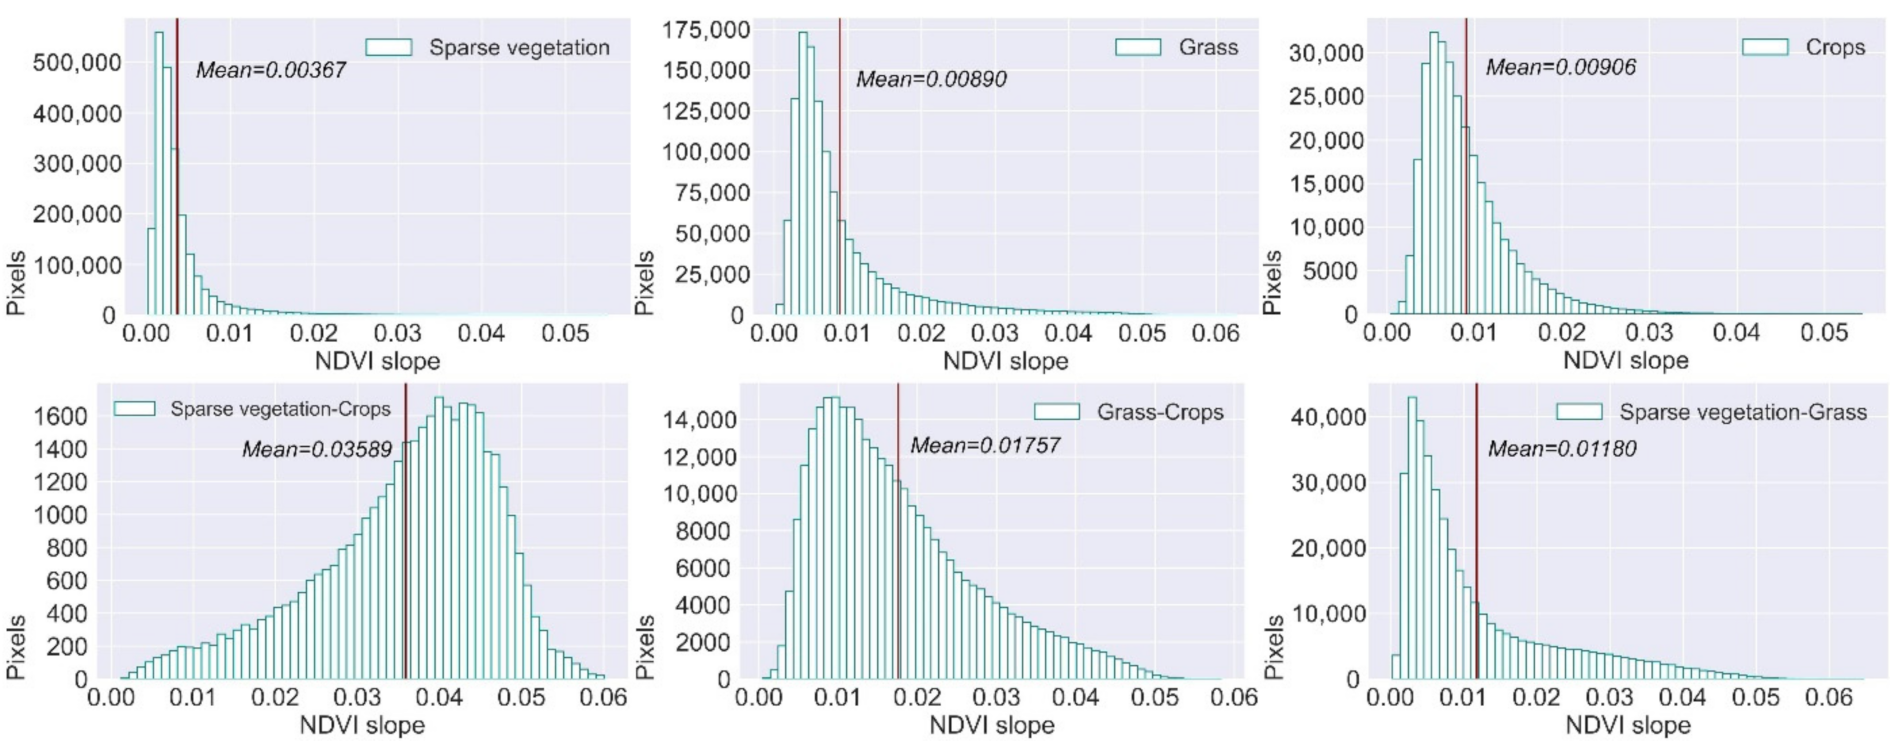
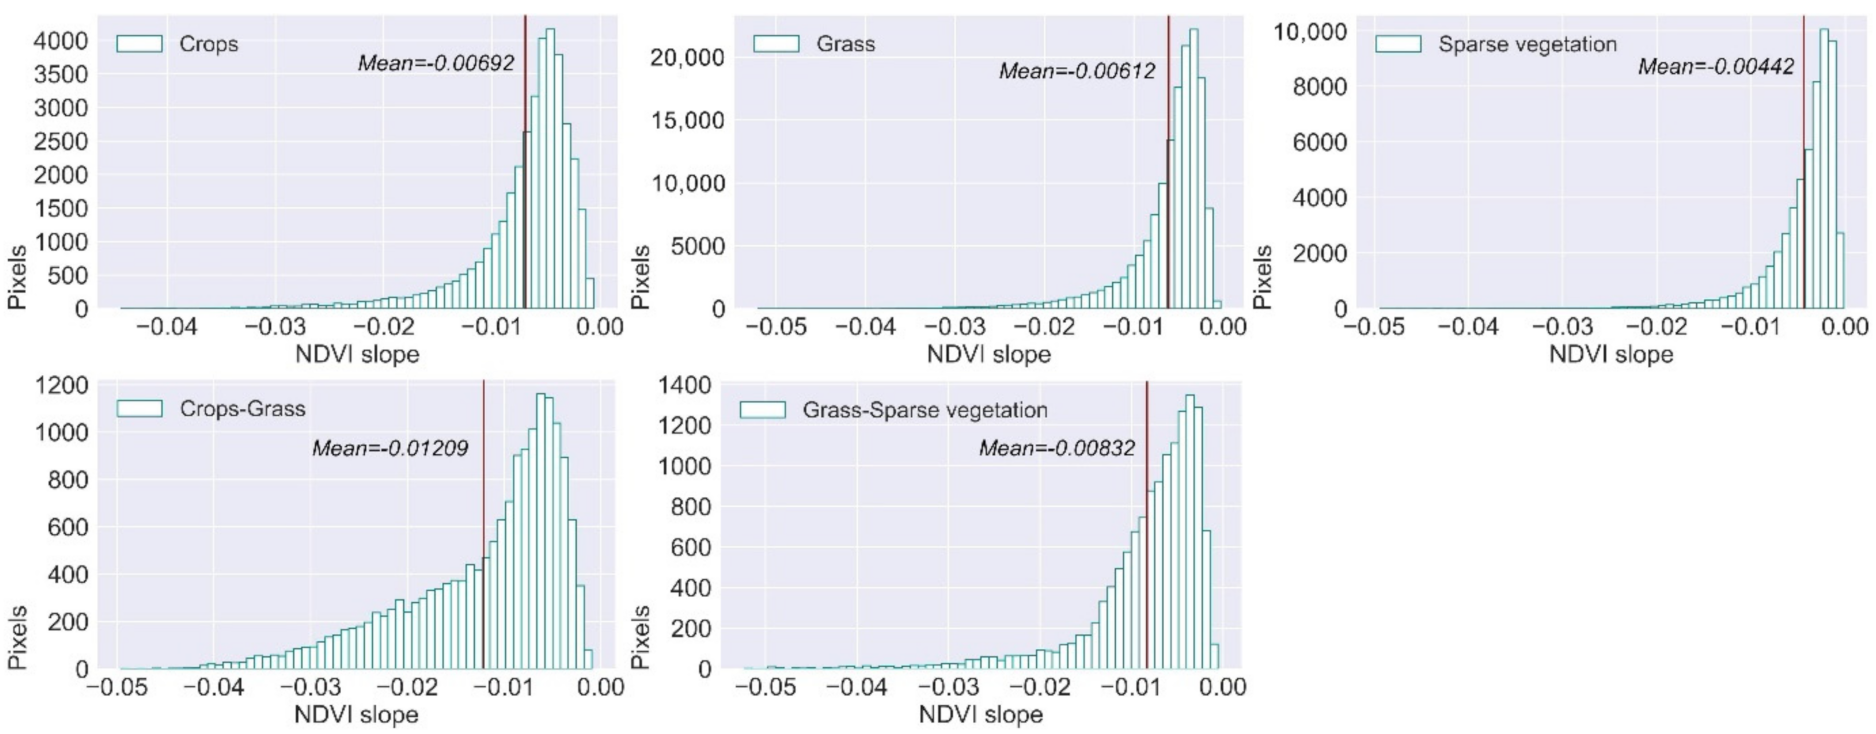
3.3.3. Variation in the NDVI Slope

In the area where the NDVI increased, the mean NDVI slopes of sparse vegetation, grass, and crop pixels were 3.67‰, 8.9‰, and 9.06‰, respectively (Figure 11). The mean NDVI slope of the pixels with sparse vegetation transferred to crops was 35.98‰, which was 9.8 times that of sparse vegetation pixels. The mean NDVI slope of the pixels of sparse vegetation transferred to grass was 11.8‰, which was 3.2 times that of sparse vegetation pixels, whereas the mean NDVI slope of the pixels of grass to crops was 17.57‰, which was 1.97 times that of grass pixels.
In the area where the NDVI decreased, the mean NDVI slopes of sparse vegetation, grass, and crop pixels were −6.12‰, −4.42‰, and−6.92‰, respectively (Figure 12). The mean NDVI slope of the pixels in which cropland transferred to sparse vegetation was −12.09‰, which was 1.75 times that of cropland pixels. The mean NDVI slope of the pixels in which grassland transferred to sparse vegetation was −8.32‰, which was 1.36 times that of grassland pixels.

4. Discussion

4.1. Vegetation Change Trend

NDVI is one of the most widely used indicators for monitoring vegetation changes [32], and the slope of the NDVI can effectively indicate the direction and intensity of vegetation changes. Therefore, the slope of time-series NDVI data is typically used to reveal vegetation changes. Changes in the vegetation type will greatly affect the value of the NDVI slope, thereby affecting the evaluation of vegetation changes. However, the influence of vegetation type change on the NDVI slope value could easily be ignored. When the number of pixels of vegetation type changes accounted for a small proportion, its impact on the NDVI slope was relatively limited. However, when the pixels with changes in the vegetation type accounted for a large proportion of the study area, the understanding of the vegetation change may be affected. Here, we focused on the issue of how vegetation type changes affected the NDVI slope. We considered Xinjiang as an example to analyze the spatiotemporal variation characteristics of NDVI and vegetation type change, and then analyzed the impact of vegetation type change on the NDVI slope value distribution.
Overall, vegetation in the Xinjiang region showed a trend towards greening, which was consistent with previous studies [14]. The results of this study differed slightly from those of previous studies regarding the magnitude of variation and area of vegetation. For example, previous studies in Xinjiang demonstrated that the NDVI significantly increased for approximately 91% of vegetation and decreased by 9%. This difference may be related to the different start and end times of the studies and different types of data used [1]. Overall, the main vegetation types that changed were sparse vegetation, grassland, and crops. The NDVI of sparse vegetation, grassland, and crops increased significantly when the vegetation type remained unchanged. Transfer among sparse vegetation, grassland, and crops were also important reasons for the increase in NDVI.
There were four main geomorphic features in Xinjiang: mountains, intermontane basins, plains, and deserts (Figure 13). The amount of vegetation-type change varied greatly between different geomorphic units. The transformation of sparse vegetation to crops mainly occurred in plain areas (84.91%), while the transformation of grassland to crops mainly occurred in plain areas (72%) and intermontane basin areas (17.15%). The transformation of sparse vegetation to grassland mainly occurred in plain (43.1%) and mountain areas (34.27%). Excluding desert areas, the number of pixels in which NDVI increased did not greatly differ from that in which NDVI decreased in other geomorphic units.
Crops were the main type of vegetation that changed in Xinjiang. Affected by human activities, large areas of sparse vegetation and grassland were transferred to cropland. In arid and semi-arid areas, 90% of the population is concentrated in oases in Xinjiang [33], and most human activities are concentrated in plain oases [1,34]. In the middle- and low-altitude regions, the NDVI values of oasis vegetation, such as natural forests, grasslands, and crops, were strongly affected by human activities [35,36]. However, agricultural activities and urban expansion often occupied and transformed the vegetation in the oasis desert ecotone [14,20], driving vegetation type transformations among sparse vegetation, grassland, and cropland [37]. The transfer of sparse vegetation and grassland to crops significantly improved the NDVI [1,38], while immoderate pastoral activities led to a decline in grassland [39].

4.2. Influence of Vegetation-Type Change on NDVI Slope

Some previous studies have combined single-period vegetation-type data with NDVI slopes to analyze the NDVI slope of different vegetation types, but few have focused on the quantitative relationship between vegetation type transformation and the NDVI slope. We analyzed the proportion of vegetation types in pixels with NDVI changes and the influence of vegetation type change on NDVI slope value. The results showed that in the pixels with NDVI change, the proportion of the pixels with vegetation-type change was 17.23%. The change in NDVI in a considerable part of the region was due to a change in vegetation type. This accounted for 17.4% of the area of increasing NDVI and 14.61% of the area of reducing NDVI.
Furthermore, the change of vegetation type had a strong effect on the increase (decrease) in the NDVI slope. In the area where NDVI increased, the mean slope of pixels that transformed from sparse vegetation to crops was 9.8 times higher than that of sparse vegetation. Therefore, if there is no description of the vegetation-type change, this change can be easily understood as a rapid increase in the coverage of sparse vegetation. Similarly, among the pixels with reduced NDVI, the mean NDVI slope of the pixels converted from cropland to grassland was 1.75 times that of cropland.
The CV was an effective indicator for characterizing the variability of the NDVI. Vegetation-type transformation often led to strong variability in the NDVI [40,41]; therefore, the CV reflected changes in vegetation types, to an extent. The results of combining the CV of the NDVI with the vegetation-type transfer matrix showed that the area of transferred vegetation type accounted for 42% of the vegetation area with a high CV (CV > 0.5) (Figure 10), and the greatest variability of NDVI was attributed to vegetation-type transfers.

4.3. Strengths and Limitations

On a large spatial scale, under the condition that vegetation types remain unchanged, an increase in NDVI is often regarded as an indicator of vegetation greening and restoration. However, in local areas, changes in the vegetation type will have a great impact on the NDVI slope value, which will lead to misunderstanding of vegetation changes. Using single-period vegetation-type data to explore the characteristics of changes in the NDVI of different vegetation types assumes that the vegetation type is stable, to an extent, and ignores the influence of vegetation type on the NDVI slope [38]. We compared the differences between the NDVI slope of the pixels with and without a change in the vegetation type to reveal the impact of the change of vegetation type on the NDVI slope value, which was the main focus of this study. Our research provides a new understanding for exploring vegetation change, that is, vegetation-type change has a strong increasing (decreasing) effect on the NDVI slope value. Considering that NDVI changes driven by vegetation type change account for a considerable proportion of the area, NDVI slope changes driven by vegetation type changes should not be ignored. The limitation of this study is that it did not analyze the drivers of vegetation type change. Therefore, vegetation-type transfer data should be effectively combined with climatic, human activity, and other data to explore the factors influencing vegetation-type change.

5. Conclusions

This study explored the changes in NDVI in Xinjiang from 2001 to 2020 using linear regression, F-tests, and CV to analyze the continuous time-series MOD13Q1 NDVI data. A transfer matrix was created using the MCD12Q1 vegetation-type data and the characteristics of vegetation-type transitions from 2001 to 2019 were analyzed. Finally, the relationship between the changes in vegetation type and NDVI was analyzed.
First, most vegetation in Xinjiang was in a stable state (63.29%) from 2001 to 2020, without significant changes, while a small part of the vegetation had significantly changed (36.71%). The main feature of the change was a significant increase in the NDVI. In the significantly-changed-vegetation area, approximately 93.88% of the NDVI increased significantly, while approximately 6.12% decreased significantly. Second, considering the change in vegetation type from 2001 to 2019, the area of sparse vegetation decreased significantly, while the areas of grassland and crops increased significantly, and the three vegetation types of sparse vegetation, grassland, and crops were frequently transferred. Third, in areas with significant changes in NDVI, the area with vegetation types that changed occupied a non-negligible proportion (17.23%). The change of vegetation type has a strong increasing (decreasing) effect on the numerical value of the NDVI slope. In the area where NDVI increased, the mean NDVI slopes of pixels in which sparse vegetation transferred to cropland, sparse vegetation transferred to grassland, and grassland transferred to cropland were 9.8 times that of sparse vegetation, 3.2 times that of sparse vegetation, and 1.97 times that of grassland, respectively.
Considering the above, we believe that research on vegetation dynamics based on NDVI slope should pay special attention to changes in vegetation-type, and in the case of changes in vegetation types in local areas, vegetation changes are mainly determined by the transfer of specific vegetation types; as such, considering only the NDVI slope may not fully indicate vegetation changes.

Author Contributions

Conceptualization, S.L. and Z.D.; methodology, S.L. and Z.D.; investigation, S.L.; formal analysis, S.L. and Z.D.; resources, Z.D.; writing—original draft, S.L.; writing—review and editing, S.L. and Z.D. All authors have read and agreed to the published version of the manuscript.

Funding

The Science and Technology Bureau of Altay Region in Yili Kazak Autonomous Prefecture (Y99M4600AL).

Institutional Review Board Statement

Not applicable.

Informed Consent Statement

Not applicable.

Data Availability Statement

No new data were created or analyzed in this study. Data sharing was not applicable to this study.

Acknowledgments

The authors appreciate the anonymous reviewers for their constructive comments and suggestions that significantly improved the quality of this manuscript.

Conflicts of Interest

The authors declare no conflict of interest.

References

  1. Du, J.; Shu, J.; Yin, J.; Yuan, X.; Jiaerheng, A.; Xiong, S.; He, P.; Liu, W. Analysis on spatio-temporal trends and drivers in vegetation growth during recent decades in Xinjiang, China. Int. J. Appl. Earth Obs. Geoinf. 2015, 38, 216–228. [Google Scholar] [CrossRef]
  2. Li, C.; Wang, R.; Cui, X.; Wu, F.; Yan, Y.; Peng, Q.; Qian, Z.; Xu, Y. Responses of vegetation spring phenology to climatic factors in Xinjiang, China. Ecol. Indic. 2021, 124, 107286. [Google Scholar] [CrossRef]
  3. Luo, N.; Mao, D.; Wen, B.; Liu, X. Climate Change Affected Vegetation Dynamics in the Northern Xinjiang of China: Evaluation by SPEI and NDVI. Land 2020, 9, 90. [Google Scholar] [CrossRef] [Green Version]
  4. Liu, Y.; Li, L.; Chen, X.; Zhang, R.; Yang, J. Temporal-spatial variations and influencing factors of vegetation cover in Xinjiang from 1982 to 2013 based on GIMMS-NDVI3g. Glob. Planet. Chang. 2018, 169, 145–155. [Google Scholar] [CrossRef]
  5. Fensholt, R.; Langanke, T.; Rasmussen, K.; Reenberg, A.; Prince, S.D.; Tucker, C.; Scholes, R.J.; Le, Q.B.; Bondeau, A.; Eastman, R.; et al. Greenness in semi-arid areas across the globe 1981–2007—An Earth Observing Satellite based analysis of trends and drivers. Remote Sens. Environ. 2012, 121, 144–158. [Google Scholar] [CrossRef]
  6. Venter, Z.S.; Scott, S.L.; Desmet, P.G.; Hoffman, M.T. Application of Landsat-derived vegetation trends over South Africa: Potential for monitoring land degradation and restoration. Ecol. Indic. 2020, 113, 106206. [Google Scholar] [CrossRef]
  7. Hill, M.J. Vegetation index suites as indicators of vegetation state in grassland and savanna: An analysis with simulated SENTINEL 2 data for a North American transect. Remote Sens. Environ. 2013, 137, 94–111. [Google Scholar] [CrossRef]
  8. Pettorelli, N.; Chauvenet, A.L.M.; Duffy, J.P.; Cornforth, W.A.; Meillere, A.; Baillie, J.E.M. Tracking the effect of climate change on ecosystem functioning using protected areas: Africa as a case study. Ecol. Indic. 2012, 20, 269–276. [Google Scholar] [CrossRef]
  9. Jiapaer, G.; Liang, S.; Yi, Q.; Liu, J. Vegetation dynamics and responses to recent climate change in Xinjiang using leaf area index as an indicator. Ecol. Indic. 2015, 58, 64–76. [Google Scholar] [CrossRef]
  10. Ju, J.; Masek, J.G. The vegetation greenness trend in Canada and US Alaska from 1984–2012 Landsat data. Remote Sens. Environ. 2016, 176, 1–16. [Google Scholar] [CrossRef]
  11. Ding, C.; Huang, W.; Li, Y.; Zhao, S.; Huang, F. Nonlinear Changes in Dryland Vegetation Greenness over East Inner Mongolia, China, in Recent Years from Satellite Time Series. Sensors 2020, 20, 3839. [Google Scholar] [CrossRef]
  12. Mafi-Gholami, D.; Zenner, E.K.; Jaafari, A.; Ward, R.D. Modeling multi-decadal mangrove leaf area index in response to drought along the semi-arid southern coasts of Iran. Sci. Total Environ. 2019, 656, 1326–1336. [Google Scholar] [CrossRef]
  13. Diao, C.; Wang, L. Incorporating plant phenological trajectory in exotic saltcedar detection with monthly time series of Landsat imagery. Remote Sens. Environ. 2016, 182, 60–71. [Google Scholar] [CrossRef]
  14. He, P.; Sun, Z.; Han, Z.; Dong, Y.; Liu, H.; Meng, X.; Ma, J. Dynamic characteristics and driving factors of vegetation greenness under changing environments in Xinjiang, China. Environ. Sci. Pollut. Res. Int. 2021, 28, 42516–42532. [Google Scholar] [CrossRef]
  15. Bajocco, S.; Ferrara, C.; Alivernini, A.; Bascietto, M.; Ricotta, C. Remotely-sensed phenology of Italian forests: Going beyond the species. Int. J. Appl. Earth Obs. Geoinf. 2019, 74, 314–321. [Google Scholar] [CrossRef]
  16. Holben, B.N. Characteristics of maximum-value composite images from temporal AVHRR data. Int. J. Remote Sens. 1986, 7, 1417–1434. [Google Scholar] [CrossRef]
  17. de Jong, R.; de Bruin, S.; de Wit, A.; Schaepman, M.E.; Dent, D.L. Analysis of monotonic greening and browning trends from global NDVI time-series. Remote Sens. Environ. 2011, 115, 692–702. [Google Scholar] [CrossRef] [Green Version]
  18. Meng, X.; Gao, X.; Li, S.; Lei, J. Spatial and Temporal Characteristics of Vegetation NDVI Changes and the Driving Forces in Mongolia during 1982–2015. Remote Sens. 2020, 12, 603. [Google Scholar] [CrossRef] [Green Version]
  19. Chu, H.; Venevsky, S.; Wu, C.; Wang, M. NDVI-based vegetation dynamics and its response to climate changes at Amur-Heilongjiang River Basin from 1982 to 2015. Sci. Total Environ. 2019, 650, 2051–2062. [Google Scholar] [CrossRef]
  20. Zhang, Z.; Xia, F.; Yang, D.; Huo, J.; Wang, G.; Chen, H. Spatiotemporal characteristics in ecosystem service value and its interaction with human activities in Xinjiang, China. Ecol. Indic. 2020, 110, 105826. [Google Scholar] [CrossRef]
  21. Shi, L.; Halik, Ü.; Mamat, Z.; Aishan, T.; Abliz, A.; Welp, M. Spatiotemporal investigation of the interactive coercing relationship between urbanization and ecosystem services in arid northwestern China. Land Degrad. Dev. 2021, 32, 4105–4120. [Google Scholar] [CrossRef]
  22. Yao, J.; Hu, W.; Chen, Y.; Huo, W.; Zhao, Y.; Mao, W.; Yang, Q. Hydro-climatic changes and their impacts on vegetation in Xinjiang, Central Asia. Sci. Total Environ. 2019, 660, 724–732. [Google Scholar] [CrossRef] [PubMed]
  23. Yao, J.; Chen, Y.; Zhao, Y.; Mao, W.; Xu, X.; Liu, Y.; Yang, Q. Response of vegetation NDVI to climatic extremes in the arid region of Central Asia: A case study in Xinjiang, China. Theor. Appl. Climatol. 2017, 131, 1503–1515. [Google Scholar] [CrossRef]
  24. Zhuang, Q.; Wu, S.; Feng, X.; Niu, Y. Analysis and prediction of vegetation dynamics under the background of climate change in Xinjiang, China. PeerJ 2020, 8, e8282. [Google Scholar] [CrossRef]
  25. Zhang, F.; Wang, C.; Wang, Z.-H. Response of Natural Vegetation to Climate in Dryland Ecosystems: A Comparative Study between Xinjiang and Arizona. Remote Sens. 2020, 12, 3567. [Google Scholar] [CrossRef]
  26. Friedl, M.A.; McIver, D.K.; Hodges, J.C.F.; Zhang, X.Y.; Muchoney, D.; Strahler, A.H.; Woodcock, C.E.; Gopal, S.; Schneider, A.; Cooper, A.; et al. Global land cover mapping from MODIS: Algorithms and early results. Remote Sens. Environ. 2002, 83, 287–302. [Google Scholar] [CrossRef]
  27. Friedl, M.A.; Sulla-Menashe, D.; Tan, B.; Schneider, A.; Ramankutty, N.; Sibley, A.; Huang, X. MODIS Collection 5 global land cover: Algorithm refinements and characterization of new datasets. Remote Sens. Environ. 2010, 114, 168–182. [Google Scholar] [CrossRef]
  28. Zhang, H.; Wang, X.-S. The impact of groundwater depth on the spatial variance of vegetation index in the Ordos Plateau, China: A semivariogram analysis. J. Hydrol. 2020, 588, 125096. [Google Scholar] [CrossRef]
  29. Bao, A.; Huang, Y.; Ma, Y.; Guo, H.; Wang, Y. Assessing the effect of EWDP on vegetation restoration by remote sensing in the lower reaches of Tarim River. Ecol. Indic. 2017, 74, 261–275. [Google Scholar] [CrossRef]
  30. Zhu, L.; Meng, J.; Zhu, L. Applying Geodetector to disentangle the contributions of natural and anthropogenic factors to NDVI variations in the middle reaches of the Heihe River Basin. Ecol. Indic. 2020, 117, 106545. [Google Scholar] [CrossRef]
  31. Schucknecht, A.; Erasmi, S.; Niemeyer, I.; Matschullat, J. Assessing vegetation variability and trends in north-eastern Brazil using AVHRR and MODIS NDVI time series. Eur. J. Remote Sens. 2013, 46, 40–59. [Google Scholar] [CrossRef] [Green Version]
  32. Piao, S.; Wang, X.; Park, T.; Chen, C.; Lian, X.; He, Y.; Bjerke, J.W.; Chen, A.; Ciais, P.; Tømmervik, H.; et al. Characteristics, drivers and feedbacks of global greening. Nat. Rev. Earth Environ. 2020, 1, 14–27. [Google Scholar] [CrossRef]
  33. Waldron, B.; Gui, D.; Liu, Y.; Feng, L.; Dai, H. Assessing water distribution and agricultural expansion in the Cele Oasis, China. Env. Monit. Assess. 2020, 192, 288. [Google Scholar] [CrossRef] [Green Version]
  34. Vitousek Peter, M.; Mooney Harold, A.; Lubchenco, J.; Melillo Jerry, M. Human Domination of Earth’s Ecosystems. Science 1997, 277, 494–499. [Google Scholar] [CrossRef] [Green Version]
  35. Li, A.; Wu, J.; Huang, J. Distinguishing between human-induced and climate-driven vegetation changes: A critical application of RESTREND in inner Mongolia. Landsc. Ecol. 2012, 27, 969–982. [Google Scholar] [CrossRef]
  36. Chen, C.; Park, T.; Wang, X.; Piao, S.; Xu, B.; Chaturvedi, R.K.; Fuchs, R.; Brovkin, V.; Ciais, P.; Fensholt, R.; et al. China and India lead in greening of the world through land-use management. Nat. Sustain. 2019, 2, 122–129. [Google Scholar] [CrossRef] [PubMed]
  37. Yang, G.; Li, F.; Chen, D.; He, X.; Xue, L.; Long, A. Assessment of changes in oasis scale and water management in the arid Manas River Basin, north western China. Sci. Total Environ. 2019, 691, 506–515. [Google Scholar] [CrossRef]
  38. Ma, L.; Yang, S.; Gu, Q.; Li, J.; Yang, X.; Wang, J.; Ding, J. Spatial and temporal mapping of cropland expansion in northwestern China with multisource remotely sensed data. CATENA 2019, 183, 104192. [Google Scholar] [CrossRef]
  39. Chen, Y.; Wang, W.; Guan, Y.; Liu, F.; Zhang, Y.; Du, J.; Feng, C.; Zhou, Y. An integrated approach for risk assessment of rangeland degradation: A case study in Burqin County, Xinjiang, China. Ecol. Indic. 2020, 113, 106203. [Google Scholar] [CrossRef]
  40. Lu, Q.; Zhao, D.; Wu, S.; Dai, E.; Gao, J. Using the NDVI to analyze trends and stability of grassland vegetation cover in Inner Mongolia. Theor. Appl. Climatol. 2019, 135, 1629–1640. [Google Scholar] [CrossRef]
  41. Zhang, X.; Hu, Y.; Zhuang, D.; Qi, Y.; Ma, X. NDVI spatial pattern and its differentiation on the Mongolian Plateau. J. Geogr. Sci. 2009, 19, 403–415. [Google Scholar] [CrossRef]
Figure 1. Main vegetation types in Xinjiang.
Sustainability 14 00582 g001
Figure 2. Trends in vegetation in Xinjiang from 2001 to 2020 as indicated by the NDVI slope.
Sustainability 14 00582 g002
Figure 3. NDVI slope in different geomorphic units.
Sustainability 14 00582 g003
Figure 4. Spatial distribution of the CV and changes of vegetation. (a) Mean CV of the NDVI-increasing region. (b) Mean CV of the NDVI-decreasing region.
Sustainability 14 00582 g004
Figure 5. Interannual variation in the area of the main vegetation types.
Sustainability 14 00582 g005
Figure 6. Change in the NDVI of pixels in the area with no vegetation type change.
Sustainability 14 00582 g006
Figure 7. Vegetation type structure in the area with NDVI change.
Sustainability 14 00582 g007
Figure 8. Spatial distribution of changes in vegetation type and NDVI. (a) Unchanged vegetation type and increased NDVI. (b) Changed vegetation type and increased NDVI. (c) Change of vegetation type in the region where NDVI increased.
Sustainability 14 00582 g008
Figure 9. Change of vegetation type in the region where NDVI decreased.
Sustainability 14 00582 g009
Figure 10. Main vegetation types and their changes in the area with a high CV of NDVI. (a) Spatial distribution of vegetation types with a high CV. (b) Pie chart of vegetation types and vegetation type change.
Sustainability 14 00582 g010
Figure 11. Changes in the NDVI slope in the area with increased NDVI.
Sustainability 14 00582 g011
Figure 12. Changes in the NDVI slope in the area with decreased NDVI.
Sustainability 14 00582 g012
Figure 13. Vegetation changes in different geomorphic areas. (a) Geomorphological type of Xinjiang, (b) changes of vegetation types in different geomorphic areas, and (c) variation of NDVI in different geomorphic areas.
Sustainability 14 00582 g013
Table 1. Classification of vegetation types.
Vegetation Type (IGBP)Reclassified Vegetation Type
Evergreen Needleleaf ForestForests
Evergreen Broadleaf Forest
Deciduous Needleleaf Forest
Deciduous Broadleaf Forest
Mixed Forest
Closed ShrublandShrubs
Open Shrubland
Woody SavannaGrass
Savanna
Grassland
CroplandCrops
Permanent WetlandOther land types
Urban and Built-up Land
Cropland/Natural Vegetation Mosaics
Permanent Snow and Ice
Water Bodies
BarrenNDVI > 0.1 and FVC < 0.1Sparse vegetation
BarrenNDVI < 0.1No vegetation
Note: FVC, fractional vegetation cover.
Table 2. Proportions of vegetation pixels in each category of the slope of NDVI.
SlopeSignificanceSpeedPercentage
>0.01Slope > 0
p < 0.05
High speed increase20.23%
0.008–0.016.00%
0.006–0.008Medium speed increase9.56%
0.004–0.00616.08%
0.002–0.00425.68%
0–0.002Low speed increase16.33%
−0.002–0Slope < 0
p < 0.05
Low speed decrease0.56%
−0.004–−0.002Medium speed decrease1.77%
−0.006–−0.0041.49%
−0.008–−0.0060.85%
−0.01–−0.008High speed decrease0.47%
<−0.010.97%
Table 3. Changes in areas of main vegetation types in Xinjiang from 2001 to 2019 (km2).
Vegetation-Type20012019Change Magnitude
Crops46,248.1470,806.1653.10%
Grass379,303.97394,490.604.00%
Shrubs450.42865.8392.23%
Forests2127.611853.10−12.90%
Sparse vegetation404,602.14364,432.19−9.93%
Table 4. Transfer matrix of vegetation types (km2).
20012019
CropsSparse VegetationGrassShrubsForestsOther
Crops42,268.2614.843790.841.010.00171.52
Sparse vegetation2566.97357,582.8243,382.82499.160.00555.79
Grass25,915.446452.10345,606.44134.30299.80714.57
Shrubs6.9837.86108.30216.551.0156.82
Forests0.000.00559.662.411527.2336.97
Other44.39331.44358.841.9024.9820,132.31
Publisher’s Note: MDPI stays neutral with regard to jurisdictional claims in published maps and institutional affiliations.

