
Measurement and Monitoring of Particulate Matter in Construction Sites: Guidelines for Gravimetric Approach


Abstract
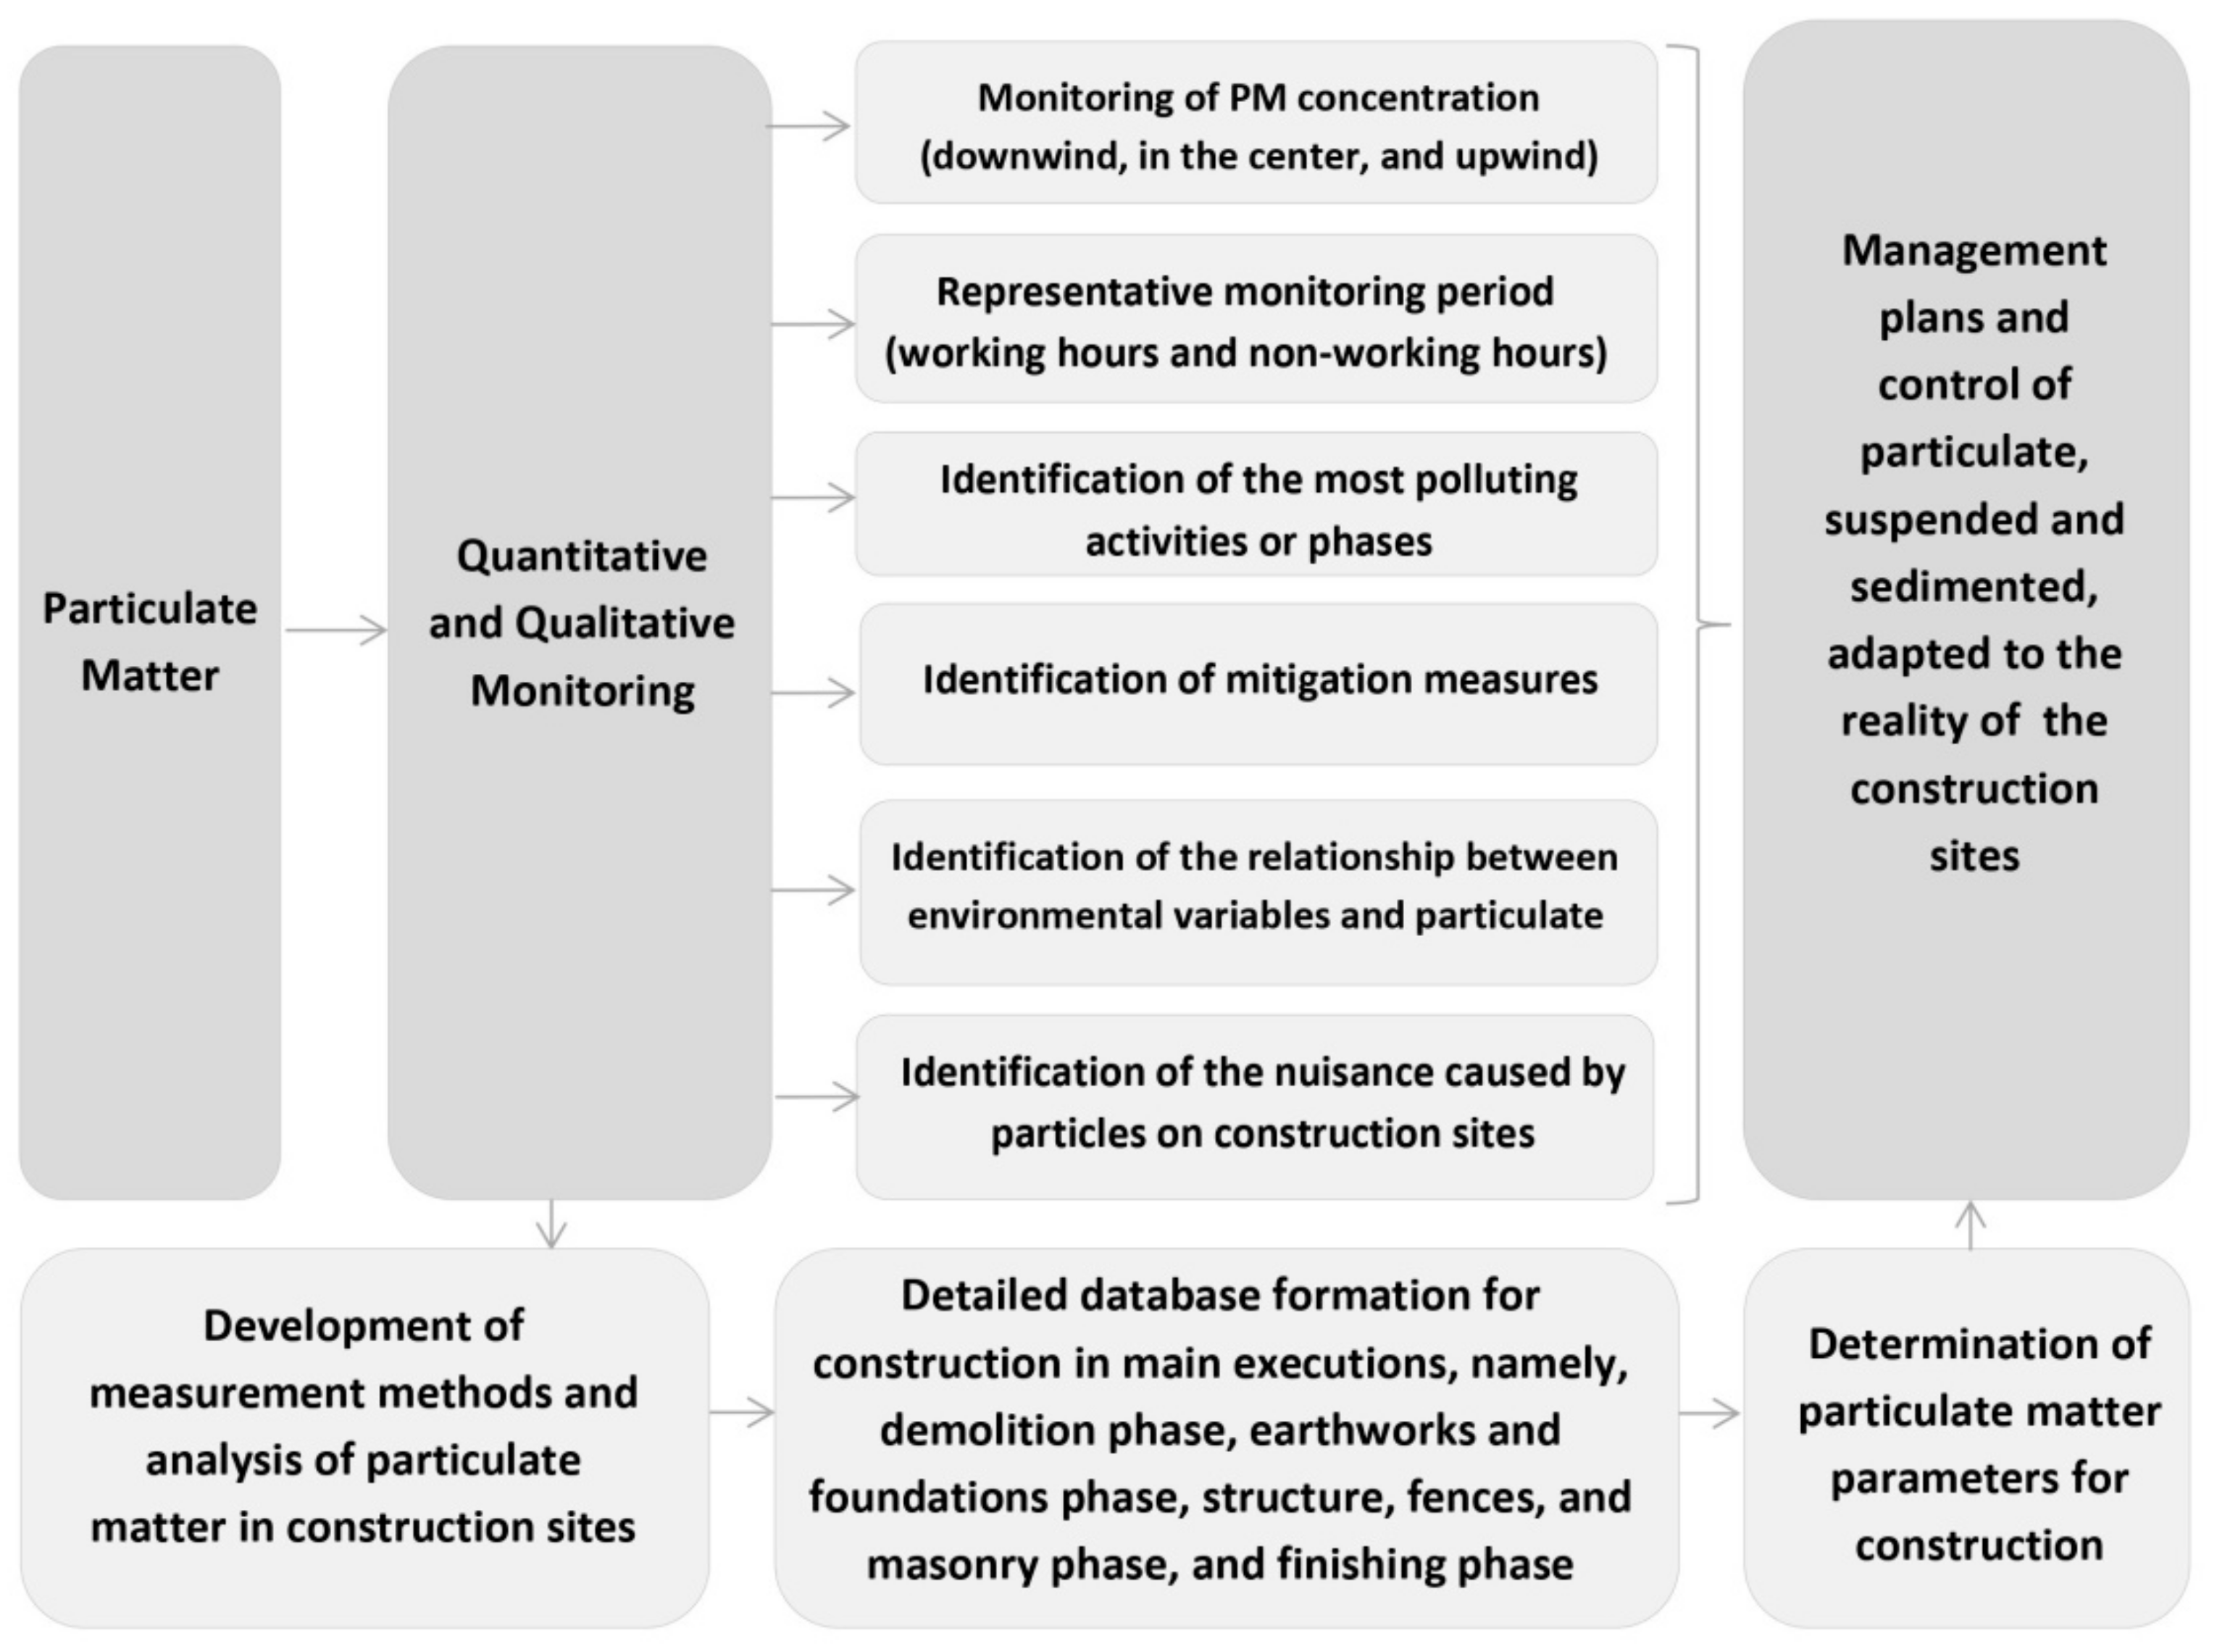
:1. Introduction
2. Legislation on Suspended and Sedimented Particulate Matter
3. Equipment and Methods for Measuring Particulate Matter in Construction
3.1. Equipment and Filters for Measuring Suspended Particulate Matter
3.2. Equipment and Methods for Measuring Sedimented Particles
3.3. Experimental Studies on Measuring Particulate Matter in Construction
4. Research Method
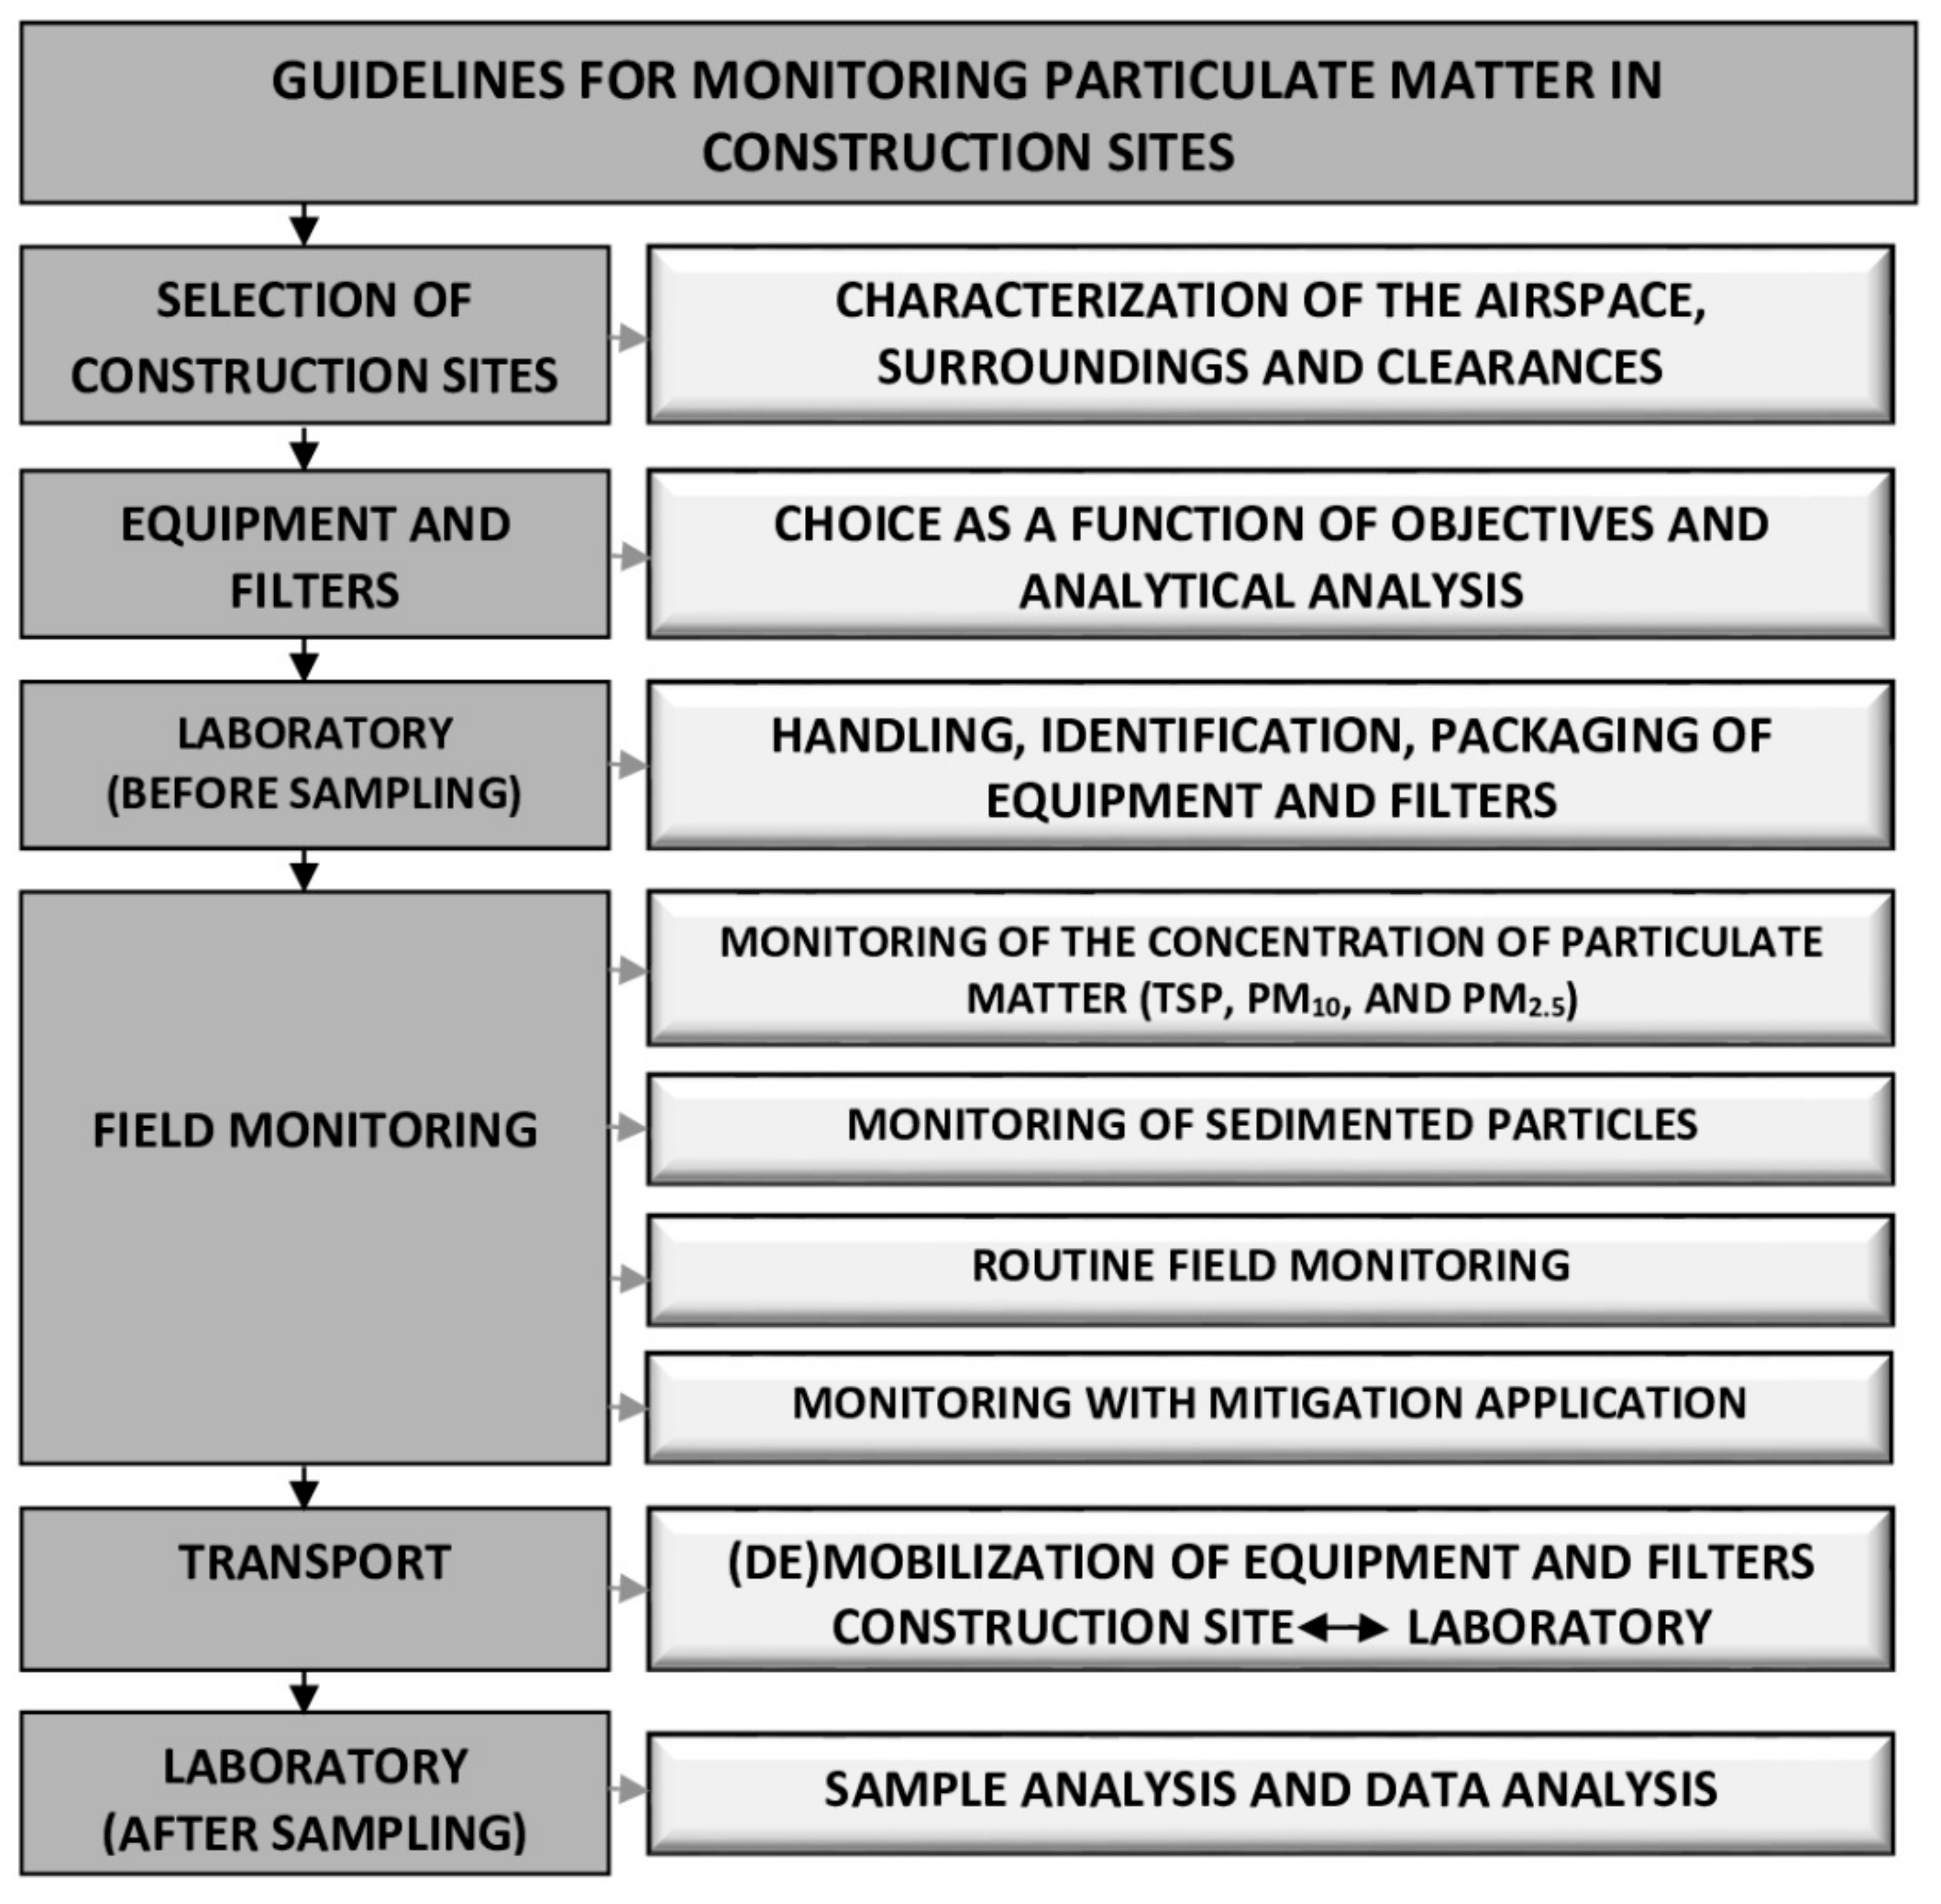
5. Guidelines for Measuring and Monitoring Particulate Matter at Construction Sites
5.1. Selection of Construction Sites and Characterization of the Micro-Region
5.2. Equipment and Filter Selection
5.3. Laboratory Activities Prior to Monitoring
- Procedure for the scale:
- Check that the scale is clean and remove any filter or object in the surroundings, leaving the environment clean;
- Check the scale level and adjust if necessary;
- Switch on the balance and let it stabilize for 3 h;
- Place the silica gel immediately after turning it on;
- Try to make the internal adjustment, then weigh and record the reference weight value for the blank of the scale;
- After 3 h, start weighing.
- Procedure for the filter:
- Tare the balance;
- Pass the filter through the load elimination system;
- Place the filter on the scale;
- Record the weight after the scale stabilizes;
- Remove the filter and wait for the balance to return to zero;
- Repeat the weighing (µg) “n” times, passing the filter through the load elimination system again until, in two consecutive measurements, there is variation only in the sixth decimal place (i.e., 0.00000Y, 0.00000X). In this way, the average filter mass in µg is obtained according to Section 5.6.
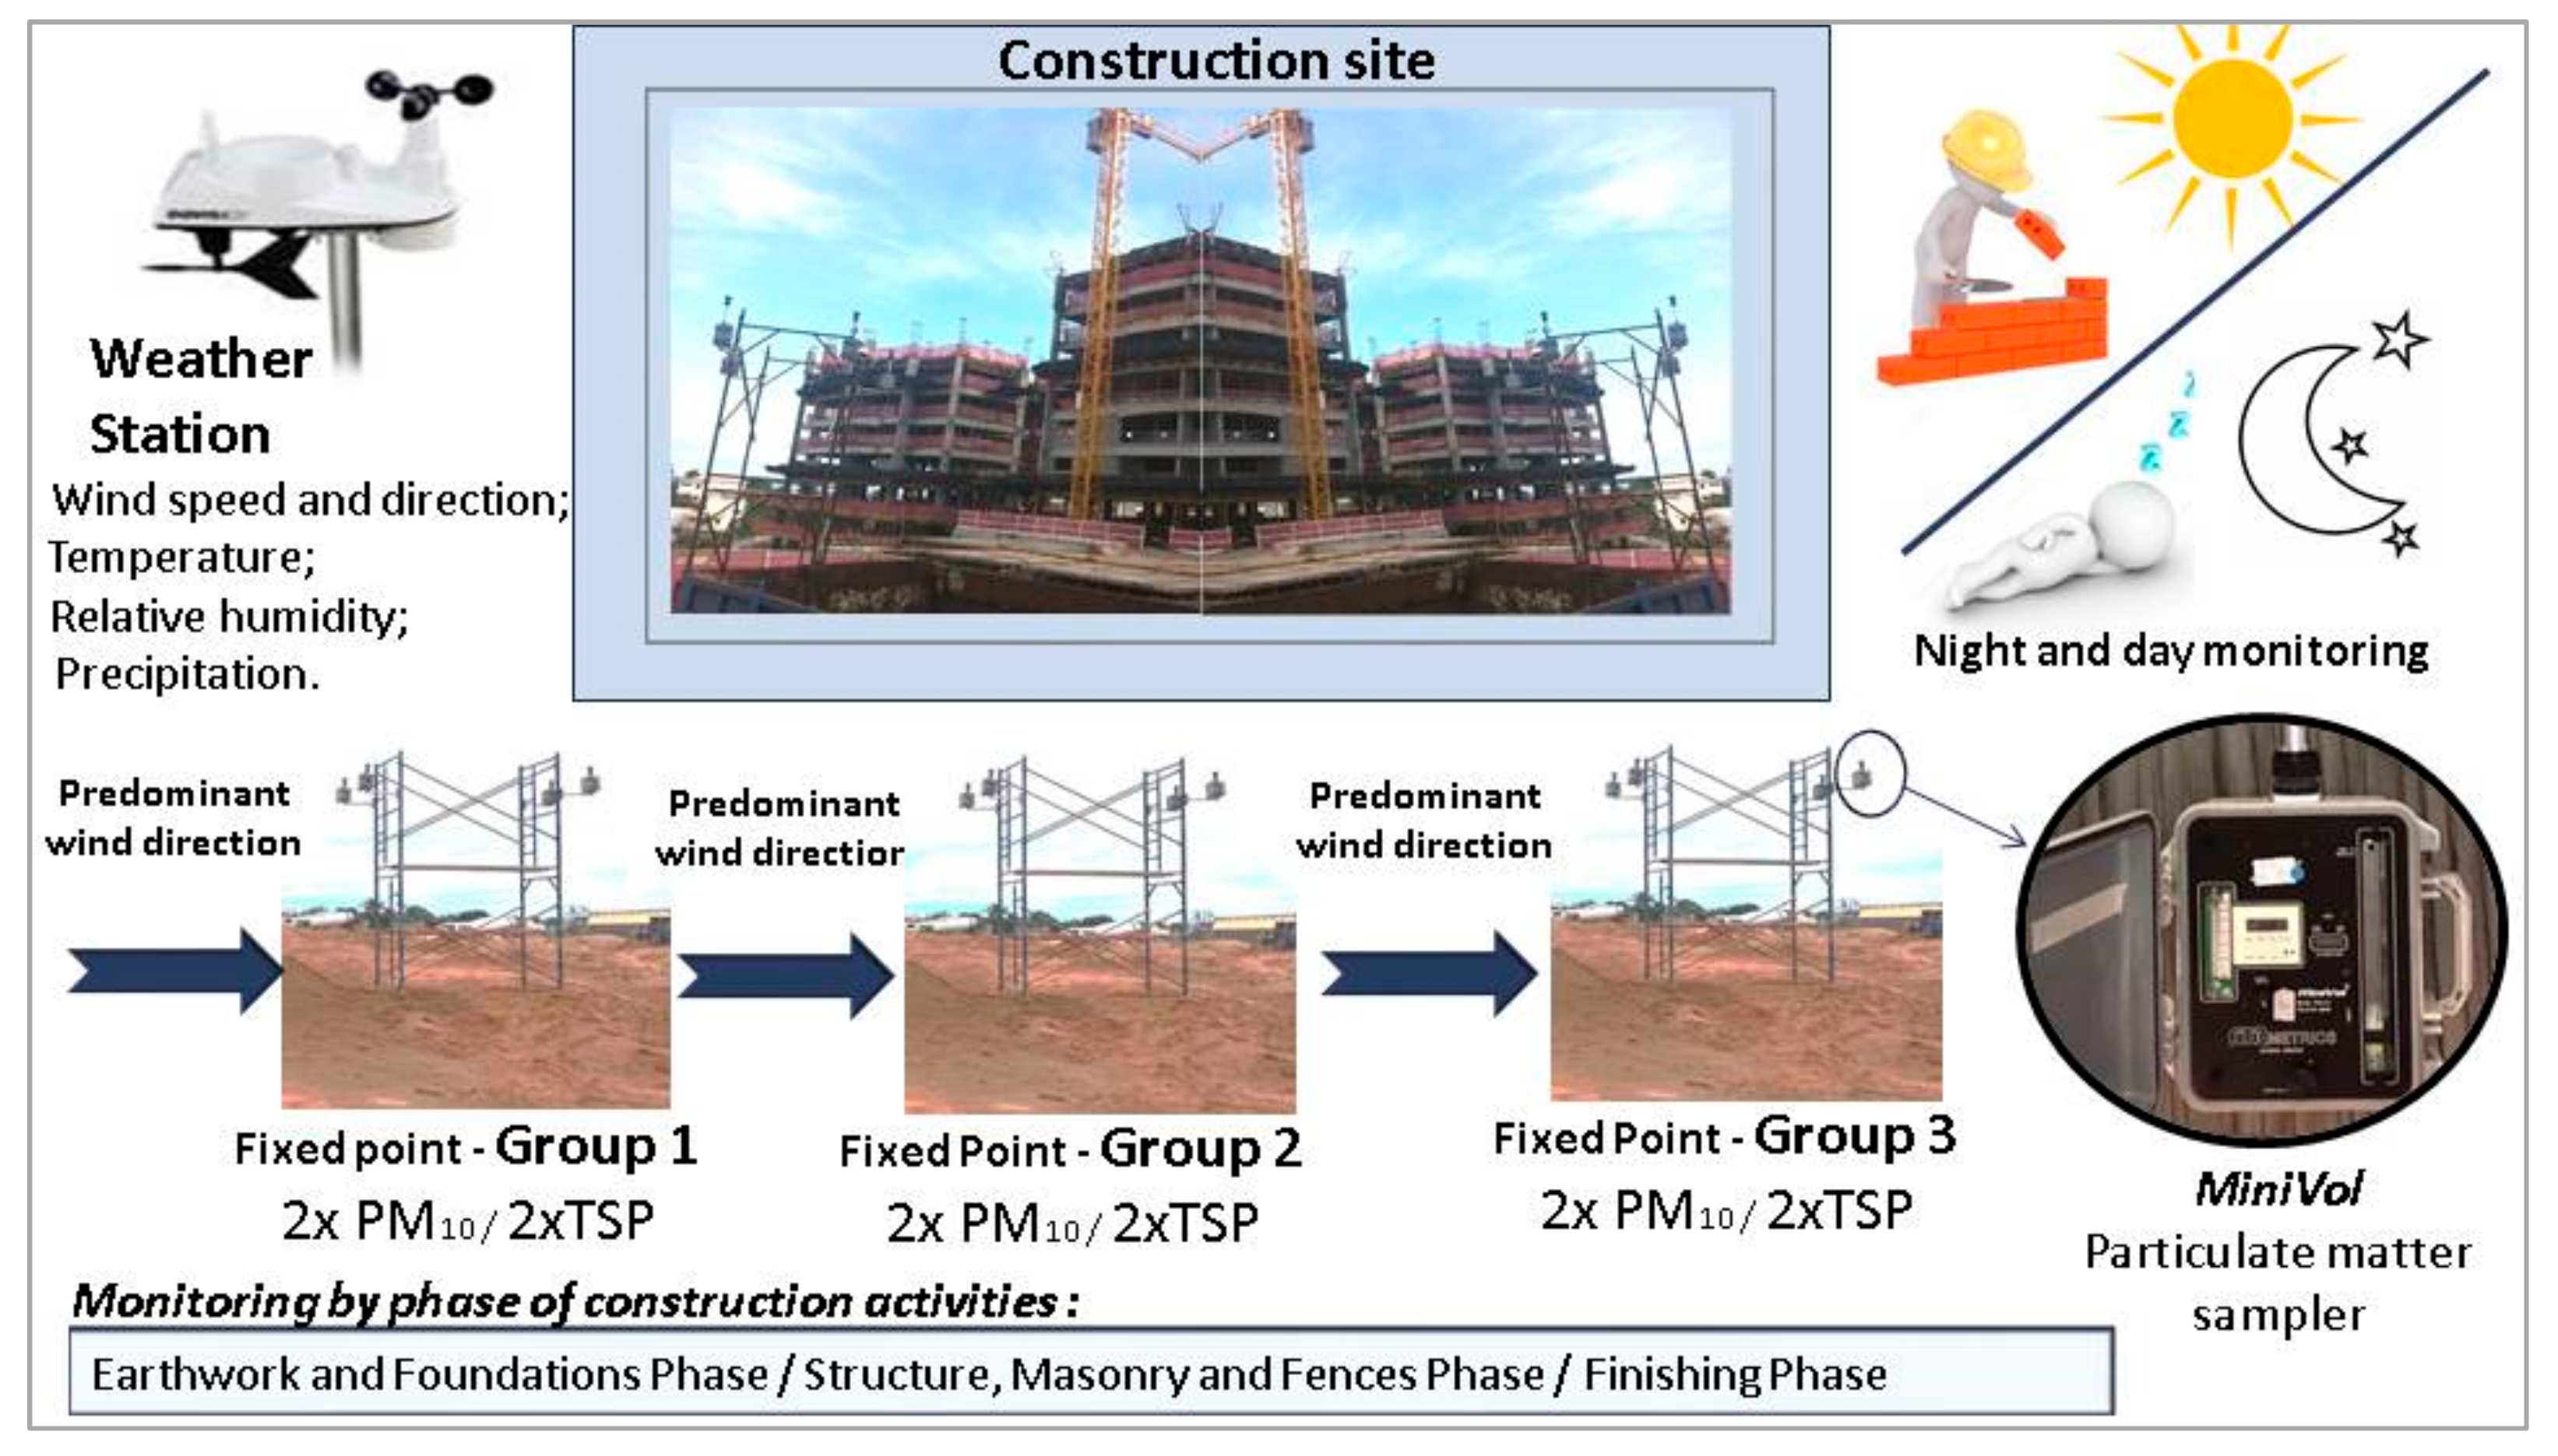
5.4. Field Monitoring
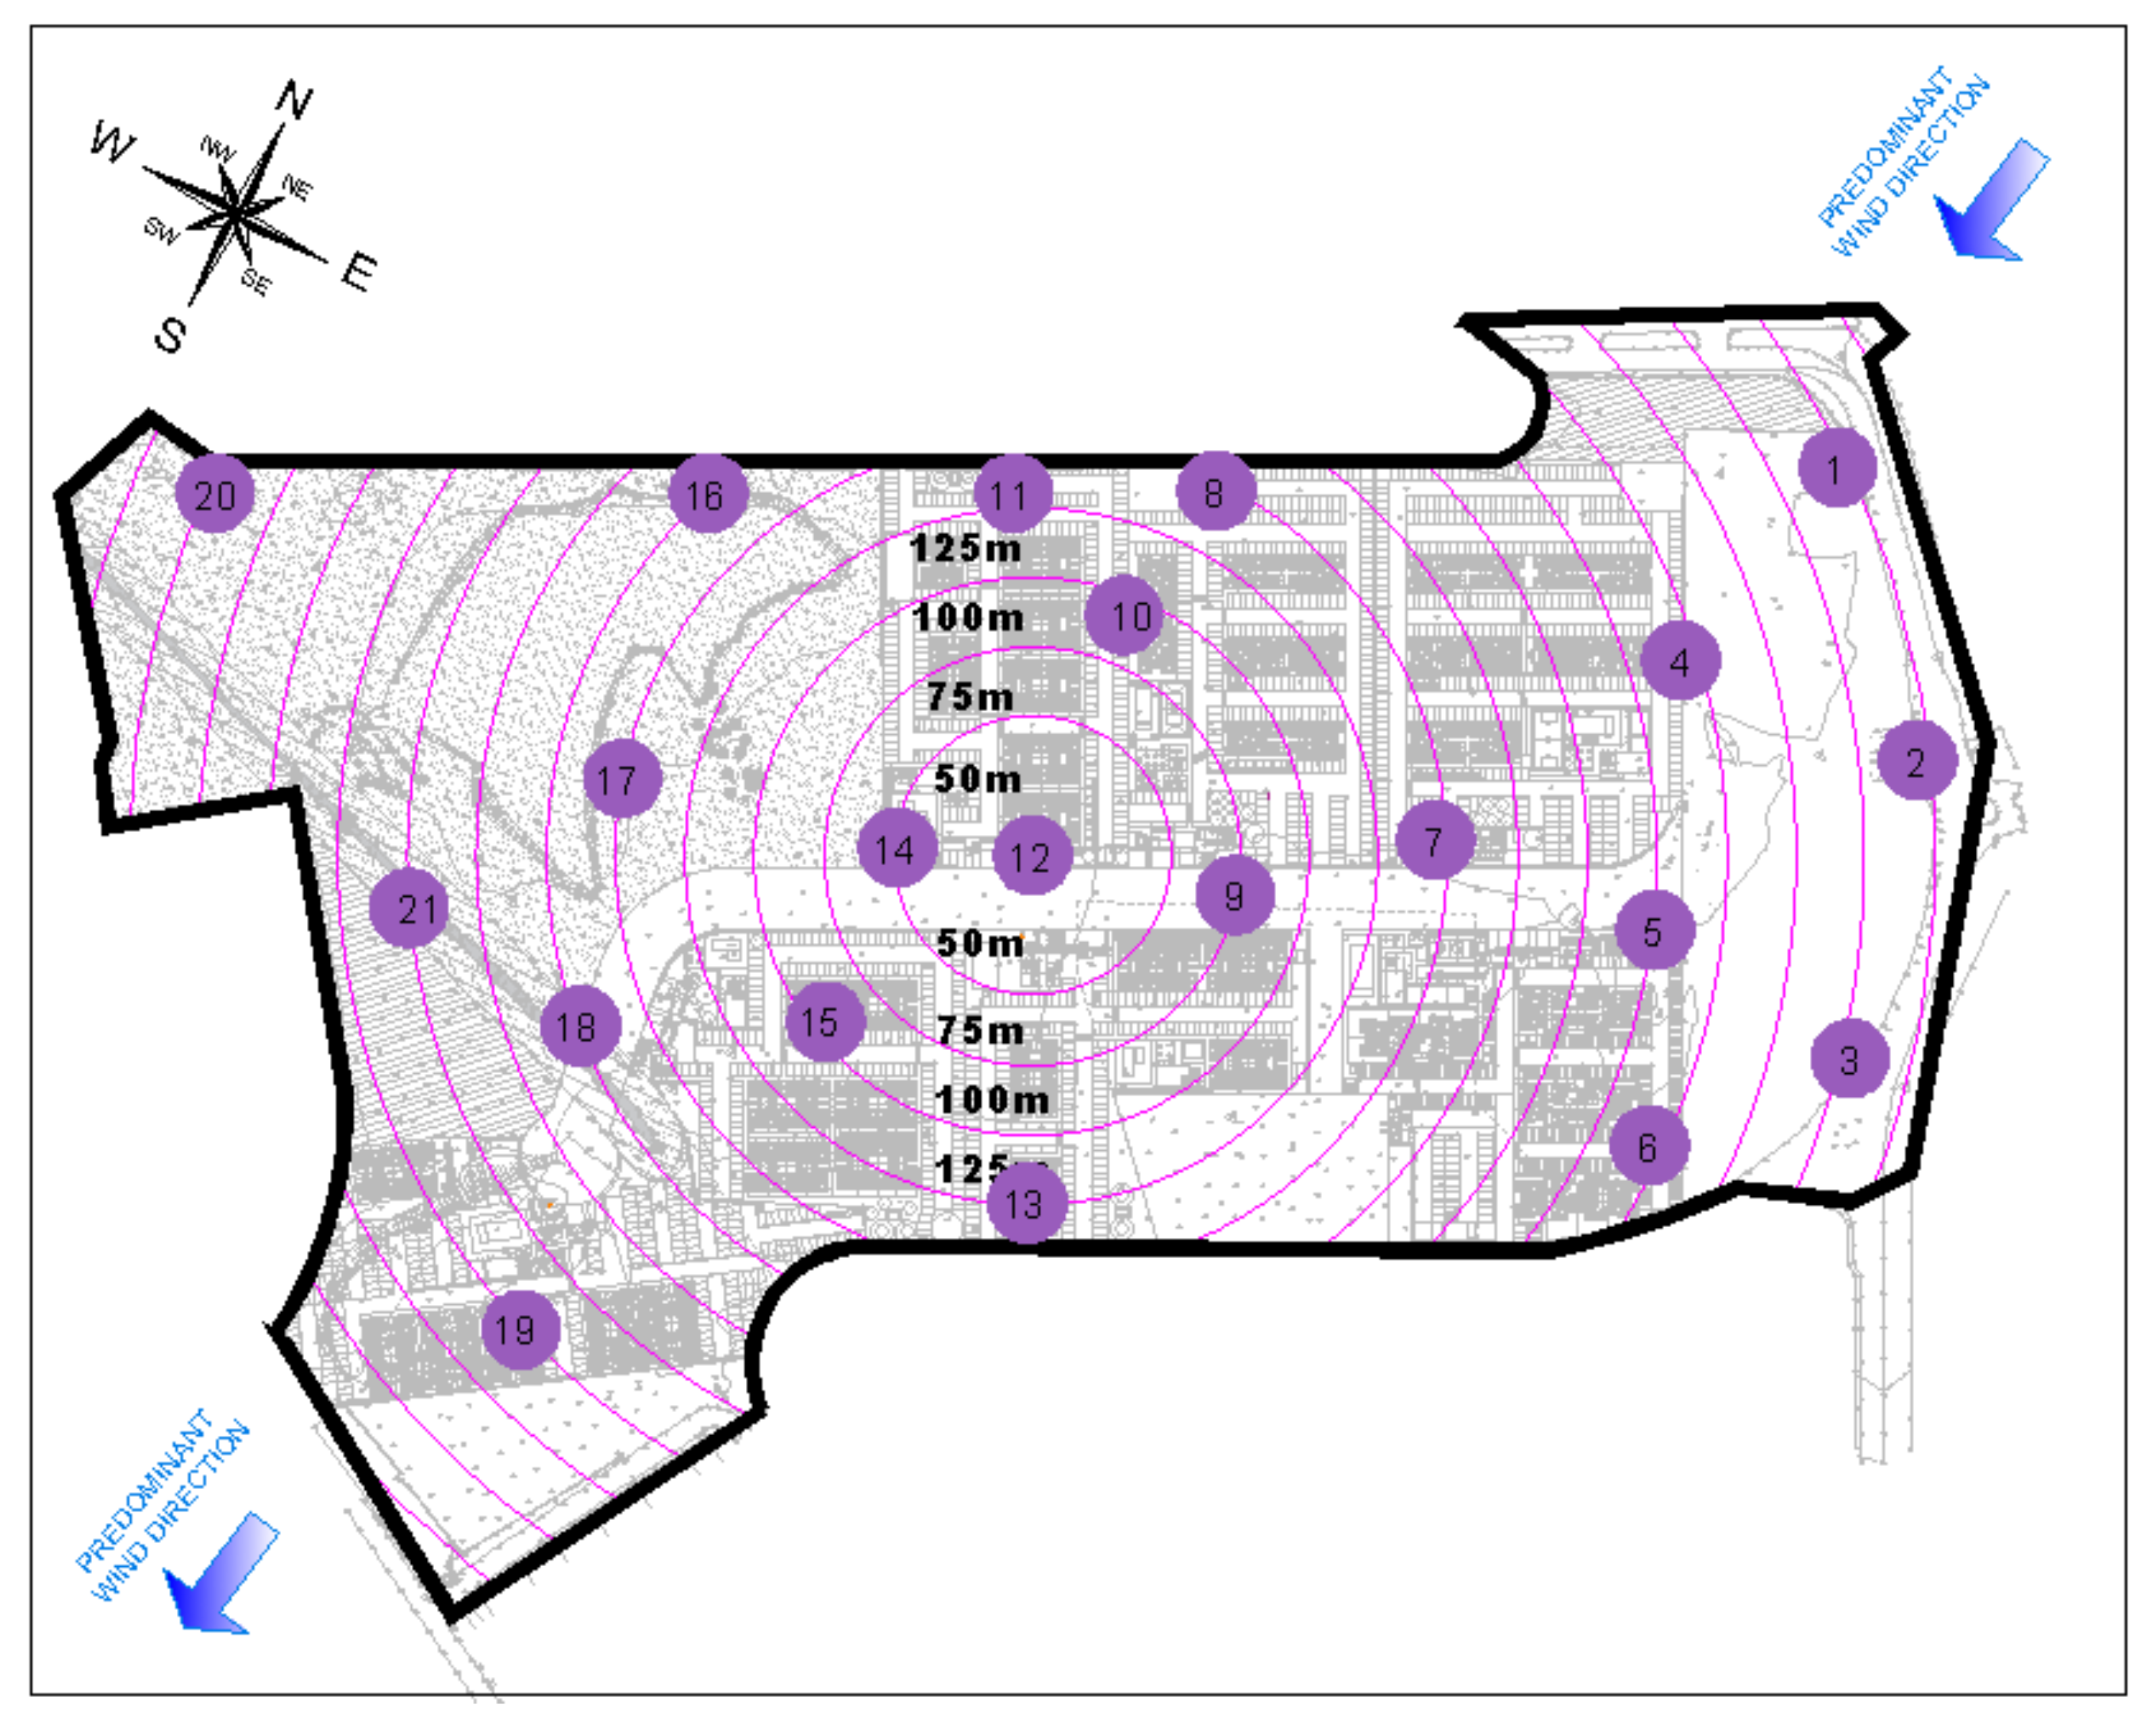
5.4.1. Monitoring of Suspended Particles
- The construction site must generally be downwind, and the emitting activities at the construction site must guarantee the period of exposure to prevailing wind conditions and pollution plumes;
- The equipment must be in an open and flat area with structural similarity and absence of proximity to skyscrapers in at least three directional quadrants of the equipment;
- The airflow around the sampler must be free from any obstruction over a range of at least 270°;
- The entrance of the equipment must be at least 2 m from the entrance of any other equipment;
- For samplers rented for simultaneous sampling (comparative evaluations), the entries must be, at most, 4 m from each other.
- It is recommended to keep heavy activities and other major sources of emission of primary particles, according to the road parameters, a distance/volume of at least 25 m from the main arterial circulation routes;
- Vertical and horizontal barriers (vegetation, trees, buildings, walls, among other obstacles) that can impede the normal wind flow around the sampler or monitoring path must be observed;
- The sampler must be at least 90% of the monitoring path, with free airflow, and be away from vertical obstacles, so that the distance between the capture point is at least twice the maximum height of the obstacle, above the sampler path;
- The equipment must be at least 2 m away from any obstacle; it is noteworthy that the fence of the construction site can be a restriction on installation; in this case, it is recommended to position it above the siding;
- The sampler must be at least 20 m away from trees, buildings, or other major obstacles;
- The height of the stations must be at least 2 m above the ground or the height of the breathing zone.
- Demolition Phase: characterized by a need to demolish buildings that will not be maintained on the ground;
- Earthworks and Foundations Phase: characterized by a wide-open area at the construction site;
- Structures, Fences, and Masonry Phase: characterized by the elevation of the building with emissions at and above ground level;
- Finishing Phase: characterized by final activities in external and internal environments.
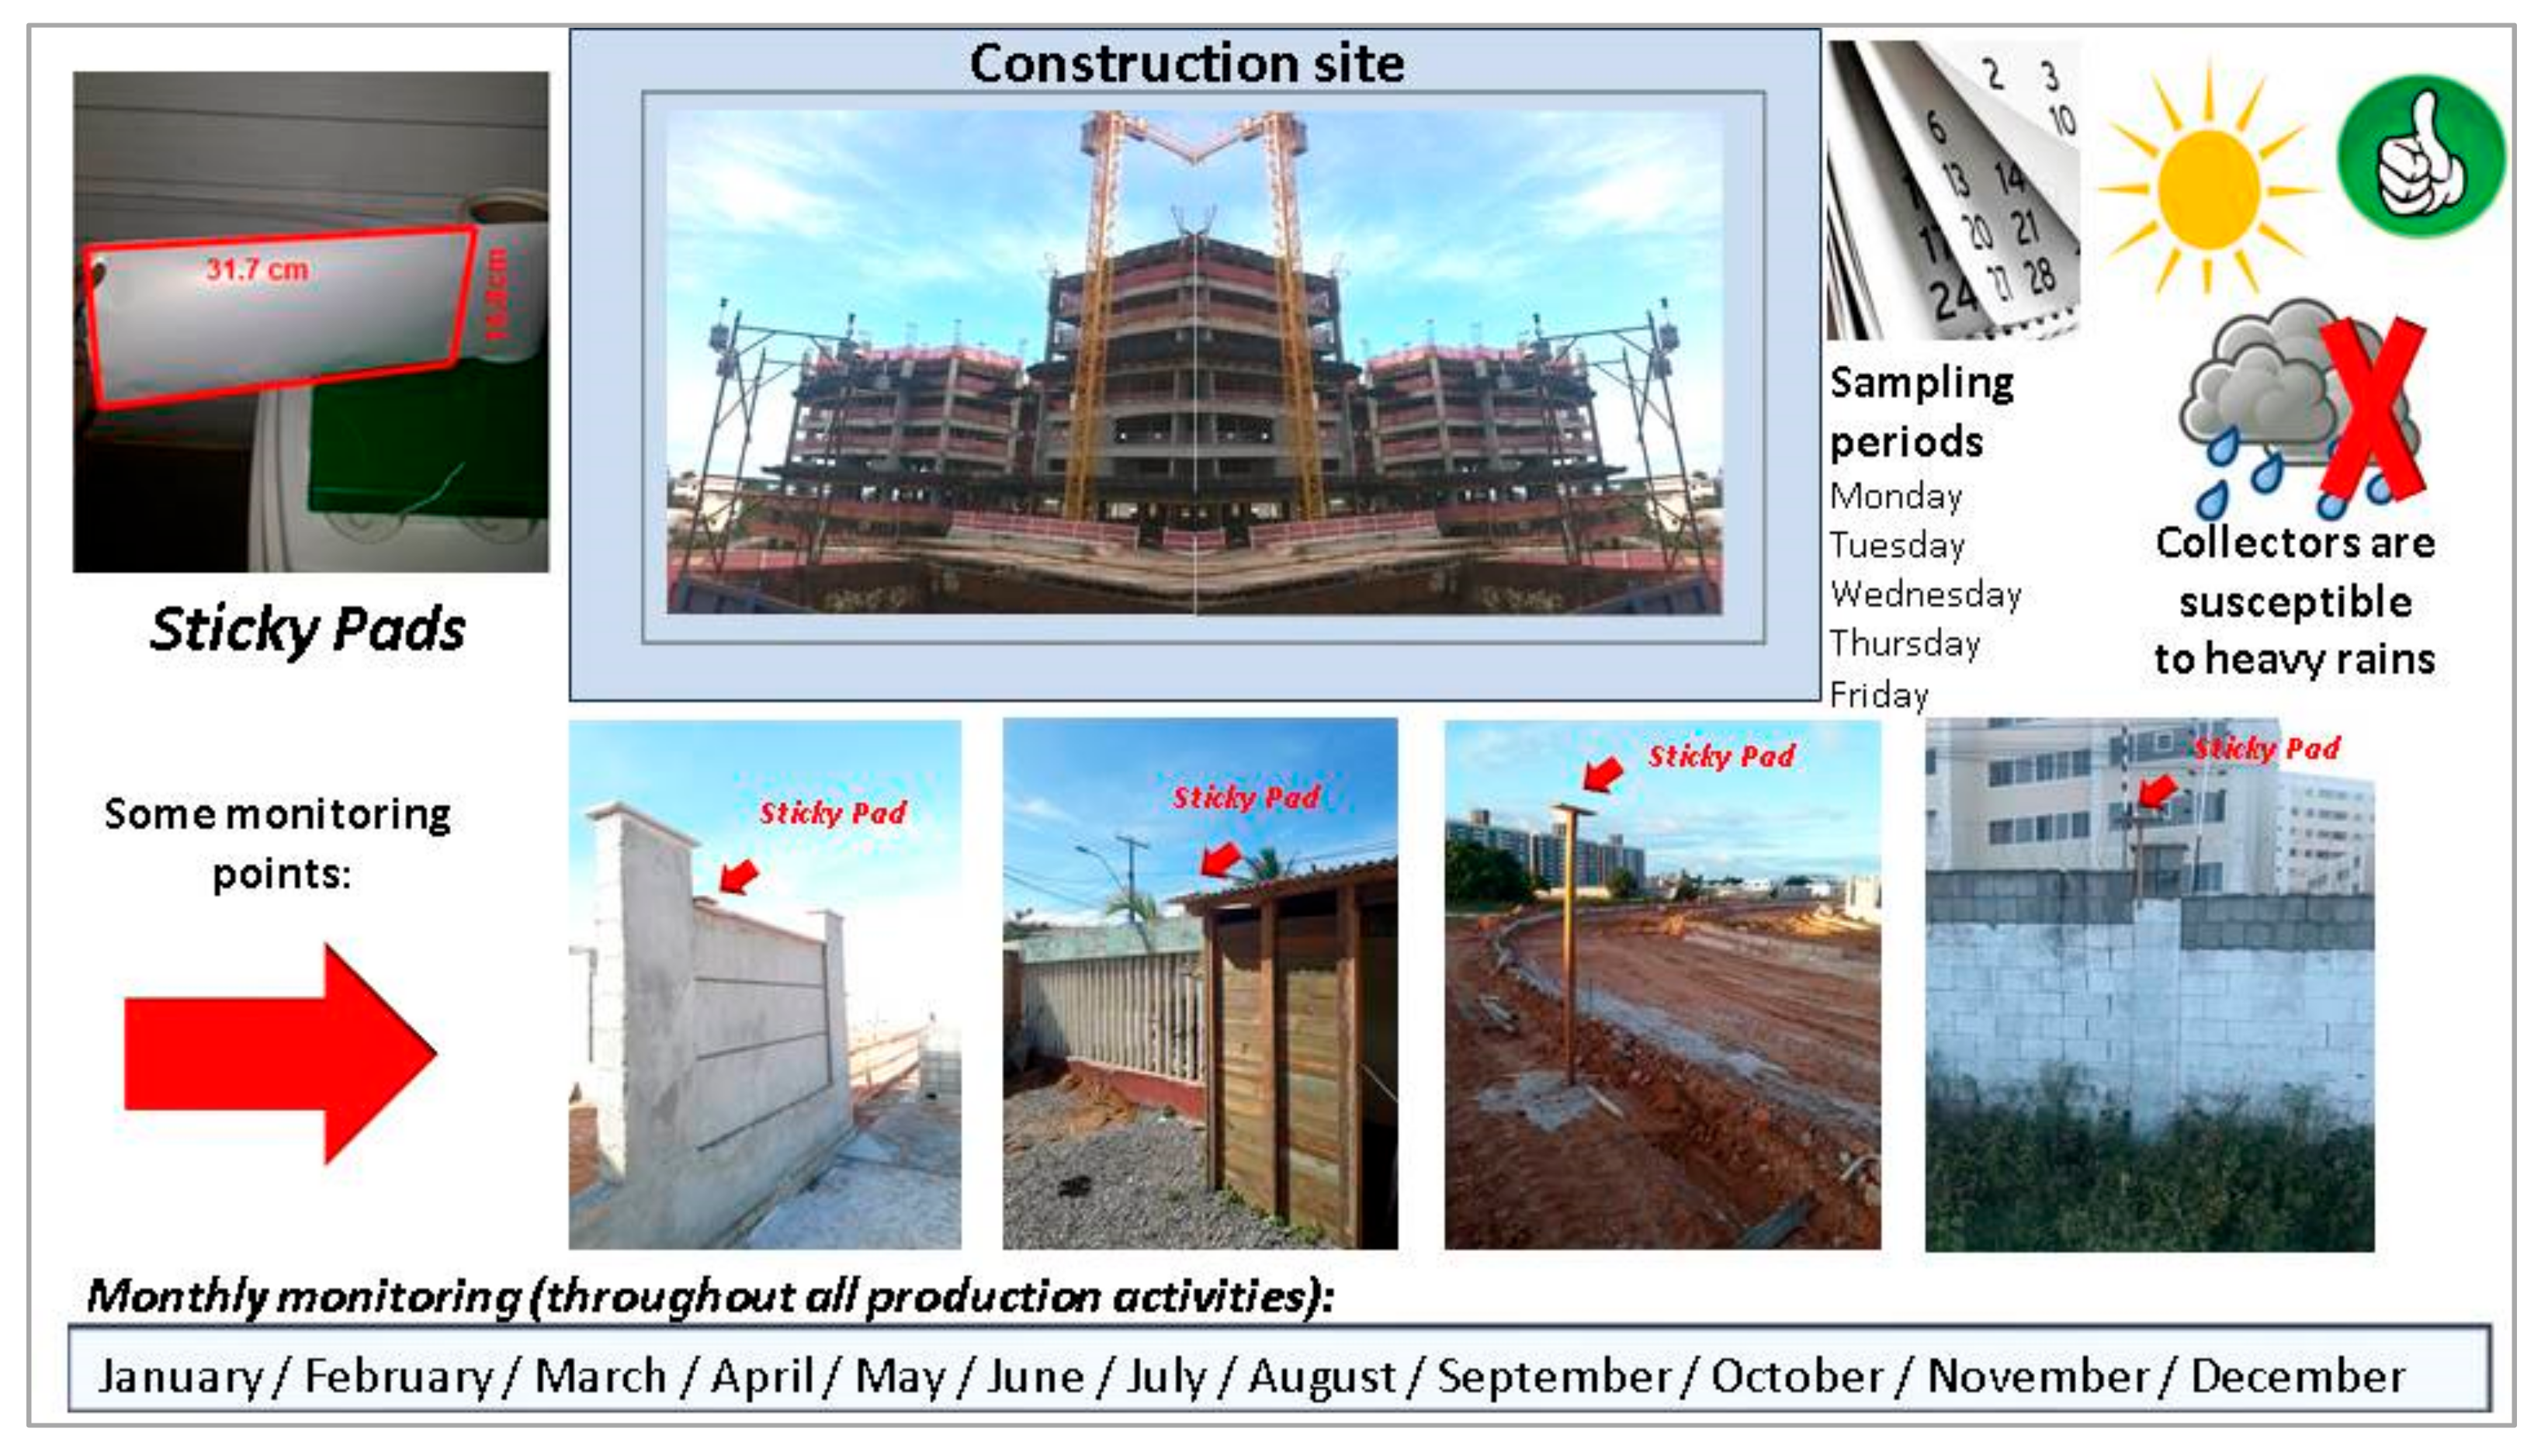
5.4.2. Monitoring of Sedimented Particles
5.4.3. Routine Field Monitoring
5.4.4. Monitoring with Mitigation Application
5.5. Transport
- Care must be taken when transporting equipment and filters to the construction site/laboratory in order to avoid contamination and loss of characteristics;
- Samples must be stored immediately after collection in order to avoid contamination and hydration of the filter surface.
5.6. Laboratory Activities after Sampling
6. Application of Guidelines for Monitoring Particulate Matter at Construction Sites
7. Limitations and Recommendations for Future Research
8. Conclusions
Author Contributions
Funding
Institutional Review Board Statement
Informed Consent Statement
Acknowledgments
Conflicts of Interest
References
- Jung, S.; Kang, H.; Sung, S.; Hong, T. Health risk assessment for occupants as a decision-making tool to quantify the environmental effects of particulate matter in construction projects. Build. Environ. 2019, 161, 106267. [Google Scholar] [CrossRef]
- Wang, L.K.; Pereira, N.C.; Hung, Y.T. Air Pollution Control Engineering; Human Press: Totowa, NJ, USA, 2004. [Google Scholar]
- World Health Organization. WHO Global Air Quality Guidelines. Global Update 2021. Particulate Matter (PM2.5 and PM10), Ozone, Nitrogen Dioxide, Sulfur Dioxide and Carbon Monoxide. 2021. Available online: https://apps.who.int/iris/bitstream/handle/10665/345329/9789240034228-eng.pdf?sequence=1&isAllowed=y (accessed on 11 December 2021).
- World Health Organization. Ambient Air Pollution: A Global Assessment of Exposure and Burden of Disease; World Health Organization: Geneva, Switzerland, 2016; Available online: https://apps.who.int/iris/bitstream/handle/10665/250141/9789241511353-eng.pdf;jsessionid=26F10218EBA7462EF0C07364E9FB34E4?sequence=1 (accessed on 18 November 2021).
- Machado, M.; Reisen, V.A.; Santos, J.M.; Reis, N.C., Jr.; Frère, S.; Bondon, P.; Ispány, M.; Aranda Cotta, H.H. Use of multivariate time series techniques to estimate the impact of particulate matter on the perceived annoyance. Atmos. Environ. 2020, 222, 117080. [Google Scholar] [CrossRef]
- Baron, P.; Generation and Behavior of Airborne Particles (Aerosols). Center for Disease Control and Prevention, NIOSH. 2010. Available online: https://www.sdpt.net/rd/Aerosol_101.pdf (accessed on 18 November 2021).
- Tian, G.; Wang, J.; Lu, Z.; Wang, H.; Zhang, W.; Ding, W.; Zhang, F. Indirect effect of PM1 on endothelial cells via inducing the release of respiratory inflammatory cytokines. Toxicol. Vitr. 2019, 57, 203–210. [Google Scholar] [CrossRef]
- Cheriyan, D.; Choi, J. Estimation of particulate matter exposure to construction workers using low-cost dust sensors. Sustain. Cities Soc. 2020, 59, 102197. [Google Scholar] [CrossRef]
- Khamraev, K.; Cheriyan, D.; Choi, J. A review on health risk assessment of PM in the construction industry–Current situation and future directions. Sci. Total Environ. 2020, 758, 143716. [Google Scholar] [CrossRef]
- Cheriyan, D.; Choi, J.H. A review of research on particulate matter pollution in the construction industry. J. Clean. Prod. 2020, 254, 120077. [Google Scholar] [CrossRef]
- Lipfert, F.W. Filter artifacts associated with particulate measurements: Recent evidence and effects on statistical relationships. Atmos. Environ. 1994, 28, 3233–3249. [Google Scholar] [CrossRef]
- Araújo, I.P.S.; Costa, D.B.; Moraes, R.J.B. Identification and characterization of particulate matter concentrations at construction jobsites. Sustainability 2014, 6, 7666–7688. [Google Scholar] [CrossRef] [Green Version]
- Moraes, R.J.B.; Costa, D.B.; Araujo, I.P.S. Particulate matter concentration from construction sites: Concrete and masonry works. J. Environ. Eng. 2016, 142, 05016004. [Google Scholar] [CrossRef]
- Xing, J.; Ye, K.; Zuo, J.; Jiang, W. Control dust pollution on construction sites: What governments do in China? Sustainability 2018, 10, 2945. [Google Scholar] [CrossRef] [Green Version]
- Sa’adeh, H.; Aburugia, S.; Chiari, M. An assessment of the impact of construction work on fine particulate matter in the University of Jordan: A PIXE study. X-Ray Spectrom. 2019, 48, 569–578. [Google Scholar] [CrossRef]
- Chiang, Y.C.; Kuo, C.C. Characteristics of suspended particulate matter emitted from various stages of construction works. J. Aerosol Sci. 2004, 35, S995–S996. [Google Scholar] [CrossRef]
- Feliciano, M.; Gonçalves, A.; Gomes, P.; Cardoso, A.; Araújo, R. Partículas em Suspensão na Praça Camões (Bragança), durante a Construção do Parque de Estacionamento. In Proceedings of the Conferência Nacional De Ambiente, Lisboa, Portugal, 27–29 October 2004. (In Portuguese). [Google Scholar]
- Li, H.; Fang, C.H.; Shi, W.; Gurusamy, S.; Li, S.; Krishnan, M.N.; George, S. Size and site dependent biological hazard potential of particulate matters collected from different heights at the vicinity of a building construction. Toxicol. Lett. 2015, 238, 20–29. [Google Scholar] [CrossRef] [PubMed]
- Azarmi, F.; Kumar, P.; Marsh, D.; Fuller, G. Assessment of the long-term impacts of PM10 and PM2.5 particles from construction works on surrounding areas. Environ. Sci. Process. Impacts 2016, 18, 208–221. [Google Scholar] [CrossRef] [PubMed] [Green Version]
- Ahmed, S.; Arocho, I. Characteristics of the emission of particulate matters in construction site: A comparative study on a timber and a steel construction project. In Proceedings of the CSCE Annual Conference, Laval, QC, Canada, 12–15 June 2019. [Google Scholar]
- Ahmed, S.; Arocho, I. Emission of particulate matters during construction: A comparative study on a Cross Laminated Timber (CLT) and a steel building construction project. J. Build. Eng. 2019, 22, 281–294. [Google Scholar] [CrossRef]
- Cheriyan, D.; Hyun, K.Y.; Jaegoo, H.; Choi, J.H. Assessing the distributional characteristics of PM10, PM2.5, and PM1 exposure profile produced and propagated from a construction activity. J. Clean. Prod. 2020, 276, 124335. [Google Scholar] [CrossRef]
- Cheriyan, D.; Khamraev, K.; Choi, J.H. Varying health risks of respirable and fine particles from construction works. Sustain. Cities Soc. 2021, 72, 103016. [Google Scholar] [CrossRef]
- Araújo, I.P.S.; Costa, D.B.; Moraes, R.J.B. Boas práticas para redução da emissão de material particulado proveniente dos canteiros de obras. In Tecnologias Para o Canteiro de Obras Sustentável; Serra, S.B., Costa, D.B., Saurin, T.A., Cardoso, F.F., Eds.; FINEP: São Carlos, Brazil, 2017. [Google Scholar] [CrossRef]
- World Health Organization. Air Quality Guidelines. Global Update 2005. Particulate Matter, Ozone, Nitrogen Dioxide and Sulfur Dioxide. 2006. Available online: https://apps.who.int/iris/bitstream/handle/10665/107823/9789289021920-eng.pdf?sequence=1&isAllowed=y (accessed on 18 November 2021).
- European Union. European Union: Standards Air Quality Environment European Commission. 2008. Available online: http://ec.europa.eu/environment/air/quality/standards.htm (accessed on 18 November 2021).
- Conselho Nacional do Meio Ambiente. Resolução 491. Brasília: Ministério do Meio Ambiente. 2018. Available online: http://conama.mma.gov.br/?option=com_sisconama&task=arquivo.download&id=766 (accessed on 18 November 2021).
- Health and Safety Commission. Table 1: List of Approved Workplace. 2005, pp. 9–15. Available online: https://www.chemeng.upatras.gr/sites/default/files/users/site/health-Safety/04ENG.ListOfApprovedWorkplaceExposureLimits.pdf (accessed on 18 November 2021).
- Machado, M.; Santos, J.M.; Reisen, V.A.; Reis, N.C., Jr.; Mavroidis, I.; Lima, A. A new methodology to derive settleable particulate matter guidelines to assist policy-makers on reducing public nuisance. Atmos. Environ. 2018, 182, 242–251. [Google Scholar] [CrossRef]
- Vallack, H.W.; Shillito, D.E. Suggested guidelines for deposited ambient dust. Atmos. Environ. 1998, 32, 2737–2744. [Google Scholar] [CrossRef]
- de Melo, M.M. Correlação Entre Percepção do Incômodo e Exposição ao Material Particulado Presente na Atmosfera e Sedimentado. Ph.D. Thesis, Espírito Santo University, Vitoria, Brazil, 2015; p. 272. (In Portuguese). [Google Scholar]
- Li, C.Z.; Zhao, Y.; Xu, X. Investigation of dust exposure and control practices in the construction industry: Implications for cleaner production. J. Clean. Prod. 2019, 227, 810–824. [Google Scholar] [CrossRef]
- Chow, J.C. Measurement Methods to Determine Compliance with Ambient Air Quality Standards for Suspended Particles. J. Air Waste Manag. Assoc. 1995, 45, 320–382. [Google Scholar] [CrossRef] [Green Version]
- Maioli, B.G. Quantificação e Caracterização do MP Fino (MP2,5) na Região Metropolitana da Grande Vitória-ES. Master’s Thesis, Espírito Santo University, Vitoria, Brazil, 2011; p. 118. (In Portuguese). [Google Scholar]
- Fisher, J.; Friesen, M.; Kim, S.; Locke, S.; Kefelegn, Y.; Wong, J.; Albert, P.S.; Jones, R.R. Sources of variability in real-time monitoring data for fine particulate matter: Comparability of three wearable monitors in an urban setting. Environ. Sci. Technol. Lett. 2019, 6, 222–227. [Google Scholar] [CrossRef]
- United States Environmental Protection Agency. Evaluation of Emerging Air Pollution Sensor Performance. 2021. Available online: https://www.epa.gov/air-sensor-toolbox/evaluation-emerging-air-sensor-performance (accessed on 18 November 2021).
- Zheng, T.; Bergin, M.H.; Johnson, K.; Tripathi, S.N.; Shirodkar, S.; Landis, M.S.; Sutaria, R.; Carlson, D.E. Field evaluation of low-cost particulate matter sensors in high- and low-concentration environments. Atmos. Meas. Tech. 2018, 11, 4823–4856. [Google Scholar] [CrossRef] [Green Version]
- Institute of Air Quality Management. Guidance on Monitoring in the Vicinity of Demolition and Construction Sites. 2018. Available online: http://iaqm.co.uk/text/guidance/guidance_monitoring_dust_2018.pdf (accessed on 18 November 2021).
- Alves, M.R. Estudo do Fluxo de Deposição de Partículas Para a Região Metropolitana da Grande Vitória Usando Dados de PTS. Master’s Thesis, Espírito Santo University, Vitoria, Brazil, 2011; p. 147. (In Portuguese). [Google Scholar]
- Galvão, E.S.; Santos, J.M.; Lima, A.T.; Reis, N.C., Jr.; Orlando, M.T.D.A.; Stuetz, R.M. Trends in analytical techniques applied to particulate matter characterization: A critical review of fundaments and applications. Chemosphere 2018, 199, 546–568. [Google Scholar] [CrossRef] [PubMed]
- Alves, D.D.; Osório, D.M.M.; Rodrigues, M.A.S.; Schuck, S. Morfologia e composição do material particulado atmosférico da bacia hidrográfica do Rio dos Sinos (RS) analisados por microscopia eletrônica de varredura. Geochim. Bras. 2015, 29, 45–57. [Google Scholar]
- Nascimento, A.P. Influência da Poluição Atmosférica por SO2, MP10, MP2.5 e sua Composição Elementar na Incidência de Doença Respiratória Aguda em Crianças. Ph.D. Thesis, Espírito Santo University, Vitoria, Brazil, 2015; p. 166. (In Portuguese). [Google Scholar]
- Code of Federal Regulations. Title 40, Chapter I, Part 50, Appendix L e O. Office of the Federal Register. 2011. Available online: https://www.epa.gov/laws-regulations/regulations#find (accessed on 18 November 2021).
- Phung, T.; Zhang, Y.; Dunlop, J.; Dalziel, J. Bilayer lipid membranes supported on Teflon filters: A functional environment for ion channels. Biosens. Bioelectron. 2011, 26, 3127–3135. [Google Scholar] [CrossRef]
- Khuzestani, R.B.; Schauer, J.J.; Wei, Y.; Zhang, Y.; Zhang, Y. A non-destructive optical color space sensing system to quantify elemental and organic carbon in atmospheric particulate matter on Teflon and quartz filters. Atmos. Environ. 2017, 149, 84–94. [Google Scholar] [CrossRef]
- Martin, S.S. El Aerosol Particulado en Telde, Gran Canaria (España), Durante 2002/03. Ph.D. Thesis, Las Palmas de Gran Canaria Univ., Las Palmas, Spain, 2008; p. 445. (In Spanish). [Google Scholar]
- United States Environmental Protection Agency. IO Compendium Method IO-3.1: Compendium of Methods for the Determination of Inorganic Compounds in Ambient Air: Selection, Preparation and Extraction of Filter Material; EPA/625/R-96/010a; United States Environmental Protection Agency: Cincinnati, OH, USA, 1999. Available online: https://www.epa.gov/sites/default/files/2015-07/documents/epa-io-3.1.pdf (accessed on 18 November 2021).
- Environment Agency. Monitoring of Particulate Matter in Ambient Air Around Waste Facilities: Technical Guidance Document (Monitoring) M17. 2013. Available online: https://assets.publishing.service.gov.uk/government/uploads/system/uploads/attachment_data/file/301206/TGN_M17_-_Monitoring_of_particulate_matter_in_ambient_air_around_waste_facilities.pdf (accessed on 18 November 2021).
- Sow, M.; Goossens, D.; Rajot, J.L. Calibration of MDCO dust collector and of four versions of the inverted Frisbee dust deposition sampler. Geomorphology 2006, 82, 360–375. [Google Scholar] [CrossRef]
- ASTM D 1739-98; Standard Test Method for Collection and Measurement of Dustfall (Settleable Particulate Matter). American Society for Testing and Material: West Conshohocken, PA, USA, 2017.
- Payus, C.; Mian, L.Y.; Sulaiman, N. Airborne fine particulate emissions from construction activities. Int. J. Environ. Sci. Develop. 2017, 8, 526–529. [Google Scholar] [CrossRef] [Green Version]
- Rahman, S.A.A.; Yatim, S.R.M.; Abdullah, A.H.; Zainuddin, N.A.; Samah, M.A.A. Exposure of particulate matter 2.5 (PM2.5) on lung function performance of construction workers. AIP Conf. Proc. 2019, 2124, 020030-1–020030-7. [Google Scholar] [CrossRef]
- Yan, H.; Ding, G.; Li, H.; Wang, Y.; Zhang, L.; Shen, Q.; Feng, K. Field evaluation of the dust impacts from construction sites on surrounding areas: A city case study in china. Sustainability 2019, 11, 1906. [Google Scholar] [CrossRef] [Green Version]
- Canadian Council of Ministers of the Environment. Ambient Air-Monitoring Protocol for PM2.5 and Ozone Canada-Wide Standards for Particulate Matter and Ozone; Canadian Council of Ministers of the Environment: Winnipeg, MB, Canada, 2011. [Google Scholar]
- Greater London Authority. The Control of Dust Emissions during Construction and Demolition—Supplementary Planning Guidance. 2014. Available online: https://www.london.gov.uk/sites/default/files/gla_migrate_files_destination/Dust%20and%20Emissions%20SPG%208%20July%202014_0.pdf (accessed on 18 November 2021).
- Institute of Air Quality Management. Guidance on the Assessment of dust from Demolition and Construction. 2014. Available online: http://iaqm.co.uk/text/guidance/construction-dust-2014.pdf (accessed on 18 November 2021).
- United States Environmental Protection Agency. Monitoring PM2.5 in Ambient Air Using Designated Reference or Class I Equivalent Methods; EPA-454/B-16-001; Research Triangle Park: Research Triangle, NC, USA, 2016. Available online: https://www3.epa.gov/ttn/amtic/files/ambient/pm25/qa/m212.pdf (accessed on 18 November 2021).
- Resende, F.; Cardoso, F.F.; Costa, D.B.; Melo, A.; Araújo, I.P.S.; Moraes, R.J.B.; Porfiro, A. Metodologia para medição da concentração de material particulado em canteiros de obra. In Proceedings of the Simpósio Brasileiro de Gestão e Economia da Construção, Salvador, Brazil, 19–20 November 2013. (In Portuguese). [Google Scholar]
- Han, I.; Symanski, E.; Stock, T.H. Feasibility of using low-cost portable particle monitors for measurement of fine and coarse particulate matter in urban ambient air. J. Air Waste Manag. Assoc. 2017, 67, 330–340. [Google Scholar] [CrossRef] [Green Version]
- Venkatram, A.; Isakov, V.; Yuan, J.; Pankratz, D. Modeling dispersion at distance of meters from urban sources. Atmos. Environ. 2004, 38, 4633–4641. [Google Scholar] [CrossRef]
- Conti, M.M. Caracterização Química e Morfológica de Partículas Sedimentadas na Região Metropolitana da Grande Vitória-ES. Ph.D. Thesis, Espírito Santo University, Vitoria, Brazil, 2013; p. 124. (In Portuguese). [Google Scholar]
- Hanby, I. Airborne Dust Monitoring Equipment. 2019. Available online: http://www.hanby.co.uk/CAL%20&%20USE%20SPR.htm (accessed on 18 November 2021).
- Zuo, J.; Rameezdeen, R.; Hagger, M.; Zhou, Z.; Ding, Z. Dust pollution control on construction sites: Awareness and self-responsibility of managers. J. Clean. Prod. 2017, 166, 312–320. [Google Scholar] [CrossRef]
- Noh, H.; Lee, S.; Yu, J. Identifying effective fugitive dust control measures for construction projects in Korea. Sustainability 2018, 10, 1206. [Google Scholar] [CrossRef] [Green Version]
- Giunta, M. Assessment of the environmental impact of road construction: Modelling and prediction of fine particulate matter emissions. Build. Environ. 2020, 176, 106865. [Google Scholar] [CrossRef]
- Heal, M.R.; Kumar, P.; Harrison, R.M. Particles, air quality, policy and health. Chem. Soc. Rev. 2012, 41, 6606–6630. [Google Scholar] [CrossRef] [PubMed] [Green Version]
- United States Environmental Protection Agency. Integrated Science Assessment (ISA) for Particulate Matter. EPA/600/R-19/188; Research Triangle Park: Research Triangle, NC, USA, 2019. Available online: https://cfpub.epa.gov/ncea/isa/recordisplay.cfm?deid=347534 (accessed on 18 November 2021).
- Diapouli, E.; Manousakas, M.; Vratolis, S.; Vasilatou, V.; Maggos, T.; Saraga, D.; Grigoratos, T.; Argyropoulos, G.; Voutsa, D.; Samara, C.; et al. Evolution of air pollution source contributions over one decade, derived by PM10 and PM2.5 source apportionment in two metropolitan urban areas in Greece. Atmos. Environ. 2017, 164, 416–430. [Google Scholar] [CrossRef]
- Kelly, K.E.; Whitaker, J.; Petty, A.; Widmer, C.; Dybway, A.; Sleeth, D.; Martin, R.; Butterfield, A. Ambient and laboratory evaluation of a low-cost particulate matter sensor. Environ. Pollut. 2017, 221, 491–500. [Google Scholar] [CrossRef]
- Zhang, H.; Srinivasan, R.; Ganesan, V. Low Cost, Multi-Pollutant Sensing System Using Raspberry Pi for Indoor Air Quality Monitoring. Sustainability 2021, 13, 370. [Google Scholar] [CrossRef]


| Equipment | Advantages | Disadvantages | Applications |
|---|---|---|---|
| Gravimetric sampler using filters | This is a sampler that monitors the TSP, PM10, and PM2.5 fractions using a suction pump; They usually provide average concentrations over 24 h and require laboratory determination to identify the mass of the filters; The concentrations obtained can be associated with air quality limit values; Reference methods for monitoring suspended particles are based on gravimetric samplers. | High operating costs; Care must be taken with the selection, storage, handling, and weighing of the filters; Results not available in real time. | It is unlikely to be applicable in most situations, as there are delays between the sampling period and the availability of results; Although some types of samplers are small and battery-powered, they do not provide real-time information. |
| Filters | Characteristics | References |
|---|---|---|
| Glass fiber filters | Filters that show resistance to high temperatures, low reaction to corrosive material, and high efficiency. They do not break easily with handling, and are recommended for gravimetric processes. They can be used for elementary analysis if their chemical composition is known (typically Al and Si, with large and variable amounts of Na). Recommended by the United States Environmental Protection Agency (EPA). | [39,40] |
| Polycarbonate filters | Filters that present low thickness, smooth surface, and vitreous aspects. Recommended for performing elementary analysis of the samples, owing to their low blank levels and inertness to gas adsorption. These filters contain carbon, which makes them difficult to use in certain research applications. Widely used in monitoring particulate matter. | [40,41,42] |
| Teflon filters | These filters have an irregular, porous, and chemically inert structure. They contain carbon, which makes them difficult to use in certain research. Recommended when characterizing the sampled particles using analytical techniques. Recommended by 40 CFR Part 50—Appendix L and O. | [40,41,42,43,44,45] |
| Cellulose filters | These are highly hygroscopic filters, not recommended for accurate analysis. They are difficult to handle. These filters are necessary for sampling where there is no possibility of using other filters owing to the chemical equivalence between their compositions and the monitored particles. | [39,46] |
| Quartz filters | Filters with generally high collection efficiency. They are spectral quality filters, that is, more refined filters, with low contents of organic and inorganic contaminants. Highly recommended for carbon analysis. Recommended when chemical analyses are required. | [39,40,46,47] |
| Equipment | Advantages | Disadvantages | Applicability |
|---|---|---|---|
| Sticky Pads | Relatively low cost; Can be easily installed; No electricity required; The analysis of the percentage of effective area coverage (% EAC) considers the color of the particle; Can be used to quantify the flow of dust; Subsequent analyses can be performed to determine the chemical composition and morphology of the particles. | Requires subsequent laboratory analysis of the percentage of effective area coverage (% EAC) and/or percentage of absolute area coverage (% AAC); Limited time resolution, does not provide daily information; Intensive use of resources. | Provides useful information to complement the monitoring of PM concentrations; Provides an indication of the potential loss of amenity; Provides information on the effectiveness of mitigation measures. |
| Authors/References | Monitoring and Sampling Protocols | Sampling Information (Fraction/Filter/Equipment) | Location |
|---|---|---|---|
| Chiang and Kuo [16] | Monitoring was carried out during excavation, template marking, and concreting. The sampling periods were 8 h (active work) and 24 h (background). In total, 15 samples per activity and 3 background samples were collected. The monitoring points were located close to the activities. Chemical analyses were carried out. | TSP, glass fiber filters, HiVol | Taoyuan County, China |
| Feliciano et al. [17] | Monitoring was carried out during several activities at the construction site. The sampling period was 24 h for 10 monitoring campaigns. Total of 32 samples for each monitored fraction. The location of the monitoring points was changeable due to factors of a different nature (the authors indicated that the most suitable locations from a scientific point of view were not always chosen). No chemical analyses were carried out. | TSP, PM10, and PM2.5, MiniVol | Bragança, Portugal |
| Araújo et al. [12] | Monitoring was carried out during activities in the earthwork, structure, and finishing phases. The sampling period was 8 h (active work) and 10 h for 9 days. In total, 54 samples per activity phase (8 h) and 24 samples for 22 h were collected. The monitoring points were located in favor of and against the prevailing wind. Chemical analyses were carried out. | TSP, PM10, and PM2.5, polycarbonate and Teflon filters, MiniVol | Salvador, Brazil |
| Li et al. [18] | Monitoring was carried out during the construction activities of a building and after the completion of the work. The total sampling period was 35 h during working hours of 5 consecutive days. The measurements were performed in an adjacent building, based on its ground floor and its covering floor, with height difference between the floors equivalent to 20 m. Chemical analyses were carried out. | PM20–35, PM8.1–20, PM4–8.1, PM2–4, PM1–2, PM0.5–1, and PM0.25–0.5, glass slides, Naneum Nano ID Select™ | Singapore |
| Azarmi et al. [19] | Analyses were carried out during various activities of three construction sites. The sampling period was 10 h (active work; daytime monitoring) and 14 h (stopped work, nighttime monitoring) during weekdays and weekends. The collection period was approximately 4000 days for approximately 12 years. The measurements were carried out in favor of and against the wind in the areas surrounding the selected sites. No chemical analyses were carried out. | PM10 and PM2.5, TEOM 1400 and Turnkey Osiris (model 2315) | London, England |
| Moraes et al. [13] | Monitoring was carried out during activities in the structure and masonry phases. The sampling period was 8 h (active work) and 8 h (Sunday or other holidays) for 11 days + 1 day (Sunday or holiday). Four sites were analyzed, plus a reference site. In total, 252 samples were collected, including 52 for construction site 1, 60 for construction site 2, 56 for construction site 3, 48 for construction site 4, and 36 for the reference construction site. The monitoring points were located in favor of and against the prevailing wind. Chemical analyses were carried out. | TSP and PM10, polycarbonate and Teflon filters, MiniVol | Salvador, Brazil |
| Payus et al. [51] | Analyses were carried out during preliminary service activities, site preparation, and structure activities. Sampling was carried out during working hours, over 4 working days in the dry season and another 4 working days in the rainy season. The fractions were monitored for 20 min/day, continuously. No chemical analyses were carried out. | PM0.3, PM0.5, PM1, and PM2, Particulate Counter (model GT-321) | Kota Kinabalu, Malaysia |
| Ahmed and Arocho [20] | Analyses were carried out at two construction sites to compare the PM concentration of two construction systems: wooden panels (CLT) and steel. There was no specific monitoring time, as the researchers gave priority to the activities. The measurement occurred for 15 min/day for each fraction of PM in the period of 5 days. In total, 600 data points were collected, i.e., 300 for each construction site. Measurements were taken close to the activities (350 feet). No chemical analyses were carried out. | PM1, PM2.5, PM4, and PM10, DustTrak | Oregon, USA |
| Ahmed and Arocho [21] | Extension of the study of Ahmed and Arocho [20]. The two sites previously studied were compared with a third site (external area without construction). Measurements were performed following the same procedures at the three monitoring sites. There was no specific time for monitoring, as the researchers gave priority to the activities. The measurement took place for 15 min/day for each fraction of PM in the period of 5 days. Measurements were taken close to the activities (350 feet). Regarding the reference site (without construction), the authors reported only the movement of students. In total, 900 data points were collected, i.e., 300 for each monitoring location. No chemical analyses were carried out. | PM1, PM2.5, PM4, and PM10, DustTrak | Oregon, USA |
| Rahman et al. [52] | Analyses were carried out during the activities of masonry, plastering, and concrete mixing. Correlations were investigated between PM concentrations found in these activities and the performance of pulmonary function (peak expiratory flow, PEF) of construction workers. The sampling period was 8 h (active work) for a period of 6 days per activity, during a total of 18 days. The PEF test was performed at a fixed time of day (9:30 a.m. to 11:30 a.m.). In total, 54 concentration data points and 80 workers were tested. No chemical analyses were carried out. | PM2.5, DustTrak | Klang, Malaysia |
| Sa’adeh et al. [15] | Monitoring was carried out before and during construction activities of an educational building in three sampling periods: “No Construction”, “Pouring Concrete”, and “Bleaching”. The measurements were performed on a rooftop of an adjacent building. The sampling period was 24 h, with 2–3 samples per week. Total of 60 sampling days, 20 samples for each sampling period. Chemical analyses were carried out. | PM2.5, Teflon filters, ISAP® 1050e sampler | Amman, Jordan |
| Yan et al. [53] | Analyses were carried out in the areas surrounding seven construction sites during the execution of activities. The measurements were carried out in favor of and against the wind in the vicinity of the borders of the flowerbeds. Each construction site was monitored continuously for 2 to 3 days. No chemical analyses were carried out. | TSP, PM10, and PM2.5, air/smart integrated sampler (2050) | Qingyuan, China |
| Cheriyan et al. [22] | Systematic experimental assessments were carried out during construction activity, concrete mixing activity in an area of 3 × 4 m, using a location-based PM monitoring approach. Three PM monitoring points were installed (Alphasenses sensors, with 2 s sampling times) and arranged between them (horizontal distances of 1 m and 1.5 m and vertical distances of 0.8 m and 1.3 m) and at an angle of 120°. No chemical analyses were carried out. | PM10, PM2.5, and PM1, Alphasense OPC-N2 | Laboratory |
| Cheriyan et al. [23] | This study adopted a location-based real-time PM monitoring system proposed by Cheriyan et al. [22] with Alphasense OPC-N3 sensors. The authors also installed the Hexoskin wearable monitor to identify (IR) inhalation rate real-time variation. The real-time PM and IR sensor data were collected simultaneously to assess the drilling, cutting, concrete mixing, mortar mixing, sanding, and gypsum activities, performed with different materials. No chemical analyses were carried out. | PM10, PM2.5, and PM1, Alphasense OPC-N3 and Hexoskin wearable monitor | Laboratory |
| % EAC/day | Response |
|---|---|
| 0.2 | Noticeable |
| 0.5 | Possible complaints |
| 0.7 | Objectionable |
| 2.0 | Probable complaints |
| 5.0 | Serious complaints |
Publisher’s Note: MDPI stays neutral with regard to jurisdictional claims in published maps and institutional affiliations. |
© 2022 by the authors. Licensee MDPI, Basel, Switzerland. This article is an open access article distributed under the terms and conditions of the Creative Commons Attribution (CC BY) license (https://creativecommons.org/licenses/by/4.0/).
Share and Cite
Araújo, I.P.S.; Costa, D.B. Measurement and Monitoring of Particulate Matter in Construction Sites: Guidelines for Gravimetric Approach. Sustainability 2022, 14, 558. https://doi.org/10.3390/su14010558
Araújo IPS, Costa DB. Measurement and Monitoring of Particulate Matter in Construction Sites: Guidelines for Gravimetric Approach. Sustainability. 2022; 14(1):558. https://doi.org/10.3390/su14010558
Chicago/Turabian StyleAraújo, Ingrid Priscylla Silva, and Dayana Bastos Costa. 2022. "Measurement and Monitoring of Particulate Matter in Construction Sites: Guidelines for Gravimetric Approach" Sustainability 14, no. 1: 558. https://doi.org/10.3390/su14010558