Article

Multi-Objective Spatial Suitability Evaluation and Conflict Optimization Considering Productivity, Sustainability, and Livability in Southwestern Mountainous Areas of China

1
College of Land Science and Technology, China Agricultural University, Beijing 100193, China
2
Key Laboratory of Agricultural Land Quality and Monitoring, Ministry of Natural Resources, Beijing 100193, China
3
Department of Geography, Ghent University, 9000 Ghent, Belgium
4
College of Information and Electrical Engineering, China Agricultural University, Beijing 100083, China
*
Author to whom correspondence should be addressed.
Sustainability 2022, 14(1), 371; https://doi.org/10.3390/su14010371
Submission received: 25 November 2021 / Revised: 20 December 2021 / Accepted: 28 December 2021 / Published: 30 December 2021

Abstract

:
Space is the fundamental carrier for production, living, and ecological activities, and optimizing the spatial pattern is of vital importance to promote regional sustainable development. To achieve this goal, the core issues are to identify the risks of resource and environmental constraints of development and to realize the rational distribution of human living space. Based on the integration of multisource heterogeneous data, taking Yunnan Province, a typical mountainous area in China, as an example, this research proposes a multi-object suitability evaluation method based on 50 × 50 m grid data at the provincial scale. We build a spatial conflict analysis model to identify production–living–ecological space (PLES) and propose governance suggestions for different functional areas. The results show that (1) areas suitable for ecology make up the greatest proportion of Yunnan Province, but areas with living and ecological functions show obvious spatial complementarity; (2) areas suitable for production are restricted by steep slope, geological hazards and fragmented pattern; (3) areas suitable for living is rare, and they are mainly concentrated in the plains of central Yunnan; and (4) twenty-seven percent of area has potential spatial conflicts, among which 4.38% of the area is all suitable for production–living–ecological. The production–living advantage areas are concentrated in the central Yunnan UA (Urban agglomeration), which has a high spatial overlap. These results are expected to provide valuable insights to support comprehensive multifunctional spatial utilization and sustainable development in mountainous areas.

1. Introduction

In the process of urbanization, a variety of problems have emerged, drawing attention to the challenges to rational and sustainable development, such as ecosystem degradation, the spatial mismatch of resources, and inefficient land use. It has long been recognized that human activities have affected regional ecological security and the sustainable development of ecosystems [1]. As a result, the need to clarify resource and environmental constraints and to identify risks in regional development remains a core development issue in different parts of the world, e.g., Iran [2], Italy [3], Nepal [4], and recently China [5]. These studies demonstrate the need to coordinate the relationship between resources, environment, and economic development and to more rationally arrange living spaces [6].
In line with the development goal of “Beautiful China” [7], national territory spatial planning (NTSP) is proposed as an effective tool to promote regional sustainable development and to modernize spatial governance [8]. A territorial and spatial planning system, which highlights the leading functional zoning to integrate multiple plans, has subsequently come into effect [9]. The zoning includes agricultural development, urban construction, and ecological protection, and the underlying idea is to draw “three red lines” (i.e., an urban growth boundary line, a basic farmland protection red line, and an ecological protection red line) [10,11,12,13,14]. Carrying out multi-objective suitability evaluation works to lay the foundation for the delineation of the “three zones”—that is, PLES—so as to identify deficiencies in regional development [15] and explore the regional balanced development model [16].
Multi-objective spatial suitability analysis, a tool for compiling spatial planning, is an important task for spatial planners and decision-makers. This analysis method quantifies research objects under certain standards, diagnoses resource and environmental issues, and identifies the optimal spatial pattern for land use in the future [17,18]. To conduct a suitability analysis, multidisciplinary perspectives ranging from physical science to biophysical science, social science, land science, and landscape ecology are integrated. Specifically, under the theoretical framework of suitability analysis, land use can generally be defined as “developed” [19] or “undeveloped” [20]. In recent years, suitability evaluation has been widely used to assess multi-objective PLES functional trade-offs [16,21,22], spatial conflict analysis [23,24,25], crop habitat determination [26,27], landscape evaluation planning, and environmental impact assessment [28]. It can even be applied to predict suitability ratios for different future scenarios [29].
Suitability analysis methods include the following approaches: the overlay mapping method, the multistandard analysis method [30], the analytic hierarchy process (AHP) [31,32], visualization and artificial intelligence [33,34] (e.g., machine learning), expert-based decision evaluation systems, fuzzy logic regression [35], or a combination of the above methods [36,37,38,39]. Among them, the multi-objective optimization of land use function is the most widely used. It is a scientific evaluation system based on assessments of productivity, sustainability, livability, spatial conflict, and other factors. For example, PLES multi-objective suitability evaluation is conducted considering land use functions and the resolution of potential conflicts. This method takes into account the productivity, sustainability, and livability of the land, and it is regarded as an effective approach for realizing balanced and coordinated regional development.
However, in the current development stage, the spatial suitability, the carrying capacity and coordination between resources are often ignored. As a result, the conflicts between PLES are increasing and lead to decreasing stability in the spatial structure [40], razing the need to prioritize the function of the PLES. Therefore, on the basis of PLES suitability evaluation, a multi-objective spatial function conflict analysis model is proposed for spatial conflict optimization [41]. Research has shown that the implementation of PLES in China has achieved many objectives and has provided decision making support for land utilization, conflict management, and sustainable development.
Although a research tradition on land use functions (LUFs) is present, to date, little attention has been paid to conflict detection and the multi-objective optimization of spatial planning. In addition, the lack of comprehensive research remains unaddressed, and there is a further need to improve the analytical framework, both empirically and theoretically. Besides, there are several issues in research evaluating suitability: the conclusions are out of touch with the applications; the application scenarios are ambiguous; and the appraisal methods are impractical. Moreover, less attention has been given to PLES conflicts at the microgrid scale. Taken together, these factors suggest an urgent need to establish a multiscale integration model to diagnose land use conflicts from the perspective of PLES [25].
Against this backdrop, using the example of Yunnan Province, China, this paper aims to contribute to the literature by establishing a systematic multi-objective integration model. Yunnan is an important biological resource carrier and act as the “gateway” of the southwest border in China. Specifically, Yunnan Province is one of the 34 most species-rich regions in the world, and it is endowed with the highest biodiversity in China. The 15th Conference of the Parties to the United Nations Convention on Biological Diversity (COP15) was held in Yunnan in October 2021, during which the Post-2020 Global Biodiversity Framework and a 10-year biodiversity conservation action plan were developed. Through multi-objective suitability evaluation models considering productivity, sustainability, and livability, we coordinate spatial conflicts through spatial suitability evaluation and pattern optimization. We aim to contribute to the literature in three ways: (1) improve multifunctional land use conflict diagnosis, (2) improve the optimization method of land space function zone in typical mountainous areas, and (3) refine the research scale. We focus on PLES subregions at the provincial scale (integrated by grid units within administrative units). The results are relevant to policymaking for the sustainable development of other mountainous areas, for the optimization of major functional areas, and for the formulation of land use control strategies.

2. Study Area and Data Sources
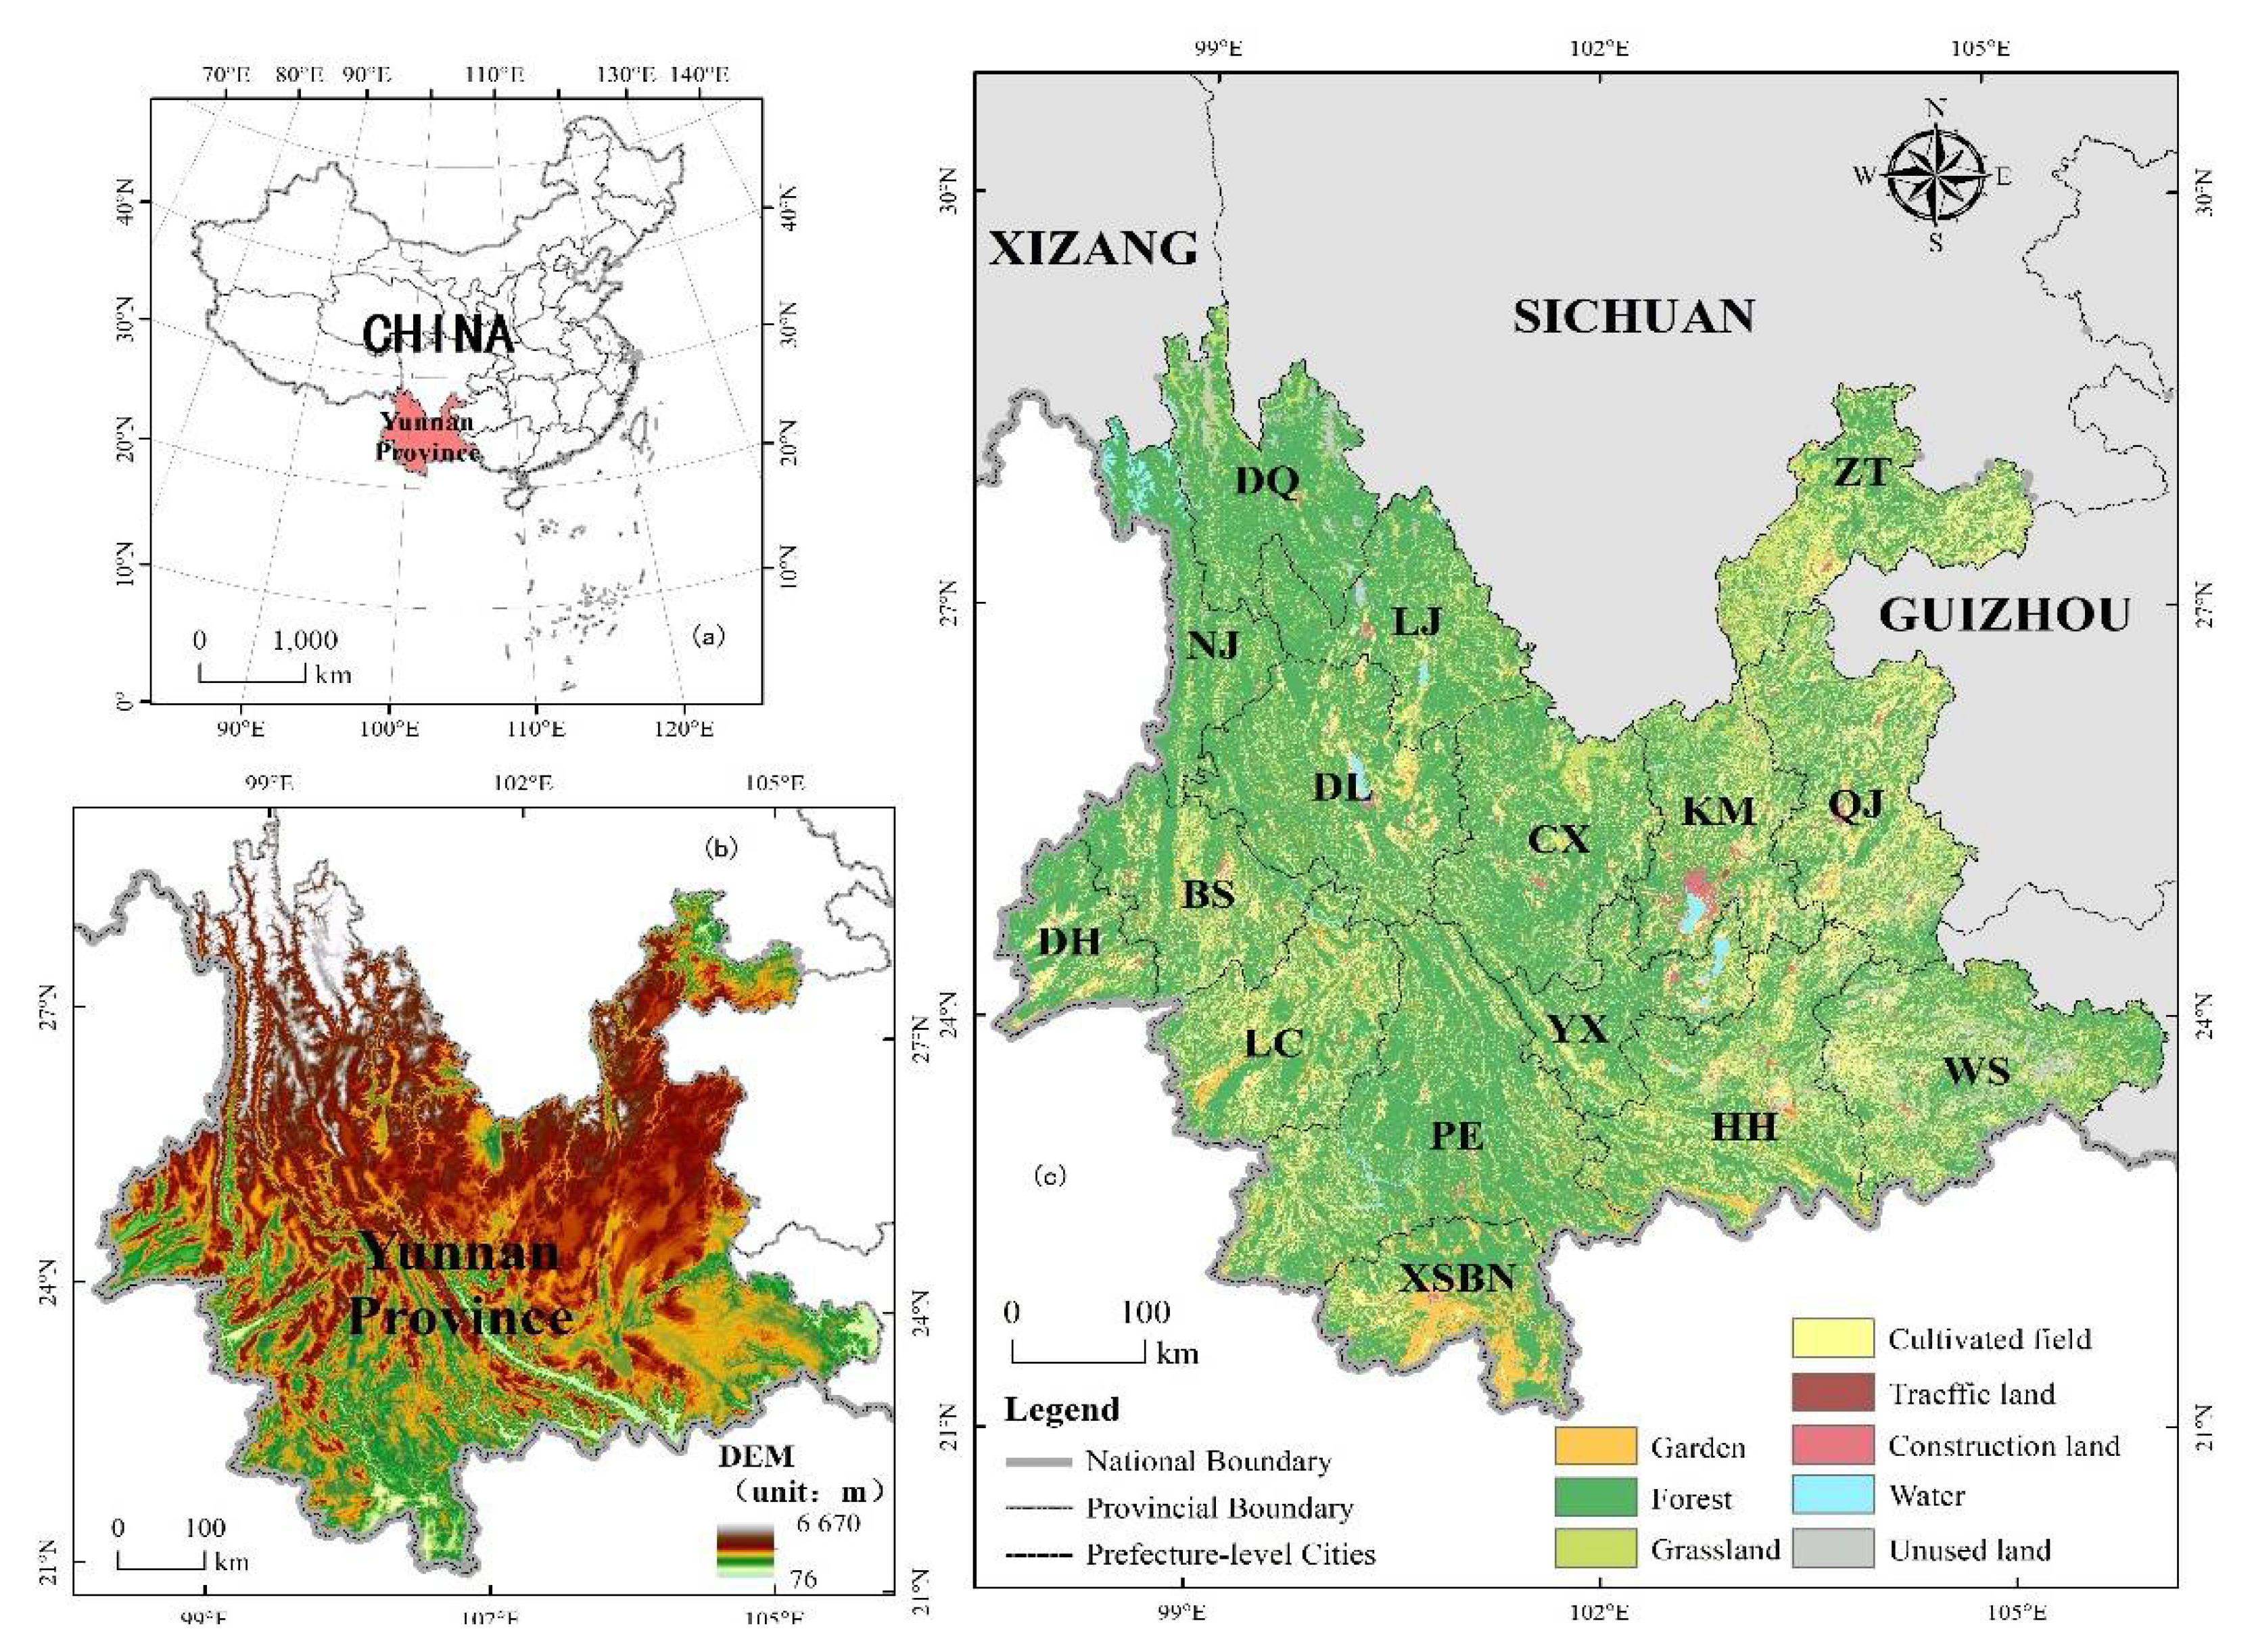
2.1. Study Area

Yunnan is located in southwestern China (E 97°31′–106°11′, N 21°8′–29°15′), connected to four provinces (Tibet, Sichuan, Guizhou, and Guangxi), and adjacent to three countries (Vietnam, Laos, and Myanmar), with a border of 4060 kilometers. Yunnan Province has a total land area of 383,189 km2 and a permanent population of 47.21 million in 2020, a GDP of 245.22 billion yuan, and an urbanization rate of 48.91%. The topography of Yunnan shows a trend of “high in the north and low in the south” (Figure 1). The topography of “vast mountains but few plains” has restricted the development of production and construction, which is further complicated by the fact that areas appropriate for urban construction and agricultural production overlap substantially [42]. Specifically, mountainous area accounts for 94% of the total land area of the province [43], with altitudes ranging from 76 meters to 6670 meters and an average altitude of almost 2000 meters.
There is high rainfall throughout the year in Yunnan, and many rivers originate from this area. Despite abundant water resources in Yunnan overall, the spatial distribution is uneven. Most cities and towns are located in areas at high altitude, while the water resources are concentrated in low-altitude areas, generating difficulties to utilize and store the water. These unique altitude and topographical factors have fostered climatic diversity and almost concealed the differences created by latitude zonality. Consequently, Yunnan serves as an excellent environment for the origin, evolution, and reproduction of various organisms [44].
According to the third Chinese National Land Survey results for Yunnan (2020), the area dedicated to agricultural and forestry land is 351,358 km2, accounting for 91.69%; the area of construction land is 10,869 km2, accounting for 2.84%; and the area of unused land and nature-reserved land is 20,967 km2, accounting for 5.47%. This province is characterized by complex topography and a fragmented land use pattern. The land production ability is relatively low, and the spatial distribution of land use is haphazard [45]. In recent years, the ecological protection measures in Yunnan have remained loose, and the issue of ecological degradation has intensified the conflicts between PLES, which has impeded the economic and social development. Therefore, optimizing the spatial pattern of development in Yunnan Province considering productivity, sustainability, and livability is of critical theoretical and practical importance [46].

2.2. Data Sources

In the context of the Chinese government’s current efforts to build the information platform of “one picture” (yizhangtu in Chinese), the multi-source data fusion method is adopted to support the “multi-plan integration” strategy of spatial planning. The platform is used to integrate current land use data with other resource and environmental data to unify basic data. We collect many single-layer data from 11 departments in Yunnan to build a basic database for evaluation. The main data sources are shown in Table 1.

2.3. Data Format and Resolution Standardization

The accuracy of basic data is essential to guarantee the reliability of the results. Due to the differences in industry standards, data classification standards, and the variety of information platforms adopted by special investigation departments, there are many discrepancies among the data derived from different special investigations of natural resources. The construction of a “base map”, a currently advocated platform, has enabled the ability to improve the temporal and spatial accuracy of a blueprint and a management map. The premise is that a large amount of multisource heterogeneous data needs to be integrated, which relies heavily on evaluating suitability. Specifically, suitability evaluation aims to combine multisource heterogeneous data and interpretations of remote sensing through uniform of “element-attribute-space” and allows the fusion and superposition of various types of data. The first step is to unify the data format, such as converting kms format data to tiff format data; then, the collected multisource data are input into ArcGIS software for standardized processing. All single features are standardized to a 50 × 50 m raster map, and the vector data are converted through a conversion tool. If the resolution of the raster data is inconsistent, the resampling tool is applied to convert it into a uniform resolution.

3. Methods

The method used to conduct suitability evaluation involves the following three steps: (1) build a multi-object suitability evaluation model based on the productivity, sustainability, and livability perspectives; (2) identify and classify spatial conflicts; and (3) optimize the spatial layout with multi-objective coupling. The research flow chart is shown in Figure 2.

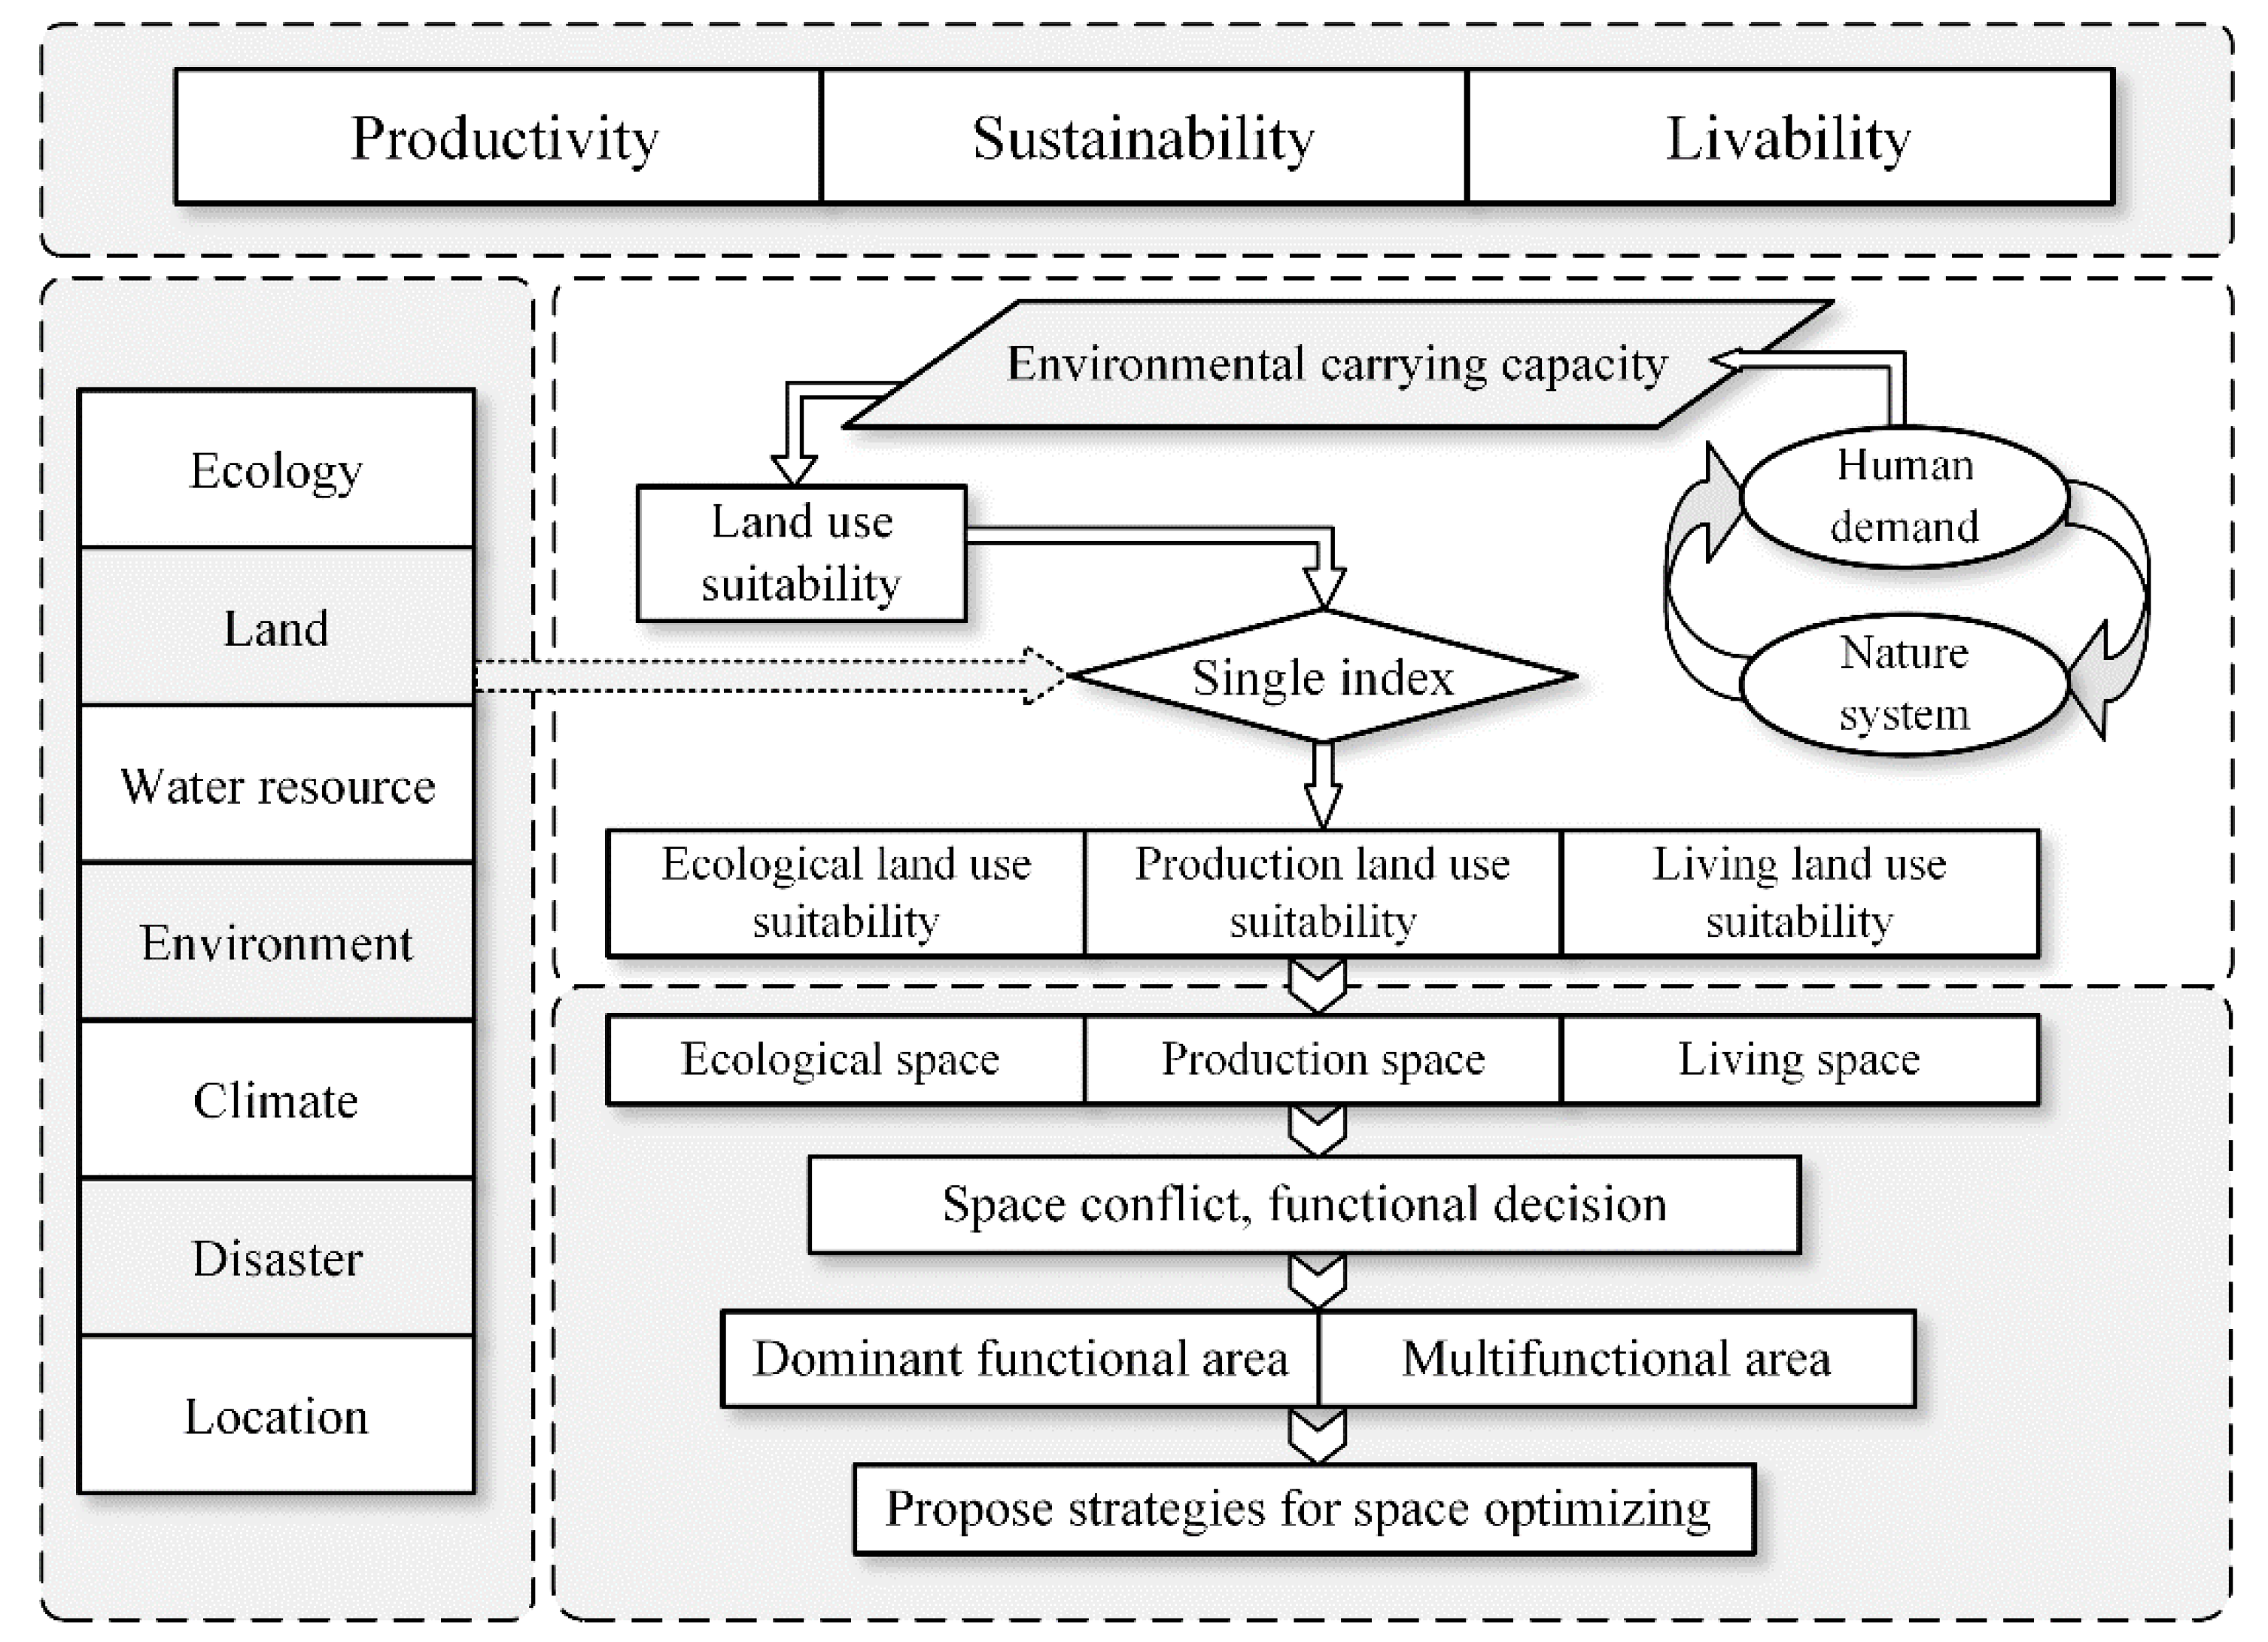
3.1. Multi-Objective Suitability Evaluation Model Construction

The construction of this model must incorporate the combined characteristics of the “four diversities” of Yunnan Province, including topographic diversity (altitude, slope, terrain relief), climatic diversity, biodiversity, and ethnic-cultural diversity. In addition, the resource and environmental endowments, human development needs, natural ecosystems, and future strategic arrangements of Yunnan Province need to be included. Using scoring determined by experts in the field, we develop a hierarchical multicriteria evaluation system. Representative indicators are selected from the lower-level criteria, including ecology, land, water resources, climate, environment, disasters, and location. Alongside the selection of evaluation factors, the construction of a multi-objective suitability evaluation model involves determining index weights, assigning factors, calculating evaluation units, and dividing into suitability levels.

3.1.1. Selection of Evaluation Factors

The evaluation index system is based on the principles of comprehensiveness, representativeness, regionality, relatedness and data availability. Considering the distinguishment between ecological protection, agricultural production, and living functions, the evaluation system is divided into three subindex systems. The selected indicators are shown in the following tables (Table 2, Table 3 and Table 4).
To begin with, production suitability refers to the ability of a region to provide tangible agricultural and industrial products or intangible products in accordance with human needs. Indicators for production suitability that capture natural resource supply and disasters are selected. It consists of five single-layer evaluations, including land, water resources, climate, environment, and disasters. Among them, land resources are evaluated using slope and soil organic matter, while water resources are evaluated through the drought index and agricultural water consumption modulus. The climate factor is proxied with active accumulated temperature ≥0 °C (according to the statistics on the ≥0 °C active accumulated temperature of each meteorological station). We then perform the spatial interpolation, combine the altitude correction with a temperature decrease rate of 0.6° per 100-m increase in altitude, and obtain the active accumulated temperature layer). The environment is approximated using soil environmental quality, which integrates the results of a detailed investigation of soil pollution in and around the area. We then analyze the main pollutant content at each point, after which the integrated results are obtained through spatial interpolation layers. Disasters are evaluated using multiple disasters, i.e., drought, flood, gale, low-temperature injury, and high-temperature heat damage. The calculation of the probability distribution of various meteorological disasters is presented in Appendix A. The indicators of production suitability and the classification methods are shown in the following table.
Secondly, living suitability categorizes the regions according to suitability based on topography, natural disasters, and location conditions. It aims to reflect the suitability of the human settlement activity space for land development and construction, mainly considering the natural constraints for construction. A single-layer evaluation, including land resources, water resources, climate, disasters, and location, is established to evaluate living suitability. Among them, the land resources are evaluated by slope, elevation, and terrain relief. Water resources are evaluated using the total water consumption modulus and total water resource modulus. Climate is proxied using the temperature and humidity index for comfort evaluation (Appendix B). Disasters are evaluated in terms of susceptibility to earthquake and geological hazards. Location is evaluated according to location conditions and traffic network density (Appendix C). The indicators of living suitability and their classification are shown in the following table.
Finally, ecological suitability evaluation consists of two parts: evaluation of the importance of ecosystem service functions and evaluation of ecological vulnerability. Ecosystem service functions refer to the benefits that humans can directly or indirectly obtain from the ecosystem. Based on the relationship between ecosystem structure, processes, and service functions, we analyze the characteristics of ecosystem services and classify them according to their importance to regional ecological security [47].
Three indicators are selected to evaluate the importance of ecosystem service functions: biodiversity maintenance, water conservation, and soil and water conservation. First, the biodiversity maintenance function is evaluated based on the natural forests within the current national public welfare forests, as well as on the classification of dominant tree species in the forestry survey data. It considers the habitats of priority ecosystems as well as dominant protected species and endangered, endemic, and very small population species distributed in different areas. Natural forests and priority ecological system distribution areas should be defined as extremely important, and other forests, wetlands, and water areas should be defined as important. Second, we evaluate the soil and water conservation functions. Forests, shrubs, and grasslands with a slope of at least 25 degrees and vegetation coverage of at least 80% are defined as extremely important areas, while forests, shrubs, and grasslands with a slope of no less than 15 degrees and vegetation coverage of at least 60% are defined as important areas. Third, the importance of the water conservation function is evaluated based on the water conservation capacity of different ecosystem types. It is measured by the water balance equation, comprehensively consider rainfall, ecosystem types, and topography aspects, as follows:
TQ = i j ( P i R i E T i ) × A i × 10 3
where TQ is water conservation total quantity, Pi is rainfall (mm), Ri is surface runoff (mm), ETi is evapotranspiration (mm), i is the type of ecosystem, Ai is the area of the i-type of ecosystem (km2), and j is the number of ecosystem types in the area.
Surface   runoff ( R i ) = P i × α
where α is the average surface runoff coefficient, calculated according to the types of surface ecosystems. The coefficient is referred to in the “Guidelines for Delineation of Ecological Protection Red Lines”.
Ecological vulnerability refers to the sensitivity of the ecosystem to disturbance caused by natural and human activities. It reflects the potential and the difficulty to repair ecological and environmental problems when the regional ecosystem is damaged. The vulnerability to water and soil erosion, the vulnerability to rocky desertification, and the vulnerability of plateau lakes are selected for evaluation. First, the vulnerability to soil erosion is determined based on the recent results of special investigations and monitoring of soil erosion (categorized according to the intensity). Second, the vulnerability to rocky desertification is determined based on the recent results of special surveys and the monitoring of rocky desertification. Third, nine plateau lakes and the wetlands around them are defined as ecologically vulnerable areas where the strictest protection measures should be taken.
Finally, through the ArcGIS overlay analysis of the above six single-layer evaluation indicators, we obtain the results for the ecosystem service functionality of Yunnan Province. Each layer is assigned a grade, and the evaluation result is divided into three grades: highest, high, and general (from high to low). The calculation formula is:
M i = Max ( A 1 i , A 2 i A n i )
where Mi is the importance of the ecological service function in the ith unit space, and A1i–Ani is the importance of single-factor ecological protection in the ith unit space. The importance levels and assignments of different ecological area types are shown in Table 4.

3.1.2. Assignment of Factors

A variety of methods are employed to classify the indicators according to their natural attributes, including the assignment method, the diffusion method, the natural interruption method, and the equal interval method. The indicators are divided into five levels and scored 100, 80, 60, 40, and 20. The scores for qualitative factors, such as slope, altitude, terrain relief, soil organic matter, soil erosion vulnerability, and rocky desertification vulnerability, are determined referring to the classification standards of relevant Chinese government management departments. For continuous quantitative indicators, such as the total water resource modulus, total water use modulus, and transportation network density, the natural interruption method is used. Percentage indicators, e.g., agrometeorological disaster evaluation probability, are directly divided into 5 levels using the equal interval method. For indicators of seismic fault zones and location conditions, we employ the diffusion method to classify the fault zone or urban attractiveness and set a diffusion radius as a buffer. If a grid is affected by multiple diffusion sources, the layer with the highest score is selected for subsequent analysis.

3.1.3. Determination of Index Weights

This study uses the analytic hierarchy process to determine the weight of each factor. A hierarchical model of goals, criteria, and indicators is established accordingly. The weights are first assigned to the criterion layer and then to the index layer, and the comprehensive weight is the product of the weights of the two layers. The values of each indicator are assumed to be the same (with the equivalence method) but are adjusted according to the expert scoring method; we consulted 10 experts in related fields who are familiar with the local situation to assign weights to each indicator. The weights of each indicator are finally calculated using average values.

3.1.4. Calculation of Evaluation Units

Based on the single-factor weight at each single-layer score, the raster calculator (Spatial analysis > Map algebra > Raster calculator) is used for spatial superposition. The PLE suitability score of each grid is calculated using the following exponential weighting model:
S = i = 1 m k = 1 n ( W k × ε k ) × E i
where S is the comprehensive evaluation score of each factor (the larger the value is, the greater the suitability of the corresponding function); Wk is the index value of coefficient k; εk is the index level weight of k; and Ei is the criterion level weight of factor i.

3.1.5. Division of Suitability Levels

According to the evaluation scores of PLE suitability, the suitability level of each type of function is calculated, and a frequency distribution histogram is used for statistical analysis. The scores of each evaluation unit are counted by frequency, and the suitability level is determined by the mutation point of the frequency curve as the boundary. Ecologically suitable areas are divided into extremely important (E1), important (E2), and general areas (E3). Using the natural breakpoint method for production suitability, the region is divided into highly suitable (P1), moderately suitable (P2), and general suitable areas (P3); for living suitability, the region is divided into highly suitable (L1), moderately suitable (L2), and generally suitable areas (L3).

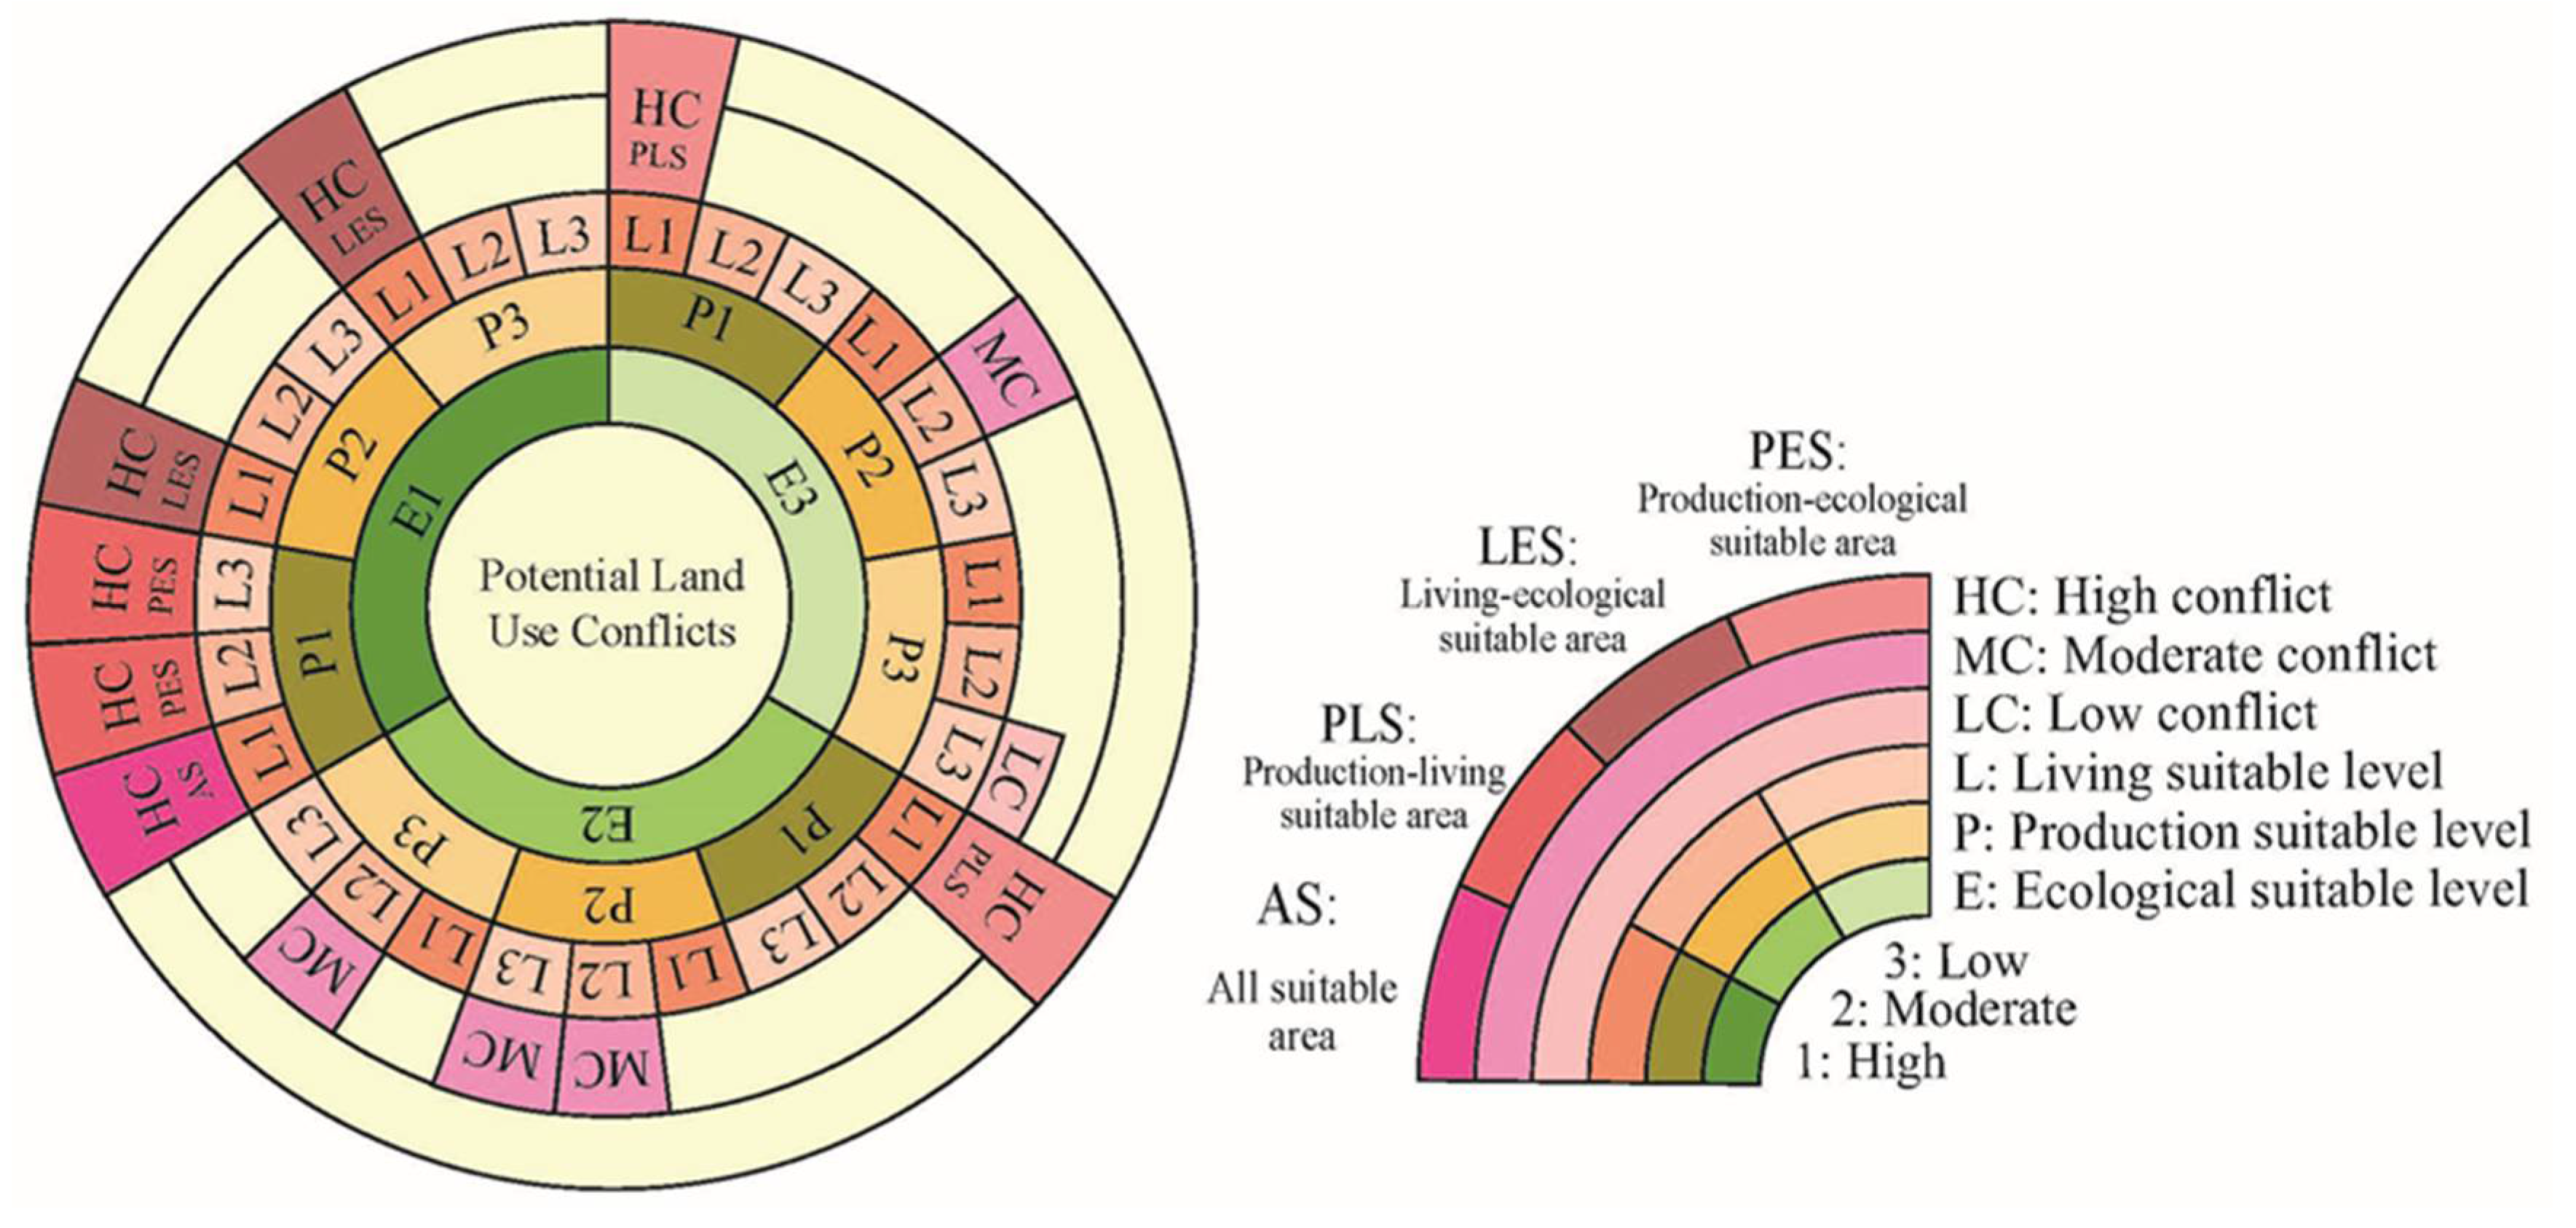
3.2. Potential Conflict Analysis

Referring to permutation and combination rules, we use an empirical model to carry out conflict identification and intensity diagnosis of land use. The emergence of potential land use conflicts indicates that two or more types of suitability methods have the same competitiveness in a specific unit. Three essential steps are involved in the process. First, three types of suitability evaluation maps are superimposed through ArcGIS software, and therefore, each evaluation unit has the attributes of “production-living-ecology”. The conflicting relationships between suitability levels lead to 27 combinations for suitability strength in Figure 3. Second, comparing the suitability levels representing land use preferences, the suitability types with the highest level are selected as the dominant areas, that is, 15 types of combinations. Finally, two or three suitability types of the same suitability level are chosen as potential conflict areas. The intensity of the potential conflict is divided into three levels (high conflict, medium conflict, and low conflict), generating 12 types of combinations. When a unit features two or three competitive suitability types, it is classified as a strong conflict; when it has two or three medium-competitive suitability types, it is classified as a medium conflict; when all suitability types are weakly competitive, the situation is defined as a low conflict.

4. Results

4.1. Suitability Evaluation Results

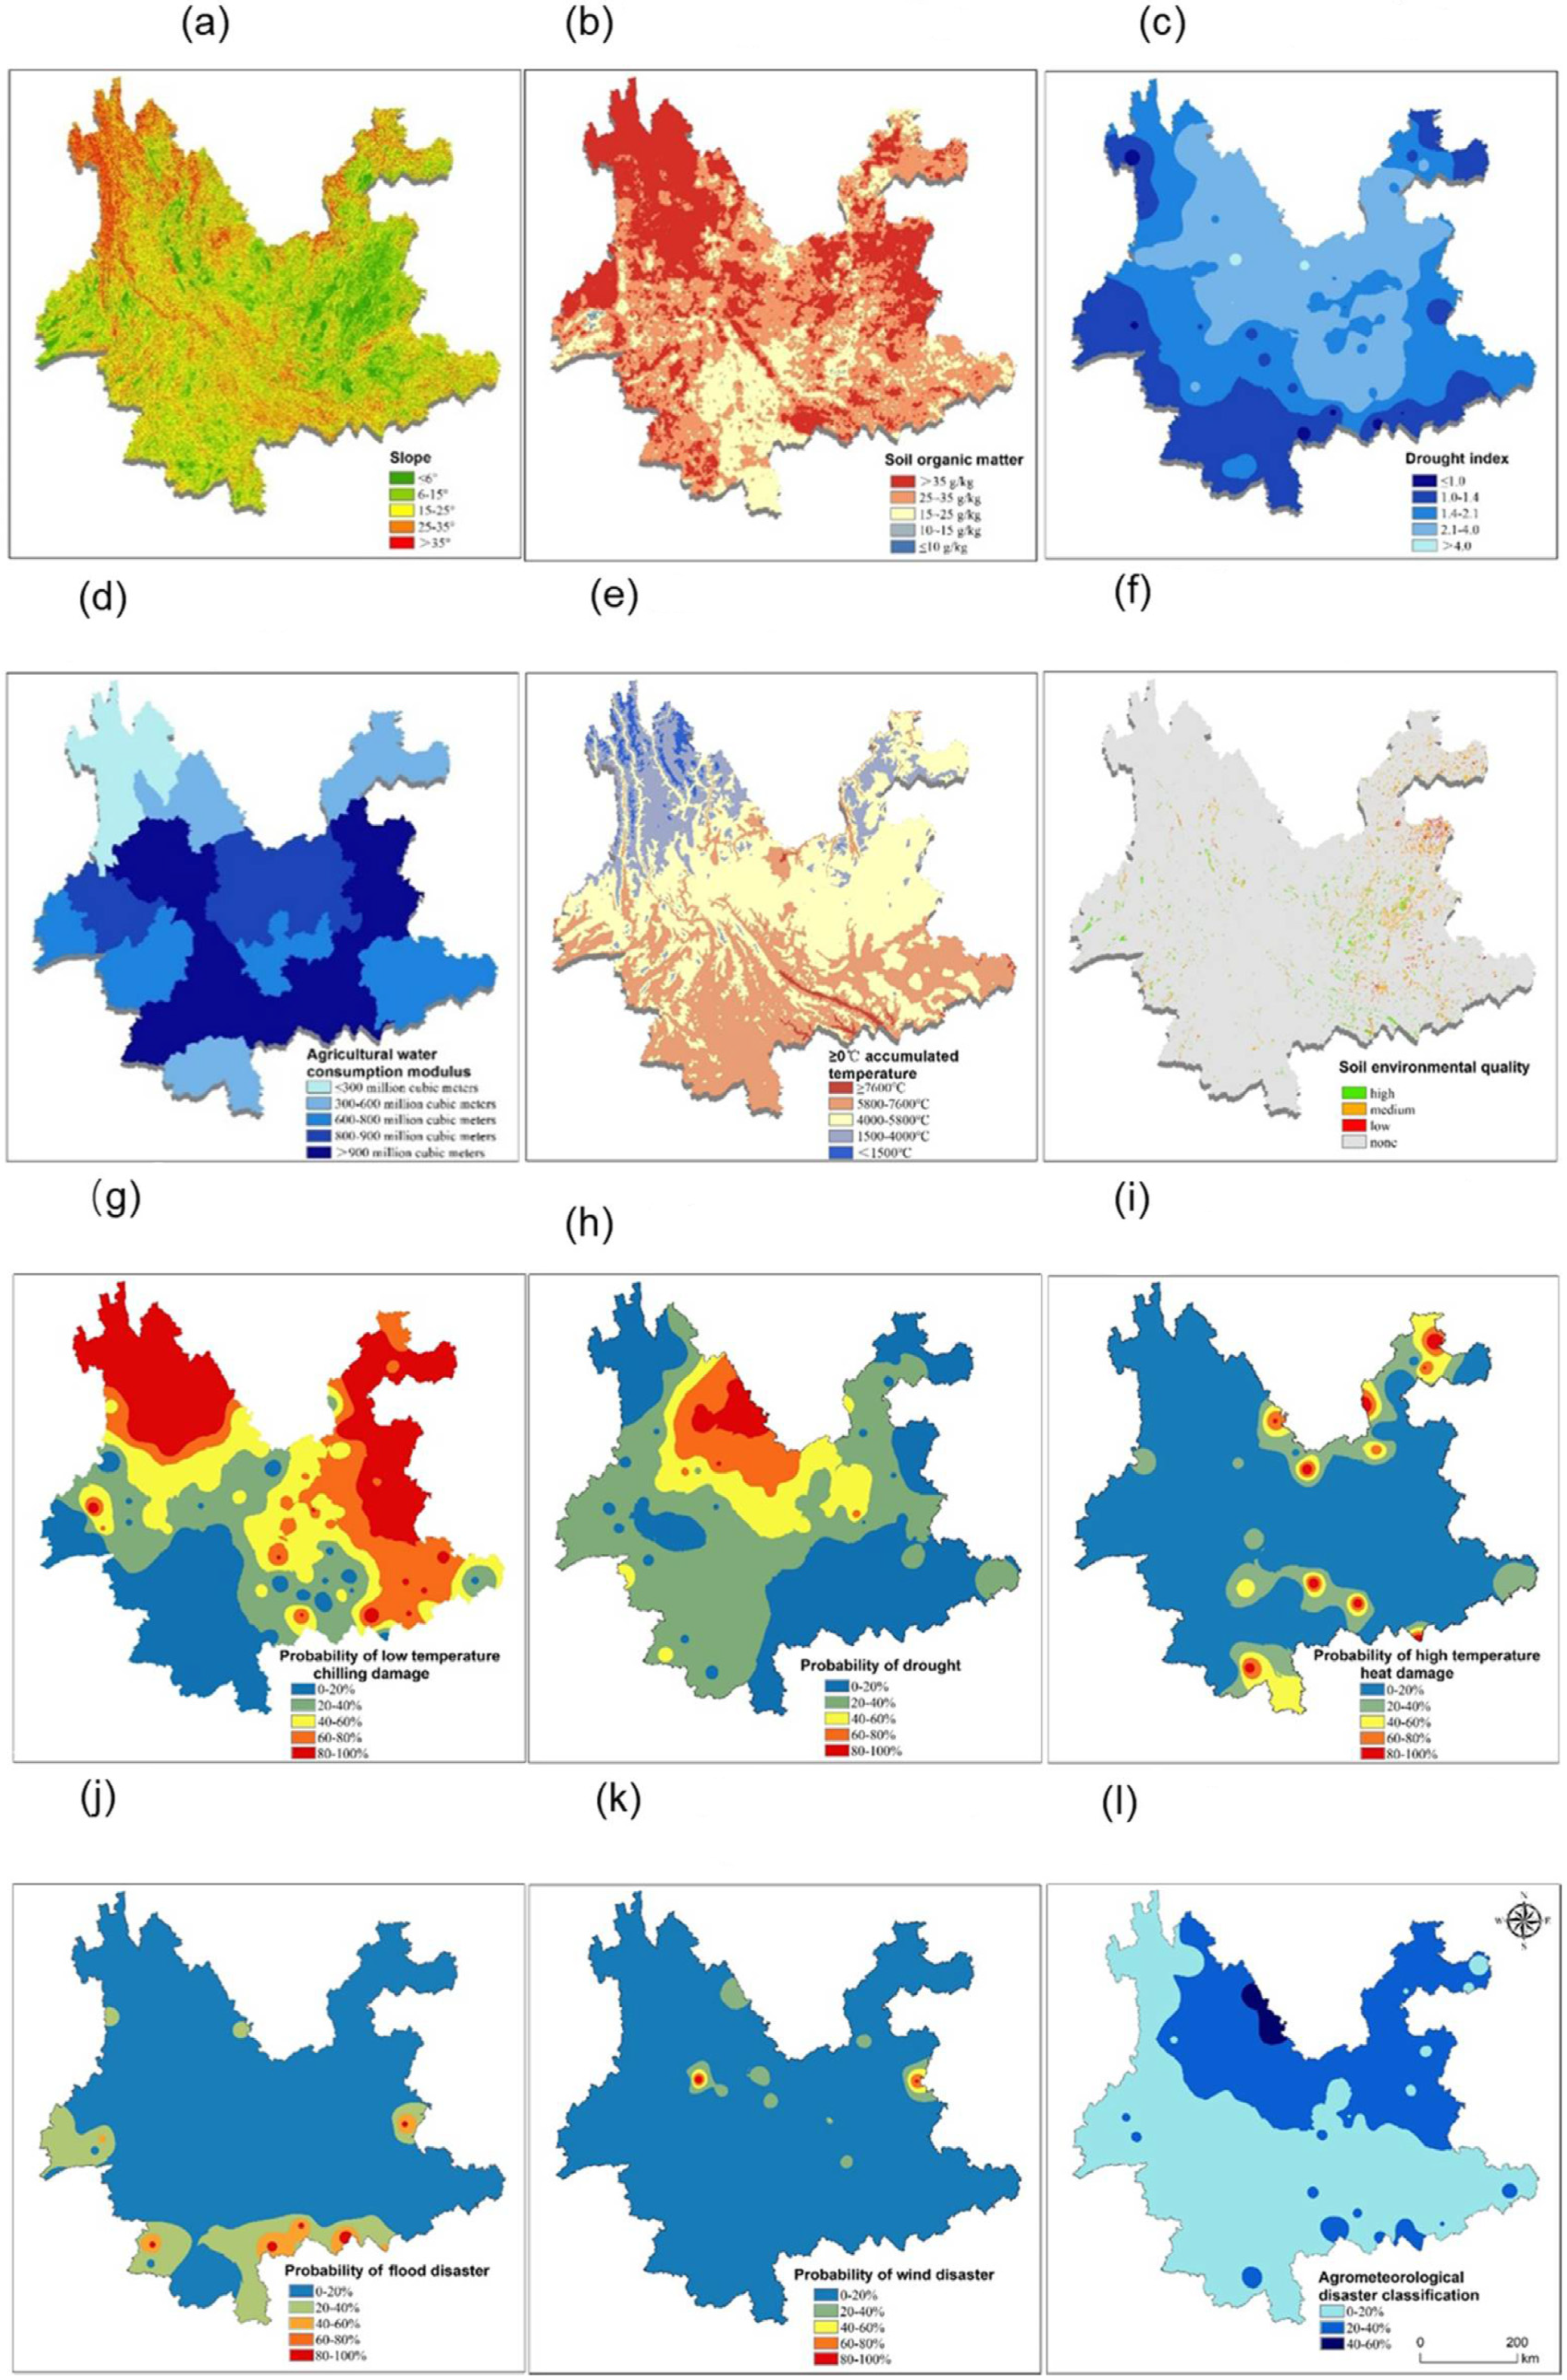
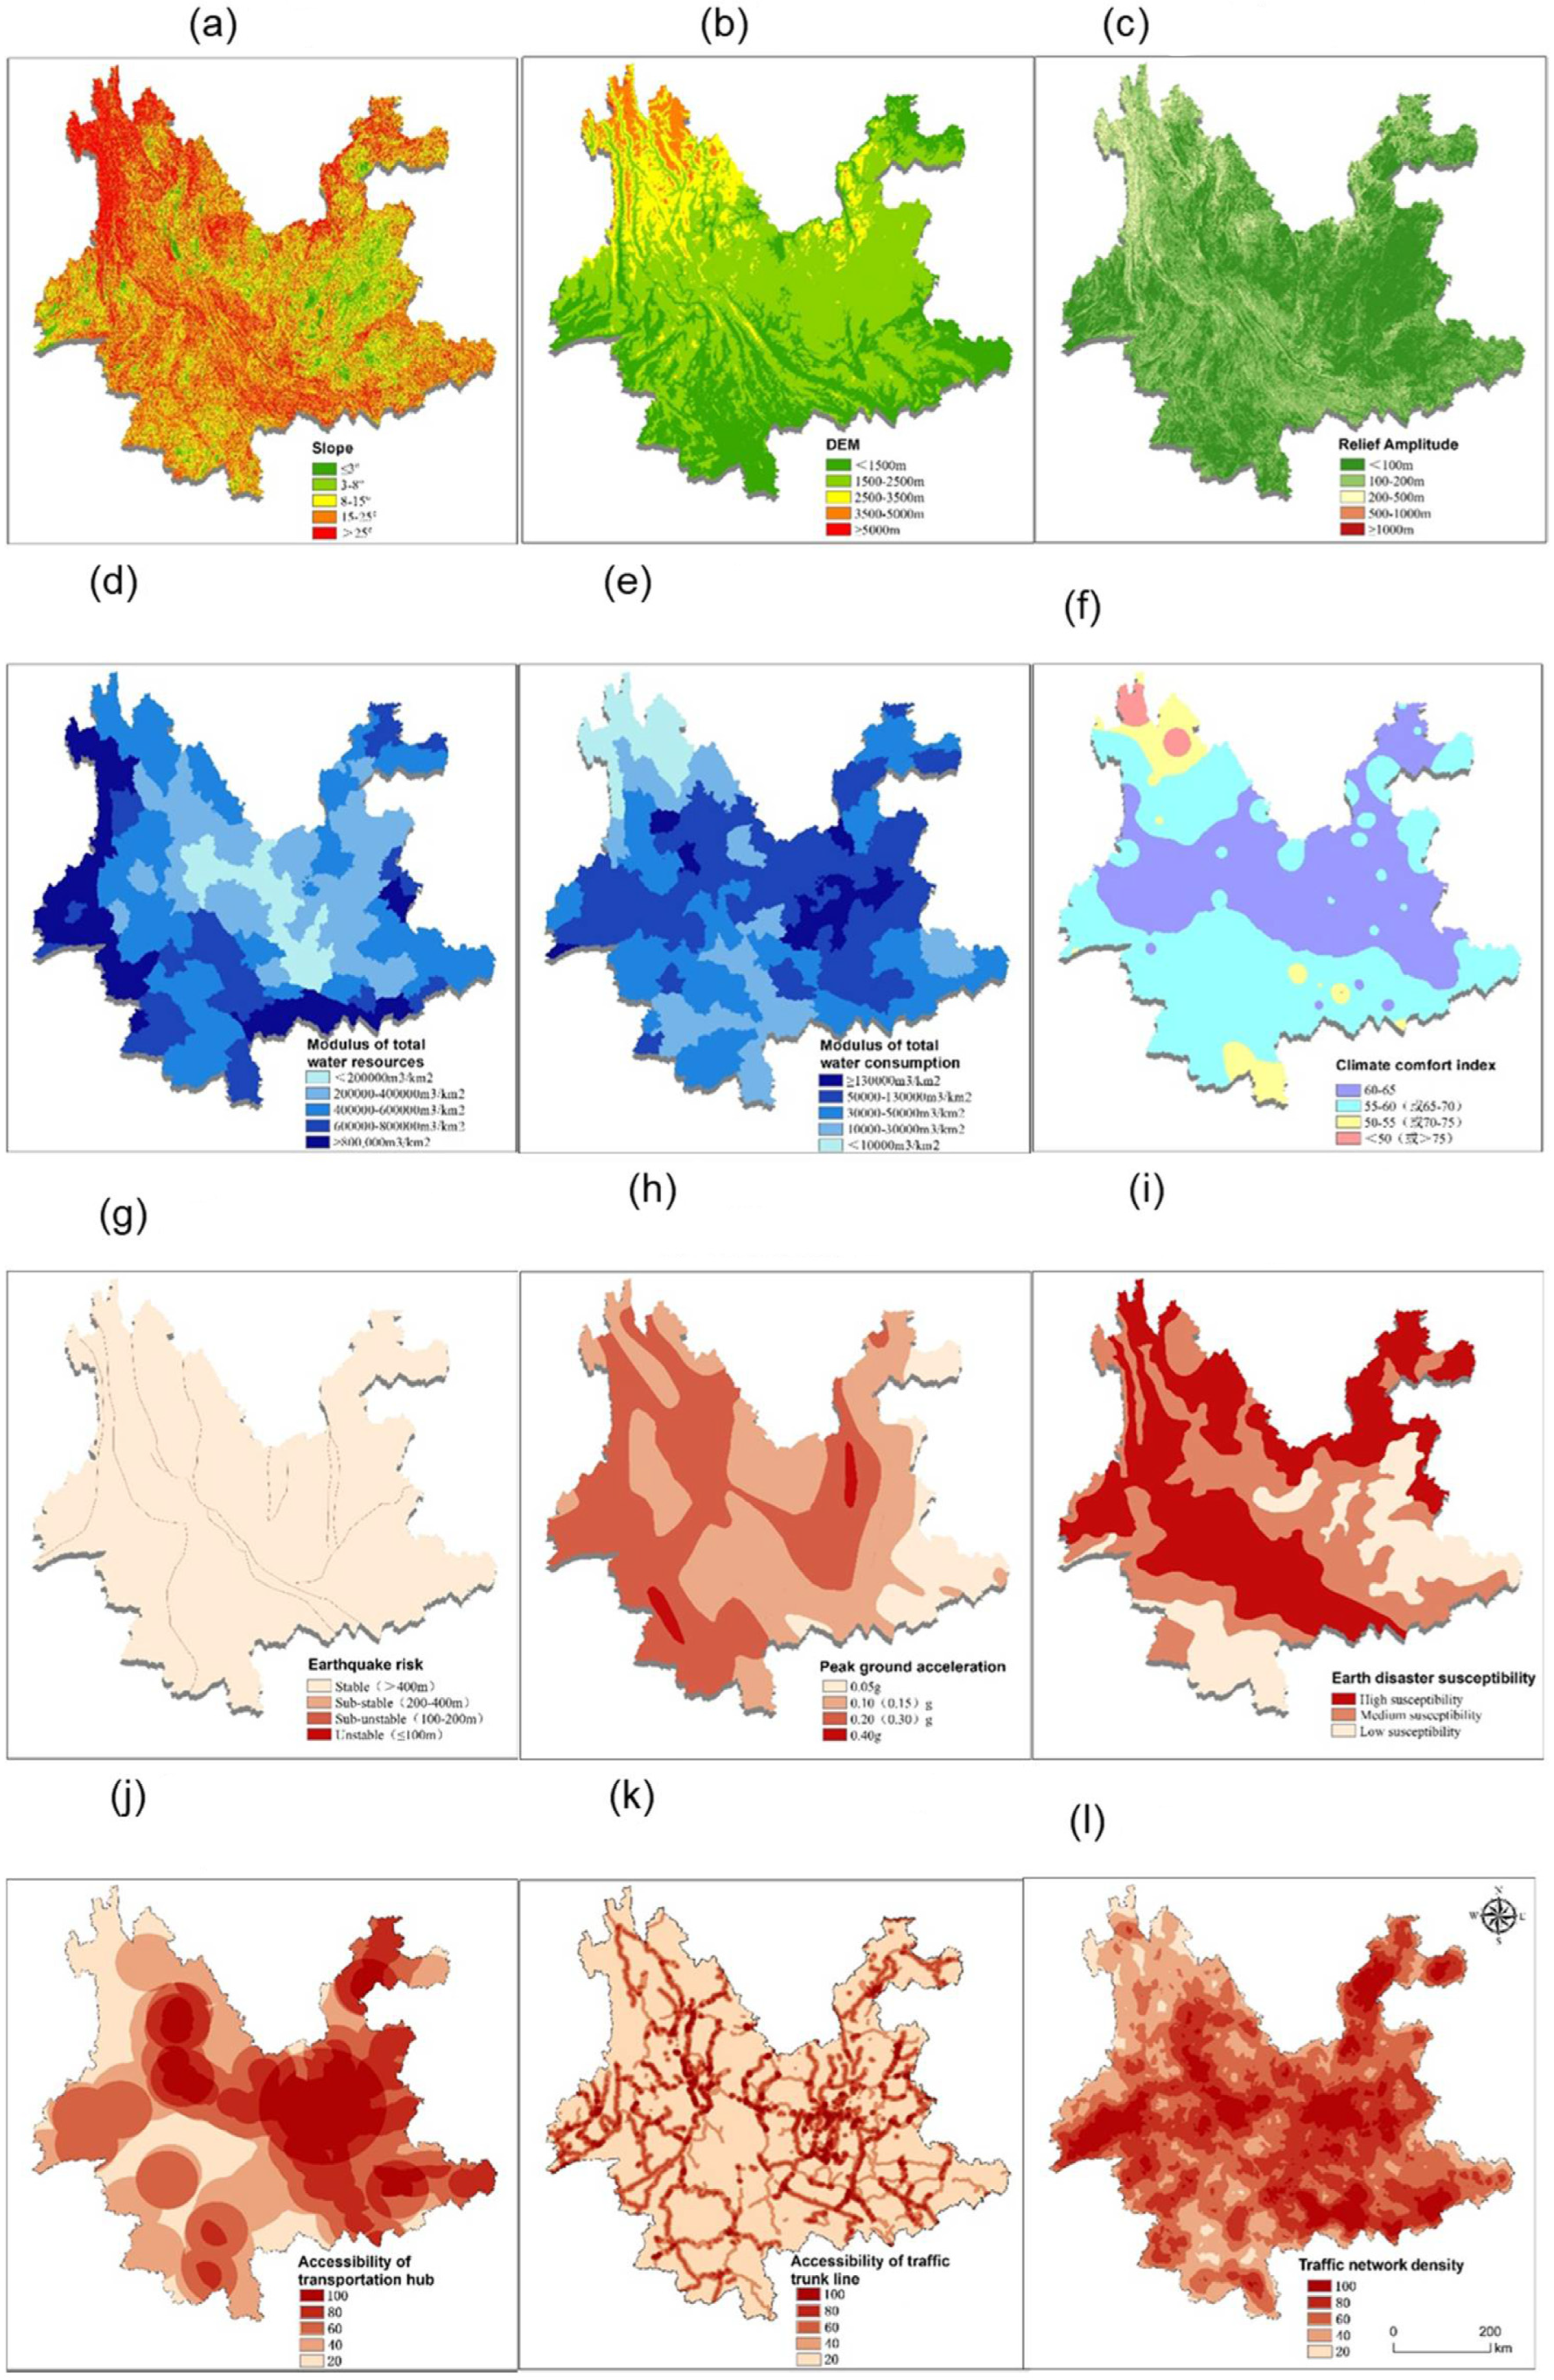
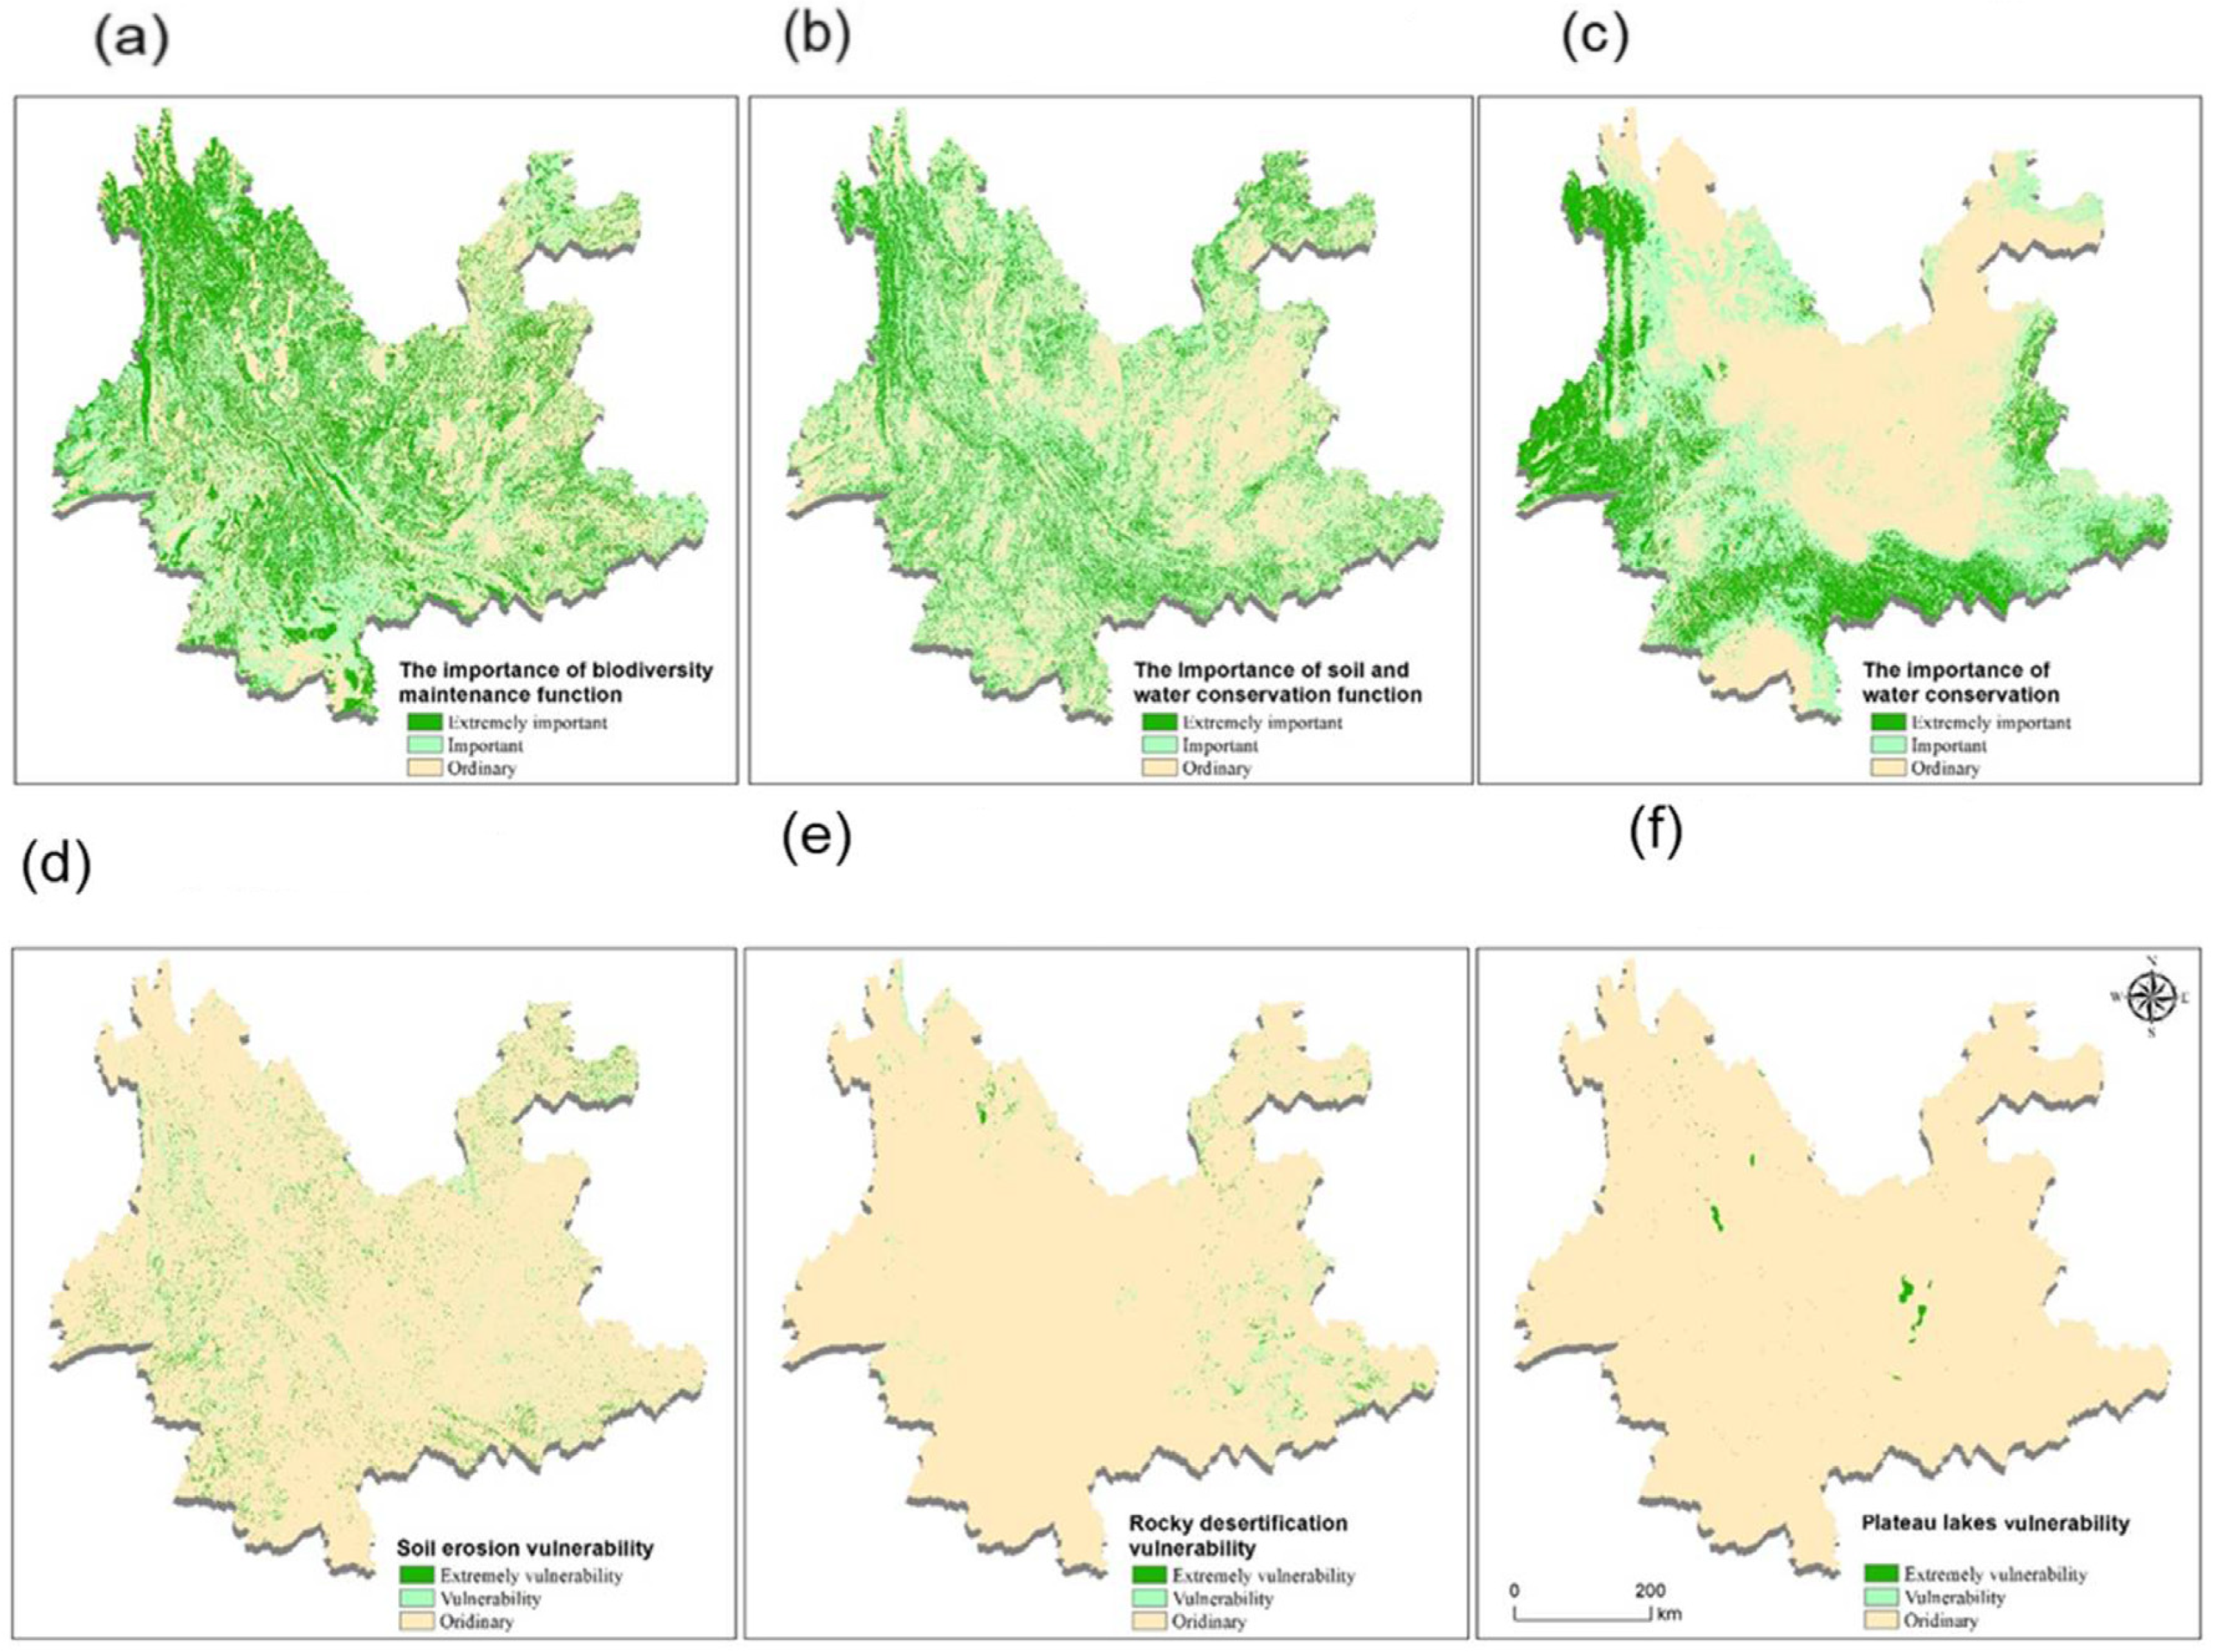
4.1.1. Single-Factor Spatial Analysis

The spatial distribution of suitability evaluation results for single factors is shown in the following combination diagram. Regarding the single layers of production suitability (Figure 4), the soil organic matter in the northern region is relatively high. The northwest region has a large slope, low accumulated temperature, and relative medium aridity. The probability of the occurrence of meteorological disasters is relatively high. Comparatively, the overall condition in the southern region is better.
Among the single layers of living suitability (Figure 5), the areas with a lower slope are mainly concentrated in central and eastern Yunnan. This region exhibits higher comfort, lower susceptibility to geological disasters, and good location conditions. However, population and economic activities take place in central Yunnan. The high water consumption in contrast with the relatively low water resources suggest a poor match between the utilization of water and land resources.
The most important ecological suitability area is mainly water conservation areas, which carry fundamental biodiversity maintenance functions (Figure 6). In particular, in the southern tropical rainforest area in Yunnan, the high rainfall and large woodland areas correspond to strong water storage capacity and strong water conservation capacity. Therefore, the overall ecological protection value of the southern region is relatively high.

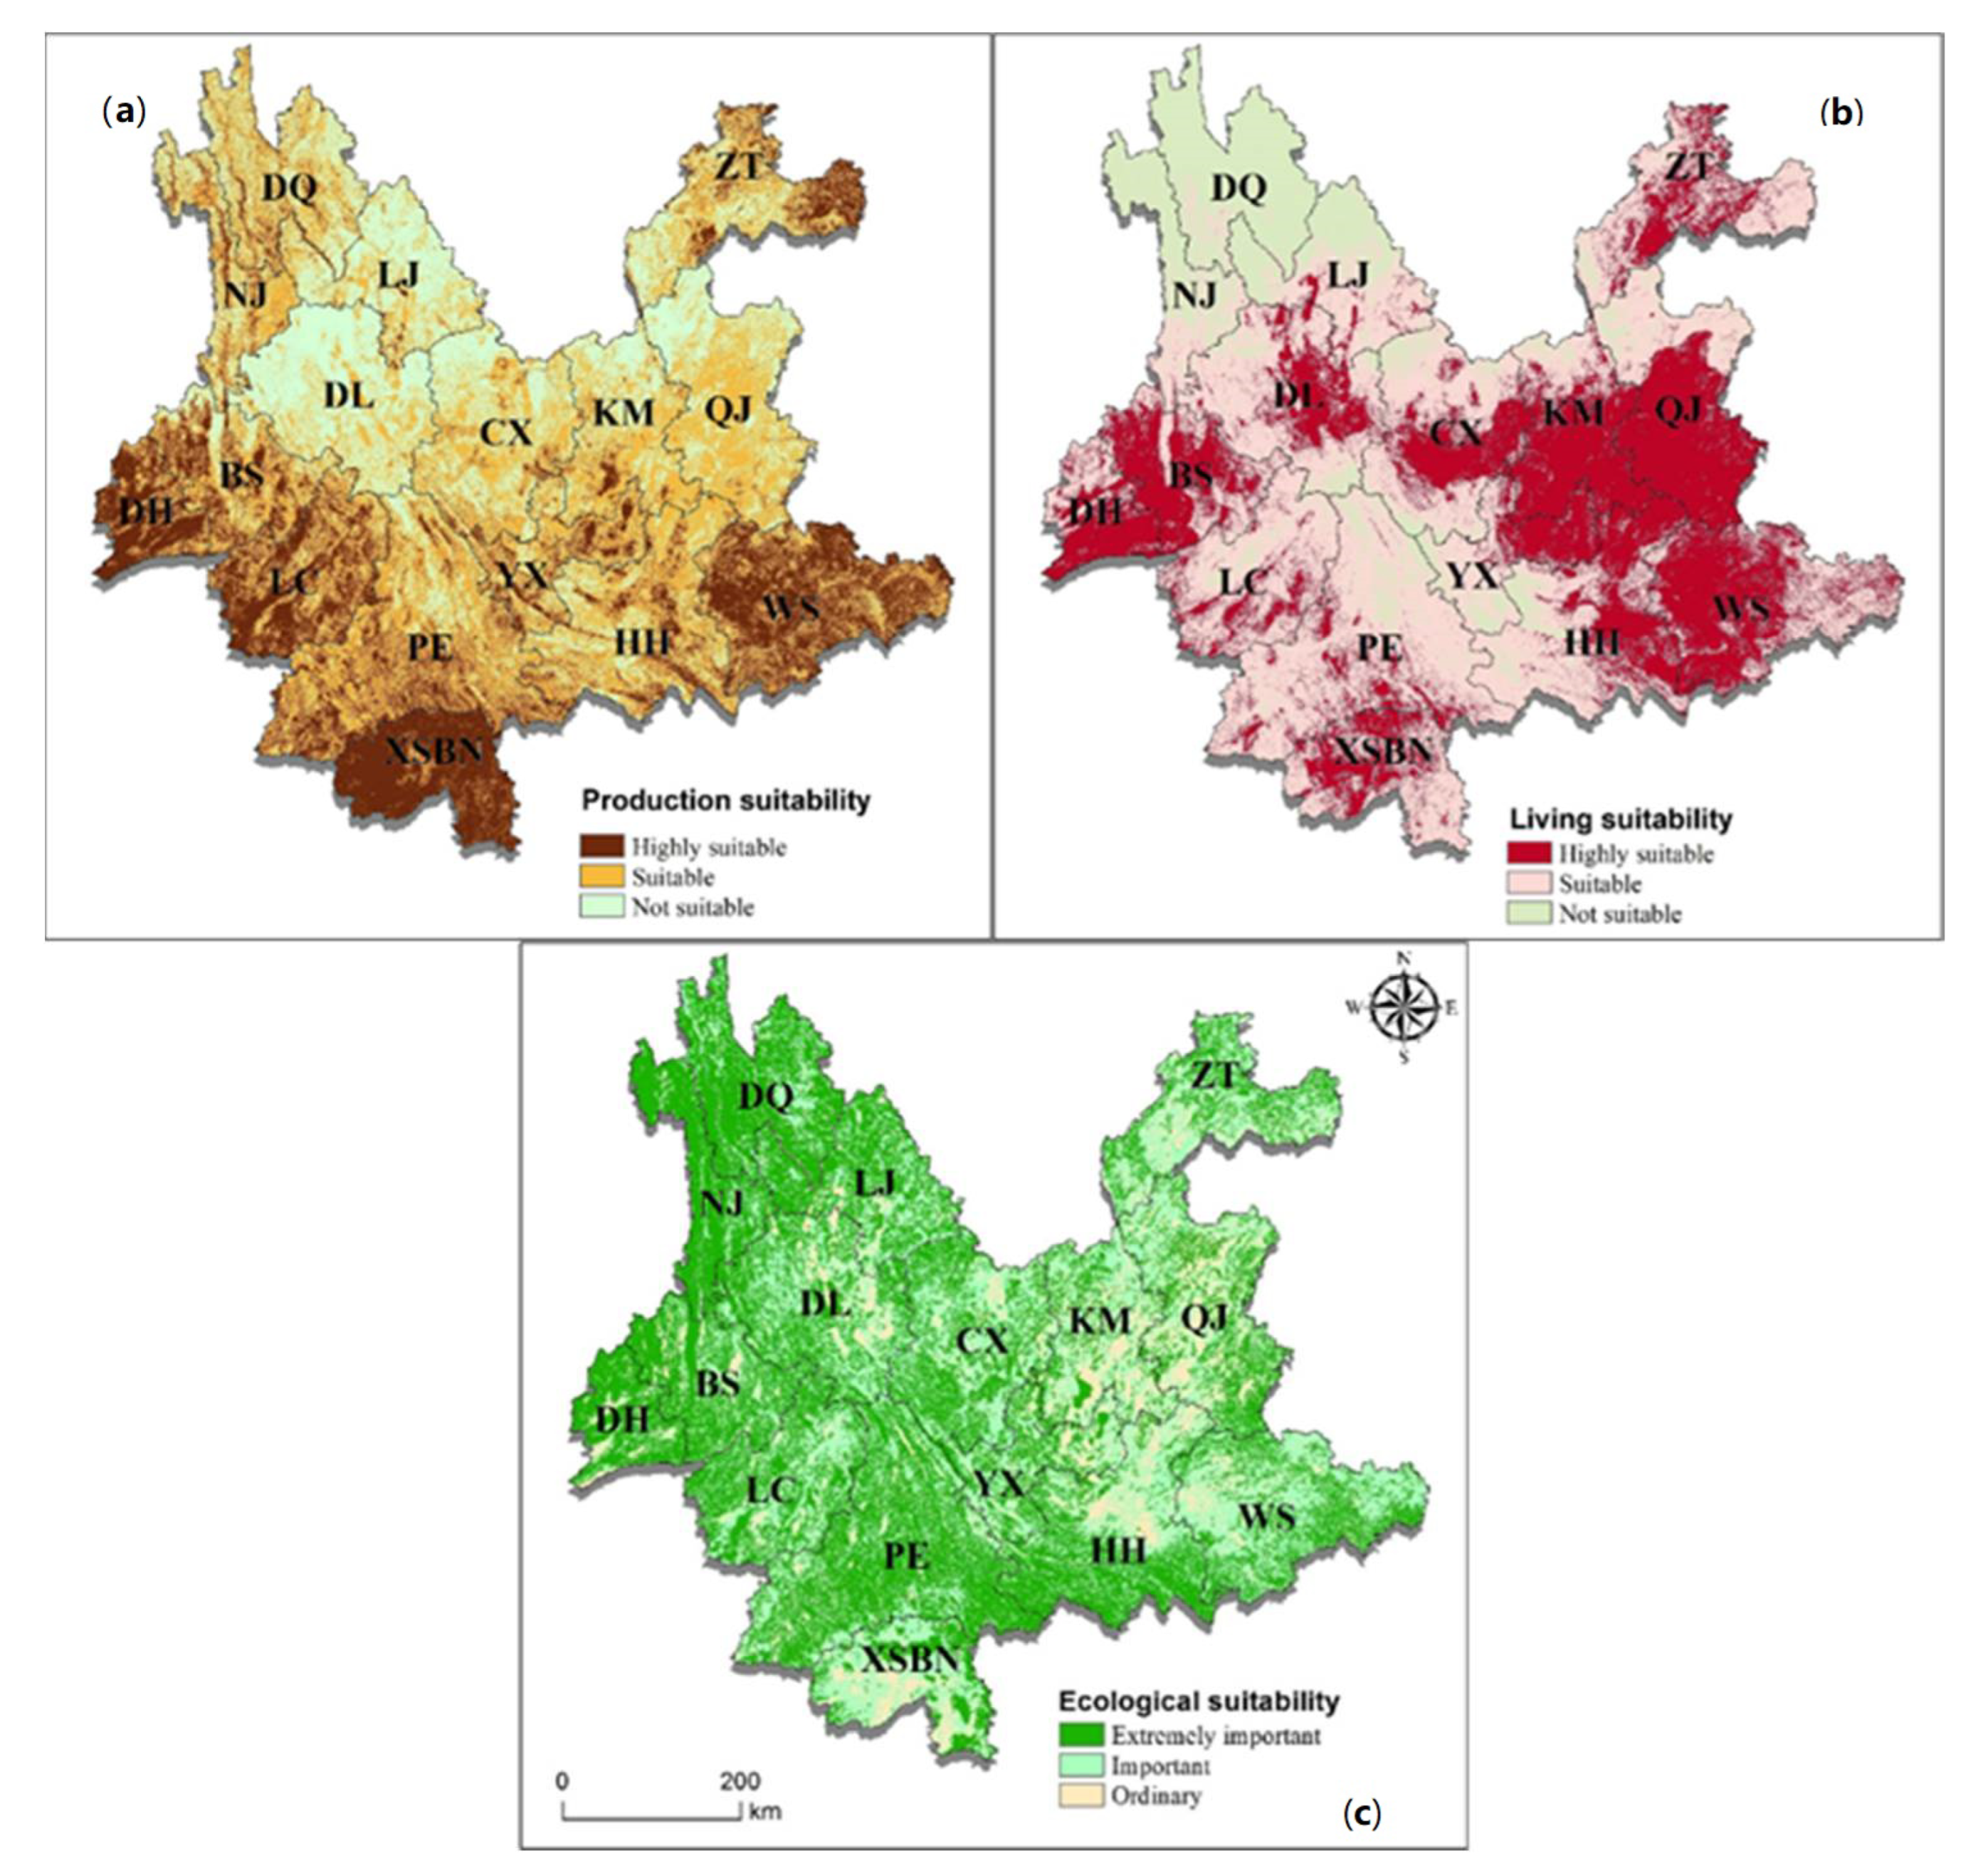
4.1.2. Integrated Evaluation Spatial Analysis

The spatial distribution of suitability evaluation results for production-living-ecological space are shown in Figure 7. The areas suitable for production exhibit the differentiation characteristics of being “centralized near the flat dams while scattered in mountainous areas”. The highly suitable, suitable, and unsuitable areas total 101,800 km2, 183,200 km2, and 109,100 km2, accounting for 25.83%, 46.49%, and 27.69% of the total area, respectively. Water resources, topography (above 25 degrees), and disasters are the dominant factors restricting agricultural production, and thus the suitable areas for production are concentrated in southwestern and southeastern Yunnan. These areas feature flat terrain, abundant water resources, and fertile soil. However, suitable areas for living are also concentrated in this area, suggesting a strong contradiction between agricultural production and urban construction. Finally, the unsuitable areas for production are mainly distributed in northwestern Yunnan, with steep terrain, large topography, and frequent geological disasters.
The suitable areas for living can be characterized as “agglomerated in central Yunnan, sporadically distributed on the border”. The areas for highly suitable, suitable, and unsuitable living of regions are 139,000 km2, 197,600 km2, and 57,500 km2, accounting for 35.28%, 50.14%, and 14.58% of the total area, respectively. Topography and geological disasters are the most significant factors restricting urban construction. Contiguously suitable areas for living are mainly located in Kunming, Yuxi, Qujing, and Chuxiong, while the unsuitable areas for living are mainly distributed in northwestern and western Yunnan. These areas are characterized by steep terrain, large terrain relief, weak transportation access, poor infrastructure services, and lagged social and economic development. However, because of the vast area, abundant water resources, and excellent natural conditions, they are currently becoming key areas for the Chinese government to carry out poverty alleviation work.
The suitable areas for ecology can be characterized as “more in the west and less in the east, extending along the mountain range”. The extremely important, important, and generally important areas for ecology total 190,100 km2, 157,700 km2, and 46,300 km2, accounting for 48.24%, 40%, and 11.76% of the total area, respectively. Among them, the extremely important areas for ecological protection are distributed in northwestern Yunnan Province (including the Hengduan Mountains and Gaoligong Mountains), which is covered by contiguous forest and mixed grassland. Generally important areas are concentrated in central and southeastern rocky desertification areas in Yunnan and are mainly arable land and construction land. However, in shallow mountainous areas with smaller slopes, the important and general areas are staggered, indicating potential conflicts between development and protection.

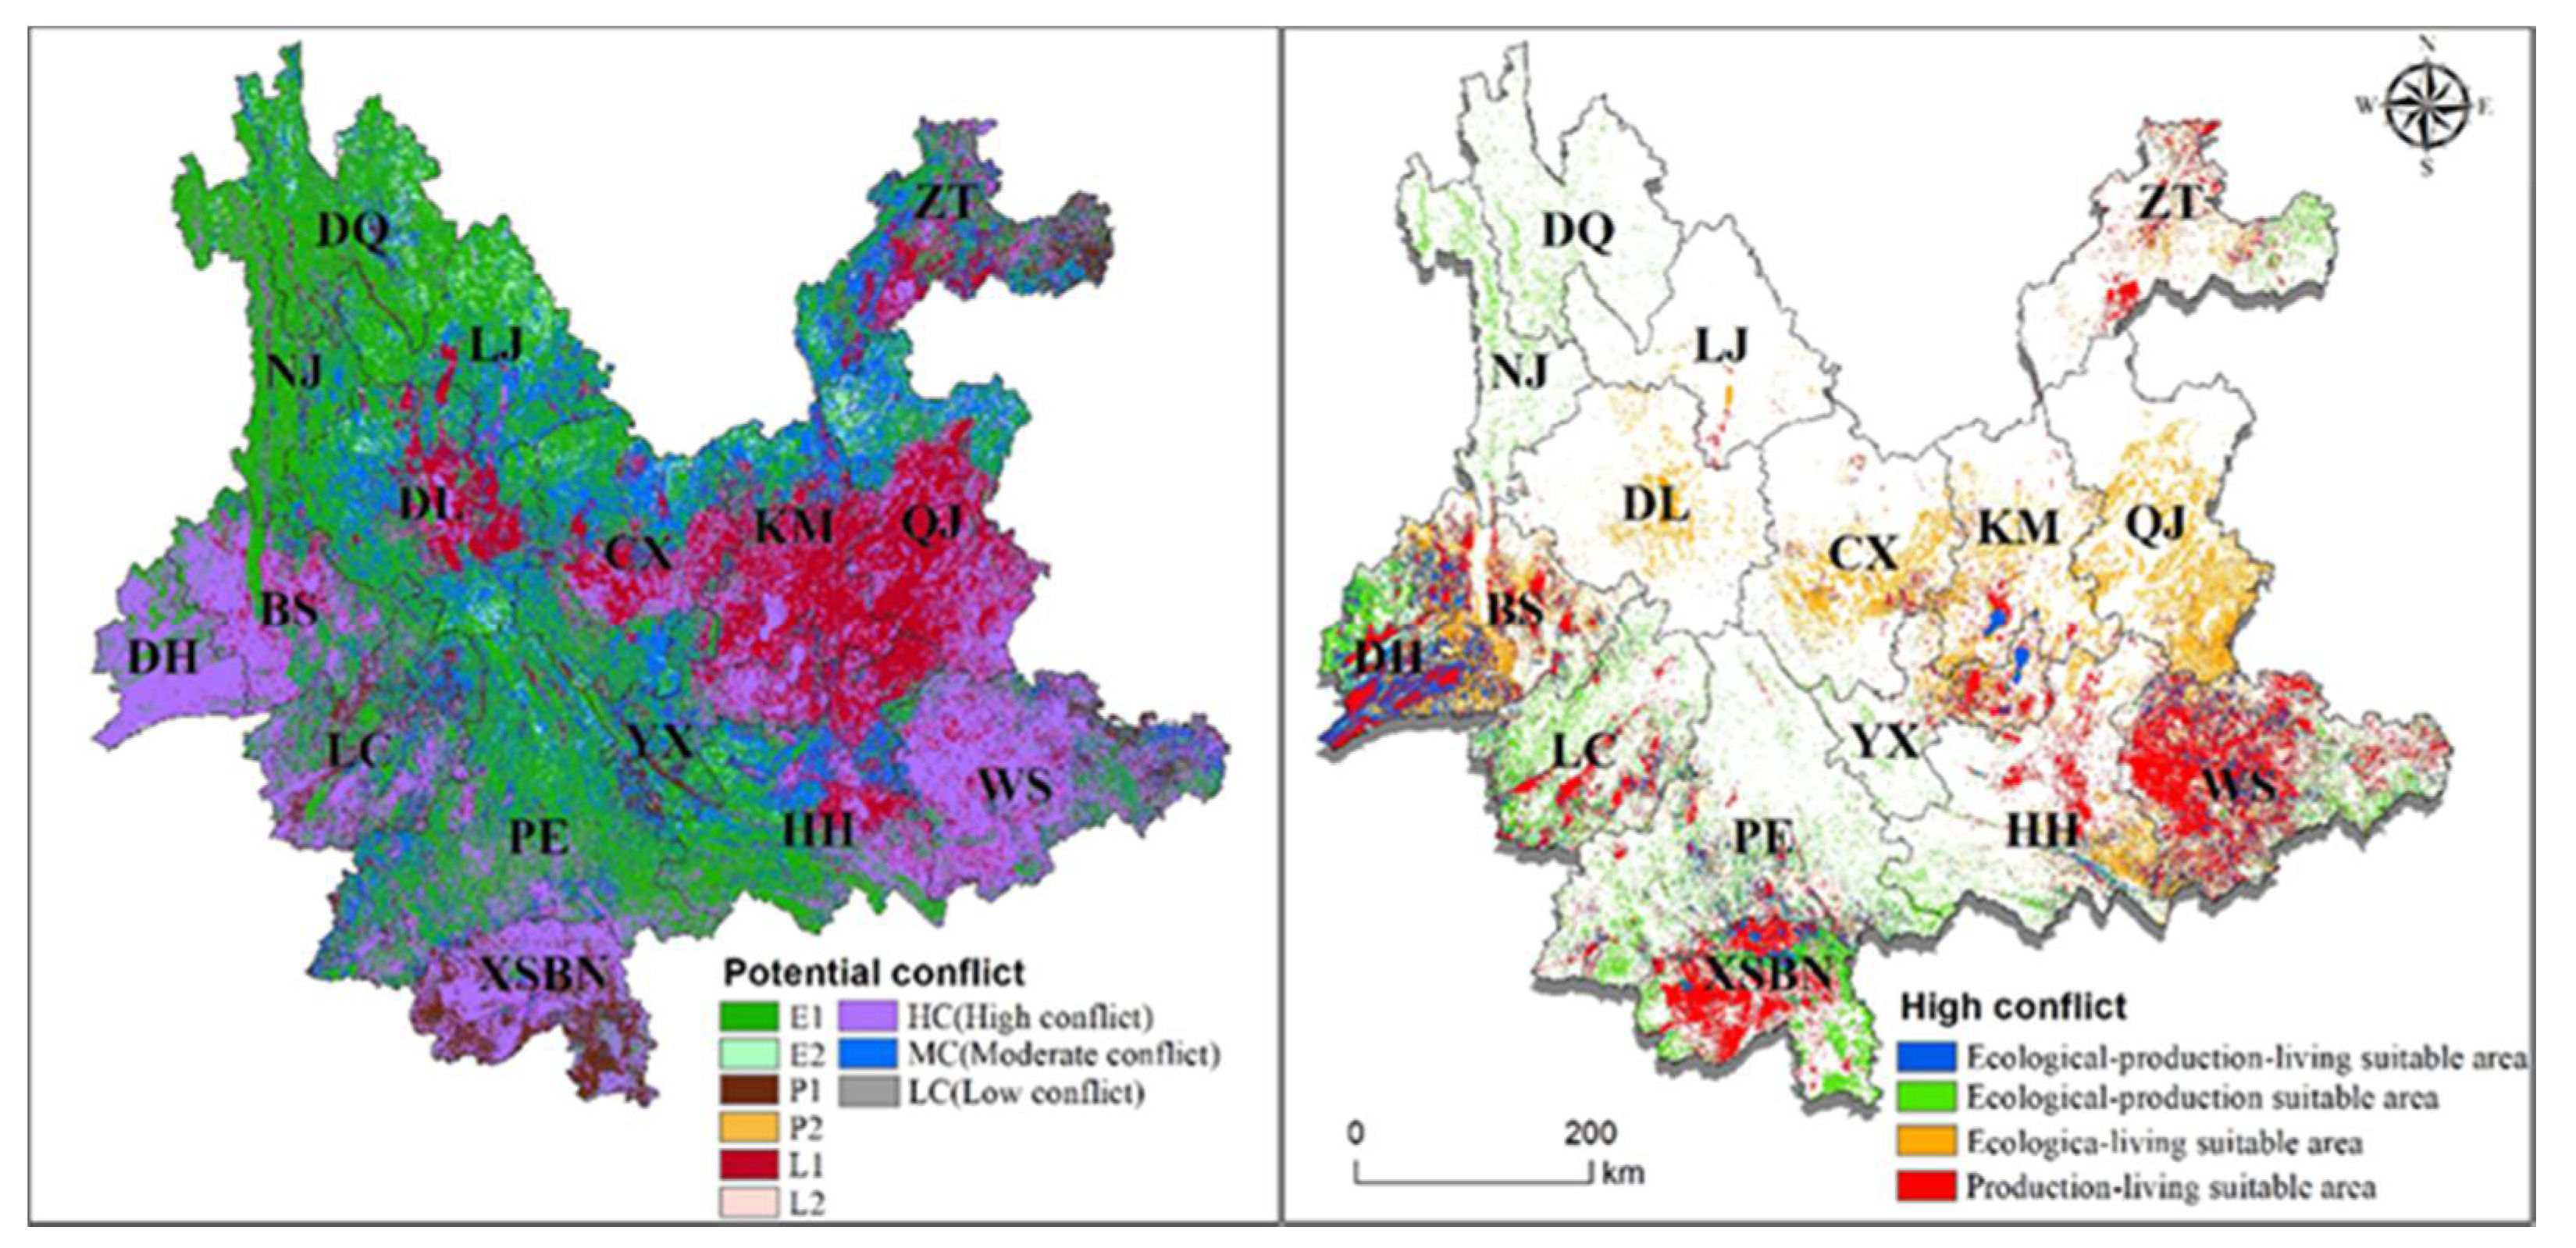
4.2. Conflict-Based Optimization of Space Function

Through the permutation and combination methods, PLES suitability results are merged and classified, generating 27 types of land use function combinations. In terms of quantity, 26.6% of the area in Yunnan Province is at risk of potential conflicts. Potential conflicts in Yunnan Province are mostly fierce between the ecological–production functions and production–living functions. In mountainous areas particularly, due to the complex terrain conditions, few low hills, and terrain constraints, there is high overlap between the areas suitable for production and living, as shown in Figure 8.
In conjunction with these analyses, the following governance strategies are proposed:
Production function advantage zone (P1): This zone totals 25,200 km2 in area, accounting for only 6.39% of the total area. Because advantageous agricultural areas are distributed in strips, measures should be implemented for the intensive use and conservation management of agricultural space (for instance, making full use of scientific knowledge to utilize agricultural land, selecting advantageous agricultural products, and rationally increasing the level of industrialized management).
Living function advantage zone (L1): This zone totals 56,300 km2 in area, accounting for 14.28% of the total area. Restricted by topographical conditions, the living function advantage zone is concentrated in the central part of Yunnan Province and is extensively mixed with other types. It is necessary to expand the radiation of benefits from this area to neighboring areas and to improve the income and consumption level of residents through regional coordination. For the scattered living function advantage zones, urban planners need to formulate specific detailed and differentiated management policies.
Ecological functional advantage zone (E1): This zone totals 122,600 km2 in area, accounting for 31.12% of the total area. This area is mainly concentrated in northwest Yunnan and extends along the Ailao Mountains and Wuliang Mountains to the south. To maintain the ecological functions of this zone, ecological protection should be prioritized. Any development and construction activities that are not related to protection should be prohibited, and measures to gradually withdraw construction land should be adopted to protect the ecological environment.
Production–living–ecological advantage zone (P1–L1–E1): This zone is 17,300 km2 in area, accounting for 4.38% of the total area. The eco–production–living advantage zone is suitable for all three functions. In these areas, all index items generally have the highest scores, and they should be adapted to local conditions to maximize their effectiveness. In these zones, most of the current land use types are for construction. Therefore, attention should be given to multifunctional development to maximize utilization efficiency.
Production–living functional advantage zone (P1–L1): The area of this zone is 37,200 km2, accounting for 9.43% of the total area. This area has high-quality agricultural land with good terrain and traffic conditions, making it a suitable area for expanding construction. This area is the first choice for development when new construction land is needed, and the probability that agricultural land will be converted to construction land is relatively high. The goal for construction land is to find potential sites, activate the land stock, and avoid occupying large-scale arable land.
Production–ecological function advantage zone (P1–E1): This zone is 22,000 km2 in area and accounts for 5.59% of the total area. This zone is endowed with a good ecological environment and rich agricultural resources, which are distributed at the intersection of the agricultural production areas and ecological function areas. Both production and ecological values are relatively high in this area, indicating that the coordinated development of production and ecology should be promoted, e.g., by building green industry.
Living–ecological function advantage zone (L1–E1): This zone is 28,400 km2 in area, accounting for 7.2% of the total area. Zones of this type are either located around the periphery of cities or are embedded in the production–living functional advantage zone. In the future, the natural environmental advantages of this zone should be utilized to build an ecologically livable development model. For instance, the ecotourism industry and a distinctive tourism brand can be appropriately developed by considering unique ethnic customs, nature sightseeing, and biological research.
All unsuitable zone (P3–L3–E3): The total area of unsuitable zones is 85,200 km2, accounting for 21.61% of the total area. Sites in this zone are mainly located in areas with high altitude, high terrain fragmentation, and no advantage in road access, suitable for neither living nor production. For land in this zone, the original land type should be maintained. In other words, there is no need to take compulsory measures. A combination of local natural, human, and social factors, as well as the scientific adjustment of the layout, should be adopted to foster natural ecological restoration.

5. Discussion and Conclusions

5.1. Discussion

To empirically build the PLE suitability evaluation model, we first analyze the natural geographical environment of the mountainous region in Southwest China. Based on the aggregation of massive multisource heterogeneous data, a representative multilevel and multistandard evaluation system is then constructed through multi-objective function selection [48]. Integrating multiple indicators under various systems involves a range of availability indicators, including land resources, water resources, environment, and ecosystems, which are indispensable for regional land use conflict assessment. Finally, we map the intensity of potential land use conflict over time at the grid level, which allows the support of land use decisions with accurate locations. At the same time, the unique research area provides new discoveries with high practical significance. For the study area, Southwest China is an important ecological security barrier belt in China [49,50]. Yunnan is an important part of the southwest ecological security barrier, as its rich biodiversity provides an excellent habitat for animals and plants. This research will be beneficial to the optimization and governance of the spatial pattern in Southwest China and provide a reference for sustainable land use in other mountainous regions.
This research not only focuses on the application of comprehensive results, but also emphasizes the pertinence, accuracy, and objectivity of single-element evaluations and identifies the constraints that affect the utilization of regional production and living spaces. By comparing the results derived from single-factor and integrated evaluation, specific problems and risks can be identified. These strategies can be compiled into further comprehensive governance and ecological restoration projects. Combining the results of suitability evaluation, the analysis is conducted based on the following points:
(1)
Through a comparative analysis of available agricultural water quantity and production suitability, it can be concluded that some concentrations of suitable areas for production have less water available, especially in central Yunnan. The quality of cultivated land can be improved by constructing comprehensive land remediation projects, funding large-scale farmland water conservancy projects, and improving farmland water-saving facilities.
(2)
Through a comparative analysis of available water resources and living suitability, we find that regions with fewer water resources have higher levels of living suitability, particularly in the plains of central Yunnan. Therefore, it is necessary to address the water shortage issue by constructing major water conservancy projects and increasing water-saving measures.
(3)
Comparing the biological diversity layer with the ecological function area delineated in main function planning, we have observed a recent decrease in biological diversity. This decrease is particularly prominent in the Xishuangbanna area, where ecological restoration measures are needed.
(4)
Comparing the soil pollution results with the production suitability results, the soil pollution leads to a reduction in the suitability of production, especially in Qujing, Wenshan, and Honghe cities. Therefore, the protection and restoration of soil environmental pollution should be strengthened through comprehensive land remediation.
As a theoretical and empirical exploration, this paper naturally has some limitations, which, at the same time, suggests avenues for further research. This research explores the methods and application of provincial suitability evaluation. However, for suitability evaluation at other scales, e.g., at the municipal, county, and village levels, it is necessary to select other evaluation methods and indicators according to the scale application requirements. For different regional development stages, the need for evaluation and the degree of convergence also demands further exploration. Due to the different levels of political power held by administrative departments, the selection of indicators is still restricted by data availability, and the criteria for determining indicators are subjective. In terms of the current evaluation results, as the accuracy of data collection is relatively low, the evaluation results at the provincial level may not sufficiently support the optimization of the three red lines. However, the results are mainly used to identify the dominant functional areas and any spatial risk. For suitability evaluation at the city level, the evaluation accuracy needs to be enhanced, and investigations should be carried out to identify existing risks.
Taken together, predicting the carrying capacity of the resource and environment system is a dynamic monitoring process, and the suitability of spatial structure also changes with the external environment. The production capacity of resources and environmental foundations will be irreversibly reduced if they are not carefully utilized. Improving the methods of managing the economic structure and resources is one effective measure to achieve sustained economic and population growth. At present, suitability evaluation is carried out at a given point in time, and thus the prediction is limited to a certain time node, which reduces the accuracy of predictions. Only by monitoring the changing status of regional suitability and assessing the sustainability of regional development from a dynamic perspective can the planning and implementation be scientifically and effectively achieved. Moreover, when the carrying capacity of resources and the environment is at risk, establishing a long-term system for monitoring and then providing an early warning allows a clear understanding of the characteristics and attributes of space [51].
In the future, facing the imaginary concept of “Beautiful China” and the goal of becoming the “Pioneer of the Ecological Civilization”, the technical framework for the suitability of PLES and the optimization of its functions can meet the national strategic application requirements. The multidimensional coupled relationship between population, society, economy, resources, and environmental subsystems deserves comprehensive consideration. Various elements should be integrated within the system to form a dynamic and open geographic system. Furthermore, based on PLES optimization control and simulation theory, a “one picture” platform, as an overall optimization and decision support platform, will be constructed to manage information. The platform will integrate a set of functions including data processing, time-space analysis, scenario simulation, display of results, problem diagnosis, and early warning and control. At the theoretical level of optimization, resource metabolism theory is combined with the geographic pattern of PLES. The development and application of system simulation models and multi-objective optimization models are emphasized. Different scenarios and parameters can be designed by considering the dynamic mechanisms operating among population, resources, environment, and geographical factors and combining this with the results of the evolution, conflict, and problem diagnosis of PLES.

5.2. Conclusions

Following the principle of regional sustainable development, we build a spatial suitability evaluation model considering productivity, sustainability, and livability for land development. We take Yunnan Province, a typical mountainous area in China, as the research area. Using the analytical hierarchy process and GIS spatial analysis technology, we carry out a single-function suitability evaluation and analyze the spatial pattern distribution characteristics of this province. Then, a comprehensive integrated multifunction delineation of PLES through spatial conflict analysis is conducted. The following main conclusions are drawn:
(1)
From the evaluation results of PLES suitability, suitable areas for production account for 6.39% and are mainly distributed in southern Yunnan. Suitable areas for living account for 14.28%, which are mainly distributed in central Yunnan. Suitable areas for ecology accounts for 31.12%, and which is mainly located in northwestern Yunnan.
(2)
In terms of spatial correlation and conflict analysis, 26.6% of the area has potential spatial conflicts. Among them, 4.38% of the area is suitable for production–living–ecology. The production–living advantage areas are concentrated in the central Yunnan UA, which has a high spatial overlap.
(3)
Ecological functional areas account for the largest proportion and are concentrated in the northwestern part of Yunnan Province. In the future, to formulate regional plans for Yunnan, urban planners should make full use of its natural and human geographical features, vigorously utilize its dominant and advantageous functions, and improve its relatively lagging spatial functions.

Author Contributions

Conceptualization, methodology, and writing—Y.Y.; original draft preparation, visualization, writing, and editing—Y.F.; software, validation, and formal analysis—W.S. and J.Z.; project administration, funding, and review—D.A. All authors have read and agreed to the published version of the manuscript.

Funding

This research was funded by the 2020 Special Scientific Research Project of Yunnan Provincial Department of Natural Resources.

Institutional Review Board Statement

Not applicable.

Informed Consent Statement

Not applicable.

Data Availability Statement

The data presented in this study are available upon request from the author.

Acknowledgments

Our deepest gratitude goes to the anonymous reviewers and editors for their careful work and thoughtful suggestions that have helped improve this paper substantially. In addition, we sincerely thank Chen Xi for his help in this research.

Conflicts of Interest

The authors declare no conflict of interest.

Appendix A

Evaluation of agricultural meteorological disaster data.
(1)
Flood: A flood process is counted when the rainfall of each station reaches or exceeds 250 mm in 10 days or the rainfall reaches or exceeds 350 mm in 20 days. We take the years when a flooding process occurs once or more as a “flood year”. The daily rainfall at each station for the past 10 years is used to count the flood processes and determine whether it is a flood year. The frequency of flood years is an indicator to analyze the risk of flood disasters.
(2)
Drought: The drought statistical indicators are classified according to the meteorological drought grades delineated in the national standard “Meteorological Drought Grades”. The months above the moderate drought grade were regarded as “drought months”. The percentage of rainfall anomalies reflects the degree of deviation in rainfall in a certain period from the average state of the same period. The calculation formula is as follows:
P A = P P ¯ P ¯ × 100 %
where PA is the percentage of rainfall anomaly in a certain month (%); P is the rainfall for the month in a certain year (mm); and P ¯   is the average rainfall for the month over 10 years (mm). Using the monthly rainfall data of each station for the past 10 years to judge the meteorological drought on a monthly scale (no drought, P > −40%; light drought, −60% < P ≤ −40%; moderate drought, −80% < P ≤ −60%; severe drought, −95% < P ≤ −80%; extreme drought, P ≤ −95%), the years when the cumulative meteorological drought lasts for more than 3 months are defined as “meteorological drought years”. The frequency of meteorological drought years is used to analyze the risk of meteorological drought.
(3)
High-temperature heat damage: A high-temperature process is defined as occurring when the daily maximum temperature is ≥35 °C for more than 3 days, ≥35 °C for 2 consecutive days, or ≥38 °C in one day. A high-temperature year is defined as a year in which a high-temperature process occurs more than 3 times in a year or a high-temperature day lasts more than 30 days. We use the daily maximum temperature of each station to calculate the probability of occurrence for high temperature in the past 10 years and then perform hierarchical analysis.
(4)
Low-temperature injury: The standards for low-temperature injury are determined according to the “General Theory of Meteorological Disasters in Yunnan”. In summer and autumn from July to early September, in the Yunnan one-season mid-season rice or hybrid rice area, where the altitude is below 1500 m (the average daily temperature drops by 1 °C for every 100 m increase in altitude), severe cold damage occurs when the daily average temperature is lower than 20 °C for 3 consecutive days or more. The occurrence of one chilling injury indicates a low-temperature injury year, and the probability of low-temperature injury occurring at each site is calculated over 10 years.
(5)
Gale disaster: A strong-wind day is defined as a day when the instantaneous wind speed reaches or exceeds 17 m/s, while a gale day is defined as occurring when the instantaneous wind speed reaches or exceeds 24.5 m/s. Strong-wind days and gale days at each station are selected as evaluation indicators for wind disaster risk assessment. A year when a specific location has 30 strong wind days or one gale day in a year is defined as a wind disaster year. The number of strong-wind days or gale days at each station in the past 10 years is used to judge the number of wind disasters years at each station. We then calculate its occurrence frequency and conduct spatial interpolation and classification.

Appendix B

Evaluation of temperature and humidity index.
Based on the data from meteorological stations in Yunnan Province, the 12-month average temperature and monthly average relative air humidity of each station are calculated; the grid-scale monthly average temperature and monthly average relative air humidity are obtained through spatial interpolation. The 12-month grid-scale temperature and humidity index are calculated according to the above formula. The median value of the 12-month comfort level is taken as the comfort level of the area. The temperature and humidity index formula is shown as follows:
T H I = T 0.55 × ( 1 f ) × ( T 58 )
where THI is the temperature and humidity index, T represents the monthly average temperature (Fahrenheit), and f is the monthly average relative humidity (%).

Appendix C

Evaluation of traffic network density.
The road network is used to evaluate traffic network density adopting the linear density analysis method. The calculation formula is:
D = L / A
where D is the density of the traffic network (km2/km2); L is the grid area of the county area containing roads (highways, national roads, provincial roads, and county roads) using a 50 × 50 m grid; and A is the neighborhood area of the grid unit (km²), with a neighborhood radius of 20 km.

References

  1. Arrow, K.; Bolin, B.; Costanza, R.; Dasgupta, P.; Folke, C.; Holling, C.S.; Jansson, B.-O.; Levin, S.; Mäler, K.-G.; Perrings, C.; et al. Economic growth, carrying capacity, and the environment. Ecol. Econ. 1995, 15, 91–95. [Google Scholar] [CrossRef]
  2. Memarbashi, E.; Azadi, H.; Barati, A.A.; Mohajeri, F.; Passel, S.V.; Witlox, F. Land-use suitability in Northeast Iran: Application of AHP-GIS hybrid model. ISPRS Int. J. Geo Inf. 2017, 6, 396. [Google Scholar] [CrossRef] [Green Version]
  3. Romano, G.; Dal Sasso, P.; Trisorio Liuzzi, G.; Gentile, F. Multi-criteria decision analysis for land suitability mapping in a rural area of Southern Italy. Land Use Policy 2015, 48, 131–143. [Google Scholar] [CrossRef]
  4. Pokhrel, S. Green space suitability evaluation for urban resilience: An analysis of kathmandu metropolitan city, nepal. Environ. Res. Commun. 2019, 1, 105003. [Google Scholar] [CrossRef]
  5. Liu, Y.; Fang, F.; Li, Y. Key issues of land use in China and implications for policy making. Land Use Policy 2014, 40, 6–12. [Google Scholar] [CrossRef]
  6. Jiang, D.; Lin, G.; Fu, J. Discussion on scientific foundation and approach for the overall optimization of “Production-Living-Ecological” space. J. Nat. Resour. 2021, 36, 1085. [Google Scholar] [CrossRef]
  7. Chen, M.; Liang, L.; Wang, Z.; Zhang, W.; Yu, J.; Liang, Y. Geographical thoughts on the relationship between ‘Beautiful China’ and land spatial planning. J. Geogr. Sci. 2020, 30, 705–723. [Google Scholar] [CrossRef]
  8. Liu, Y.; Zhou, Y. Territory spatial planning and national governance system in China. Land Use Policy 2021, 102, 105288. [Google Scholar] [CrossRef]
  9. Fan, J.; Wang, Y.; Wang, C.; Chen, T.; Jin, F.; Zhang, W.; Li, L.; Xu, Y.; Dai, E.; Tao, A.; et al. Reshaping the Sustainable Geographical Pattern: A Major Function Zoning Model and Its Applications in China. Earth’s Future 2019, 7, 25–42. [Google Scholar] [CrossRef]
  10. Bai, Y.; Wong, C.P.; Jiang, B.; Hughes, A.C.; Wang, M.; Wang, Q. Developing China’s Ecological Redline Policy using ecosystem services assessments for land use planning. Nat. Commun. 2018, 9, 3034. [Google Scholar] [CrossRef] [Green Version]
  11. Xu, X.; Yang, G.; Tan, Y. Identifying ecological red lines in China’s Yangtze River Economic Belt: A regional approach. Ecol. Indic. 2019, 96, 635–646. [Google Scholar] [CrossRef]
  12. Liang, X.; Liu, X.; Li, X.; Chen, Y.; Tian, H.; Yao, Y. Delineating multi-scenario urban growth boundaries with a CA-based FLUS model and morphological method. Landsc. Urban Plan. 2018, 177, 47–63. [Google Scholar] [CrossRef]
  13. Zhang, D.; Liu, X.; Lin, Z.; Zhang, X.; Zhang, H. The delineation of urban growth boundaries in complex ecological environment areas by using cellular automata and a dual-environmental evaluation. J. Clean. Prod. 2020, 256, 120361. [Google Scholar] [CrossRef]
  14. Zhao, Y.; Xie, D.; Zhang, X.; Ma, S. Integrating Spatial Markov Chains and Geographically Weighted Regression-Based Cellular Automata to Simulate Urban Agglomeration Growth: A Case Study of the Guangdong–Hong Kong–Macao Greater Bay Area. Land 2021, 10, 633. [Google Scholar] [CrossRef]
  15. Zhao, X.; Li, S.; Pu, J.; Miao, P.; Wang, Q.; Tan, K. Optimization of the national land space based on the coordination of urban-agricultural-ecological functions in the karst areas of Southwest China. Sustainability 2019, 11, 6752. [Google Scholar] [CrossRef] [Green Version]
  16. Lin, G.; Fu, J.; Jiang, D. Production-living-ecological conflict identification using a multiscale integration model based on spatial suitability analysis and sustainable development evaluation: A case study of Ningbo, China. Land 2021, 10, 383. [Google Scholar] [CrossRef]
  17. Hopkins, L.D. Methods for generating land suitability maps: A comparative evaluation. J. Am. Plan. Assoc. 1977, 43, 386–400. [Google Scholar] [CrossRef]
  18. Collins, M.G.; Steiner, F.R.; Rushman, M.J. Land-use suitability analysis in the United States: Historical development and promising technological achievements. Environ. Manag. 2001, 28, 611–621. [Google Scholar] [CrossRef] [PubMed]
  19. Marull, J.; Pino, J.; Mallarach, J.M.; Cordobilla, M.J. A Land Suitability Index for Strategic Environmental Assessment in metropolitan areas. Landsc. Urban Plan. 2007, 81, 200–212. [Google Scholar] [CrossRef]
  20. Malczewski, J. GIS-based land-use suitability analysis: A critical overview. Prog. Plan. 2004, 62, 3–65. [Google Scholar] [CrossRef]
  21. Liao, T.; Li, D.; Wan, Q. Tradeoff of Exploitation-protection and Suitability Evaluation of Low-slope hilly from the perspective of “production-living-ecological” optimization. Phys. Chem. Earth 2020, 120, 102943. [Google Scholar] [CrossRef]
  22. Yu, S.-H.; Deng, W.; Xu, Y.-X.; Zhang, X.; Xiang, H.-L. Evaluation of the production-living-ecology space function suitability of Pingshan County in the Taihang mountainous area, China. J. Mt. Sci. 2020, 17, 2562–2576. [Google Scholar] [CrossRef]
  23. Cui, J.; Kong, X.; Chen, J.; Sun, J.; Zhu, Y. Spatially explicit evaluation and driving factor identification of land use conflict in yangtze river economic belt. Land 2021, 10, 43. [Google Scholar] [CrossRef]
  24. Jing, W.; Yu, K.; Wu, L.; Luo, P. Potential Land Use Conflict Identification Based on Improved Multi-Objective Suitability Evaluation. Remote Sens. 2021, 13, 2416. [Google Scholar] [CrossRef]
  25. Jiang, S.; Meng, J.; Zhu, L. Spatial and temporal analyses of potential land use conflict under the constraints of water resources in the middle reaches of the Heihe River. Land Use Policy 2020, 97, 104773. [Google Scholar] [CrossRef]
  26. Zhang, J.; Su, Y.; Wu, J.; Liang, H. GIS based land suitability assessment for tobacco production using AHP and fuzzy set in Shandong province of China. Comput. Electron. Agric. 2015, 114, 202–211. [Google Scholar] [CrossRef]
  27. Cornwell, E.; Sposito, V.; Faggian, R. Land suitability projections for traditional sub-alpine cropping in the Australian Alps and Chilean Dry Andes. A combined biophysical and irrigation potential perspective. Appl. Geogr. 2020, 121, 102248. [Google Scholar] [CrossRef]
  28. Zhang, Z.; Zhou, M.; Ou, G.; Tan, S.; Song, Y.; Zhang, L.; Nie, X. Land suitability evaluation and an interval stochastic fuzzy programming-based optimization model for land-use planning and environmental policy analysis. Int. J. Environ. Res. Public Health 2019, 16, 4124. [Google Scholar] [CrossRef] [PubMed] [Green Version]
  29. Ramadan, M.S.; Effat, H.A. Geospatial modeling for a sustainable urban development zoning map using AHP in Ismailia Governorate, Egypt. Egypt. J. Remote Sens. Sp. Sci. 2021, 24, 191–202. [Google Scholar] [CrossRef]
  30. Everest, T.; Sungur, A.; Özcan, H. Determination of agricultural land suitability with a multiple-criteria decision-making method in Northwestern Turkey. Int. J. Environ. Sci. Technol. 2021, 18, 1073–1088. [Google Scholar] [CrossRef]
  31. Cengiz, T.; Akbulak, C. Application of analytical hierarchy process and geographic information systems in land-use suitability evaluation: A case study of Dümrek village (Çanakkale, Turkey). Int. J. Sustain. Dev. World Ecol. 2009, 16, 286–294. [Google Scholar] [CrossRef]
  32. Bozdağ, A.; Yavuz, F.; Günay, A.S. AHP and GIS based land suitability analysis for Cihanbeyli (Turkey) County. Environ. Earth Sci. 2016, 75, 813. [Google Scholar] [CrossRef]
  33. Taghizadeh-Mehrjardi, R.; Nabiollahi, K.; Rasoli, L.; Kerry, R.; Scholten, T. Land suitability assessment and agricultural production sustainability using machine learning models. Agronomy 2020, 10, 573. [Google Scholar] [CrossRef]
  34. Kang, Z.; Wang, S.; Xu, L.; Yang, F.; Zhang, S. Suitability assessment of urban land use in Dalian, China using PNN and GIS. Nat. Hazards 2021, 106, 913–936. [Google Scholar] [CrossRef]
  35. Akbari, M.; Neamatollahi, E.; Neamatollahi, P. Evaluating land suitability for spatial planning in arid regions of eastern Iran using fuzzy logic and multi-criteria analysis. Ecol. Indic. 2019, 98, 587–598. [Google Scholar] [CrossRef]
  36. Amini, S.; Rohani, A.; Aghkhani, M.H.; Abbaspour-Fard, M.H.; Asgharipour, M.R. Assessment of land suitability and agricultural production sustainability using a combined approach (Fuzzy-AHP-GIS): A case study of Mazandaran province, Iran. Inf. Process. Agric. 2020, 7, 384–402. [Google Scholar] [CrossRef]
  37. Tashayo, B.; Honarbakhsh, A.; Azma, A.; Akbari, M. Combined Fuzzy AHP–GIS for Agricultural Land Suitability Modeling for a Watershed in Southern Iran. Environ. Manag. 2020, 66, 364–376. [Google Scholar] [CrossRef] [PubMed]
  38. Malmir, M.; Zarkesh, M.M.K.; Monavari, S.M.; Jozi, S.A.; Sharifi, E. Analysis of land suitability for urban development in Ahwaz County in southwestern Iran using fuzzy logic and analytic network process (ANP). Environ. Monit. Assess. 2016, 188, 447. [Google Scholar] [CrossRef]
  39. Overmars, K.P.; Verburg, P.H.; Veldkamp, T. Comparison of a deductive and an inductive approach to specify land suitability in a spatially explicit land use model. Land Use Policy 2007, 24, 584–599. [Google Scholar] [CrossRef]
  40. Zhou, D.; Xu, J.; Lin, Z. Conflict or coordination? Assessing land use multi-functionalization using production-living-ecology analysis. Sci. Total Environ. 2017, 577, 136–147. [Google Scholar] [CrossRef]
  41. Wang, Y.; Fan, J.; Zhou, K. Territorial function optimization regionalization based on the integration of “Double Evaluation”. Geogr. Res. 2019, 38, 2415–2429. [Google Scholar] [CrossRef]
  42. Jin, G.; Li, Z.; Lin, Q.; Shi, C.; Liu, B.; Yao, L. Land Use Suitability Assessment in Low-Slope Hilly Regions under the Impact of Urbanization in Yunnan, China. Adv. Meteorol. 2015, 2015, 848795. [Google Scholar] [CrossRef] [Green Version]
  43. Luo, J.; Zhan, J.; Lin, Y.; Zhao, C. An equilibrium analysis of the land use structure in the Yunnan Province, China. Front. Earth Sci. 2014, 8, 393–404. [Google Scholar] [CrossRef]
  44. Yang, Y.; Tian, K.; Hao, J.; Pei, S.; Yang, Y. Biodiversity and biodiversity conservation in Yunnan, China. Biodivers. Conserv. 2004, 13, 813–826. [Google Scholar] [CrossRef]
  45. Li, S.; Zhao, X.; Pu, J.; Miao, P.; Wang, Q.; Tan, K. Optimize and control territorial spatial functional areas to improve the ecological stability and total environment in karst areas of Southwest China. Land Use Policy 2021, 100, 104940. [Google Scholar] [CrossRef]
  46. Zong, W.; Cheng, L.; Xia, N.; Jiang, P.; Wei, X.; Zhang, F.; Jin, B.; Zhou, J.; Li, M. New technical framework for assessing the spatial pattern of land development in Yunnan Province, China: A “production-life-ecology” perspective. Habitat Int. 2018, 80, 28–40. [Google Scholar] [CrossRef]
  47. Wang, Y.; Dai, E.; Yin, L.; Ma, L. Land use/land cover change and the effects on ecosystem services in the Hengduan Mountain region, China. Ecosyst. Serv. 2018, 34, 55–67. [Google Scholar] [CrossRef]
  48. El Baroudy, A. Mapping and evaluating land suitability using a GIS-based model. Catena 2016, 140, 96–104. [Google Scholar] [CrossRef]
  49. Dai, E.; Wang, Y.; Ma, L.; Yin, L.; Wu, Z. ‘Urban-Rural’ Gradient Analysis of Landscape Changes around Cities in Mountainous Regions: A Case Study of the Hengduan Mountain Region in Southwest China. Sustainability 2018, 10, 1019. [Google Scholar] [CrossRef] [Green Version]
  50. Sherman, R.; Mullen, R.; Haomin, L.; Zhendong, F.; Yi, W. Spatial patterns of plant diversity and communities in Alpine ecosystems of the Hengduan Mountains, northwest Yunnan, China. J. Plant Ecol. 2008, 1, 117–136. [Google Scholar] [CrossRef]
  51. Fan, J.; Wang, Y.; Ouyang, Z.; Li, L.; Xu, Y.; Zhang, W.; Wang, C.; Xu, W.; Li, J.; Yu, J.; et al. Risk forewarning of regional development sustainability based on a natural resources and environmental carrying index in China. Earth’s Future 2017, 5, 196–213. [Google Scholar] [CrossRef]
Figure 1. Research location, altitude map, and land use status map for 2020. For Yunnan Province, (a) its location in China; (b) an elevation analysis; and (c) land use in 2020. (Abbreviations represent cities in Yunnan Province. KM: Kunming; QJ: Qujing; YX: Yuxi; BS: Baoshan; ZT: Zhaotong; LJ: Lijiang; PE: Pu’er; LC: Lincang; CX: Chuxiong; HH: Honghe; WS: Wenshan; XSBN: Xishuangbanna; DL: Dali; DH: Dehong; NJ: Nujiang; DQ: Diqing.)
Sustainability 14 00371 g001
Figure 2. Research flow chart.
Sustainability 14 00371 g002
Figure 3. Potential conflict analysis chart.
Sustainability 14 00371 g003
Figure 4. Single-layer analysis chart of the production suitability evaluation.(a) Slope; (b) Soil organic matter; (c) Drought index; (d) Agricultural water consumption modulus; (e) ≥0 °C accumulated temperature; (f) Soil environmental quality; (g) Probability of low temperature chilling damage; (h) Probability of drought; (i) Probability of high temperature heat damage; (j) Probability of flood disaster; (k) Probability of wind disaster; (l) Agrometeorological disaster classification.
Sustainability 14 00371 g004
Figure 5. Single-layer analysis chart of the living suitability evaluation. (a) Slope; (b) DEM; (c) Relief amplitude; (d) Modulus of total water resources; (e) Modulus of total water consumption; (f) Climate comfort index; (g) Earthquake risk; (h) Peak ground acceleration; (i) Earth disaster susceptibility; (j) Accessibility of transportation hub; (k) Accessibility of traffic trunk line; (l) Traffic network density.
Sustainability 14 00371 g005
Figure 6. Single-layer analysis chart of the ecological suitability evaluation. (a) The importance of biodiversity maintenance function; (b) The importance of soil and water conservation function; (c) The importance of water conservation; (d) Soil erosion vulnerability; (e) Rocky desertification vulnerability; (f) Plateau lakes vulnerability.
Sustainability 14 00371 g006
Figure 7. Suitability evaluation of PLES in Yunnan for (a) production space, (b) living space, and (c) ecological space.
Sustainability 14 00371 g007
Figure 8. Potential conflict and high conflict map.
Sustainability 14 00371 g008
Table 1. Basic data source diagram.
Data CategoryData NameData FormatData ResolutionData Sources
Basic information categorySocioeconomic dataText Yunnan Statistical Yearbook of 2020
Fundamental geographic categoryThe third national land surveyVector Natural Resources Department of Yunnan Province
DEM dataRaster30 m × 30 mChinese Academy of Sciences Geospatial Data Cloud http://www.gscloud.cn/search, accessed on 15 December 2021.
Terrain reliefRaster50 m × 50 mUsing the DEM neighborhood analysis function to calculate (neighborhood area is 9 × 9)
Water resources categoryTotal water resources and water consumption dataExcel Results of the third water resources survey and evaluation
Average annual rainfall and evaporationExcel China meteorological data network (http://data.cma.cn, accessed on 15 December 2021.)
Environmental categorySoil pollution survey dataVector Ecological Environment Department of Yunnan Province
Ecological categoryForestry survey dataVector Forestry and Grass Bureau of Yunnan Province
NDVIRaster250 m × 250 mChinese Academy of Sciences Geospatial Data Cloud
Ecosystem type diagramRaster250 m × 250 mEcological Environment Department of Yunnan Province
Special monitoring results for soil erosionVector Water Resources Department of Yunnan Province
Special monitoring results for rocky desertificationVector Ecological Environment Department of Yunnan Province
Soil organic matterRaster1 km × 1 kmNanjing Institute of Soil Science, Chinese Academy of Sciences
Disaster categoryPeak ground accelerationText Earthquake Administration of Yunnan Province
Active faultsVector Geological Atlas of China
Geological hazard susceptibility zoneVector Geological Disaster Prevention Plan of Yunnan Province
Climate categoryDaily rainfall, ≥0 °C active accumulated temperature, daily average temperature, multi-year average wind speed, daily maximum wind speed, monthly average temperature, and monthly average humidityExcel Meteorological Bureau of Yunnan Province
Location categoryNational highways, provincial highways, county highways, highway entrances and exits, airports, railway stations, etc.Vector Geographical data of Yunnan Province
Table 2. Production suitability evaluation index system table.
Criteria and WeightIndices and WeightGrading and Assignment
10080604020
Land resources (0.25)Slope (0.7)≤6°6–15°15–25°25–35°>35°
Soil organic matter/g/kg (0.3)>3525–3515–2510–15≤10
Water resources (0.2)Drought index (0.5)≤1.01.0–1.41.4–2.12.1–4.0>4.0
Agricultural water consumption modulus/×103 m3/km2 (0.5)≤3030–6060–8080–90>90
Climate (0.2)≥0 °C active accumulated temperature/°C≥76005800–76004000–58001500–4000<1500
Environment (0.1)Soil environmental qualityRisk screening value >Risk screening value and ≤ risk control value >Risk control value
Meteorological disasters (0.25)Flood/% (0.2)≤2020–4040–6060–80>80
Drought/% (0.25)≤2020–4040–6060–80>80
High-temperature heat damage/% (0.2)≤2020–4040–6060–80>80
Low-temperature injury/% (0.15)≤2020–4040–6060–80>80
Gale disaster/% (0.2)≤2020–4040–6060–80>80
Table 3. Living suitability evaluation index system table.
Criteria and WeightIndices and WeightGrading and Assignment
10080604020
Land resources (0.15)Slope (0.4)≤3°3–8°8–15°15–25°>25°
Elevation/m (0.4)<15001500–25002500–35003500–5000≥5000
Terrain relief/m (0.2)<100100–200200–500500–1000≥1000
Water resources (0.2)Modulus of total water resources/×103 m3/km2 (0.5)≥800600–800400–600200–400<200
Modulus of total water consumption/×103 m3/km2 (0.5)≥13050–13030–5010–30<10
Climate (0.15)Comfort level/THI60–6555–60 (or 65–70)50–55 (or 70–75)<50 (or > 75)
Disaster (0.25)Earthquake risk/m (0.3)>400200–400100–200≤100
Peak ground acceleration/g (0.2)0.050.10 (or 0.15)0.20 (or 0.30)0.40
Geological hazard susceptibility (0.5) Low-prone zoneModerate-prone zoneHigh-prone zone
Location (0.25)First-class road/km (0.04)≤33–6 >6
Second-class road/km (0.06) ≤33–6 >6
Third-class road/km (0.06) ≤33–6>6
Fourth-class road/km (0.04) ≤3>3
Central city accessibility (0.4)≤1515–3535–6060–90>90
Airport/km (0.09)≤3030–6060–9090–120>120
Railway/km (0.09)≤3030–60 >60
Port/km (0.03) ≤6060–9090–120>120
Highway entrance (0.09) ≤3030–60 >60
Traffic network density (0.1)54321
Table 4. Ecological suitability evaluation index system table.
CriterionIndexGrading and Assignment
HighestHighGeneral
The importance of ecosystem servicesThe importance of biodiversity maintenance functionNatural forests within national public welfare forests, priority ecological system distribution areasOther forests, wetlands, water landAll other areas
The importance of water conservationThe top 50% of areas based on cumulative water conservation quantityThe top 80% areas based on cumulative water conservation quantityAll other areas
The importance of soil and water conservationForests, shrubs, and grasslands with a slope of no less than 25 degrees and vegetation coverage no less than 80%Forests, shrubs, and grasslands with a slope of at least 15 degrees and vegetation coverage at least 60%All other areas
Ecological vulnerabilitySoil erosion vulnerabilityViolent and extremely intense areasStrong and moderate areasMild and slight areas
Rocky desertification vulnerabilityExtremely severe areasSevere areasModerate areas
Ecological vulnerability of plateau lakesNine plateau lakes and wetlands All other areas
Publisher’s Note: MDPI stays neutral with regard to jurisdictional claims in published maps and institutional affiliations.

