Article

The “Island Formation” within the Hinterland of a Port System: The Case of the Padan Plain in Italy

1
Department of Civil and Industrial Engineering and University Centre of Logistic Systems, University of Pisa, 56126 Pisa, Italy
2
University Centre of Logistic Systems, University of Pisa, 57128 Livorno, Italy
*
Author to whom correspondence should be addressed.
Sustainability 2021, 13(9), 4819; https://doi.org/10.3390/su13094819
Submission received: 4 March 2021 / Revised: 20 April 2021 / Accepted: 21 April 2021 / Published: 25 April 2021
(This article belongs to the Collection Sustainable Maritime Policy and Management)

Abstract

:
An “island formation” is a region within the hinterland of a port which is served by another port. Some regions of southern Europe, although located within the hinterland of some Mediterranean ports, are “island formations” of northern range ports (namely, northern European ports between Le Havre and Hamburg): an example is the Padan Plain, in northern Italy, which is currently, although only partially, an “island formation” of northern range ports. Actually, a relevant number of TEUs, which have origin or destination in the Padan Plain, and have been unloaded from ships operating deep-sea routes or will be loaded on them, cross northern range ports. Several sources report this number of TEUs, but there is disagreement among them. In this paper, firstly, this number of TEUs is estimated, according to scheduled rail connections between northern range ports and Italian intermodal centres/freight villages. Afterwards, an analysis of transport costs and travel times is carried out in order to determine the advantage of unloading containers (having origin in the Far East or North America and destination in the Padan Plain) through northern range ports instead of Italian ports.

1. Introduction

A maritime port is defined in Notteboom and Rodrigue [1] as “a transit area through which goods and people move from and to the sea”. A port is therefore the connection point between maritime and inland transport: briefly, it is an “access gate” to its hinterland. The hinterland of a port has been defined as “the area of which the greater part or a substantial part of the trade passes through a single port” (Sargent [2] in Acciaro et al. [3]). As stated in Hilling and Hoyle [4], hinterlands were initially well-defined: each port had its own hinterland, and each region belonged only to the hinterland of one port. Hinterlands then have become shared among several ports (freight having origin or destination in a given region may cross more than one port), which are in competition among each other. In the hinterland it could be distinguished between a “fundamental hinterland” and a “competitive hinterland” (Rodrigue [5]). The fundamental hinterland is the port core market and consists of its captive market, i.e., the areas which mainly, or exclusively, belong to its market: it is usually formed by regions which are the closest to the port. The “competitive hinterland” is the external area of the hinterland which overlaps with the hinterland of other ports. Wilmsmeier et al. [6] report that the hinterland of a port can be defined as the area that can be reached at a cheaper cost or a shorter time than from any other port.
The development of inland ports, dry ports, and inland terminals, which are well connected with the port (by railway or inland waterway corridors) enlarges hinterlands, leading to the formation of a “regional load centre network” and determines the last phase of the development of a port: regionalization (Notteboom and Rodrigue [7]).
Therefore, nowadays a port hinterland may also consist of areas which are not geographically close to the port. Notteboom and Rodrigue [8] introduced the concept of the “creation of corridor-based ‘island formations’ in the distant hinterland of another port”. The “island formation” is an area which is part of the hinterland of port A, but it is served by port B. The “island formation”, generally, is in the competitive hinterland of A, but it could be also, geographically, in the fundamental hinterland of A. The high performance of inland transport and the availability of efficient and well-located inland terminals acquire a strategic role in the development of “island formations” within the hinterland of other ports (Monios and Wilmsmeier [9]).
As reported above, the development of inland ports, dry ports, and inland terminals is the result of port regionalization. We consider an inland port as an intermodal terminal connected to a port through a multimodal corridor, and in particular through an efficient rail link. Sometimes, the term “dry port” (Roso and Lumsden [10]; Roso et al. [11]) is preferred, emphasising the fact that the corridor is made up of a rail link. However, other times, the term “inland port” is preferred, because the intermodality is among inland waterways and roads, inland waterways and rail, as well as rail and roads; therefore, the term dry port is not completely appropriate. Inland waterways are particularly important for northern range multi-port systems: for example, for the Rhine–Scheldt Delta system. Rodrigue and Notteboom [12] report that these inland terminals have been referred to using many terms (in addition to inland ports and dry ports): inland hubs, inland logistics centres, inland freight villages, inland clearance depots, inland container depots, intermodal freight centres and inland freight terminals. In any case, it should be observed that the connection of the port with the hinterland, through a multimodal corridor, is often with a large intermodal terminal which also serves continental freight transport demand (not directly associated with the port activities). The intermodal terminal, linked with the seaport by the multimodal corridor, may be also a part of a freight village in which a lot of other logistics activities are carried out.
There are several reasons behind the development of inland terminals and port regionalization. Firstly, the shortage of spaces in port areas causes several activities related to ports to be placed elsewhere. In inland terminals, collection, distribution, groupage, and degroupage functions are transferred, because of overcrowded port areas or preventing a future overcrowding of these port areas. Secondly, port areas are often placed in heavily urbanised environments; therefore, a reduction in traffic congestion is desirable. Thirdly, the demand between the port and the hinterland is sometimes unbalanced: for example, the demand in import is much greater than the demand in export. In this case, full lorries travel from the port to the continental destination of their trips, and return empty to the port. However, if the freight is carried by train from the port to the rail terminal closest to the destination, after usage, the wagons can be rearranged to form new trains; therefore, there is no need to send an empty train back to the port terminal (Frémont and Franc [13]).
Inland ports could be developed by both port terminal operators and port authorities (Monios and Wilmsmeier [9]): usually, those developed by port terminal operators are the most successful in the integration of the port operations. An example of an inland port (dry port) developed by a terminal operator in Italy is the intermodal centre of Melzo, developed by Contship (Lupi et al. [14]). An inland port developed by a port authority is that of Coslada (close to Madrid) (Monios [15]), which was established by the “Puertos del Estado”, namely, the State-owned Spanish port system.
Two types of development of inland ports can be distinguished: Inside-Out and Outside-In (Wilmsmeier et al. [6]). Inside-Out describes a scenario where the establishment of the inland facility was driven by “continental” operators: for example, an inland carriage company (railroad company, barge company). Instead, Outside-In describes a scenario where the establishment of the inland facility was driven by port or maritime operators, for example: port authorities, port terminal operators or ocean carriers. An example of Inside-Out inland port is the Rickenbacker inland port, USA, located along the Heartland Corridor developed by Norfolk Southern Railway (Rodrigue [5]). Examples of Outside-In inland ports are the terminals established at Venlo, Willebroek and Duisburg by the Rotterdam port terminal operator ECT (Wilmsmeier et al. [6]).
Among the various functions performed by inland ports, satellite terminals could be identified (Rodrigue and Notteboom [12]). Satellite terminals sometimes are located close to a port facility, but more often are placed at the periphery of the metropolitan area where the port is located. Satellite terminals mainly assume a service function to the seaport facilities: they serve functions that either have become too expensive at the port, such as warehousing and empty container depots. However, very often, satellite terminals are also transhipment points from rail/barge to trucks and vice versa: for gateway ports whose import traffic is remarkable, at satellite terminals the freight contained in maritime containers is transloaded into domestic containers or truckloads.
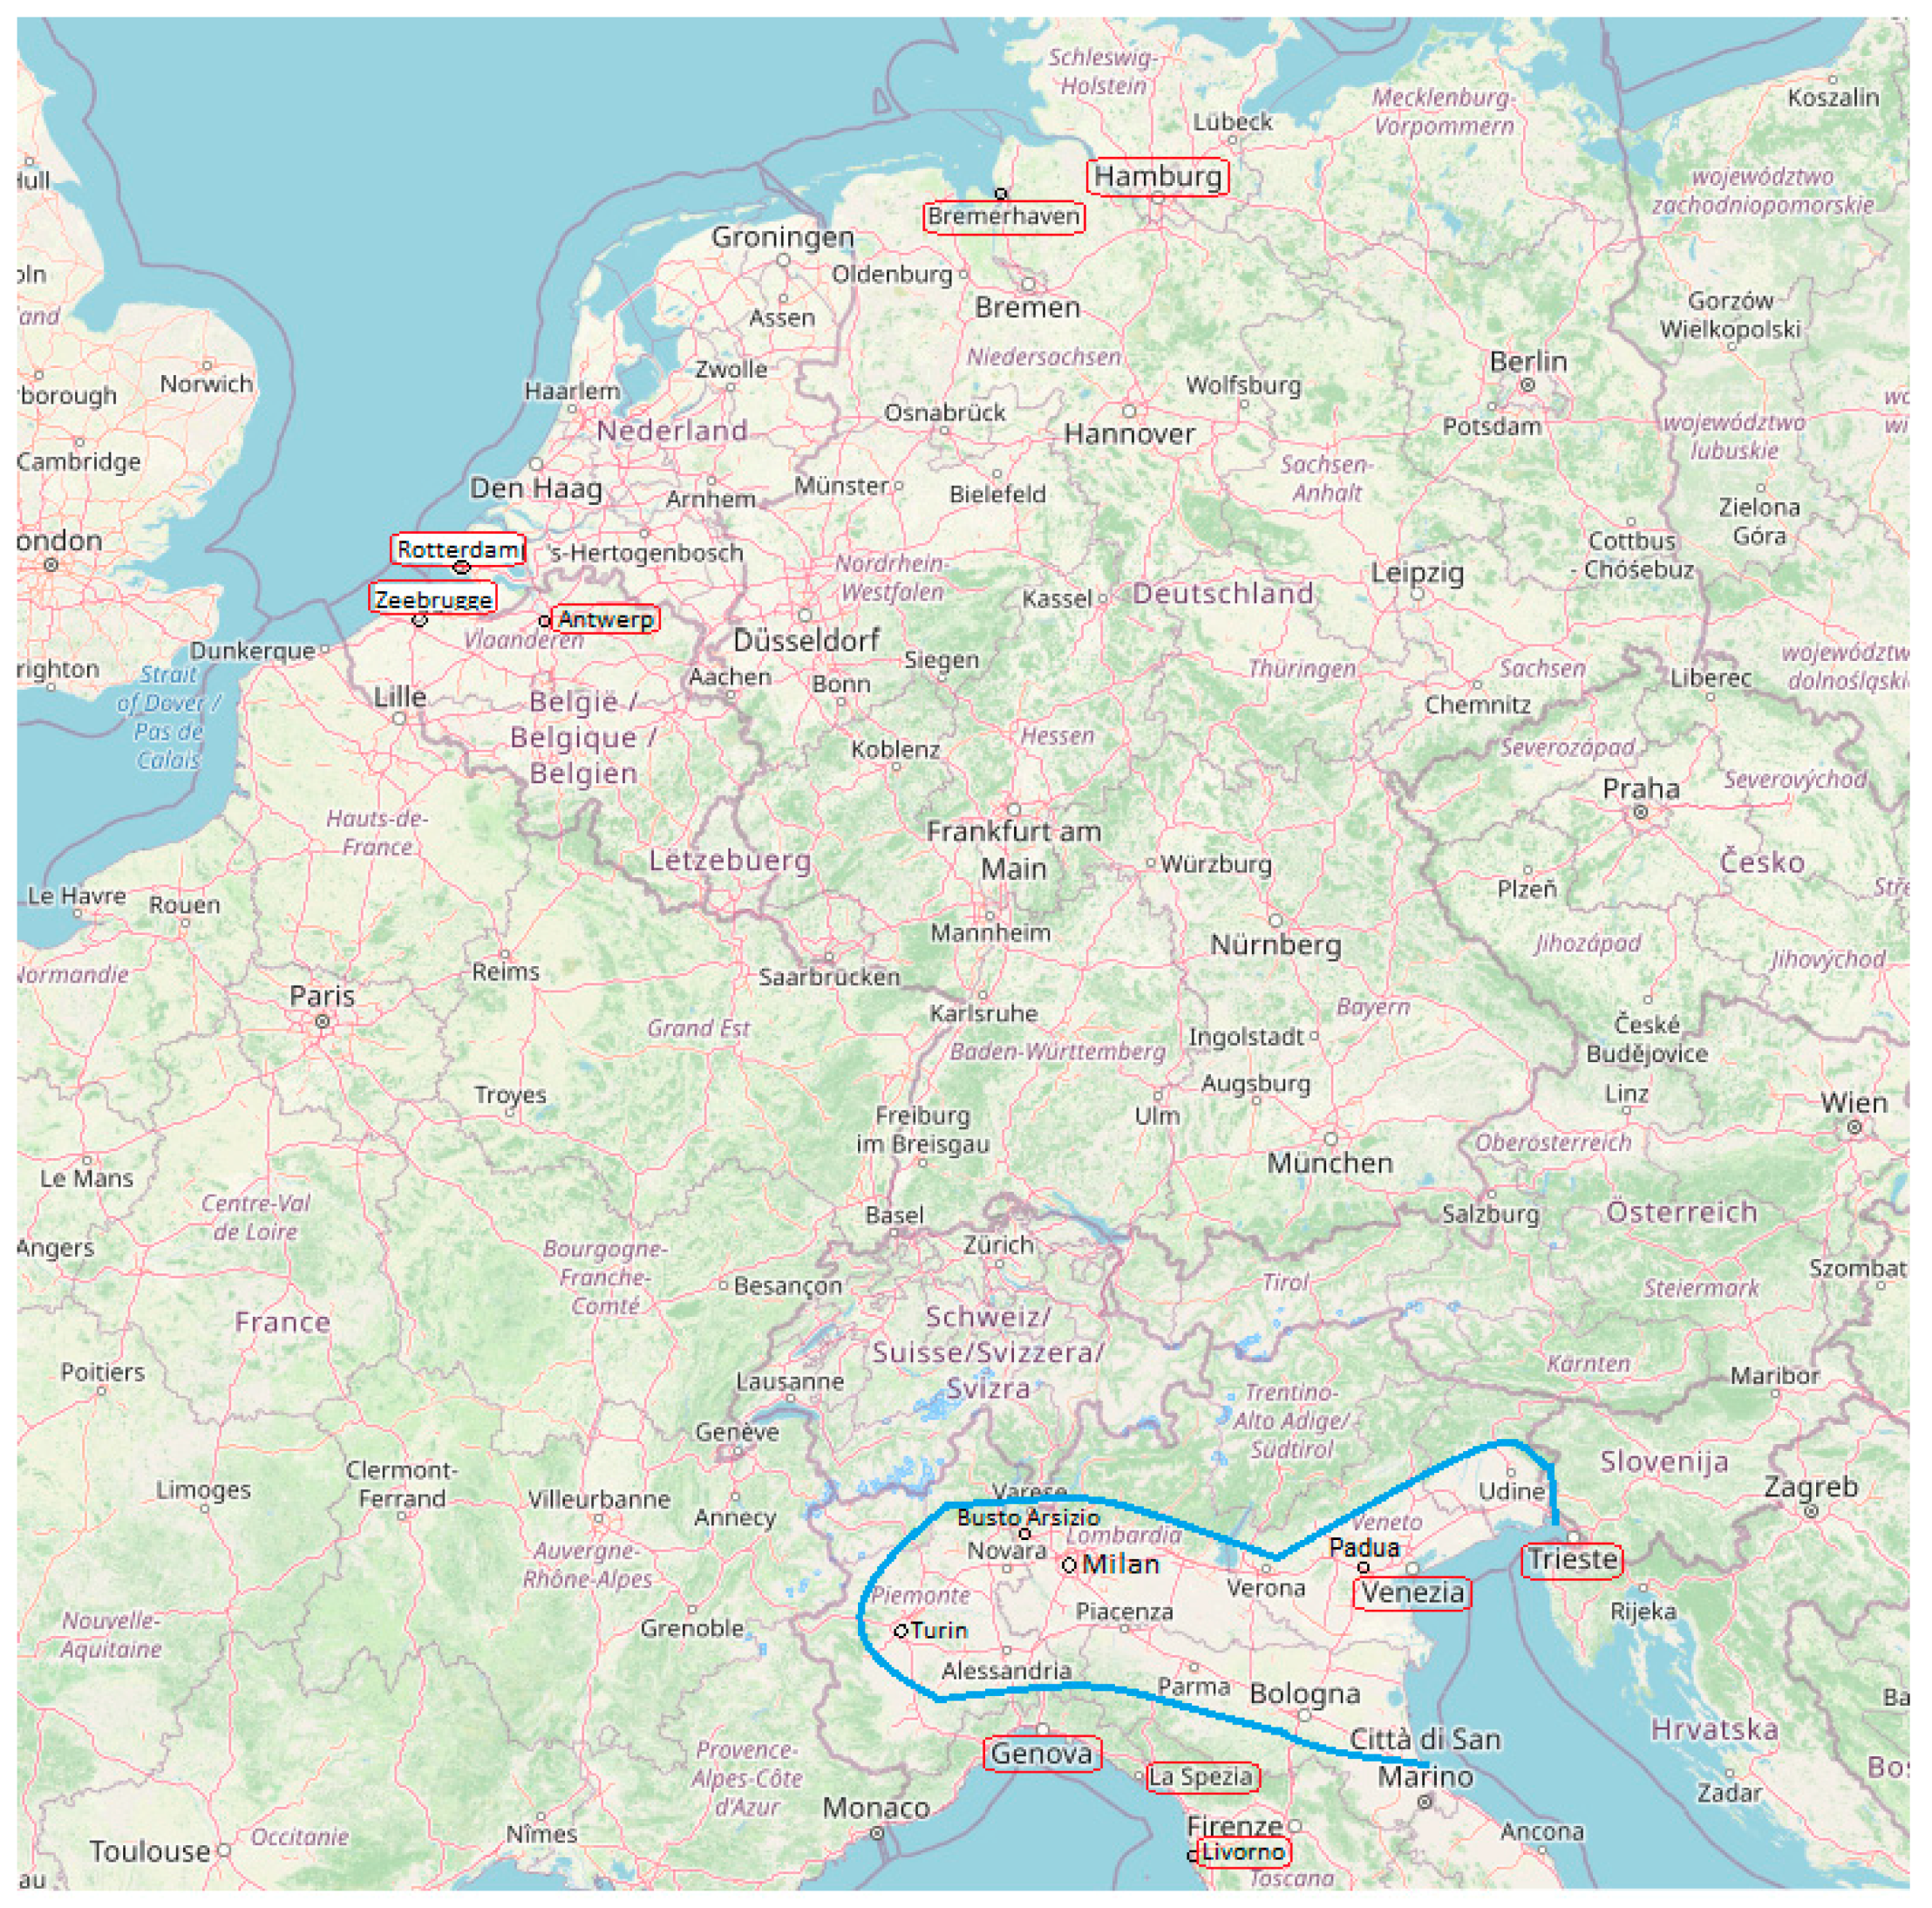
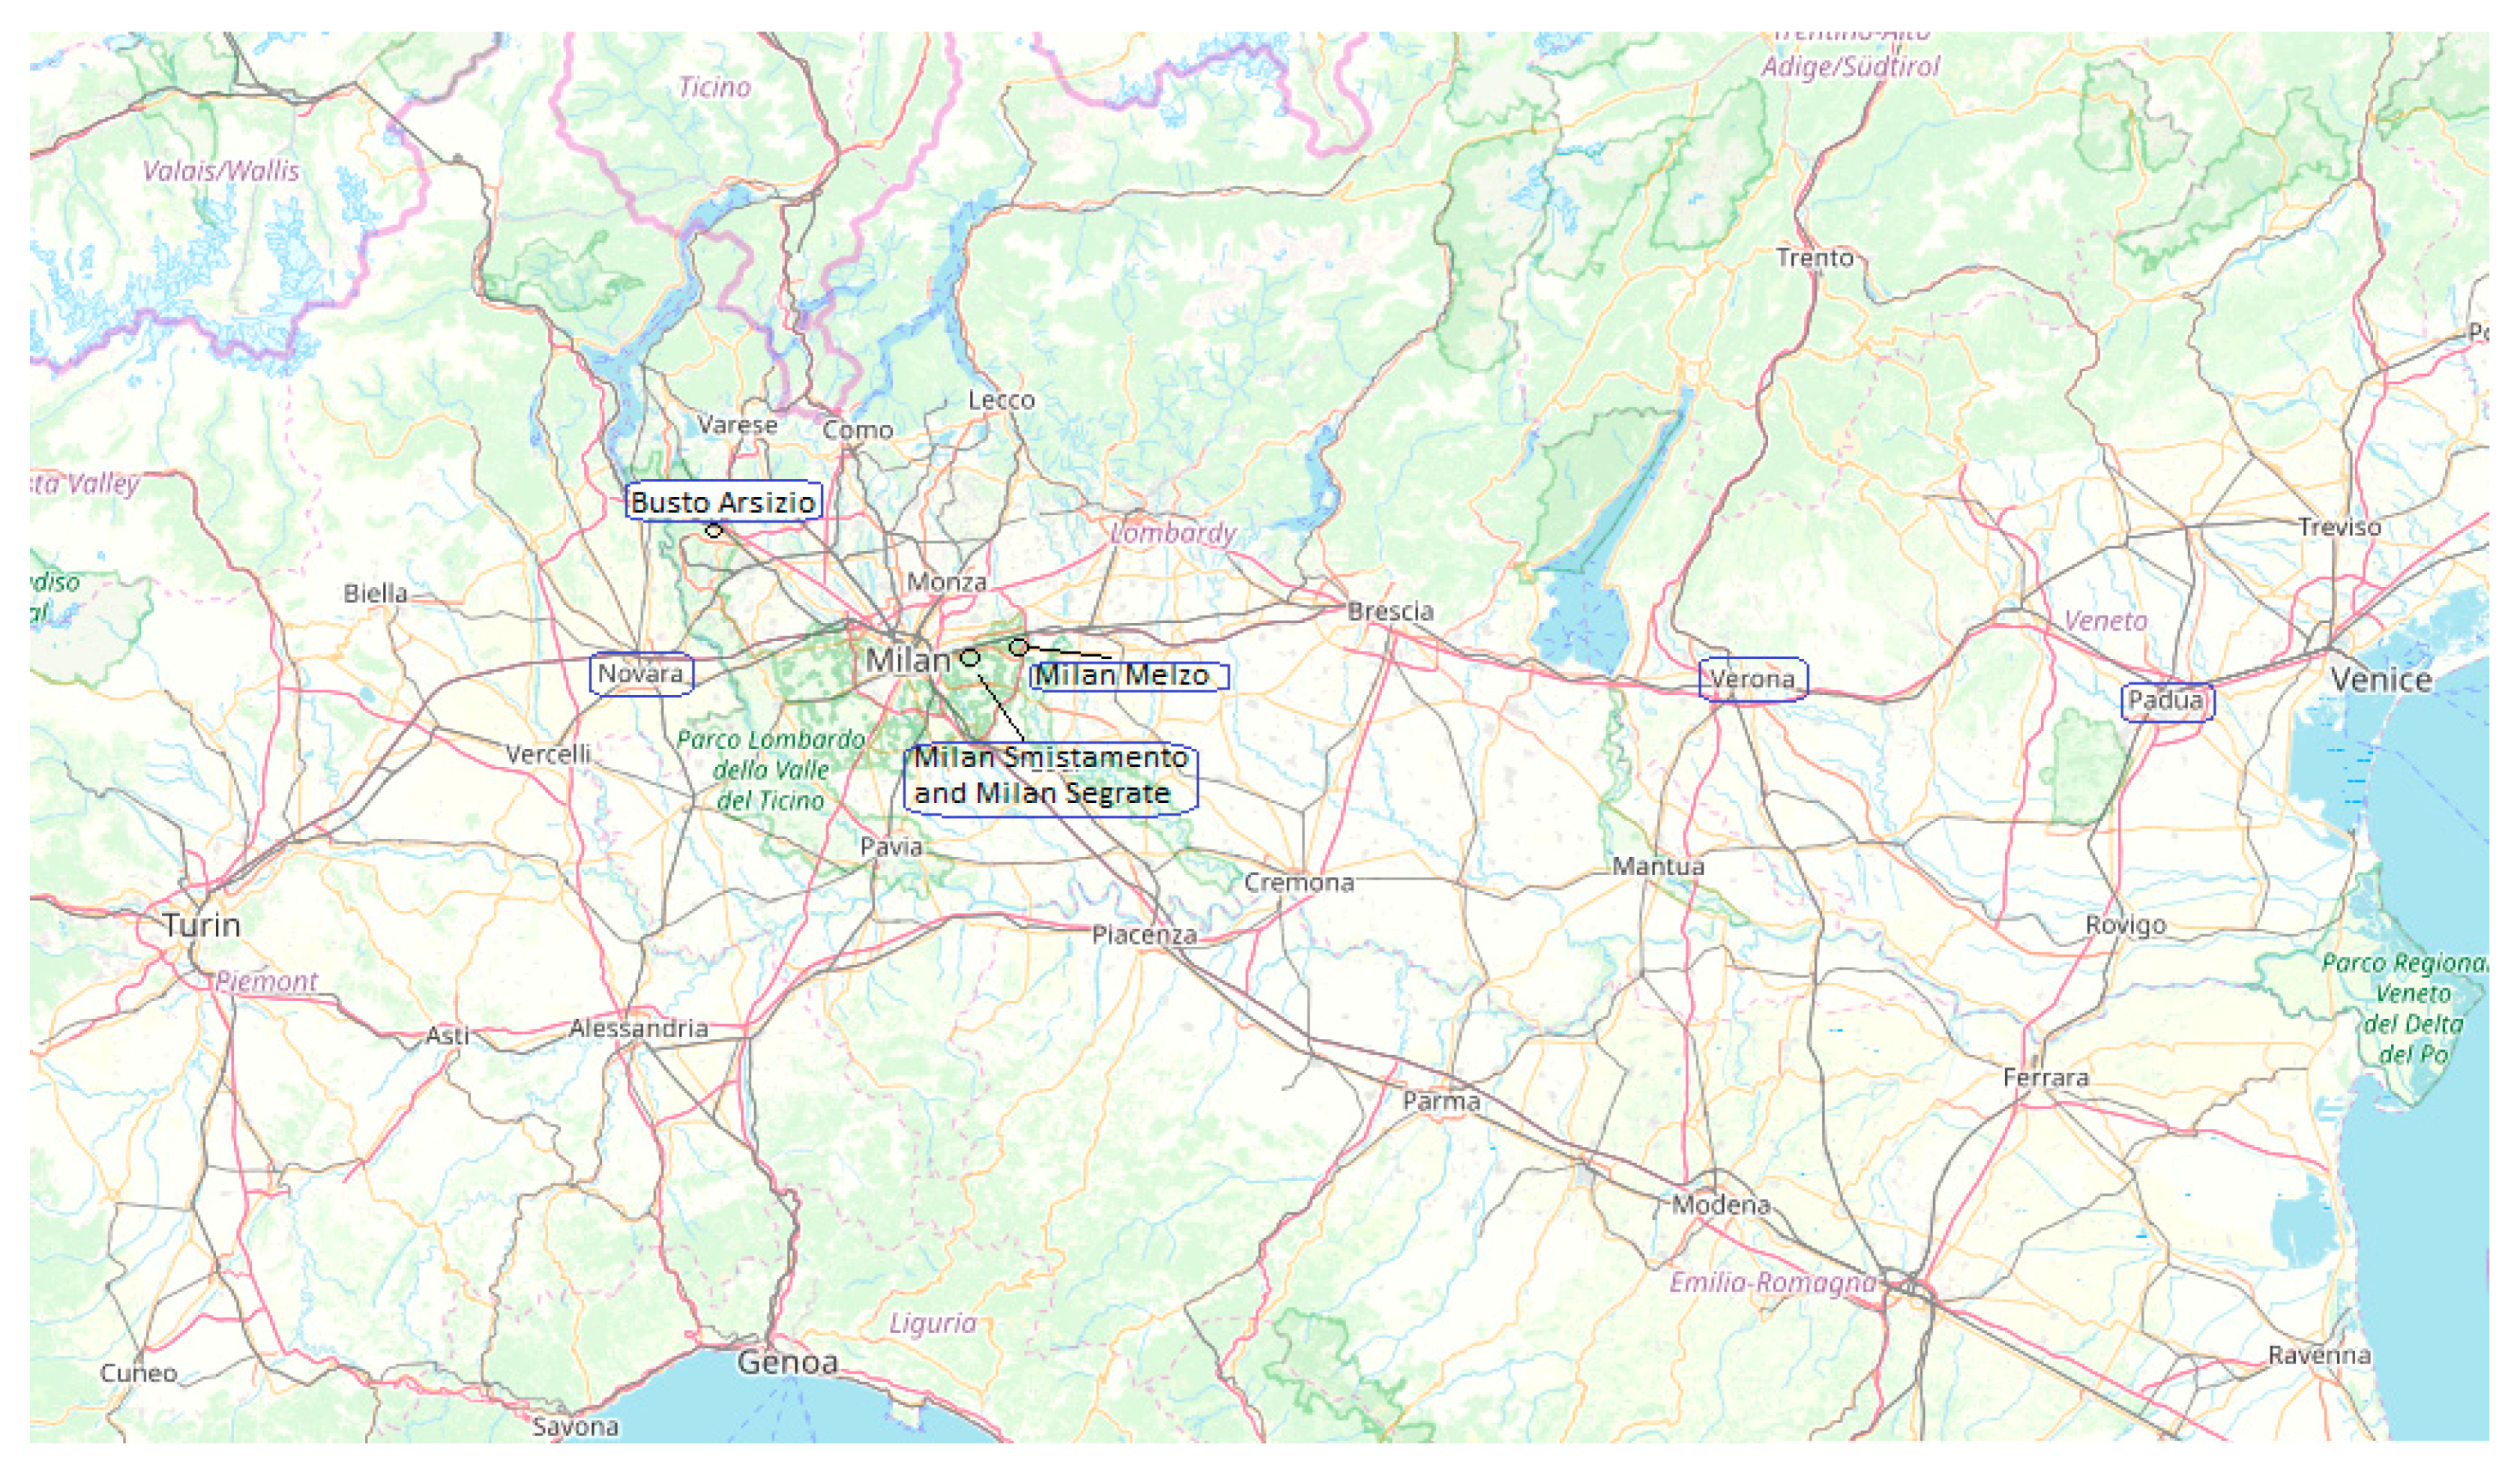
In this paper, in order to understand the general phenomenon of island formations, particularly in Europe, an example of “island formation” has been considered: the Padan Plain in Italy. In Figure 1, a map displays: the Padan Plain (circled in blue), the most important northern Italian ports (circled in red), and the most important northern European ports (circled again in red). An enlargement of Figure 1, which shows the Padan Plain in detail, is displayed in Figure 2.
The Padan Plain is within the fundamental hinterland of northern Italian ports, in particular, within the fundamental hinterland of the Ligurian multi-port gateway system, but it is also served by northern European ports: therefore it is, at least partially, an “island formation” of the hinterlands of these ports (Van Klink and Van Den Berg [16], Figure 3, which shows that this is not a recent phenomenon; Ferrari et al. [17], p. 384). Northern European ports are definitely farther from the Padan Plain with respect to Italian ports. The Padan Plain is the most productive area of Italy and it has become, although only partially, an “island formation” of northern European ports because high-performance rail connections (to/from northern European port cities) and a set of well-located inland terminals (in the Padan Plain) have been established. The most important among these inland terminals are Busto Arsizio-Gallarate, Novara, Milano Smistamento, Milano Segrate Milano-Melzo, and Padua (see Figure 1 and Figure 2); they play the role of inland terminals not only for Italian ports, but also for northern European ones.
The competitiveness of northern European ports will become even stronger in the future after the construction of the new railway lines and base tunnels across the Alps, which will considerably reduce the travel times and monetary costs of rail transport (Lupi et al. [18]). Additionally, dwell times influence port competitiveness (as shown in Gonzalez et al. [19], and Lupi et al. [20]), and they too are favourable to northern European ports.
Some previous attempts have been made to estimate the market of northern European ports in the Padan Plain: in brief, the amount of TEUs having origin and destination in Italy but crossing northern European ports. There is a large disagreement about these estimates, and on the other hand, no clear methodology of these estimates has been provided. All these estimates are reported in Section 2.1.
One of the two main purpose of this paper is to quantify the amount of deep-sea maritime containers, having origin or destination in Italy, but crossing northern European ports. In order to do this, an analysis of scheduled rail connections between northern European ports and Italian rail terminals has been carried out.
The other main objective is to analyse transport costs and travel times in order to determine the advantage of unloading containers, having origin in the Far East or North America and destination in the Padan Plain, in northern range ports instead of Italian ports.
The present paper is organised as follows.
At first, a literature review is performed, of previous estimates of the market of northern European ports in the Padan Plain, and of the main characteristics of combined transport, based on rail, in Europe.
Afterwards, a new estimate, of the number of containers crossing northern European ports but having origin or destination in Italy, is carried out. This estimate is based on the analysis of direct and indirect scheduled rail connections between Italian rail terminals and northern European ports. With this target, all the data about rail links operated by the most important Multimodal Transport Operators (MTOs) have been collected. Additionally, road transport of containers has been considered, but afterwards was neglected for the reasons which will be exposed in Section 3.1.3. The methodology of this study is presented in Section 3.1.; the results are shown in Section 4.1.
Subsequently, a quantitative study was performed, about monetary costs and travel times necessary to transport a 20 foot and a 40 foot container from the Far East and from North America to the Padan Plain, in particular, to the Milan area (the Milan metropolitan area is the most important in Italy as far as economic activity is concerned). The choice of the Far East and North America as origins has been made because they are, currently, the most important economies in the world (along with the EU economy). Monetary costs and travel times, between unloading at a northern European and an Italian port, have been compared. Materials and methods of this study are presented in Section 3.2.; the results are shown in Section 4.2.
The discussion follows, and then the conclusions.

2. Literature Review

2.1. Previous Estimates of the Number of Containers Having Origin or Destination in Italy and Crossing Northern European Ports

In several studies, the numbers of containers having origin or destination in Italy, but crossing northern European ports, have been estimated. The most important of these studies are summarised herewith.
The Italian General Board for Road Transport and Logistics ([21], pp. 53–60), has provided an estimate of the maritime container traffic which has origin/destination in Italy but crosses ports of the northern range: this estimate resulted equal to 441,888 TEUs in 2011. The same datum value is also reported in Cassa Depositi e Prestiti ([22], p. 29).
However, other studies report very different values. In the Italian National Plan of Logistics 2012/2020 (Ministero delle Infrastrutture e dei Trasporti [23], p. 61), it is stated that “hundreds of thousands of containers, having destination in Italy and surrounding regions” are unloaded in northern European ports. The previous version of the Italian National Plan of Logistics of 2011/2020 (Ministero delle Infrastrutture e dei Trasporti [24], p. 38) reports that “2 millions of containers, having destination in Italy and surrounding regions” are unloaded in northern European ports.
An Italian magazine dedicated to maritime transport, especially read by people working in the field, Informare ([25], p. 7), reports other estimates, in particular, the one performed by the Centro Studi Fedespedi, which evaluates the Italian traffic crossing northern range ports as around 800,000–1 million TEUs per year. The Fedespedi report of March 2015 ([26], p. 4), states: “It is well known that a relevant number of containers, equal to around 900,000 TEUs, which have origin or destination in the Italian area, cross northern European ports”.
The 2015 Italian national strategic plan of port sector and logistics (Ministero delle Infrastrutture e dei Trasporti [27], p. 162) instead reports a quota of over 1.5 million TEUs/year which have origin or destination in Italy and cross northern European ports. The plan points out also that this quantity comprises a non-negligible quota of internal European traffics, for example, between Italy and Great Britain or Ireland or between Italy and Scandinavia: in this case, it is convenient to carry cargo from Italy to northern European ports by train, then to board the cargo on a ship towards the final destination in the British Isles or Scandinavia.
A synthesis of the values provided by the above-mentioned sources is reported in Table 1.
None of these sources described how these estimates had been obtained. Only the Italian General Board for Road Transport and Logistics (in [21], pp. 53–60) reported how the datum of 441,888 TEUs was obtained. This analysis was carried out with the support of D’Appolonia (an engineering company based in Pittsburgh, PA, USA, and with several offices in Italy). The work of D’Appolonia is based on the evaluation of the number of maritime containers crossing the Alpine passes, along the main rail corridors used by maritime shippers to transport containers between northern European ports and Italy. The percentage of maritime containers, on the total of freight transported, has been determined after interviews with the shippers. As shown in tab. 2.30, page 60, of [21], only some MTOs have been taken into account: Hupac, Mercitalia Intermodal, Kombiverkehr, Lineas Intermodal, Novatrans and Shuttlewise. Instead, Contship, which is an important MTO operating in the transport of maritime containers between northern Europe and Italy, has been completely neglected. Furthermore, Kombiverkehr performs several indirect connections, i.e., with the transhipment of load units at intermediate terminals, and these connections have also been neglected.
In any case, the study of Ministero delle Infrastrutture e dei Trasporti, Consulta Generale per l’Autotrasporto e la Logistica [21] could be considered as a departure point for the work implemented in this paper.
Lombardy, which has the capital Milan, is the main Italian region from the point of view of both the population (about 10 million inhabitants) and the economy: Lombardy occupies a large part of the Padan Plain. Curi and Dallari ([28], p. 19) assert that the port of Genoa is the main access gate of containerised traffic coming from Far East countries and directed to Lombardy; northern range ports are the main access gate of containerised traffic coming from North America and directed to Lombardy, but an estimate of this flow has not been given. Cassa Depositi e Prestiti ([22], p. 61) instead affirms that several containers having origin or destination in the Far East cross northern European ports. On the other hand, Notteboom [29] asserts: “In theory, mainland Mediterranean ports offer transit time advantages over the northern European ports for accommodating cargo flows between Asia/Middle East and large parts of Southern and Central Europe (time savings for vessels of up to 5 days)”. As a result, according to Notteboom (but “in theory”), Mediterranean ports could be crossed by containers having origin in Asia/Middle East and destination: not only in southern Europe, but also in central Europe.
Before the description of the research about rail connections, some important characteristics and definitions of rail transport in Italy and Europe will be introduced, because several of them are referred to in the rest of the paper.

2.2. Rail Transport and Intermodality in Italy and Europe

Combined transport has been defined by ECE [30] (in Frémont and Franc [13], p. 548), as “an intermodal transport where a major part of the journey is by rail, inland waterways or sea and any initial and/or final legs (of the trip) carried out by road are as short as possible”. It is important to keep the road parts of combined transport as short as possible, because, as pointed out by Nelldal [31], the feeder road parts of combined transport, could have very high costs because, in general, they have a higher cost per km than that of all-road mode.
The Intermodal Transport Units (ITUs) transported in combined transport are mainly: containers (20 and 40 feet long), swap bodies (25, 30 and 45 feet long), and semitrailers (around 45 feet long).
In Europe, combined transport, based on rail, consists mainly of (Grossato [32]; Cosmos, intermodal production systems [33]): direct trains, shuttle trains, liner trains, Y-shuttle trains and group trains. They are illustrated in detail in Table 2.
The system of shuttle connections currently constitutes a network of point-to-point direct links, with planned timetables, which connect two terminals in both directions. A necessary completion of the shuttle system is the hub and spoke system in which load units are vertically handled, at rail terminals, from the previous train to the following one. In the hub and spoke system, shuttle trains are involved.
The hub and spoke system has been designed and developed, in the rail freight transport sector, by the three main European Multimodal Transport Operators (MTOs): Hupac, Mercitalia Intermodal and Kombiverkehr; but especially, Kombiverkehr makes use of this system. While Hupac and Mercitalia Intermodal mainly perform direct connections, Kombiverkehr mainly performs indirect connections and uses some most important freight villages as “hubs”, among them: Duisburg Ruhrort Hafen, München Riem, Ludwigshafen, and Koln Eifeltor in Germany, and Wels in Austria.
The main Multimodal Transport Operators (MTOs) operating to/from Italy are: Hupac, Mercitalia Intermodal, Kombiverkehr (which is also the most important MTO in Europe) and Lineas Intermodal. All these MTOs deal mainly with continental traffic, but also transport maritime containers. Hupac, Mercitalia Intermodal, Kombiverkehr and Lineas Intermodal will be referred to hereafter as “traditional” MTOs, because they have been fully operational for a longer time: Hupac was founded in 1967, Kombiverkehr in 1969, and Mercitalia Intermodal has been in operation under the previous name “Cemat” since 1976. Furthermore, they mainly transport continental containers on their trains.
Moreover, there are other important MTOs mainly transporting maritime containers, i.e., containers that have been previously unloaded from ships or which are going to be loaded onto them. Among these MTOs, the most important operating to/from Italy are Contship and partner companies, i.e., Samskip and Shuttlewise, and Alpe Adria. Contship and the connected companies Samskip and Shuttlewise, Alpe Adria, Move Intermodal and GTS Trasporti, will be referred to hereafter as “non-traditional” MTOs, because they have been operating for a shorter amount of time. Indeed, Contship, although it was founded in 1969 as a maritime terminal operator, has been managing container rail transport since 1987. Furthermore, they mainly transport maritime containers on their trains.
More details on the main characteristics of rail freight transport in Italy (domestic and international) are provided in Lupi et al. [14].

3. Materials and Methods

3.1. Calculation of Maritime Containers Crossing Northern European Ports

3.1.1. Calculation of Maritime Containers Transported by the So-Called “Traditional” MTOs

In order to quantify the number of TEUs which cross northern European ports, having an origin or destination in Italy, an analysis of scheduled rail connections between Italian rail terminals and northern European ports has been carried out. In particular, at first, shuttle, liner and Y-shuttle trains, offered by “traditional” MTOs operating in Italy, Hupac, Mercitalia Intermodal, Kombiverkehr, Lineas Intermodal and DB Schenker, have been taken into account. Lineas Intermodal existed under the name of IFB until April 2017, while Mercitalia Intermodal (which belongs to the group Mercitalia Logistics) existed under the name of Cemat until January 2017. Kombiverkehr mainly operates connections using the hub-and-spoke system; therefore, indirect connections, i.e., connections which perform the transhipment of load units at intermediate rail terminals, have also been considered.
Hupac, Mercitalia Intermodal and Kombiverkehr offer several connections in code sharing: for example, the same train could be operated together by Hupac and Kombiverkehr. In order to avoid counting the same connection several times, the train numbers have also been collected.
Afterwards, the average number of TEUs transported by each train has been quantified. Hupac, Mercitalia Intermodal, Kombiverkehr and Lineas Intermodal were interviewed, and they were asked:
(1)
The number of wagons forming each train;
(2)
The number of Intermodal Transport Units (ITUs) transported on each train. The ITUs could be: 40 foot containers, 20 foot containers, long swap bodies, short swap bodies, and semitrailers;
(3)
The number of so-called “deep-sea maritime” containers (i.e., containers which have been unloaded from deep-sea containerships or which are going to be loaded onto them);
(4)
The average composition of each train, distinguishing: 40 foot containers, 20 foot containers, long swap bodies, short swap bodies, and semitrailers.
One of the interviewed MTOs provided detailed information about the average composition of each train (that is, they answered all the questions (1), (2), (3) and (4)). The other MTOs provided only answers for questions (1), (2) and (3). In order to convert ITUs into TEUs, the conversion factor proposed in the UIR report (Unione Interporti Riuniti [34], p. 6) has been used, i.e., 1 ITU = 1.79 TEUs.
The answers to the questions of the interviewed MTOs are reported in Table 3.
The percentage of maritime containers reported in Table 3 is an average: some trains transport a higher quota of maritime containers, while other trains do not transport maritime containers at all. Such a low percentage of maritime containers was unexpected; therefore, several offices of freight villages and rail terminals have been interviewed, in order to more deeply understand this phenomenon. Actually, from the responses of MTOs and terminal managers, some ITUs transported to/from rail terminals close to ports of Antwerp and Zeebrugge do indeed have origins or destination in Great Britain and Ireland, while some ITUs transported to/from rail terminals close to Hamburg actually have origins or destinations in Scandinavia. The highest quota of ITUs refers to swap bodies and semitrailers directed to (or coming from) continental rail terminals: they are not maritime containers.
Looking carefully at the connected terminals, it is clear that connections offered by “traditional” MTOs usually do not have origin or destination at rail terminals located in the quays (e.g., Rotterdam Euromax), but at continental terminals, in particular, at those mentioned as “satellite terminals” in Rodrigue and Notteboom [12]: for example, Hamburg Billwerder, Antwerp Mainhub, Rotterdam RSC, which are in the metropolitan area devoted to logistic activities, but not in the port area near the quays.
From the interviews, it also emerged that deep-sea maritime containers are usually transported by so-called (in this paper) “non-traditional” MTOs, which operate not only in the rail sector but also in the maritime terminal container sector: in particular, Contship and its partners. Practically, some major maritime container terminal operators also manage the initial (export) and final part (import) of container movement which takes place by rail: they try to cover all the inland part of the supply chain: link (railway) + node (maritime terminal). However, Alpe Adria, which is not a maritime container terminal operator, but which has been classified as a “non-traditional” MTO, mainly transports maritime containers.

3.1.1.1. Analysis of Indirect Connections

While Hupac and Mercitalia Intermodal almost always offer direct connections, Kombiverkehr mainly offers indirect connections, using the hub-and-spoke system: in this last case, it is difficult to understand the origin (in connections to Italy) or the final destination (in connections from Italy) of the ITUs, and, generally, it is difficult to quantify the number of maritime containers on each train.
For example, Kombiverkehr offers connections to Milano Smistamento from: Antwerp Combinant, Rotterdam, Hamburg, and Lübeck, but also Leipzig, which are all indirect. All these connections perform transhipment at München Riem and share the same train in the last part of the journey, from München Riem to Milano Smistamento; therefore, the same train is shared not only by traffic originating in port terminals (Rotterdam, Antwerp, Hamburg and Lübeck), but also by traffic originating in continental terminals (Leipzig).
Consequently, Kombiverkehr was interviewed about the percentage of maritime containers to consider this case. Kombiverkehr suggested to consider the same percentage of maritime containers used in case of direct connections, and to apply this percentage to the train which operates from the last transhipment terminal to the Italian (destination) terminal: in this case, the train from München to Milano Smistamento. Therefore, for all these connections, the percentage of maritime containers has been calculated for the train from München Riem to Milano Smistamento.
Indirect connections are offered not only by Kombiverkehr but also by Lineas Intermodal. In particular, while connections from Italy to Zeebrugge are usually direct ones, connections from Italy to the other port cities are usually indirect, and use Antwerp Mainhub as transhipment terminal.

3.1.1.2. Duisburg and Other Ports Located on the Rivers

Special care has been devoted to ports located along the rivers, because some maritime containers may be transhipped from ships to barges at northern range ports, e.g., Rotterdam or Antwerp, and finally transhipped from barges to trains at ports located along the rivers, e.g., Duisburg.
This analysis has been performed after examining the port statistics. Actually, the transport of maritime containers by inland waterways is very low in the port of Hamburg, while in the ports of Rotterdam and Antwerp, it is relevant.
The port of Hamburg, in 2019 (source: Hamburg port authority [35]), recorded a total container throughput of 9.3 million TEUs: of which, 3.5 million were of transhipments (37.2%), and 5.8 million TEUs (62.8%) had a continental origin or destination. Among these 5.8 million TEUs, 51.3% were transported by road, 46.3% by rail, and only 2.4% by inland waterways.
The ports of Antwerp and Rotterdam recorded a different situation. The port of Antwerp (source: Antwerp port authority [36], p. 26) in 2019 registered the following modal split of containers crossing the port with continental origin or destination: 58% road, 8% rail, and 34% inland waterways. The port of Rotterdam recorded, in 2018, a similar modal split (source: Rotterdam port authority [37]) of containers crossing the port, with continental origin/destination: 55% road, 14% rail, and 31% inland waterways.
Synthesis of these data is reported in Table 4.
In the European Parliament, Directorate-general for internal policies [38] (Table 6, p. 34), it is stated that the most important European countries, regarding inland waterway navigation, are, in descending order: Germany, The Netherlands, Romania, Belgium. Neglecting Romania, for the other three countries the most important inland waterway is the Rhine. The most important ports on the Rhine are ([38], p. 48, Table 8) Duisburg, with around 50 million tons of traffic in 2013, and Cologne, with 11.5 million tons. Other important ports are Mannheim, with 8.7 million tons of traffic in 2013, Strasbourg, with 8.0 million tons, and Ludwigshafen, with 7.6 million tons. The container traffic of Duisburg slightly increased to over 52 million tons, or 4.0 million TEUs, in 2019 (Source: duisport.de [39]).
Consequently, the possibility that a quota of maritime containers is transhipped, from deep-sea ships to barges, at the ports of Antwerp and Rotterdam, and finally transhipped, from barges to trains, at the most important fluvial ports of the Rhine has been considered. In particular, given its relevant traffic, Duisburg has also been considered among northern European ports, only with regard to the problem of estimating the number of containers having origin or destination in Italy and crossing northern European ports.
Among the four “traditional” MTOs, only Hupac and Kombiverkehr have rail connections between Duisburg and Italian terminals. However, they have been interviewed and they answered that they do not transport maritime containers from Antwerp and Rotterdam to Duisburg by inland waterways, then from Duisburg to Italy by train: they perform all the transport, from Antwerp and Rotterdam to Italy, by train. Actually, Hupac and Kombiverkehr reported that for them it is more convenient, from the point of view of monetary costs, to cover all the route, from northern range ports to Italy, by train.

3.1.2. Calculation of Maritime Containers Transported by “Non-Traditional” MTOs

The number of TEUs transported by “traditional” MTOs is only a part of the total number of TEUs having origin or destination in Italy and crossing northern European ports. From the interviews with “traditional” MTOs, actually, it turned out that the majority of maritime containers are transported by Contship and other MTOs operating in the field of maritime transport.
Connections operated by “non-traditional” MTOs were collected in December 2019 and January 2020, and they refer, as for “traditional” MTOs, to shuttle, Y-shuttle and liner trains. The following MTOs have been analysed: Contship, Samskip, Shuttlewise, GTS Logistics (previously named GTS Transporti), Move Intermodal.
Additionally, Alpe Adria has been examined, but this MTO does not offer connections between northern European ports and Italian continental terminals. Instead, Alpe Adria offers several connections between the port of Trieste and several continental terminals located in central Europe. Alpe Adria has been neglected because in its connections the boarding/unboarding port is the Italian port of Trieste, and not a northern European one.
Finally, Ambrogio Intermodal has also been taken into account, but this MTO only offers connections between continental terminals and does not transport “maritime” containers.
Indeed it resulted, directly from the interviews, that trains operated by Contship and partners (Samskip and Shuttlewise), almost exclusively transport deep-sea maritime containers in connections to/from northern range ports (for example, those to/from Rotterdam); instead, they transport deep-sea maritime containers for one-third of the total number of ITUs in connections to/from Duisburg (in this case, deep-sea maritime containers are transported between Rotterdam or Antwerp and Duisburg by inland waterways).
In the previous section (Section 3.1.1.2), it was reported that Hupac and Kombiverkehr do not transport maritime containers from Antwerp and Rotterdam to Duisburg by inland waterways, then from Duisburg to Italy by train. Contship instead operates this intermodal chain. The ports of Antwerp, Rotterdam and Duisburg do not accommodate container terminals managed by the Contship–Eurokai group, but Contship could probably benefit from lower terminal fees.

3.1.3. TEUs Transported by Road

While the amount of TEUs transported between Italy and northern European ports by train can be quantified basing on train schedules, the amount of TEUs transported by road could not be quantified, because, obviously, road transport is not scheduled.
In order to try to quantify the amount of TEUs transported by road, the following have been interviewed:
  • The port authorities of Hamburg and Antwerp and the managing offices of Rotterdam Euromax terminal;
  • The most important MTOs analysed before: Hupac, Mercitalia Intermodal, Kombiverkehr and Contship;
  • The Verona and Padua freight villages, which register road traffic as much higher than rail traffic.
The interviewees related that, while connections between northern European ports and continental terminals located in northern Europe mainly take place by road, connections between northern European ports and Italian inland terminals take place almost exclusively by train. Indeed, the biggest freight forwarders and MTOs do not find it convenient to use the roads, because of the high costs of road transport, the large distances between northern European ports and the Italian inland terminals, and because of the traffic limitations in Switzerland and Austria (the HVC (Heavy Vehicles Charge) and the “sectorial ban”, respectively).
The HVC is a tax imposed by Switzerland to heavy vehicles and it is calculated basing on the total weight of the heavy road vehicle, the level of emissions generated by the vehicle, and the kilometres travelled. The amount of the tax is high to discourage freight transport by heavy road vehicles across Switzerland.
The “sectorial ban” in Austria is applied to commercial vehicles, heavier than 7.5 tons, which transport non-perishable typologies of freight (i.e., garbage, stones and terrain, wood products, vehicles, iron ores and non-iron minerals, iron and steel, marble, ceramic) on the Brenner motorway in Austria. These vehicles cannot circulate between Kufstein (east of Innsbruck, close to the German border) and Zirl (west of Innsbruck); therefore, heavy vehicles, travelling from Brennero (i.e., from Italy), when they reach Innsbruck are “blocked” by the sectorial ban and are “forced” to take the rolling motorway Brennero–Wörgl. The “sectorial ban” decreases the competitiveness of freight transport by heavy vehicles across the Alps in Austria, because road alternatives to the Brenner motorway (for example, the Tauern route) are too long to be convenient.
Another aspect in favour of rail mode between northern European ports and Italian inland terminals is the long distances: they are much higher than the break-even distances, proposed in the literature, for intermodal transport based on rail. In the comparison between “all-road” transport and intermodal transport, the break-even distance is defined as the distance of “all-road” transport, over which the cost of “all-road” is greater than the cost of intermodal transport. In Lupi et al. [40] and in Dalla Chiara and Pellicelli [41], it is reported that, according to several studies, the break-even distance for intermodal transport based on rail in Europe is generally between 350 and 600 km. Hawthorne et al. [42] assert that the break-even distance has different values according to the typology of freight; however, after 800 km, intermodal transport based on rail is more convenient than “all-road” transport. The values of the break-even distance depend on several factors; in Kim and Van Wee [43], some of them are mentioned: pre-haulage distance (i.e., from the origin of the shipment to the loading terminal), post-haulage distance (i.e., from the unloading terminal to the final destination), distance travelled by rail mode, distance travelled by “all-road” mode, and costs related to all these distances.
However, there is, for sure, a quota of freight transport between Italy and northern European ports that is performed by minor trucking companies, which cannot be exactly quantified, but it is, in any case, negligible with respect to the number of TEUs transported by train.

3.2. Costs and Travel Times for Transporting a Container from the Far East and from North America to the Padan Plain

The second study presented in this paper consists of the calculation of monetary costs and travel times required to transport a 20 foot or 40 foot maritime container from the Far East and from North America to northern Italy. Two alternatives have been considered:
  • Crossing an Italian port, in particular a Ligurian port, because deep-sea container routes in Italy usually call at Ligurian ports (Lupi et al. [44], Lupi et al. [45]);
  • Crossing a northern range port.
The Mediterranean ports are in a great advantage, from a geographic point of view, regarding container routes to/from the Far East, while they are in a slight disadvantage with respect to northern European ports, again from the geographic point of view, regarding container routes to/from North America.
In the examples considered, Shanghai and New York have been taken as departure ports and Milan area as the destination (some of the most important intermodal railway terminals in the Milan area are Busto Arsizio-Gallarate, Milano Melzo, and Milano Smistamento).
The chosen unloading ports in northern Europe were Rotterdam and Antwerp.
The chosen unloading port in Italy was La Spezia (within the Ligurian multi-port system), because in 2011 it was the country’s second port, after Trieste, regarding rail modal shares of containers, and it is the port with the highest number of rail connections with the Padan Plain (Lupi et al. [14]). Finally, it is crossed by deep-sea routes. However, the three Ligurian ports of La Spezia, Genova, and Livorno, have very similar monetary costs and travel times, regarding the maritime part of the journey, for both origins: the Far East and North America.
In the same way, Rotterdam, Antwerp, and Hamburg have similar monetary costs and travel times, regarding the maritime part of the journey (the same number of days for Rotterdam and Antwerp, one day more for Hamburg) and this occurs for both origins: the Far East and North America.
In order to quantify, for example, the differences of monetary costs and travel times to reach Italy, calling at an Italian port and calling at a northern European one, the following itineraries have been considered (Figure 3 and Figure 4):
  • Shanghai–La Spezia–Milano Smistamento/Milano-Melzo;
  • Shanghai–Antwerp/Rotterdam–Busto Arsizio-Gallarate/Milano-Melzo;
  • New York–La Spezia–Milano Smistamento/Milano-Melzo;
  • New York–Antwerp/Rotterdam–Busto Arsizio-Gallarate/Milano-Melzo.
In detail, firstly, the following itineraries, in which the rail connection is offered by one of the “traditional” MTOs, have been considered (Figure 3):
  • Origin Far East (Shanghai), unloading at La Spezia, rail connection La Spezia–Milano Smistamento;
  • Origin Far East (Shanghai), unloading at Antwerp, rail connection Antwerp–Busto Arsizio–Gallarate;
  • Origin North America (New York), unloading at La Spezia, rail connection La Spezia–Milano Smistamento;
  • Origin North America (New York), unloading at Antwerp, rail connection Antwerp–Busto Arsizio–Gallarate.
Secondly, the following additional itineraries, in which the rail connection is offered by Contship (the main non-traditional MTO), have been considered (Figure 4):
  • Origin Far East (Shanghai), unloading at La Spezia, rail connection La Spezia–Milano-Melzo;
  • Origin Far East (Shanghai), unloading at Rotterdam, rail connection Rotterdam–Milano-Melzo;
  • Origin North America (New York), unloading at La Spezia, rail connection La Spezia–Milano-Melzo;
  • Origin North America (New York), unloading at Rotterdam, rail connection Rotterdam–Milano-Melzo.
Figure 3 refers to the unloading ports of Antwerp and La Spezia; Figure 4 refers to the unloading ports of Rotterdam and La Spezia. In the figures, they have been reported as phases: “maritime terminal crossing”, “transport to rail terminal” and “rail terminal crossing”. As shown by the figures, only Antwerp shows the phase “transport to rail terminal”, because in both Rotterdam and in La Spezia, the rail terminal is located inside the maritime terminal.
  • “Maritime terminal crossing” refers to the monetary cost and time necessary for all port operations related to:
    Unloading the container, from the ship to the berth area;
    Transfer of the container from the berth area to the storage yard (where the container stops until administrative and maintenance operations are completed);
    Transfer of the container from the storage yard to the receipt/delivery area of the terminal where the consignment of the container is carried out. If inside the maritime terminal there is a rail terminal, the consignment consists of the movement of the container from the storage yard to the tracks of the rail terminal.
  • “Transport to rail terminal” refers to the monetary cost and time necessary to transport the container by truck from the maritime terminal to the rail terminal where the train departs. This phase exists only if the rail terminal is not inside the maritime terminal. In La Spezia and Rotterdam, the rail terminal is in the maritime terminal; therefore, this phase does not exist. This phase instead exists in Antwerp because it is necessary to transport containers by road from the maritime terminal to the rail terminal;
  • “Rail terminal crossing” refers to the monetary cost and time necessary for the operations related to loading the container onto the train, i.e., picking up the container, handling the container through the gantry crane, and loading the container on the train. All administrative procedures linked to these operations must be considered. Monetary costs and times related to “rail terminal crossing” are considerably less than those related to “maritime terminal crossing”.
All these phases are schematically reported in Figure 3 and Figure 4.

4. Results

4.1. Number of Maritime Containers Crossing Northern European Ports

4.1.1. TEUs Transported by “Traditional” MTOs by “Direct” Connections

The number of trains per week, linking northern European ports and Italian rail terminals, operated by “traditional” MTOs, and operated by “direct“ connections (i.e., without transhipment at intermediate terminals) was equal to: 178 trains per week operated by Hupac, 82 by Mercitalia Intermodal, 8 by Kombiverkehr and 8 by Lineas Intermodal; in addition, 42 trains per week were operated in code sharing by Hupac and Mercitalia Intermodal and 8 in code sharing by Kombiverkehr and Mercitalia Intermodal. Trains operating in code sharing were considered separately: for example, the 42 trains operating in code sharing by Hupac and Mercitalia Intermodal were not included in the 178 trains operated by Hupac or in the 82 trains operated by Mercitalia Intermodal. Overall, 336 trains per week were supplied by “traditional” MTOs between northern European ports and Italy: which is 17,519 trains per year. All these trains linked northern European ports with Italian rail terminals located in the Padan Plain. Rail terminals located in the central and southern parts of Italy are connected to northern Europe only by transhipment in northern Italian terminals, in particular: Busto Arsizio–Gallarate, Novara CIM, Milano Smistamento, and Verona Quadrante Europa. A synthesis of the results is reported in Table 5. Data refer to December 2019 and January 2020. The number of trains reported has been calculated from the overall rail connections between the Padan Plain and northern range ports. The total number of deep-sea maritime containers transported by rail per year, only by “traditional” MTOs, and by “direct” connections, resulted equal to 92,119: see Table 5.

4.1.2. TEUs Transported by “Traditional” MTOs by “Indirect” Connections

The number of trains per week linking northern European ports and Italian rail terminals, operated by “traditional” MTOs and operated by “indirect” connections (i.e., with transhipment at intermediate terminals), is equal to 87:75 trains per week are operated by Kombiverkehr, and 12 by DB Schenker. A synthesis of the research is reported in Table 6. Data refer to December 2019 and January 2020. The number of trains reported has been calculated from the overall rail connections between the Padan Plain and northern range ports. The total number of deep-sea maritime containers transported by rail per year, only by “traditional” MTOs and by “indirect” connections, resulted equal to 27,667: see Table 6. Summing this quantity with the total number of deep-sea maritime containers transported by “direct” connection, it was obtained that 119,786 TEUs per year are transported, on the whole, by “traditional” MTOs.

4.1.3. TEUs Transported by “Non-Traditional” MTOs

All data about “non-traditional” MTOs are reported in Table 7. The most important “non-traditional” MTOs are Contship and partner companies Samskip and Shuttlewise. Their trains are made up, on average, of 24 wagons and transport, on average, 35.7 maritime containers (20 or 40 feet; at most, 40 foot ones) per train and around 64 TEUs per train. The number of TEUs per train has not been calculated by the conversion factor; it was provided directly by the MTO themselves.
Besides Contship, Samskip and Shuttlewise, all the other MTOs also operating between northern European ports and Italian terminals have been analysed. In particular, we examined:
  • GTS Logistics: their trains transported, on average, 33 ITUs per train, 45 feet long, but the traffic was almost completely continental (5% maritime containers);
  • Move Intermodal: same data as GTS Logistics.
ERS Railways was operative in 2017, although currently, it does not offer any more connections to/from northern European ports. In 2017, their trains transported, on average, 36 ITUs per train, but only 10% were maritime containers.
There are several other MTOs operating in the sector of rail transport of maritime containers in Europe; the most important is Distrirail. However, they do not operate in Italy, only in northern and central Europe.
The number of trains operated by “non-traditional” MTOs was equal to 151 trains per week, which is 7874 trains per year. Overall, it was estimated that 286,772 TEUs per year were transported by non-traditional MTOs.
Therefore, summing these data to the total number of TEUs transported by “traditional” MTOs, which is 92,119 TEUs by direct connections and 27,667 TEUs by indirect connections, a total of 406,558 TEUs transported between Italian rail terminals and northern European ports has been obtained.
Data of 2019/2020 have been compared with older data, collected in July and August 2017, regarding “traditional” MTOs and in October and November 2017 regarding “non-traditional” MTOs. The results of the comparison are shown in Table 8 and Table 9.
The comparison has shown that the number of connections, and therefore of TEUs transported, has varied considerably for some operators. However, the total number of TEUs transported by traditional MTOs has remained almost the same, while the number of TEUs transported by non-traditional MTOs has shown a slight increase, of about 2000 TEUs (see Table 9).

4.2. Costs and Travel Times for Transporting a Container from the Far East and from North America to the Padan Plain

In this section, the results of monetary costs and travel times required to transport a 20 foot or 40 foot maritime container from the Far East and North America to northern Italy are presented. Two alternatives have been considered:
  • Crossing an Italian port: in particular, the unloading port of La Spezia was taken into account;
  • Crossing a northern range port: the unloading ports of Antwerp and Rotterdam were considered.
The methodology of this study is presented in detail in Section 3.2.

4.2.1. Monetary Costs

Maritime Freight Rates

The costs of maritime transport comprise:
  • Maritime freight rates: from Shanghai to La Spezia and from Shanghai to Rotterdam/Antwerp; from New York to La Spezia and from New York to Rotterdam/Antwerp;
  • Cost for the maritime terminal crossing phase (“maritime terminal crossing (THC)” in Figure 3 and Figure 4). The cost for maritime terminal crossing is actually the THC (Terminal Handling Charges), which will be described in detail in the following.
Maritime freight rates from the Far East (as previously mentioned, we refer to the port of Shanghai, which, however, is the most important container port in the world) to the Mediterranean, considering only transport costs of the deep-sea shipping part (i.e., apart from costs for unloading the container at the terminal), do not differ relevantly from one port to another in the Mediterranean (considering only European ports of the Mediterranean), i.e., the freight rate to La Spezia is almost the same as that to Genoa, and similar to that to Barcelona. The same observation is valid for freight rates from Shanghai to northern European ports, i.e., the freight rate to Antwerp is similar to that to Rotterdam. Instead, freight rates register relevant fluctuations month by month. Maritime freight rates refer to the Shanghai Containerized Freight Index (source: FBX, Freightos Baltic Index [46]) and have been collected from January to July 2020. Deep-sea freight rates from North America (we refer to the port of New York) to Mediterranean ports (considering only European ports of the Mediterranean) are very similar from one port to another; the same happens from North America to northern European ports. In addition, these freight rates are almost constant in time: actually, they relate to transport between two stable economies (North America and Europe). Additionally, these freight rates have been collected from January to July 2020. The values of the average freight rates are reported in Table 10.

Terminal Handling Charges and Inland Handling Charges

The cost related to maritime terminal crossing operations is made up of several parts. A complete price list, related to the Terminal Darsena Toscana of the port of Livorno, is available on the website of this terminal (source: Tariffario Terminal Darsena Toscana [47]). Terminal Handling Charges (THC) are the amounts that have to be paid by customers to terminal operators for all the operations related to loading or unloading a container. The THC completely covers all the costs related to the maritime terminal crossing reported in Figure 3 and Figure 4. THCs are different in the three cases of import, export, and transhipment. In this paper, the THC in the case of imports has been considered.
THC values are almost constant in time: they register slight fluctuations according to the market trends. The average amount, from January to July 2020, of THCs in Italian ports, was USD 200 per ITU (see Table 11): this cost was the same in all Italian ports. The average amount, from January to July 2020, of THCs in northern European ports was USD 215 per ITU (see Table 11): again, this cost was the same in all northern range ports. These values have been collected from the online THC calculator provided by Hamburg Süd (Hamburg Süd, THC Calculator [48]).
The Inland Handling Charge (IHC) is the amount to be paid for transporting the container from the maritime terminal to the final receiver, or to a continental rail terminal where the change of transport mode occurs. If the rail terminal is inside the maritime terminal, the IHC is equal to zero. In our case, the IHC existed only for the port of Antwerp, and it was equal to the cost of road transport from the maritime container terminal of Antwerp to the rail terminal. IHCs are not a characteristic of whether a port is located in the Mediterranean or in northern Europe, but depend on the layout of the port. For this reason, IHCs have been neglected in our study.
The total maritime transport costs (deep sea freight rates + THC) are reported in Table 12.

Cost of Rail Transport

The handling cost at Italian rail terminals is available on the Terminali Italia website (source: Terminali Italia [49]), and it is equal to EUR 32.50 per ITU for all terminals: this rate, reported in Table 13 and Table 14, refers to the handling truck-train, but it does not include the costs for idle container time at the terminal for longer than two days. Some terminal operators in Belgium, The Netherlands, and Germany have been interviewed, who provided similar values, equal to around EUR 35 per ITU: this rate is reported in Table 13 and Table 14. Some terminal operators in Slovenia and Croatia have also been interviewed, and they reported a handling cost slightly less than Italian one, about EUR 30 per ITU. These handling costs are related to the “rail terminal crossing” phase referred to in Figure 3 and Figure 4.
As for costs related to rail transport, interviews have been performed with the MTOs offering the connections under study, i.e., La Spezia–Milano Smistamento and Antwerp–Busto Arsizio-Gallarate (as far as the case of Figure 3 is concerned, i.e., rail connection is offered by one of the “traditional” MTOs). The actual prices requested by MTOs to customers are usually the result of a negotiation: if a customer books services very often from a given MTO, this customer benefits from lower fares. In addition, the longer the connection, the lower the price per kilometre. The price for a TEU, requested by a “traditional” MTO operating a service Antwerp–Busto Arsizio-Gallarate, is around EUR 0.7–0.9 per km, while the price for an FEU, or for a 45 foot ITU, is equal to EUR 0.9–1.1 per km. Considering an average price of 0.8 EUR/km and 1.0 EUR/km for a container/swap body of 20 and for an FEU or a 45 feet ITU, respectively, the transport cost for the rail connection Antwerp–Busto Arsizio-Gallarate, which is 1131 km long, is equal to EUR 905 for a 20 foot container and to EUR 1130 for an FEU or a 45 foot ITU. It must be emphasised that the same price applies to 40 foot containers, 45 foot swap bodies, and 45 foot semitrailer.

Total Costs (Maritime + Rail)

The total costs, maritime + rail, for “traditional” MTOs (Figure 3 scheme), are reported in Table 13 for origins in the Far East, and in Table 14 for origins in North America.
The total cost (regarding “traditional” MTOs) for transporting a 20 foot container from the Far East via Antwerp is about 34% greater than via La Spezia, and the total cost for transporting a 40 foot container from the Far East via Antwerp is about 23% greater than via La Spezia (Table 13).
The total cost for transporting a 20 foot container from North America via Antwerp is about 24% greater than via La Spezia; almost the same difference in costs (23%) is shown for a 40 foot container (Table 14). In fact, although monetary costs of deep-sea transport (without THCs) from North America via Antwerp are less than those via La Spezia, this difference is not enough to make it cost-effective to unload containers in northern European ports: this is due to the high impact of rail transport costs.
As a result, it is clear that for an origin in the Far East, the cost via northern European ports is far higher than the cost via Italian ports, because of the higher costs related to rail transport from northern European ports to the final destination in the Padan Plain. Additionally, if the origin is in North America, the total cost via northern Europe is higher, because of the cost of rail transport, but the difference is less.
However, in Section 3.1., it was reported that the majority of deep-sea maritime containers are transported by Contship and partner companies. Consequently, an alternative rail connection, operated by Contship and partner companies, has been considered (Figure 4 scheme). Costs via northern European ports are greater than those via Italian ports, as in the previous case (“traditional” MTOs). However, the lower effect of rail costs on total costs results in a lower difference in total costs between northern European ports against Italian ports.
The analysis has been carried out taking La Spezia as the Italian reference port, but the same results could also be extended to Genoa and to Livorno (the other two main ports of the Ligurian multi-port gateway system). However, currently, in Italy, the majority of rail services operate to/from La Spezia (where Contship operates), as reported in Lupi et al. [14].
In synthesis, for an origin in the Far East, the costs of deep-sea freight rates at Italian ports are greater than those of northern European ports. Additionally, for an origin in North America, the costs of deep-sea freight rates at Italian ports are greater than those of northern European ports, and the percentage difference is higher than in the case of an origin in the Far East. Instead, both THCs at the maritime terminals and at rail terminals are slightly lower in Italy (about 7–8%) than in northern Europe. The costs of rail transport are significantly lower in the case of unloading a container at a Ligurian port: both for “traditional” MTOs and for Contship. Indeed, the distance from a Ligurian port to the Padan Plain is relevantly less than from northern European ports to the Padan Plain. As far as total costs are concerned, in both cases, regarding origin in the Far East and in North America, it is more convenient to unload a container at a Ligurian port, than at a northern European port.

4.2.2. Travel Times

Travel Times on the Maritime Deep-Sea Route

The maritime times (minimum, maximum, and average) on the routes considered are reported in Table 15.

Idle Time at Port Terminals and Time to Transport a Container to the Rail Terminal

The idle times of containers in import at port terminals have been collected from interviews with some Italian port authorities. Nowadays, the idle times of containers imported in northern European ports range from one to three days, while the idle times of containers imported in Italian ports range from three to six days. The average idle time of containers imported in Italian ports is about 3.5 days, while the average idle time of containers imported in northern European ports is about 1.5 days. The idle times at ports have recently decreased significantly thanks to port telematization: the main custom documents, such as the custom declarations and the incoming good manifests, are produced in XML format, and in several cases, freight can be released before the ship arrives (Lupi et al. [20]).
Before the port telematization, the average idle times of containers were significantly higher: in 2005, in the case of import, the average idle time of a container at a northern European port was 6.4 days, and at an Italian port it was 7.4 days (Dekker [50]).
The time necessary to transport load units from the maritime terminal to the rail terminal refers to the phase “Transport to rail terminal” in Figure 3. This time is different from one port to another. For example, in Antwerp, it is necessary to carry the load units by road, while in La Spezia, the rail terminal is in the container maritime terminal: the same happens in Genoa, and recently this has become the case in Livorno. This time component differs from one port to another, and it is not a characteristic of northern European ports or of Italian ports; therefore, as for the case of monetary costs, it has been neglected in this study.

Time of Rail Transport

The time of rail transport is made up of:
  • Time for loading ITUs onto the train. It is necessary that load units are already in the terminal before the departure of the train: this time interval is generally equal to two hours. The maximum time instant at which load units can arrive at the rail terminal is called the cargo closing time;
  • Travel time;
  • Time for unloading containers from the train. This time interval is generally equal to 1.5 h. The time instant after the arrival of the train from which the load units are available is called the cargo availability time.
MTO websites do not report the travel time, but the cargo closing time and the cargo availability time; therefore, we directly obtained the total rail time: loading + voyage + unloading.
In order to determine the rail travel times, all direct rail connections from Antwerp, Rotterdam and Hamburg, and from Genoa and La Spezia, to the Milan region, have been analysed. In Table 16, these connections are reported; connections operated by Contship are Rotterdam–Milan Melzo and La Spezia–Milan Melzo, while all the other connections are operated by traditional MTOs.
The travel times of rail transport have been calculated by taking into account the same rail connections that were considered in the calculation of the monetary cost (Table 13 and Table 14). These rail connections have been reported in the green boxes of Table 16; they also include the time for handling the container at the rail terminal. As far as travel times of rail transport are concerned, a single value for each connection, and not a maximum and an average value, has been taken into account.

Total Times: Maritime + Rail

The average and maximum times for transporting a container from the Far East to Milan, via La Spezia or Antwerp, are reported in Table 17. The average and maximum times for transporting a container from North America to Milan, via La Spezia or Antwerp, are reported in Table 18.
If the origin is in the Far East, the travel times on deep-sea shipping container routes are less if the container is unloaded at a Ligurian port. However, Italian ports are at a strong disadvantage regarding dwell times; although these have significantly decreased thanks to the port telematization, both the average and the maximum dwell times at Italian ports are equal to double the average and maximum dwell times at northern European ports. In any case, from the point of view of total times, it is always convenient to unload at an Italian port.
If the origin is in North America, from the point of view of total times, it is more convenient to unload a container at a northern European port. Indeed:
  • The voyage time on the deep-sea shipping route is shorter by one day if the container is unboarded at a northern European port;
  • Dwell times of Italian ports are significantly higher than dwell times of northern European ports;
  • The rail transport travel time from northern European ports to the Padan Plain is higher by one day than the travel time from a Ligurian port, but this extra day is not sufficient to change the comparison regarding total times: it does not significantly affect the total times.

5. Discussion

In this study, a peculiar phenomenon of port regionalization, i.e., the formation of so-called “islands”, has been analysed. This phenomenon, already common, will further increase thanks to the development of rail (but also road) infrastructure to and from port terminals. As a result, port hinterlands (the “competition margin”) will become more overlapped and the competition among European ports will further increase. The Padan Plain in Italy, within the fundamental hinterland of northern Italian ports, but served (although only partially) by northern European ports, is an example of “island formation” considered in this paper to understand this general phenomenon. The main reasons for the formation of such “islands” have been investigated in detail.
Several sources report that a consistent number of TEUs, having origins or destinations in the Padan Plain, cross northern European ports, but there is much disagreement among the various estimates. In this paper, this phenomenon is analysed in depth, based on a relevant amount of data about rail connections.
Scheduled rail connections operated by the so-called “traditional” MTOs, operating to/from Italian terminals, have been studied. The results of the research have shown that “traditional” MTOs mainly operate continental connections, and in particular they usually do not connect rail terminals located in the quays (e.g., Rotterdam Euromax), or close to them, but continental terminals: for example, Hamburg Billwerder, Antwerp Mainhub, Rotterdam RSC, which are in the parts of the metropolitan area devoted to logistic activities, but not in the port area. Summing direct and indirect connections, about 120,000 TEUs (deep-sea maritime containers) are transported every year by “traditional MTOs” between northern European ports and the Padan Plain.
Scheduled rail connections operated by the so-called “non-traditional” MTOs, operating to/from Italian terminals, have been studied. They instead operate, mainly, in the maritime field: in particular, Contship and partner companies (Samskip and Shuttlewise) primarily operate in the supply chain of European deep-sea shipping container transport. Contship is an important maritime container terminal operator in the Mediterranean, and it is part of the Eurokai group, which also manages important terminals in northern Europe. The so-called “non-traditional” MTOs mainly offer rail connections directly to/from quays and almost always transport deep-sea maritime containers. A little less than 290,000 TEUs (deep-sea maritime containers) are transported every year by “non-traditional MTOs” between northern European ports and the Padan Plain.
Therefore, it seems that as far as the connections between Italy and northern Europe are concerned, on one side “traditional” MTOs primarily perform continental (having both origins and destinations in Europe) container traffic operations and marginally deep-sea container traffic; on the other side, “non-traditional” MTOs manage fundamentally deep-sea maritime containers and only partially operate with continental containers.
As far as the analysis of monetary costs is concerned, the results show that, for containers originating both in the Far East and North America, from the monetary cost point of view, it is convenient to unload at an Italian port, because of the shorter length of the rail links. Actually, the cost of rail transport, from northern Europe to the Padan Plain, has the same order of magnitude as the deep-sea shipping rates; instead, the cost of rail transport from an Italian port to the Padan Plain is relevantly less. In any case, it must be emphasised that the cost of the maritime part of the supply chain is in favour of northern European ports, both for origins in the Far East and North America.
As for travel times, they are considerably affected by idle times of containers which, at Italian Ligurian ports, are relevantly higher than at northern European ports. For containers having origins in the Far East, the greater idle times at Ligurian ports are compensated by the shorter navigation times; therefore, it is slightly more convenient to unload at a Ligurian port. As far as containers having origins in North America are concerned, the navigation time to northern European ports is shorter than to Italian ports. Although travel times by rail from Ligurian ports to the Padan Plain are shorter by one day, they do not significantly affect total travel times. As a result, for origins in North America, it is more convenient to unload at a northern European port.

6. Conclusions

In this paper, at first, an introduction to port regionalization and to the “island formation” phenomenon, considering the main contributions in the literature, has been carried out. Afterwards, in order to understand the general phenomenon of “island formation”, a very important example of “island formation” in Europe has been considered: the Padan Plain in Italy.
The performed analysis has shown that, each year, around 406,000 TEUs, considering only deep-sea maritime containers, having origins or destinations in the Padan Plain, cross northern European ports.
As far as the analysis of monetary costs is concerned, the results show that, for containers originating both in the Far East and North America, from the monetary cost point of view, it is more convenient to unload at an Italian port.
As for travel times, for containers originating in the Far East, it is slightly more convenient to unload at an Italian Ligurian port; for containers originating in North America, it is more convenient to unload at a northern European port.
The competition between Mediterranean ports and northern European ports will increase after the completion of some important infrastructure projects in TEN-T rail corridors: the important markets of central Europe, where some main industrial regions are located, will become even more contestable in the near future, and consequently, numerous new “island formations” will develop in Europe.

Author Contributions

Conceptualization, M.L. and A.F.; Data curation, A.C. and F.C.; Formal analysis, M.L.; Funding acquisition, A.P.; Investigation, M.L., A.C. and F.C.; Methodology, M.L., A.P. and A.F.; Validation, A.P.; Writing—original draft, A.F.; Writing—review & editing, A.F. All authors have read and agreed to the published version of the manuscript.

Funding

This research was funded by the University Centre of Logistic Systems and by the Department of Civil and Industrial Engineering, University of Pisa.

Institutional Review Board Statement

Not applicable for the study presented in this paper.

Informed Consent Statement

Not applicable for the study presented in this paper.

Data Availability Statement

Data sharing not applicable. Please contact the authors for further information.

Conflicts of Interest

The authors declare no conflict of interest.

References

  1. Rodrigue, J.-P.; Notteboom, T. Foreland-based regionalization: Integrating intermediate hubs with port hinterlands. Res. Transp. Econ. 2010, 27, 19–29. [Google Scholar] [CrossRef]
  2. Sargent, A.J. Seaport and Hinterlands; Adam and Charles Black: London, UK, 1938. [Google Scholar]
  3. Acciaro, M.; Bardi, A.; Cusano, M.I.; Ferrari, C.; Tei, A. Contested port hinterlands: An empirical survey on Adriatic seaports. Case Stud. Transp. Policy 2017, 5, 342–350. [Google Scholar] [CrossRef] [Green Version]
  4. Hilling, D.; Hoyle, B.S. Spatial approaches to port development. In Seaport Systems and Spatial Change; Hoyle, B.S., Hilling, D., Eds.; John Wiley & Sons: Chichester, UK, 1984; pp. 1–19. [Google Scholar]
  5. Rodrigue, J.P. Applications and case studies. In The Geography of Transport Systems, 4th ed.; Routledge: New York, NY, USA, 2017; Chapter 11; Available online: https://people.hofstra.edu/geotrans/eng/ch4en/con4en/transshipment_incidence.html (accessed on 15 January 2021).
  6. Wilmsmeier, G.; Monios, J.; Lambert, B. The directional development of intermodal freight corridors in relation to inland terminals. J. Transp. Geogr. 2011, 19, 1379–1386. [Google Scholar] [CrossRef] [Green Version]
  7. Notteboom, T.; Rodrigue, J.P. Port regionalization: Towards a new phase in port development. Marit. Policy Manag. 2005, 32, 297–313. [Google Scholar] [CrossRef]
  8. Notteboom, T.; Rodrigue, J.P. Inland Freight Distribution and the Sub-harborization of Port Terminals. In Proceedings of the ICLSP Conference, Dalian, China, 22–26 September 2004. [Google Scholar]
  9. Monios, J.; Wilmsmeier, G. The role of intermodal transport in port regionalisation. Transp. Policy 2013, 30, 161–172. [Google Scholar] [CrossRef] [Green Version]
  10. Roso, V.; Lumsden, K. The dry port concept: Moving seaport activities inland? Transp. Commun. Bull. Asia Pac. 2009, 78, 87–101. [Google Scholar]
  11. Roso, V.; Woxenius, J.; Lumsden, K. The dry port concept: Connecting container seaports with the hinterland. J. Transp. Geogr. 2009, 17, 338–345. [Google Scholar] [CrossRef]
  12. Rodrigue, J.-P.; Notteboom, T. Dry ports in European and North American intermodal rail systems: Two of a kind? Res. Transp. Bus. Manag. 2012, 5, 4–15. [Google Scholar] [CrossRef]
  13. Frémont, A.; Franc, P. Hinterland transportation in Europe: Combined transport versus road transport. J. Transp. Geogr. 2010, 18, 548–556. [Google Scholar] [CrossRef] [Green Version]
  14. Lupi, M.; Pratelli, A.; Giachetti, A.; Farina, A. Rail freight transport in Italy: An analysis of combined transport connections Il trasporto ferroviario in Italia: Una analisi dei collegamenti ferroviari di trasporto combinato. Ing. Ferrov. 2018, 73, 209–245. [Google Scholar]
  15. Monios, J. The role of inland terminal development in the hinterland access strategies of Spanish ports. Res. Transp. Econ. 2011, 33, 59–66. [Google Scholar] [CrossRef] [Green Version]
  16. Van Klink, H.A.; Van Der Berg, G.C. Gateways and intermodalism. J. Transp. Geogr. 1998, 6, 1–9. [Google Scholar] [CrossRef]
  17. Ferrari, C.; Parola, F.; Gattorna, E. Measuring the quality of port hinterland accessibility: The Ligurian case. Transp. Policy 2011, 18, 382–391. [Google Scholar] [CrossRef]
  18. Lupi, M.; Pratelli, A.; Conte, D.; Farina, A. Railway lines across the alps: Analysis of their usage through a new railway link cost function. Appl. Sci. 2020, 10, 3120. [Google Scholar] [CrossRef]
  19. Gonzalez, O.; Koivisto, H.; Mustonen, J.M.; Keinänen-Toivola, M. Digitalization in Just-In-Time Approach as a Sustainable Solution for Maritime Logistics in the Baltic Sea Region. Sustainability 2021, 13, 1173. [Google Scholar] [CrossRef]
  20. Lupi, M.; Pratelli, A.; Benenati, S.; Farina, A. A new platform for the management of physical and documental flows at Italian and French Ligurian ports. In Proceedings of the IEEE-EEEIC—19th International Conference on Environment and Electrical Engineering, Genoa, Italy, 11–14 June 2019; pp. 1358–1364, ISBN 978-1-7281-0652-6. [Google Scholar]
  21. Ministero delle Infrastrutture e dei Trasporti, Consulta Generale per l’Autotrasporto e la Logistica. Piano Della Logistica. Analisi dei Processi di filiera. Morfologia dei Flussi Logistici Internazionali. “Feelings & insight” del Sistema Logistico Italiano; Doc. N. 11-179-H3, Rev. 1–August 2011; Italian Ministry of Infrastructures and Transports (MIT): Rome, Italy, 2011.
  22. Cassa Depositi e Prestiti. Porti e Logistica. Il Sistema Portuale e Logistico Italiano nel Contesto Competitivo Euro-Mediterraneo: Potenzialità e Presupposti Per il Rilancio; Cassa Depositi e Prestiti: Rome, Italy, 2012. [Google Scholar]
  23. Ministero delle Infrastrutture e dei Trasporti, Consulta Generale per l’Autotrasporto e la Logistica. Il Piano Nazionale della Logistica 2012/2020; Italian Ministry of Infrastructures and Transports (MIT): Rome, Italy, 2012.
  24. Ministero delle Infrastrutture e dei Trasporti, Consulta Generale per l’Autotrasporto e la Logistica. Il Piano Nazionale della Logistica 2011/2020; Italian Ministry of Infrastructures and Transports (MIT): Rome, Italy, 2010.
  25. Informare, 2015. La Liguria che fa Sistema. Relazione Assemblea Generale Congiunta, Genoa. Available online: http://www.informare.it/news/forum/2015/20150327spedizionieri.asp (accessed on 27 March 2015).
  26. Fedespedi, 2015. Newsletter Fedespedi n. 11. Available online: https://www.fedespedi.it/ (accessed on 28 January 2021).
  27. Ministero delle Infrastrutture e dei Trasporti, Piano Strategico Nazionale della Portualità e della Logistica. 2015. Available online: http://www.mit.gov.it/mit/mop_all.php?p_id=23291 (accessed on 16 December 2020).
  28. Curi, S.; Dallari, F. Misurazione e rappresentazione dei flussi logistici di Milano; Chamber of Commerce of Milan: Milan, Italy, 2009. [Google Scholar]
  29. Notteboom, T. Dynamics in port competition in Europe: Implications for North Italian ports. In Proceedings of the Workshop “I porti del Nord”, Milan, Italy, 18 April 2012. [Google Scholar]
  30. ECE (Economic Commission for Europe). Terminology on Combined Transport, Prepared by the UN/ECE. In European Conference of Ministers of Transport (ECMT) and the European Commission (EC); United Nations: New York, NY, USA; Geneva, Switzerland, 2001. [Google Scholar]
  31. Nelldal, B.L. Competition and co-operation between railways and trucking in long distance freight transport—An economic analysis. In Proceedings of the 3nd KFB-Research Conference “Transport Systems—Organisation and Planning”, Stockholm School of Economics, Stockholm, Sweden, 13–14 June 2000. [Google Scholar]
  32. Grossato, R. Il Sistema Gateway Nello Sviluppo Della Rete del Trasporto Combinato in Europa: Il Caso del Terminal di Verona Quadrante Europa. Ph.D. Thesis, University of Bologna, Bologna, Italy.
  33. Cosmos, Intermodal Production Systems. 2018. Available online: http://www.intermodal-cosmos.eu/content/intermodal-transport-in-south-east-europe/intermodal-basics/intermodal-production-systems/index_eng.html (accessed on 15 January 2021).
  34. Unione Interporti Riuniti, 2014. Rapporto UIR. Il Sistema Degli Interporti Italiani Nel 2012. Available online: http://www.unioneinterportiriuniti.org/SharedFiles/Download.aspx?pageid=33&mid=130&fileid=171 (accessed on 28 January 2021).
  35. Hamburg Port Authority, Modal Split of Container Traffic. Available online: https://www.hafen-hamburg.de/en/statistics/modalsplit (accessed on 16 December 2020).
  36. Antwerp Port Authority, 2020. Port of Antwerp. Facts and Figures. Available online: https://www.portofantwerp.com/sites/default/files/Facts%20and%20figures%202020_0.pdf (accessed on 28 January 2021).
  37. Rotterdam Port Authority, 2020. Port of Rotterdam. Facts and Figures. Available online: https://www.portofrotterdam.com/en/the-port/port-facts-and-figures/containers (accessed on 28 January 2021).
  38. European Parliament, Directorate-General for Internal Policies. Modal Share of Freight Transport to and from EU Ports; Policy Department, Structural and Cohesion Policies: Bruxelles, Belgium, 2015. [Google Scholar]
  39. Duisburg Port Website. Available online: www.duisport.de (accessed on 28 January 2021).
  40. Lupi, M.; Farina, A.; Orsi, D.; Pratelli, A. The capability of Motorways of the Sea of being competitive against road transport. The case of the Italian mainland and Sicily. J. Transp. Geogr. 2017, 58, 9–21. [Google Scholar] [CrossRef] [Green Version]
  41. Dalla Chiara, B.; Pellicelli, M. On the cost of road-rail combined transport sul costo del trasporto combinato strada rotaia. Ing. Ferrov. 2011, 66, 951–965. [Google Scholar]
  42. Hawthorne, J.; Brooker, I.; Ashley, D.; Hughes, C. A Rail Freight Forecasting Model for the Strategic Rail Authority. In Proceedings of the Association for European Transport Conference, Cambridge, UK, 9−11 September 2002. [Google Scholar]
  43. Kim, N.S.; Van Wee, B. The relative importance of factors that influence the break-even distance of intermodal freight transport systems. J. Transp. Geogr. 2011, 19, 859–875. [Google Scholar] [CrossRef]
  44. Lupi, M.; Pratelli, A.; Licandro, C.; Farina, A. The evolution of deep sea container routes: The Italian case. Transp. Probl. 2019, 14, 69–80. [Google Scholar] [CrossRef] [Green Version]
  45. Lupi, M.; Pratelli, A.; Seminara, L.; Farina, A. The Development of Deep and Short Sea Shipping Container Routes Departing from Italian Ports. Nase More Our Sea 2021, 68, 83–92. [Google Scholar]
  46. FBX—Freightos Baltic Index. Available online: https://fbx.freightos.com/ (accessed on 2 September 2020).
  47. Tariffario Terminal Darsena Toscana. 2020. Available online: https://www.tdt.it/LinkClick.aspx?fileticket=QAaDawWHpIU%3D&tabid=94&mid=422&language=it-IT (accessed on 28 January 2021).
  48. Hamburg Sud, THC Calculator. Available online: https://ecom.hamburgsud.com/ecom/en/ecommerce_portal/tariffs_and_surcharges/thc_calc/ep_thc_calculator.xhtml (accessed on 30 July 2020).
  49. Terminali Italia, 2021. Tariffe Servizi Terminalistici. Available online: http://www.terminaliitalia.it/content/terminaliitalia/it/i-nostri-servizi/handling---manovra.html (accessed on 28 January 2021).
  50. Dekker, S. Port Investment: Towards an Integrated Planning of Port Capacity. Ph.D. Thesis, TU Delft, Delft, The Netherlands, 2005. [Google Scholar]
Figure 1. The area under study. The Padan Plain is circled in blue. The main northern European ports (Zeebrugge, Antwerp, Rotterdam, Bremerhaven, and Hamburg) and northern Italian ports (Genoa, La Spezia, Livorno, Venice, Trieste) are circled in red. The terminals of Milano Smistamento, Milano Segrate and Milano Melzo, mentioned later, are in the immediate surroundings of the Milan urban area.
Sustainability 13 04819 g001
Figure 2. Detail about the area under study. The main continental terminals of the Padan Plain are circled in blue. The terminals Milano Smistamento and Milano Segrate have almost the same position.
Sustainability 13 04819 g002
Figure 3. The itineraries considered in the research: Shanghai/New York—Milan area, crossing the northern European port of Antwerp or the Italian port of La Spezia. Rail connection is offered by one of the “traditional” MTOs.
Sustainability 13 04819 g003
Figure 4. The itineraries considered in the research: Shanghai/New York—Milan area, crossing the northern European port of Rotterdam or the Italian port of La Spezia. Rail connection is offered by Contship.
Sustainability 13 04819 g004
Table 1. Synthesis of the estimates of the number of TEUs per year, crossing northern European ports but having origin/destination in Italy, proposed by the various sources.
SourceNumber of TEUs Per Year
Italian General Board for Road Transport and Logistics [21]441,888 TEUs
Cassa Depositi e Prestiti [22]440,000 TEUs
Italian National Plan of Logistics 2012/2020 [23]“hundreds of thousands of containers”
Italian National Plan of Logistics 2011/2020 [24]2 million containers
Centro Studi Fedespedi [26]Around 900,000 TEUs
Italian national strategic plan of port sector and logistics of 2015 [27]1.5 million TEUs
Table 2. Typologies of trains in combined transport.
Type of TrainAbout the ScheduleOrigin/Destination of the Wagons which Make Up the TrainOther Characteristics
Direct trainScheduled or not scheduledSingle origin and a single destinationThey do not allow any handling of ITUs, or any horizontal handling of wagons, during the journey.
Shuttle trainsScheduledSingle origin and a single destination.They do not allow any handling of ITUs, or any horizontal handling of wagons, during the journey.
Liner trainsScheduledNo single origin, no single destination: groups of wagons are added or removed at intermediate stations.They perform some intermediate stops (however no more than one or two), between the departure and arrival terminal, in order to add or remove groups of wagons.
Y-shuttle trainsScheduledSingle origin, but no single destination; otherwise: no single origin but single destination.They are similar to liner trains, but in Y-shuttle trains, the wagons removed from the previous train are after added to another train, which carries them to their final destination; while in liner trains, the wagons are not added to any other train because their final destination is the intermediate terminal itself.
Group trains:Not scheduledThe wagons have several origins and several destinations.These trains travel on the European combined transport network and transport ITUs, but they have similarities with diffused traffic because they are made up of groups of wagons with a lot of different origins and destinations.
Table 3. Synthesis on the number of wagons in each train, the number of ITUs transported by each train, the number of TEUs transported by each train, and the average percentage of maritime containers, for the four MTOs interviewed.
Number of Wagons in Each TrainNumber of ITUs Transported by Each TrainNumber of TEUs Transported by Each TrainAverage Percentage of Maritime Containers
MTO 125–2635–3863–687%
MTO 223–2432–3858–6810%
MTO 325–2635–3863–6810%
MTO 421–2230–3354–5910%
Table 4. Modal split of containers crossing the ports of Hamburg, Rotterdam, and Antwerp, with continental origin or destination.
PortYear of ReferenceRoadRailInland Waterways
Hamburg (source: [35])201951.30%46.30%2.40%
Rotterdam (source: [37])201855%14%31%
Antwerp (source: [36])201958%8%34%
Table 5. Deep-sea maritime container traffic between northern European ports and Italian rail terminals, operated by “traditional” MTOs by “direct” connections (i.e., without transhipment at intermediate terminals). Data refer to December 2019 and January 2020.
MTONo. Trains/WeekNo. Trains/YearAverage No. ITU/TrainAverage No. TEUs/Train% Deep-Sea Maritime ContainersTotal Deep-Sea Maritime Containers/Year
Hupac178928136.565.57%42,553
Mercitalia Intermodal824276356310%26,939
Kombiverkehr841736.565.510%2731
Lineas Intermodal841731.556.510%2356
Hupac + Kombiverkehr (*)1052136.565.58.5%2901
Hupac + Mercitalia (*)42219035.7564.258.5%11,960
Mercitalia + Kombiverkehr (*)841735.7564.2510%2679
Total33617,519 92,119
(*) in case of code sharing, is an average value of: No. ITU/train, No. TEUs/train and % maritime containers, among the two MTOs which share the train, has been taken, as suggested by the MTOs offices.
Table 6. Deep-sea maritime container traffic between northern European ports and Italian rail terminals, operated by “traditional” MTOs by “indirect” connections (i.e., with transhipment at intermediate terminals). Data refer to December 2019 and January 2020.
MTONo. Trains/WeekNo. Trains/YearAverage No. ITU/TrainAverage No. TEUs/Train% Deep-Sea Maritime ContainersTotal Deep-Sea Maritime Containers
Kombiverkehr75391136.565.510%25,617
DB Schenker1262636.565.55%2050
Total874537 27,667
Table 7. Deep-sea maritime container traffic between northern European ports and Italian rail terminals, operated by “non-traditional” MTOs. Data refer to December 2019 and January 2020.
MTONo. Trains/WeekNo. Trains/YearAverage No. ITU/TrainAverage No. TEUs/Train% Deep-Sea Maritime ContainersTotal Deep-Sea Maritime Containers
Contship: connections to/from Rotterdam26135635.764100.0%86,784
Contship: connections to/from Duisburg23119935.76433.3%25,553
Samskip: connections to/from Rotterdam26135635.764100.0%86,784
Samskip: connections to/from Duisburg631335.76433.3%6671
Shuttlewise22114735.764100.0%73,408
GTS Logistics30156432.9595.0%4614
Move Intermodal1893935.1635.0%2958
Total1517874 286,772
Table 8. Comparison of the number of connections per week and of the number of “maritime” deep-sea TEUs transported by rail in 2017 and in 2019/2020 (December/January), between Italian terminals and northern European ports.
MTOTotal Connections Per Week 2017 Total Connections Per Week 2019/20 No. TEUs (Only Deep-Sea Maritime)/Week 2017 No. TEUs (Only Deep-Sea Maritime)/Week 2019/20
Only Hupac 76178349816
Only Mercitalia Intermodal (ex Cemat) 12682794517
Only Kombiverkehr 11783766544
Hupac + Mercitalia 114260229
Mercitalia + Kombiverkehr 885151
Hupac + Kombiverkehr 010056
Lineas Intermodal 48827145
DB Schenker 012039
Contship 324917922154
Samskip 423220031791
Shuttlewise 262214071408
GTS Logistics 30308989
Move Intermodal 30189457
ERS Railways 120770.0
TOTAL55857477537796
Table 9. Comparison of the number of maritime TEUs transported by rail in 2017 and in 2019/2020 (December/January), between Italian terminals and northern European ports.
No. Maritime TEUs/Year (2017)No. Maritime TEUs/Year (2019/2020)
Traditional MTOs119,481119,786
Non-traditional MTOs284,730286,772
Total No. maritime TEUs404,211406,558
Table 10. Average container freight rates, on the period from January to July 2020, From Far East and North America to Mediterranean and northern European ports. Source: FBX Freightos Baltic Index [46].
ROUTECost 20 Foot Container (USD)Cost 20 Foot Container (EUR)Cost 40 Foot Container (USD)Cost 20 Foot Container (EUR)
Shanghai–Rotterdam933.80794.721867.601589.45
Shanghai–La Spezia 965.27821.501930.531643.00
New York–Rotterdam 876.16745.671021.47869.34
New York–La Spezia 1057.97900.401243.161058.01
Table 11. Average Terminal Handling Charges in La Spezia, Rotterdam, and Antwerp, over the period January–July 2020. Source: Hamburg Sud, THC Calculator [48].
PortTerminal Handling Charges for Container Import
20 Foot Container (USD)20 Foot Container (EUR)40 Foot Container (USD)40 Foot Container (EUR)
Rotterdam/Antwerp215182.98215182.98
La Spezia200170.21200170.21
Table 12. Total maritime transport costs (deep-sea freight rates + THC) from the Far East to northern Europe, from the Far East to the Mediterranean, from North America to northern Europe, and from North America to the Mediterranean.
Maritime RouteTotal Cost: Deep-Sea Rate + THC
EUR/TEUEUR/FEU
Shanghai–Rotterdam/Antwerp977.701772.43
Shanghai–La Spezia991.711813.22
New York–Rotterdam/Antwerp928.651052.31
New York–La Spezia1070.611228.22
Table 13. Comparison of monetary costs between the two cases of crossing Italian ports and northern European ports, for both 20 foot and 40 foot containers. Origin Far East.
Origin: Far East—COSTSVia La SpeziaVia Antwerp/RotterdamDiff. (%)Via La SpeziaVia Antwerp/RotterdamDiff. (%)
Container 20 FootContainer 20 FootContainer 40 FootContainer 40 Foot
Cost of deep-sea transportEUR 821.50EUR 794.72−3.3%EUR 1643.00EUR 1589.45−3.3%
THC portEUR 170.21EUR 182.987.5%EUR 170.21EUR 182.987.5%
THC rail terminalEUR 32.5EUR 35.07.7%EUR 32.5EUR 35.07.7%
Cost of rail connection (traditional MTOs)EUR 405EUR 905123.5%EUR 540 (*)EUR 1130 (*)109.3%
Total cost (traditional MTOs) (Figure 3)EUR 1429EUR 191834.2%EUR 2386EUR 293723.1%
cost of rail connection (Contship)EUR 140EUR 380171.4%EUR 280EUR 760171.4%
Total cost (Contship) (Figure 4)EUR 1164EUR 139319.7%EUR 2126EUR 256720.7%
(*) In the calculation of the cost of rail transport, we refer to a 45 foot ITU (container/swap body).
Table 14. Comparison of monetary costs between the two cases of crossing Italian ports and northern European ports, for both 20 feet and 40 feet containers. Origin North America.
Origin: North America—COSTSVia La SpeziaVia Antwerp/RotterdamDiff. (%)Via La SpeziaVia Antwerp/RotterdamDiff. (%)
Container 20 FootContainer 20 FootContainer 40 FootContainer 40 Foot
Cost of deep-sea transportEUR 900.40EUR 745.67−17.2%EUR 1058.01EUR 869.34−17.8%
THC portEUR 170.21EUR 182.987.5%EUR 170.21EUR 182.987.5%
THC rail terminalEUR 32.5EUR 35.07.7%EUR 32.5EUR 35.07.7%
Cost of rail connection (traditional MTOs)EUR 405EUR 905123.5%EUR 540 (*)EUR 1130 (*)109.3%
Total cost (traditional MTOs) (Figure 3)EUR 1508EUR 186923.9%EUR 1801EUR 221723.1%
cost of rail connection (Contship)EUR 140EUR 380171.4%EUR 280EUR 760171.4%
Total cost (Contship) (Figure 4)EUR 1243EUR 13448.1%EUR 1541EUR 184719.9%
(*) In the calculation of the cost of rail transport, we refer to a 45 foot ITU (container/swap body).
Table 15. Minimum, maximum, and average travel times, in days (sources: websites of deep-sea shipping container routes operators).
Maritime RouteMin. Travel Time (Days)Max. Travel Time (Days)Av. Travel Time (Days)
Shanghai–La Spezia253128
Shanghai–Antwerp/Rotterdam283431
New York–La Spezia131614.5
New York–Antwerp/Rotterdam121513.5
Table 16. Duration of rail transport from northern European ports and from Ligurian ports to the Padan Plain. The rail connections, taken as references for the calculation of travel times of rail transport, are reported in the green boxes. The duration of the rail transport also imcludes the time for handling the container at the rail terminals.
OriginDestinationDurationOriginDestinationDuration
AntwerpBusto Arsizio (Milan)1 d 6 hGenoaBusto Arsizio (Milan)6 h
Milano Segrate1 d 12 hMilano Smistamento6 h 30 min
RotterdamBusto Arsizio (Milan)1 d 4 hVerona9 h
Milano Melzo1 d 6 hLa SpeziaBusto Arsizio (Milan)6 h
HamburgBusto Arsizio (Milan)1 d 6 hMilano Smistamento9 h
Verona1 d 8 hVerona5 h 30 min
Novara1 d 6 hMilano Melzo7 h 30 min
Table 17. Comparison of travel times between the two cases of crossing Italian ports and northern European ports. Origin: Far East.
Origin: Far EastVia La Spezia Via Antwerp/RotterdamDiff. (%)
Average (Days)Max. (Days)Average (Days)Max. (Days)Average (days)Max. (days)
Travel time of deep-sea transport2831313410.7%9.7%
Idle time at port terminal3.561.53−57.1%−50.0%
Time of rail transport (voyage + handling) (*)0.30.31.251.25316.7%316.7%
Total time (days)31.837.333.7538.256.1%2.5%
(*) Regarding the travel time of rail transport, a single reference value (and not the maximum and the average values) has been taken into account.
Table 18. Comparison of travel times between the two cases of crossing Italian ports and northern European ports. Origin: North America.
Origin: North AmericaVia La Spezia Via Antwerp/RotterdamDiff. (%)
Average (Days)Max. (Days)Average (Days)Max. (Days)Average (Days)Max. (Days)
Travel time of deep-sea transport14.51613.515−6.9%−6.3%
Idle time at port terminal3.561.53−57.1%−50.0%
Time of rail transport (voyage + handling) (*)0.30.31.251.25316.7%316.7%
Total time (days)18.322.316.2519.25−11.2%−13.7%
(*) Regarding the travel time of rail transport, a single reference value (and not the maximum and the average values) has been taken into account.
Publisher’s Note: MDPI stays neutral with regard to jurisdictional claims in published maps and institutional affiliations.

