Article

Propensity to Choose Electric Vehicles in Cross-Border Alpine Regions

1
Institute for Renewable Energy, Eurac Research, Via A.Volta 13/A, 39100 Bolzano, Italy
2
Faculty of Economics and Management, Free University of Bozen-Bolzano, Piazza Università 1, 39100 Bolzano, Italy
3
UBM Consulting Bologna, Via Goito 3, 40126 Bologna, Italy
*
Author to whom correspondence should be addressed.
Sustainability 2021, 13(8), 4583; https://doi.org/10.3390/su13084583
Submission received: 3 March 2021 / Revised: 9 April 2021 / Accepted: 15 April 2021 / Published: 20 April 2021
(This article belongs to the Collection Sustainable Transport Economics, Behaviour and Policy)

Abstract

:
Electric vehicles (EVs) are low-carbon innovations that decrease emissions in transportation. Understanding what drives individual propensity to choose EVs supports policymakers in shaping effective low-carbon mobility policies. Within the MOBSTER Interreg project, data were collected using a survey administered to residents in three Alpine cross-border regions—Canton Ticino (Switzerland), South Tyrol (Italy), and Verbano-Cusio-Ossola (Italy)—and were analyzed with a logistic regression. This study reports on the relevant drivers of EV uptake, showing (i) that some sociodemographic attributes positively impact the propensity to choose an EV (e.g., young age and teenage children), (ii) that the presence and visibility of charging infrastructures are important, and (iii) that the role of tourism is not a driver of EV uptake. This study confirms that policies should consider sociodemographics, social practices, and physical infrastructures as playing roles in EV uptake. Future research should address the issue of access to low-carbon innovations for all.

1. Introduction

As the most recent report from the International Energy Agency states, transportation in 2018 was responsible for 24% of direct CO 2 emissions from fuel combustion. Within the transport sector, road vehicles account for nearly three-quarters of CO 2 emissions [1]. Thus, it is urgent to reduce CO 2 emissions from the transport sector and, more specifically, from road vehicles to meet the objectives of climate change mitigation set out in the Paris Agreement [2] by providing accessible, affordable, healthier, and cleaner mobility alternatives to current user practices [3]. In this sense, promising technology are electric vehicles (EVs). Even if the sales of EVs are rising and future scenarios of penetration of EVs in the mobility market are very promising—in fact, in 2030, they are expected to count for 15% of the global fleet—today, they are still limited to less than 1% of the global car fleet [1,4].
Such slow uptake could be explained by the fact that diffusion of innovation, in this case EVs, in society takes place gradually [5], and it has been claimed that innovation adopters tend to cluster together as individuals learn about and become familiar with innovations through others in their proximity, both geographical, e.g., neighbors, and relational, e.g., family members and friends. Europe mirrors a very similar situation: EV sales in 2018 were 2% of total passenger cars purchases (source: European Environment Agency). Northern European countries are front runners in the uptake of EVs in their fleet, leaving southern states behind. Nevertheless, Alpine regions show a high potential to decarbonize their transport sector via the adoption of EVs and to be fuelled with electricity produced by renewable energy sources produced locally [6], thus reducing affect the final level of greenhouse gases (GHG) production [7]. Figure 1 shows EV registration trends in 5 Alpine regions: Switzerland’s share of EVs over the overall passenger vehicle registrations in 2018 was well above the European average, while the Austrian share was slightly above. On one hand, Germany and France were in line with the European figure; on the other hand, Italy was far below. As Table 1 shows, the mix of BEVs (Battery Electric Vehicles) and PHEVs (Plug-in Hybrid Electric Vehicles) has been varying over the last few years, and different countries have different combinations of the two different types of technology in overall registrations. BEVs are in general the most diffused technology in all five countries, and their share in the overall figure has been growing in recent years. Only France shows an opposite trend, with PHEV figures growing but representing just one third of overall EV registrations. The penetration of EVs in these markets is too little if they want to meet the targets of their share of renewable energy in the transport sector for 2030 (https://www.eea.europa.eu/data-and-maps/indicators/use-of-cleaner-and-alternative-fuels/use-of-cleaner-and-alternative-5, accessed on 8 February 2021).
On the one hand, Alpine regions have the potential to decarbonize their passenger fleets thanks to electricity production from renewable energy sources (mainly hydropower); on the other hand, they are popular destinations for considerable tourist flows year-round, exposing them to technological spillovers from neighboring countries. As cross-border regions, they are also affected by availability and interoperability challenges related to recharging infrastructure [8].
Among the Alpine regions, we selected three for our study: Canton Ticino in Switzerland, the autonomous province of South Tyrol (Italy), and the Italian province of Verbania-Cusio-Ossola. They were selected as they exemplify leader, early adopter, and laggard markets of EVs, as further explained in Section 3.1, and they also are cross-border tourist regions.
This study aims to support the local decision-making process by shedding some light on the factors that foster the diffusion of EVs in cross-border regions, focusing on individual propensity to choose an EV. In particular, this study proposes a deeper perspective of EV uptake, considering the pivotal change in practices that such low-carbon innovation entails [9]. Thus, it investigates the sociodemographic characteristics of the users to reveal more complex social dynamics, as suggested by Sovacool et al. [10], and the integration of sustainable mobility practices and daily habits [11] within Alpine tourist regions. Moreover, this study explores the contribution that tourism can provide in the uptake of EVs in cross-border regions by making EVs more visible and therefore facilitating a norm change towards EVs in local residents [12,13] as well as the role that physical charging infrastructure has.
The specific questions addressed in this study are as follows:
  • Which sociodemographic characteristics affect the adoption of EVs?
  • Do daily life habits affect the propensity to choose an EV?
  • Does tourism act as a driver for EV uptake in tourist regions?
  • How much does charging infrastructure availability affect the choice of EVs?
We postulated a positive link between the factors mentioned above and EV purchase intention:
Hypothesis 1
(H1). The propensity to purchase an EV differs according to sociodemographic characteristics.
Hypothesis 2
(H2). The current mobility habits and the reasons and objectives behind these habits affect the propensity to purchase an EV.
Hypothesis 3
(H3). Tourism acts as a positive driver for EV uptake in tourist regions.
Hypothesis 4
(H4). Charging infrastructure availability and visibility positively affect the adoption of EVs.
To answer these questions and to test the resulting hypotheses, a multidisciplinary approach is used, including social practice and transport social science, beyond the dominant psychological and infrastructural approaches [10].
In this paper, we chose to focus on BEVs and PHEVs as they were indicated as the most attractive technological alternatives to conventionally fuelled vehicles in order to achieve fossil independence and a more energy-efficient transport sector [14]. We refer to EVs as comprehensive for BEVs and PHEVs because both technologies have robust shares in overall EV registrations.
The study reported in this paper was carried out in the framework of the Interreg project MOBSTER (https://www.progettomobster.eu/, accessed on 8 February 2021) (electric mobility for sustainable tourism), which aims to foster economic competitiveness of the tourism sector through the diffusion of electric mobility in cross-border Italian regions and Switzerland.

2. Background

In this section, we first discuss the policies that have been implemented to support the diffusion of EVs in Europe and, then, we introduce the geographical context in which this study was conducted. We then present the current knowledge on the topics addressed by specific research questions through a literature review.

2.1. EV Diffusion Policies

A number of policies and incentives to support EV uptake are already in place in most European countries; several of them have shown a positive response from the market [15,16,17,18]. Melton et al. [19] offer a broad classification on “demand-oriented”, so-called consumer focused, and “supply-oriented” or industry-focused incentives, which for the purpose of this paper is an appropriate one. Among different pilot and well-established policy measures, there are fiscal and non-fiscal ones. Several studies [14,20,21] pointed out that fiscal tools are some of the most successful ones in shaping consumer demand for EVs in the introductory phase of this new technology, while others state that there is still a public and scientific debate as to which of the policies provide an effective mix to boost EV numbers in private and company fleets in a given area, especially when it comes to cross-contamination of policy effects among different border regions [16,22,23]. Among non-fiscal incentives the most effective one was shown to be a wide diffusion of public charging infrastructures [16,24], existing demonstration projects [16,25,26], and changes in building codes to increase home-charging infrastructure [19], among others. Meanwhile, DellaValle and Zubaryeva [27], argue that even in the regions that show a high lead market for EV potential, still sales numbers in the fleet are lagging behind.

2.2. EV Diffusion in Cross-Border Regions

Regionalization in the studies of EV diffusion and adoption of policies for EV support is fundamental to understanding the main drivers behind capillary EV adoption and market development. Scholars [16,23,25,28] showed that, despite European and national targets in sustainable mobility, the rate of EV purchase varies greatly among regions and cities in Europe. The geographical scope of the studies so far focused on the UK, Scandinavian countries, the USA, and various European capitals [10,12,29,30]. Schäuble et al. [8] in their cross-border project analyzed in depth the technical and social needs for a successful interoperable cross-border EV ecosystem construction in Germany and France. Still, given the differences between EU member state regions, potential cross-contamination factors or spillover effects for larger EV purchase remain underexplored. In the theory of regional lead markets for new technology diffusion, the concept of leaders, early adopters, and laggard regions exists [31,32]. For this specific study, we chose three areas that can be classified based on the assessment of Zubaryeva et al. [28] and other characteristics described in detail in Section 3.1: Canton Ticino (leader), South Tyrol (early adopter), and the province of Verbania-Cusio-Ossola (laggard).

2.3. Sociodemographic Characteristics and Daily Practices

The European Green Deal [3] declared the need to provide “more affordable, accessible, healthier and cleaner alternatives” to the current mobility practices of European citizens to achieve sustainable transport means. Citizens and, more broadly, all users have a central role in the transition towards sustainable mobility [33]. Hence, this research investigates the propensity to choose an EV, exploring how a citizen contributes to the transition towards sustainable mobility, which sociodemographic characteristics show who chooses an EV, which current mobility habits exist, and how these habits affect the propensity to adopt EVs.
The current scientific literature investigates the relevance of gender, education, occupation, age, and household size on electric mobility preferences [10]. According to scientific literature, the level of education is relevant in explaining, i.e., has a positive effect, the choice—in different uptake phases—and interest in EVs [10]. Level of education is often reported as a proxy of individual environmental sensitiveness [10]. However, it misses the relevant component of knowledge attributed to the level of education and to the adoption and uptake of a technological innovation [34]. Another relevant aspect is household composition, both in terms of the number of members and the presence of children [10]. These household characteristics positively affect the ownership, use, and interest in EVs.
In changing mobility practices, sociodemographic characteristics are relevant and reveal more complex social dynamics [10]. Social dynamics refer to behavior, more specifically, mobility behavior, resulting from social interactions within a group. For example, when a member of a group, e.g., household, changes their behavior, other members consequently change their behavior too [35]. The group members have their own sociodemographic characteristics, e.g., gender, and these characteristics act within social dynamics and daily habits. In this direction, scientific literature recognizes gender gaps in the transition towards sustainable mobility [10,36,37], especially in terms of ownership of, interest in, and use of EVs. However, the literature shows differences in the gender gap for different case studies without recognizing a gender rule in mobility aspects [10,36,37].
The transition towards sustainable mobility can be described as “emergent outcomes of a dynamic system of interacting and co-evolving practices” [38]. The replication of practices, such as mobility habits, meets the daily needs of the individual and the group [11]. Indeed, mobility is a matter of integrating everyday life with the need to reproduce social practices, e.g., work or family life habits. When an EV does not meet daily needs, contrary to the current mobility practices using a conventional car, an individual does not have the propensity to choose an EV [4]. The socio-temporal rhythms of daily practices can affect the propensity to adopt innovation and the consequential uptake of EVs [11]. In order to investigate how mobility practices can change towards EV uptake, we need to understand current mobility practices and why they are relevant today within our society and social groups [10,11]. Thus, this study investigates why, how, and by whom private cars are used.
This part of the research is relevant to propose policy recommendations, based on awareness of relevant interactions among policies, social practices, and propensity to choose EVs [38], beyond dominant technologically and psychologically analytical approaches [4].

2.4. Neighbor Effect and Tourism as a Driver for Change

The Diffusion of Innovation Theory was developed in the 1960s by Rogers [5] to explain how innovations spread throughout society and how individuals adopt new ideas, products, or behavior. Diffusion of innovation in society takes place gradually, and in fact, Rogers identifies five different categories of individuals based on their propensity to adopt innovations [5]: innovators, early adopters, early majority, late majority, and laggards. In the framework of innovations, the diffusion and adoption of the so-called “neighbor effect” is embraced, which states that innovation adopters tend to cluster together, as potential innovation adopters discover, learn about, and lean towards innovations through others in their proximity [29]. Geographical and relational proximity to innovation adopters play a major role in the individual’s decision to do it as well. This is particularly relevant concerning vehicles as they are especially visible as innovations [12]. The diffusion of innovation theory has also been applied to so-called eco-innovations [39], which are products and processes that contribute to sustainable development [40], such as photovoltaic solar panels (PVs) or EVs. The so-called “neighbor effect” in the adoption of alternative fuel vehicles has been proven for family members, coworkers, and neighbors [12,29,30].
By making EVs more visible, tourists who drive EVs to reach their holiday destination could foster a norm change in local residents from conventional cars towards EVs [12,13]. As EV tourist drivers charge their EVs in their tourist destinations [41], tourism can therefore play a strategic role in promoting sustainable mobility by acting as an “accelerator of change” [42]. Despite Westin et al. [12] in their study hypothesizing that Swedish residents living along the Norwegian boarder may be exposed to Norwegian EVs tourists and that therefore their propensity to choose EVs would be affected by it, to our knowledge, so far, no study has investigated the role of tourism as a catalyst for EV adoption.

2.5. Physical Drivers for Change: Charging Infrastructure

Public charging infrastructure distribution is recognized by experts as being one of the most important non-fiscal incentives for initial EV diffusion in different countries with a relatively high share of electric vehicles in new vehicle sales [16,24]. Santos and Davies [16] showed that the majority of experts and stakeholders surveyed recognized charging infrastructures as a strong enabler for BEV and PHEV quick diffusion. As enhanced visibility of EVs affecting the individual’s decision to choose them has been proven, the same applies to charging infrastructure [12]. Hence, not only is the increase in charging points in the territory relevant but also their visibility becomes necessary. Scientific literature about the importance of the visibility of charging points is torn apart: on one hand, some studies found that the visible presence of charging points has a positive impact on the intention to purchase an EV, such as a study conducted in the US [43] and another carried out in Norway [12]; on the other hand, since many drivers charge their EVs at home or work, another Norwegian study highlighted that the difficulty to access charging infrastructure does not hinder EV adoption [44].

3. Material and Methods
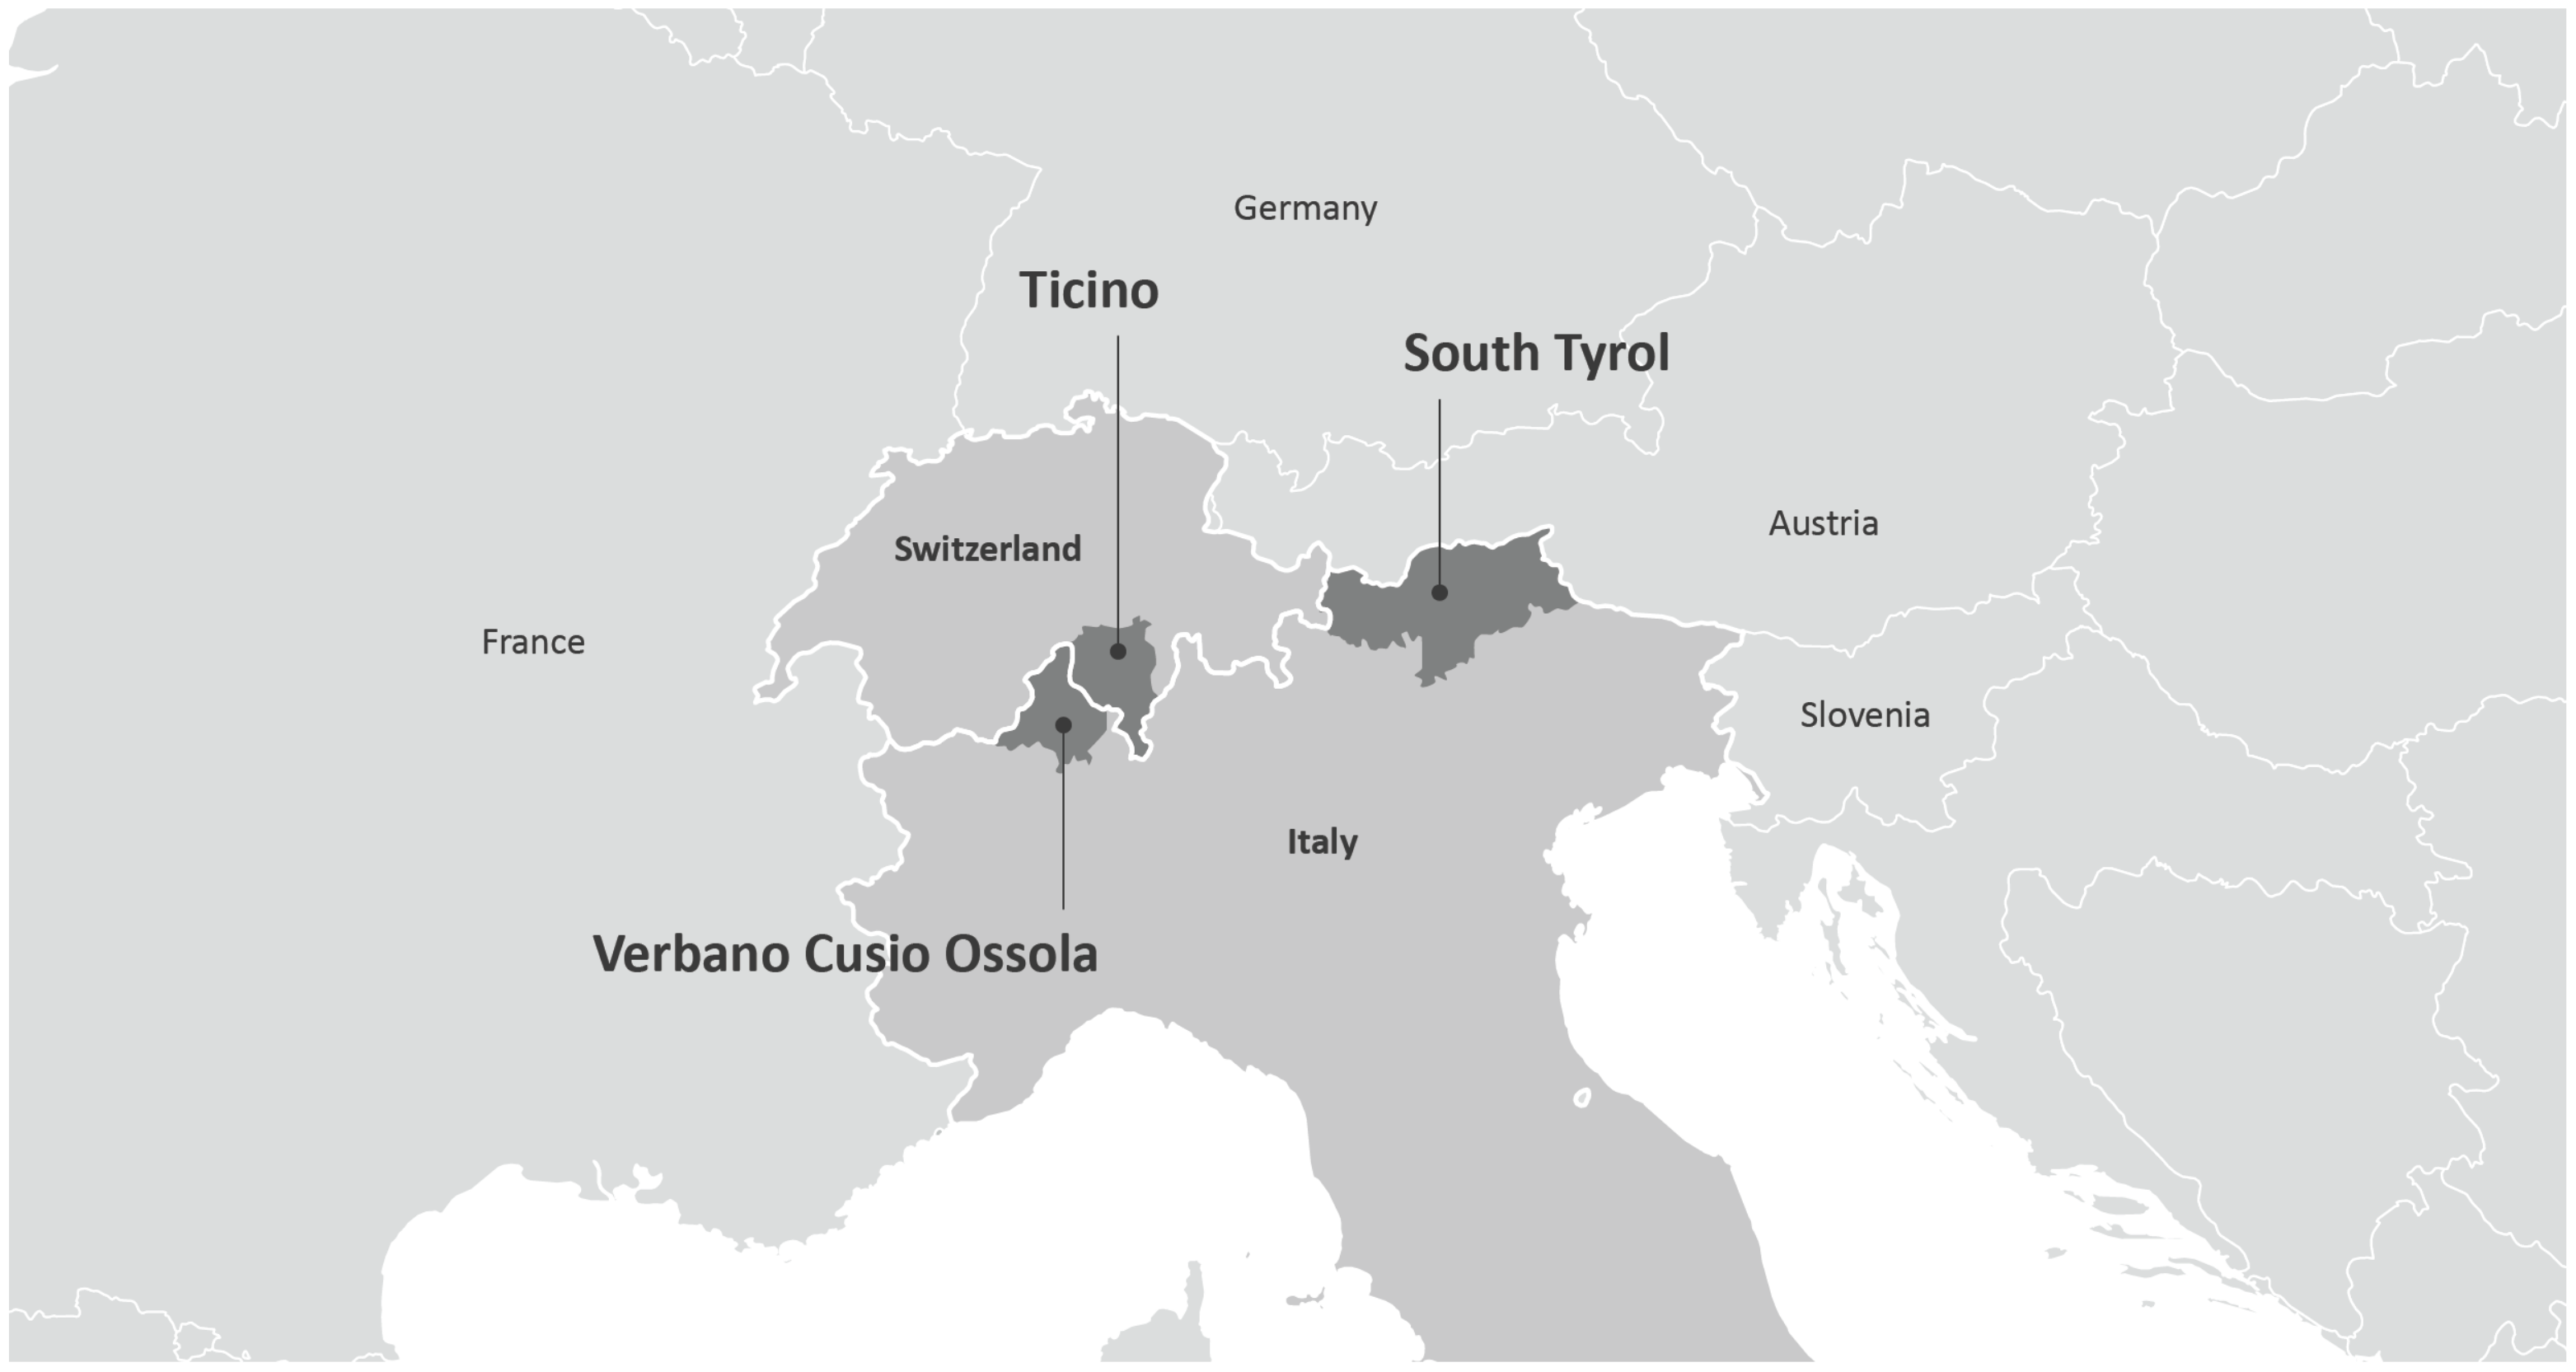
3.1. Study Areas

The three study areas selected for this work are shown in Figure 2: Canton Ticino in Switzerland, the autonomous province of South Tyrol (Italy), and the Italian province of Verbania-Cusio-Ossola. Canton Ticino is the southernmost canton of Switzerland, being the only Swiss canton completely located to the south of the Alps. In 2014, Canton Ticino was voted the most ecologic canton in Switzerland [45]. In 2018, 53% of energy consumption in Ticino was met using energy from renewable sources. In 2020, Canton Ticino won the Swiss prize “Goldenen Stecker 2019” that recognized the active commitment of the canton in favoring electromobility [26]. Additionally, the EV fleet figures (see Table 2) confirm the role of Ticino as a lead region.
The Province of South Tyrol is known as the “Green Region” of Italy for being at the forefront in its sustainable approach in multiple sectors [27] and for its sustainable energy mix [6]. In fact, 58% of its energy consumption is met through the use of energy from renewable sources (if transport demand is not taken into account) [6]. In South Tyrol, the regional government promoted EV purchases through direct incentives; moreover, it is committed to improving charging infrastructure and to offering test drives and tax reductions to citizens and companies [27]. Both South Tyrol and Canton Ticino have seen increases in their EV fleet in the last years [27]. All the former make South Tyrol suitable as an early adopter in this study.
The Province of Verbano-Cusio-Ossola (VCO) is the smallest of the three areas, with 160,000 inhabitants. There are no specific policies for EVs at the provincial level; incentive policies currently in place are those generally implemented at the national and regional levels. The Piedmont Region (where the Province of VCO is located) initiatives include car tax exemption for the first 5 years from the date of registration for hybrid vehicles (petrol/electric supply) with power equal to or less than 100 kW and contributions from €1000 to €10,000 for scrapping or converting to fuels other than diesel for commercial vehicles below 3.5 tons and those from 3.5 to 12 tons used for transport by micro, small, and medium-sized enterprises [46]. All these make VCO suitable as a laggard market in our study.

3.2. Questionnaire and Data Collection

The data used in this study were collected with a questionnaire survey administered by specialized interviewers who guaranteed the presence of German speakers in order to address the German linguistic minorities of South Tyrol in their mother tongue. Computer-Assisted Telephone Interviews (CATI) were conducted between the first and the last weeks of March 2020. The selected sample consisted of 1000 interviews subdivided within the three study areas proportionally to the distribution of resident populations among them: 500 in South Tyrol, 200 in VCO, and 300 in Ticino. The distribution of interviews within each area was planned according to tourist flows (figures from 2018 for each region), as Table 3 shows. The respondents’ contact information was extracted from public databases, such as telephone directories. The extraction, considering the stratified sampling, occurred randomly.
Given the size of the population, which we can define as infinite for the purpose of calculating statistical error, we can consider the sample representative of the totality of the three areas, with a sample error of ±3.10% (95% confidence level). The questionnaire comprised a maximum of 30 questions for non-EV owners and a maximum of 26 questions for EV owners, i.e., if the respondent activated all the filter questions with their answers. A German version was offered for the German-speaking minority in South Tyrol. The duration of the telephone interviews was on average around 10 min. The selection of items for the survey, i.e., variables for the models, was based on previous studies [4,10,11,12,29,30,47,48,49,50,51] and, to a minor extent, on the author’s considerations of further plausible predictors of individual propensity to change. Table 4 provides an overview of the variables included in the analysis and their reference in the literature.
As Table 4 shows, the questionnaire consisted of four sections: in the first one, there were questions about weekly mobility practices of interviewees; the second section gathered questions aimed at characterizing the vehicles owned by interviewees; the third focused on questions about EVs; and finally, the last one aimed to gather sociodemographic information about the respondents.

3.3. Statistical Model

As previously shown in the section that describes the questionnaire, different predictors of individual propensity to change were identified to be included in the statistical model. Such factors were shown to have a significant influence on the purchase of electric cars in scientific literature [4,10,11,12,29,30,47,48,49,50,51], and even though they were assessed alone, in this study, the authors decided to build a model that could study the phenomenon as a whole, that is, jointly evaluating all of the factors investigated. Thus, the model allows us to identify which factors influence propensity to change the most and which lose significance following the inclusion of further predictors.
The model created is a binary logistic regression in which the dependent variable, i.e., the propensity to change, is a dichotomous variable (yes/no) deriving from the question relating to the propensity to purchase an electric/plug-in car in the next 10 years. The questionnaire could be answered with four degrees of probability: “definitely yes”, “probably yes”, “probably no”, and “definitely no”. To dichotomize the dependent variable, the authors decided to indicate with 1 the individuals inclined to change (definitely and probably yes) and with 0 the non-inclined (definitely and probably no). We chose to apply a stated intention approach, i.e., the intention to purchase an EV and not the actual purchase, since the EV ownership rate in Southern Europe is still very low (Figure 1). The stated intention (or stated preference) approach is widely applied in research on EV uptake [31,54,55] due to the limited real-world data on actual EV purchase and ownership. The revealed preference approach should be preferred where possible [31]. The limitations of the stated intention approach are described in the Discussion section.
Among the independent variables, in addition to those investigated through the questionnaire (e.g., socioeconomic information, number of cars in the household, driving reasons, etc.), different figures were retrieved from external sources. Table 5 shows such variables.
The logistic model
P ( Y | X ) = e α + β X 1 + e α + β X
where α is the constant and β the coefficients.

4. Results

4.1. Sample Sociodemographic Statistics

The final sample of interviews amounted to 1000 individuals, divided into the three study areas as follows, cosistent with the total amount of residents and yearly tourist flows: 500 interviews were conducted in South Tyrol (of those, 113 were conducted in German), 300 were conducted in Canton Ticino, and 200 were conducted in Verbano-Cusio-Ossola. The interviews were administered to a sample equally divided by gender and age (See Table 6). In fact, 50% of interviewees were men and 50% women, the average age was 52 years old, and in general, the age classes were represented as follows: 24% of interviewee were in the age class 18–34, 25% were in the 35–50 age group, 25% were in the 51–65 age group, and 26% were over 65 years old. Concerning sociodemographic features, the sample was average/highly educated, with 80% being graduates, and the incidence of retirees was 33% of the entire sample due to the need to make the sample representative with an important share of individuals over 65 years old. The sample households, excluding South Tyrol where they are larger, were mainly composed of a maximum of 3 people. The average net income of households in our sample (see Table 7) was not representative because of the high proportion of non-respondents (34% in Italy and 37% in Canton Ticino). In CATI, research income data were obtained with difficulty.

4.2. Propensity to Buy an Electric Vehicle

The survey asked the interviewees about their propensity to buy an EV in the next 10 years. Only 5% said that they would buy one with certainty, while 32% would probably buy it, with a combined 37% propensity to adopt the innovation in the forthcoming years. This confirms a future trend similar to the Norwegian one, with a low EV uptake trend observed in 2017 [4] and which is in line with future global EV uptake scenarios [1]. Amongst the three regions, Canton Ticino has the highest combined propensity rate (39%). Moreover, for the age groups, an important cutoff between under and over 65 is determined: the propensity of respondents between 18–34 and 35–50 is 51%, which is much higher than the 12% for over 65s.
The survey also asked about the perceived barriers for future purchases of electric/plug-in vehicles, and they were identified by the sample as being current sales prices (37%), distrust of battery autonomy (27%), and reduced availability of charging stations near home (11%). Concerning battery autonomy, if we cross-check the answers given in the section about weekly driving habits, the duration of daily drives is in line with current battery autonomy of the electric/plug-in vehicles on the market. Moreover, an increment in the number of EV charging points is necessary in order to face the foreseen increase in EVs on the roads.

4.3. Charging Infrastructure

Not only the presence but also the visibility of the EV charging infrastructure by drivers has proven to be pivotal for the uptake of EVs [12]. The survey asked if the respondents noticed charging points on their daily routes. The answers show that, currently, the perceived presence is medium in the study areas, as half of the sample (52%) claims to see them on a daily journey in their car; reaches maximum in Canton Ticino (58%); and is at the minimum in Verbano-Cusio-Ossola (40%), which could be due to the different number of charging points installed in the regions (see Table 2).

4.4. The Model

The estimated model consists of sociodemographic characteristics, car use and ownership, EV experience, barriers, and charging infrastructure (see Table 4), all factors found relevant in other studies. The results of our study (see Table 8) show that age is a significant factor but, conversely, as expected and in contrast with the results of other similar studies [10,12], is in fact a negative element. That is, in our model with increasing age, the propensity to choose an EV decreases.
Among the demographic variables, the results of our model show a positive relationship between the level of education and EV adoption, as already found in previous studies [12]. Additionally, the presence of children in the household [10] enhances the propensity to choose an EV, especially if their age is between 12 and 18 years old. In this case, we can hypothesize that it is likely that parents, foreseeing the purchase of a second car as their children are about to get their driving licence, consider the introduction of a BEV/PHEV in the “family fleet”, as there is still enough time for the expansion of this market and for vehicles to improve. In the case of children under 12 or over 18, however, the choice could be seen either as too distant or too imminent to invest in an EV.
The number of cars in the household also has a positive impact on the individual propensity to choose an EV; in fact, as the number of cars owned by the family members increases, regardless of the type of fuel supply, the intention to purchase an EV is stronger. This result suggests that the choice to purchase an EV occurs not for the first and principal car of the household, but for the secondary one.
In the survey on driving times, company and reasons were investigated [4,11]. The first variable was not significant to the model, while both usually driving alone as well as with company have positive impacts on the propensity to purchase an EV. Concerning driving purposes (i.e., the activities that the car is used for), the results demonstrate that the use of cars for long and leisurely journeys, such as reaching holiday destinations, increases the probability of purchasing an EV, while the use of the car for daily activities and, therefore, for short journeys causes a decrease in the propensity to choose an EV. It can therefore be assumed that the use of the car limited to daily activities in the surrounding area does not encourage investment in a new EV. Interestingly, among the different driving reasons proposed in the survey, only the reason “to relax” resulted as independent (chi-square test) from the propensity to purchase an EV, in contrast to other studies focused on Northern Europe countries [4]. Indeed, this contradicts the results of a research carried out in Denmark in 2017 investigating the still low local EV-uptake rate [4]. In that case, the reason “to relax” was one of the main factors explaining the decisions not to choose an EV.
Experience with EVs [47], especially as a passenger, also influences the propensity to change to electric mobility. The significance of both experiences as a driver and as a passenger was tested in the model, but the first was not significant, perhaps due to the low answer frequency obtained (4.3% with experience as a driver and 16% as a passenger). In the model, the assessment given to the experience as a passenger in an EV was included (evaluated in the survey on a Likert scale from 1 to 10) and it emerged that, as satisfaction increases, the propensity to purchase an EV also increases.
Analyzing the main limits of EVs, it can be seen that the propensity to choose an EV is greater for individuals who consider the costs, battery autonomy, or the availability of charging infrastructures (near the home, along the travel routes, or in parking lots) as the most critical current barriers for the uptake of EVs. In particular, those who believe that the limited availability of charging infrastructure is the main limit today are also the individuals with the greatest propensity to buy an EV. It can therefore be assumed that the interviewed sample believes that the three barriers identified will be easily overcome in the next 10 years: the purchase costs will decrease, battery autonomy will improve further, and the number of charging points will be suitable for the number of EVs on the roads.
The availability of a charging infrastructure is a factor that appears several times within the model, not only as a current barrier for EV uptake. In fact, it can be noted that the variables “Influence of the greater diffusion of charging infrastructures on the uptake of EVs in the next 10 years” and “Perceived presence of charging points along the daily route” are also significant, confirming that both social practices and physical infrastructures are relevant in promoting EV uptake [11]. The first variable evaluates how influential an individual considers the increment of charging infrastructure for the diffusion of BEVs/PHEVs (evaluation on a Likert scale from 1 to 5), and it can be deduced that, the greater the degree of influence measured, the greater the propensity to choose an EV. The second variable, on the other hand, detects whether the charging infrastructure is present or more visible and is noticed along the path usually travelled. In this case, in the survey, three possible answers were available: “yes”, “no”, and “I don’t know/I didn’t notice”. To insert this variable into the model, we decided to transform it into a dichotomy: 1 = “yes”, and 0 = “no” or “I don’t know/I didn’t notice”. The results show that, in this case, the variable also positively affects the propensity to purchase an EV; therefore, the presence and visibility of a charging infrastructure has been proven to be a relevant factor in future development of the EV market.
The last significant variable analyzed in the model is the temporal forecast for EV uptake. From the results, it emerges that the propensity for EV adoption decreases with increasing time, within which we expect to see almost only BEVs/PHEVs on the roads in the area of residence. This easily suggests that, the more likely an individual feels that EVs will soon be adopted by society, the more likely he or she is to embrace it. In this way, an individual observes social dynamics and the main mobility practices recognized as prominent within society [10,11].
Other variables, beyond the ones finally inserted into the model, were tested to assess their significance and the dependency relationship with other variables. One of the objectives of this study was to evaluate whether tourism [12] played a role in affecting the intention of residents from tourist regions to choose EVs. This variable tested in our model was not significant. The reasons can be manifold, but the answers to our survey highlight that there is very little knowledge of tourists with BEVs/PHEVs (only one interviewee in the total sample) and that, on average, it is believed that tourism does not have a great impact on the presence of EVs in the study areas (average: 2.40 out of 5). Since the data about a possible neighbor effect of tourism retrieved through the survey was not significant, we tested the tourism effect through official data related to the tourist flow of the municipality of residence (data relating to arrivals in 2018). This allowed us to assess whether locations with greater tourist flows were more likely to adopt innovation, and tourism emerged as not significant in predicting this. We can therefore state that, at the moment, tourism, also due to the scarce diffusion of BEV/PHEV, has no dependency relationship with the propensity of the residents of tourist areas to purchase an EV.
Another variable that surprisingly, and in contrast with what was already discovered in former studies, showed that the variable of gender was not significance in our model. By carrying out a chi-squared test to verify the independence of the two variables, the results show (see Table 9) that there is no relationship of dependence between gender and propensity to purchase an EV. The same test was also performed to check whether there was any relationship between the area of residence (South Tyrol, Canton Ticino, and Verbano Cusio Ossola) and the propensity to change (see Table 10). Additionally, in this case, the results show independence between the variables.
Finally, the last two factors that were believed to be significant in the construction of the model, based on the literature review, are knowledge of people owning BEVs/PHEVs, the so-called neighbor effect [12,29,30], and the presence of EV purchase incentives [30]. As the test results show, in both cases, there is a dependency relationship between the propensity to purchase an EV and knowledge, both of people (see Table 11) and incentives (see Table 12). It can therefore be deduced that the relationship between the variables is explained by other factors in the two models proposed above, following the introduction of other information to the model itself.
For the first variable in particular, a logistic regression model was developed (see Table 13), which can explain the relationship between the degree of knowledge and the propensity to purchase an EV. In this case, it can be said that the propensity to purchase an EV is greater if people in their close friends circles have already made this choice. In relation to tourists and relatives, however, this was not significant in the model.

5. Discussion

The results of our study have been, to some extent, consistent with existing literature on the topic but have also contributed to the existing knowledge by adding some insightful considerations. In fact, even if scientific literature often confirms that young people prefer to walk and that old people prefer to own a private car to move around [10], in this study, young people are the most inclined to buy an EV, probably due to the daily needs of their social life. Indeed, the two age groups have different social dynamics within the family and different daily practices linked to family, work, and free time [10]. The greater propensity of young people to purchase an EV may also be due to their greater sensitivity to environmental sustainability compared to the elderly [56,57]. This greater attention to the environment is also evident from the use of conventional bikes as a mean of transport: daily bike use entails a greater propensity to purchase EVs, confirming that pro-environmental choices can lead to other environmentally friendly behavior [56]. While practices concerning free time and holidays seem to support the propensity to buy an EV in the study areas, new means of transportation do not seem to be able to answer daily mobility needs. Concerning the perceived present barriers to future EV purchase in our study’s sample, primarily sales prices and battery autonomy, the IEA foresees that the number of EV purchases will increase in the next few years also thanks to fiscal incentives and other complementary measures [17] that would lessen the economic burden of purchasing an EV. Moreover, to overcome mistrust towards EV battery autonomy, both information campaigns on battery autonomy and important investments in charging infrastructures are needed [17]. However, EV recharging is time-consuming and further research should investigate if recharging time is in line with daily habits [4]. More generally, from our study, the broader issue of charging infrastructure—not only the charging time but also the location, number, and visibility of the charging points—emerges as pivotal concern and should be further explored. In any case, the results of our study point out that the interviewed sample considers that such barriers will be overcome within the next 10 years. The message coming from fiscal and non-fiscal incentives either from national or local policymakers has positively reached the targeted population. Future research should also further explore the potential neighbor effect that tourism may have. Our study was not able to verify this, probably limited by the fact that tourists driving EVs visiting the study areas are still too few. Moreover, another possible explanation for the lack of a neighbor effect of tourists over residents could be that the ties between tourists and residents could be too weak [29].
Some questions remain unanswered. In this direction, some limitations of our study should be pointed out. Firstly, as mentioned in Section 3, the outcome variable for our model was stated as the intention to purchase an EV and is not actual choice. Hence, there could be potential biases in responses, since the stated intention could not match actual purchases, leading to a gap between stated and actual purchase, the so-called hypothetical bias [31,54,55]. This limitation potentially undermines the results in forecasting EV uptake in the case study regions [31]. Nonetheless, since EV uptake rates in Southern Europe are still low, this study could not use figures about actual ownership of EVs, and the use of stated preference surveys is an approach widely used to overcome the limited existence of actual EV purchase data [31,55]. Secondly, it was not possible to assess the impact of wealth, the household net income in our study on the propensity to adopt low-carbon innovations due to the sensitivity of the information itself, which is difficult to retrieve through surveys, as was the case in our study. Nonetheless, future research should address the issue of access to low-carbon innovations, in terms of ownership, to guarantee the inclusion of all end users in the energy transition, including vulnerable and marginalized users, adopting the lens of energy justice [9]. Moreover, our study combines BEVs and PHEVs together as they both represent attractive technological alternatives to conventionally fuelled vehicles and their equal cumulative presence is still very limited in the case study areas of this study. However, they are characterized by different features, the impact of which on owner behaviors and perceived barriers of each technology varies (e.g., range anxiety is limited for PHEVs as the driver can switch to fuel if the vehicle runs out of charge). Finally, we acknowledge that the individual decision to purchase an EV is influenced not only by the factors used in our model but also by others, e.g., environmental beliefs and values [50,58,59]. We indirectly recognized the role of these latter factors using the level of education and age as a proxy for them.
The results of our study confirm that both social practices and physical infrastructure play major roles in EV uptake and should therefore be taken into consideration for policy making.

6. Conclusions

The results of this study highlight, on the one hand, the still limited penetration of BEVs/PHEVs in the three study areas—only 0.5% of our sample in fact owns an EV—and, on the other hand, that strong barriers to purchase currently still exist, determined in particular by the high prices of EVs, doubts about battery autonomy, and the limited presence of charging points in the territory. The three study areas widely differ in the diffusion of EV technology and related infrastructure. In fact, our study confirms that VCO is the territory where residents mostly use private cars for weekly trips, with very low rates for public transport and bicycle use. It is also the area with more vehicles per family unit, and more recently bought and new (not used) vehicles compared to South Tyrol and Canton Ticino. The VCO is therefore a province where residents have a preference towards conventional cars. A lack of interest in electric vehicles is primarily due to the current cost of this technology and, more interestingly, due to the scarce availability of charging infrastructures. These results confirm that VCO is an EV laggard market in our investigation. Canton of Ticino is the most advanced region present in terms of EV development. It is in fact the area with the lowest private car ownership rate and with the highest percentage of people who travel during the week using public transport. Interestingly, it is the territory with the lowest penetration of electric bikes but the greatest possession of BEV/PHEV among the three areas. In fact, compared to the other two territories, the purchase cost is not perceived as such a widespread problem and the availability of recharging points is not thought of as a problem for residents. It is also the area with the highest declared propensity to purchase electric cars. All these confirm the role of Canton Ticino as a leading region in this study. Finally, South Tyrol ranks intermediately compared to the other two territories regarding the diffusion of EVs and related services. Residents in South Tyrol use public transport and conventional bikes more on weekdays than those residing in VCO and Canton Ticino. The possession of electric bikes is also more widespread, the number of cars owned per family unit is smaller, and the car fleet is older than in the VCO and Ticino. The perceived presence of charging points for electric cars reflects a widespread installation that has been developed in recent years in South Tyrol.
Looking to the future, the stated propensity to purchase an EV in the next 10 years is generally high, which is consistent with the future scenarios of EV uptake. Such an uptake will however depend on endeavors to enhance charging infrastructure and on the reduction of purchase costs. As support to the descriptive statistic results, the model, developed to predict which are the most relevant factors influencing the propensity to purchase an EV, suggests that the demographic profile of individuals most likely to choose an EV is as follows: young people with a high level of education, with at least one child between 12 and 18 years old, and with more than one car per household or often making long journeys. The regression model also confirms that the driving reasons linked to daily activities and habits affect the propensity to choose and EV, hence confirming H2 proposed in the Introduction. Therefore, the sociodemographic characteristics positively affecting the propensity of EV purchase are young age, high education level, and presence of youth among the household components. This confirms H1. The importance of both the presence and visibility of charging infrastructure stated in the literature is confirmed by this study, confirming also H4. The daily practices and user mobility needs as well as physical infrastructures are relevant in explaining the propensity to buy an EV and the consequent uptake of this innovation. This research is an attempt to define the relationship between the propensity to buy an EV, sociodemographic characteristics, social dynamics, and current mobility practices. These results support the hypothesis that the practices and lifestyles of the young people profiled as explained above increase the propensity to buy EVs and promote the uptake of sustainable mobility. From further investigation, the tourist flows of EV drivers in the study areas at the moment would not provide any type of influence for residents in the purchase of such cars. Thus, H3 was not confirmed.
Finally, this study proposes some insights into the specific Alpine regional context. The results can inform on mobility strategy and planning within the Alpine region, in particular, Swiss Canton Ticino, and the Italian Provinces of South Tyrol and Verbano-Cusio-Ossola.

Author Contributions

Conceptualization of the work, S.T. and J.B.; methodology, S.T., J.B. and M.D.C.; investigation, C.P.; formal analysis, C.P., M.D.C., S.T. and J.B.; project administration, A.Z.; funding acquisition, A.Z.; writing—original draft preparation, S.T., J.B. and A.Z.; writing—review and editing, all authors; coordination of inputs and revision, S.T. All authors have read and agreed to the published version of the manuscript.

Funding

This operation was cofinanced by the European Union, European Regional Development Fund, and by National Funds of Italy, Swiss Confederation, and the Cantons as part of the Interreg V-A Italy-Switzerland Cooperation Program. The European Fund for Regional Development is not liable for any use that may be made of the information contained in this document, which merely represents the authors’ view.

Conflicts of Interest

The authors declare no conflict of interest.

References

  1. Teter, J.; Le Feuvre, P.; Gorner, M.; Scheffer, S. Tracking Transport 2019; IEA: Paris, France, 2019. [Google Scholar]
  2. Hopkins, D.; Higham, J. Transitioning to Low Carbon Mobility. In Low Carbon Mobility Transitions; Goodfellow Publishers: Oxford, UK, 2016; p. 1. [Google Scholar]
  3. European Commission. Communication from the Commission to the European Parliament, the European Council, the Council, the European Economic and Social Committee and the the Committee of the Regions. The European Green Deal; European Commission: Brussels, Belgium, 2019. [Google Scholar]
  4. Friis, F. An alternative explanation of the persistent low EV-uptake: The need for interventions in current norms of mobility demand. J. Transp. Geogr. 2020, 83, 102635. [Google Scholar]
  5. Rogers, E.M. Diffusion of Innovations; Simon and Schuster: New York, NY, USA, 2010. [Google Scholar]
  6. Tomasi, S.; Garegnani, G.; Scaramuzzino, C.; Sparber, W.; Vettorato, D.; Meyer, M.; Santa, U.; Bisello, A. EUSALP, a model region for smart energy transition: Setting the baseline. In New Metropolitan Perspectives; Springer: Cham, Switzerland, 2018; pp. 132–141. [Google Scholar]
  7. Skrúcanỳ, T.; Kendra, M.; Stopka, O.; Milojević, S.; Figlus, T.; Csiszár, C. Impact of the electric mobility implementation on the greenhouse gases production in central European countries. Sustainability 2019, 11, 4948. [Google Scholar] [CrossRef] [Green Version]
  8. Schäuble, J.; Jochem, P.; Fichtner, W. Cross-Border Mobility for Electric Vehicles: Selected Results from One of the First Cross-Border Field Tests in Europe; KIT Scientific Publishing: Karlsruhe, Germany, 2016. [Google Scholar]
  9. Sovacool, B.K.; Lipson, M.M.; Chard, R. Temporality, vulnerability, and energy justice in household low carbon innovations. Energy Policy 2019, 128, 495–504. [Google Scholar] [CrossRef]
  10. Sovacool, B.K.; Kester, J.; Noel, L.; de Rubens, G.Z. The demographics of decarbonizing transport: The influence of gender, education, occupation, age, and household size on electric mobility preferences in the Nordic region. Glob. Environ. Chang. 2018, 52, 86–100. [Google Scholar]
  11. Shove, E. Rushing around: Coordination, Mobility and Inequality; Department for Transport: London, UK, 2002. [Google Scholar]
  12. Westin, K.; Jansson, J.; Nordlund, A. The importance of socio-demographic characteristics, geographic setting, and attitudes for adoption of electric vehicles in Sweden. Travel Behav. Soc. 2018, 13, 118–127. [Google Scholar] [CrossRef]
  13. Eijgelaar, E.; Peeters, P. Zero Emission Tourism Mobility: A Research and Policy Agenda; Breda University of Applied Sciences: Breda, The Netherlands, 2018. [Google Scholar]
  14. Egnér, F.; Trosvik, L. Electric vehicle adoption in Sweden and the impact of local policy instruments. Energy Policy 2018, 121, 584–596. [Google Scholar] [CrossRef] [Green Version]
  15. European Automobile Manufacturers Association. Electric Vehicles: Tax Benefits & Incentives in the EU. 2020. Available online: https://www.acea.be/publications/article/overview-of-incentives-for-buying-electric-vehicles (accessed on 8 February 2021).
  16. Santos, G.; Davies, H. Incentives for quick penetration of electric vehicles in five European countries: Perceptions from experts and stakeholders. Transp. Res. Part A Policy Pract. 2020, 137, 326–342. [Google Scholar] [CrossRef]
  17. Teter, J.; Le Feuvre, P.; Gorner, M.; Scheffer, S. Tracking Transport 2019, Electric Vehicles; IEA: Paris, France, 2019. [Google Scholar]
  18. Adenaw, L.; Lienkamp, M. Multi-Criteria, Co-Evolutionary Charging Behavior: An Agent-Based Simulation of Urban Electromobility. World Electr. Veh. J. 2021, 12, 18. [Google Scholar] [CrossRef]
  19. Melton, N.; Axsen, J.; Moawad, B. Which plug-in electric vehicle policies are best? A multi-criteria evaluation framework applied to Canada. Energy Res. Soc. Sci. 2020, 64, 101411. [Google Scholar] [CrossRef]
  20. Contestabile, M.; Alajaji, M.; Almubarak, B. Will current electric vehicle policy lead to cost-effective electrification of passenger car transport? Energy Policy 2017, 110, 20–30. [Google Scholar]
  21. Bonges, H.A.; Lusk, A.C. Addressing electric vehicle (EV) sales and range anxiety through parking layout, policy and regulation. Transp. Res. Part A Policy Pract. 2016, 83, 63–73. [Google Scholar] [CrossRef] [Green Version]
  22. Gnann, T.; Plötz, P.; Kühn, A.; Wietschel, M. Modelling market diffusion of electric vehicles with real world driving data–German market and policy options. Transp. Res. Part A Policy Pract. 2015, 77, 95–112. [Google Scholar] [CrossRef] [Green Version]
  23. Held, T.; Gerrits, L. On the road to electrification–A qualitative comparative analysis of urban e-mobility policies in 15 European cities. Transp. Policy 2019, 81, 12–23. [Google Scholar] [CrossRef]
  24. Sierzchula, W.; Bakker, S.; Maat, K.; Van Wee, B. The influence of financial incentives and other socio-economic factors on electric vehicle adoption. Energy Policy 2014, 68, 183–194. [Google Scholar] [CrossRef]
  25. Zubaryeva, A.; Thiel, C.; Barbone, E.; Mercier, A. Assessing factors for the identification of potential lead markets for electrified vehicles in Europe: Expert opinion elicitation. Technol. Forecast. Soc. Chang. 2012, 79, 1622–1637. [Google Scholar] [CrossRef]
  26. Grotto, A.; Zubaryeva, A.; Simão, J.V.; Cellina, F. Report on State-of-the-Art of Electric and Autonomous Mobility Policies and Business Models; European Union: Brussels, Belgium, 2020. [Google Scholar]
  27. DellaValle, N.; Zubaryeva, A. Can we hope for a collective shift in electric vehicle adoption? Testing salience and norm-based interventions in South Tyrol, Italy. Energy Res. Soc. Sci. 2019, 55, 46–61. [Google Scholar] [CrossRef]
  28. Zubaryeva, A.; Thiel, C.; Zaccarelli, N.; Barbone, E.; Mercier, A. Spatial multi-criteria assessment of potential lead markets for electrified vehicles in Europe. Transp. Res. Part A Policy Pract. 2012, 46, 1477–1489. [Google Scholar] [CrossRef]
  29. Jansson, J.; Pettersson, T.; Mannberg, A.; Brännlund, R.; Lindgren, U. Adoption of alternative fuel vehicles: Influence from neighbors, family and coworkers. Transp. Res. Part D Transp. Environ. 2017, 54, 61–73. [Google Scholar] [CrossRef]
  30. Zhu, X.; Liu, C. Investigating the neighborhood effect on hybrid vehicle adoption. Transp. Res. Rec. 2013, 2385, 37–44. [Google Scholar] [CrossRef]
  31. Coffman, M.; Bernstein, P.; Wee, S. Electric vehicles revisited: A review of factors that affect adoption. Transp. Rev. 2017, 37, 79–93. [Google Scholar] [CrossRef]
  32. Beise, M.; Rennings, K. Lead markets and regulation: A framework for analyzing the international diffusion of environmental innovations. Ecol. Econ. 2005, 52, 5–17. [Google Scholar] [CrossRef]
  33. Omahne, V.; Knez, M.; Obrecht, M. Social Aspects of Electric Vehicles Research—Trends and Relations to Sustainable Development Goals. World Electr. Veh. J. 2021, 12, 15. [Google Scholar] [CrossRef]
  34. Geels, F.W.; Schwanen, T.; Sorrell, S.; Jenkins, K.; Sovacool, B.K. Reducing energy demand through low carbon innovation: A sociotechnical transitions perspective and thirteen research debates. Energy Res. Soc. Sci. 2018, 40, 23–35. [Google Scholar] [CrossRef]
  35. Outcault, S.; Sanguinetti, A.; Pritoni, M. Using social dynamics to explain uptake in energy saving measures: Lessons from space conditioning interventions in Japan and California. Energy Res. Soc. Sci. 2018, 45, 276–286. [Google Scholar] [CrossRef] [Green Version]
  36. Fan, Y. Household structure and gender differences in travel time: Spouse/partner presence, parenthood, and breadwinner status. Transportation 2017, 44, 271–291. [Google Scholar] [CrossRef]
  37. Solá, A.G. Constructing work travel inequalities: The role of household gender contracts. J. Transp. Geogr. 2016, 53, 32–40. [Google Scholar] [CrossRef]
  38. Shove, E.; Walker, G. Governing transitions in the sustainability of everyday life. Res. Policy 2010, 39, 471–476. [Google Scholar] [CrossRef]
  39. Van der Kam, M.; Meelen, A.; Van Sark, W.; Alkemade, F. Diffusion of solar photovoltaic systems and electric vehicles among Dutch consumers: Implications for the energy transition. Energy Res. Soc. Sci. 2018, 46, 68–85. [Google Scholar] [CrossRef]
  40. Díaz-García, C.; González-Moreno, Á.; Sáez-Martínez, F.J. Eco-innovation: Insights from a literature review. Innovation 2015, 17, 6–23. [Google Scholar] [CrossRef]
  41. Schmidt, M.; Staudt, P.; Weinhardt, C. Evaluating the importance and impact of user behavior on public destination charging of electric vehicles. Appl. Energy 2020, 258, 114061. [Google Scholar] [CrossRef]
  42. La Rocca, R.A. Tourism and mobility. Best practices and conditions to improve urban livability. TeMA J. Land Use Mobil. Environ. 2015, 8, 311–330. [Google Scholar]
  43. Carley, S.; Krause, R.M.; Lane, B.W.; Graham, J.D. Intent to purchase a plug-in electric vehicle: A survey of early impressions in large US cites. Transp. Res. Part D Transp. Environ. 2013, 18, 39–45. [Google Scholar] [CrossRef]
  44. Hannisdahl, O.H.; Malvik, H.V.; Wensaas, G.B. The future is electric! The EV revolution in Norway—Explanations and lessons learned. In Proceedings of the 2013 World Electric Vehicle Symposium and Exhibition (EVS27), Barcelona, Spain, 17–20 November 2013; pp. 1–13. [Google Scholar]
  45. Isetti, G.; Corradini, P.; Gruber, M.; Della Valle, N.; Zubaryeva, A. Culture building and territorial development: Come preparare un territorio alla rivoluzione “disruptive” dell’e-mobility; Eurac Research: Bolzano, Italy, 2018. [Google Scholar]
  46. Gabba, G.; Zubaryeva, A.; Testa, G. Inventory of Best Practices by Region; Mobster Project; European Union: Brussels, Belgium, 2020. [Google Scholar]
  47. Degirmenci, K.; Breitner, M.H. Consumer purchase intentions for electric vehicles: Is green more important than price and range? Transp. Res. Part D Transp. Environ. 2017, 51, 250–260. [Google Scholar] [CrossRef] [Green Version]
  48. Bigerna, S.; Micheli, S.; Polinori, P. Willingness to pay for electric boats in a protected area in Italy: A sustainable tourism perspective. J. Clean. Prod. 2019, 224, 603–613. [Google Scholar] [CrossRef]
  49. Simsekoglu, Ö. Socio-demographic characteristics, psychological factors and knowledge related to electric car use: A comparison between electric and conventional car drivers. Transp. Policy 2018, 72, 180–186. [Google Scholar] [CrossRef]
  50. Egbue, O.; Long, S. Barriers to widespread adoption of electric vehicles: An analysis of consumer attitudes and perceptions. Energy Policy 2012, 48, 717–729. [Google Scholar] [CrossRef]
  51. Schuitema, G.; Anable, J.; Skippon, S.; Kinnear, N. The role of instrumental, hedonic and symbolic attributes in the intention to adopt electric vehicles. Transp. Res. Part A Policy Pract. 2013, 48, 39–49. [Google Scholar] [CrossRef]
  52. Lane, B.; Potter, S. The adoption of cleaner vehicles in the UK: Exploring the consumer attitude–action gap. J. Clean. Prod. 2007, 15, 1085–1092. [Google Scholar] [CrossRef]
  53. Rezvani, Z.; Jansson, J.; Bodin, J. Advances in consumer electric vehicle adoption research: A review and research agenda. Transp. Res. Part D Transp. Environ. 2015, 34, 122–136. [Google Scholar] [CrossRef] [Green Version]
  54. Smith, B.; Olaru, D.; Jabeen, F.; Greaves, S. Electric vehicles adoption: Environmental enthusiast bias in discrete choice models. Transp. Res. Part D Transp. Environ. 2017, 51, 290–303. [Google Scholar] [CrossRef]
  55. Jia, W.; Chen, T.D. Are Individuals’ stated preferences for electric vehicles (EVs) consistent with real-world EV ownership patterns? Transp. Res. Part D Transp. Environ. 2021, 93, 102728. [Google Scholar] [CrossRef]
  56. Isetti, G.; Ferraretto, V.; Stawinoga, A.E.; Gruber, M.; DellaValle, N. Is caring about the environment enough for sustainable mobility? An exploratory case study from South Tyrol (Italy). Transp. Res. Interdiscip. Perspect. 2020, 6, 100148. [Google Scholar] [CrossRef]
  57. Hidrue, M.K.; Parsons, G.R.; Kempton, W.; Gardner, M.P. Willingness to pay for electric vehicles and their attributes. Resour. Energy Econ. 2011, 33, 686–705. [Google Scholar] [CrossRef] [Green Version]
  58. Hasan, S.; Simsekoglu, Ö. The role of psychological factors on vehicle kilometer travelled (VKT) for battery electric vehicle (BEV) users. Res. Transp. Econ. 2020, 82, 100880. [Google Scholar] [CrossRef]
  59. Zhang, X.; Bai, X.; Shang, J. Is subsidized electric vehicles adoption sustainable: Consumers’ perceptions and motivation toward incentive policies, environmental benefits, and risks. J. Clean. Prod. 2018, 192, 71–79. [Google Scholar] [CrossRef]
Figure 1. EV registration trends for 2016–2019 in Alpine cross-border countries. Source: ACEA, Alternative fuel vehicle registrations and Consolidated Registrations By Country.
Sustainability 13 04583 g001
Figure 2. Map of study areas highlighting the three regions examined in this study.
Sustainability 13 04583 g002
Table 1. Composition of EV registration in Alpine cross-border countries from 2016 to 2019.
% of BEVs% of PHEVs
20162017201820192016201720182019
AUSTRIA76%76%75%81%24%24%25%19%
FRANCE75%68%68%70%25%32%32%30%
GERMANY45%46%54%58%55%54%46%42%
ITALY51%43%51%62%49%57%49%38%
SWITZERLAND54%58%54%75%46%42%46%25%
Table 2. Fleet figures in the study areas.
RegionSouth TyrolVCOTicino
Population
(in thousands)
533160353
Total private vehicles fleet
(in thousands)
497105223
Number of private vehicles
(per thousand inhabitants)
931653632
Total EV fleet
(in thousands)
10.51
Number of charging points2736199
Number of EV
(per charging point)
3.80.015.3
Table 3. Composition of the sample, based on population and tourist flow figures.
PopulationInterviewsTouristic FlowInterviews
N.%N.%N.%N.%
South Tyrol531,17850.8%50050%7,519,786100%500100%
- Bassa Atesina + Salto-Sciliar + Bolzano 2,075,70827%13527%
- Burgraviato + Val Venosta 2,090,05328%14028%
- Val Pusteria 2,178,83629%14529%
- Alta Valle Isarco + Valle Isarco 1,175,18916%8016%
Verbano-Cusio-Ossola159,66415.3%20020%3,079,681100%200100%
- Lake municipalities 2,741,22070%14070%
- Mountain municipalities 338,46130%6030%
Ticino354,37533.9%30030%1,098,200100%300100%
- Bellinzona, Alto Ticino +Lago Maggiore, Valli 551,57350%15150%
- Lago di Lugano + Mendrisiotto 546,62750%14950%
Table 4. Sections of the survey and variables included in the analysis, with reference to the literature.
SectionVariableDescriptionVariable TypeReference
Car useMeans of transportHow the interviewee travels during
the week and on weekends/holiday
Categorical,
multiple choice
[10,11,38,49]
Weekly driving timeHow much time the interviewee
spends in the car in a day,
on average, during the
week and on
weekends/holidays
Categorical[4,11]
Weekly driving companyWith whom the interviewee
travels during the week and
on weekends/holiday
Categorical,
multiple choice
[4,11]
Weekly driving reasonsActivities the interviewee
uses your car for
Categorical,
multiple choice
[4,11]
Vehicle ownershipNumber of vehiclesNumber of vehicles ownedDescrete[12,30,49]
Type of carPower supply of the vehicleCategorical
Last car purchaseLast purchase of a vehicle
by the household
Categorical
Electric vehiclesNeighbor effectKnowledge of people who
own an EV,
and type of relationship
Categorical[12,29,30]
Driving experienceExperience as driver of EVCategorical[10,47]
Policy incentivesAwareness of the possibility of
obtaining economic incentives for
the purchase of an EV
Categorical[12,30,52]
Propensity to buy/
Purchase intention
Propensity to buy an EV
in the next 10 years
Categorical[10,47,50]
Barriers to purchaseCurrent the main limitation of EVsCategorical[30,47,50,53]
Charging infrastructurePresence of charging
infrastructure in the usual route
Categorical[12]
Sociodemo graphicsGender Categorical[10,12,29,30,36,37]
Age Categorical[10,12,29,30]
EducationHighest education level obtainedCategorical[12,29,30,34]
JobOccupationCategorical[10,12]
Family size
and composition
Number and age
of household components
Descrete and
categorical
[10,30]
IncomeHousehold net monthly incomeCategorical[12,29,30]
Residential areaMunicipalityCategorical[12]
Table 5. Additional predictors and their sources.
VariableSource
Population per municipalityItaly: ISTAT
Switzerland: USTAT
Annual tourist flow per municipalitySouth Tyrol: ASTAT
VCO: Osservatorio sul turismo
Canton Ticino: USTAT
Size of municipality in km2Italy: ISTAT
Switzerland: USTAT
Number of EV charging pointsOwn calculation
Table 6. Overview of sociodemographic characteristics of the sample.
South TyrolTicinoVCOTotal
N.%N.%N.%N.%
GenderFemale23547.0%16053.3%10653.0%50150.1%
Male26553.0%14046.7%9447.0%49949.9%
Age18–3411222.4%7826.0%5326.5%24324.3%
35–5012925.8%7324.3%4723.5%24924.9%
51–6513026.0%7123.7%5025.0%25125.1%
>6512925.8%7826.0%5025.0%25725.7%
Education
level
Primary or Lower
Secondary School
6412.8%4715.7%3216.0%14314.3%
Professional Institute/
Apprenticeship
214.2%3210.7%31.5%565.6%
Upper Secondary School27855.6%15752.3%13065.0%56556.5%
Bachelor’s Degree234.6%82.7%42.0%353.5%
Master’s Degree8717.4%299.7%157.5%13113.1%
Bachelor’s + Master’s
Degree
224.4%248.0%126.0%585.8%
PhD20.4%20.7%31.5%70.7%
NA30.6%10.3%10.5%50.5%
Household
size
17815.6%6321.0%4623.0%18718.7%
220841.6%12441.3%7638.0%40840.8%
38316.6%5618.7%4723.5%18618.6%
411322.6%5016.7%2311.5%18618.6%
591.8%72.3%73.5%232.3%
>691.6%00%10.5%101.0%
Table 7. Descriptive statistics of the sample income in Euro (South Tyrol and VCO) and Swiss Francs (Ticino).
a. Household Monthly Net Income in Euros (South Tyrol and VCO)
South TyrolVCOTotal
N.%N.%N.%
Income<1000 €132.6%84.0%213.0%
1000–2000 €8717.4%3417.0%12117.3%
2001–3000 €12825.6%3115.5%15922.7%
3001–4000 €7515.0%147.0%8912.7%
4001–5000 €316.2%105.0%415.9%
5001–6000 €61.2%105.0%162.3%
>6000 €71.4%105.0%172.4%
NA15330.6%8341.5%23633.7%
b. Household net monthly income in Swiss Franc (Ticino)
TicinoTotal
N.%N.%
Income<1000 CHF113.7%113.7%
1000–2000 CHF248.0%248.0%
2001–3000 CHF3411.3%3411.3%
3001–4000 CHF237.7%237.7%
4001–5000 CHF279.0%279.0%
5001–6000 CHF3010.0%3010.0%
6001–9000 CHF299.7%299.7%
9001–12,000 CHF93.0%93.0%
>12,000 CHF20.7%20.7%
NA11137.0%11137.0%
Table 8. Logistic regression showing propensity to purchase an EV.
Model 1
BExp(B)
Age−0.031 ***0.969
Bike0.601 **1.824
No. of cars0.693 ***2.001
Driving company: alone0.748 ***2.114
Driving company: in company0.856 ***2.354
Driving reasons: holiday1.009 ***2.744
Driving reasons: daily activities−0.602 **0.548
Driving experience as passenger0.091 ***1.096
Barriers: Costs1.138 ***3.121
Barriers: Battery autonomy1.325 ***3.762
Barriers: Availability of charging infrastructure1.433 ***4.193
Uptake drivers: enhanced charging infrastructure0.251 **1.285
Perceived presence of charging infrastructure0.631 ***1.879
Time range for EV uptake−0.453 ***0.636
Education level (University degree)0.652 ***1.919
<12 years old children0.558 *1.747
12–18 years old children0.786 **2.194
19–25 years old children0.511.665
Constant−2.277 ***0.103
−2 log likelihood904.99
Nagelkerke R sq.0.463
* p < 0.05. ** p < 0.01. *** p < 0.001.
Table 9. Chi-squared test on gender.
Propensity to Purchase an EV
NoYes
Male314185
Female315186
Tot.629371
𝜒2 0.00. df 1.
Table 10. Chi-squared test on residence area.
Propensity to Purchase an EV
NoYes
South Tyrol316184
Ticino184116
Verbano Cusio Ossola12971
Tot.629371
𝜒2 0.554. df 2.
Table 11. Chi-squared test on knowledge of people owning BEVs/PHEVs.
Propensity to Purchase an EV
NoYes
Knowledge134178
Not knowledge495193
Tot.629371
𝜒2 77.277. df 1.
Table 12. Chi-squared test on knowledge of incentives for EV purchases.
Propensity to Purchase an EV
NoYes
Knowledge413311
Not knowledge21660
Tot.629371
𝜒2 38.546. df 1.
Table 13. Logistic regression model showing the neighbor effect on the propensity to purchase an EV.
Model 2
BExp(B)
Relatives0.3741.454
Friends1.313 ***3.719
Colleagues0.898 **2.454
Neighbors0.849 ***2.336
Tourists−20.3070.000
Constant−0.8960.408
−2 log likelihood1241.251
Nagelkerke R sq.0.102
* p < 0.05. ** p < 0.01. *** p < 0.001.
Publisher’s Note: MDPI stays neutral with regard to jurisdictional claims in published maps and institutional affiliations.

