
User Preferences in the Design of Advanced Driver Assistance Systems

 ,
,  , , , , ,
Abstract
:1. Introduction
2. Literature Review
2.1. Review of ADAS
2.2. Review of Survey Designs
- Socio-demographic data: crucial to contrast the social features of drivers on which to apply our assistance analysis to the driver.
- Assessment of the use of the car in the previous year (measured in km/year).
- Frequency of use of protection devices (belt and helmet) in the previous six months. This information is not useful for our purposes.
- Involvement in traffic accidents during the previous year (indicating the number and characteristics of the last traffic accident suffered).
- Age of obtaining driving license (car or motorcycle), two questions about their quality as a driver and their perceived driving speed and a set of 28 dichotomous response questions, presented in the form of a matrix, which is related to driving circumstances potentially associated with accidents.
2.3. Review of Interfaces and Usability
3. Survey Design, Analysis and Results
3.1. Analysis Methodology
3.2. General Characteristics of the Participants
3.3. Usefulness of an ADAS
3.3.1. Drivers without an ADAS
3.3.2. Drivers with an ADAS
Usefulness of the ADAS
When It Is Useful to Have an Assistant
Aspects of Improvement of the Assistant
3.4. Assistant Design Preferences
3.4.1. Frequency of Warnings or Recommendations
3.4.2. Information on Traffic
3.4.3. Information on Driving
3.4.4. Information about the Weather
3.4.5. Relaxation Method with Stress
3.4.6. Method to Avoid Distractions
3.4.7. Drowsiness Aid Method
3.5. Method of Receiving Information
3.5.1. Use of Avatar
3.5.2. Type of Avatar
3.5.3. Gender of the Avatar Character
3.6. Analysis of Driver Behavior and Driver Preferences for the Assistant
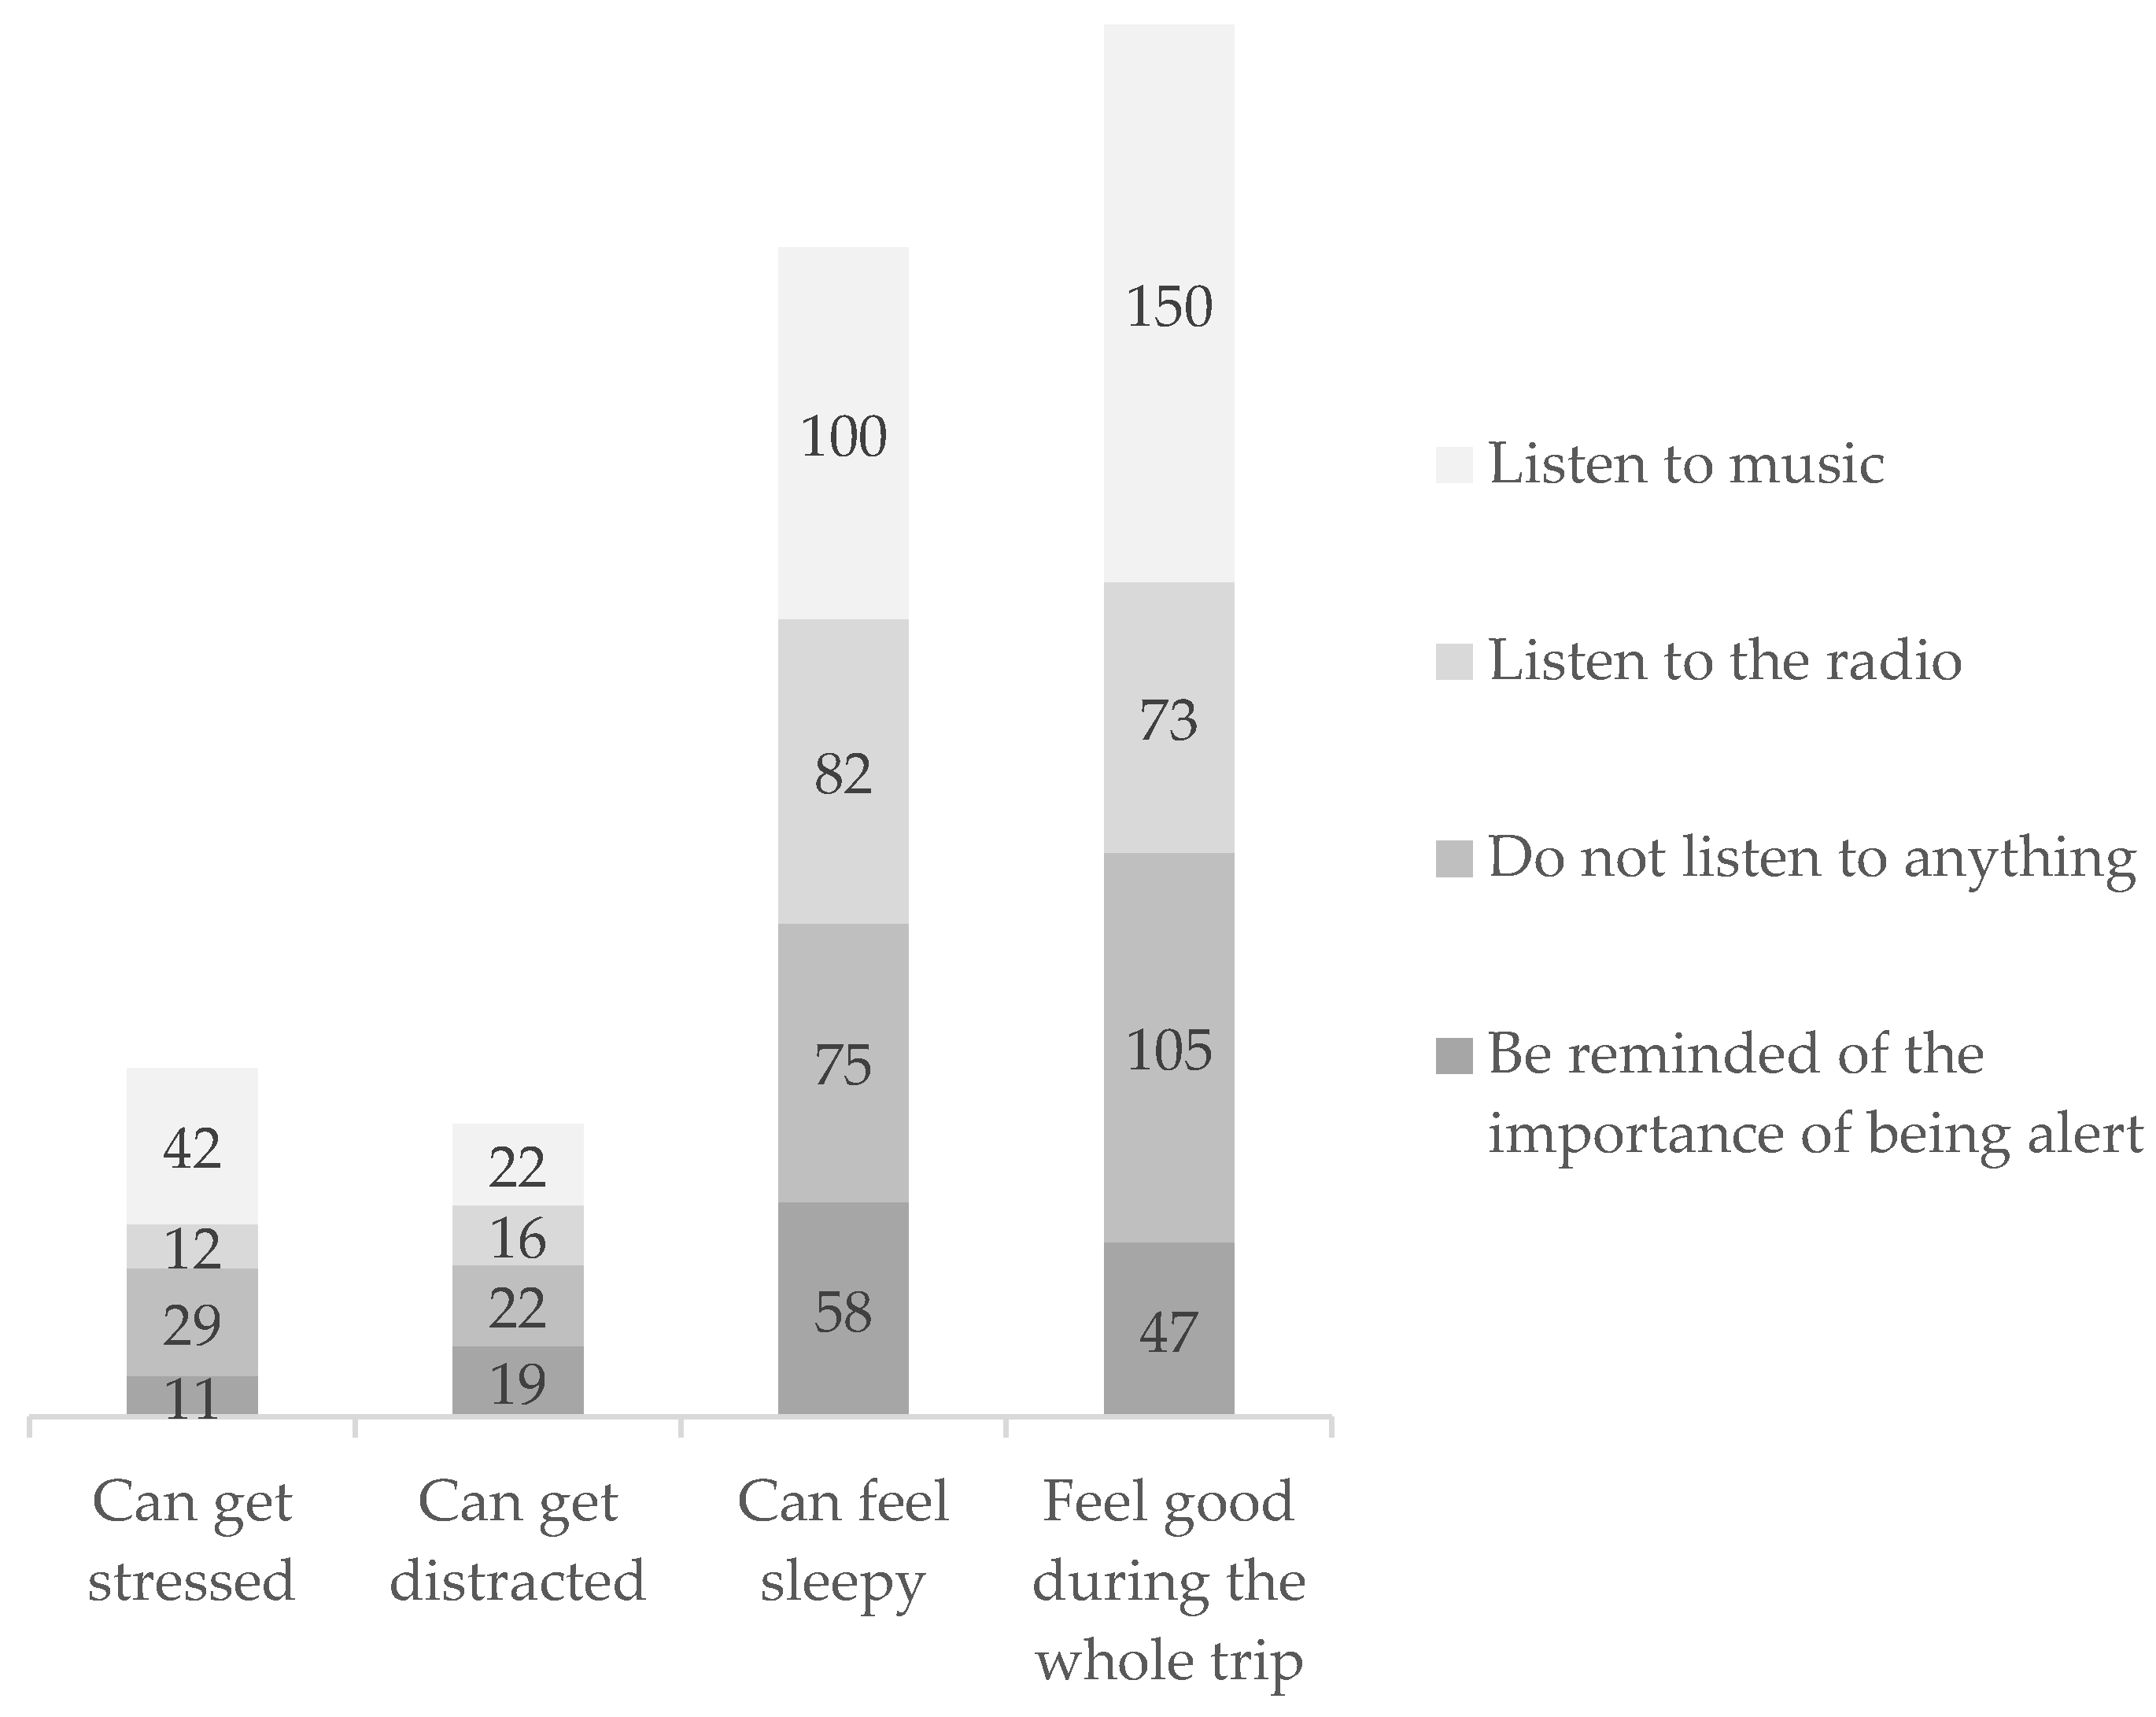
3.6.1. Relationship between Being Distracted Frequently When Driving and What Helps You Avoid Distractions
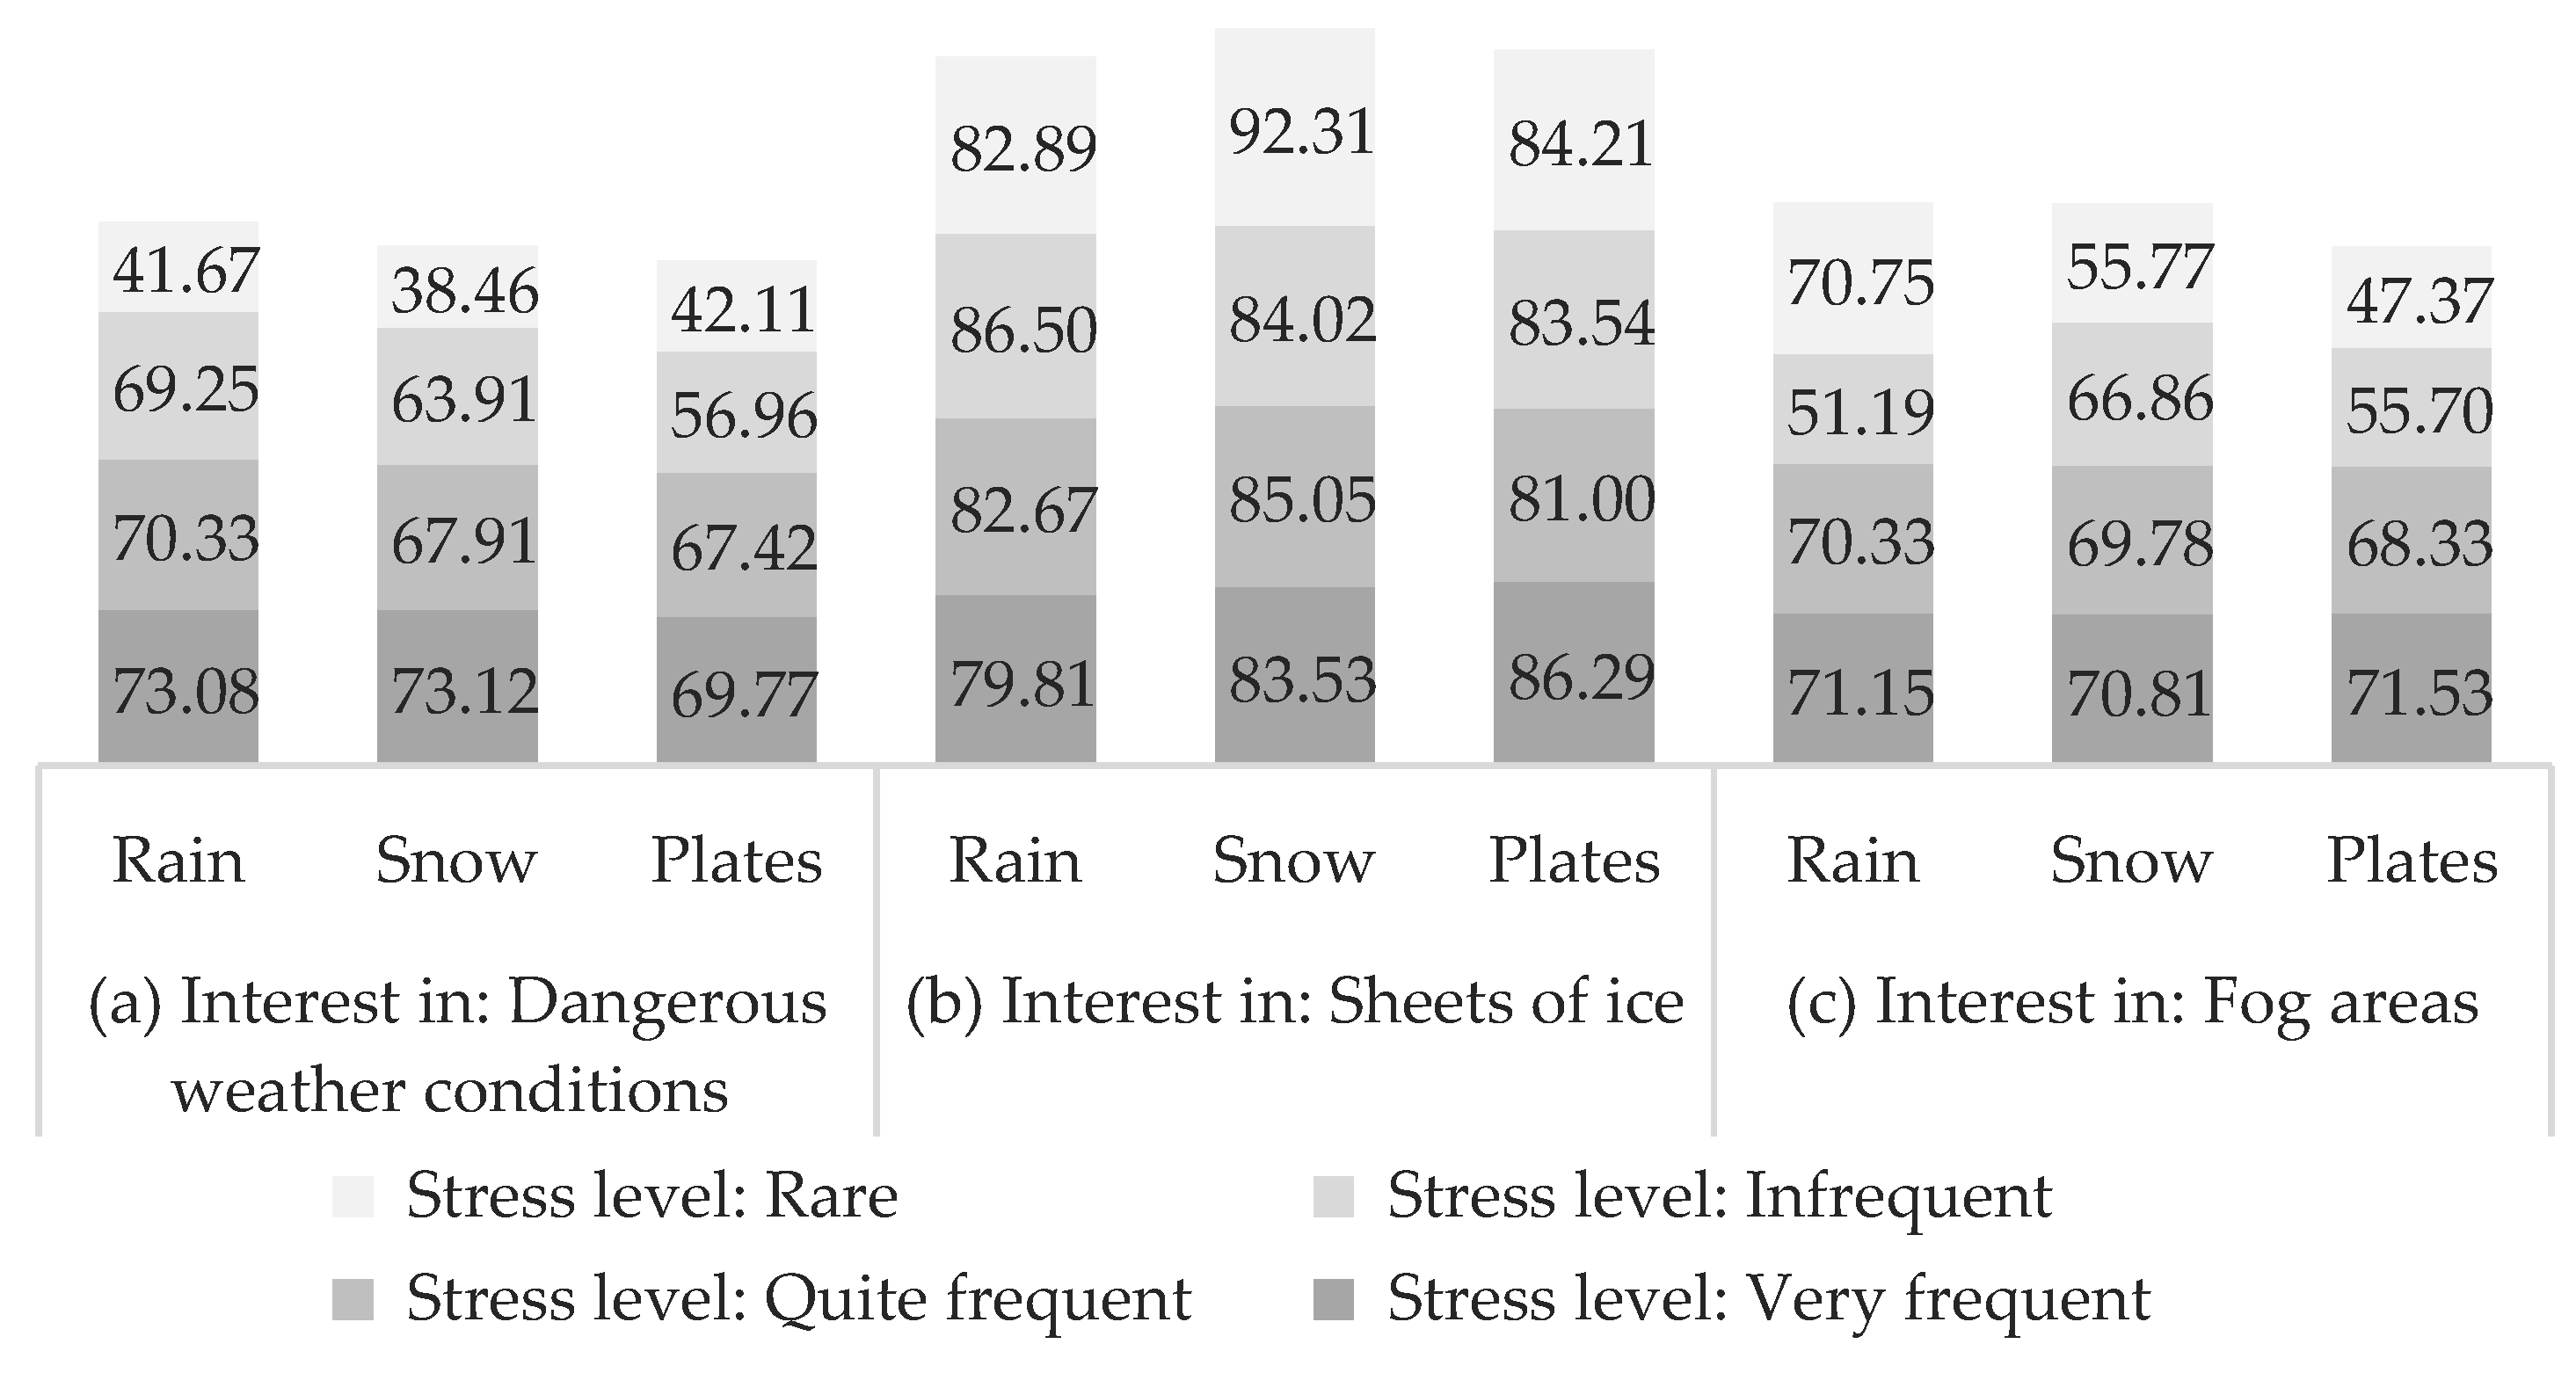
3.6.2. Relationship between Circumstances on Long Journeys and Situations That Can Represent Some Danger on the Road
3.7. Discussion
4. Prototype
4.1. Overview
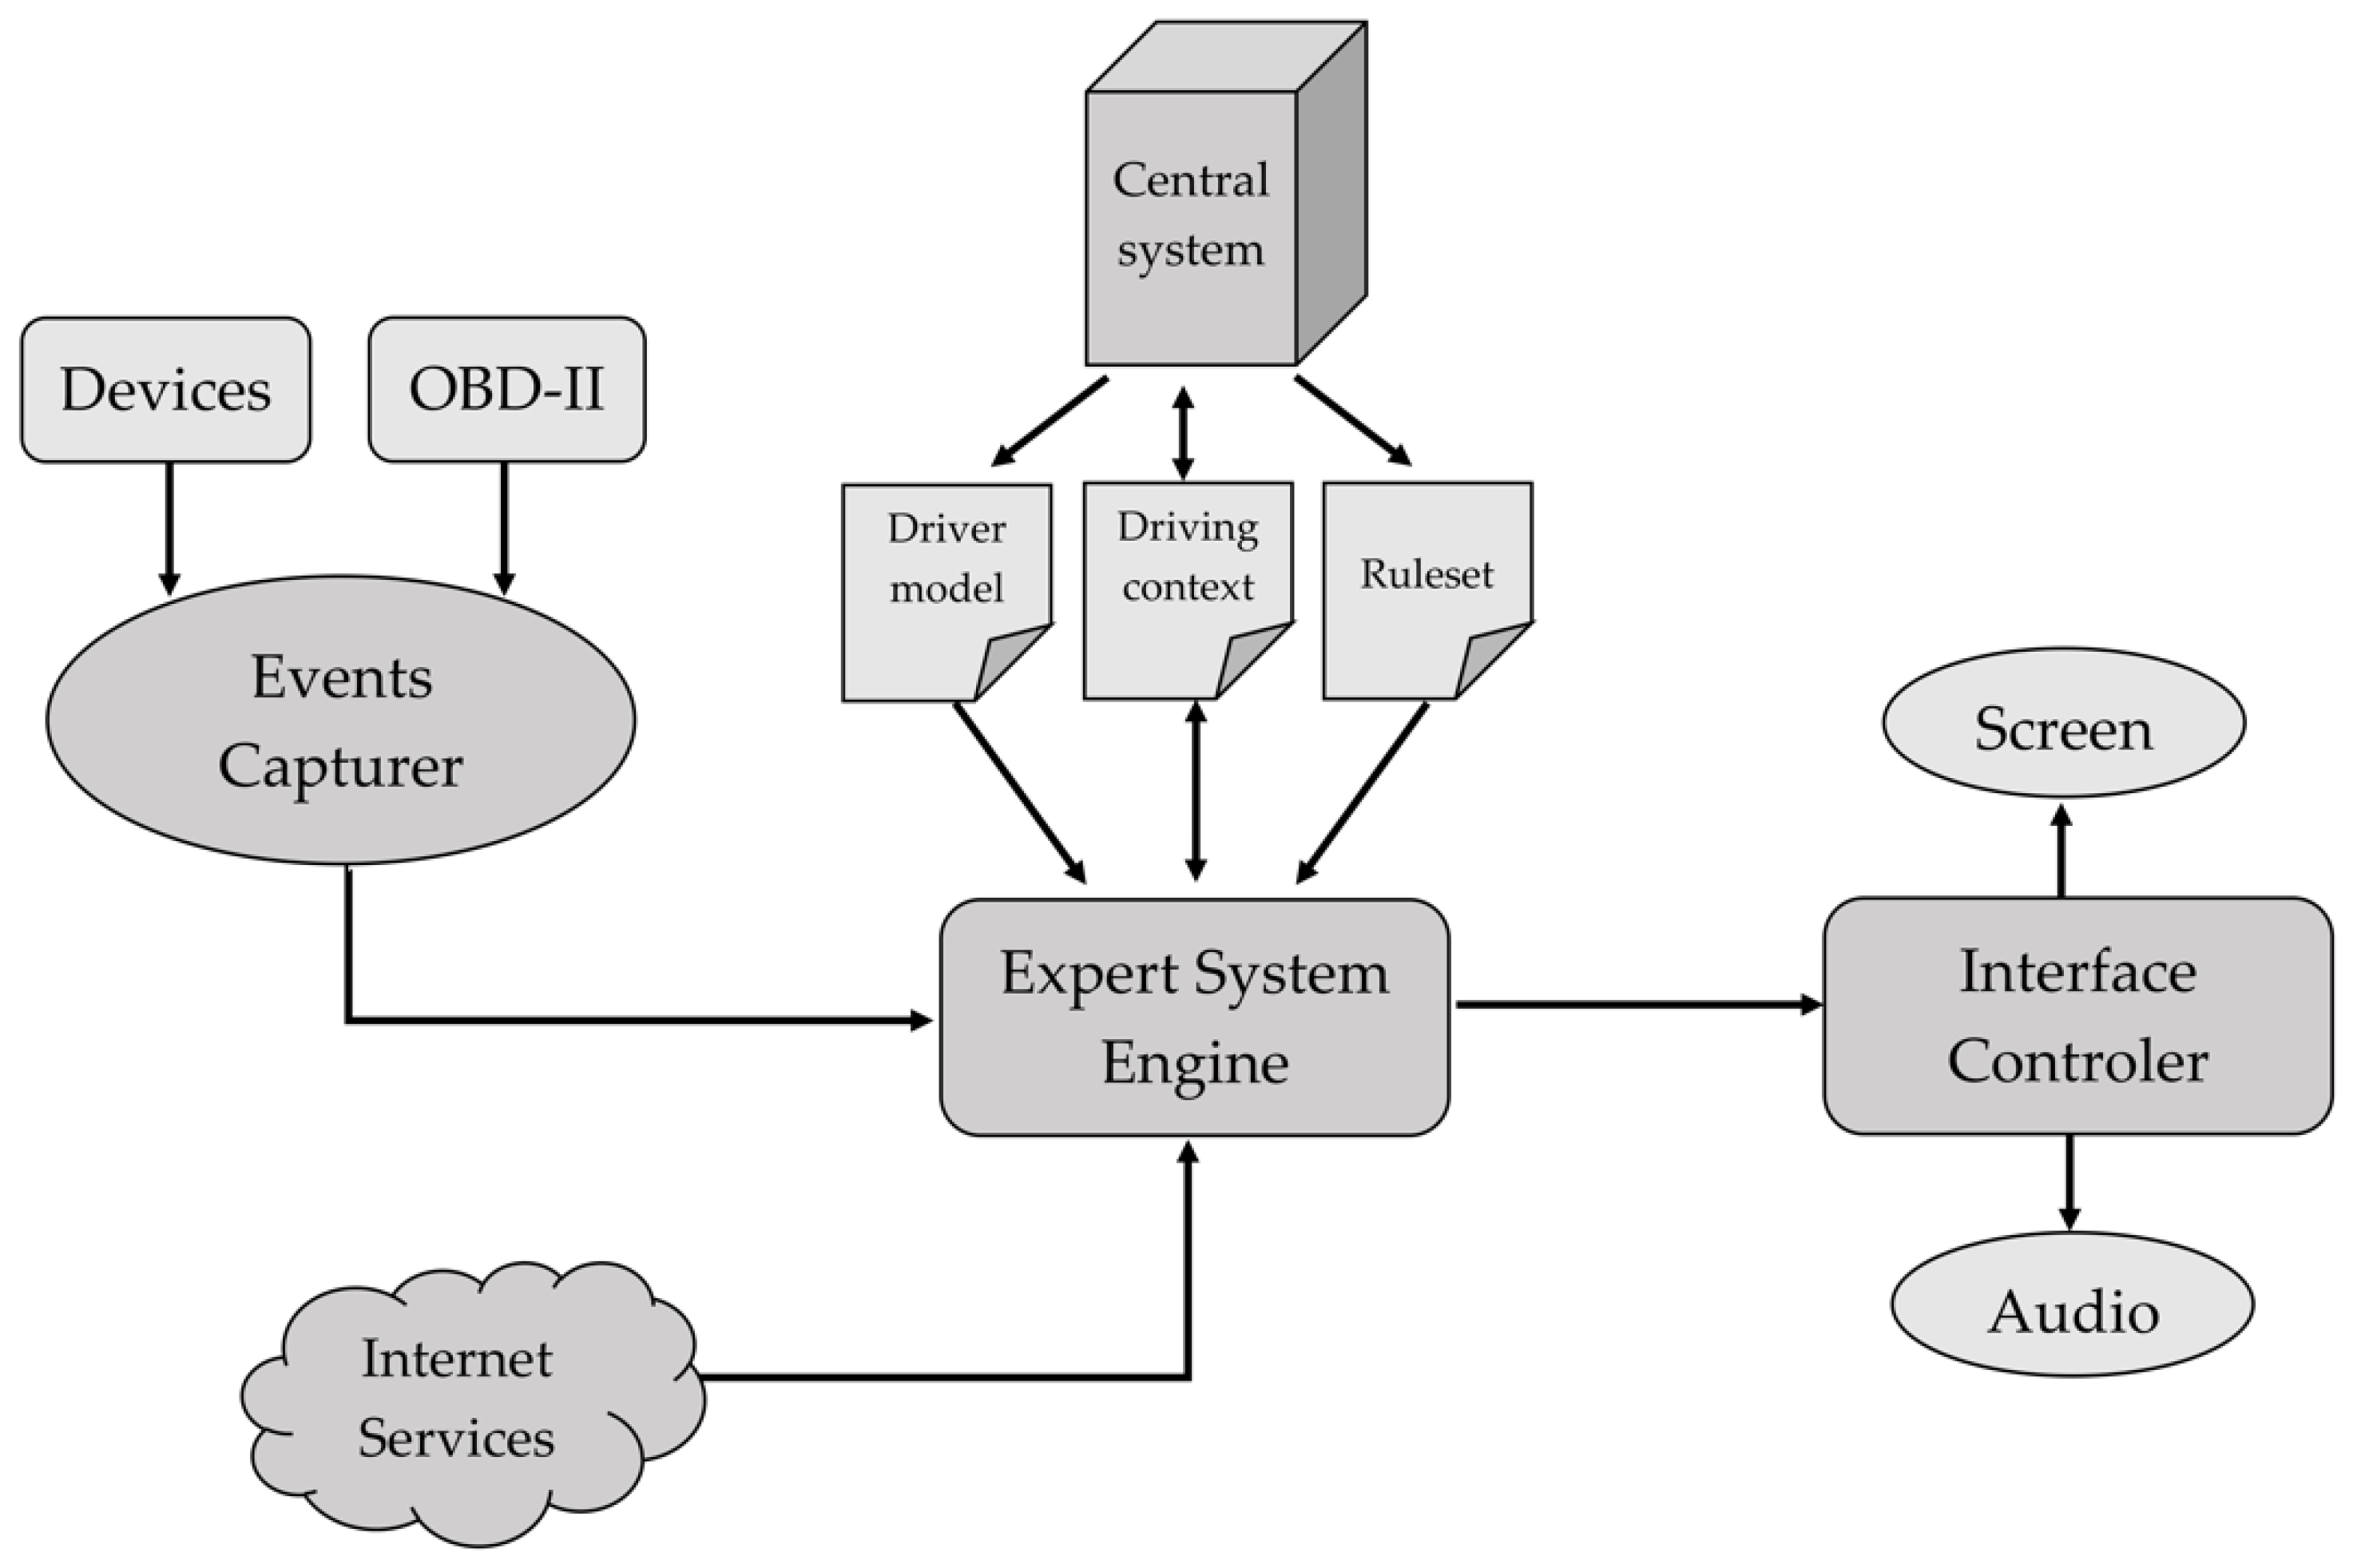
4.2. Architecture
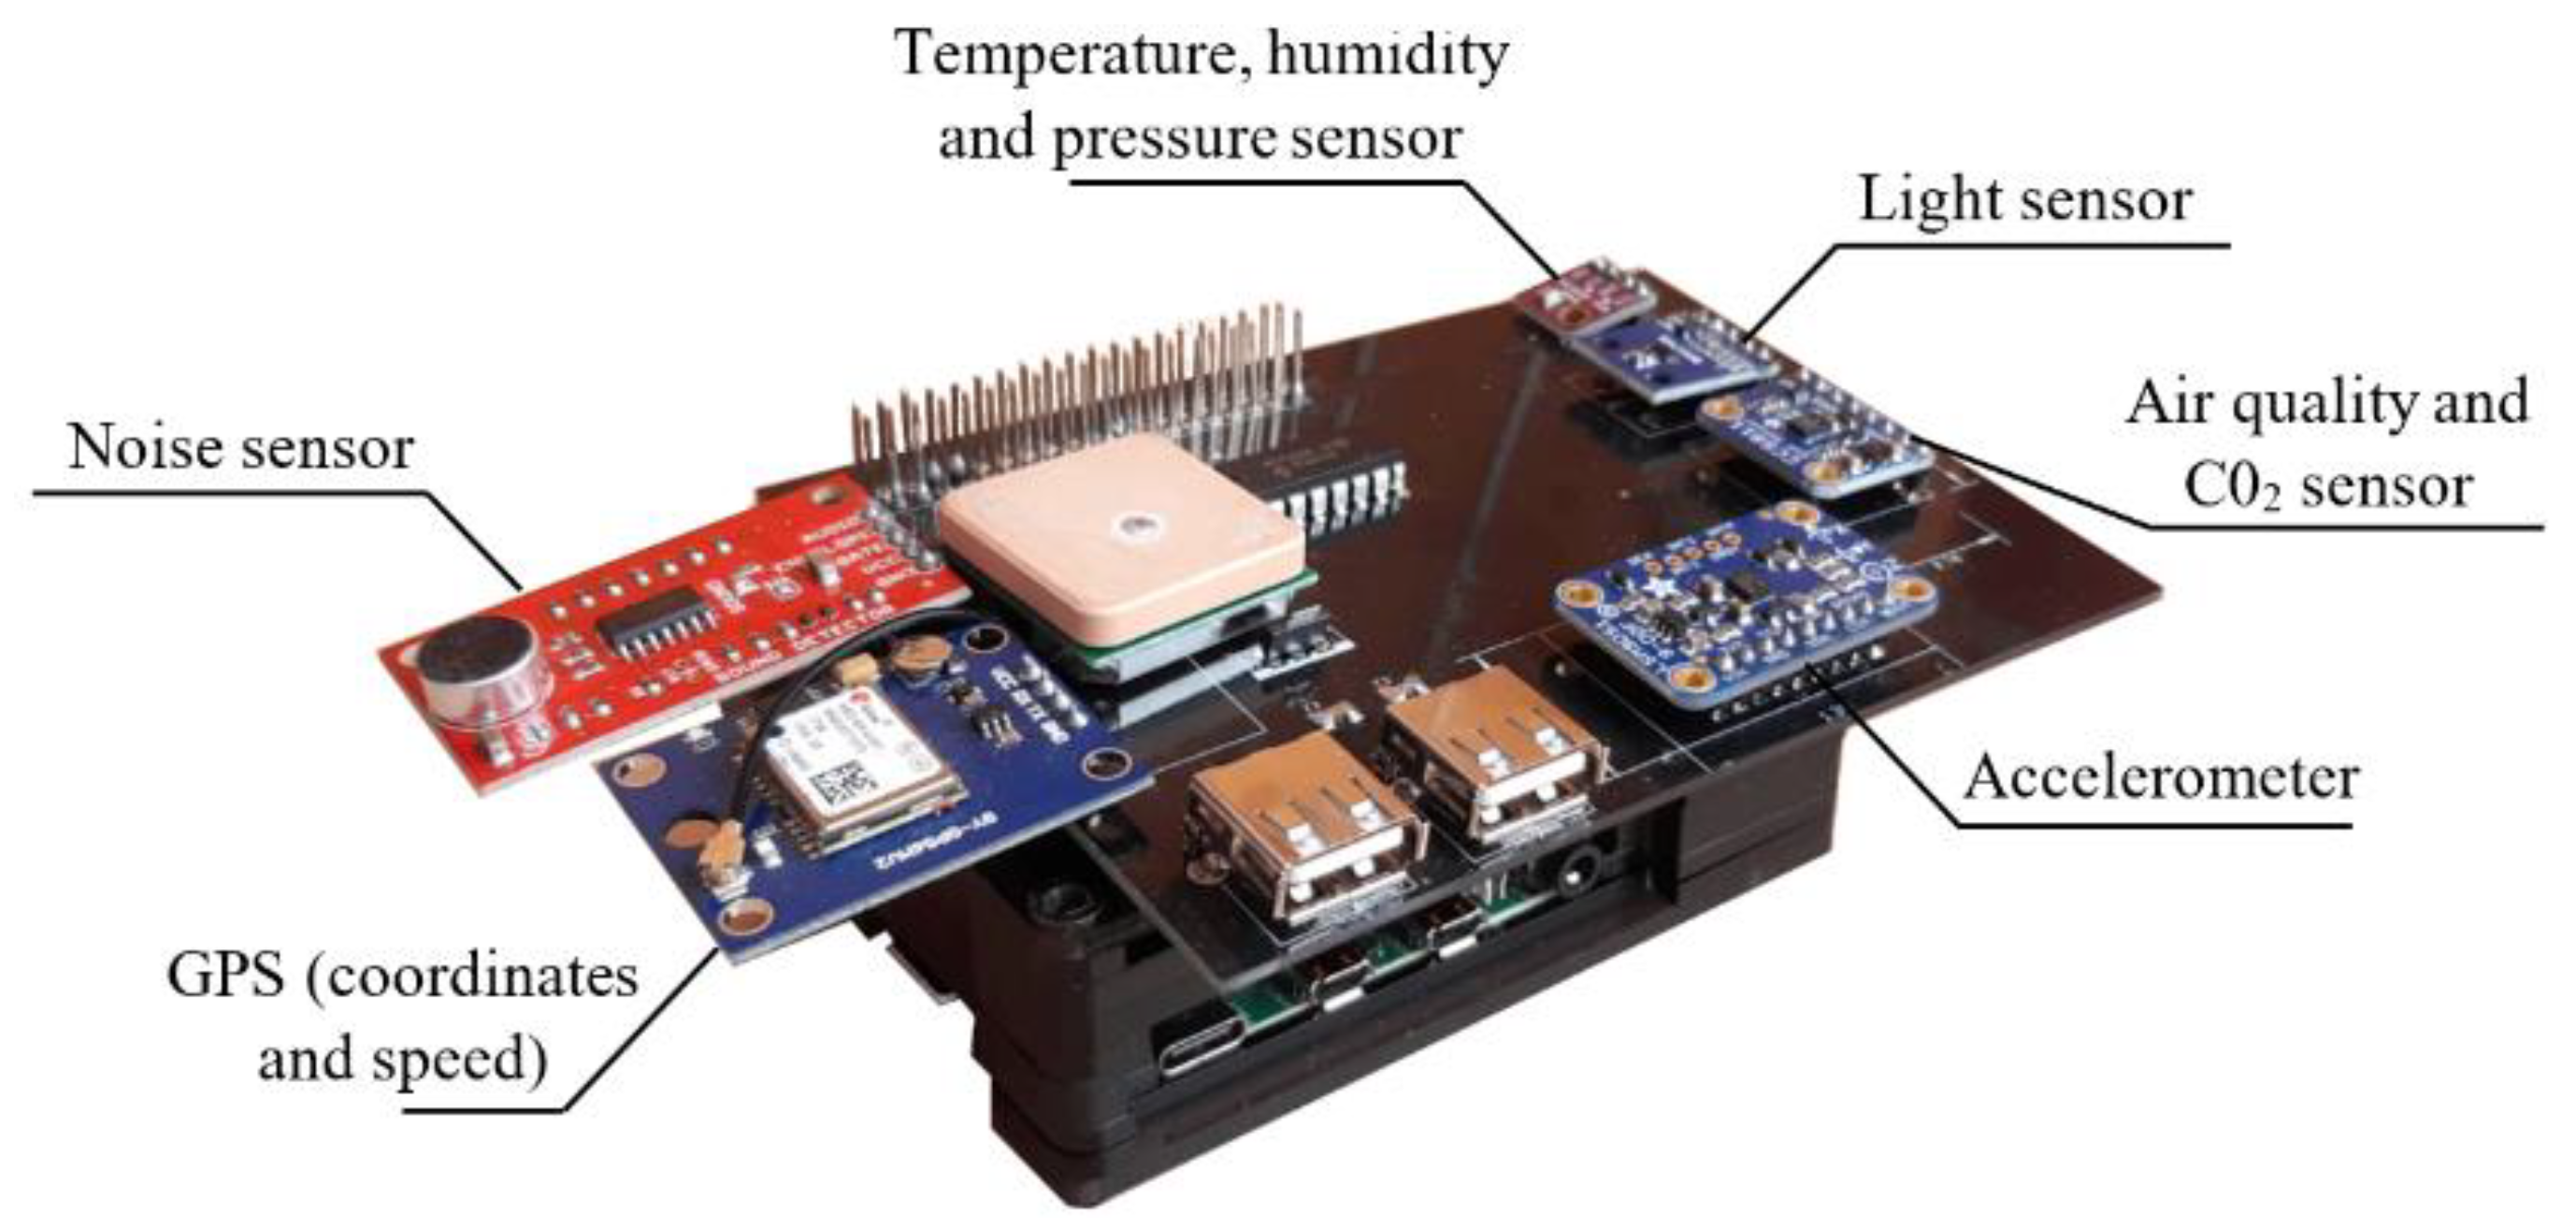
4.3. Technologies
4.4. Test Scenarios
5. Discussions and Conclusions
Author Contributions
Funding
Institutional Review Board Statement
Informed Consent Statement
Data Availability Statement
Acknowledgments
Conflicts of Interest
References
- Andria, G.; Attivissimo, F.; Di Nisio, A.; Lanzolla, A.M.; Pellegrino, A. Design and implementation of automotive data acquisition platform. In Proceedings of the IEEE International Instrumentation and Measurement Technology Conference (I2MTC), Pisa, Italy, 11–14 May 2015; pp. 272–277. [Google Scholar]
- Wittmann, M.; Lohrer, J.; Betz, J.; Jäger, B.; Kugler, M.; Klöppel, M.; Waclaw, A.; Hann, M.; Lienkamp, M. A holistic framework for acquisition, processing and evaluation of vehicle fleet test data. In Proceedings of the IEEE 20th International Conference on Intelligent Transportation Systems (ITSC), Yokohama, Japan, 16–19 October 2017; pp. 1–7. [Google Scholar]
- Sieber, M.; Färber, B. Driver perception and reaction in collision avoidance: Implications for ADAS development and testing. In Proceedings of the IEEE Intelligent Vehicles Symposium (IV), Gothenburg, Sweden, 19–22 June 2016; pp. 239–245. [Google Scholar]
- SAE International. Taxonomy and Definitions for Terms Related to Driving Automation Systems for On-Road Motor Vehicles, Ground Vehicle Standard J3016; SAE Mobilus: Warrendale, PA, USA, 2016. [Google Scholar]
- Magaña, V.C.; Muñoz-Organero, M. Artemisa: A Personal Driving Assistant for Fuel Saving. IEEE Trans. Mob. Comput. 2016, 15, 2437–2451. [Google Scholar] [CrossRef] [Green Version]
- Rojdestvenskiy, D.; Cvetković, M.; Bouchner, P. Real-time driver advisory system for improving energy economy based on advance driver assistant systems interface. In Proceedings of the Smart City Symposium Prague (SCSP), Prague, Czech Republic, 24–25 May 2018; pp. 1–6. [Google Scholar]
- Saito, Y.; Itoh, M.; Inagaki, T. Driver Assistance System with a Dual Control Scheme: Effectiveness of Identifying Driver Drowsiness and Preventing Lane Departure Accidents. IEEE Trans. Hum. Mach. Syst. 2016, 46, 660–671. [Google Scholar] [CrossRef] [Green Version]
- Zeng, S.; Li, J.; Jiang, L.; Jiang, J. A driving assistant safety method based on human eye fatigue detection. In Proceedings of the 29th Chinese Control and Decision Conference (CCDC), Chongqing, China, 28–30 May 2017; pp. 6370–6377. [Google Scholar]
- Quintero, M.C.; Cuervo, P.A. Intelligent driving assistant based on accident risk maps analysis and intelligent driving diagnosis. In Proceedings of the IEEE Intelligent Vehicles Symposium (IV), Los Angeles, CA, USA, 11–14 June 2017; pp. 914–919. [Google Scholar]
- Cheng, G.; Zheng, J.Y.; Murase, H. Sparse Coding of Weather and Illuminations for ADAS and Autonomous Driving. In Proceedings of the IEEE Intelligent Vehicles Symposium (IV), Changshu, China, 26–30 June 2018; pp. 2030–2035. [Google Scholar]
- Moten, S.; Celiberti, F.; Grottoli, M.; van der Heide, A.; Lemmens, Y. X-in-the-loop advanced driving simulation platform for the design, development, testing and validation of ADAS. In Proceedings of the IEEE Intelligent Vehicles Symposium (IV), Changshu, China, 26–30 June 2018; pp. 1–6. [Google Scholar]
- Heckmann, M.; Orth, D.; Kolossa, D. Gap after the next two vehicles: A Spatio-temporally Situated Dialog for a Cooperative Driving Assistant. In Proceedings of the Speech Communication, 13th ITG-Symposium, Oldenburg, Germany, 10–12 October 2018; pp. 1–5. [Google Scholar]
- Byon, Y.; Shalaby, A.; Abdulhai, B. Travel Time Collection and Traffic Monitoring via GPS Technologies. In Proceedings of the IEEE Intelligent Transportation Systems Conference, Toronto, ON, Canada, 17–20 September 2006; pp. 677–682. [Google Scholar]
- You, C.; Lu, J.; Tsiotras, P. Nonlinear Driver Parameter Estimation and Driver Steering Behavior Analysis for ADAS Using Field Test Data. IEEE Trans. Hum. Mach. Syst. 2017, 47, 686–699. [Google Scholar] [CrossRef]
- Lyu, N.; Duan, Z.; Xie, L.; Wu, C. Driving experience on the effectiveness of advanced driving assistant systems. In Proceedings of the 4th International Conference on Transportation Information and Safety (ICTIS), Banff, AB, Canada, 8–10 August 2017; pp. 987–992. [Google Scholar]
- Yin, J.; Chen, B.; Lai, K.R.; Li, Y. Automatic Dangerous Driving Intensity Analysis for Advanced Driver Assistance Systems from Multimodal Driving Signals. IEEE Sens. J. 2018, 18, 4785–4794. [Google Scholar] [CrossRef]
- Park, J.; Son, H.; Lee, J.; Choi, J. Driving Assistant Companion with Voice Interface Using Long Short-Term Memory Networks. IEEE Trans. Ind. Inform. 2019, 15, 582–590. [Google Scholar] [CrossRef]
- Cheng, Z.; Jeng, L.; Li, K. Behavioral Classification of Drivers for Driving Efficiency Related ADAS Using Artificial Neural Network. In Proceedings of the IEEE International Conference on Advanced Manufacturing (ICAM), Yunlin, Taiwan, 16–18 November 2018; pp. 173–176. [Google Scholar]
- Shouming, Q.; Liwei, H.; Xiaoyang, D. Control Methods of Traffic Congestion Based on Drivers’ Behavior Characteristics. In Proceedings of the 8th International Conference on Intelligent Computation Technology and Automation (ICICTA), Nanchang, China, 14–15 June 2015; pp. 333–336. [Google Scholar]
- Gheorghiu, R.A.; Cormos, A.C.; Iordache, V.; Alexandru, V. Analysis of driver behaviour’s influence in urban traffic flows. In Proceedings of the 10th International Conference on Electronics, Computers and Artificial Intelligence (ECAI), Iasi, Romania, 28–30 June 2018; pp. 1–4. [Google Scholar]
- Bevilacqua, C.; Bogdan, P.; Marculescu, R. Exploring congestion phase transitions in vehicular traffic via topology and driver behavior modeling. In Proceedings of the 2011 IEEE Forum on Integrated and Sustainable Transportation Systems, Vienna, Austria, 29 June–1 July 2011; pp. 115–121. [Google Scholar] [CrossRef]
- Teoh, E.R. What’s in a Name? Drivers’ Perceptions of the Use of Five SAE Level 2 Driving Automation Systems. J. Saf. Res. 2020, 72, 145–151. [Google Scholar] [CrossRef]
- ProPILOT 2.0—Next-Gen Driver Assistance System. Available online: https://global.nissannews.com/en/releases/propilot-20 (accessed on 19 February 2021).
- Nissan’s “Driver Attention Alert” Helps Detect Erratic Driving Caused by Drowsiness and Inattention. Available online: https://usa.nissannews.com/en-US/releases/nissan-s-driver-attention-alert-helps-detect-erratic-driving-caused-by-drowsiness-and-inattention (accessed on 19 February 2021).
- Neuhaus, R.; Laschke, M.; Theofanou-Fülbier, D.; Hassenzahl, M.; Sadeghian, S. Exploring the Impact of Transparency on the Interaction with an In-Car Digital AI Assistant. In Proceedings of the 11th International Conference on Automotive User Interfaces and Interactive Vehicular Applications: Adjunct Proceedings, Utrecht, The Netherlands, 22–25 September 2019; Association for Computing Machinery: New York, NY, USA, 2019; pp. 450–455. [Google Scholar]
- Maag, C.; Muhlbacher, D.; Mark, C.; Kruger, H. Studying effects of advanced driver assistance systems (adas) on individual and group level using multi- driver simulation. IEEE Intell. Transp. Syst. Mag. 2012, 4, 45–54. [Google Scholar] [CrossRef]
- Cao, S.; Qin, Y.; Jin, X.; Zhao, L.; Shen, M. Effect of driving experience on collision avoidance braking: An experimental investigation and computational modelling. Behav. Inf. Technol. 2014, 33, 929–940. [Google Scholar] [CrossRef]
- Abe, G.; Richardson, J. The influence of alarm timing on driver response to collision warning systems following system failure. Behav. Inf. Technol. 2006, 25, 443–452. [Google Scholar] [CrossRef]
- Park, E.; Kim, H.; Ohm, J.Y. Understanding driver adoption of car navigation systems using the extended technology acceptance model. Behav. Inf. Technol. 2015, 34, 741–751. [Google Scholar] [CrossRef]
- Jimenez-Mejias, E.; Lardelli, P.; Amezcua-Prieto, C.; Jimenez Monlen, J.J. A review of questionnaires exploring driver’s exposure and risk factors in road crashes. An. Sist. Sanit. Navar. 2011, 34, 443–452. [Google Scholar]
- Jiménez Mejías, E.; Luna del Castillo, J.D.; Amezcua Prieto, C.; Olvera Porcel, M.C.; Lardelli Claret, P.; Jiménez Moleón, J.J. Diseño y validación de un cuestionario sobre patrones de conducción de riesgo en jóvenes. Rev. Española Salud Pública 2012, 86, 71–84. [Google Scholar] [CrossRef] [PubMed] [Green Version]
- Owsley, C.; Stalvey, B.T.; Elgin, J.; Sloane, M. Older drivers and cataract: Driving habits and crash risk. J. Gerontol. Ser. A Biol. Sci. Med Sci. 1999, 54, M203–M211. [Google Scholar] [CrossRef] [PubMed] [Green Version]
- De Winter, J.; Dodou, D. The driver behaviour questionnaire as a predictor of accidents: A meta-analysis. J. Saf. Res. 2010, 41, 463–470. [Google Scholar] [CrossRef]
- Leandro, M. Tres instrumentos para el estudio de la conducta de conducir. In Psychology/Environmental PhD. Program; GSUC/CUNY: New York, NY, USA, 2009. [Google Scholar]
- Ajzen, I. The theory of planned behavior. Organ. Behav. Hum. Decis. Process. 1991, 50, 179–211. [Google Scholar] [CrossRef]
- Crawford, J.R.; Henry, J.D. The depression anxiety stress scales (dass): Normative data and latent structure in a large non-clinical sample. Br. J. Clin. Psychol. 2003, 42, 111–131. [Google Scholar] [CrossRef] [Green Version]
- Hart, S.G.; Staveland, L.E. Development of nasa-tlx (task load index): Results of empirical and theoretical research. Adv. Psychol. 1988, 52, 139–183. [Google Scholar]
- Pauzie, A. A method to assess the driver mental workload: The driving activity load index (dali). IET Intell. Transp. Syst. 2008, 2, 315–322. [Google Scholar] [CrossRef]
- Shively, R.J.; Bortolussi, M.R.; Battiste, V.; Hart, S.G.; Pepitone, D.D.; Matsumoto, J. Inflight Evaluation of Pilot Workload Measures for Rotorcraft Research; International Symposium on Aviation Psychology: Columbus, OH, USA, 1987. [Google Scholar]
- Milleville-Pennel, I.; Charron, C. Driving for real or on a fixed-base simulator: Is it so different? An explorative study. Presence Teleoper. Virtual Environ. 2015, 24, 74–91. [Google Scholar] [CrossRef] [Green Version]
- Gde, M.; Trkulja, V.; Petras, V. Everything changes, everything stays the same? Understanding information spaces. In Proceedings of the 15th International Symposium of Information Science (ISI 2017), Berlin, Germany, 13–15 March 2017; Volume 24, pp. 116–130. [Google Scholar]
- Lisetti, C.L.; Yasavur, U.; Visser, U.; Rishe, N. Toward conducting motivational interviewing with an on-demand clinician avatar for tailored health behavior change interventions. In Proceedings of the 5th International Conference on Pervasive Computing Technologies for Healthcare (PervasiveHealth) and Workshops, Dublin, Ireland, 23–26 May 2011; pp. 246–249. [Google Scholar]
- Nurgaliyev, K.; Mauro, D.D.; Khan, N.; Augusto, J.C. Improved multi-user interaction in a smart environment through a preference-based conflict resolution virtual assistant. In Proceedings of the 2017 International Conference on Intelligent Environments (IE), Seoul, Korea, 21–25 August 2017; pp. 100–107. [Google Scholar]
- Konecki, M.; Gams, M.; Ivkovi, N. Mia: A multi-purpose intelligent assistant. In Proceedings of the 38th International Convention on Information and Communication Technology, Electronics and Microelectronics (MIPRO), Opatija, Croatia, 25–29 May 2015; pp. 1109–1113. [Google Scholar]
- Lugano, G. Virtual assistants and self-driving cars. In Proceedings of the 15th International Conference on ITS Telecommunications (ITST), Warsaw, Poland, 29–31 May 2017; pp. 1–5. [Google Scholar]
- Felnhofer, A.; Kaufmann, M.; Atteneder, K.; Kafka, J.X.; Hlavacs, H.; Beutl, L.; Hennig-Fast, K.; Kothgassner, O.D. The mere presence of an attentive and emotionally responsive virtual character influences focus of attention and perceived stress. Int. J. Hum. Comput. Stud. 2019, 132, 45–51. [Google Scholar] [CrossRef]
- Alvarez, I.; Alnizami, H.; Dunbar, J.; Jackson, F.; Gilbert, J.E. Help on the road: Effects of vehicle manual consultation in driving performance across modalities. Int. J. Hum. Comput. Stud. 2015, 73, 19–29. [Google Scholar] [CrossRef]
- Ho, C.; Spence, C. Assessing the effectiveness of various auditory cues in capturing a driver’s visual attention. J. Exp. Psychol. Appl. 2005, 11, 157–174. [Google Scholar] [CrossRef] [Green Version]
- Horowitz, A.D.; Dingus, T. Warning signal design: A key human factors issue in an in-vehicle front-to-rear-end collision warning system. Proc. Hum. Factors Soc. 1992, 36, 1011–1013. [Google Scholar] [CrossRef]
- Green, P.; Sullivan, J.; Tsimhoni, O.; Oberholtzer, J.; Buonarosa, M.; De-vonshire, J.; Schweitzer, J.; Baragar, E.; Sayer, J. Integrated Vehicle-Based Safety Systems (Ivbss): Human Factors and Driver-Vehicle Interface (dvi) Summary Report; National Highway Traffic Safety Administration: Washington, DC, USA, 2008.
- Adell, E.; Varhelyi, A.; Alonso, M.; Plaza, J. Developing human-machine interaction components for a driver assistance system for safe speed and safe distance. IET Intell. Transp. Syst. 2008, 2, 1–14. [Google Scholar] [CrossRef]
- Diederich, A.; Colonius, H. Bimodal and trimodal multisensory enhancement: Effects of stimulus onset and intensity on reaction time. Percept. Psychophys. 2004, 66, 1388–1404. [Google Scholar] [CrossRef] [PubMed] [Green Version]
- Vahidi, A.; Eskandarian, A. Research advances in intelligent collision avoidance and adaptive cruise control. IEEE Trans. Intell. Transp. Syst. 2003, 4, 143–153. [Google Scholar] [CrossRef] [Green Version]
- Avatar Replaces Vehicle Owner’s Manual. Available online: https://www.isa.org/standards-and-publications/isa-publications/intech-magazine/2011/october/automation-update-avatar-replaces-vehicle-owners-manual/ (accessed on 23 February 2019).
- The Irish Times, Ibm and Ucd in Drive to Perfect Intelligent In-Car Assistant. Available online: https://www.irishtimes.com/business/innovation/ibm-and-ucd-in-drive-to-perfect-intelligent-in-car-assistant-1.2966857?cm_mc_uid=17459354675814881263421&cm_mc_sid_50200000= (accessed on 13 February 2019).
- Rns 810. Available online: https://www.volkswagen.co.uk/technology/navigation-and-entertainment-systems/rns-810 (accessed on 10 October 2019).
- Charamel, Avatar Service in Car Devices. Available online: https://www.charamel.com/en/case-studies/avatar-service-in-car-devices (accessed on 13 February 2019).
- Pocket-Lint, an In-Car Avatar Becomes Your Ride-Along Assistant in Nissan’s Invisible-to-Visible Driving Concept. Available online: https://www.pocket-lint.com/cars/news/nissan/146615-an-avatar-becomes-your-assistant-in-nissan-invisible-to-visible-driving-concept (accessed on 13 February 2019).
- Rohatgi, V.K.; Saleh, A.K. An Introduction to Probability and Statistics, 2nd ed.; Wiley Series in Probability and Statistics; John Wiley & Sons: Hoboken, NJ, USA, 2015. [Google Scholar]
- Son, J.; Park, M.; Park, B.B. The effect of age, gender and roadway environment on the acceptance and effectiveness of advanced driver assistance systems. Transp. Res. Part F Traffic Psychol. Behav. 2015, 31, 12–24. [Google Scholar] [CrossRef]
- Bellet, T.; Paris, J.C.; Marin-Lamellet, C. Difficulties experienced by older drivers during their regular driving and their expectations towards advanced driving aid systems and vehicle automation. Transp. Res. Part F Traffic Psychol. Behav. 2018, 52, 138–163. [Google Scholar] [CrossRef]
- Weiss, E.; Thiel, M.F.; Sultana, N.; Hannan, C.; Seacrist, T. Advanced driver assistance systems for teen drivers: Teen and parent impressions, perceived need, and intervention preferences. Traffic Inj. Prev. 2018, 19, S120–S124. [Google Scholar] [CrossRef]
- Oxley, P.R.; Mitchell, C.G. Final Report on Elderly and Disabled Drivers Information Telematics. Dedicated Road Infrastructure for Vehicle Safety in Europe Drive ii Project v2031 Elderly and Disabled Drivers Information Telematics Eddit, Deliverable Type p. r d Programme Telematics System in the Area of Transport (Drive ii); Commission of the European Communities CEC, Directorate General XIII Telecommunications, Information Industries and Innovation: Brussels, Belgium, 1995. [Google Scholar]
- Stevens, S. The relationship between driver acceptance and system effectiveness in car-based collision warning systems: Evidence of an overreliance effect in older drivers? SAE Int. J. Passeng. Cars Electron. Electr. Syst. 2012, 5, 114–124. [Google Scholar] [CrossRef]
- Viborg, N. Older and younger drivers attitudes toward in-car its. Bulletin 1999, 181, 1–20. [Google Scholar]


| Goals | Studies |
|---|---|
| Save fuel costs/energy | [1,5,6,18] |
| Collision/Accident risk detection | [3,9,10,11,12,16] |
| Fatigue/drowsiness detection | [7,8] |
| Study driving patterns | [1,2,13,14,15,16,17,18,19,20,21] |
| Commercial solutions | [22,23,24,25] |
| Questions | Frequency | % |
|---|---|---|
| I know what it is, but it does not seem useful | 46 | 7.8 |
| I do not know what it is | 12 | 2.0 |
| Yes, under any circumstance | 131 | 22.2 |
| Yes, when driving in the city | 23 | 3.9 |
| Yes, when driving in unknown zones | 378 | 64.1 |
| Total | 590 | 100.0 |
| Questions | Age under 40 | Age 41–60 | Age over 60 | |||
|---|---|---|---|---|---|---|
| n | % | n | % | n | % | |
| I know what it is, but it does not seem useful | 24 | 9.41 | 20 | 6.62 | 2 | 6.06 |
| I do not know what it is | 3 | 1.18 | 5 | 1.66 | 4 | 12.12 |
| Yes, under any circumstance | 56 | 21.96 | 67 | 22.19 | 8 | 24.24 |
| Yes, when driving in the city | 6 | 2.35 | 16 | 5.30 | 1 | 3.03 |
| Yes, when driving in unknown zones | 166 | 65.10 | 194 | 64.24 | 18 | 54.55 |
| Area for Improvement of ADAS | General Scores | Pearson Test (p-Value) | |||
|---|---|---|---|---|---|
| Frequency | % | Country | Gender | Age | |
| Notifications | 150 | 50.3 | 0.197 | 0.550 | 0.884 |
| Interaction | 149 | 50.0 | 0.881 | 0.265 | 0.007 |
| Information | 84 | 28.2 | 0.619 | 0.287 | 0.072 |
| Interface | 71 | 23.8 | 0.506 | 0.003 | 0.345 |
| Notification Frequency | Respondents without ADAS (N = 590) | Respondents with ADAS (N = 298) | ||
|---|---|---|---|---|
| n | % | n | % | |
| When there is relevant information | 461 | 78.10 | 233 | 78.20 |
| When driving tired | 99 | 16.80 | 49 | 16.40 |
| When there are traffic accidents | 95 | 16.10 | 51 | 17.10 |
| When there are adverse weather conditions | 83 | 14.10 | 43 | 14.40 |
| When approaching a dangerous zone | 76 | 12.90 | 33 | 11.10 |
| When approaching heavy traffic | 63 | 10.70 | 32 | 10.7 |
| When speed limits are exceeded | 62 | 10.50 | 33 | 11.10 |
| Continuously | 43 | 7.30 | 31 | 10.4 |
| When approaching roadworks | 40 | 6.80 | 18 | 6 |
| When approaching pedestrian zones | 29 | 4.90 | 25 | 8.4 |
| Minutes | 29 | 4.9 | 22 | 7.4 |
| Fixed periods | 29 | 4.9 | 22 | 7.4 |
| Per itinerary | 25 | 4.2 | 10 | 3.4 |
| When approaching schools | 25 | 4.20 | 16 | 5.4 |
| Information Provided by ADAS | Respondents without ADAS (N = 590) | Respondents with ADAS (N = 298) | ||
|---|---|---|---|---|
| n | % | n | % | |
| Approaching an accident | 400 | 67.80 | 214 | 71.80 |
| Approaching a traffic jam | 387 | 65.60 | 193 | 64.80 |
| Driving in a forbidden direction | 368 | 62.40 | 192 | 64.40 |
| Approaching a dangerous section of road | 320 | 54.20 | 172 | 57.70 |
| Approaching roadworks | 271 | 45.90 | 138 | 46.30 |
| Approaching out of order traffic lights | 267 | 45.30 | 118 | 39.60 |
| Approaching a heavy traffic zone | 254 | 43.10 | 152 | 51.00 |
| Approaching dangerous curves | 241 | 40.80 | 122 | 40.90 |
| Approaching a wild animal zone | 210 | 35.60 | 98 | 32.90 |
| Approaching an area with a high density of pedestrians | 206 | 34.90 | 109 | 36.60 |
| Approaching a school zone | 188 | 31.90 | 106 | 35.60 |
| Information Provided by ADAS | Respondents without ADAS (N = 590) | Respondents with ADAS (N = 298) | ||
|---|---|---|---|---|
| n | % | n | % | |
| Starting to suffer from fatigue/tiredness | 356 | 60.30 | 199 | 66.80 |
| Exceeding the maximum speed limit of the road | 296 | 50.20 | 153 | 51.30 |
| Not keeping the safety distance | 215 | 36.40 | 117 | 39.30 |
| Driving erratically | 220 | 37.30 | 132 | 44.30 |
| The air quality is not appropriate | 200 | 33.90 | 112 | 37.60 |
| Driving too aggressively | 189 | 32.00 | 98 | 32.90 |
| Managing other devices while driving | 134 | 22.70 | 69 | 23.20 |
| Temperature is too high inside the car | 99 | 16.80 | 58 | 19.50 |
| Smoking while driving | 28 | 4.70 | 18 | 6.00 |
| Information Provided by ADAS | Respondents without ADAS (N = 590) | Respondents with ADAS (N = 298) | ||
|---|---|---|---|---|
| n | % | n | % | |
| Listen to music | 217 | 36.8 | 104 | 34.90 |
| Do not listen to anything | 177 | 30.0 | 64 | 21.50 |
| To be reminded how important it is to stay alert | 99 | 16.8 | 38 | 12.80 |
| Listen to radio programs | 97 | 16.4 | 92 | 30.90 |
| Information Provided by ADAS | Respondents without ADAS (N = 590) | Respondents with ADAS (N = 298) | ||
|---|---|---|---|---|
| n | % | n | % | |
| Audio notification | 522 | 88.5 | 267 | 89.60 |
| Through vibrations in the safety belt | 80 | 13.6 | 46 | 15.40 |
| Visual notification | 19 | 20.2 | 89 | 29.90 |
| Listen to Music | Listen to Radio Programs | Do Not Listen to Anything | Be Reminded of How Important It Is to Be Alert | |
|---|---|---|---|---|
| Very frequent | 33.33% | 33.33% | 33.33% | 0 |
| Quite frequent | 25.93% | 19.75% | 20.99% | 33.33% |
| Infrequent | 36.38% | 21.54% | 27.37% | 14.70% |
| Rare | 41.88% | 20.51% | 29.91% | 7.69% |
| Criteria | Main Option | Differentiation |
|---|---|---|
| General usefulness of an assistant | Very useful, in more than 90% of cases, in drivers with and without ADAS | By age: for drivers without an assistant, there is less awareness of usefulness for those over the age of 60. By gender: women surveyed that use assistants give them more importance than men when driving through unfamiliar areas. |
| What can be improved on an ADAS? | System interaction and notifications | Interaction with the system: By age: the younger group is critical compared to the other age groups, regarding the graphics and the interaction component with the system. By gender: men give more value to the graphic part than women. |
| Criteria | Main Option | Differentiation |
|---|---|---|
| When do drivers want to receive notifications? | Only when there is something relevant to report. They do not want periodic or programmable notifications. | |
| How do drivers want to receive notifications? | With an audio notification | |
| What do they want to know about? | Approaching an accident; Approaching a traffic jam; Driving in the wrong direction; General weather conditions especially ice; When they start to get tired, when they exceed the maximum speed | In Portugal there is more interest in knowing when driving aggressively, compared to Spanish drivers (51% versus 29%). Additionally, in terms of information on air quality, the Portuguese are more interested in this information (60% against 33%). Information on tiredness is more important for people over 40 (70%) than below this age (57%). Regarding fatigue, women give it less importance (56%) than men (67%). As regards ice on the road, Spanish drivers give more importance to this information (89%) compared to the Portuguese (69%). |
| What they do not want to be informed about | When they are smoking. | |
| Preferential form of relaxation | Listen to music | In Portugal this preference is more pronounced (84%) than in Spain (70%). In drivers without assistants, the % of music choice is higher for women (41%) than men (32%). Those under 40 prefer to listen to music (43%) and only 10% radio. In Portugal, the option “listen to music” is more relevant (49%) than in Spain (31%), where the most relevant is radio (34%). Users of ADAS under 40 prefer to listen to music (45%) rather than radio whilst with users over the age of 60 it is just the opposite. |
| Preferential form of notification in case of distraction | Audio notifications | For the audio notifications there is no differentiation. There is an association by country and by gender for visual notifications, being higher in Portugal than in Spain and in men (37.4%) than in women (19.0%). |
| Preferred way to avoid drowsiness | Drink caffeinated beverages | |
| Use of avatar | Overall, there is no preference for a more user-friendly avatar in relation to a message, either in relation to the avatar image or its gender | In drivers with assistants, in Portugal they prefer a cartoon (41%) while in Spain they have no preference (61%). Regarding gender, there is a strong preference for a female avatar, more chosen by men than women, regardless of being or not users of ADAS. In users of ADAS, there is a greater preference for a female avatar in Portugal (40%) than in Spain (18%). |
| Event | Rule | Recommendation |
|---|---|---|
| Tiredness detected | -Driver model: frequent drowsiness, enjoys driving -Driving status: daytime, 2 h travelled | “It has already been 2 h. Why don’t you take a break?” |
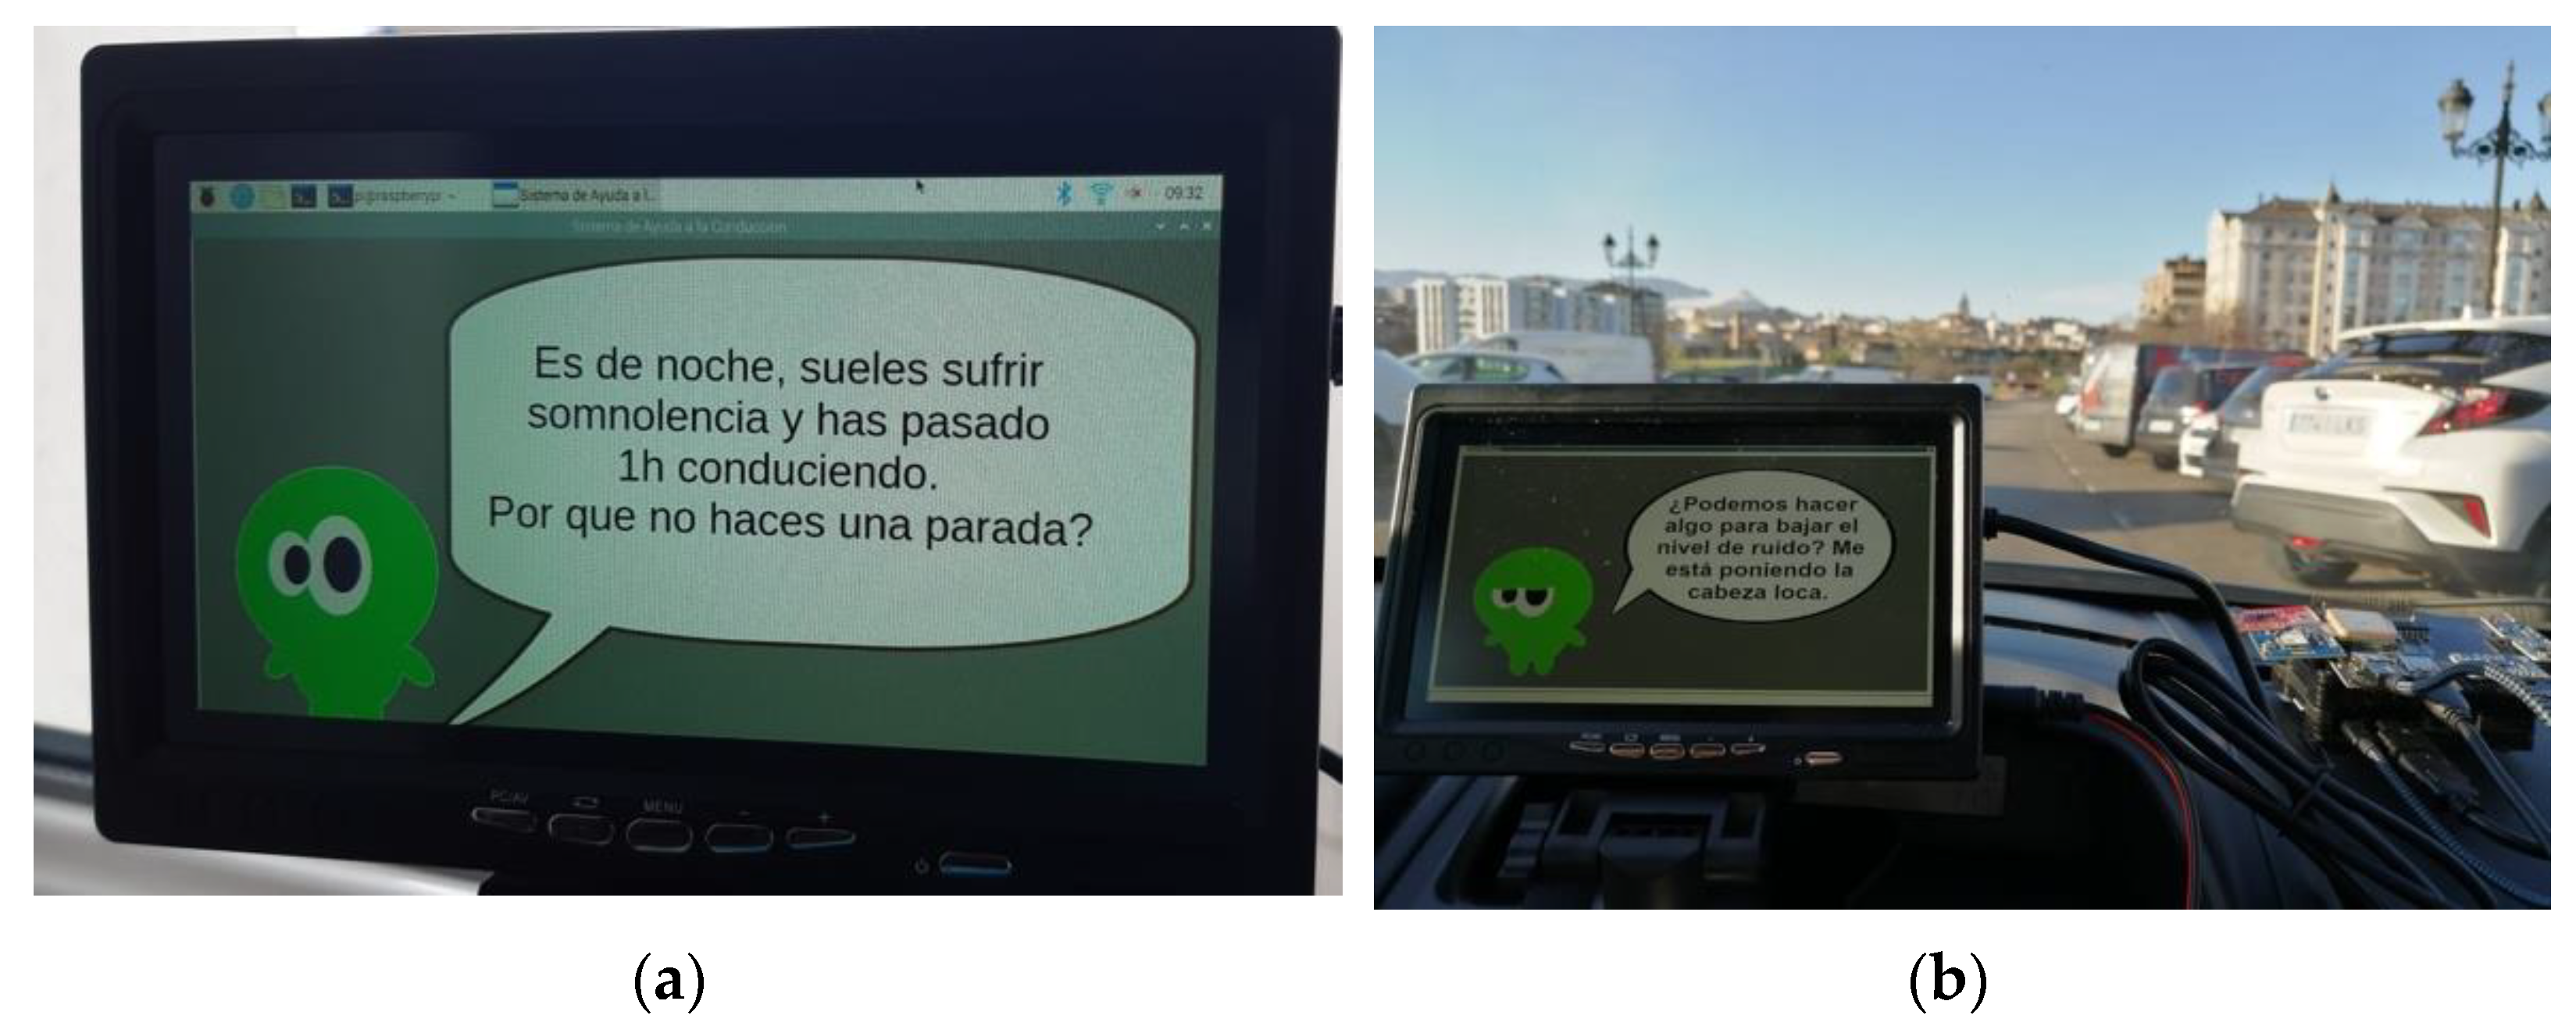
| -Driver model: frequent drowsiness -Driving status: night-time, 1 h travelled | “It is night-time, you tend to suffer from drowsiness, and it has been 1 h. Why don’t you take a break?” (Figure 5a) | |
| -Driver model: infrequent drowsiness, enjoys driving -Driving status: daytime, 3 h travelled | “You should take a break even if you don’t feel tired. It has been 3 h.” | |
| High noise detected | -Driver model: does not enjoy loud music, tends to suffer stress -Driving status: high noise | “Could you turn the music down? It is too loud” (Figure 5b) |
| First trip of the day | -Driver model: gets distracted easily, does not enjoy driving -Driving status: early in the morning, more than 8 h since last trip, bad weather | “Welcome. We have many hours ahead of us and the weather seems to be bad. Today we need to focus.” |
| -Driver model: enjoys driving -Driving status: early in the morning, more than 8 h since last trip, good weather | “Welcome. It is a nice day to be driving, don’t you think? Let’s go!” | |
| High stress detected | -Driver model: tends to suffer stress and does not enjoy driving -Driving status: night-time, high heart rate, driving on a motorway, frequent accelerations and braking | “Is everything ok? I’m detecting stress, it is night-time and your behavior is erratic. Shall we take a break?” |
Publisher’s Note: MDPI stays neutral with regard to jurisdictional claims in published maps and institutional affiliations. |
© 2021 by the authors. Licensee MDPI, Basel, Switzerland. This article is an open access article distributed under the terms and conditions of the Creative Commons Attribution (CC BY) license (https://creativecommons.org/licenses/by/4.0/).
Share and Cite
Paiva, S.; Pañeda, X.G.; Corcoba, V.; García, R.; Morán, P.; Pozueco, L.; Valdés, M.; del Camino, C. User Preferences in the Design of Advanced Driver Assistance Systems. Sustainability 2021, 13, 3932. https://doi.org/10.3390/su13073932
Paiva S, Pañeda XG, Corcoba V, García R, Morán P, Pozueco L, Valdés M, del Camino C. User Preferences in the Design of Advanced Driver Assistance Systems. Sustainability. 2021; 13(7):3932. https://doi.org/10.3390/su13073932
Chicago/Turabian StylePaiva, Sara, Xabiel García Pañeda, Victor Corcoba, Roberto García, Próspero Morán, Laura Pozueco, Marina Valdés, and Covadonga del Camino. 2021. "User Preferences in the Design of Advanced Driver Assistance Systems" Sustainability 13, no. 7: 3932. https://doi.org/10.3390/su13073932