Article

Slow-Release Urea as a Sustainable Alternative to Soybean Meal in Ruminant Nutrition

1
Solutions Deployment Team, Alltech (UK) Ltd., Stamford PE9 1TZ, UK
2
Ruminant Research Department, IRTA Torre Marimon, Caldes Montbui, 08140 Barcelona, Spain
3
Alimetrics Research Ltd., 02920 Espoo, Finland
4
Centre for Applied and Animal Nutrition, Alltech Inc., Nicholasville, KY 40356, USA
5
Regulatory Affairs Department, Alltech European Bioscience Centre, A86 X006 Meath, Ireland
6
Regulatory Affairs Department, Alltech SARL, 14500 Vire, France
*
Author to whom correspondence should be addressed.
Sustainability 2021, 13(5), 2464; https://doi.org/10.3390/su13052464
Submission received: 11 January 2021 / Revised: 20 February 2021 / Accepted: 20 February 2021 / Published: 25 February 2021
(This article belongs to the Special Issue Animal Nutrition and Welfare in Sustainable Production Systems)

Abstract

:
Three experiments were conducted to evaluate the feasibility of using a commercial slow-release urea product (SRU; Optigen®, Alltech Inc., Nicholasville, KY, USA) as a partial replacement for vegetable protein sources in cattle diets. The first experiment was an in vitro rumen fermentation that evaluated the effect of replacing soybean meal (SBM) nitrogen with nitrogen from either SRU or free urea in diets varying in forage:concentrate ratios. The second experiment examined the effect of replacing SBM with SRU on in situ dry matter and nitrogen degradability in the rumen. In the third experiment, a feeding trial was conducted to evaluate the effect of replacing SBM (0% as-fed SRU) with 1% or 3% as-fed SRU on feed carbon footprint (CFP; total greenhouse gas emissions associated with the life cycle of feed raw materials) and the toxicity potential of SRU in growing beef cattle. Results showed that replacing SBM with SRU up to 1.3% did not negatively affect in vitro rumen fermentation parameters. Supplementing SRU favourably decreased ruminal accumulation of ammonia and lactic acid when compared to free urea. There was no significant effect on effective rumen degradability of dry matter and nitrogen when one-third of SBM was replaced by SRU in the in situ study. Compared with the 0% SRU diet, feed CFP decreased by 18% and 54% in 1% SRU and 3% SRU diets, respectively. Additionally, feeding up to 3% SRU diet to beef cattle did not affect health and intake, and blood hematological and biochemical indices were within the physiological range for healthy bulls, suggesting no indication of ammonia toxicity. Overall, these results indicate that SRU can be used as a sustainable alternative to partially replace vegetable protein sources in ruminant diets without compromising rumen function and health of ruminants.

1. Introduction

Ruminants play a crucial role in converting human-inedible resources to high-quality protein (meat and milk) which is vital for meeting the nutritional needs of humans [1]. Increasing population growth, household income and urbanization have contributed significantly to a growing demand for animal protein, which has been projected to increase by 70% between 2005 and 2050 [2,3]. In recent times, the sustainability of the ruminant sector has attracted intense public concerns due to the environmental impacts of the sector. Thus, the ruminant sector is faced with the serious challenge of meeting the growing demand for animal protein while reducing its environmental impacts. The environmental impacts of the ruminant sector are largely due to manure nitrogen excretion and greenhouse gas (GHG) emissions originating mainly from enteric fermentation, as well as feed production, processing and transport [3]. The low nitrogen utilization efficiency of ruminants increases manure nitrogen excretion, which can negatively affect air quality through ammonia volatilization, water quality through nitrate leaching and eutrophication and global warming through the release of nitrous oxide [4,5]. Opio, et al. [6] estimated that GHG emission from the ruminant sector was approximately 5.7 gigatonnes CO2-eq, of which beef and dairy cattle production contribute about 4.6 gigatonnes CO2-eq, representing 65% of the anthropogenic emissions from the livestock sector. Feed emission is the second-largest source of ruminant emissions, contributing about 36% of emissions associated with beef and milk production [3]. Thus, reducing the carbon footprint (CFP) of ruminant feeds is crucial for improving the resource efficiency and environmental performance of the ruminant sector [5,7,8].
Ruminants have the unique capability of converting dietary non-protein nitrogen (NPN) sources, such as urea, into high-quality protein via microbial protein synthesis in the rumen. Traditionally, the low cost of urea has increased its use as a partial substitute for vegetable protein sources, such as SBM (soybean meal) and rapeseed meal, to supply rumen-degradable protein (RDP) in ruminant diets. Moreover, the use of urea products could reduce the effect of land-use changes and GHG emissions associated with the cultivation and processing of plant protein sources, thus improving the resource efficiency and carbon footprint of ruminant production [9,10]. However, the utilization of feed-grade (unprotected) urea in ruminant nutrition is limited due to its rapid ruminal hydrolysis to ammonia, often exceeding the rate of carbohydrate fermentation in the rumen [11]. Asynchronization between ammonia production and fermentable energy availability in the rumen negatively affects the efficiency of microbial protein synthesis. This condition decreases the amount of rumen microbial protein outflow which may reduce the availability of metabolizable protein required to meet the maintenance and production needs of ruminants [12]. The rapid ruminal hydrolysis of feed-grade urea could also reduce the nitrogen utilization efficiency of ruminants, resulting in negative environmental impacts associated with increased nitrogen excretion and ammonia emission from manure [12]. Furthermore, the rapid degradation of dietary urea in the rumen can increase the blood ammonia concentration and increase the risk of ammonia toxicity and related negative health impacts in ruminants [13]. As a consequence, dietary urea supplementation is typically limited to 1% of total dietary dry matter or 0.3 g/kg body weight (BW)/day in animals adapted to urea consumption and fed a diet with an adequate supply of readily fermentable carbohydrates [14].
To alleviate the limitations associated with the use of feed-grade urea, several research efforts have been dedicated to developing coated urea products with a reduced rate of hydrolysis in the rumen and therefore improving the efficiency of microbial protein synthesis, while minimizing nitrogen excretion and toxic effects in ruminants [11]. In earlier research, Owens, et al. [15] estimated that 900 g of urea consumption in tung- and linseed-oil-coated urea would be required to cause ammonia toxicity in steers. Similarly, other slow-release forms of urea supplemented at 1.2–1.9% of the diet have been shown to exert no detrimental effects on the health or performance of ruminants with improved nitrogen use efficiency [16,17,18]. Another commercial slow-release urea product (SRU; Optigen®, Alltech Inc., Nicholasville, KY, USA) involves the use of urea prills embedded in a lipid matrix. The SRU has demonstrated a reduction in the rate of urea degradation in the rumen [18,19] and led to a more consistent concentration of ruminal ammonia compared to feed-grade urea [20]. Indeed, the rate of microbial urea hydrolysis must proceed in synchrony with bacterial ammonia assimilation and fermentable energy availability to maximize microbial protein synthesis in the rumen.
Data from the Dutch FeedPrint software developed by Wageningen University and Research, Wageningen, The Netherlands [21] indicate that the isonitrogenous replacement of soybean meal nitrogen with SRU will reduce the carbon footprint of the diet. However, feeding strategies aimed at utilizing SRU to replace vegetable protein sources must be achieved without impairing rumen function and production performance, and without significant risk of toxicity to animals. In this paper, three studies were conducted to evaluate the feasibility of using SRU to replace vegetable protein sources in cattle diets. The first experiment examined the effect of dietary SRU on in vitro rumen fermentation parameters at different forage:concentrate ratios to understand its potential application across beef diets high in forage or grain. The second experiment was designed to evaluate the effect of replacing vegetable protein with SRU on dry matter and nitrogen degradability using in situ techniques. The third experiment evaluated the impacts of replacing SBM with dietary SRU on feed CFP and the toxicity potential of SRU when fed up to 3% of cattle diet. To test the toxicity potential of SRU, the maximal supplemented SRU dose (i.e., 3%) selected in this experiment was three-fold higher than the maximum dose recommended for free urea [14], but lower than the expected threshold (i.e., 4.8%) for toxicity [15].

2. Materials and Methods

2.1. Experiment 1: In Vitro Evaluation to Determine the Effect of Slow-Release Urea on Rumen Fermentation

2.1.1. Diets, Treatments, and Doses

In this experiment, an in vitro rumen fermentation model developed by Alimetrics Research Ltd. (Espoo, Finland) [22,23] was used to compare the effect of replacing SBM nitrogen with nitrogen from either SRU or urea on the ruminal fermentation of high-forage and high-grain rations. Two basic diets were used in the rumen fermentation study: a high-forage ration consisting of 200 mg DM (dry matter) of wheat and 800 mg DM of grass silage and a high-grain ration consisting of 600 mg DM of wheat and 400 mg DM of grass silage. The total amount of feed introduced in each fermentation vessel was 1000 mg. Each nitrogen supplement, SBM, SRU (Optigen®, Alltech Inc., Nicholasville, KY, USA) and urea, were introduced at three doses. Notably, the SRU (Optigen®) consists of urea evenly coated with a semi-permeable vegetable fat matrix containing 88% urea (41% N, 256% crude protein (CP)) and 11–12% fat [24]. The fat coating in the SRU slows the dissolution of urea, reducing the rate of urea conversion to ammonia in the rumen [19].
The starting point for dose determination was that 20, 60 or 100 mg of each basic ration was replaced by the corresponding amount of SBM (2, 6 and 12% of ration DM). The total nitrogen analysis of the SBM preparation revealed that the amount of nitrogen thus added was 1.07, 3.22 and 5.35 mg, respectively. The doses of SRU and urea were calculated so that the amount of nitrogen added was the same as in 20, 60 and 100 mg of SBM. Since the nitrogen densities in SRU and urea were significantly higher than in SBM, smaller proportions of basic diets were replaced by these nitrogen sources. For SRU, the doses were 2.6, 7.8 and 13.1 mg (0.26, 0.78 and 1.31% of ration DM) and for urea, the doses were 2.3, 6.9 and 11.5 mg in the 1000 mg amount of diet (0.23, 0.69 and 1.15% of ration DM). Each of the 20 treatments was fermented in 5 replicate vessels. Thus, the total number of fermentation vessels was 100. Table 1 summarizes the treatment combinations and dosages used in this study.

2.1.2. Rumen Fermentation Simulation

Individual feed components and test products were weighed in 120 mL serum bottles, flushed with CO2 that had passed through a hot copper catalyst for O2 scavenging and sealed with thick butyl rubber stoppers. In each simulation vessel, 38 mL of anaerobic, reduced, temperature-adjusted (38 °C) buffer solution was added under oxygen-free CO2 flow. Ruminal fluid was obtained from a rumen-fistulated early-lactation Ayshire cow fed ad libitum grass silage (13 kg dry matter with energy 10.8 MJ/kg and CP 16%) and a compound feed at 8 kg DM/day (Opti-Maituri 26, Lantmännen Feed Oy, Turku, Finland; energy 12.8 MJ/kg, CP 26%). Finally, 2 mL of fresh, strained rumen fluid was added to the serum bottles, where the final volume was 40 mL. This inoculation started the actual fermentation. Inoculation time for each vessel was registered and considered when sampling and stopping the fermentation. Details of the protocol are described by Meissner, et al. [23] and Apajalahti, et al. [22].

2.1.3. Analytical Procedures

Rumen fermentation simulation was continued for 24 h at 38 °C. During fermentation, the total gas production was measured after 3, 6, 9, 12 and 24 h of simulation fermentation to reveal the general metabolic activity of rumen microbes. Volatile fatty acids (VFA), lactic acid and pH were measured in all simulation vessels at 0, 9 and 12 h by taking 1 mL of the inoculum from each vessel through the rubber stopper using a 1 mL syringe and needle. The short-chain fatty acids (lactic acid and VFA) were analyzed by gas chromatography using a packed column for the analysis of free acids as described in detail by Apajalahti, et al. [22]. In brief, the following volatile fatty acids were analyzed: acetic, propionic, butyric, valeric, isobutyric, 2-methylbutyric and isovaleric acid. The main non-volatile fatty acid quantified was lactic acid. In this paper, all these acids are cumulatively referred to as short-chain fatty acids (SCFA). In the gas chromatographic analysis, a glass column packed with 80/120 Carbopack B-DA/4% Carbowax stationary phase was used. The use of this column enabled quantification of the free acids, with no derivatization. Pivalic acid was used as an internal standard (Sigma-Aldrich, St. Louis, MO, USA). The analytical chromatography run was isothermal at 175 °C (Agilent Technologies, Santa Clara, CA, USA), helium was used as a carrier gas and analytes were detected by flame ionization.
Total bacteria density was analyzed at 12 h in all the simulation vessels. Bacterial samples were fixed with formaldehyde, stained with DNA-specific dye SYTO® 24 and the total bacteria were enumerated by flow cytometry using settings adjusted to the counting of bacteria. The details of the method have been described by Apajalahti, et al. [25]. The samples from simulation vessels were analyzed for ammonia at 0, 3, 9 and 12 h. Ammonia analysis was performed by using a colorimetric method described by Weatherburn [26] modified from the Berthelot reaction [27]. The method was based on the reaction of phenol and hypochlorite with ammonia, resulting in color formation and the color intensity was measured with a spectrophotometer.

2.2. Experiment 2: In Situ Evaluation to Determine the Effect of Slow-Release Urea on Feed Degradability in the Rumen

2.2.1. Diets, Treatments and In Situ Incubation

Two rumen-fistulated cows in mid-lactation were fed with grass silage (CP = 16.4% of DM) and a compound feed mixture (CP = 12.4% of DM) of hay, oats, wheat and protein-rich meals (soy, pea and/or rapeseed), and were used to examine the effect of SRU (i.e., Optigen®) on in situ dry matter (DM) and nitrogen degradation. Two test diets (control and SRU) were formulated as shown in Table 2. The control diet had no SRU whereas the SRU diet contained one-third of the SBM in the control diet, replaced with an isonitrogenous amount of SRU (0.75%). Thus, a cow consuming 20 kg DM/day of a total mixed ration would have been provided 150 g of SRU. The CP content of both diets was 19.9%. Dacron bags (10 cm × 20 cm; 53 μm pore size; ANKOM Technology Corp., Fairport, NY, USA) containing 5 g of the corresponding test diets were incubated in the rumen of the two cows. At 0 h, there were 6 replicate bags and 3 replicates for the other time points. Bags were withdrawn from the rumen after 0, 2, 5, 8, 16, 24 and 48 h of incubation. The bags were immediately dipped in cold water to stop fermentation, after which the bags were rinsed with water and the excess water was removed with a spin dryer and the bags were freeze-dried.

2.2.2. Analysis of Dry Matter and Nitrogen Degradation

Residual dry matter in the Dacron bags was determined by weighing the bags after drying and dry matter (DM) residues in three replicate bags were determined. The nitrogen content in the feed residues was determined by the Kjeldahl method [28]. In situ degradation curves of DM and nitrogen were fitted to a non-linear model [29] using the equation:
Y = a + b   [ 1 e K d ( t ) ]
where Y = ruminal degradation of DM or nitrogen (%); a = rapidly soluble fraction that disappeared at 0 h after the rinsing procedure; b = potentially degradable fraction; Kd = constant rate of degradation of fraction b; and t = time of incubation (h). The undegradable fraction, c, was calculated as 100 − (a + b). Effective rumen degradability (ERD) was determined by the equation:
ERD = a + [ b K d / ( K d + K p ) ]
where a, b and Kd are the degradation constants described previously [29] and Kp is the passage rate from the rumen (%/h) assumed fixed at 0.06/h. Degradation constants of DM and nitrogen described above were estimated using the NLIN procedure of SAS (Statistical Analysis Systems, Cary, NC, USA) [30].

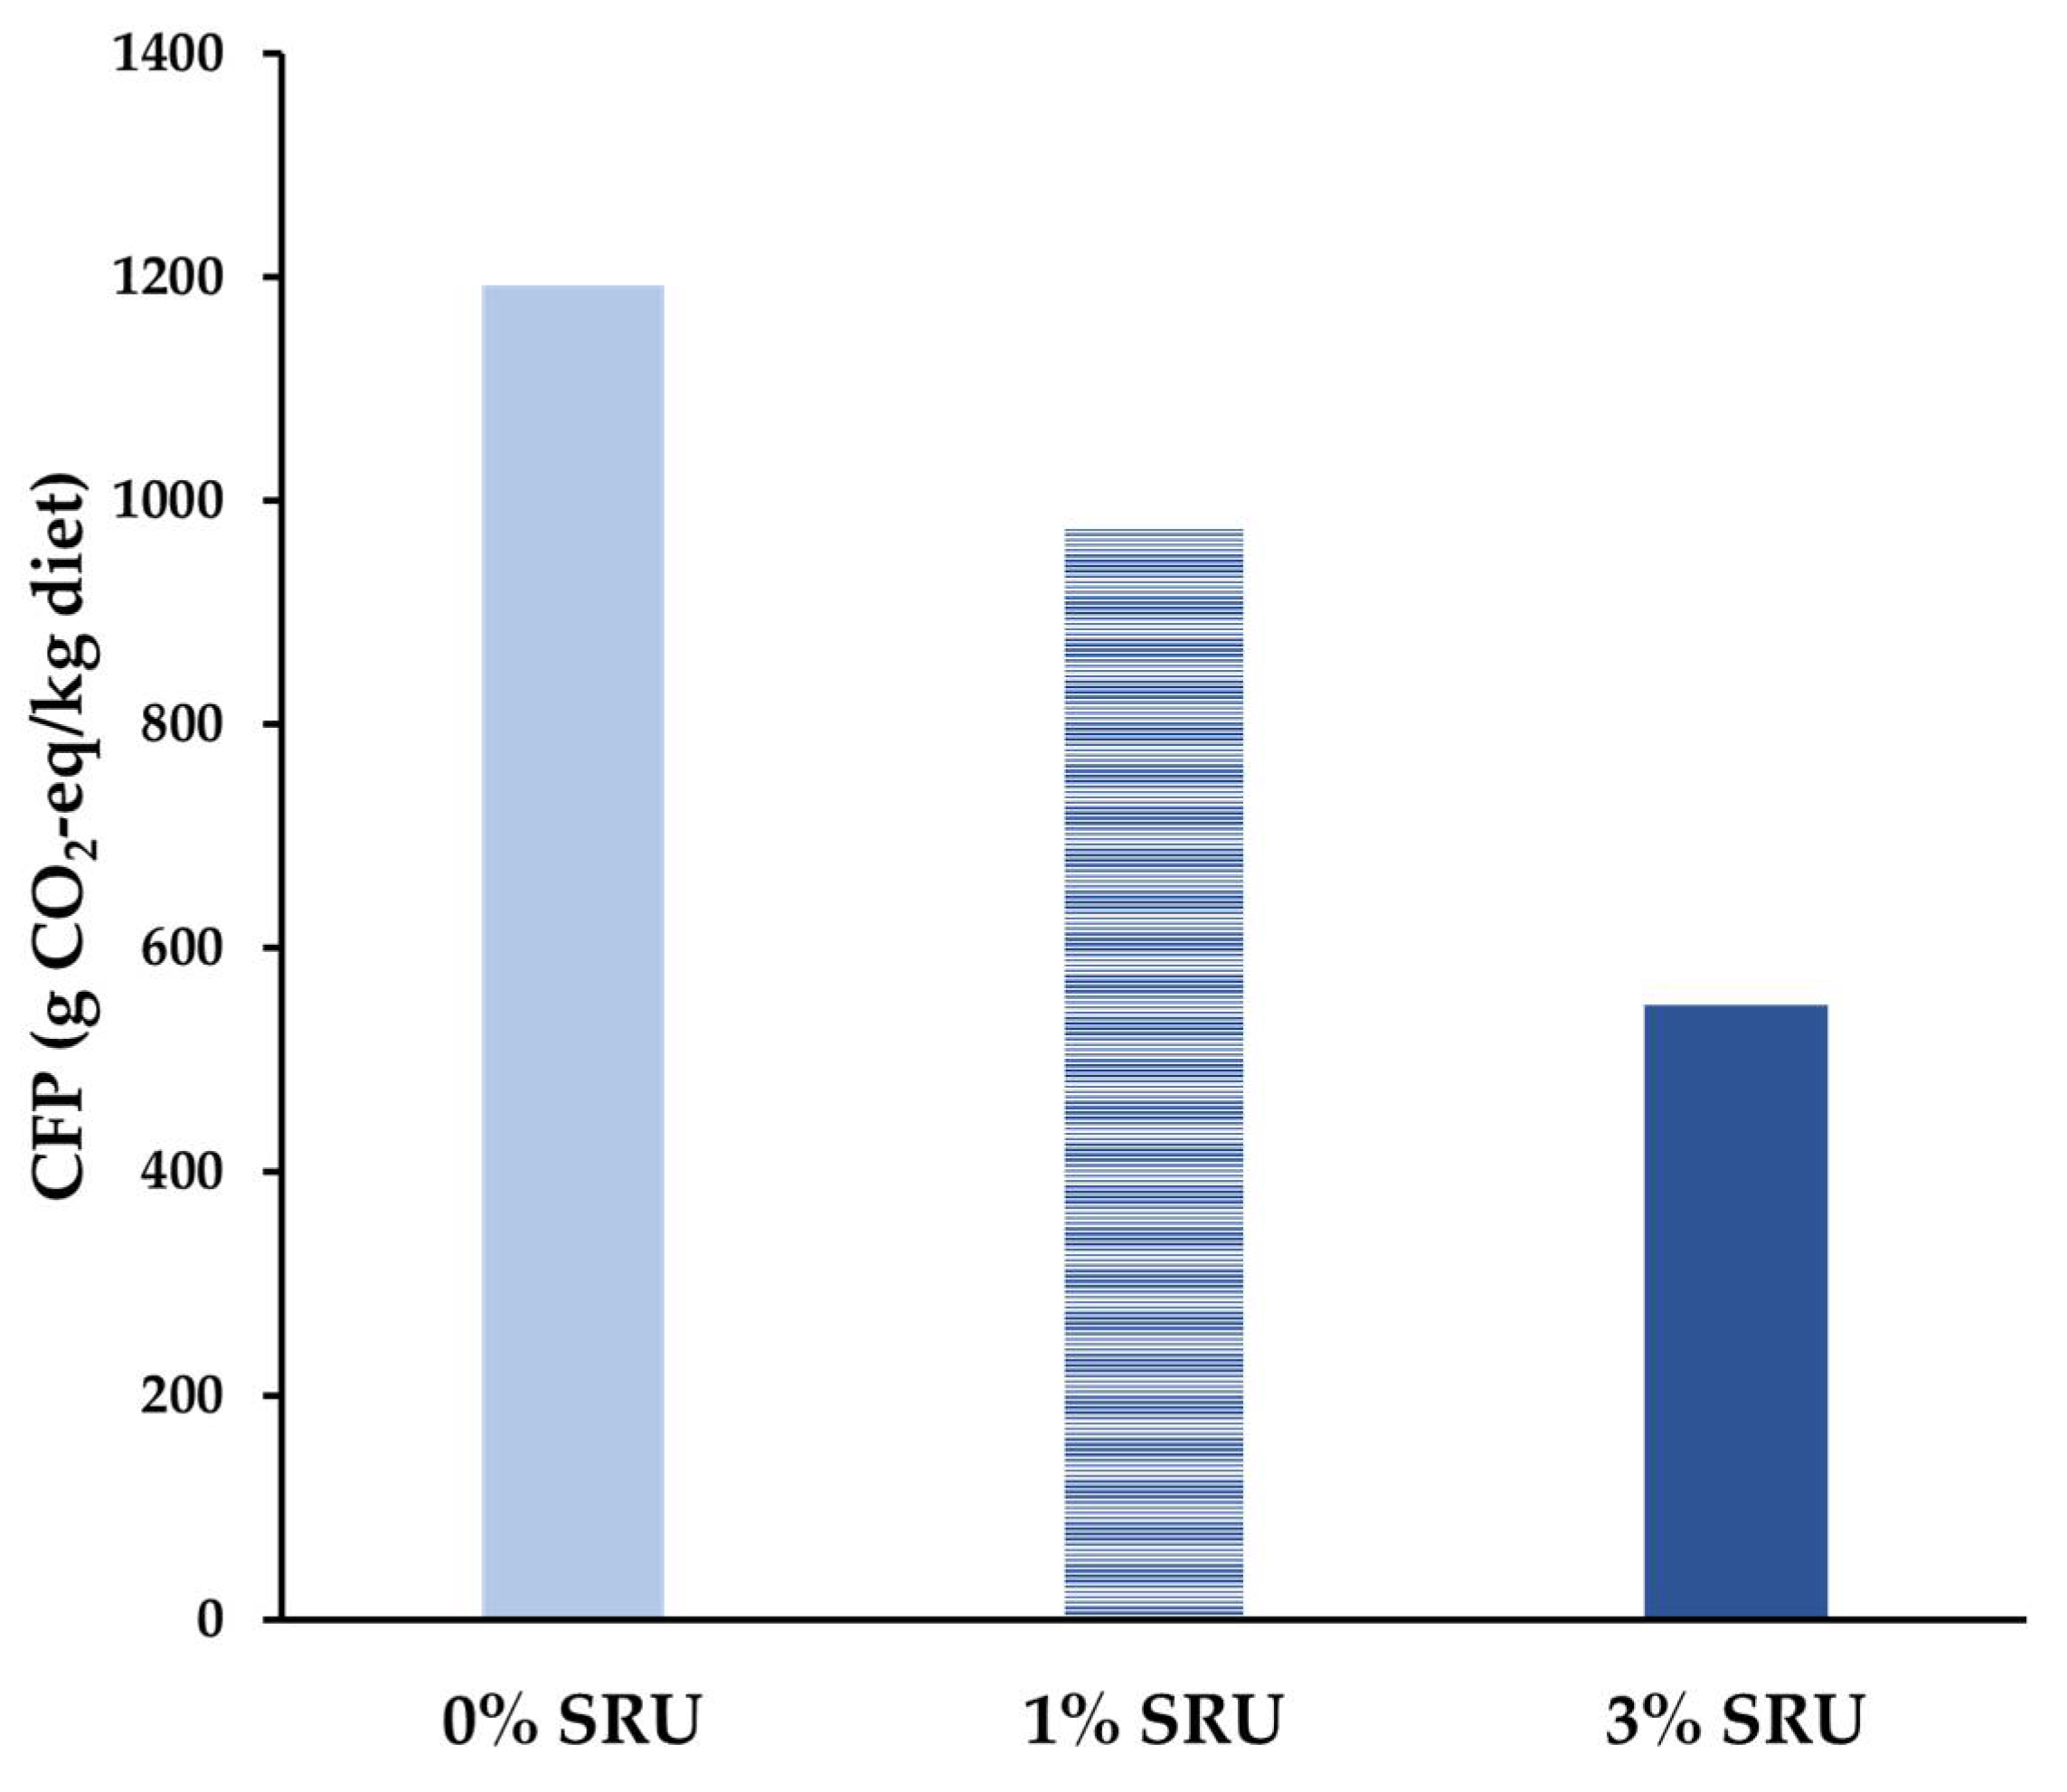
2.3. Experiment 3: In Vivo Trial to Evaluate Feed Carbon Footprint and Toxicity Potential of Slow-Release Urea in Cattle

The research protocol and animal care followed the European Union Directive 2010/63/EU on the protection of animals used for experimental or other scientific purposes and were managed according to the regulations of the Animal Care Committee of the Institute of Agrifood Research and Technology (IRTA), Spain. The animal experiment was conducted at the Corporació Alimentaria de Guissona Experimental Station, Lleida, Spain.

2.3.1. Animals, Diets and Experimental Design

Twenty-four growing Holstein bulls (3–4 months of age) were commercially-sourced and subjected to the following preventive treatments before the start of the experiment: Draxxin® (intravenous injection of tulathromycin, 2.5 mg/kg BW, Pfizer Animal Health, Parsippany-Troy Hills, NJ, USA) to prevent intercurrent respiratory disease; Vectimax® (subcutaneous injection of ivermectin, 0.2 mg/kg BW, Esteve Veterinaria, Barcelona, Spain) for internal and external parasites; CattleMaster® (subcutaneous application of a vaccine against IBR, BVD, PI3, BRSV, 2 mL/animal, Pfizer Animal Health), to prevent relevant viral respiratory diseases affecting young ruminants; Vecoxan® (oral Diclazuril, 1 mg/kg BW, Esteve Veterinaria) to prevent coccidiosis.
The growing Holstein bulls were blocked by liveweight (128.1 ± 14.2 kg) and randomly assigned to one of three treatments: a control diet, basal mash feed (CON, 0% SRU) or the basal diet reformulated to include SRU (i.e., Optigen®) at a rate of 1% (1% SRU) or 3% (3% SRU) of the diet on an as-fed basis. Energy and CP levels were maintained in the SRU diets by replacing SBM with SRU, barley grain meal and corn grain meal; the ingredient and nutrient composition of diets are presented in Table 3. The SRU was added in meal form to the complete feed and thoroughly mixed. Diets contained no antibiotics or other growth promoters. Trace minerals and other nutrients were supplied at nutritional concentrations according to the NRC requirements [31]. Basal diets were calculated to be iso-nutritive, to meet the nutrient requirements recommended for growing ruminants [31]. Bulls were allocated to an individual, partially slatted pens (2.40 × 1.45 m), with two feeders in each pen (one for mash feed and one for straw), which were hand-filled daily. Animals were allowed ad libitum access to both the mash feed and straw and an automatic watering device was available in each pen. The experimental feeding period lasted for 42 days. All animal handling and laboratory staff were blinded to the study diets.
Animal liveweights were determined on d 0, 21 and 42. Individual intake of the experimental mash diets was recorded daily, while the straw intake was recorded weekly. Animal health, culls and mortality were recorded daily. Blood samples were collected from each animal on d 0 and 42 (1 h post-feeding) for routine hematological and biochemical analysis (total blood cell counts, hemoglobin, hematocrit, aspartate aminotransferase, alanine aminotransferase, gamma-glutamyl transferase, glucose, uric acid, albumin, total protein, urea, and ammonia). Blood samples were taken via jugular venipuncture using a vacutainer and an 18 G needle. For hematology, 4 mL of blood was collected in EDTA vacutainer tubes (BD, Franklin Lakes, NJ, USA), inverted and stored at 5 °C until analysis. For biochemistry analysis, 10 mL of blood was collected in spray-dried clot activator vacutainer tubes (BD, Franklin Lakes, NJ, USA). For glucose analysis, 4 mL of blood was collected in sodium fluoride and potassium oxalate vacutainer tubes (BD, Franklin Lakes, NJ, USA). For ammonia analysis, 4 mL of blood was collected in EDTA dipotassium salt vacutainer tubes (BD, Franklin Lakes, NJ, USA). The vacutainer tubes for biochemistry, glucose and ammonia were then centrifuged at 1500× g at 4 °C for 15 min and the serum from each tube was equally divided between three Eppendorf tubes.

2.3.2. Chemical Analysis

Proximal analysis and the urea concentration of each experimental diets was determined using the following methods: Crude protein (AOAC 988.05); Crude fat (AOAC 920.39); Ash (AOAC 642.05); Moisture (AOAC 925.04); Neutral Detergent Fiber [32]; Urea (AOAC 967.07). Plasma glucose concentration was determined following the hexokinase method, serum aspartate aminotransferase and alanine aminotransferase following recommended IFCC reference method, without pyridoxal phosphate addition, serum urea following GLDH method, serum uric acid following uricase/peroxidase method, serum ammonia method by molecular absorption spectrometry, serum albumin following bromocresol green method, and serum total protein following biuret method (OSR, Winston-Salem, NC, USA). For hematology analyses, the ADVIA 120 Hematology System developed by the manufacturer (Siemens Healthcare GmbH, Erlangen Germany) was used. The following parameters were measured using flow cytometry methods and specific staining such as peroxidase and basophilic staining: red cell count, hemoglobin, packed cell volume, mean corpuscular volume, mean corpuscular hemoglobin, cell hemoglobin concentration mean, white cell count, percentage and number of neutrophils, lymphocytes, monocytes, eosinophils and platelet count.

2.3.3. Calculations

The impact of replacing SBM with SRU on feed CFP was determined by calculating the sum of the CFP of feed raw materials in 0% SRU, 1% SRU and 3% SRU diets. The CFP values (including land-use changes) of feed raw materials were retrieved from the Dutch FeedPrint software developed by Wageningen University and Research, Wageningen, The Netherlands [21]. The FeedPrint calculates the CFP of feed raw materials during their complete life cycle and it has been developed to gain insight into GHG emissions during the production and utilization chain of feed and to identify mitigation options. Supplementary Table S1 presents the CFP of the common feed raw materials used for the estimation of feed CFP. The contribution of the feed raw materials to the feed CFP was estimated by multiplying the inclusion level of the raw material and the CFP per kg of raw material (g CO2-eq/kg). The average feed CFP was expressed as g CO2-eq/kg diet. Figure 1 shows that replacing SBM (0% SRU) with 1% and 3% SRU in the diets of growing bulls decreased calculated feed CFP by 18% and 54%, respectively.

2.4. Statistical Analysis

For experiment 1 (in vitro fermentation study), the experimental unit was the individual fermentation vessel. For each of the two diets (high-forage or high-grain), there were ten experimental groups: a control group and three nitrogen supplements (SBM, SRU and urea) each at three levels of nitrogen (low, medium or high). All data were subjected to one-way ANOVA as a factorial arrangement, to determine the effect of dietary treatment on rumen fermentation parameters. Tukey’s HSD test was used for multiple comparisons of treatment means when significance was detected at p < 0.05 and a tendency for treatment effect was observed when 0.05 < p ≤ 0.10. Statistical analyses were performed using Minitab® software (Minitab, v18, State College, TX, USA). Data from experiment 2 (in situ degradability study) were analyzed as a linear mixed model to test the effect of the diets as a fixed factor and the cow was considered as a random term using SAS® software. Diet effect was declared significant when p < 0.05. For experiment 3 (in vivo study), feed intake data were analyzed using a linear mixed-effects model with repeated measurements using SAS® software. The model accounts for the fixed effects of treatment, time and the interaction between these two factors, plus the random effect of the pen as the experimental unit and the initial body weight as a covariate. Blood parameters at 42 d were analyzed using a linear model with the fixed effects of treatment including data of day 0 as covariate plus the random effect of the pen. Tukey’s HSD test was used for multiple comparisons of treatment groups when a significant effect of the treatment was found at p < 0.05 for growth performance parameters and p ≤ 0.10 for blood indices.

3. Results

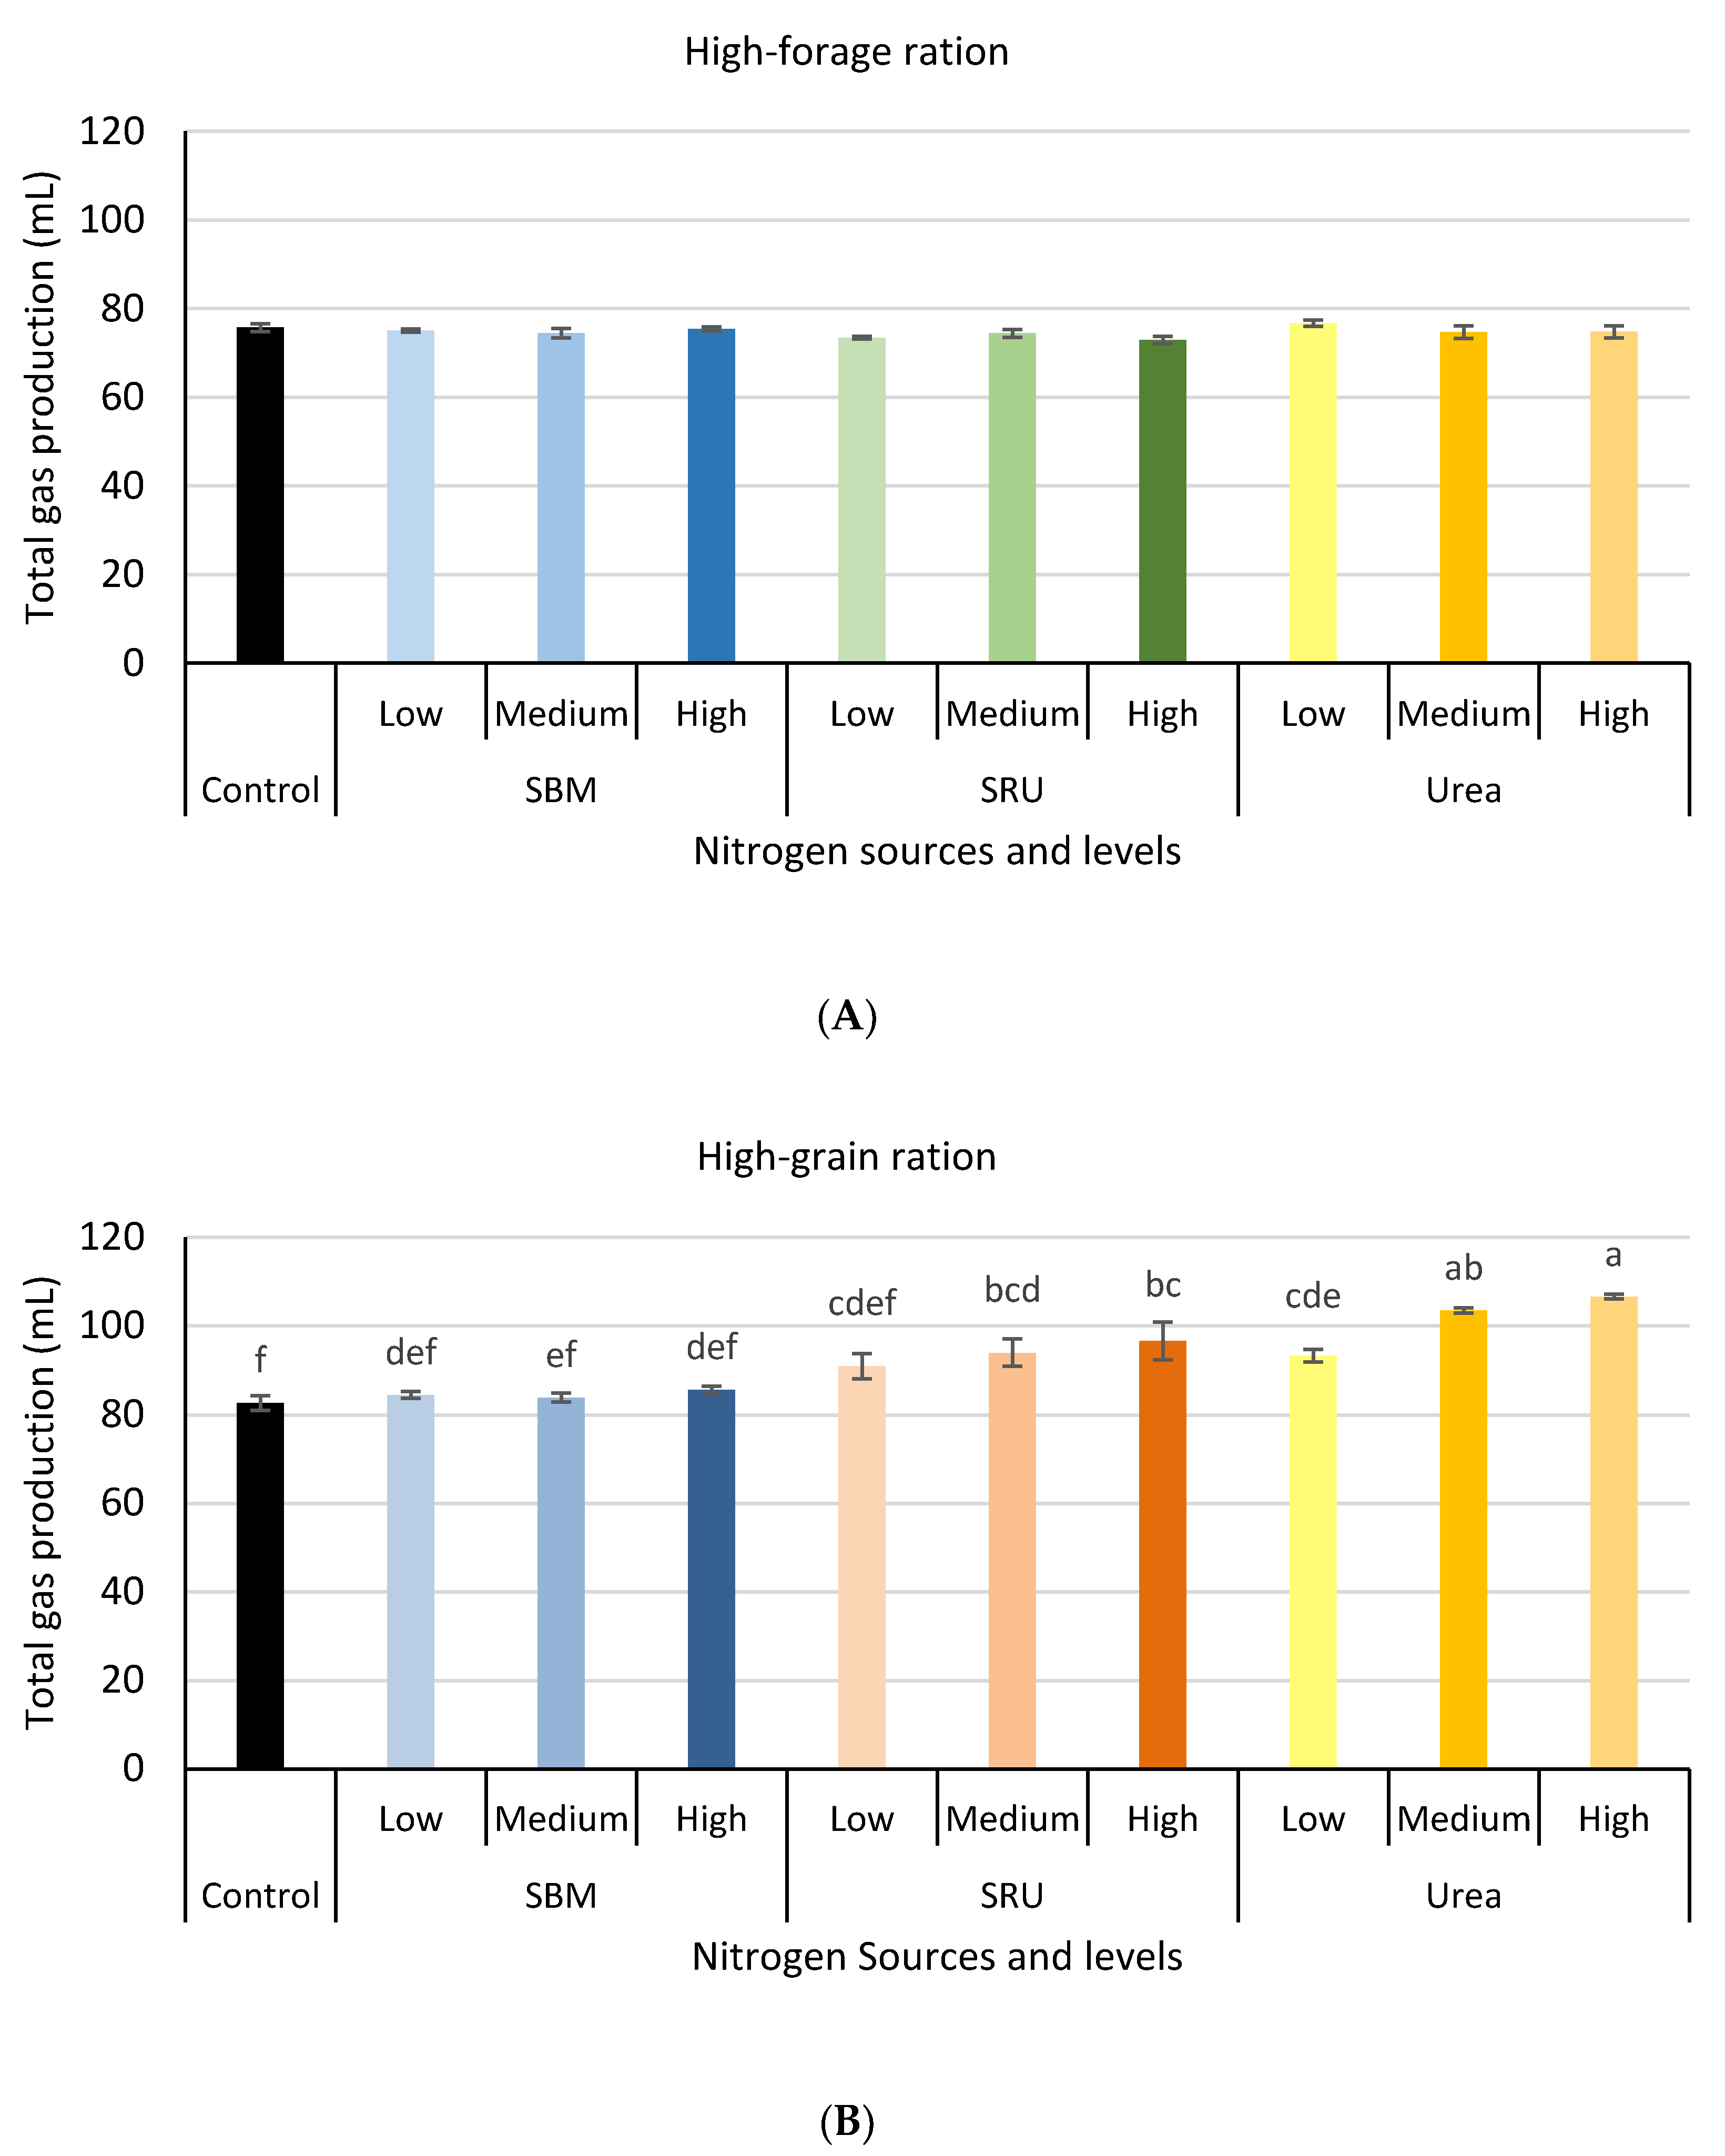
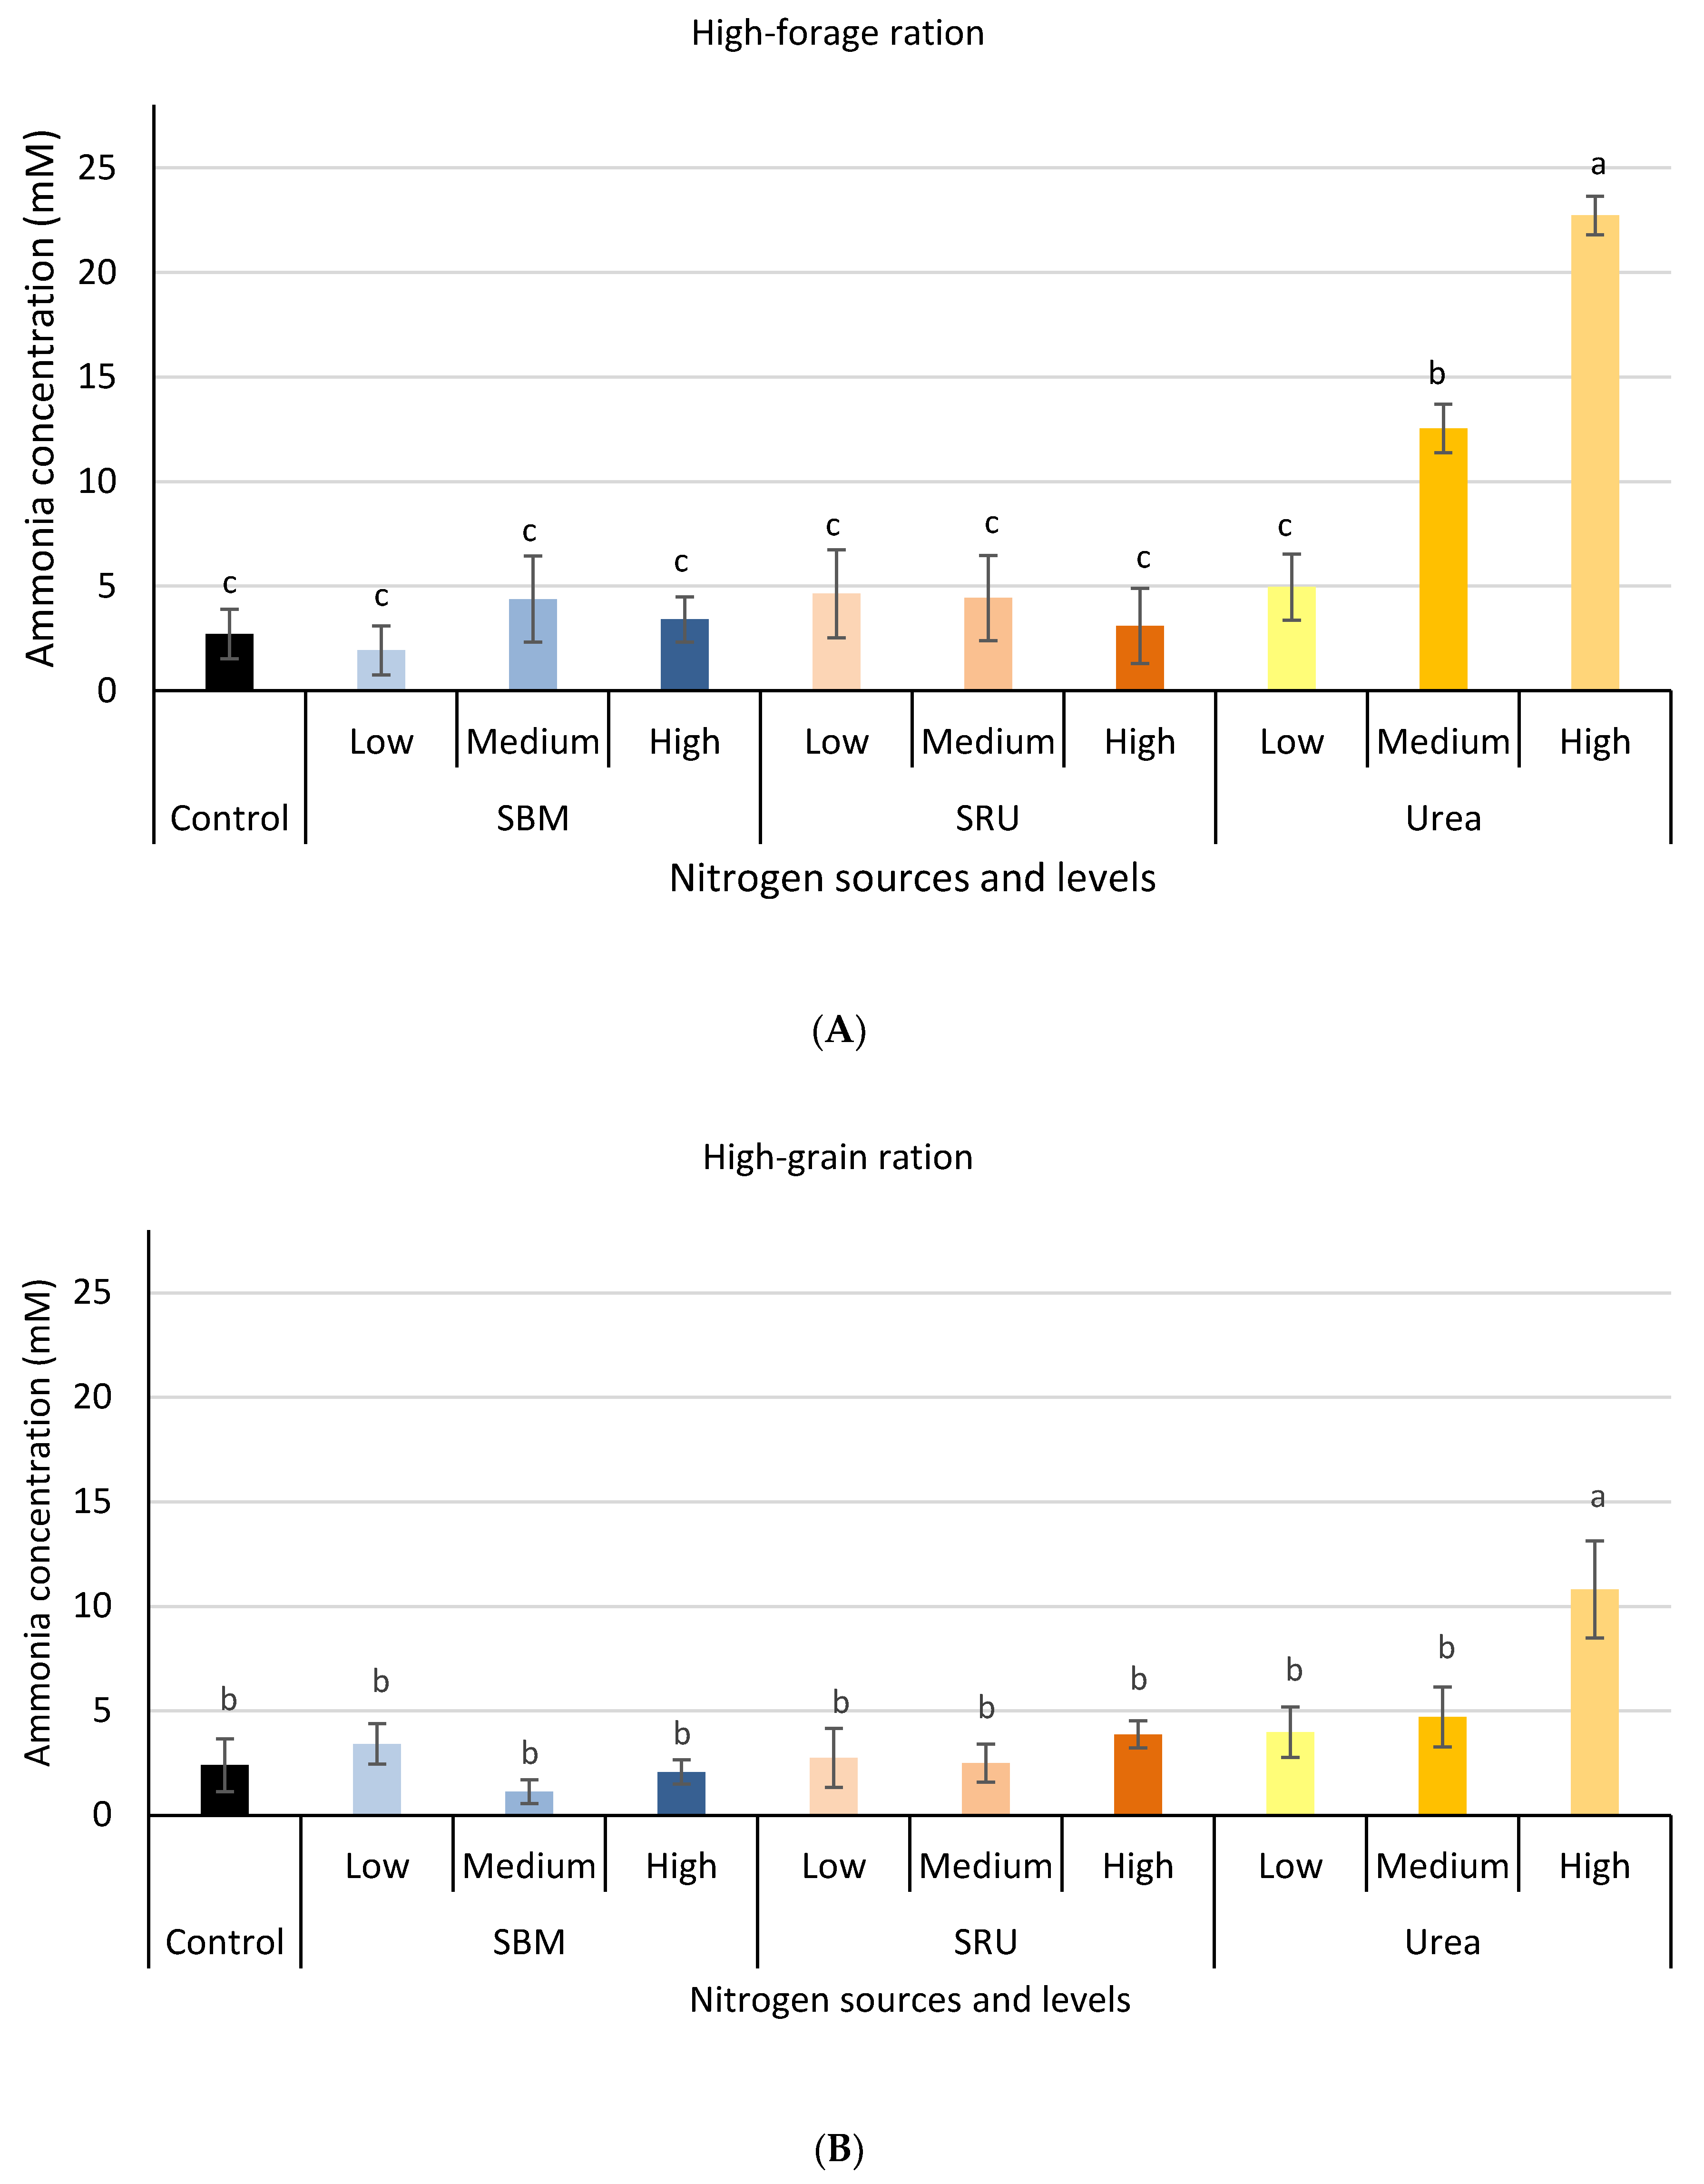
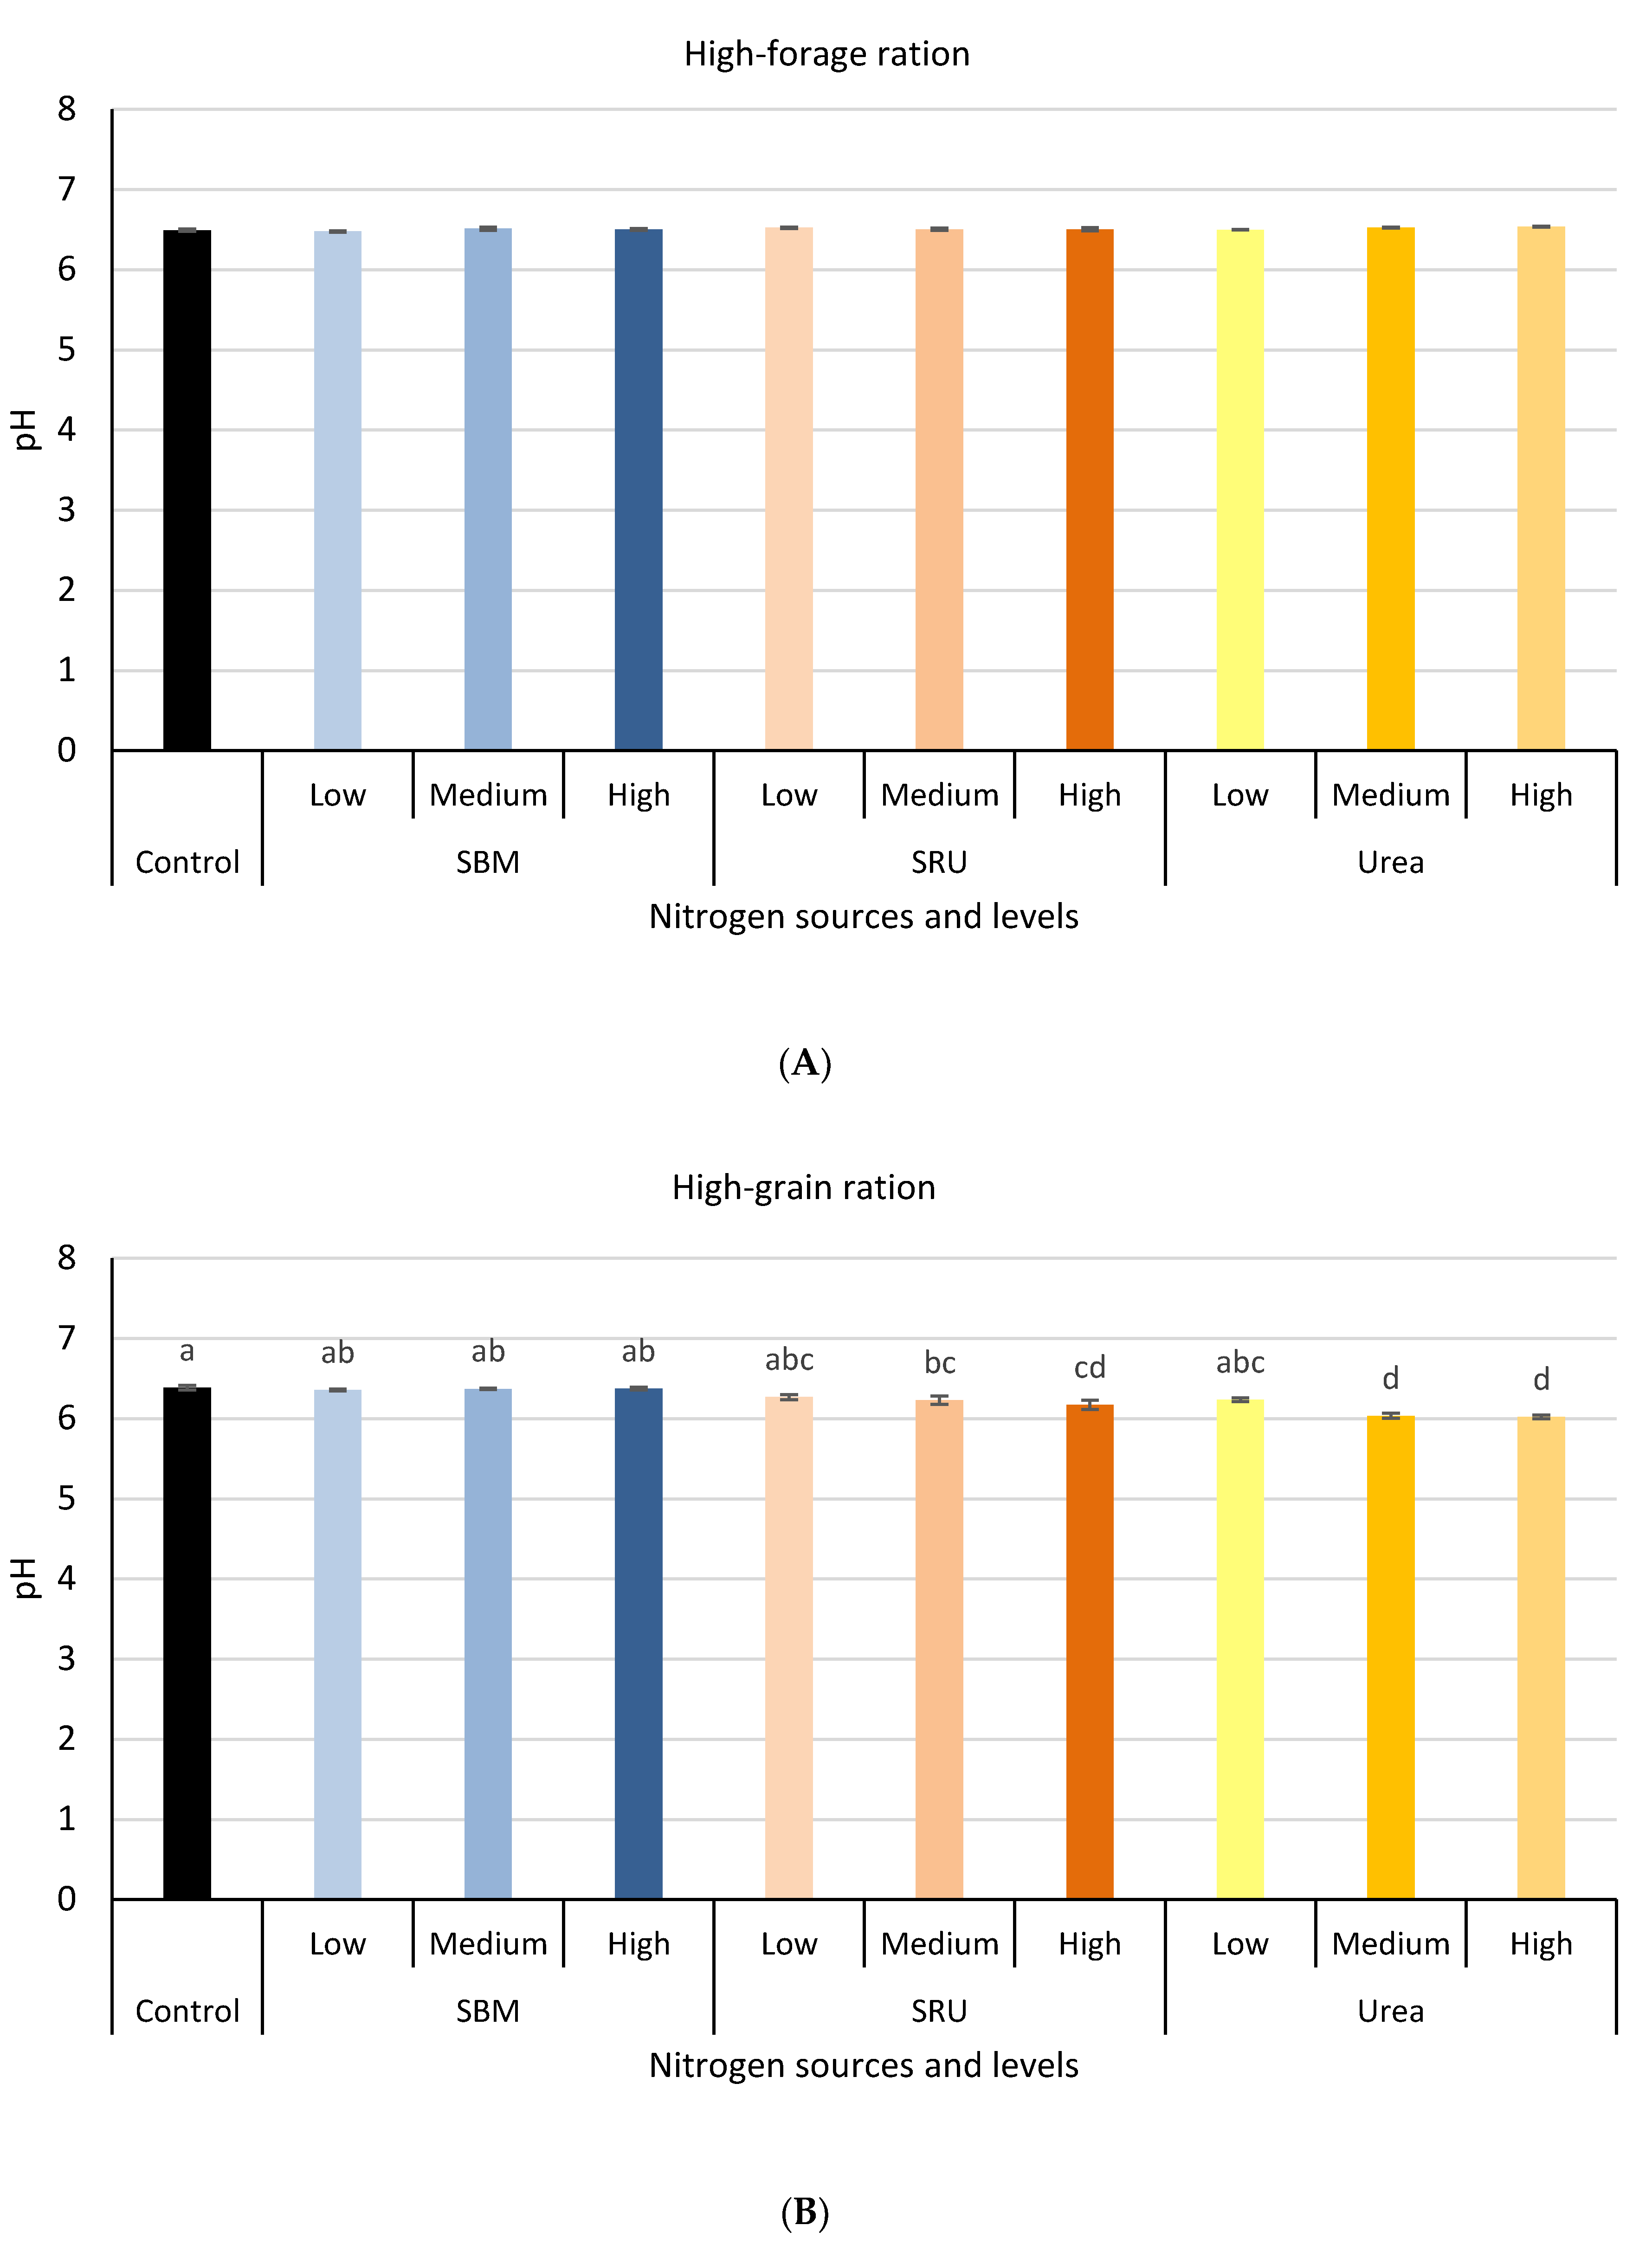
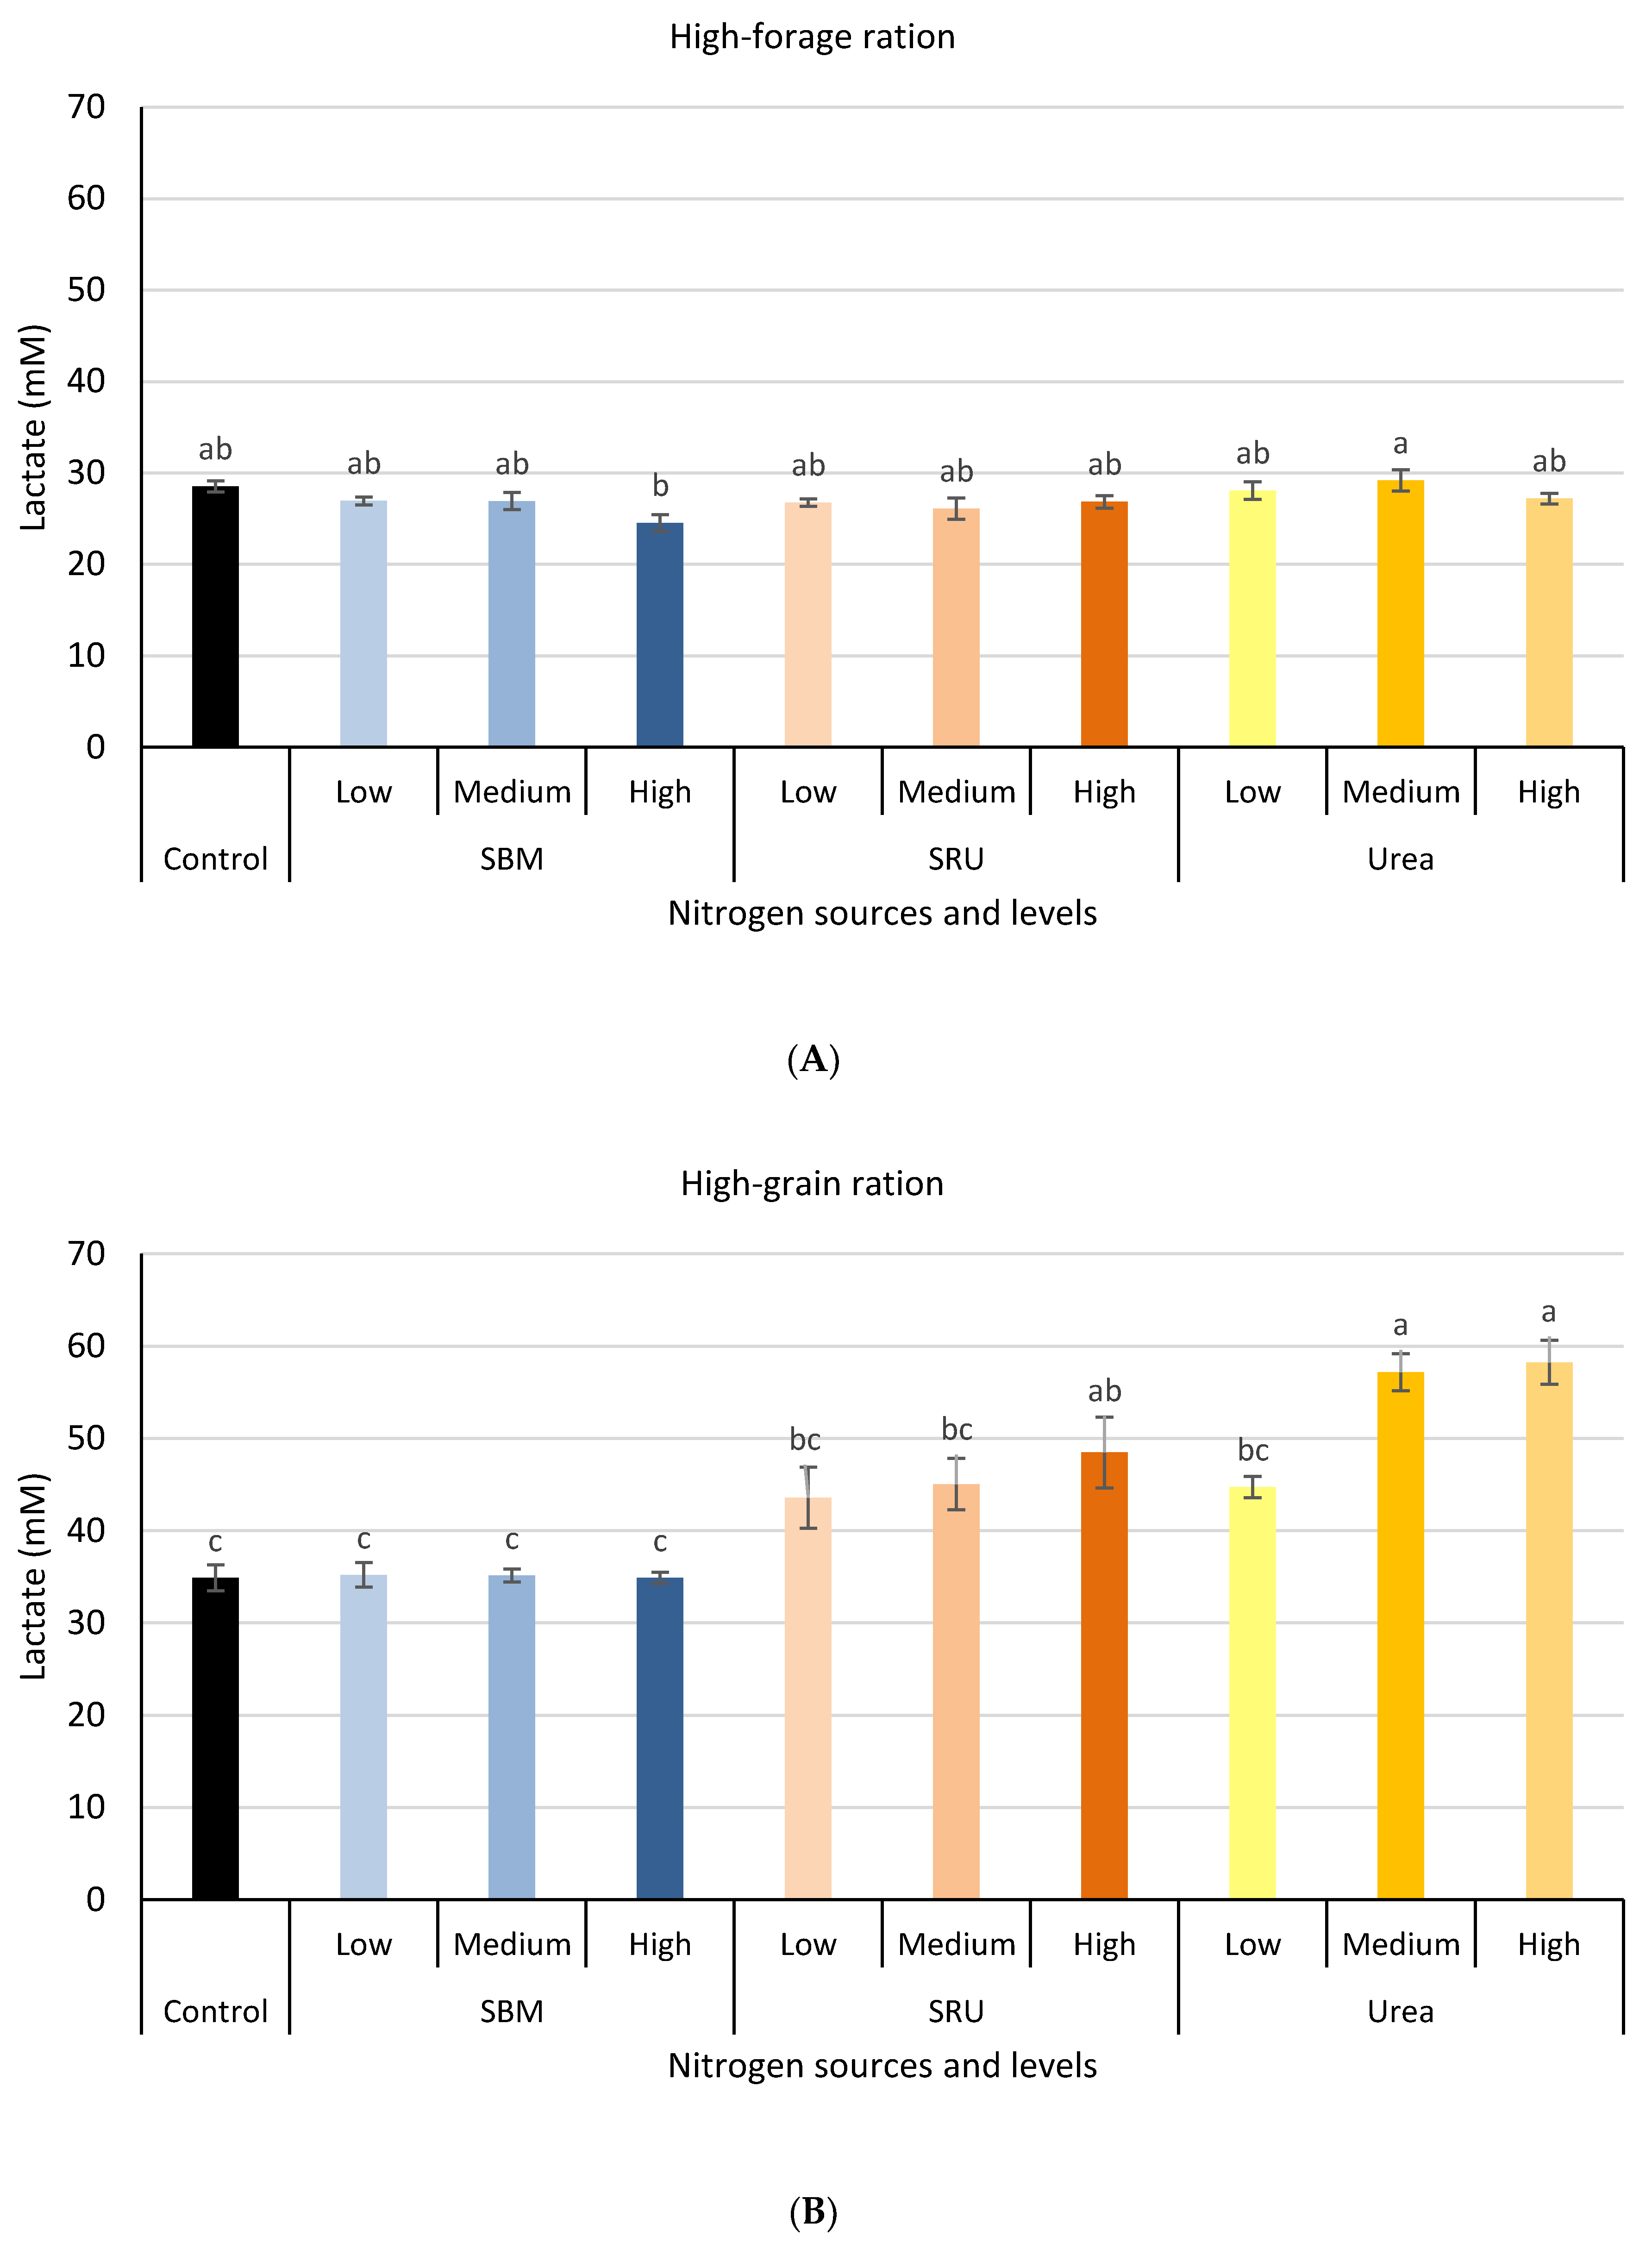
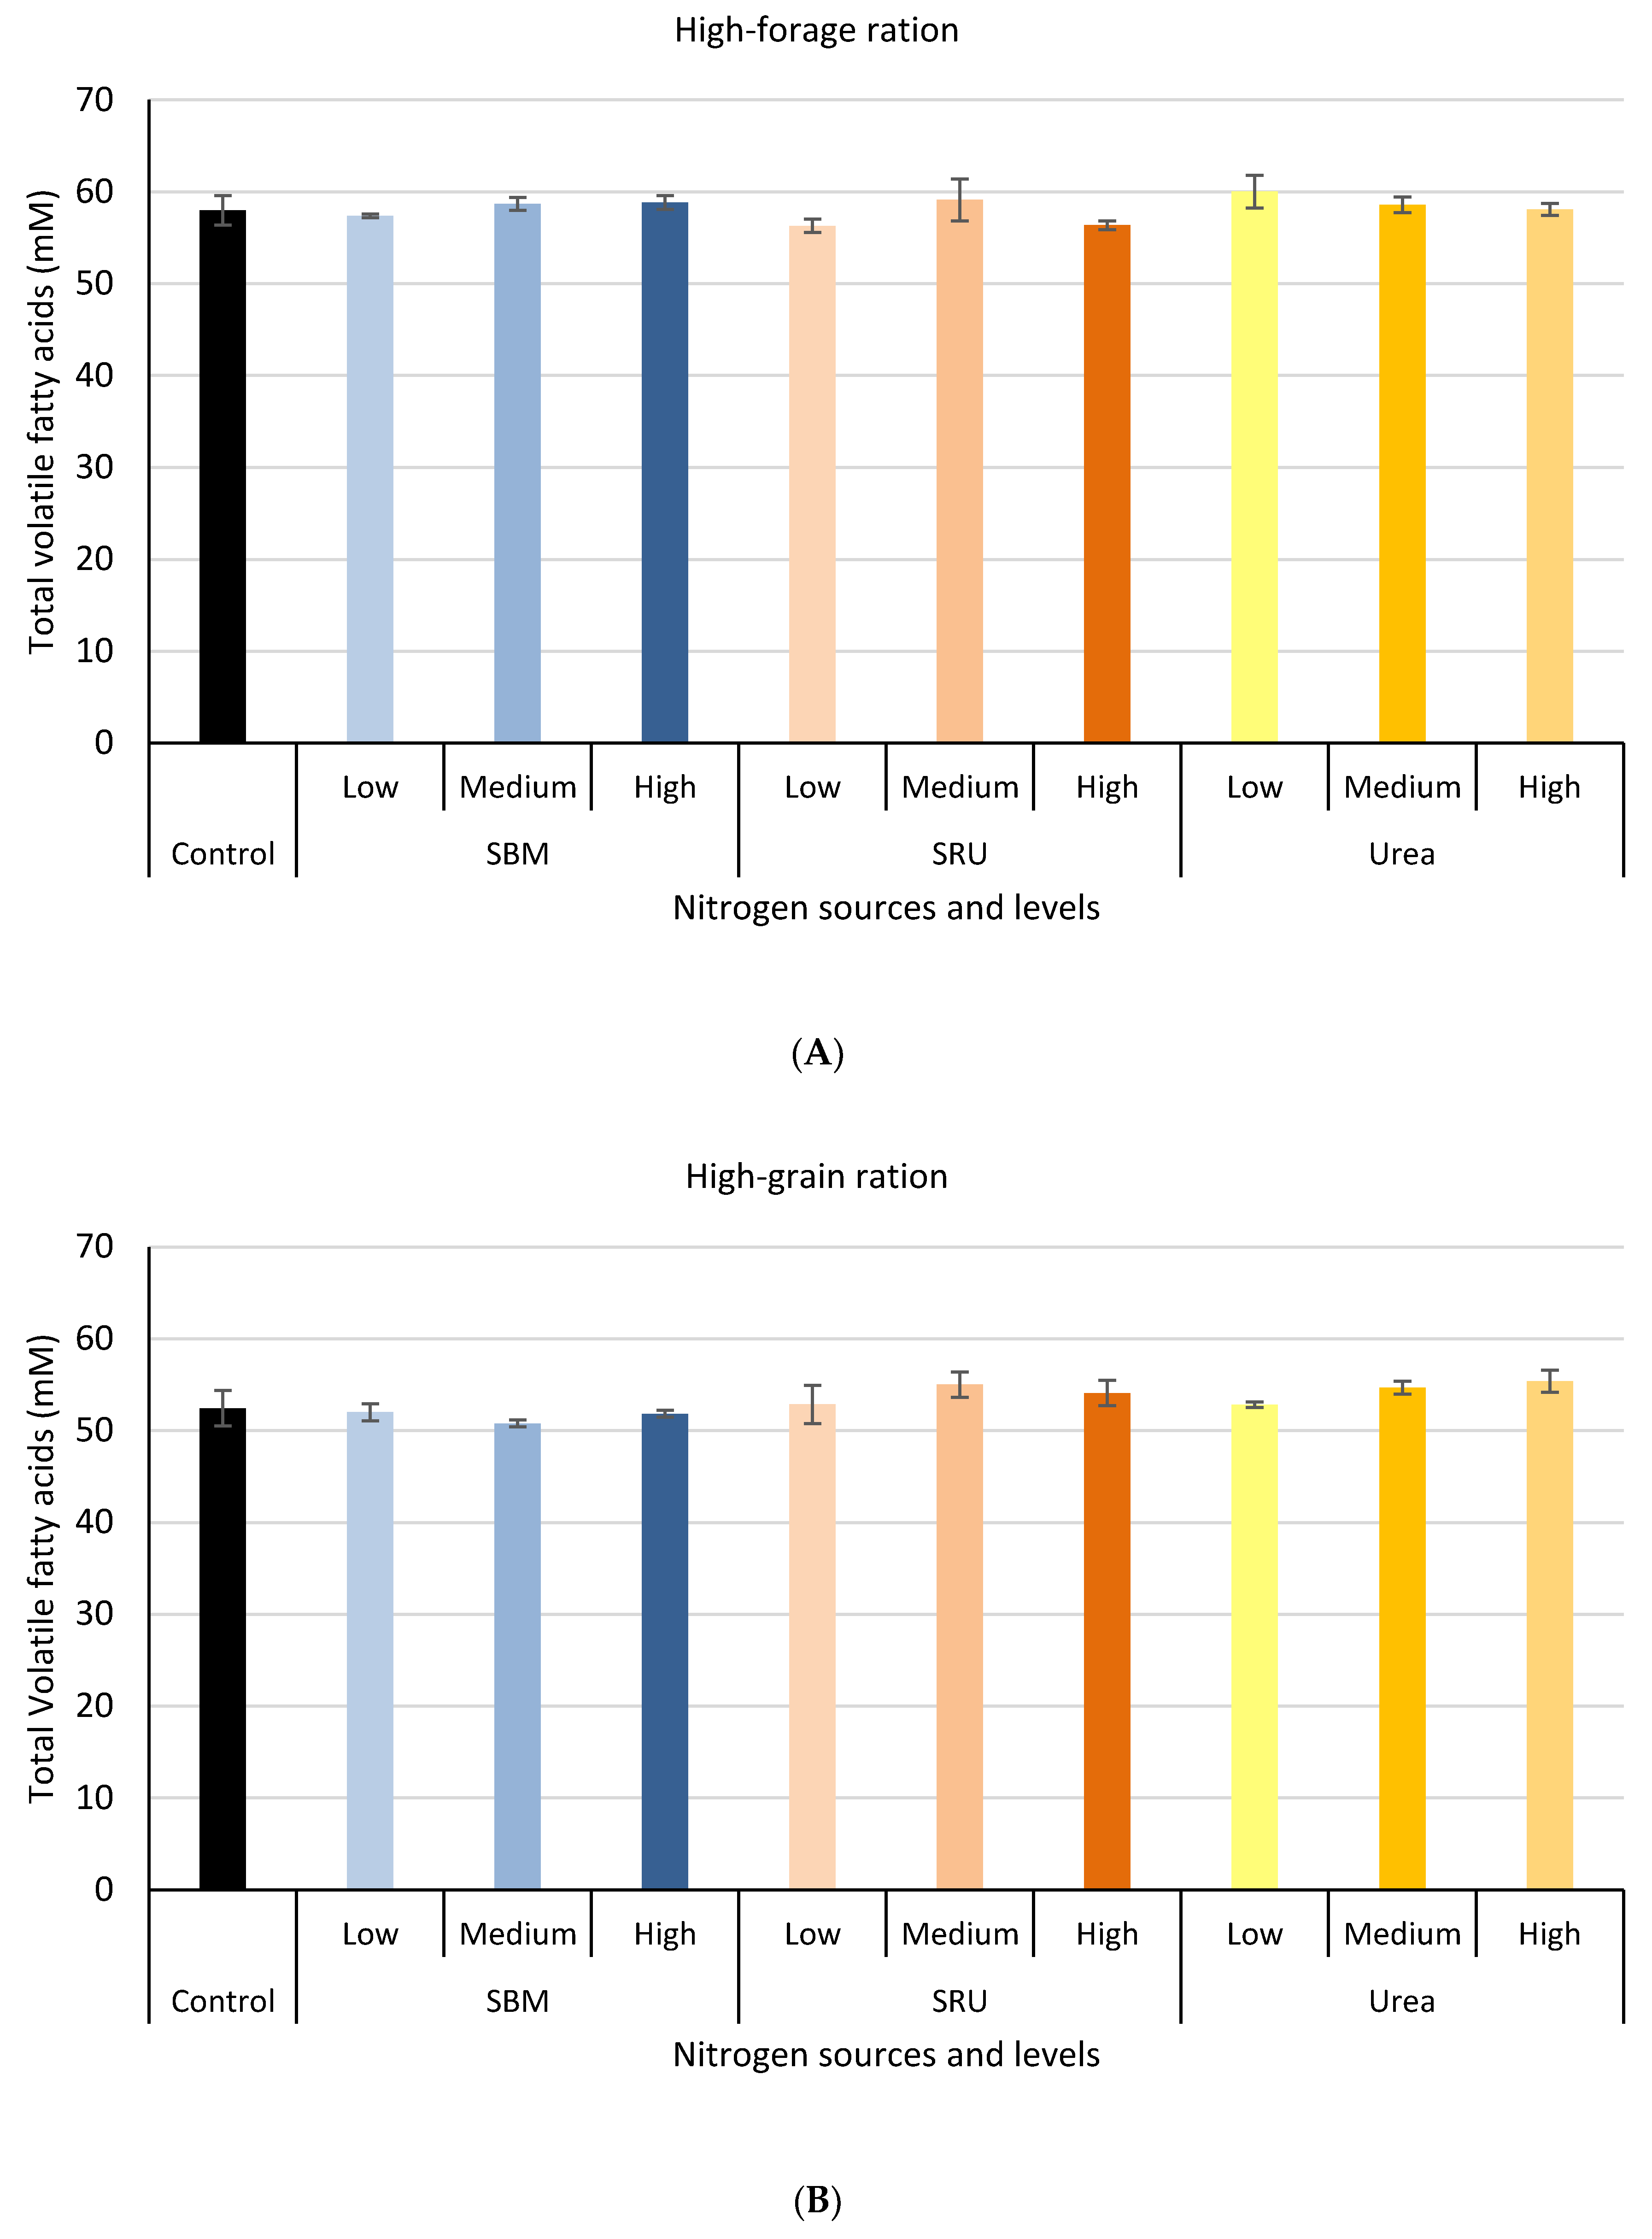
3.1. Experiment 1: In Vitro Rumen Fermentation

Although the effects of supplementing different nitrogen sources (SBM, SRU and urea) on in vitro rumen fermentation in high-forage and high-grain diets were measured over 24 h of incubation, the most discerning effects were obtained at 9 h incubation. Thus, the effects of treatments on in vitro fermentation characteristics at 9 h are reported here (Figure 2, Figure 3, Figure 4, Figure 5, Figure 6 and Figure 7) while results of total gas production, short-chain fatty acids, pH, ammonia and lactate concentration measured at all time points (0 h, 9 h and 12 h of incubation) are presented in Tables S2–S15. Total gas production at 9 h (p > 0.05) was unaffected when different nitrogen sources (SBM, SRU and urea) were supplemented with high-forage diets (Figure 2A). However, total gas production at 9 h for the high-grain diets increased significantly (p < 0.05) for both urea and SRU treatments in a dose-dependent manner while the isonitrogenous amount of SBM did not affect total gas production (Figure 2B). The addition of urea significantly increased (p < 0.05) ammonia concentration in high-forage diets after 9 h, whereas there was no difference (p > 0.05) between SRU, SBM and control treatments (Figure 3A). For high-grain diets, only the highest dose (i.e., 5.35 mg N) of urea increased ammonia concentration (p < 0.05) after 9 h, with no difference (p > 0.05) observed between SRU, SBM and control treatments (Figure 3B). Nitrogen supplements in high-forage diets did not influence the pH of the fermentation vessels (Figure 4A) whereas medium and high dosage (i.e., 3.22 mg N and 5.35 mg N) of SRU and urea in high-grain diets lowered the pH of the fermentation vessels (Figure 4B). Compared with the control treatment, lactic acid accumulation at 9 h was not affected (p > 0.05) by nitrogen supplements (SBM, SRU and urea) in high-forage diets (Figure 5A) whereas high dosage of SRU and urea treatments (medium and high dosages) increased lactic acid concentration in high-grain diets (Figure 5B). Notably, SRU resulted in 21 to 33% lower (p < 0.05) accumulation of lactic acid in the high-grain diets compared to urea (Figure 5B). However, the residual concentration of lactic acid was marginal at 12 h with the high-forage diet while its concentration at 12 h was still significant with the high-grain diet (Table S14). Total volatile fatty acids concentration measured at 9 h was not different (p > 0.05) between control, SBM, SRU and urea treatments in both high-forage and high-grain diets (Figure 6A,B). The effect of nitrogen supplements on bacterial density was observed (p < 0.05) in high-forage diets (Figure 7A) but not (p > 0.05) in high-grain diets (Figure 7B). In high-forage diets, both SBM and urea inclusion slightly increased the total bacterial density at this single analyzed time point (12 h). In general, the high-grain diet yielded higher bacterial density than the high-forage diet.

3.2. Experiment 2: In Situ Degradability

The effects of replacing one-third of the SBM in the control diet with SRU on in situ dry matter and nitrogen degradability estimates are presented in Table 4. The potentially degradable DM fraction was lower (p < 0.05) in the SRU diet whereas other estimated parameters (c, Kd and ERD) were not affected. Similarly, the replacement of SBM with SRU did not significantly affect (p > 0.05) the nitrogen degradability estimates. However, ERD of dietary nitrogen tended (p = 0.052) to be lower in the SRU diet compared to the control diet.

3.3. Experiment 3: Effect on Feed Intake and Blood Indices in Growing Cattle

There was no effect (p > 0.05) of dietary treatment on dry matter intake (5.06, 4.89 and 5.01 kg DM/day for 0%, 1% and 3% SRU respectively; p = 0.721).
The blood hematologic indices for all dietary treatments were within normal physiological ranges (Table 5). Compared with 0% SRU (control diet), bulls fed SRU at 1% or 3% diets had lower (p < 0.05) hemoglobin and packed cell volume. Bulls fed 3% SRU diet had lower mean corpuscular volume (p = 0.090) and mean corpuscular hemoglobin (p = 0.061) compared to those fed 0% SRU diet. Mean corpuscular hemoglobin concentrations (39.4–39.6 g/dL) were slightly higher than reference values (30–38 g/dL [33]) but did not differ between the control and SRU diets.
Table 6 depicts the blood biochemical indices in growing bulls fed concentrate diets in which SBM was replaced with 1% or 3% SRU. Albumin concentrations differed (p < 0.05) between treatments, but all values were within the normal physiological range. Total protein values were significantly lower (p < 0.05) in bulls fed diets containing SRU compared to bulls fed the control diet and were slightly under the reference values. The activity of aspartate aminotransferase was lower (p = 0.07) in bulls fed 1% SRU compared with those fed 0% SRU, whereas a further reduction in aspartate aminotransferase activity was not observed at 3% SRU. Serum ammonia concentrations were below the toxic limit (i.e., 5 mg/dL) and did not differ (p > 0.05) between dietary treatments.

4. Discussion

Vegetable protein sources, such as SBM and rapeseed meal, are commonly utilized to supply RDP in ruminant diets. Emissions from ruminant feeds represent 36% of the GHG emissions attributed to beef and milk production [3]. Thus, formulating environmentally friendly ruminant feeds offers an opportunity to mitigate the negative impacts of beef and milk production on GHG emissions and climate change [7]. Vegetable protein sources could constitute high CFP due to the impact of cultivation on land-use changes. This has increased the interest in utilizing NPN sources for providing RDP in ruminant nutrition. In the experimental design of the in vivo study (experiment 3), we employed a diet reformulation strategy that reduced the feed CFP by using the inclusion of 1% or 3% SRU for isonitrogenous replacement of SBM in concentrate diets of growing beef cattle. Consistent with our experimental design, Reddy, et al. [10] reported that feed CFP was decreased by 23% when SBM was replaced by up to 1.2% SRU in a total mixed ration of sheep. Similarly, replacing cottonseed meal with SRU at a 2% level of concentrate diet reduced the feed CFP of dairy buffalo by 25% [9]. Moreover, a recent meta-analysis study revealed that the replacement of vegetable protein sources with an average inclusion of 0.58% DM SRU reduced the CFP of feed use for milk production by 14.5% [36]. In addition to a reduction in feed CFP, these previous studies showed that feeding SRU to ruminants could offer other environmental benefits such as lower global warming potential for meat and milk production, lower eutrophication potential and reduction of land and virtual water requirement for feed. Overall, this information suggests that SRU could be an eco-friendly alternative to vegetable protein sources in ruminant diets.
As mentioned previously, feed-grade urea is a commonly used NPN source in ruminant diets, but its utilization is limited due to rapid degradation in the rumen, producing excess ammonia that can increase the risk of ammonia toxicity on animal health and increase nitrogen excretion to the environment [11,37]. Alternatively, coating technologies have been used to develop SRU with a reduced rate of hydrolysis in the rumen, increasing the synchronization of ammonia and fermentable carbohydrate for microbial protein synthesis in the rumen. This reduced rate of hydrolyses in the rumen may reduce their toxicity when supplemented at greater rates compared with feed-grade urea, increasing their potential to substitute vegetal protein sources and therefore reducing the CFP.
In the first study, the effect of energy supply and N doses was evaluated on microbial fermentation in vitro. Microbial fermentation of feed substrates in the rumen produces VFA and microbial proteins that supply ruminant animals with energy and highly digestible proteins used for maintenance and production purposes [38]. Thus, strategies aimed at reformulating ruminant diets with SRU must not impair ruminal fermentation to avoid negative effects on animal performance. It is noteworthy that the most discerning effects of supplementing high-forage and high-grain diets with different nitrogen sources (SBM, SRU and urea) on rumen fermentation were observed at 9 h incubation in the fermentation vessels. Thus, the effect of treatments on in vitro fermentation characteristics at 9 h were reported in this study. In general, the present results indicated that supplementation of SRU in high-forage and high-grain cattle rations did not impair in vitro ruminal fermentation characteristics. The effect of SRU on ruminal fermentation was similar to that of SBM when supplemented in high-forage and high-grain cattle diets. Gas production in the rumen directly results from the microbial digestion of feed substrates and indirectly from buffering of acids generated as a result of fermentation [39]. Menke [40] indicated that the amount of gas production reflects the extent and rate of digestion of soluble and insoluble carbohydrates and the production of VFA. In this study, higher gas production was obtained from the incubation of high-grain diets compared to high-forage diets, possibly due to greater fermentation of higher non-fibre carbohydrate levels in the high-grain diet [39]. Dose-dependent stimulation of gas production by SRU and urea, when supplemented in high-grain diets, could suggest that nitrogen supply may have been limiting rumen fermentation. In contrast to the effect of NPN sources (SRU and urea), SBM supplementation did not increase in vitro gas production, possibly indicating that more soluble protein might be required to increase the fermentation of the high-grain diets. However, the effect of NPN sources on increasing total gas production of high-grain diets did not result in greater total VFA concentration.
Furthermore, the current results indicated that SRU resulted in similar ammonia accumulation as SBM but lower than that of urea, confirming the reduced hydrolysis of SRU in the simulated rumen environment. This effect could be explained by the similarity in the nitrogen disappearance of SRU and that of SBM in the rumen, which is slower than that of feed-grade urea [41]. This assertion is further supported by the similarity in the in situ nitrogen degradation estimates when one-third of SBM was replaced by SRU in diets incubated in the rumen of cows reported herein. In further agreement with our observation, Garcia-Gonzalez, et al. [19] demonstrated that the dissolution rate of SRU in the rumen was lower than that of urea, resulting in lower ruminal and blood ammonia concentrations in steers. This implies that reduced ruminal hydrolysis of SRU produces lower ammonia concentration that could decrease the risk of ammonia toxicity and improve nitrogen utilization efficiency through better synchronization of ammonia with available fermentable energy in the rumen [11]. An increase in rumen pH is a major contributing factor to the toxicity of urea, as the permeability of the rumen epithelium to ammonia increases as rumen pH increases [42]. In this study, there was no effect of supplementing SRU or urea in high-forage diets on the pH of the fermentation vessels. This is in agreement with previous observations reported when urea or SRU was supplemented in high-fibre diets similar to the high-forage diets incubated herein [17,43]. However, supplementing medium and high dosage (i.e., 3.22 mg N and 5.35 mg N) of SRU and urea in high-grain diets lowered the pH of the fermentation vessels. This observation is contrary to the assertion that ruminal ammonia from urea could increase ruminal pH, as ammonia protonates to ammonium [44]. Notably, the lower pH in the present study was accompanied by an increase in lactic acid accumulation particularly in high-grain diets supplemented with NPN sources (SRU and urea). The high-grain diet presumably induced an acidotic condition in the ruminal incubation system, typical of the effect of high concentrate diets [45]. It is well documented that rapid fermentation of starch in high concentrate diets results in the accumulation of lactic acid, which induces lower ruminal pH [45]. Thus, the lower pH found in our study could be attributed to the acidotic potential of the high-grain diet, but NPN sources appeared to stimulate this acidotic condition to a lesser extent for SRU compared to urea. It is noteworthy that the decrease in ruminal pH was not as dramatic as the elevated level of lactic acid in the urea-based treatments, which could be related to the counteracting effect of ammonia accumulation on ruminal pH.
It is crucial to consider that reformulating diets with SRU does not impair ruminant health and performance due to their direct relationship with animal welfare and farm profitability [46,47]. In this regard, we examined the tolerance of growing cattle to feeding a high inclusion level of SRU at 3% of the concentrate diet. It is noteworthy that our feeding trial was not primarily designed to test the effect of SRU in improving the production performance of cattle. Growth performance parameters are not discussed in the present paper and only intake data are considered to analyze if SRU exhibits toxicity potential that affects animal health and consequently affects the production performance of cattle. Replacement of SBM with 1% or 3% SRU in concentrate diets did not affect the intake or health of growing bulls, suggesting that feeding up to 3% SRU was well tolerated by cattle. In agreement with this result, Bourg, et al. [48] have also shown that the inclusion of 3.1% DM of SRU in concentrate diet did not negatively affect the growth performance and carcass characteristics of steers. The lack of negative effect of SRU on animal performance is consistent with results of in vitro and in situ experiments which indicated that SRU does not impair rumen fermentation and feed degradability. Similarly, previous studies have shown that dietary inclusion up to 1.75% DM SRU did not affect the growth performance of cattle [16,47,48]. However, other studies have demonstrated positive effects of dietary SRU on feed efficiency of beef and dairy cattle production [48,49]. A recent meta-analysis showed that partial replacement of vegetable protein sources with an average SRU inclusion of 0.88% DM diet improved the liveweight gain and feed efficiency of growing and finishing beef cattle [24]. The authors identified different diet- and production-related factors that contributed to variations in the performance response of cattle when SRU is supplemented. Dietary inclusion of corn silage as the forage source was particularly found to improve liveweight gain and feed efficiency while other roughage sources did not affect these performance parameters. This positive effect was explained by the high digestible energy and digestibility value of corn silage which could have provided fermentable carbohydrate with better synchronization with ammonia to optimize microbial protein synthesis [24]. In contrast, straw was fed as the roughage source in the present study, which might have partly contributed to the lack of positive effect of SRU on the growth performance of beef cattle.
Furthermore, the potential of SRU supplementation to cause ammonia toxicity in cattle was determined by measuring blood hematological and biochemical parameters [50,51]. Excess ammonia produced from rapid ruminal hydrolysis of RDP sources, such as urea, above the requirement of microbes may be absorbed across the rumen epithelium and converted to urea in the liver through hepatic detoxification [52]. The liver can remove ammonia added to the portal blood up to a maximum of 182 mg/min before peripheral blood concentration increases [53]. The accumulation of ammonia in the blood of urea-fed cattle is the primary cause of urea toxicity [42]. Serum ammonia concentration is one of the primary biomarkers used to evaluate urea toxicity [54]. In the current study, serum ammonia concentrations (0.7–0.9 mg/dL) measured at 1 h post-feeding were below the toxic limit (i.e., 5 mg/dL) and did not differ between the three dietary treatments. This observation is consistent with the lack of treatment effect on plasma ammonia concentrations when 0.55% SRU or 0.50% feed-grade urea were fed to dairy cows [18]. Similarly, the serum urea concentration measured in this study was not different between treatments and was within recommended range. Holder, et al. [55] showed that rumen ammonia and plasma urea were higher in steers fed feed-grade urea compared to those fed SRU at two levels of dietary CP (12.1% and 10.9%), suggesting that SRU offers a safer alternative to feed-grade urea. Garcia-Gonzalez, et al. [19] also reported that replacing feed-grade urea with SRU resulted in reduced rumen ammonia concentration and did not increase postprandial plasma urea concentration. Moreover, aspartate aminotransferase (AST), alanine aminotransferase (ALT) and gamma-glutamyl transferase (GGT) are key enzymes that reflect the condition of liver function and they are associated with the welfare of animals [50,56]. Chronic urea toxicity could result in intense hepatic nitrogen metabolism, which may be manifested by higher serum activity of AST, ALT and GGT enzymes in ruminants [50,57]. Thus, the lack of substantial increase in these key enzymes is further evidence that feeding 3% SRU did not induce toxicity in growing bulls. Overall, blood hematological and biochemical indices measured in this study were within the normal physiological ranges for healthy cows, suggesting that feeding high inclusion level of up to 3% SRU in a concentrate diet was well tolerated by the bulls and did not exhibit a negative effect on animal health.

5. Conclusions

These results demonstrated that SRU is a viable NPN source that can be utilized to partially replace vegetable protein sources, such as SBM, without negative impact on in vitro rumen fermentation and in situ feed degradability under the current experimental conditions. Replacement of vegetable protein sources with SRU could reduce the CFP of ruminant diets, thereby contributing to lower environmental impacts of ruminant milk and meat production. Moreover, dietary inclusion of SRU can be tolerated at up to 3% in cattle diets without negative impacts on feed intake and health indices of bulls.

Supplementary Materials

The following are available online at https://www.mdpi.com/2071-1050/13/5/2464/s1. Table S1. Carbon footprint (CFP) of common feed raw materials used for calculating the CFP of diets used in experiment 3. Table S2. Total gas production (mL) measured in an in vitro fermentation model. Table S3. Acetate concentration (mM) measured in an in vitro fermentation model. Table S4. Propionate concentration (mM) measured in an in vitro fermentation model. Table S5. Isobutyric acid concentration (mM) measured in an in vitro fermentation model. Table S6. Butyrate concentration (mM) measured in an in vitro fermentation model. Table S7. Total short-chain fatty acids concentration (mM) measured in an in vitro fermentation model. Table S8. Isovaleric acid concentration (mM) measured in an in vitro fermentation model. Table S9. Valeric acid concentration (mM) measured in an in vitro fermentation model. Table S10. Branched volatile fatty acids concentration (mM) measured in an in vitro fermentation model. Table S11. 2-methylbutyric acid concentration (mM) measured in an in vitro fermentation model. Table S12. pH measured in an in vitro fermentation model. Table S13. Ammonia concentration (mM) measured in an in vitro fermentation model. Table S14. Lactate concentration (mM) measured in an in vitro fermentation model. Table S15. Total volatile fatty acids concentration (mM) measured in an in vitro fermentation model.

Author Contributions

Conceptualization, J.A., M.D. and C.A.M.; methodology, J.A., M.D.; formal analysis, J.A., M.D. and S.A.S.; investigation, J.A., M.D., S.S.; resources, J.A., M.D.; data curation, J.A., M.D.; writing—original draft preparation, V.H. and S.A.S.; writing—review and editing, J.A., M.D., J.D.K., S.A.S. and C.A.M.; visualization, V.H. and S.A.S.; supervision, J.A., M.D. and C.A.M.; project administration, C.A.M.; funding acquisition, C.A.M. All authors have read and agreed to the published version of the manuscript.

Funding

The research was financially supported by Alltech SARL (France), which also provided the test products used in this study.

Institutional Review Board Statement

The animals used as a source of rumen fluid or in situ trial were cannulated and maintained in the research facility of Alimetrics Ltd. in Southern Finland, following the European Union (EU) Directive 2010/63/EU on the protection of animals used for experimental or other scientific purposes. The cannulation was approved by the Animal Experiment Board in Finland. Additionally, the research protocol of the animal feeding trial followed the EU Directive 2010/63/EU and the animals were managed according to the regulations of the Animal Care Committee of the Institute of Agrifood Research and Technology, Spain.

Informed Consent Statement

Not applicable.

Data Availability Statement

Data will be provided upon request.

Acknowledgments

The authors thank all members of the IRTA Ruminant Production team and the farm team of BonArea Agrupa for the hard work and enthusiasm, and thanks to the support of the Generalitat de Catalunya through the CERCA Programme. The authors appreciate Kamal Mjoun (Alltech Inc., Nicholasville, KY, USA) for his expert assistance with the data analysis. C.A.M. wishes to acknowledge the late Pearse Lyons (Alltech Inc., Nicholasville, KY, USA) for his leadership in sustainable agriculture.

Conflicts of Interest

The authors S.A.S., V.H., J.D.K. and C.A.M. are employees of Alltech which produces and markets Optigen®, the commercial slow-release urea evaluated in this study. The research was funded by Alltech SARL (France).

References

  1. Adesogan, A.T.; Havelaar, A.H.; McKune, S.L.; Eilittä, M.; Dahl, G.E. Animal source foods: Sustainability problem or malnutrition and sustainability solution? Perspective matters. Glob. Food Secur. 2020, 25, 100325. [Google Scholar] [CrossRef]
  2. Herrero, M.; Thornton, P.K. Livestock and global change: Emerging issues for sustainable food systems. Proc. Natl. Acad. Sci. USA 2013, 110, 20878–20881. [Google Scholar] [CrossRef] [PubMed] [Green Version]
  3. Gerber, P.J.; Steinfeld, H.; Henderson, B.; Mottet, A.; Opio, C.; Dijkman, J.; Falcucci, A.; Tempio, G. Tackling Climate Change through Livestock: A Global Assessment of Emissions and Mitigation Opportunities; Food and Agriculture Organization of the United Nations (FAO): Rome, Italy, 2013.
  4. Wattiaux, M.; Uddin, M.; Letelier, P.; Jackson, R.; Larson, R. Invited Review: Emission and mitigation of greenhouse gases from dairy farms: The cow, the manure, and the field. Appl. Anim. Sci. 2019, 35, 238–254. [Google Scholar] [CrossRef]
  5. Wilkinson, J.; Garnsworthy, P. Impact of diet and fertility on greenhouse gas emissions and nitrogen efficiency of milk production. Livestock 2017, 22, 140–144. [Google Scholar] [CrossRef]
  6. Opio, C.; Gerber, P.; Mottet, A.; Falcucci, A.; Tempio, G.; MacLeod, M.; Vellinga, T.; Henderson, B.; Steinfeld, H. Greenhouse Gas Emissions from Ruminant Supply Chains–A Global Life Cycle Assessment; Food and Agriculture Organization of the United Nations: Rome, Italy, 2013.
  7. Wilkinson, J.; Garnsworthy, P. Dietary options to reduce the environmental impact of milk production. J. Agric. Sci. 2017, 155, 334–347. [Google Scholar] [CrossRef]
  8. Salami, S.; Luciano, G.; O’Grady, M.; Biondi, L.; Newbold, C.; Kerry, J.; Priolo, A. Sustainability of feeding plant by-products: A review of the implications for ruminant meat production. Anim. Feed Sci. Technol. 2019, 251, 37–55. [Google Scholar] [CrossRef]
  9. Reddy, P.R.K.; Kumar, D.S.; Rao, E.R.; Seshiah, C.V.; Sateesh, K.; Rao, K.A.; Reddy, Y.P.K.; Hyder, I. Environmental sustainability assessment of tropical dairy buffalo farming vis-a-vis sustainable feed replacement strategy. Sci. Rep. 2019, 9, 1–16. [Google Scholar] [CrossRef]
  10. Reddy, P.R.K.; Kumar, D.S.; Rao, E.R.; Seshiah, C.V.; Sateesh, K.; Reddy, Y.P.K.; Hyder, I. Assessment of eco-sustainability vis-à-vis zoo-technical attributes of soybean meal (SBM) replacement with varying levels of coated urea in Nellore sheep (Ovis aries). PLoS ONE 2019, 14, e0220252. [Google Scholar]
  11. Cherdthong, A.; Wanapat, M. Development of urea products as rumen slow-release feed for ruminant production: A review. Aust. J. Basic Appl. Sci. 2010, 4, 2232–2241. [Google Scholar]
  12. Calsamiglia, S.; Ferret, A.; Reynolds, C.; Kristensen, N.B.; Van Vuuren, A. Strategies for optimizing nitrogen use by ruminants. Animal 2010, 4, 1184–1196. [Google Scholar] [CrossRef] [PubMed]
  13. Cope, R.B. Nonprotein nitrogen (urea) and hyperammonemia. In Veterinary Toxicology; Elsevier: Amsterdam, The Netherlands, 2018; pp. 1093–1097. [Google Scholar]
  14. EFSA. EFSA Panel on Additives Products or Substances used in Animal Feed. Scientific Opinion on the safety and efficacy of Urea for ruminants. EFSA J. 2012, 10, 2624. [Google Scholar]
  15. Owens, F.; Lusby, K.; Mizwicki, K.; Forero, O. Slow ammonia release from urea: Rumen and metabolism studies. J. Anim. Sci. 1980, 50, 527–531. [Google Scholar] [CrossRef]
  16. Tedeschi, L.; Baker, M.; Ketchen, D.; Fox, D. Performance of growing and finishing cattle supplemented with a slow-rlease urea product and urea. Can. J. Anim. Sci. 2002, 82, 567–573. [Google Scholar] [CrossRef]
  17. Taylor-Edwards, C.; Hibbard, G.; Kitts, S.; McLeod, K.; Axe, D.; Vanzant, E.; Kristensen, N.; Harmon, D. Effects of slow-release urea on ruminal digesta characteristics and growth performance in beef steers. J. Anim. Sci. 2009, 87, 200–208. [Google Scholar] [CrossRef] [PubMed] [Green Version]
  18. Sinclair, L.; Blake, C.; Griffin, P.; Jones, G. The partial replacement of soyabean meal and rapeseed meal with feed grade urea or a slow-release urea and its effect on the performance, metabolism and digestibility in dairy cows. Animal 2012, 6, 920–927. [Google Scholar] [CrossRef] [PubMed] [Green Version]
  19. Garcia-Gonzalez, R.; Tricarico, J.; Harrison, G.; Meyer, M.; McLeod, K.; Harmon, D.; Dawson, K. Optigen® is a sustained release source of non-protein nitrogen in the rumen. J. Anim. Sci. 2007, 85, 98. [Google Scholar]
  20. Ribeiro, S.; Vasconcelos, J.; Morais, M.; Ítavo, C.; Franco, G. Effects of ruminal infusion of a slow-release polymer-coated urea or conventional urea on apparent nutrient digestibility, in situ degradability, and rumen parameters in cattle fed low-quality hay. Anim. Feed Sci. Technol. 2011, 164, 53–61. [Google Scholar] [CrossRef]
  21. Vellinga, T.V.; Blonk, H.; Marinussen, M.; Van Zeist, W.; Starmans, D. Methodology Used in Feedprint: A Tool Quantifying Greenhouse Gas Emissions of Feed Production and Utilization; 1570-8616; Wageningen UR Livestock Research: Wageningen, The Netherlands, 2013. [Google Scholar]
  22. Apajalahti, J.; Vienola, K.; Raatikainen, K.; Holder, V.; Moran, C.A. Conversion of branched-chain amino acids to corresponding isoacids-an in vitro tool for estimating ruminal protein degradability. Front. Vet. Sci. 2019, 6, 311. [Google Scholar] [CrossRef] [PubMed]
  23. Meissner, H.; Henning, P.; Leeuw, K.-J.; Hagg, F.; Horn, C.; Kettunen, A.; Apajalahti, J. Efficacy and mode of action of selected non-ionophore antibiotics and direct-fed microbials in relation to Megasphaera elsdenii NCIMB 41125 during in vitro fermentation of an acidosis-causing substrate. Livest. Sci. 2014, 162, 115–125. [Google Scholar] [CrossRef]
  24. Salami, S.A.; Moran, C.A.; Warren, H.E.; Taylor-Pickard, J. A Meta-Analysis of the Effects of Slow-Release Urea Supplementation on the Performance of Beef Cattle. Animals 2020, 10, 657. [Google Scholar] [CrossRef] [PubMed] [Green Version]
  25. Apajalahti, J.H.; Kettunen, H.; Kettunen, A.; Holben, W.E.; Nurminen, P.H.; Rautonen, N.; Mutanen, M. Culture-independent microbial community analysis reveals that inulin in the diet primarily affects previously unknown bacteria in the mouse cecum. Appl. Environ. Microbiol. 2002, 68, 4986–4995. [Google Scholar] [CrossRef] [PubMed] [Green Version]
  26. Weatherburn, M. Phenol-hypochlorite reaction for determination of ammonia. Anal. Chem. 1967, 39, 971–974. [Google Scholar] [CrossRef]
  27. Berthelot, M. Violet d’aniline. Rep. Chim. Appl. 1859, 1, 284. [Google Scholar]
  28. AOAC. Association of Official Analytical Chemists, 16th ed.; Official Methods of Analysis: Gaithersburg, MD, USA, 1996. [Google Scholar]
  29. Ørskov, E.; McDonald, I. The estimation of protein degradability in the rumen from incubation measurements weighted according to rate of passage. J. Agric. Sci. 1979, 92, 499–503. [Google Scholar] [CrossRef] [Green Version]
  30. SAS. Stat User’s Guide; Cary, N.C., Ed.; Statistical Analysis Systems Inst. Inc.: Cary, NC, USA, 2001. [Google Scholar]
  31. NRC. Nutrient Requirements of Beef Cattle: Update 2000; National Academies Press: Washington, DC, USA, 2000. [Google Scholar]
  32. Van Soest, P.v.; Robertson, J.; Lewis, B. Methods for dietary fiber, neutral detergent fiber, and nonstarch polysaccharides in relation to animal nutrition. J. Dairy Sci. 1991, 74, 3583–3597. [Google Scholar] [CrossRef]
  33. Lumsden, J.; Mullen, K.; Rowe, R. Hematology and biochemistry reference values for female Holstein cattle. Can. J. Comp. Med. 1980, 44, 24. [Google Scholar] [PubMed]
  34. Martin, S.; Lumsden, J. The relationship of hematology and serum chemistry parameters to treatment for respiratory disease and weight gain in Ontario feedlot calves. Can. J. Vet. Res. 1987, 51, 499. [Google Scholar] [PubMed]
  35. Mohri, M.; Sharifi, K.; Eidi, S. Hematology and serum biochemistry of Holstein dairy calves: Age related changes and comparison with blood composition in adults. Res. Vet. Sci. 2007, 83, 30–39. [Google Scholar] [CrossRef] [PubMed]
  36. Salami, S.A.; Moran, C.A.; Warren, H.E.; Taylor-Pickard, J. Meta-analysis and sustainability of feeding slow-release urea in dairy production. PLoS ONE 2021, 16, e0246922. [Google Scholar] [CrossRef] [PubMed]
  37. Kertz, A. Urea feeding to dairy cattle: A historical perspective and review. Prof. Anim. Sci. 2010, 26, 257–272. [Google Scholar] [CrossRef]
  38. Loor, J.; Elolimy, A.; McCann, J. Dietary impacts on rumen microbiota in beef and dairy production. Anim. Front. 2016, 6, 22–29. [Google Scholar] [CrossRef] [Green Version]
  39. Getachew, G.; Robinson, P.; DePeters, E.; Taylor, S. Relationships between chemical composition, dry matter degradation and in vitro gas production of several ruminant feeds. Anim. Feed Sci. Technol. 2004, 111, 57–71. [Google Scholar] [CrossRef]
  40. Menke, K.H. Estimation of the energetic feed value obtained from chemical analysis and in vitro gas production using rumen fluid. Anim. Res. Dev. 1988, 28, 7–55. [Google Scholar]
  41. Akay, V.; Tikofsky, J.; Holtz, C.; Dawson, K. Optigen® 1200: Controlled release of non-protein nitrogen in the rumen. In Proceedings of the 20th Alltech Symposium, Lexington, KY, USA, 23–24 May 2004; Alltech Inc.: Nicholasville, KY, USA, 2004; pp. 179–185. [Google Scholar]
  42. Bartley, E.; Davidovich, A.; Barr, G.; Griffel, G.; Dayton, A.; Deyoe, C.; Bechtle, R. Ammonia toxicity in cattle. I. Rumen and blood changes associated with toxicity and treatment methods. J. Anim. Sci. 1976, 43, 835–841. [Google Scholar] [CrossRef] [PubMed]
  43. Chegeni, A.; Li, Y.; Deng, K.; Jiang, C.; Diao, Q. Effect of dietary polymer-coated urea and sodium bentonite on digestibility, rumen fermentation, and microbial protein yield in sheep fed high levels of corn stalk. Livest. Sci. 2013, 157, 141–150. [Google Scholar] [CrossRef]
  44. Kertz, A.; Davidson, L.; Cords, B.; Puch, H. Ruminal infusion of ammonium chloride in lactating cows to determine effect of pH on ammonia trapping. J. Dairy Sci. 1983, 66, 2597–2601. [Google Scholar] [CrossRef]
  45. Calsamiglia, S.; Blanch, M.; Ferret, A.; Moya, D. Is subacute ruminal acidosis a pH related problem? Causes and tools for its control. Anim. Feed Sci. Technol. 2012, 172, 42–50. [Google Scholar] [CrossRef]
  46. Kenny, D.; Fitzsimons, C.; Waters, S.; McGee, M. Invited review: Improving feed efficiency of beef cattle–the current state of the art and future challenges. Animal 2018, 12, 1815–1826. [Google Scholar] [CrossRef] [PubMed] [Green Version]
  47. McGrath, J.; Duval, S.M.; Tamassia, L.F.; Kindermann, M.; Stemmler, R.T.; de Gouvea, V.N.; Acedo, T.S.; Immig, I.; Williams, S.N.; Celi, P. Nutritional strategies in ruminants: A lifetime approach. Res. Vet. Sci. 2018, 116, 28–39. [Google Scholar] [CrossRef] [PubMed]
  48. Bourg, B.; Tedeschi, L.; Wickersham, T.; Tricarico, J. Effects of a slow-release urea product on performance, carcass characteristics, and nitrogen balance of steers fed steam-flaked corn. J. Anim. Sci. 2012, 90, 3914–3923. [Google Scholar] [CrossRef] [PubMed]
  49. Inostroza, J.; Shaver, R.; Cabrera, V.; Tricárico, J. Effect of diets containing a controlled-release urea product on milk yield, milk composition, and milk component yields in commercial Wisconsin dairy herds and economic implications. Prof. Anim. Sci. 2010, 26, 175–180. [Google Scholar] [CrossRef]
  50. Radkowska, I.; Herbut, E. Hematological and biochemical blood parameters in dairy cows depending on the management system. Anim. Sci. Papers Rep. 2014, 32, 317–325. [Google Scholar]
  51. Roland, L.; Drillich, M.; Iwersen, M. Hematology as a diagnostic tool in bovine medicine. J. Vet. Diagn. Investig. 2014, 26, 592–598. [Google Scholar] [CrossRef] [PubMed] [Green Version]
  52. Lobley, G.; Connell, A.; Lomax, M.A.; Brown, D.S.; Milne, E.; Calder, A.G.; Farningham, D. Hepatic detoxification of ammonia in the ovine liver: Possible consequences for amino acid catabolism. Br. J. Nutr. 1995, 73, 667–685. [Google Scholar] [CrossRef] [PubMed] [Green Version]
  53. Symonds, H.; Mather, D.L.; Collis, K. The maximum capacity of the liver of the adult dairy cow to metabolize ammonia. Br. J. Nutr. 1981, 46, 481–486. [Google Scholar] [CrossRef] [PubMed] [Green Version]
  54. Word, J.; Martin, L.; Williams, D.; Williams, E.; Panciera, R.; Nelson, T.; Tillman, A. Urea toxicity studies in the bovine. J. Anim. Sci. 1969, 29, 786–791. [Google Scholar] [CrossRef]
  55. Holder, V.B.; El-Kadi, S.W.; Tricarico, J.M.; Vanzant, E.S.; McLeod, K.R.; Harmon, D.L. The effects of crude protein concentration and slow release urea on nitrogen metabolism in Holstein steers. Arch. Anim. Nutr. 2013, 67, 93–103. [Google Scholar] [CrossRef]
  56. Ribeiro, M.N.; Ribeiro, N.L.; Bozzi, R.; Costa, R.G. Physiological and biochemical blood variables of goats subjected to heat stress–a review. J. Appl. Anim. Res. 2018, 46, 1036–1041. [Google Scholar] [CrossRef] [Green Version]
  57. Huntington, G.; Archibeque, S. Practical aspects of urea and ammonia metabolism in ruminants. Proc. Am. Soc. Anim. Sci. 2000, 77, 1–11. [Google Scholar] [CrossRef] [Green Version]
Figure 1. Calculated carbon footprint of concentrate diets of growing cattle when soybean meal (0% SRU) was replaced with increasing levels of slow-release urea (1% SRU and 3% SRU).
Sustainability 13 02464 g001
Figure 2. Total gas production measured at 9 h in an in vitro fermentation model incubated with (A) high-forage (20:80, wheat: grass silage) ration and (B) high-grain ration (60:40, wheat: grass silage) supplemented with three different nitrogen sources (soybean meal (SBM), slow-release urea (SRU) and urea) at increasing nitrogen levels (low, medium and high). Low, medium and high nitrogen levels correspond to 1.07 mg N, 3.22 mg N and 5.35 mg N, respectively. Values are presented as means with standard error bars. a–f Bars with different letters are significantly different (p < 0.05).
Sustainability 13 02464 g002
Figure 3. Ammonia (NH3) concentration measured at 9 h in an in vitro fermentation model incubated with (A) high-forage (20:80, wheat: grass silage) ration and (B) high-grain ration (60:40, wheat: grass silage) supplemented with three different nitrogen sources (soybean meal (SBM), slow-release urea (SRU) and urea) at increasing nitrogen levels (low, medium and high). Low, medium and high nitrogen levels correspond to 1.07 mg N, 3.22 mg N and 5.35 mg N, respectively. Values are presented as means with standard error bars. a–c Bars with different letters are significantly different (p < 0.05).
Sustainability 13 02464 g003
Figure 4. pH measured at 9 h in an in vitro fermentation model incubated with (A) high-forage (20:80, wheat: grass silage) ration and (B) high-grain ration (60:40, wheat: grass silage) supplemented with three different nitrogen sources (soybean meal (SBM), slow-release urea (SRU) and urea) at increasing nitrogen levels (low, medium and high). Low, medium and high nitrogen levels correspond to 1.07 mg N, 3.22 mg N and 5.35 mg N, respectively. Values are presented as means with standard error bars. a–d Bars with different letters are significantly different (p < 0.05).
Sustainability 13 02464 g004
Figure 5. Lactate concentration measured at 9 h in an in vitro fermentation model incubated with (A) high-forage (20:80, wheat: grass silage) ration and (B) high-grain ration (60:40, wheat: grass silage) supplemented with three different nitrogen sources (soybean meal (SBM), slow-release urea (SRU) and urea) at increasing nitrogen levels (low, medium and high). Low, medium and high nitrogen levels correspond to 1.07 mg N, 3.22 mg N and 5.35 mg N, respectively. Values are presented as means with standard error bars. a–c Bars with different letters are significantly different (p < 0.05).
Sustainability 13 02464 g005
Figure 6. Total volatile fatty acids concentration measured at 9 h in an in vitro fermentation model incubated with (A) high-forage (20:80, wheat: grass silage) ration and (B) high-grain ration (60:40, wheat: grass silage) supplemented with three different nitrogen sources (soybean meal (SBM), slow-release urea (SRU) and urea) at increasing nitrogen levels (low, medium and high). Low, medium and high nitrogen levels correspond to 1.07 mg N, 3.22 mg N and 5.35 mg N, respectively. Values are presented as means with standard error bars.
Sustainability 13 02464 g006
Figure 7. Total bacteria concentration measured at 12 h in an in vitro fermentation model incubated with (A) high-forage (20:80, wheat: grass silage) ration and (B) high-grain ration (60:40, wheat: grass silage) supplemented with three different nitrogen sources (soybean meal (SBM), slow-release urea (SRU) and urea) at increasing nitrogen levels (low, medium and high). Low, medium and high nitrogen levels correspond to 1.07 mg N, 3.22 mg N and 5.35 mg N, respectively. Values are presented as means with standard error bars. a–c Bars with different letters are significantly different (p < 0.05).
Sustainability 13 02464 g007
Table 1. Treatments used for the evaluation of slow-release urea in in vitro rumen fermentation.
Diet
Number
Ration 1Nitrogen
Supplement
Dose, mg
(Nitrogen Levels) 2
Replicate
Fermentations
1High-forageNone-5
2SBM20 (low)5
360 (medium)5
4100 (high)5
5SRU 2.6 (low)5
67.8 (medium)5
713.1 (high)5
8Urea2.3 (low)5
96.9 (medium)5
1011.5 (high)5
11High-grainNone-5
12SBM20 (low)5
1360 (medium)5
14100 (high)5
15SRU2.6 (low)5
167.8 (medium)5
1713.1 (high)5
18Urea2.3 (low)5
196.9 (medium)5
2011.5 (high)5
Total100
SBM: soybean meal, SRU: slow-release urea. 1 High-forage ration: 20:80, wheat: grass silage ration; high-grain ration: 60:40, wheat: grass silage ration. 2 Low, medium and high nitrogen levels correspond to 1.07 mg N, 3.22 mg N and 5.35 mg N, respectively, in the total 1 g of diet.
Table 2. Composition of test feeds used for in situ rumen degradability.
Diet ComponentNitrogen Content (g/kg DM)Crude Protein
(g/kg DM)
DM (%)% of Diet DM
ControlSRU
Soybean meal82.351488.91510
SRU410256310000.75
Compound feed 119.9124904445.25
Grass haylage26.216472.14144
SRU: slow-release urea. 1 Compound feed (CP—12.4% of DM) containing hay, oats, wheat and protein-rich meals.
Table 3. Ingredient composition of the experimental mash diets of growing bulls supplemented with slow-release urea (SRU) in replacement for soybean meal.
Ingredient (%)0% SRU1% SRU3% SRU
Corn grain meal38.1940.9648.00
Wheat middlings3.023.022.00
Barley grain meal17.0219.0222.61
Wheat2.512.512.00
Beet pulp7.997.999.99
Dried alfalfa8.338.336.52
Palm oil2.462.853.27
Soybean meal18.3812.160.00
Calcium carbonate0.800.860.80
Sodium bicarbonate0.600.600.60
Salt0.400.400.40
Bicalcium phosphate0.000.000.51
Vitamin/mineral premix 809 10.300.300.30
Slow Release Urea0.001.003.00
Analyzed nutrient content (% DM)
DM87.4687.8187.51
Crude protein18.2218.0318.28
Ether extract4.285.396.15
Neutral detergent fibre26.1725.5626.14
Ash5.995.624.86
Urea-<0.10.88
Calculated NSC53.253.153.3
DM: dry matter; NSC: non-structural carbohydrates. 1 Vitamin/mineral premixture: Calcium 0.0102%; Phosphorus 0.0612%; Magnesium 29.02%; Sodium 0.0139%; Selenium 150 mg/kg; Cobalt 240 mg/kg; Iodine 256 mg/kg; Manganese 15,525 mg/kg; Zinc 20,350 mg/kg; Copper 2500 mg/kg Vitamin A (retinyl acetate) 5,000,000 IU/kg; Vitamin D3 (cholecalciferol) 1,000,000 IU/kg; Vitamin E (di-alpha tocopheryl acetate) 50,000 mg/kg.
Table 4. Effect of replacing soybean meal with slow-release urea (SRU) on estimated parameters of in situ dry matter (DM) and nitrogen degradation in the rumen.
ParameterControlSRUSEMp-Value
DM degradation
b68.3062.310.0290.004
c29.0531.270.6860.263
Kd0.150.160.0060.640
ERD51.8651.710.2190.716
Nitrogen degradation
b88.4085.910.5090.179
c11.6014.090.5090.179
Kd0.100.100.0020.252
ERD54.4053.980.0240.052
b: potentially degradable fraction; c: undegradable fraction; Kd: fractional rate of degradation; ERD: effective rumen degradability. SEM: standard error of the mean.
Table 5. Effect of slow-release urea (SRU) supplementation in concentrate diets on hematological indices of growing cattle.
Parameter0% SRU1% SRU3% SRUSEMp-ValueReference
Values 1
Red cell count (×106 cells/µL)9.69.59.70.150.6496.5–11.9
Hemoglobin (g/dL)13.0 a12.3 b12.3 b0.190.0288–14.1
Packed cell volume (%)33.1 a31.1 b31.2 b0.440.00723–42
Mean corpuscular volume (fL)34.2 a33.1 ab32.6 b0.440.09026.6–44.3
Mean corpuscular hemoglobin (pg)13.5 a13.1 ab12.8 b0.180.0619.1–15.6
White cell count (×103 cells/µL)11.610.911.90.920.6095.6–13.7
Neutrophils (×103 cells/µL)4.63.74.50.670.4280.6–6.1
Lymphocytes (×103 cells/µL)6.16.46.80.460.5272.2–8.7
Monocytes (×103 cells/µL)0.50.50.50.060.8090.1–0.2
Eosinophils (×103 cells/µL)0.20.20.20.080.9020–0.3
Basophils (×103 cells/µL)0.30.30.40.030.5190–0.1
Platelets (×103 cells/µL)580591524480.752220–950
SEM: Standard error of the mean. 1 Reference values were according to Lumsden, et al. [33], Martin and Lumsden [34], and Mohri, et al. [35]. ab Values in the same row with different superscripts are significantly different (p ≤ 0.10).
Table 6. Effect of slow-release urea (SRU) supplementation in concentrate diet on serum biochemical indices of growing cattle.
Parameter0% SRU1% SRU3% SRUSEMp-ValueReference Values 1
Glucose (mg/dL)101.2103.0102.92.910.87945–135
Aspartate aminotransferase (IU/L)66.1 a56.9 b62.5 ab3.030.067<60
Alanine aminotransferase (IU/L)17.214.916.60.750.1143–18
Gamma-glutamyl transferase (IU/L)13.412.111.71.130.534<16
Urea (mg/dL)27.528.224.41.440.18021–54
Uric acid (mg/dL)0.40.40.4-0.679-
Albumin (g/dL)3.7 a3.4 c3.6 b0.030.0012.5–3.8
Ammonia (mg/dL)0.70.70.90.090.105<5
Total protein (g/dL)6.8 a6.6 b6.5 b0.090.0316.8–7.5
SEM: standard error of the mean. 1 Reference values were according to EFSA [14], Lumsden, et al. [33], Martin and Lumsden [34], and Mohri, et al. [35]. a–c Values in the same row with different superscripts are significantly different (p ≤ 0.10).
Publisher’s Note: MDPI stays neutral with regard to jurisdictional claims in published maps and institutional affiliations.

