Article

Plant Protein and Plant-Based Meat Alternatives: Consumer and Nutrition Professional Attitudes and Perceptions

1
School of Medicine, University of Wollongong, Northfields Avenue, Wollongong 2522, Australia
2
Grains & Legumes Nutrition Council, 1 Rivett Road, North Ryde 2113, Australia
*
Author to whom correspondence should be addressed.
Sustainability 2021, 13(3), 1478; https://doi.org/10.3390/su13031478
Submission received: 9 December 2020 / Revised: 20 January 2021 / Accepted: 21 January 2021 / Published: 1 February 2021

Abstract

:
Plant-based and flexitarian eating patterns are increasingly popular, and the food supply system has responded with a wide range of convenience products despite a lack of understanding regarding consumer views. The aim of this study was to explore consumer and nutrition professional (NP) perceptions and attitudes to plant protein, including plant-based meat alternatives (PBMA) within an Australian context. Using an online survey promoted via social media, 679 responses (89% completion rate), achieved an even spread across key age groups. A total of sixty percent reported following a special diet, with 25% vegan and 19% flexitarian. ‘Health’ was a key driver for diet type among the NPs (53.3%) and they were less likely to follow a special diet, while “ethical” reasons were cited by consumers (69%). Plant-based eating was considered a vegan dietary pattern and the most frequently consumed plant-based proteins were whole grains. Most (74%) had tried PBMA, but they were more frequently chosen by consumers, with burger patties then sausages and mince selected as a ‘trendy’ choice; taste was very important across both groups. Products mimicking chicken and fish were of less interest. Plant-based claims were observed by 78% but these were also of greater interest to consumers. Participants reported looking for whole ingredients and iron content and expected that both iron and vitamin B12 would be comparable to red meat. Sodium was the nutrient of greatest interest to NPs and, together, these results help inform the direction for product innovation, while also highlighting the need to assess the adequacy of the dietary pattern when promoting sustainable plant-based eating.

1. Introduction

‘Plant-based’ has placed within the top ten global food trends since 2014 according to New Nutrition Business and, as of 2020, is one of the top three trends [1]. The concept has also been recently highlighted via the Planetary Health Diet as part of the Eat Lancet Commission [2] and presents as a significant opportunity to review eating patterns. Plant-based diets are focused on fruit, vegetables, nuts, whole grains and legumes, in addition to unsaturated plant oils and modest amounts of meat and dairy. Current global dietary trends are having detrimental impacts on both the environment and human health, with traditional diets being replaced by those characterised by higher intakes of refined sugars, fats, highly processed foods and meats [3]. One of the possible solutions to address current health and environmental challenges is to obtain a greater proportion of protein from plant sources. It has been suggested that following a ‘flexitarian’ dietary pattern, with a reduction in consumption of animal-based foods and increased consumption of plant-based foods has been associated with a reduction in the risk of both disease [4,5], and impacts on the planet [2,6,7]; however, sustainability assessments of food and eating patterns are complex. As little as a 3% change in total energy from animal protein (meat, poultry, fish or dairy products) to plant proteins (like whole grains, legumes, beans and nuts) has been identified in reducing risk of premature death (between 5% and 10%) in two recently published studies [5,8]. While the tendency is to focus on meat and other animal-based proteins within the diet, highly processed foods also have a higher environmental footprint. When Green House Gas emissions (GHGe) were examined, core foods contributed 68.4%, of which meat and meat alternatives contributed 33.9%. Diets with average to high amounts of discretionary foods increased emissions 121–307% compared with the recommended dietary pattern [9].
Predictions are that by 2050 we could see increases in global GHGe of 80% from food production and land erosion, as well as increasing rates of Type 2 diabetes mellitus, coronary heart disease and other chronic conditions [2,10]. Global burden of disease data points to diets high in sodium, low in whole grain, fruit, seeds, nuts, vegetables and low in omega 3 as the top six dietary concerns driving both morbidity and mortality [3]. In Australia, an unhealthy diet accounts for 27,500 preventable deaths annually, where 7400 are due to diets low in whole grain, 5500 due to low fruit, 4900 due to low nuts and seeds and 4400 due to low vegetables [11]. As a consequence, it has been suggested that “…a policy focus on the sugar and fat components of diets might have a comparatively smaller effect than that of promotion of increased uptake of vegetables, fruit, whole grains, nuts and seeds and seafood omega-3” [3]. The current Australian Dietary Guidelines only briefly address the environmental effects of food choices [12]. However, eating patterns using the Typical Australian Diet Basket (based on the 1995 National Nutrition Survey data) have been assessed against the dietary pattern proposed by the EAT Lancet Commission [13]. Researchers found that the Planetary Health Diet was more affordable than the Typical Australian Diet for metropolitan-dwelling Australians with savings of up to AUD 1800 per annum through the adoption of this dietary pattern [13]. The authors reported that further savings could be made by purchasing fresh seasonal produce, buying dry goods in bulk, utilising supermarket special buys and price mark-downs, and replacing some more expensive items (e.g., fresh salmon with less expensive tinned salmon). This research provides the basis for an economic motivator concerning changing dietary patterns, and in alignment with this is a greater emphasis on plant proteins.
To aid in the transition to a plant-based dietary pattern, alternative protein sources are being explored as possible substitutes to conventional animal-based proteins. Although vegetarian and vegan diets have been common for many years and plant-based food items such as tofu and textured soy protein have existed in the western world since at least the 1960s, more recently there has been a steadily increasing range of plant-based meat alternatives (PBMAs) [14]. Unlike tofu and textured soy protein products, it appears that the target has moved from a niche to a more mainstream trend, with a new generation of products designed specifically to appeal to meat-eaters without the need to elicit major dietary changes. PBMAs made from processed plant-based ingredients such as legume protein isolates, are formulated to imitate the taste, colour, texture and experience of eating meat. Since 2015, there has been a five-fold increase in the number of plant-based meat substitutes in Australia, where many mimic the sensory experience of consuming animal-based products [14], with launches exceeding 4400 products worldwide [15].
Modelling suggests the PBMA market in Australia alone may reach AUD 3 billion in sales by 2030 [16]; however, it is unknown if Australian consumers are truly viewing these as a direct substitute for meat, with little consumer research published to date [17]. As with plant-based milk, there may be a health halo surrounding plant-based meat products and nutritional issues may not be well understood by consumers. There is a possibility of some being led to believe that PBMAs are healthier than they are, or others missing the opportunity to enter the market, believing them to be for special diets. The lack of published research points to a significant knowledge gap regarding Australian consumer perceptions and attitudes towards these products. Research is needed to help cater to and meet consumer demand while considering the vastly different nutritional needs between groups within the population and provide educational awareness where appropriate. The aim of this study was to explore consumer and nutrition professional (NP) perceptions and attitudes to plant protein including PBMAs within an Australian context.

2. Materials and Methods

A cross-sectional self-administered online survey was conducted between June 2020 and October 2020. Ethics approval for this study was provided by the University of Wollongong HREC (2020/256). Consumer and NP perspectives on plant protein and PBMAs were sought from Australians over the age of 18 years. NPs were defined as those with a background in nutrition science or dietetics and we relied on participants to self-identify. The purpose of the study was to examine the alternative views of plant protein and PBMA by those with nutrition knowledge; however, the level or precise nature of nutrition qualification was not considered important. The survey was voluntary, anonymous, and tacit consent was provided after participants read the summarised. Participant Information Sheet on the first page of the survey. Participants were alerted to the study through a combination of convenience, snowballing and purposive recruitment, via word of mouth, as well as advertisement on social media platforms such as Facebook, Twitter and Instagram via a nation-wide promotion of the survey link. The study was also advertised in the Grains & Legumes Nutrition Council (GLNC) newsletter to over 5000 subscribers. As an incentive to encourage participation, participants were given the opportunity for inclusion in a prize draw to win a AUD 50 grain and legume food prize pack.
Survey questions including answer options for multiple choice questions were based on previous research exploring plant protein and PBMAs [17,18]. The survey (see Appendix A) comprised of 32 questions and used both open and closed questionnaire design to collect information on participant demographics, reported consumption of plant-based protein foods, perceptions of PBMAs including barriers and enablers to consumption and comparison of PBMAs to animal-based proteins. PBMAs were clearly defined as products formulated to mimic the taste, texture and appearance of animal-based products, as the absence of a definition had been noted as an issue in previous consumer research [19]. Closed multiple-choice questions were used to collect participant demographics including age, gender, highest level of education, residential area and to gather information on current eating practices and dietary preferences. Participants were asked to indicate whether they had a background in nutrition science or dietetics, which was used to define the two groups (NPs and general consumers). For diet type, participants were asked to indicate which term best describes their current dietary pattern (‘no special diet’, ‘flexitarian’, ‘vegetarian’, ‘vegan’, ‘pescatarian’, ‘gluten free’ or ‘other’), with each diet described in a short sentence to reduce respondent confusion. A five-point Likert scale was used to obtain perceptions of plant-based eating and PBMAs with options ranging from ‘strongly agree’ to ‘strongly disagree’ and ‘very important’ to ‘not at all important’ Optional open-ended questions allowed participants to expand or elaborate on their responses. The survey was pilot tested by five dietitians and three non-dietitians to assist with construct and content validity, as well as the general understanding of questions and flow of the survey tool.
Data were exported from Survey Monkey® to Microsoft® Excel® (Version 16.22, 2019, Washington, DC, USA), where data collation and cleaning occurred. Descriptive statistics were used to provide frequency counts and percentages for demographic information, multiple-choice questions and Likert scale related questions. Content analysis of open-ended responses was used to explore topics and themes as they emerged in the data, representing a conventional approach to this analysis with no preconceived ideas as to the relevant themes derived from responses [20]. Chi-Square tests with post-hoc analysis using Bonferroni adjustments for column frequencies and by considering the adjusted standardised residuals for cell comparisons were performed in SPSS (IBM SPSS®, version 25.0, IBM Corp., Chicago, IL, USA) to compare responses between NPs and consumers. For demographic questions related to diet type and reasons for following the diet, multiple responses were accepted and were excluded from statistical analysis. The significance levels for all tests was α < 0.05.

3. Results

3.1. Participant Demographics

A total of 679 eligible participants attempted the survey, corresponding to a completion rate of 89%. Partially complete questionnaires were included in the final analysis, as most responses were independent of one another. All participants resided in Australia, 37% of which were from New South Wales, 26% from Victoria, 12% from Queensland, 9% from South Australia, 7% from Western Australia, 4% from Australian Capital Territory and the remaining 5% from Tasmania and Northern Territory. As shown in Table 1, survey participants were mostly female (71.1%; n = 469), with a significantly higher (p < 0.05) proportion of females within the NPs group. In the total sample, the distribution across age groups was comparable to the Australian population [21], although the NPs tended to be younger. Three quarters of participants did not have a background in nutrition or dietetics (65.5%; n = 432); despite this, 71% (n = 468) held a bachelor or postgraduate degree. Most participants were primarily responsible for the household grocery shopping (81.4%; n = 537), with home cooking the most common method of food preparation (97.6%; n = 644).
As shown in Table 2, most participants did not follow a specific diet (37.7%; n = 249). Among the NPs, there was a higher proportion of individuals not following a specific diet (54.0%, n = 123) compared with consumers (28.7%, n = 124). A higher proportion of consumers followed a vegan diet (34.5%, n = 149). A flexitarian dietary pattern was reported by ~19% of the sample and whereas health was the key driver for dietary pattern choices among NPs, ethical concerns were the main factors influencing consumers.
The majority of participants reported consuming two serves of fruit per day (42.7%; n = 281) and four serves of vegetables per day (24.7%; n = 163). More than half of NPs reported consuming two serves of fruit per day (53.7%, n = 122), while 29% of Consumers reported two or more serves of fruit per day. A greater proportion of NPs were also more likely to consume the suggested five serves of vegetables than Consumers (22.5% and 14.2%, respectively), with most Consumers (36.9%, n = 159) reporting only two serves of vegetables per day on average.

3.2. Definition of Plant-Based Eating and Sources of Plant Protein

A plant-based diet was defined as ‘following a vegan diet’ (55.3%, n = 352), 38% (n = 244) of participants defined a plant-based diet as ‘following a flexitarian diet’ and 27.8% (n = 177) defined it as ‘a vegetarian diet’. Open-ended responses identified the most common sources of plant-based proteins as legumes, nuts, soy, tofu, whole grains, tempeh, vegetables and meat alternatives. This is depicted in a word cloud in Figure 1.

3.3. Reported Consumption of Plant Protein and Plant-Based Meat Alternatives (PBMA)

When reporting consumption, whole grains were the most frequently consumed source of plant protein, followed by nuts, seeds, legumes and tofu. As shown in Table A1 in Appendix B, there were significant differences in the consumption frequency of whole grains, nuts, tofu and tempeh between consumers and NPs but no difference in consumption for legumes or seeds. While 72.9% (n = 164) of NPs consumed whole grains daily, only 58.7% of consumers reportedly consumed whole grains daily. More than half of NPs consumed nuts daily, whereas consumers more frequently consumed tofu (27.7% ‘more than once per week’). Tempeh was the least commonly consumed plant protein, with 50.2% of NPs and 39.8% of consumers reportedly ‘never’ consuming tempeh.
When questioned about PBMA that are formulated to mimic the taste, texture and colour of animal protein, 74.2% (n = 472) of participants reported having previously tried these products. Significant differences were observed between NPs and consumers (p < 0.001). Consumption of PBMA was higher among consumers, with 20.2% reporting consuming these products “at least once or more per week”, whereas for NP, the highest frequency of consumption of PBMA was only “once per year” (20.9%, n = 47) (Table A1 in Appendix B). The most frequently consumed PBMA were burger patties (86.9%, n = 404), sausages (72.3%, n = 336), mince (67.3%, n = 313), and chicken (nuggets, strips, schnitzel) (59.1%, n = 275). Of those who had previously tried PBMAs, most had first purchased these products from the supermarket (76.9%, n = 363) as opposed to fast food chains (5.1%, n = 24) or other speciality stores (8.3%, n = 39).

3.4. Nutrition Professional and Consumer Perceptions of Following a Plant-Based Dietary Pattern

In general, most participants strongly agreed that following a plant-based dietary pattern promotes good nutrition (56.4%, n = 359) and is environmentally friendly, although 10% more consumers strongly agreed with the statement about environmental sustainability (Table 3). NPs were more likely to strongly agree that following a plant-based dietary pattern is high in dietary fibre (74.2%). In the case for protein, 42% of consumers strongly disagreed that consuming adequate protein would be difficult to obtain following a plant-based dietary pattern.

3.5. Nutrition Professional and Consumer Perceptions of Plant-Based Meat Alternatives

Of those who had previously tried PBMA (n = 472), most were driven by curiosity with 49.3% of participants selecting ‘new food trend’ as a key factor influencing consumption. This was followed by ethical concerns such as animal welfare (44.5%, n = 207), environmental concerns (41.5%, n = 193) and health reasons (28.6%, n = 133). Only 22.1% of participants reported consuming PBMA to assist in transitioning to a more plant-based diet. Common reasons for not consuming PBMA included ‘currently not interested’ (39.6%, n = 65), ‘does not suit my eating preferences’ (28.7%, n = 65), ‘I am interested but haven’t had the chance’ (18.9%, n = 31) and other (12.8%, n = 21) with ‘processed’ being the most common response (7.9%, n = 13).
Table 4 outlines the factors influencing the selection of PBMA and differences between NPs and consumers. When asked to rate the importance of certain factors, ‘suits my diet’, ‘ingredients’, ‘taste’, ‘texture’ and ‘ethical concerns’ were rated very important by both NPs and consumers. Significant differences were observed between the two groups for all factors influencing the selection of PBMA, except for ‘taste’ (p = 0.683) which was rated very important and convenience (p = 0.894) as important to both groups. More than half of NPs believed that ingredients and texture were very important (53.9 and 57.3%, respectively); however, environmental (41.6%) and ethical concerns (53.4%) were considered very important among consumers—more so than NPs. The product brand was not at all important within this sample.
When asked about willingness to pay, participants were prepared to pay on average AUD 2.00–3.00/100 g for PBMA (Table A2 in Appendix C). For plant-based burgers and minced meat products, all participants were willing to pay slightly higher than the average cost (AUD 1.38) per 100 g with the majority selecting AUD 2.00–3.00/100 g. For plant-based sausages, consumers were willing to pay AUD 2.00–3.00/100 g, which is slightly above the average cost of meat-based products (AUD 1.42); whereas, NPs selected “I would not buy this product”. For all participants, the least favourable options were plant-based chicken and fish varieties, with 36.9 and 43.2% unwilling to purchase these.
When selecting PBMA, most participants stated they looked for whole or familiar foods (57.5%, n = 268); however, 31.4% (n = 146) stated they do not look for specific ingredients. Twenty-seven percent reported looking for products with added vitamins and minerals and 22.6% (n = 105) looked for added vegetables. This trend was consistent among Consumers; however, NPs were more likely to look for products with added vitamins or minerals.
Table A3 in Appendix D outlines the importance of nutritional factors of PBMA and differences between consumers and NPs. Significant differences were observed between NPs and consumers for all nutritional factors, except for “high in protein” (p = 0.087), and “high in dietary fibre” (p = 0.081). The salt/sodium content of PBMA was considered “very important” for 44.8% of NPs (see Figure 2). Significant differences were observed in ratings for both iron and vitamin B12, with 72.8 and 73% of NPs regarded iron and B12 content as important, fairly important or very important, while far fewer consumers believed iron was very important and proportionally more felt it was not important at all, as shown in Figure 3. Surprisingly, 39.9% of NPs rated the HSR as not at all important, whereas 23.3% of consumers rated the HSR as fairly important, with a further 15.5% rating it as very important for the selection of PBMA (see Figure 4).

3.6. Comparison between Plant-Based Meat Alternatives and Animal Protein

There were significant differences in the responses provided by NPs and Consumers across all questions comparing PBMA to traditional meat (Table 5). Most participants neither agreed nor disagreed that PBMA were more nutritious than traditional meat (40.6%, n = 252), contained less energy than traditional meat (36.6%, n = 227) and contained more protein than traditional meat (45.9%, n = 285). Both NPs and consumers predominately agreed that PBMA should contain iron and B12 to match animal-based protein; however, NPs had a higher frequency in the “agreement” categories.
A total of thirty-seven percent of consumers “strongly agreed” that “PBMA are more environmentally friendly than traditional meat”; whereas NPs had the highest proportion neither agreeing nor disagreeing (34.1%, n = 74) (see Table 5). Similarly, a greater proportion of NPs “agreed” that PBMA contain more salt than traditional meat (48.4%, n = 105); whereas consumers ‘neither agreed nor disagreed’ (32.4%, n = 131). For each statement on PBMA the “I am not sure” selection always had a higher proportion from the consumer than NP participants (Table 5).

3.7. Food Labelling

Of all participants, 77.7% (n = 495) had seen a plant-based protein claim on food labels. Those who had observed this claim had seen it most commonly on ‘meat alternative’ products (87.9%, n = 435) and ready meals (62.3%, n = 311). Interestingly, NPs generally had noticed more claims on products such as bread, breakfast cereal, muesli bars, spreads, legumes and soups. In contrast, consumers had noted other food categories such as meat and dairy alternatives and crackers, chips and savoury snacks. One-third of consumers stated that they “sometimes” actively choose foods that have a plant-based protein claim on the food label (32.3%, n = 160); whereas NP stated they “rarely” look for a plant-based claim on the food label (45.6%, n = 82), closely followed by “never” (30.0%, n = 54).

4. Discussion

This study provides some insights into Australian views, beliefs, knowledge and factors influencing the choice of plant-based proteins and PBMAs from both NPs and Consumers. Importantly, those responding to the survey reported a high frequency of cooking at home (>97% for the sample) and greater than 40% consumed the recommended two serves of fruit per day while almost 25% consumed five serves of vegetables. This result was far higher than national averages for fruit (~26%) and vegetable consumption (~5%) and combined, they indicate a high level of planned eating [22], and suggest the survey attracted a healthy and well-informed consumer. Although age groups were well represented across the sample, the group of NPs were younger and predominantly female, which is typical of the professional membership with only 6% of Dietitians Australia members identifying as male [23].
In Australia, the prevalence of vegetarian and flexitarian diets has increased from 9 to 11% between 2012 and 2016 [24], and alongside this shift, there has been a five-fold increase in the number of PBMAs on Australian supermarket shelves since 2015 [14]. With plant-based dietary patterns increasing in popularity, understanding consumers’ dietary patterns is the first step for addressing potential health-related concerns and addressing these within public health measures and health promotion activities. The survey results indicated that approximately 25% of all participants followed a vegan diet and almost 20% followed a flexitarian diet. A recent nationally representative survey of Australians indicated that almost 20% of the population were meat reducers with 4.3% vegetarian and 1.6% vegan [25]. Despite the higher representation of vegan and vegetarian participants within our study population, this research was appropriate to determine consumer perceptions and attitudes of plant-based eating including PBMAs, as some studies have found a high level of unfamiliarity with the product category as they are not well established or considered the “social norm” [19]. The proportion of adoption of a specific diet was higher among consumers than NPs which may in part be due to the increasing popularity to trial diets. Additionally, consumers may attempt to balance their beliefs of both nutrition and the environment, whereas the training provided within a nutrition degree is focused on the scientific evaluation of nutrition. Therefore, the adoption of specific diets would be based on evidence for this group, as evidenced by fewer NPs following special diets.
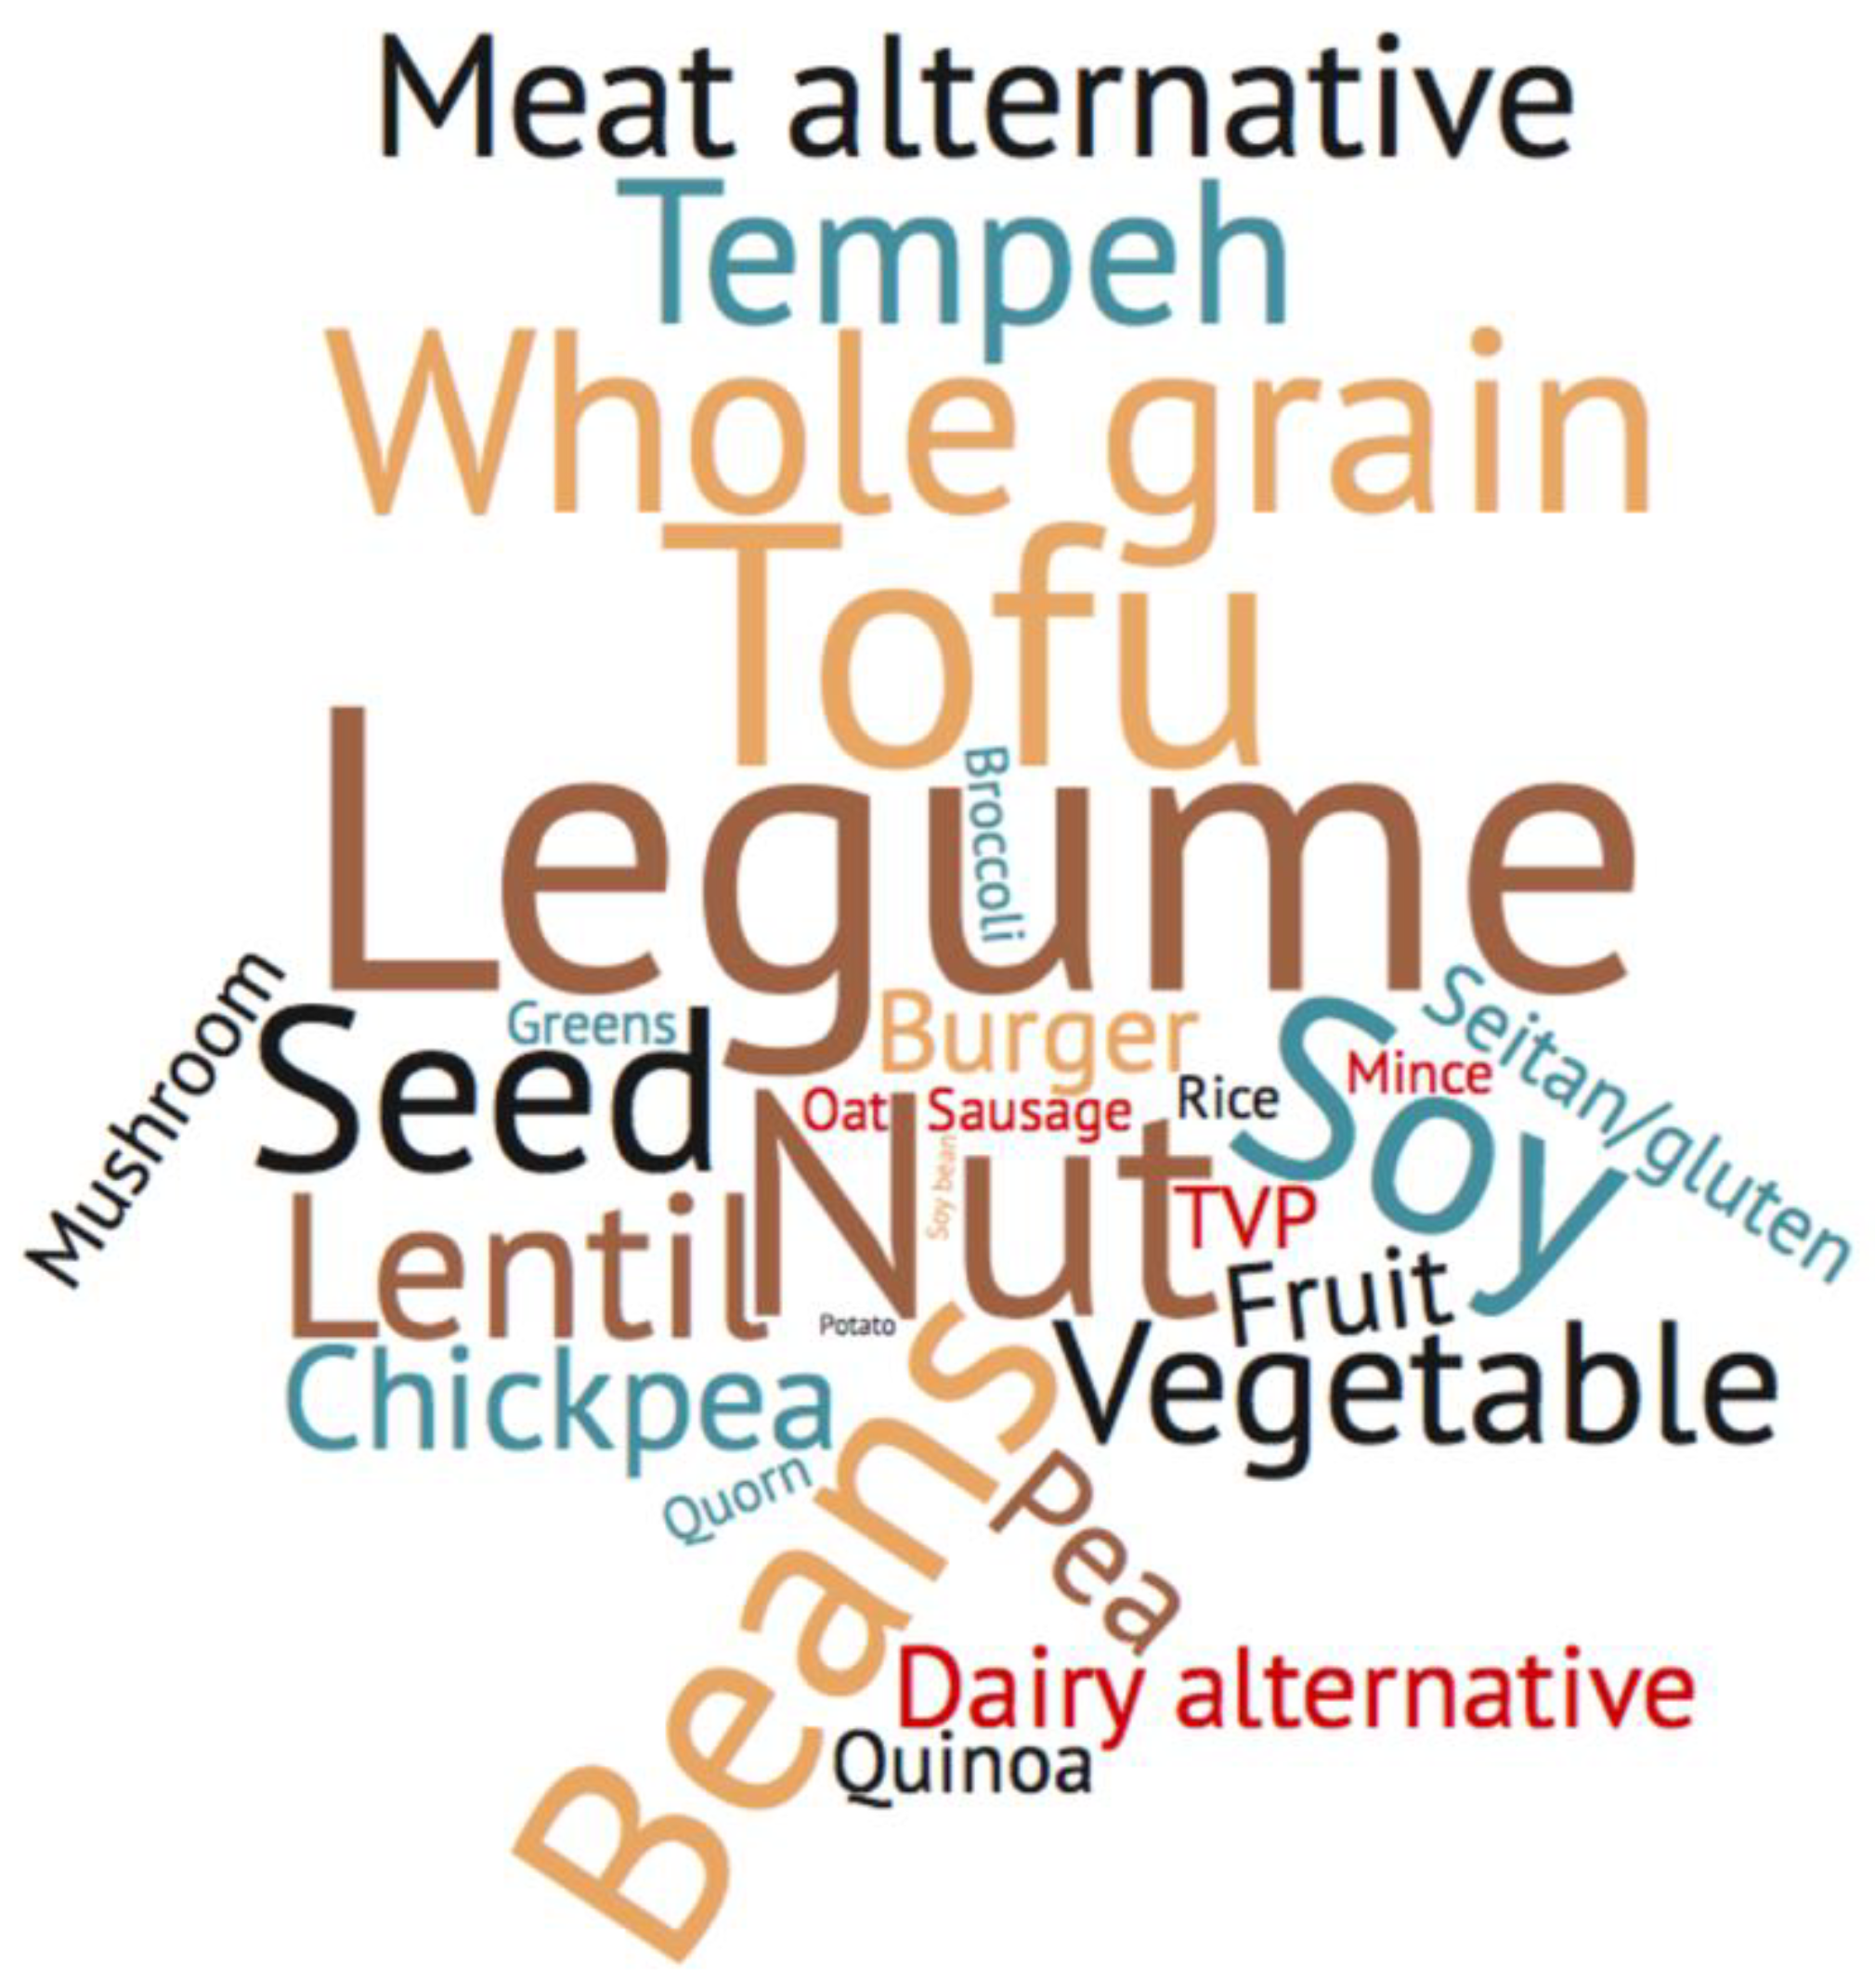
All participants identified legumes, tofu, whole grains, nuts and beans as the most common sources of plant protein, and whole grains were reported as the most commonly consumed source of plant protein, which is the case in Western countries [26]. These results may be an indication that participants may be more likely to base dietary choices on whole core foods such as whole grains and legumes as protein sources, and PBMA such as textured vegetable protein, Quorn, sausages and burger patties as secondary sources. The consumer population in our survey indicated that 46% of participants were eating PBMAs at least once per week, this consumption frequency was lower among NPs, indicating they may be more inclined to trial a product rather than consume PBMAs regularly Flexitarians in a German study were consuming slightly less than four portions of PBMA per week which was double that of Omnivores. Still, it is unclear how these portions were defined or accounted for within the study [19]. In a study of four countries (the United Kingdom, Spain, Brazil and the Dominican Republic), higher economic groups demonstrated a higher degree of readiness to adopt PBMAs in place of meat [18]. This may be a factor worth considering as there was no difference between consumers and NPs in holding a Bachelor degree in this sample, an indicator of socioeconomic status.
Results indicated that burgers and sausages were the most commonly consumed PBMA and is in agreement with the variety and range of products on offer within Australian supermarkets, where a recent audit found 50 burger, 29 sausage, 24 mince and 10 chicken products [14]. Additionally, research of PBMA companies indicates the Australian market may reach $3 billion in sales by 2030 [16], and internationally, chicken (22%), beef (19%) and pork (15%) are the primary product focus areas [27]. This information alludes to the fact that there is an opportunity for beef and chicken alternates. However, from our results, seafood alternates do not appear to be of interest, with 43.2% of participants not willing to purchase plant-based fish alternatives. This may be due to the flexitarian and pescatarian population still choosing to include fish products, therefore not requiring an alternative PBMA may be best suited as red meat alternatives potentially due to the awareness that red meat, particularly processed meat, has established links with cardiovascular and colon cancer disease [28,29]. Both our data and information gathered internationally indicate that public health education efforts should be targeted to improve consumer understanding of plant-based products and provide guidance for better health.
Regarding nutrients, consumers and NPs were aligned in their assessment of the importance of protein and dietary fibre. As suggested by Weinrich, we assessed consumer concerns about protein deficiency through the use of PBMA [17], however it was NPs who indicated concerns when asked about the overall nutrition and protein content in comparison to meat, with nearly 40% in both instances disagreeing with the statement posed. Most survey participants, especially NPs, considered sodium content to be very important when choosing PBMAs. An audit of Australian supermarkets indicated that the mean sodium content of PBMAs was 372–568 mg/100 g, and up to 1200 mg/100 g, which suggests the need for industry reformulation targets in Australia, as in England [14]. Consumers considering sodium content as very important may indicate the success of campaigns to highlight this ingredient as a key health issue [30].
As found in our study, a higher proportion of NPs considered fortification with iron and B12 as of greater importance than consumers. Meat provides an efficient source of nutrients such as iron, zinc, polyunsaturated fatty acids, vitamin A, B12 and D and it has been suggested that a suitable PBMA should provide similar quantities of essential nutrients [14]. However, in Australia, only one fifth of PBMAs are fortified with iron and less than a quarter are fortified with vitamin B12 [14]. As the popularity of plant-based diets continue to grow, a greater proportion of the population may be at risk of nutrient deficiencies [31], particularly younger women who are more likely to choose vegan or vegetarian dietary patterns, coupled with increased nutrient requirements. As found in a study of Australian University females, 33.9% of participants had hypoferritinemia and 11.3% had low B12, which may be attributed to the exclusion of whole food groups such as red meat [32]. Similarly, in a large cross-sectional study of more than 20,000 individuals, where red and processed meat was partially replaced by plant-based alternatives (legumes, seeds and nuts), diet quality improved, however there were adverse impacts on micronutrients, particularly zinc and vitamin B12 [33]. As such, there is value in fortifying PBMAs with micronutrients to supplement intakes and reduce the risk of deficiencies if they are to be consumed in place of animal-based proteins. However, in saying this, it is important to consider an individual’s habitual diet when assessing nutrient risk [34]. As concluded by van Vliet et al., if consumers were to follow a flexitarian diet, it is unlikely that unfortified PBMA would negatively impact overall nutrient status [35]. Therefore, fortification of PBMAs with iron and vitamin B12 may assist with insufficient intakes and potential nutrient deficiencies within a population; however, on an individual level, nutritional adequacy of the entire diet must be considered.
Our survey results indicated that 23.3% of consumers considered the health star rating (HSR) “fairly important” when selecting a PBMA (Figure 4). Previous research of the HSR found that consumers have a positive experience of the HSR and that its existence on-pack can sway the consumer to see the product in a positive nutritional light [36]. The audit of PBMA in Australian supermarkets indicated that 46% of products displayed a HSR, with the average HSR being above the “healthy pass” mark of 3.5 stars [14]. Interestingly, 39.9% of NPs considered the HSR not important at all when selecting PBMA. The reluctance to utilise the system when selecting products may be influenced by the access NPs have to literature critiquing the front of pack labelling system and its limitations [37]. The limited use of the HSR system as a tool by well-informed consumers may also be due to distrust in the system or their ability to make a judgement on the healthfulness of the product without the need to use the labelling tool. In the United States, consumers were asked to identify the healthier product when presented with two burger products, one being plant-based and the other being meat-based. Nearly half of the participants selected the plant-based product since it provided a breakdown of nutrients in the nutrition information panel that the meat product did not display. This is a further indication of the “health halo” that is potentially associated with these foods [38].
The recent Eat Lancet Commission have highlighted the health and planetary benefits of consuming more plant-based foods, with flexitarian dietary patterns as an example of this style of eating [2]. Among all participants in the survey, more than half (56.4%) strongly agreed that following a plant-based diet promotes good nutrition and is environmentally friendly. In the case of environmental sustainability, it appeared that consumer perceptions of plant-based eating were reflected in their opinions of PBMA; where most strongly agreed that both plant-based diets and PBMAs were environmentally friendly. Despite the perception, PBMA life cycle analysis has produced mixed results when it comes to the environmental impact of these products. One study applying an integrated conceptual framework found that “their potential sustainability benefits may turn out to be disappointing, due to the extensive processing that is required which takes energy and leads to losses during the transformation” [39]. In comparison, an industry commissioned life cycle analysis found that PBMAs generate 90% less GHGe and use 46% less energy and 93% less land compared to their beef counterpart [40]. Therefore, further life cycle analysis from an Australian perspective considering inputs and outputs is required to understand the environmental impact, particularly where products are imported or made from imported ingredients. Furthermore, consideration of products with whole food ingredients (rather than isolates), may reveal greater health and sustainability advantages while acknowledging the synergistic effects of the whole food [34].
Environmental and ethical themes were top of mind for consumers in this study compared to research a decade ago [19]; however, repeat purchase is known to be driven by taste and sensory appeal while environmental arguments are thought to be less critical in the decision stage [17]. As found in our study, the consumption of PBMAs was driven more so by curiosity, than for ethical, environmental or health reasons. This is in line with previous research investigating enablers of PBMA intake including a recent online survey involving 1000 US adults [41]. Authors found that the curiosity to try new foods was the top reason for trying PBMAs [41], and while 39.6% (n = 65) of participants in our survey had no interest in trying PBMAs, only a small number (18.9% n = 31) had not yet had the chance to try the products, with seemingly no objections to the products. Cost is another factor influencing purchasing decisions, with a unique suggestion to make animal proteins more expensive than PBMAs rather than trying to make meat alternatives less expensive [19]. The same authors, through their analysis of preferences, suggested focusing efforts on processed meat alternatives rather than on replicating particular cuts of meat [19].
There were some strengths associated with this study, one being the sample size of individuals who had tried PBMA, which allowed comparison between Consumers and NPs. The inclusion of NPs enabled comparison of trained professionals’ views with that of the general population, providing insight into misinformation and potential for further education and public health efforts. We did not formally confirm NPs qualifications, as our interest was primarily in their advanced knowledge of diet–disease relationships and understanding of food supply system issues pertaining to sustainability and food processing, such as fortification. We correctly anticipated divergent views regarding nutrient content between consumers and NPs. The advertising for the study was approved by the University of Wollongong HREC and did not seek to attract any particular group or dietary preference however, a high proportion of vegans and vegetarians participated in the study. This facilitated the collection of in-depth information surrounding their views and consumption habits of plant proteins and PBMA, although this may have resulted in an under-representation of unrestricted meat-eaters, which is a limitation of the study. Furthermore, as the study population are not representative of the Australian population, results are not generalisable and findings cannot be extrapolated beyond the study group. Additionally, there was potential for social desirability where participants may exaggerate their intake of PBMAs in the belief these products are of high nutritional quality. To account for this systematic bias, the survey was designed to limit social desirability by allowing participants to select responses on a scale including “I’m not sure” and the ability to skip questions. Additionally, the survey commenced prior to COVID-19 and any awareness of the impacts of the pandemic on lifestyle, the food supply and cooking habits. This needs to be considered; however, as we now are aware, the situation in Australia has been far less impacted than other countries around the world.

5. Conclusions

Interest in a plant-based diet and consumption of PBMAs is rapidly growing with consumers believing these products promote good health while also being environmentally friendly. The results of this survey indicate the importance of further research into the life cycle of PBMA products to evaluate and substantiate their environmental impact, to reassure consumers. Additionally, there is potential for product innovation to ensure adequate attention to micronutrients, particularly if these products are to be exchanged for meat, which is especially relevant for vegan and vegetarian consumers who are at greater risk of deficiency. Plant-based and plant proteins undeniably reflect a substantial trend that will play out over the next decade at the very least, in research, impacting policy and food systems. Nutrition professionals must consider the nutritional adequacy of the entire dietary pattern, with the opportunity to highlight whole foods, whole grains and legumes and their use in tasty products to tempt a range of consumers so there is a “new normal” aimed at sustainable, plant-based diets.

Author Contributions

Conceptualisation, S.G. and J.H.; methodology, S.G.; formal analysis, M.E.; writing—review and editing, M.E., S.G. and J.H. All authors have read and agreed to the published version of the manuscript.

Funding

This research received no external funding but was supported by the Grains & Legumes Nutrition Council, a not-for-profit charity.

Institutional Review Board Statement

This study was conducted according to the guidelines of the Declaration of Helsinki, and approved by the University of Wollongong Human Research Ethics Committee (2020/256).

Informed Consent Statement

Informed consent was obtained from all subjects involved in the study.

Data Availability Statement

All data for this study is contained within the article.

Acknowledgments

Thanks to Amy Groucutt and Vanessa El Hosri, Student Dietitians from the University of Wollongong, NSW, who were involved in the development of the survey as part of their university studies. Thanks to Marijka Batterham, Director Statistical Consulting Centre from the University of Wollongong, NSW, who provided statistical advice.

Conflicts of Interest

The authors declare no conflict of interest. J.H. and S.G. are employed by the Grains and Legumes Nutrition Council, a not-for-profit charity.

Appendix A

Survey Questions
  • What is your age group?
  • What is your gender?
  • Where do you currently live?
  • What is your highest level of education that you have completed?
  • Do you have a background in nutrition science or dietetics?
  • Which of the following categories best describes your annual combined household income?
  • Who does the majority of the food shopping in your household?
  • How do you mostly prepare your food?
  • Do you follow a specific diet? Please select all that apply to you
  • Why do you have these dietary requirements? Please select all that apply.
  • How many serves of fruit do you eat per day?
  • How many serves of vegetables do you eat per day?
  • Which of the following best defines plant-based eating? Please select all that apply.
  • When thinking of plant-based protein, what foods come to mind?
  • How frequently do you eat the following foods containing plant-based protein? This includes whole grains (e.g., whole meal bread, cereal, brown rice or pasta), legumes (e.g., lentils, baked beans, kidney beans, cannellini beans, broad beans, chickpeas, hummus, edamame), nuts, seeds, tofu and tempeh.
  • Please indicate how much you agree with the following statements about the benefits of following a plant-based dietary pattern.
  • Have you seen “plant-based protein” claims on food labels?
  • What types of products have you seen feature a “plant-based protein” claim? Please select all that apply.
  • Do you actively choose foods that have the “plant-based protein” claim on food labels?
  • Have you ever tried plant-based meat alternatives formulated to look like meat or seafood?
  • Select all the plant-based meat alternative products you have previously tried from the list below.
  • How frequently do you consume plant-based meat alternatives?
  • Where did you first purchase plant-based meat alternatives?
  • What are the reasons for choosing these foods? Please select all that apply.
  • When shopping for plant-based meat alternatives, what ingredients do you look for? Please select all that apply.
  • Thinking specifically about the nutrient content of plant-based meat alternatives, how important are the following factors when choosing a product?
  • When selecting plant-based meat alternatives, how important are the following factors?
  • Have you ever heard of the following plant-based meat alternative brands? Please select all that apply.
  • Can you tell us the reason why you have not tried plant-based meat alternatives?
  • How much do you agree with the following statements about plant-based meat alternatives?
Considering the average cost per 100 g of meat mince is $1.38, meat sausage is $1.42, chicken breast is $1.47, fish fillets are $2.03 and canned fish is $2.62, how much are you willing to pay per 100 g for the following plant-based meat alternatives? (Average prices correct as of 3 June 2020 sourced from Woolworths website)

Appendix B

Table A1. Frequency of consumption for plant-based protein and PBMA and differences between consumers and nutrition professionals.
Plant-Based Protein or Meat AlternativeCount (%)
NeverOnce Per YearFew Times Per YearOnce Per Month2–3 Times Per MonthOnce Per WeekMore than Once Per WeekDailyp-Value
Whole grains9 (1.4)1 (0.2)10 (1.6)8 (1.3)10 (1.6)33 (5.2)160 (25.1)406 (63.7)
NP (n = 225)3 (1.3)0 (0.0)1 (0.4)2 (0.9)2 (0.9)3 (1.3) *50 (22.2)164 (72.9) *0.005
Consumer (n = 412)6 (1.5)1 (0.2)9 (2.2)6 (1.5)8 (1.9)30 (7.3)110 (26.7)242 (58.7)
Legumes6 (0.9)2 (0.3)5 (0.8)18 (2.8)45 (7.1)88 (13.8)315 (49.5)158 (24.8)
NP (n = 225)3 (1.3)0 (0.0)1 (0.4)5 (2.2)21 (9.3)33 (14.7)116 (51.6)46 (20.4)0.306
Consumer (n = 412)3 (0.7)2 (0.5)4 (1.0)13 (3.2)24 (5.8)55 (13.4)199 (48.3)122 27.2)
Nuts7 (1.1)0 (0.0)20 (3.1)16 (2.5)34 (5.3)72 (11.3)199 (31.2)289 (45.4)
NP (n = 225)5 (2.2) *0 (0.0)2 (0.9) *3 (1.3)7 (3.1)20 (8.9)75 (33.3)113 (50.2)0.004
Consumer (n = 412)2 (0.5)0 (0.0)18 (4.4)13 (3.2)27 (6.6)52 (12.6)124 (30.1)176 (42.7)
Seeds9 (1.4)3 (0.5)29 (4.6)28 (4.4)61 (9.6)93 (14.6)201 (31.6)213 (33.4)
NP (n = 225)2 (0.9)0 (0.0)8 (3.6)10 (4.4)19 (8.4)31 (13.8)74 (32.9)81 (36.0)0.711
Consumer (n = 412)7 (1.7)3 (0.7)21 (5.1)18 (4.4)42 (10.2)62 (15.1)127 (30.8)132 (32.0)
Tofu73 (11.5)27 (4.2)84 (13.2)62 (9.7)96 (15.0)127 (19.9)153 (24.0)15 (2.4)
NP (n = 225)18 (8.0) *13 (5.8)34 (15.1)28 (12.4)43 (19.1) *47 (20.9)39 (17.3) *3 (1.3)0.004
Consumer (n = 412)55 (39.8)30 (3.4)50 (12.1)34 (8.3)53 (12.9)80 (19.4)114 (27.7)12 (2.9)
Tempeh277 (43.5)57 (9.0)84 (13.2)62 (9.7)63 (9.9)32 (5.0)24 (3.8)1 (0.2)
NP (n = 225)113 (50.2) *27 (12.0) *39 (17.3)15 (6.7) *18 (8.0)8 (3.6)5 (2.2)0 (0.0)0.016
Consumer (n = 412)164 (39.8)30 (7.3)79 (19.2)50 (12.1)45 (10.9)24 (5.8)19 (4.6)1 (0.2)
PBMA164 (25.8)95 (14.9)102 (16.0)55 (8.6)41 (6.5)69 (10%)93 (14.6)10 (1.6)
NP (n = 225)78 (34.7) *47 (20.9) *40 (17.8)21 (9.3)11 (4.9)13 (5.8) *10 (4.4) *1 (0.4)<0.001
Consumer (n = 411)86 (20.9)48 (11.7)62 (15.1)34 (8.3)30 (7.3)56 (13.6)83 (20.2)9 (2.2)
* within group differences (z score ± 1.96).

Appendix C

Table A2. Participants willingness to pay for PBMA products per 100 g compared to the average cost of traditional animal protein per 100 g.
Product (Average Meat Product Cost/100 g)Count (%)
AUD 1.00–2.00/100 gAUD 2.00–3.00/100 gAUD 3.00–4.00/100 gAUD 4.00–5.00/100 g>AUD 5.00/100 gI Would Not Buy Thisp-Value
Plant-based burger ($1.38)184 (29.6)213 (34.3)82 (13.2)22 (3.5)17 (2.7)103 (16.6)0.061
NP (n = 217)65 (30.0)71 (32.7)27 (12.4)4 (1.8)3 (1.4)47 (21.7) *
Consumer (n = 404)119 (29.5)142 (35.2)55 (13.6)18 (4.5)14 (3.5)56 (13.9)
Plant based minced meat ($1.38)186 (30.0)188 (30.3)60 (9.7)18 (2.9)20 (3.2)149 (24.0)0.313
NP (n = 217)64 (29.5)67 (30.9)17 (7.8)3 (1.4)6 (2.8)60 (27.7)
Consumer (n = 404)122 (30.2)121 (30.0)43 (10.6)15 (3.7)14 (3.5)89 (22.0)
Plant based sausages ($1.42)173 (27.9)194 (31.2)51 (8.2)25 (4.0)16 (2.6)162 (26.1)0.004
NP (n = 217)64 (29.5)60 (27.8)11 (5.1) *7 (3.2)2 (0.9)73 (33.6) *
Consumer (n = 404)109 (27.0)134 (33.2)40 (9.9)18 (4.5)14 (3.5)89 (22.0%
Plant based chicken alternatives ($1.47)132 (21.3)186 (30.0) 66 (10.6)31 (5.0)16 (2.6)190 (30.6)0.044
NP (n = 217)44 (30.3) 63 (29.0)20 (9.2)9 (4.2)1 (0.5) *80 (36.9) *
Consumer (n = 404)88 (21.8)123 (30.5)46 (11.4)22 (5.5)15 (3.7)110 (27.2)
Plant based fish alternatives ($2.03 fillet, $2.62 canned)71 (11.4)164 (26.4)75 (12.1)29 (4.7)14 (2.3)268 (43.2)0.653
NP (n = 217)23 (10.6)59 (27.2)25 (11.5)10 (4.6)2 (0.9)98 (45.2)
Consumer (n = 404)48 (11.9)105 (26.0)50 (12.4)19 (4.7)12 (3.0)170 (42.1)
* within group differences (z score ± 1.96).

Appendix D

Table A3. Importance of the nutrient content of plant-based meat alternatives and difference between Nutrition Professionals (n = 143) and Consumers (n = 322).
PBMA Nutrient ContentCount (%)
Not at All ImportantSlightly ImportantImportantFairly ImportantVery ImportantI’m Not Surep-Value
High in protein40 (8.6)54 (11.6)102 (21.9)107 (23.0)151 (32.5)11 (2.4)
NP (n = 143)9 (6.3)16 (11.2)28 (19.6)34 (23.8)56 (39.2)0 (0.0) *0.087
Consumer (n = 322)31 (9.6)38 (11.8)74 (23.0)73 (22.7)95 (29.5)11 (3.4)
High in dietary fibre49 (10.5)75 (16.1)107 (23.0)114 (24.5) 106 (22.8)14 (3.0)
NP (n = 143)16 (11.2)26 (18.2)29 (20.3)42 (29.4) 30 (21.0)0 (0.0) *0.081
Consumer (n = 322)33 (10.3)49 (15.2)78 (24.2) 72 (22.4)76 (23.6) 14 (4.4)
Fat content30 (6.5)84 (18.1)106 (22.8)121 (26.0) 105 (22.6)19 (4.1)
NP (n = 143)6 (4.2)26 (18.2)35 (24.5)43 (30.1) 33 (23.1)0 (0.0) *0.040
Consumer (n = 322)24 (7.5)58 (18.0)71 (24.2)78 (24.2) 72 (22.4)19 (5.9)
Salt content35 (7.5)76 (16.3)79 (17.0)105 (22.6)153 (32.9) 17 (3.7)
NP (n = 143)6 (4.2)18 (12.6)20 (14.0)35 (24.5)64 (44.8) *0 (0.0) *<0.001
Consumer (n = 322)29 (9.0)58 (18.0)59 (18.3)70 (21.7)89 (27.6) 17 (5.3)
Contains iron54 (11.6)80 (18.1)117 (25.2) 109 (23.4)85 (18.3)20 (4.3)
NP (n = 143)8 (5.6) *31 (21.7)34 (23.8)34 (23.8)36 (25.2) *0 (0.0) *<0.001
Consumer (n = 322)46 (14.3)49 (15.2)83 (25.8) 75 (23.3)49 (15.2)20 (6.2)
Contains B1259 (12.7)84 (18.1)106 (22.8)107 (23.0) 87 (18.7)22 (4.7)
NP (n = 143)16 (11.2)22 (15.4)37 (25.9)39 (27.3) 29 (20.3)0 (0.0) *0.018
Consumer (n = 322)43 (13.4)62 (19.3)69 (21.4) 68 (21.1)58 (18.0)22 (6.8)
Contains organic ingredients143 (30.8) 91 (19.6)89 (19.1)88 (19.1)64 (13.8)16 (3.4)
NP (n = 143)67 (46.9) 40 (28.0)18 (12.6)8 (5.6) *8 (5.6) *2 (1.4) *<0.001
Consumer (n = 322)76 (23.6) 69 (21.4)57 (17.7)57 (17.7)43 (13.4)19 (5.9)
Health Star Rating117 (25.2) 91 (19.6)89 (19.1)88 (18.9)64 (13.8)16 (3.4)
NP (n = 143)57 (39.9) *31 (21.7)28 (19.6)13 (9.1) *14 (9.8)0 (0.0) *<0.001
Consumer (n = 322)60 (18.6)60 (18.6)61 (18.9)75 (23.3) 50 (15.5)16 (5.0)
* Chi-Square tests using Bonferroni adjustments—within group differences (z score ± 1.96).

References

  1. New Nutrition Business. 10 Key Trends in Food, Nutrition Health 2020; New Nutrition Business: London, UK, 2020. [Google Scholar]
  2. Willett, W.; Rockström, J.; Loken, B.; Springmann, M.; Lang, T.; Vermeulen, S.; Garnett, T.; Tilman, D.; DeClerck, F.; Wood, A.; et al. Food in the Anthropocene: The EAT-Lancet Commission on healthy diets from sustainable food systems. Lancet 2019, 393, 447–492. [Google Scholar] [CrossRef]
  3. Afshin, A.; Sur, P.J.; Fay, K.A.; Cornaby, L.; Ferrara, G.; Salama, J.S.; Mullany, E.C.; Abate, K.H.; Abbafati, C.; Abebe, Z.; et al. Health effects of dietary risks in 195 countries, 1990–2017: A systematic analysis for the Global Burden of Disease Study 2017. Lancet 2019, 393, 1958–1972. [Google Scholar] [CrossRef] [Green Version]
  4. Qian, F.; Liu, G.; Hu, F.B.; Bhupathiraju, S.N.; Sun, Q. Association Between Plant-Based Dietary Patterns and Risk of Type 2 Diabetes: A Systematic Review and Meta-analysis. JAMA Intern. Med. 2019, 179, 1335–1344. [Google Scholar] [CrossRef] [PubMed]
  5. Naghshi, S.; Sadeghi, O.; Willett, W.C.; Esmaillzadeh, A. Dietary intake of total, animal, and plant proteins and risk of all cause, cardiovascular, and cancer mortality: Systematic review and dose-response meta-analysis of prospective cohort studies. BMJ 2020, 370, m2412. [Google Scholar] [CrossRef] [PubMed]
  6. Derbyshire, E.J. Flexitarian Diets and Health: A Review of the Evidence-Based Literature. Front. Nutr. 2017, 3, 55. [Google Scholar] [CrossRef] [PubMed] [Green Version]
  7. Godfray, H.C.J.; Aveyard, P.; Garnett, T.; Hall, J.W.; Key, T.J.; Lorimer, J.; Pierrehumbert, R.T.; Scarborough, P.; Springmann, M.; Jebb, S.A. Meat consumption, health, and the environment. Science 2018, 361, eaam5324. [Google Scholar] [CrossRef] [Green Version]
  8. Huang, J.; Liao, L.M.; Weinstein, S.J.; Sinha, R.; Graubard, B.I.; Albanes, D. Association Between Plant and Animal Protein Intake and Overall and Cause-Specific Mortality. JAMA Intern. Med. 2020, 180, 1173–1184. [Google Scholar] [CrossRef]
  9. Hendrie, G.A.; Baird, D.; Ridoutt, B.; Hadjikakou, M.; Noakes, M. Overconsumption of Energy and Excessive Discretionary Food Intake Inflates Dietary Greenhouse Gas Emissions in Australia. Nutrients 2016, 8, 690. [Google Scholar] [CrossRef] [Green Version]
  10. Tilman, D.; Clark, M. Global diets link environmental sustainability and human health. Nature 2014, 515, 518–522. [Google Scholar] [CrossRef]
  11. Crosland, P.; Ananthapavan, J.; Davison, J.; Lambert, M.; Carter, R. The health burden of preventable disease in Australia: A systematic review. Aust. N. Z. J. Public Health 2019, 43, 163–170. [Google Scholar] [CrossRef]
  12. Bogueva, D.; Marinova, D.; Raphaely, T. Reducing meat consumption: The case for social marketing. Asia Pac. J. Mark. Logist. 2017, 29, 477–500. [Google Scholar] [CrossRef]
  13. Goulding, T.; Lindberg, R.; Russell, C.G. The affordability of a healthy and sustainable diet: An Australian case study. Nutr. J. 2020, 19, 109. [Google Scholar] [CrossRef] [PubMed]
  14. Curtain, F.; Grafenauer, S. Plant-Based Meat Substitutes in the Flexitarian Age: An Audit of Products on Supermarket Shelves. Nutrients 2019, 11, 2603. [Google Scholar] [CrossRef] [PubMed] [Green Version]
  15. Mintel Group Ltd. Mintel Global New Product Database—Meat Substitutes; Mintel Group Ltd: London, UK, 2019. [Google Scholar]
  16. Lawrence, S.; King, T. Meat the Alternative: Australia’s $3 Billion Opportunity; Food Frontier: Melbourne, Australia, 2019. [Google Scholar]
  17. Weinrich, R. Opportunities for the Adoption of Health-Based Sustainable Dietary Patterns: A Review on Consumer Research of Meat Substitutes. Sustainability 2019, 11, 4028. [Google Scholar] [CrossRef] [Green Version]
  18. Gómez-Luciano, C.A.; de Aguiar, L.K.; Vriesekoop, F.; Urbano, B. Consumers’ willingness to purchase three alternatives to meat proteins in the United Kingdom, Spain, Brazil and the Dominican Republic. Food Qual. Prefer. 2019, 78, 103732. [Google Scholar] [CrossRef]
  19. Michel, F.; Hartmann, C.; Siegrist, M. Consumers’ associations, perceptions and acceptance of meat and plant-based meat alternatives. Food Qual. Prefer. 2021, 87, 104063. [Google Scholar] [CrossRef]
  20. Hsieh, H.-F.; Shannon, S.E. Three Approaches to Qualitative Content Analysis. Qual. Health Res. 2005, 15, 1277–1288. [Google Scholar] [CrossRef]
  21. Australian Bureau of Statistics 3101.0-Australian Demographic Statistics. Available online: https://www.abs.gov.au/AUSSTATS/abs@.nsf/DetailsPage/3101.0Jun%202019?OpenDocument (accessed on 3 December 2020).
  22. Hanson, A.J.; Kattelmann, K.K.; McCormack, L.A.; Zhou, W.; Brown, O.N.; Horacek, T.M.; Shelnutt, K.P.; Kidd, T.; Opoku-Acheampong, A.; Franzen-Castle, L.D.; et al. Cooking and Meal Planning as Predictors of Fruit and Vegetable Intake and BMI in First-Year College Students. Int. J. Environ. Res. Public Health 2019, 16, 2462. [Google Scholar] [CrossRef] [Green Version]
  23. Porter, J.; Collins, J. Do images of dietitians on the Internet reflect the profession? J. Hum. Nutr. Diet. 2020. [Google Scholar] [CrossRef]
  24. Malek, L.; Umberger, W.J.; Goddard, E. Committed vs. uncommitted meat eaters: Understanding willingness to change protein consumption. Appetite 2019, 138, 115–126. [Google Scholar] [CrossRef]
  25. Malek, L.; Umberger, W.J. Distinguishing meat reducers from unrestricted omnivores, vegetarians and vegans: A comprehensive comparison of Australian consumers. Food Qual. Prefer. 2021, 88, 104081. [Google Scholar] [CrossRef]
  26. Halkjaer, J.; Olsen, A.; Bjerregaard, L.J.; Deharveng, G.; Tjønneland, A.; Welch, A.A.; Crowe, F.L.; Wirfält, E.; Hellstrom, V.; Niravong, M.; et al. Intake of total, animal and plant proteins, and their food sources in 10 countries in the European Prospective Investigation into Cancer and Nutrition. Eur. J. Clin. Nutr. 2009, 63 (Suppl. 4), S16–S36. [Google Scholar] [CrossRef] [PubMed] [Green Version]
  27. Choudhury, D.; Singh, S.; Seah, J.S.H.; Yeo, D.C.L.; Tan, L.P. Commercialization of Plant-Based Meat Alternatives. Trends Plant Sci. 2020, 25, 1055–1058. [Google Scholar] [CrossRef] [PubMed]
  28. McAfee, A.J.; McSorley, E.M.; Cuskelly, G.J.; Moss, B.W.; Wallace, J.M.; Bonham, M.P.; Fearon, A.M. Red meat consumption: An overview of the risks and benefits. Meat Sci. 2010, 84, 1–13. [Google Scholar] [CrossRef] [PubMed]
  29. Al-Shaar, L.; Satija, A.; Wang, D.D.; Rimm, E.B.; Smith-Warner, S.A.; Stampfer, M.J.; Hu, F.B.; Willett, W.C. Red meat intake and risk of coronary heart disease among US men: Prospective cohort study. BMJ 2020, 371, m4141. [Google Scholar] [CrossRef]
  30. Rosewarne, E.; Farrand, C. Salt Levels in Meat Alternatives in Australia (2010–2019); The George Institute for Global Health: Sydney, Australia, 2019. [Google Scholar]
  31. Payne, C.L.R.; Scarborough, P.; Cobiac, L. Do low-carbon-emission diets lead to higher nutritional quality and positive health outcomes? A systematic review of the literature. Public Health Nutr. 2016, 19, 2654–2661. [Google Scholar] [CrossRef]
  32. Fayet-Moore, F.; Petocz, P.; Samman, S. Micronutrient status in female university students: Iron, zinc, copper, selenium, vitamin B12 and folate. Nutrients 2014, 6, 5103–5116. [Google Scholar] [CrossRef] [Green Version]
  33. Vatanparast, H.; Islam, N.; Shafiee, M.; Ramdath, D.D. Increasing Plant-Based Meat Alternatives and Decreasing Red and Processed Meat in the Diet Differentially Affect the Diet Quality and Nutrient Intakes of Canadians. Nutrients 2020, 12, 2034. [Google Scholar] [CrossRef]
  34. Jacobs, D.R.; Tapsell, L.C. Food, Not Nutrients, Is the Fundamental Unit in Nutrition. Nutr. Rev. 2007, 65, 439–450. [Google Scholar] [CrossRef]
  35. van Vliet, S.; Kronberg, S.L.; Provenza, F.D. Plant-Based Meats, Human Health, and Climate Change. Front. Sustain. Food Syst. 2020, 4, 128. [Google Scholar] [CrossRef]
  36. Hamlin, R.; McNeill, L. The impact of the Australasian ‘Health Star Rating’, front-of-pack nutritional label, on consumer choice: A longitudinal study. Nutrients 2018, 10, 906. [Google Scholar] [CrossRef] [Green Version]
  37. Grafenauer, S.; Locke, A.; Curtain, F. Whole Grain Diets, Health Star Ratings and Opportunities for Health Related Promotion of Grains. 2019. Available online: https://grdc.com.au/resources-and-publications/grdc-update-papers/tab-content/grdc-update-papers/2019/02/whole-grain-diets,-health-star-ratings-and-opportunities-for-health-related-promotion-of-grains (accessed on 11 December 2020).
  38. Edge, M.S.; Garrett, J.L. The Nutrition Limitations of Mimicking Meat. Cereal Foods World 2020, 65. [Google Scholar] [CrossRef]
  39. van der Weele, C.; Feindt, P.; van der Goot, A.J.; van Mierlo, B.; van Boekel, M. Meat alternatives: An integrative comparison. Trends Food Sci. Technol. 2019, 88, 505–512. [Google Scholar] [CrossRef]
  40. Hu, F.B.; Otis, B.O.; McCarthy, G. Can plant-based meat alternatives Be part of a healthy and sustainable diet? JAMA 2019, 322, 1547–1548. [Google Scholar] [CrossRef] [PubMed]
  41. A Consumer Survey on Plant Alternatives to Animal Meat. Available online: https://foodinsight.org/consumer-survey-plant-alternatives-to-meat/ (accessed on 11 December 2020).
Figure 1. Word cloud based on responses to the question “When thinking of plant-based protein, what foods come to mind?” Larger fonts indicate a higher frequency of mentions by participants.
Sustainability 13 01478 g001
Figure 2. Importance of the salt (sodium) content of PBMAs between nutrition professionals and consumers (* Chi-Square tests using Bonferroni adjustments—within group differences (z score ± 1.96)).
Sustainability 13 01478 g002
Figure 3. Importance of the iron content of PBMAs between nutrition professionals and consumers (* Chi-Square tests using Bonferroni adjustments—within group differences (z score ± 1.96)).
Sustainability 13 01478 g003
Figure 4. Importance of the Health Star Rating of PBMAs between nutrition professionals and consumers (* Chi-Square tests using Bonferroni adjustments—within group differences (z score ± 1.96)).
Sustainability 13 01478 g004
Table 1. Participant demographics and differences between Consumers and Nutrition Professionals.
Demographic VariableAll Participants Count (%)Nutrition Professionals Count (%)Consumers Count (%)p-Value
Gender (n)(n = 660)(n = 228)(n = 432)<0.05
Male184 (27.9)16 (7.0)168 (38.9) *
Female469 (71.1)209 (91.7)260 (60.2) *
Prefer not to answer4 (0.6)3 (1.3)1 (0.2)
Prefer to self-describe3 (0.5)0 (0.0)3 (0.7)
Age in years (n)(n = 660)(n = 228)(n = 432)<0.05
18–2462 (9.4)29 (12.7)33 (7.6) *
25–34145 (22.0)82 (36.0)63 (14.6) *
35–44116 (17.6)45 (19.7)71 (16.4)
45–54135 (20.5)35 (15.4)100 (23.2) *
55–64134 (20.3)27 (11.8)107 (24.8) *
≥6568 (10.3)10 (4.4)58 (13.4) *
Education Status (n)(n = 660)(n = 228)(n = 432)<0.05
High school to year 1017 (2.6)0 (0.0)17 (3.94) *
High school to year 11 or 1260 (9.1)6 (2.6)54 (12.5) *
Trade qualification13 (2.0)1 (0.4)12 (2.8) *
Certificate or Diploma98 (14.9)5 (2.2)93 (21.5) *
Bachelor’s Degree238 (36.1)87 (38.2)151 (35.0)
Post Graduate Degree230 (34.9)129 (56.6)101 (23.4) *
I’d prefer not to say4 (0.6)0 (0.0)4 (0.9)
Primary shopper (n)(n = 660)(n = 228)(n = 432)0.601
Participant537 (81.4)188 (82.5)349 (80.8)
Other123 (18.6)40 (17.5)83 (19.2)
Food Preparation Method (n)(n = 660)(n = 228)(n = 432)0.104
Home cooking644 (97.6)227 (99.6)417 (96.5) *
Takeway8 (1.2)0 (0.0)8 (1.9) *
Frozen Meals7 (1.1)1 (0.4)6 (1.4)
I’d prefer not to answer1 (0.2)0 (0.0)1 (0.2)
Chi-Square tests using Bonferroni adjustments p value < 0.05; * within group differences (z score ± 1.96).
Table 2. Diet type and reasons for diet among participant groups.
Demographic VariableAll Participants
Count (%)
Nutrition Professionals Count (%)Consumers
Count (%)
Diet (n)(n = 660)(n = 228)(n = 432)
No specific diet249 (37.7)126 (54.8)124 (28.7)
Vegan165 (25.0)16 (7.0)149 (34.5)
Flexitarian124 (18.9)58 (25.9)65 (15.1)
Vegetarian67 (10.2)13 (5.7)54 (12.5)
Other29 (4.4)9 (3.9)20 (4.6)
Gluten Free33 (5.0)14 (6.1)19 (4.4)
Pescatarian37 (5.6)9 (3.9)28 (6.5)
Reasons for diet (n)(n = 418)(n = 105)(n = 313)
Health276 (66.0)80 (76.2)196 (62.6)
Ethical272 (65.1)56 (53.3)216 (69.0)
Personal96 (23.0)16 (15.2)7 (2.2)
Other81 (19.4)21 (20.0)60 (19.2)
Religious11 (2.6)4 (3.8)7 (2.2)
Prefer not to answer3 (0.7)2 (1.9)1 (0.32)
Table 3. Perceptions of following a plant-based dietary pattern and differences between Nutrition Professionals and Consumers.
Count (%)
Strongly DisagreeDisagreeNeither Agree Nor DisagreeAgreeSTRONGLY AGREEI’m Not Surep-Value
Following a plant-based dietary pattern promotes good nutrition21 (3.3)22 (3.45)51 (8.0)180 (28.3)359 (56.4) 4 (0.6)
NP (n = 225)3 (1.3) *8 (3.6)20 (8.9)59 (26.2)135 (60.0) 0 (0.0)0.160
Consumer (n = 412)18 (4.4)14 (3.4)31 (7.5)121 (29.4)224 (54.4)4 (1.0)
Following a plant-based dietary pattern is environmentally friendly22 (3.5)12 (1.9)64 (10.1)176 (27.6)351 (55.1)12 (1.9)
NP (n = 225)4 (1.8)4 (1.8)26 (11.6)81 (36.0) *109 (48.4) *1 (0.4) *0.002
Consumer (n = 412)18 (4.4)8 (1.9)38 (9.2)95 (23.1)242 (58.7)11 (2.7)
Following a plant-based dietary pattern is high in dietary fibre14 (2.2)3 (0.5)28 (4.4)170 (26.7)412 (64.7)10 (1.6)
NP (n = 225)3 (1.3)0 (0.0)8 (3.6)47 (20.9) *167 (74.2) *0 (0.0) *0.003
Consumer (n = 412)11 (2.7)3 (0.7)20 (4.9)123 (29.9)245 (59.5)10 (2.4)
It is hard to meet protein requirements following a plant-based dietary pattern236 (37.1)234 (36.7)72 (11.3)61 (9.6)24 (3.8)10 (1.6)
NP (n = 225)63 (28.0) *104 (46.2) *29 (12.9)22 (9.8)7 (3.1)0 (0.0) *<0.001
Consumer (n = 412)173 (42.0)130 (31.6)43 (10.4)39 (9.5)17 (4.1)10 (2.4)
* Chi-Square tests using Bonferroni adjustments—within group differences (z score ± 1.96).
Table 4. Factors influencing the selection of plant-based meat alternatives and differences between Nutrition Professionals and Consumers.
Factor Influencing SelectionCount (%)
Not at All ImportantSlightly ImportantImportantFairly ImportantVery ImportantI’m Not Surep-Value
Suits my diet28 (6.0)28 (6.0)99 (21.3)66 (14.2)230 (49.5)14 (3.0)0.009
NP (n = 143)11 (7.7)7 (4.9)44 (30.8) *21 (14.7)55 (38.5) *5 (3.5)
Consumer (n = 322)17 (5.3)21 (6.5)55 (17.1)45 (14.0)175 (54.4)9 (2.8)
Price24 (5.2)56 (12.0)132 (28.4)119 (25.6)128 (27.5)6 (1.3)0.011
NP (n = 143)4 (2.8)7 (4.9) *40 (28.0)42 (29.4)48 (33.6)2 (1.4)
2Consumer (n = 322)20 (6.2)49 (15.2)92 (28.6)77 (23.9)80 (24.8)4 (1.2)
Ingredients21 (4.5)43 (9.3)107 (23.0)87 (18.7)199 (42.8)8 (1.7)0.002
NP (n = 143)4 (2.8)4 (2.8) *35 (24.5)21 (14.7)77 (53.9) *2 (1.4)
Consumer (n = 322)17 (5.3)39 (12.1)72 (22.4)66 (20.5)122 (37.9)6 (1.9)
Taste4 (0.9)5 (1.1)36 (7.7)72 (15.5)344 (74.0)4 (0.9)0.683
NP (n = 143)2 (1.4)1 (0.7)9 (6.3)19 (13.3)110 (76.9)2 (1.4)
Consumer (n = 322)2 (0.6)4 (1.2)27 (8.4)53 (16.5)234 (72.7)2 (0.6)
Texture7 (1.5)28 (6.0)61 (13.1)141 (30.3)224 (48.2)4 0.9)0.051
NP (n = 143)2 (1.4)7 (4.9)10 (7.0) *40 (28.0)82 (57.3) *2 (1.4)
Consumer (n = 322)5 (1.6)21 (6.5)51 (15.8)101 (31.4)142 (44.1)2 (0.6)
Brand227 (48.8)134 (28.8)50 (10.8)26 (5.6)17 (3.7)11 (2.4)0.021
NP (n = 143)55 (38.5) *54 (37.8) *20 (14.0)7 (4.9)5 (3.5)2 (1.4)
Consumer (n = 322)172 (53.4)80 (24.8)30 (9.3)19 (5.9)12 (3.7)9 (2.8)
Environmental concern29 (6.2)66 (14.2)93 (20.0)99 (21.3)171 (36.8)7 (1.5)0.001
NP (n = 143)10 (7.0)31 (21.7) *38 (26.6) *25 (17.5)37 (25.9) *2 (1.4)
Consumer (n = 322)19 (5.9)35 (10.9)55 (17.1)74 (23.0)134 (41.6)5 (1.6)
Ethical Concern36 (7.7)65 (14.0)69 (14.8)77 (16.6)209 (45.0)9 (1.9)<0.001
NP (n = 143)15 (10.5)37 (25.9) *27 (18.9)25 (17.5)37 (25.9) *2 (1.4)
Consumer (n = 322)21 (6.5)28 (8.7)42 (13.0)52 (16.2)172 (53.4)7 (2.2)
Convenience36 (7.7)86 (18.5)132 (28.4)137 (29.5)67 (14.4)7 (1.5)0.894
NP (n = 143)8 (5.6)29 (20.3)41 (28.7)43 (30.1)20 (14.0)2 (1.4)
Consumer (n = 322)28 (8.7)57 (17.7)91 (28.3)94 (29.3)47 (14.6)5 (1.6)
* Chi-Square tests using Bonferroni adjustments—within group differences (z score ± 1.96).
Table 5. Participant perceptions of plant-based meat alternatives and differences between nutrition professionals and consumers.
PBMA ClaimCount (%)
Strongly DisagreeDisagreeNeither Agree Nor DisagreeAgreeStrongly AgreeI’m Not Surep-Value
PBMA are more environmentally friendly than traditional meat24 (3.9)44 (7.1)128 (20.6)196 (31.6)176 (28.3)53 (8.5)<0.001
NP (n = 217)5 (2.3)27 (12.4) *69 (31.8) *74 (34.1)26 (12.0) *16 (7.4)
Consumer (n = 404)19 (4.7)17 (4.2)59 (14.6)122 (30.2)150 (37.1)37 (9.2)
PBMA are more nutritious than traditional meat29 (4.7)133 (21.4)252 (40.6)93 (15.0)55 (8.9)59 (9.5)<0.001
NP (n = 217)14 (6.5)82 (37.8) *98 (45.2)18 (8.3) *1 (0.5) *4 (1.8) *
Consumer (n = 404)15 (3.7)51 (12.6)154 (38.1)75 (18.6)54 (13.4)55 (13.6)
PBMA contain less energy than traditional meat39 (6.3)137 (22.1)227 (36.6)83 (13.4)20 (3.25)115 (18.5)<0.001
NP (n = 217)4 (1.8) *55 (25.4)92 (42.4) *42 (19.4) *4 (1.8)20 (9.2) *
Consumer (n = 404)35 (8.7)82 (20.3)135 (33.4)41 (10.2)16 (4.0)95 (23.5)
PBMA contain more protein than traditional meat22 (3.5)144 (23.2)285 (45.9)42 (6.8)17 (2.7)111 (17.9)<0.001
NP (n = 217)9 (4.2)84 (38.7) *94 (43.3)4 (1.8) *2 (0.9)24 (11.1) *
Consumer (n = 404)13 (3.2)60 (14.9)191 (47.3)38 (9.4)15 (3.7)87 (21.5)
PBMA contains more salt than traditional meat5 (0.8)41 (6.6)176 (28.3)223 (35.9)74 (11.9)102 (17.9)<0.001
NP (n = 217)1 (0.5)13 (6.0)45 (20.7) *105 (48.4) * 34 (15.7)19 (8.8) *
Consumer (n = 404)4 (1.0)28 (6.9)131 (32.4)118 (29.2)40 (9.9)83 (20.5)
PBMA should contain iron to match traditional meat17 (2.7)55 (8.9)150 (24.2)239 (38.5)123 (19.8)37 (6.0)<0.001
NP (n = 217)5 (2.3)20 (9.2)37 (17.1) *89 (41.0)62 (28.6) *4 (1.8)
Consumer (n = 404)12 (2.5)35 (8.7)113 (28.0)150 (37.1)61 (15.1)33 (8.2)
PBMA should contain vitamin B12 to match traditional meat13 (2.1)48 (7.7)125 (20.1)265 (42.7)138 (22.2)32 (5.2)<0.001
NP (n = 217)3 (1.4)21 (9.7)28 (12.9) *99 (45.6)62 (28.6) *4 (1.8)
Consumer (n = 404)10 (2.5)27 (6.7)97 (24.0)166 (41.1)76 (18.8)28 (6.9)
* Chi-Square tests using Bonferroni adjustments—within group differences (z score ± 1.96).
Publisher’s Note: MDPI stays neutral with regard to jurisdictional claims in published maps and institutional affiliations.

