Sustainability Indicator Selection by a Novel Triangular Intuitionistic Fuzzy Decision-Making Approach in Highway Construction Projects


Abstract
:1. Introduction
2. Materials and Methods
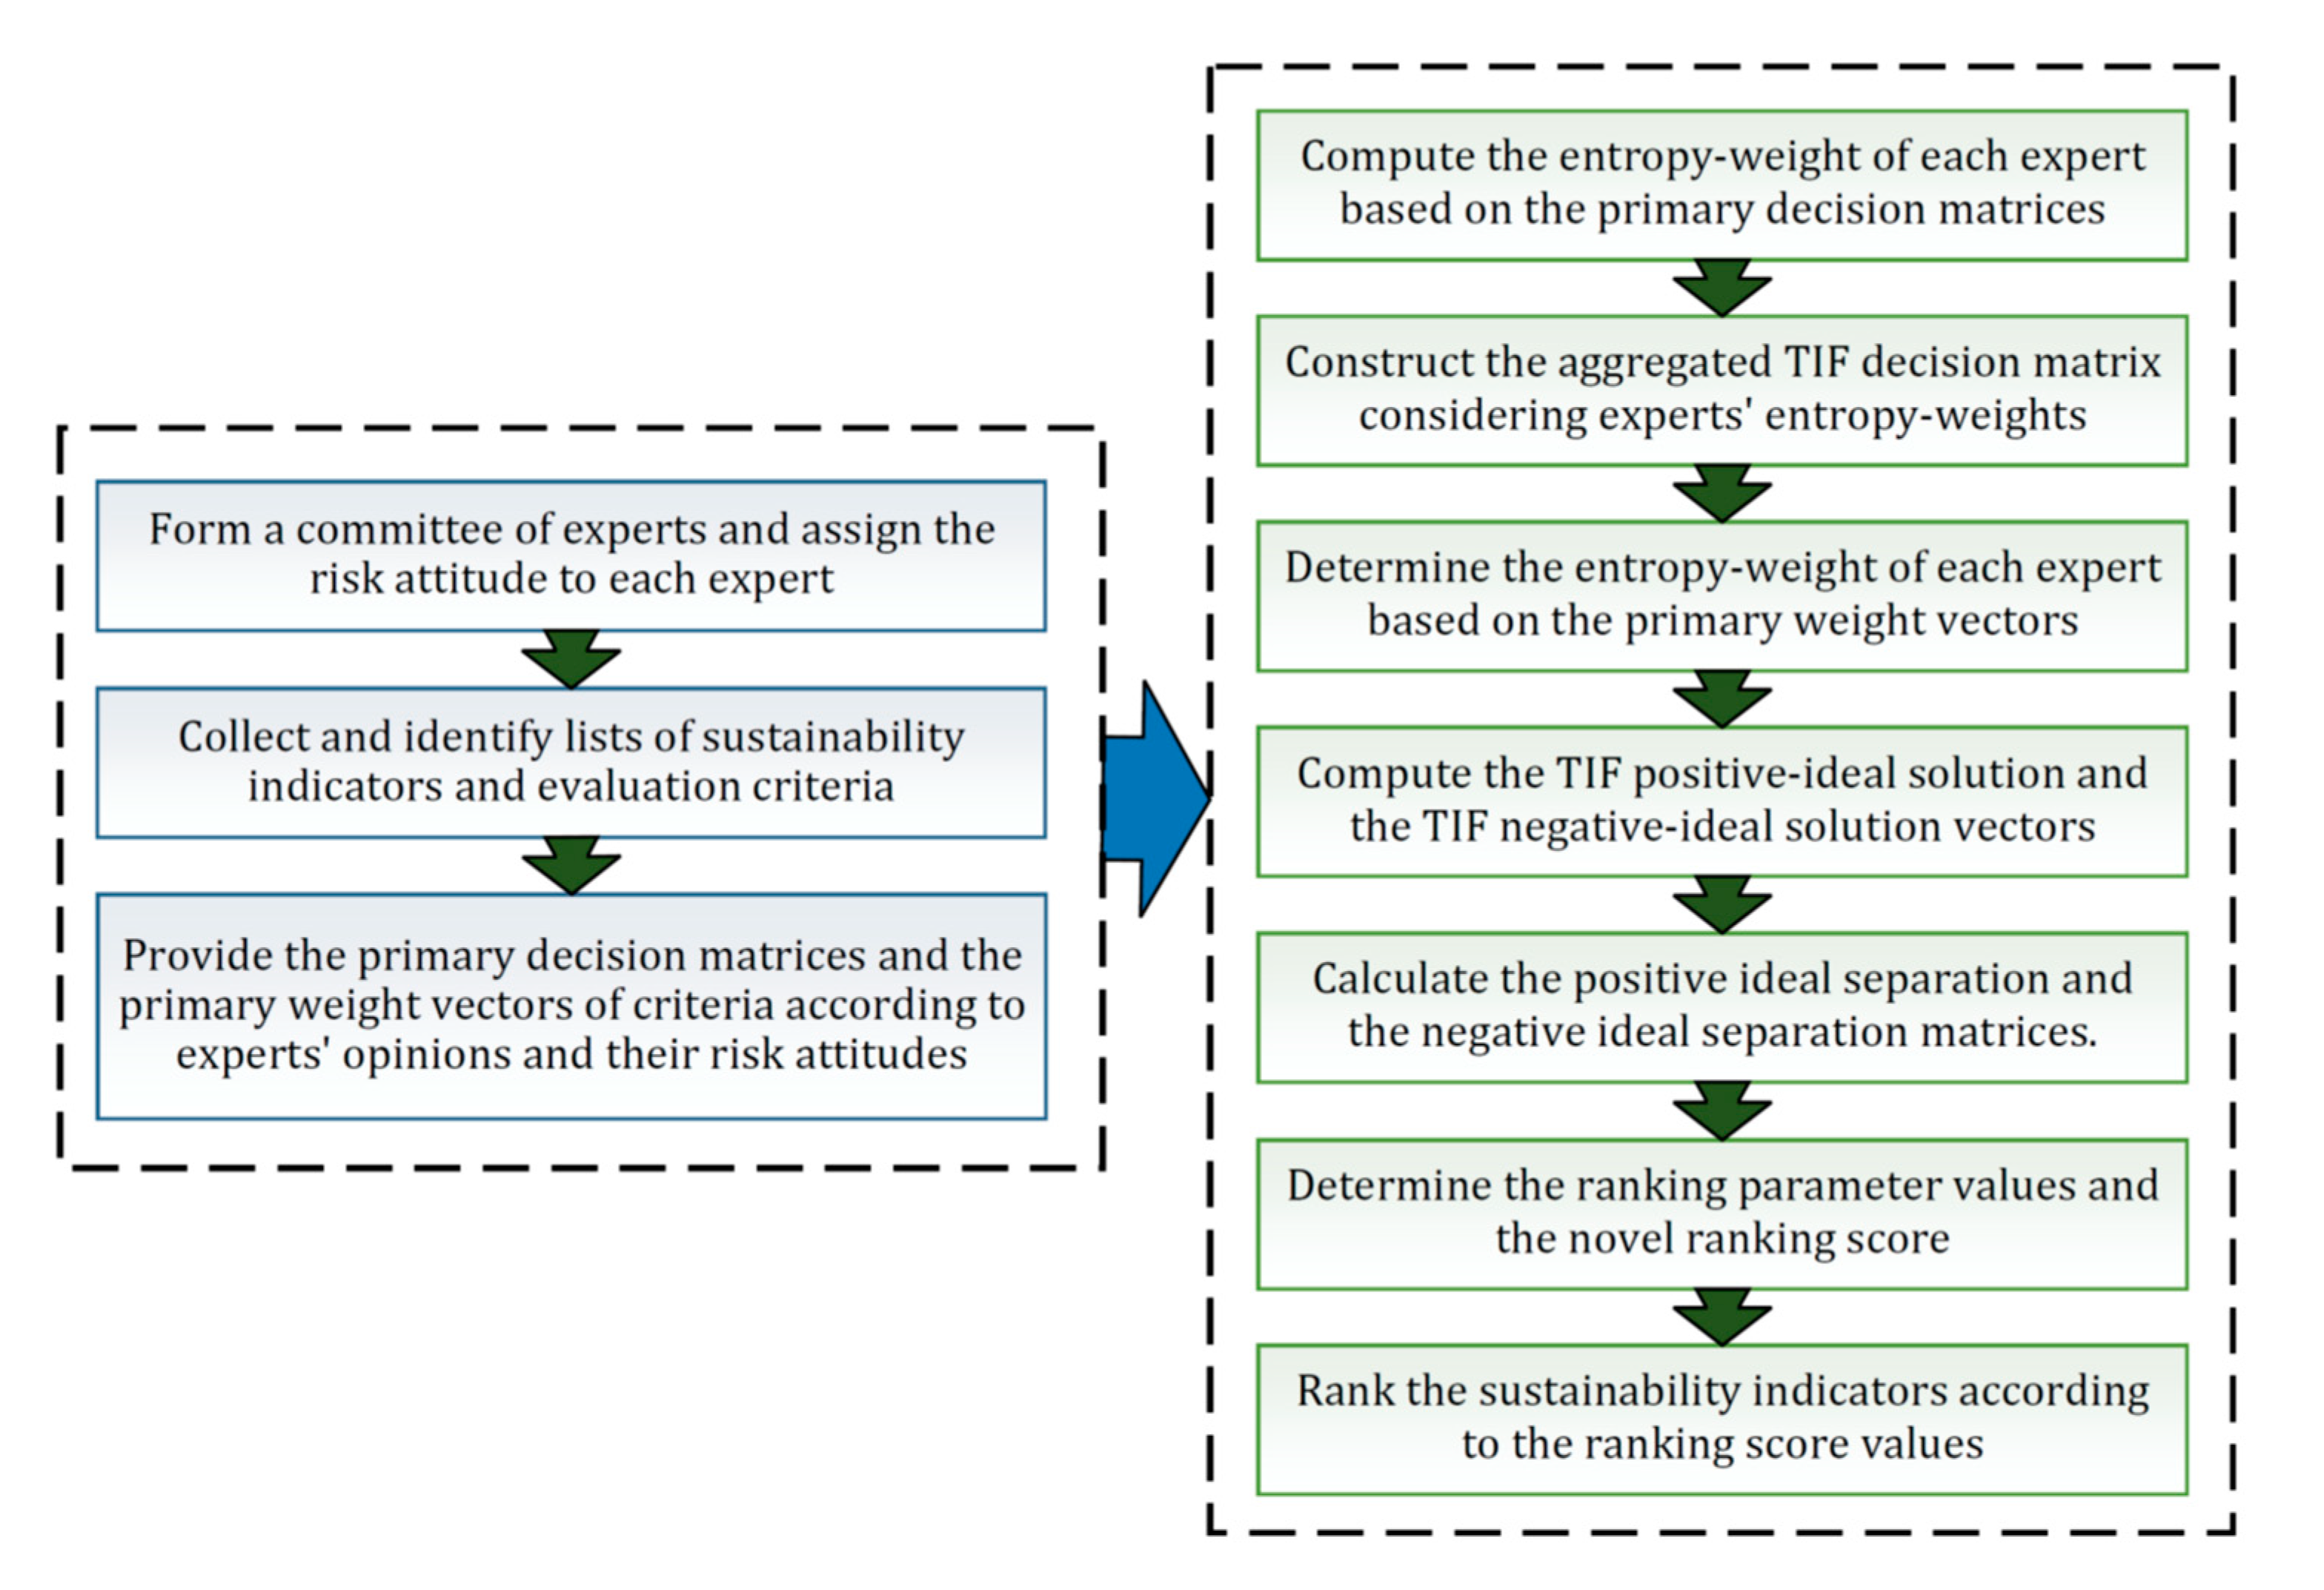
2.1. TIF Group Decision-Making Approach
- Step 1. Constitute a group of experts , whose views and judgments will be employed to build and assess the problem.
- Step 2. Gather a list of indicators that are possible to be applied for the sustainability evaluation of highway construction projects ().
- Step 3. Recognize a set of criteria for analyzing SIs through consensus of experts’ views ().
- Step 4. Assign the risk attitude to each expert and incorporate it into the related triangular intuitionistic fuzzy numbers (TIFNs) (Definition A1).
- Step 5. Construct the primary decision matrices based on the experts’ views.
- Step 6. Convert the primary decision matrices to the individual decision matrices based on each expert’s risk attitude.
- Step 7. Compute each expert’s entropy-weight according to the individual decision matrices.
- Step 8. Build the aggregated TIF decision matrix taking into account the entropy-weights of experts.
- Step 9. Construct the primary weight vectors of criteria based on experts’ views.
- Step 10. Convert the primary weight vectors to the individual weight vectors based on each expert’s risk attitude.
- Step 11. Compute each expert’s entropy-weight according to the weight vectors.
- Step 12. Provide the TIF weight vector of the criteria.
- Step 13. Compute the TIF positive-ideal solution (PIS) and the TIF negative-ideal solution (NIS) vectors.
- Step 14. Determine the positive-ideal separation (PISE) and the negative-ideal separation (NISE) matrices.
- Step 15. Compute the ,, , and values.
- Step 16. Calculate the and values.
- Step 17. Compute the novel ranking score.
- Step 18. Rank the SIs according to the ranking score values).
2.2. Case Study
3. Results
4. Discussion
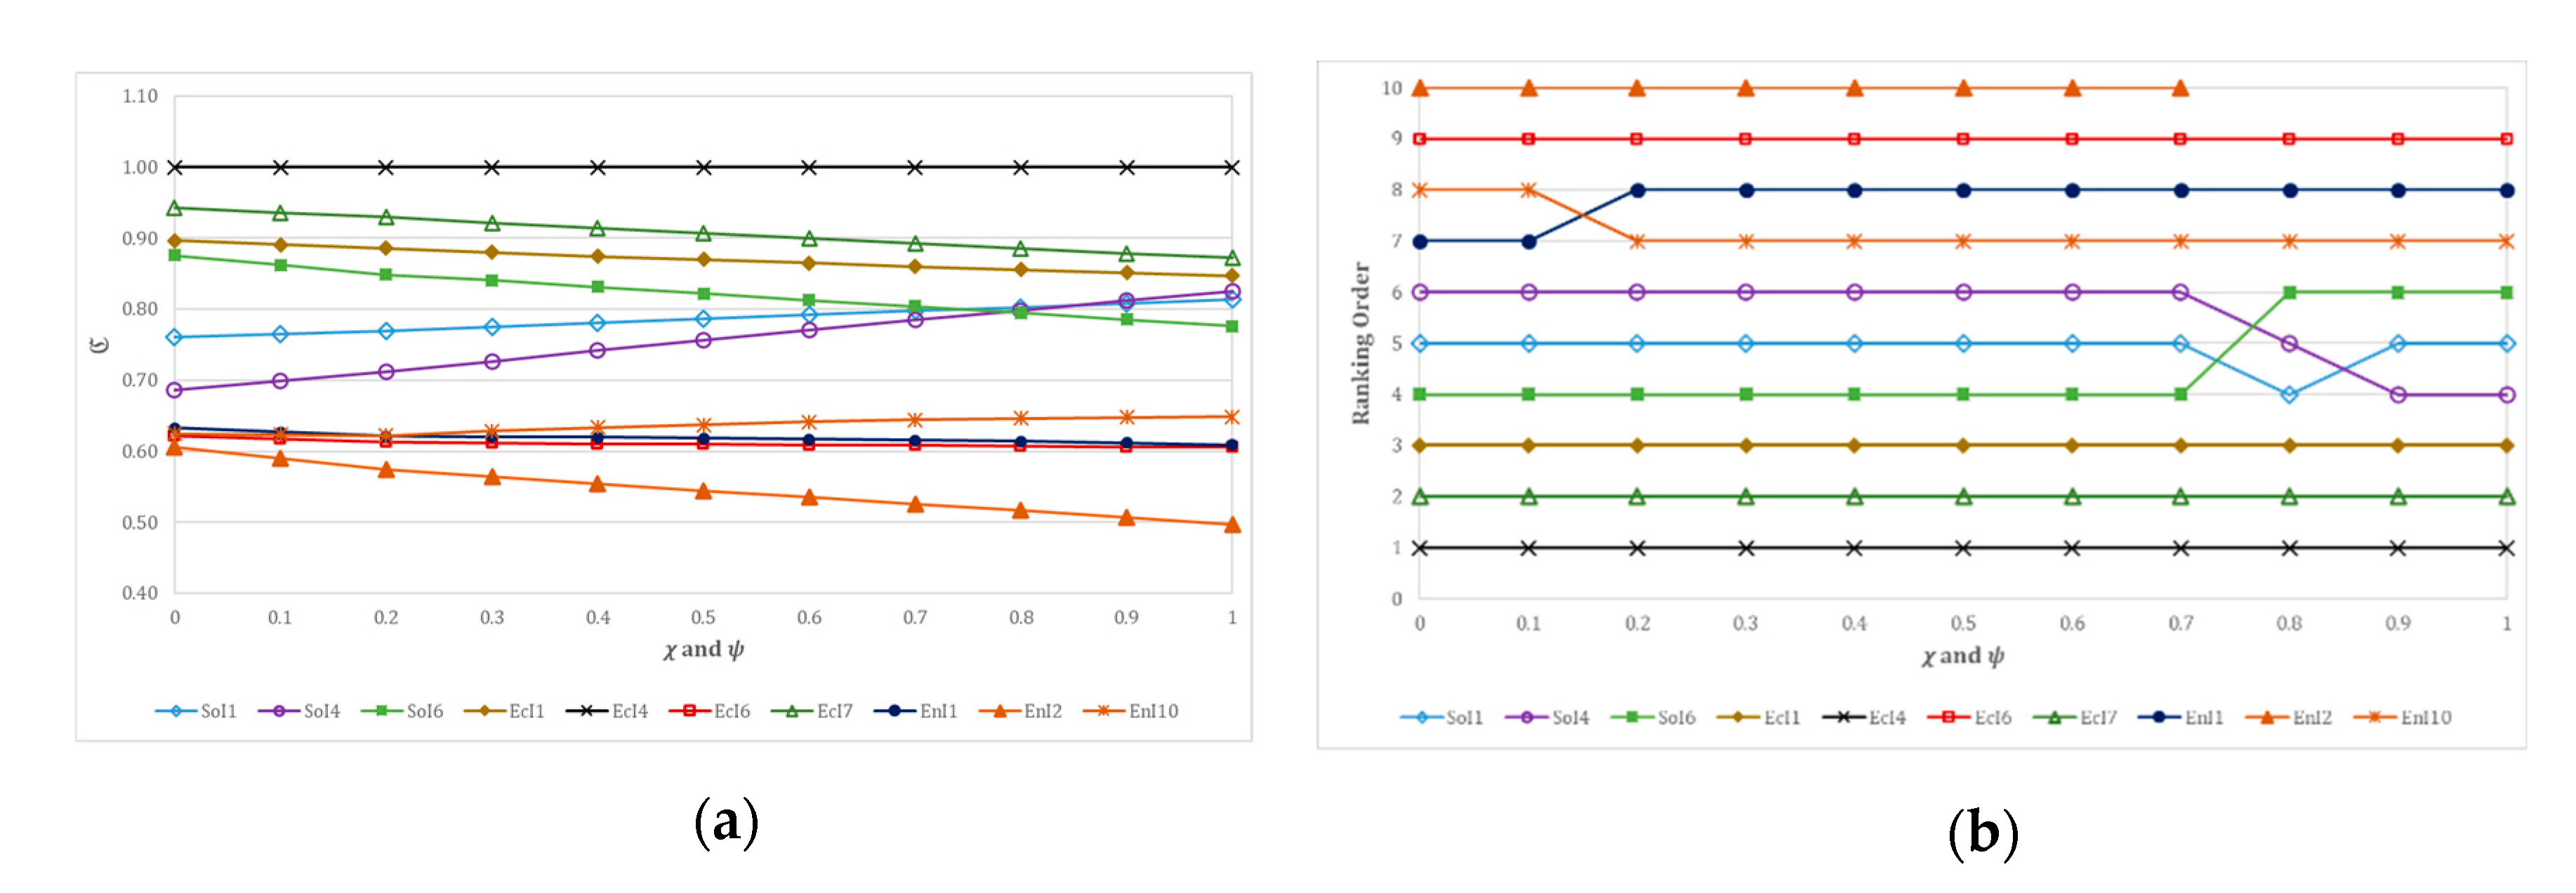
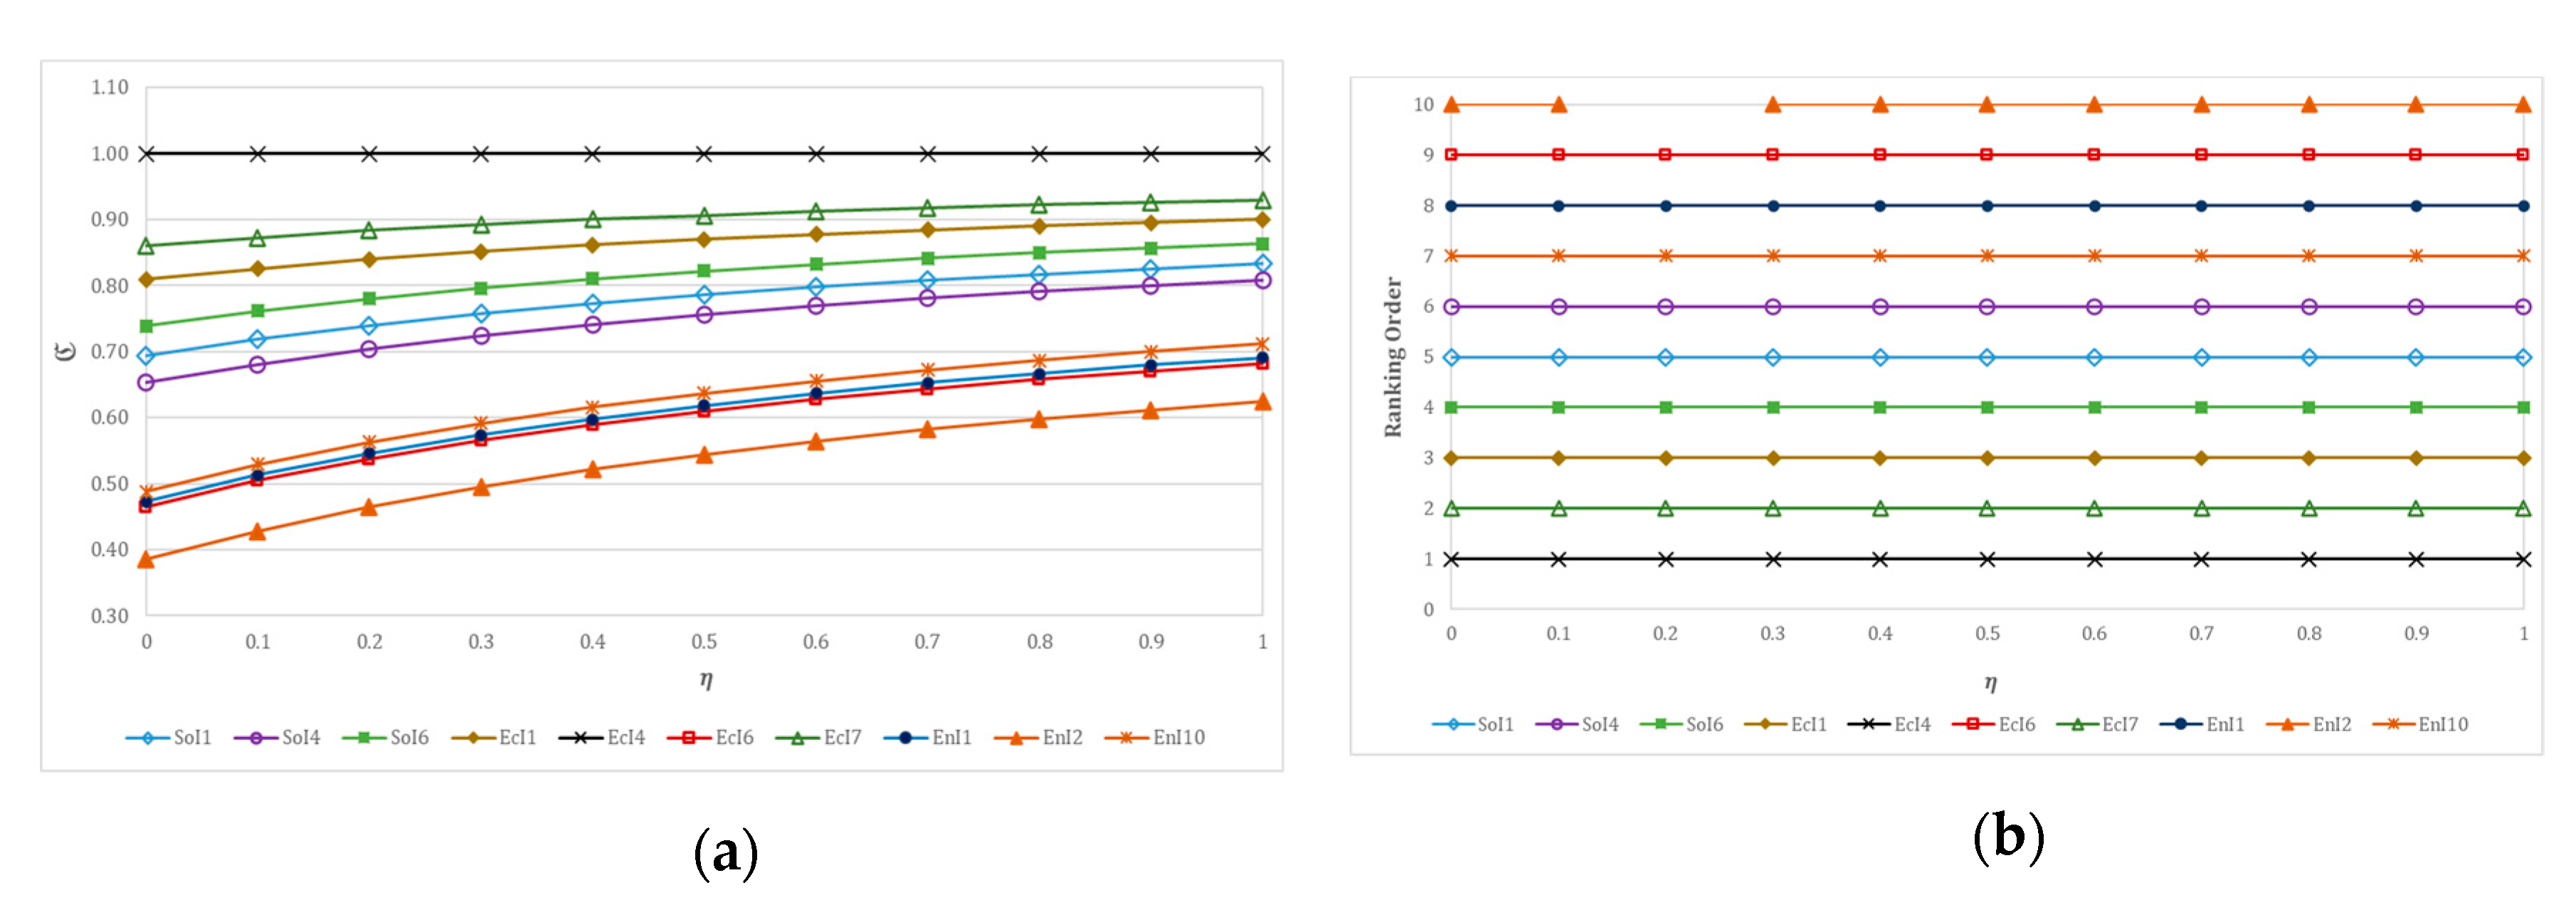
4.1. Sensitivity Analysis
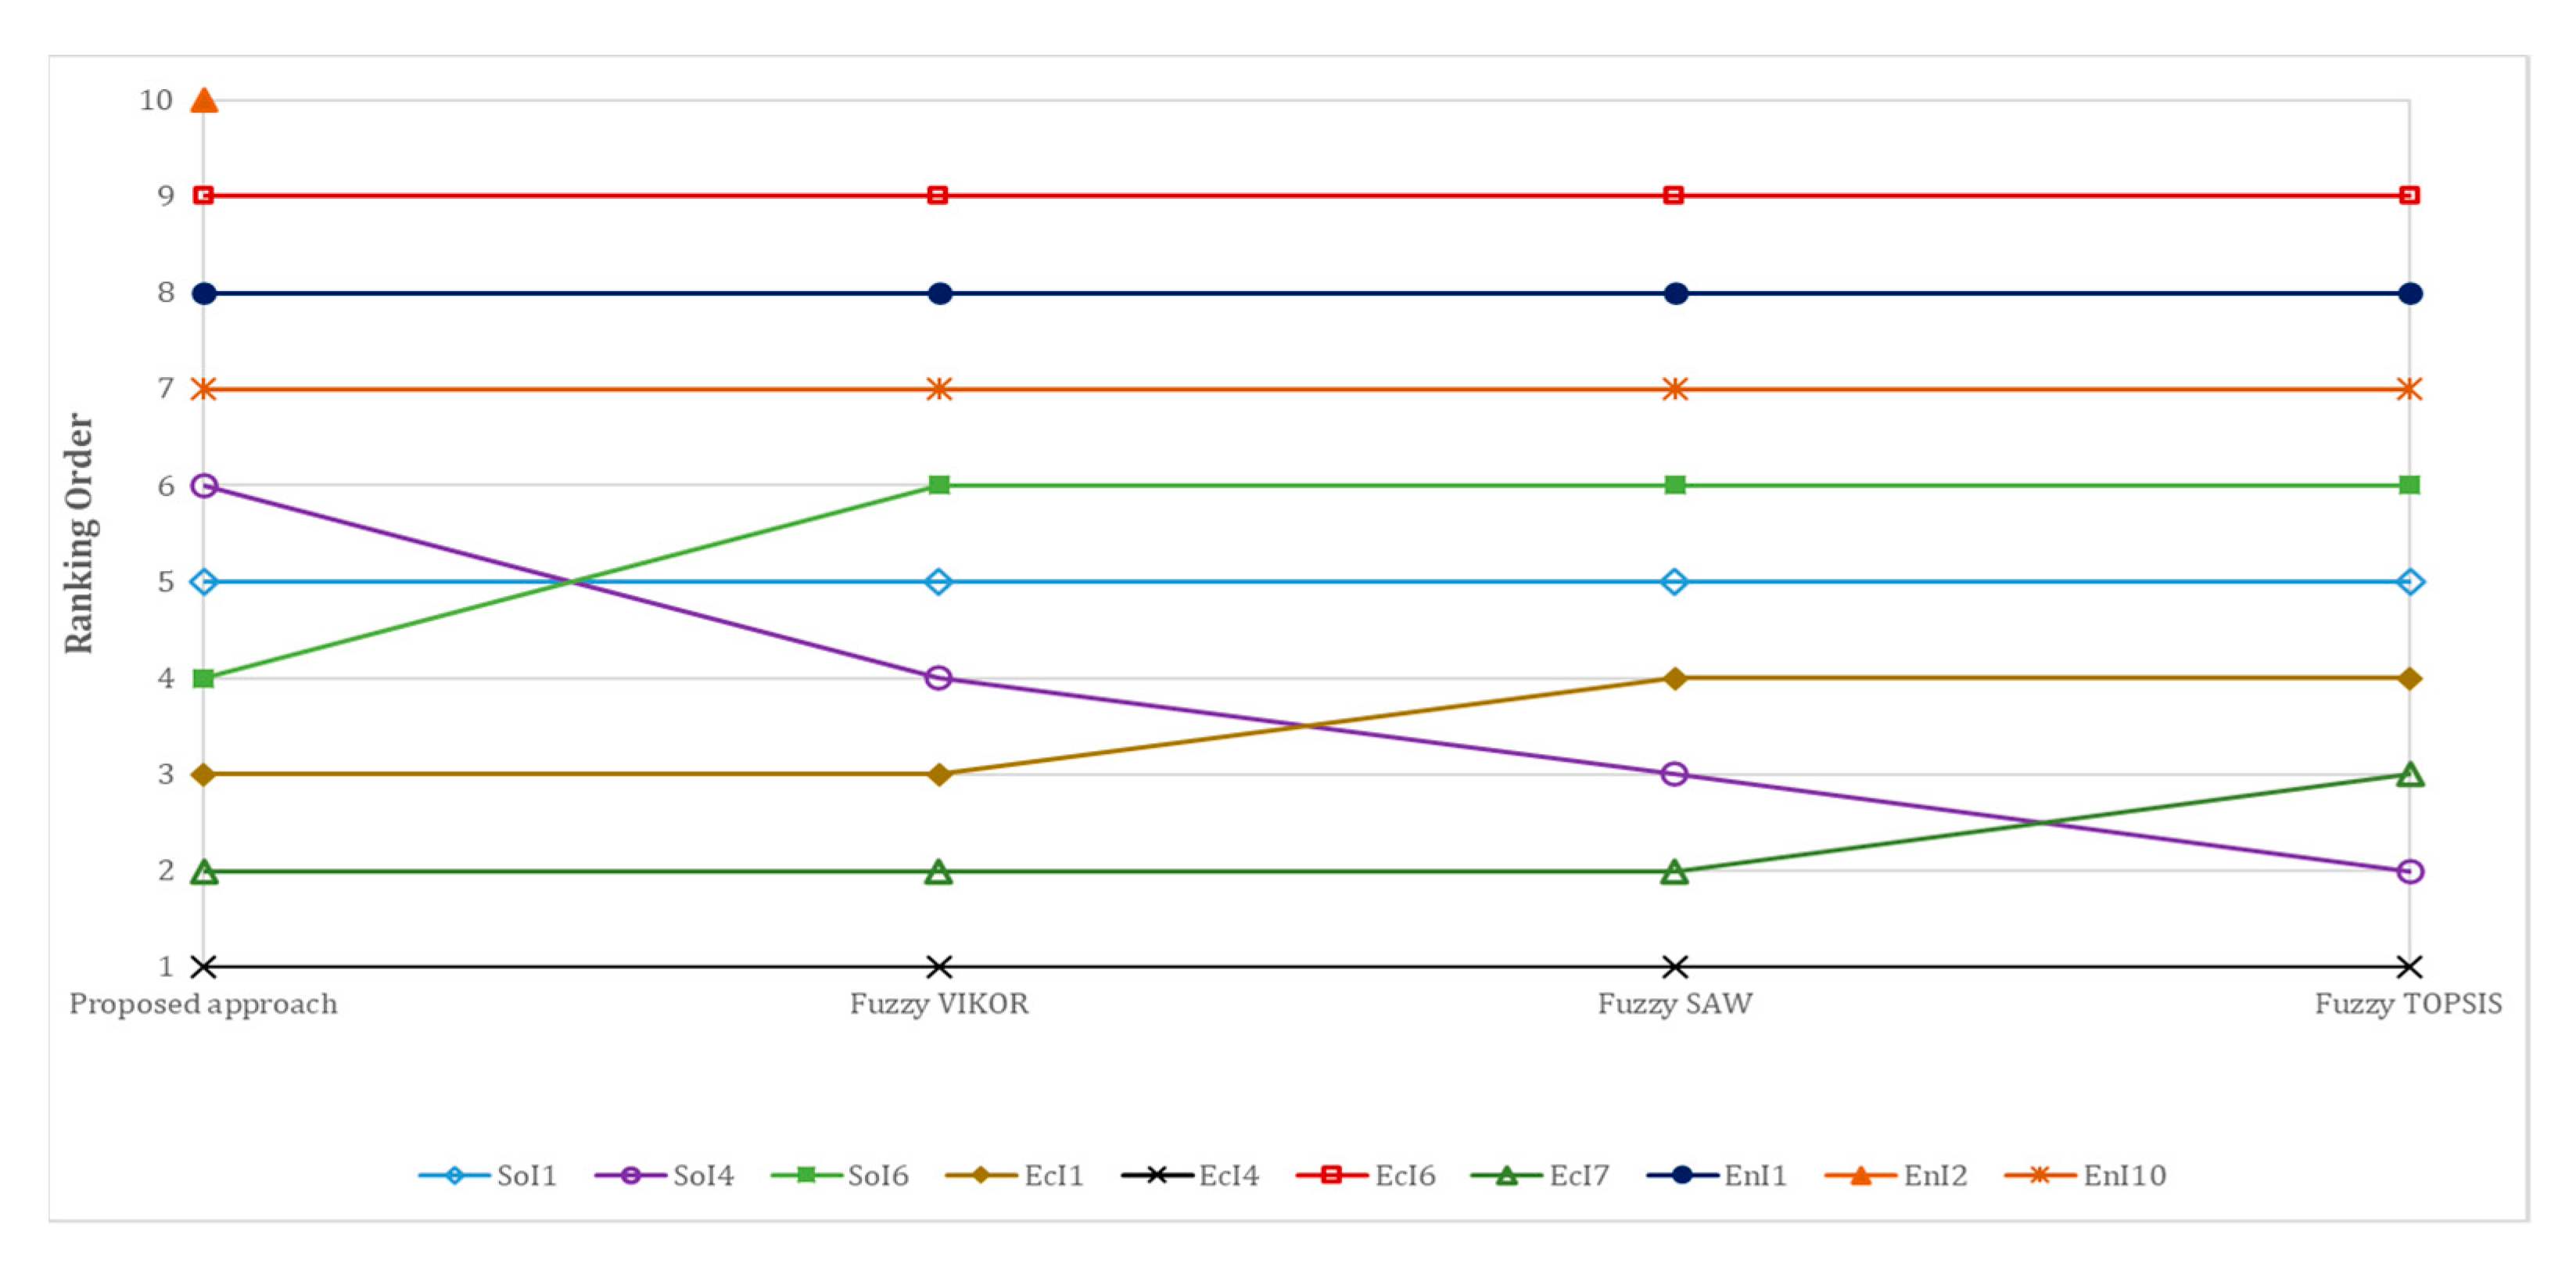
4.2. Comparison between the Proposed Approach and Other Cited Literature
5. Concluding Remarks
- To cope with uncertainty in highway construction projects, triangular intuitionistic fuzzy sets (TIFSs) are used. The TIFSs make the process of decision-making more flexible regarding degrees of agreement, disagreement, and hesitancy utilizing a triangular function.
- Risk attitudes of experts are considered within the assessment and process of group decision-making because they can have various perspectives, such as optimistic or pessimistic, in their views owing to their various backgrounds and characteristics.
- A novel methodology is proposed to specify experts’ weights within the process of group decision-making based on the concepts of entropy.
- A new compromise ranking score is proposed to evaluate and choose sustainability indicators in highway construction projects.
Author Contributions
Funding
Conflicts of Interest
Appendix A
References
- WCED. Our Common Future-Brundtland Report; Oxford University Press: Oxford, UK, 1987. [Google Scholar]
- Shen, L.Y.; Li Hao, J.; Tam, V.W.Y.; Yao, H. A checklist for assessing sustainability performance of construction projects. J. Civ. Eng. Manag. 2007, 13, 273–281. [Google Scholar] [CrossRef]
- Yu, W.D.; Cheng, S.T.; Ho, W.C.; Chang, Y.H. Measuring the sustainability of construction projects throughout their lifecycle: A Taiwan lesson. Sustainability 2018, 10, 1523. [Google Scholar] [CrossRef] [Green Version]
- Goubran, S.; Cucuzzella, C. Integrating the sustainable development goals in building projects. J. Sustain. Res. 2019, 1, e190010. [Google Scholar] [CrossRef] [Green Version]
- Karaca, F.; Guney, M.; Kumisbek, A.; Kaskina, D.; Tokbolat, S. A new stakeholder opinion-based rapid sustainability assessment method (RSAM) for existing residential buildings. Sustain. Cities Soc. 2020, 60, 102155. [Google Scholar] [CrossRef]
- Li, H.; Zhang, X.; Ng, S.T.; Skitmore, M. Quantifying stakeholder influence in decision/evaluations relating to sustainable construction in China—A Delphi approach. J. Clean. Prod. 2018, 173, 160–170. [Google Scholar] [CrossRef] [Green Version]
- Omer, M.A.; Noguchi, T. A conceptual framework for understanding the contribution of building materials in the achievement of Sustainable Development Goals (SDGs). Sustain. Cities Soc. 2020, 52, 101869. [Google Scholar] [CrossRef]
- Xu, X.; Wang, Y.; Tao, L. Comprehensive evaluation of sustainable development of regional construction industry in China. J. Clean. Prod. 2019, 211, 1078–1087. [Google Scholar] [CrossRef]
- Illankoon, I.C.S.; Tam, V.W.; Le, K.N. United Nation’s sustainable development goals: Establishing baseline for Australian building sector. Intell. Build. Int. 2020. [Google Scholar] [CrossRef]
- Olawumi, T.O.; Chan, D.W.; Chan, A.P.; Wong, J.K. Development of a building sustainability assessment method (BSAM) for developing countries in sub-Saharan Africa. J. Clean. Prod. 2020, 263, 121514. [Google Scholar] [CrossRef]
- Mansell, P.; Philbin, S.P.; Broyd, T.; Nicholson, I. Assessing the impact of infrastructure projects on global sustainable development goals. Proc. Inst. Civ. Eng. Eng. Sustain. 2020, 173, 196–212. [Google Scholar] [CrossRef]
- Mousavi, S.M.; Tavakkoli-Moghaddam, R.; Azaron, A.; Mojtahedi, S.M.H.; Hashemi, H. Risk assessment for highway projects using jackknife technique. Expert Syst. Appl. 2011, 38, 5514–5524. [Google Scholar] [CrossRef]
- Ghoddousi, P.; Nasirzadeh, F.; Hashemi, H. Evaluating Highway Construction Projects’ Sustainability Using a Multicriteria Group Decision-Making Model Based on Bootstrap Simulation. J. Constr. Eng. Manag. 2018, 144, 04018092. [Google Scholar] [CrossRef]
- Hendiani, S.; Bagherpour, M. Developing an integrated index to assess social sustainability in construction industry using fuzzy logic. J. Clean. Prod. 2019, 230, 647–662. [Google Scholar] [CrossRef]
- Rostamnezhad, M.; Nasirzadeh, F.; Khanzadi, M.; Jarban, M.J.; Ghayoumian, M. Modeling social sustainability in construction projects by integrating system dynamics and fuzzy-DEMATEL method: A case study of highway project. Eng. Constr. Archit. Manag. 2020, 27, 1595–1618. [Google Scholar] [CrossRef]
- Hashemi, H.; Mousavi, S.M.; Zavadskas, E.K.; Chalekaee, A.; Turskis, Z. A new group decision model based on grey-intuitionistic fuzzy-ELECTRE and VIKOR for contractor assessment problem. Sustainability 2018, 10, 1635. [Google Scholar] [CrossRef] [Green Version]
- Mousavi, S.M.; Antuchevičienė, J.; Zavadskas, E.K.; Vahdani, B.; Hashemi, H. A new decision model for cross-docking center location in logistics networks under interval-valued intuitionistic fuzzy uncertainty. Transport 2019, 34, 30–40. [Google Scholar] [CrossRef] [Green Version]
- Stojčić, M.; Zavadskas, E.K.; Pamučar, D.; Stević, Ž.; Mardani, A. Application of MCDM methods in sustainability engineering: A literature review 2008–2018. Symmetry 2019, 11, 350. [Google Scholar] [CrossRef] [Green Version]
- Zavadskas, E.K.; Antucheviciene, J.; Kar, S. Multi-Objective and Multi-Attribute Optimization for Sustainable Development Decision Aiding. Sustainability 2019, 11, 3069. [Google Scholar] [CrossRef] [Green Version]
- Hashemi, H.; Bazargan, J.; Mousavi, S.M.; Vahdani, B. An extended compromise ratio model with an application to reservoir flood control operation under an interval-valued intuitionistic fuzzy environment. Appl. Math. Model. 2014, 38, 3495–3511. [Google Scholar] [CrossRef]
- Huang, R.Y.; Yeh, C.H. Development of an assessment framework for green highway construction. J. Chin. Inst. Eng. 2008, 31, 573–585. [Google Scholar] [CrossRef]
- Chen, Y.; Okudan, G.E.; Riley, D.R. Sustainable performance criteria for construction method selection in concrete buildings. Autom. Constr. 2010, 19, 235–244. [Google Scholar] [CrossRef]
- Reza, B.; Sadiq, R.; Hewage, K. Sustainability assessment of flooring systems in the city of Tehran: An AHP-based life cycle analysis. Constr. Build. Mater. 2011, 25, 2053–2066. [Google Scholar] [CrossRef]
- Waris, M.; Liew, M.S.; Khamidi, M.F.; Idrus, A. Criteria for the selection of sustainable onsite construction equipment. Int. J. Sustain. Built Environ. 2014, 3, 96–110. [Google Scholar] [CrossRef] [Green Version]
- Li, Y.; Zhao, L.; Suo, J. Comprehensive assessment on sustainable development of highway transportation capacity based on entropy weight and TOPSIS. Sustainability 2014, 6, 4685–4693. [Google Scholar] [CrossRef] [Green Version]
- Kucukvar, M.; Gumus, S.; Egilmez, G.; Tatari, O. Ranking the sustainability performance of pavements: An intuitionistic fuzzy decision making method. Autom. Constr. 2014, 40, 33–43. [Google Scholar] [CrossRef]
- Medineckiene, M.; Zavadskas, E.K.; Björk, F.; Turskis, Z. Multi-criteria decision-making system for sustainable building assessment/certification. Arch. Civ. Mech. Eng. 2015, 15, 11–18. [Google Scholar] [CrossRef]
- Kamali, M.; Hewage, K. Development of performance criteria for sustainability evaluation of modular versus conventional construction methods. J. Clean. Prod. 2017, 142, 3592–3606. [Google Scholar] [CrossRef]
- Pan, M.; Linner, T.; Pan, W.; Cheng, H.; Bock, T. A framework of indicators for assessing construction automation and robotics in the sustainability context. J. Clean. Prod. 2018, 182, 82–95. [Google Scholar] [CrossRef] [Green Version]
- Zolfani, S.H.; Pourhossein, M.; Yazdani, M.; Zavadskas, E.K. Evaluating construction projects of hotels based on environmental sustainability with MCDM framework. Alex. Eng. J. 2018, 57, 357–365. [Google Scholar] [CrossRef]
- Liu, S.; Qian, S. Towards sustainability-oriented decision making: Model development and its validation via a comparative case study on building construction methods. Sustain. Dev. 2019, 27, 860–872. [Google Scholar] [CrossRef]
- Reddy, A.S.; Kumar, P.R.; Raj, P.A. Preference based multi-criteria framework for developing a Sustainable Material Performance Index (SMPI). Int. J. Sustain. Eng. 2019, 12, 390–403. [Google Scholar] [CrossRef]
- Chen, C.H. A new multi-criteria assessment model combining GRA techniques with intuitionistic fuzzy entropy-based TOPSIS method for sustainable building materials supplier selection. Sustainability 2019, 11, 2265. [Google Scholar] [CrossRef] [Green Version]
- Roy, J.; Das, S.; Kar, S.; Pamučar, D.; Roy, J.; Das, S.; Kar, S.; Pamučar, D. An extension of the CODAS approach using interval-valued intuitionistic fuzzy set for sustainable material selection in construction projects with incomplete weight information. Symmetry 2019, 11, 393. [Google Scholar] [CrossRef] [Green Version]
- Tseng, M.L.; Lin, S.; Chen, C.C.; Sarmiento, L.S.C.; Tan, C.L. A causal sustainable product-service system using hierarchical structure with linguistic preferences in the Ecuadorian construction industry. J. Clean. Prod. 2019, 230, 477–487. [Google Scholar] [CrossRef]
- Alawneh, R.; Ghazali, F.; Ali, H.; Sadullah, A.F. A novel framework for integrating United Nations Sustainable Development Goals into sustainable non-residential building assessment and management in Jordan. Sustain. Cities Soc. 2019, 49, 101612. [Google Scholar] [CrossRef]
- Dabous, S.A.; Zeiada, W.; Zayed, T.; Al-Ruzouq, R. Sustainability-informed multi-criteria decision support framework for ranking and prioritization of pavement sections. J. Clean. Prod. 2020, 244, 118755. [Google Scholar] [CrossRef]
- Rahimi, S.; Hafezalkotob, A.; Monavari, S.M.; Hafezalkotob, A.; Rahimi, R. Sustainable landfill site selection for municipal solid waste based on a hybrid decision-making approach: Fuzzy group BWM-MULTIMOORA-GIS. J. Clean. Prod. 2020, 248, 119186. [Google Scholar] [CrossRef]
- Navarro, I.J.; Yepes, V.; Martí, J.V. Sustainability assessment of concrete bridge deck designs in coastal environments using neutrosophic criteria weights. Struct. Infrastruct. Eng. 2020, 16, 949–967. [Google Scholar] [CrossRef]
- Ebrahimnejad, S.; Mousavi, S.M.; Tavakkoli-Moghaddam, R.; Hashemi, H.; Vahdani, B. A novel two-phase group decision making approach for construction project selection in a fuzzy environment. Appl. Math. Model. 2012, 36, 4197–4217. [Google Scholar] [CrossRef]
- Fenton, N.; Wang, W. Risk and confidence analysis for fuzzy multicriteria decision making. Knowl. Based Syst. 2006, 19, 430–437. [Google Scholar] [CrossRef] [Green Version]
- Zhang, X.; Jin, F.; Liu, P. A grey relational projection method for multi-attribute decision making based on intuitionistic trapezoidal fuzzy number. Appl. Math. Model. 2013, 37, 3467–3477. [Google Scholar] [CrossRef]
- Zhou, H.C.; Zhang, G.H.; Wang, G.L. Multi-objective decision making approach based on entropy weights for reservoir flood control operation. J. Hydraul. Eng. 2007, 38, 100–106. [Google Scholar]
- Chen, Y.; Li, B. Dynamic multi-attribute decision making model based on triangular intuitionistic fuzzy numbers. Sci. Iran. 2011, 18, 268–274. [Google Scholar] [CrossRef] [Green Version]
- Wan, S.P.; Wang, F.; Lin, L.L.; Dong, J.Y. Some new generalized aggregation operators for triangular intuitionistic fuzzy numbers and application to multi-attribute group decision making. Comput. Ind. Eng. 2016, 93, 286–301. [Google Scholar] [CrossRef]
- Wang, J.Q.; Nie, R.; Zhang, H.Y.; Chen, X.H. New operators on triangular intuitionistic fuzzy numbers and their applications in system fault analysis. Inf. Sci. 2013, 251, 79–95. [Google Scholar] [CrossRef]
- Awasthi, A.; Chauhan, S.S.; Omrani, H. Application of fuzzy TOPSIS in evaluating sustainable transportation systems. Expert Syst. Appl. 2011, 38, 12270–12280. [Google Scholar] [CrossRef]
- Diabat, A.; Kannan, D.; Mathiyazhagan, K. Analysis of enablers for implementation of sustainable supply chain management—A textile case. J. Clean. Prod. 2014, 83, 391–403. [Google Scholar] [CrossRef]
- Govindan, K.; Shankar, K.M.; Kannan, D. Sustainable material selection for construction industry—A hybrid multi criteria decision making approach. Renew. Sustain. Energy Rev. 2016, 55, 1274–1288. [Google Scholar] [CrossRef]
- Kandziora, M.; Burkhard, B.; Müller, F. Interactions of ecosystem properties, ecosystem integrity and ecosystem service indicators—A theoretical matrix exercise. Ecol. Indic. 2013, 28, 54–78. [Google Scholar] [CrossRef]
- Michael, F.L.; Noor, Z.Z.; Figueroa, M.J. Review of urban sustainability indicators assessment—Case study between Asian countries. Habitat Int. 2014, 44, 491–500. [Google Scholar] [CrossRef]
- Nasirzadeh, F.; Ghayoumian, M.; Khanzadi, M.; Rostamnezhad Cherati, M. Modelling the social dimension of sustainable development using fuzzy cognitive maps. Int. J. Constr. Manag. 2020, 20, 223–236. [Google Scholar] [CrossRef]
- Niemeijer, D.; de Groot, R.S. A conceptual framework for selecting environmental indicator sets. Ecol. Indic. 2008, 8, 14–25. [Google Scholar] [CrossRef]
- Oltean-Dumbrava, C.; Watts, G.; Miah, A. Transport infrastructure: Making more sustainable decisions for noise reduction. J. Clean. Prod. 2013, 42, 58–68. [Google Scholar] [CrossRef] [Green Version]
- Roy, R.; Chan, N.W. An assessment of agricultural sustainability indicators in Bangladesh: Review and synthesis. Environmentalist 2012, 32, 99–110. [Google Scholar] [CrossRef]
- Shen, L.Y.; Tam, V.W.; Tam, L.; Ji, Y.B. Project feasibility study: The key to successful implementation of sustainable and socially responsible construction management practice. J. Clean. Prod. 2010, 18, 254–259. [Google Scholar] [CrossRef]
- Shen, L.; Wu, Y.; Zhang, X. Key assessment indicators for the sustainability of infrastructure projects. J. Constr. Eng. Manag. 2010, 137, 441–451. [Google Scholar] [CrossRef] [Green Version]
- Ugwu, O.O.; Haupt, T.C. Key performance indicators and assessment methods for infrastructure sustainability—A South African construction industry perspective. Build. Environ. 2007, 42, 665–680. [Google Scholar] [CrossRef]
- Yao, H.; Shen, L.; Tan, Y.; Hao, J. Simulating the impacts of policy scenarios on the sustainability performance of infrastructure projects. Autom. Constr. 2011, 20, 1060–1069. [Google Scholar] [CrossRef]
- Yuan, H. Key indicators for assessing the effectiveness of waste management in construction projects. Ecol. Indic. 2013, 24, 476–484. [Google Scholar] [CrossRef]
- Zhao, Z.Y.; Zhao, X.J.; Davidson, K.; Zuo, J. A corporate social responsibility indicator system for construction enterprises. J. Clean. Prod. 2012, 29, 277–289. [Google Scholar] [CrossRef]
- CEEQUAL Version 6: Technical Manual—International Projects. Watford, UK. Available online: https://www.ceequal.com/version-6/ (accessed on 30 September 2019).
- Reid, L.; Bevan, T.; Davis, A.; Neuman, T.; Penney, K.; Seskin, S.; VanZerr, M.; Anderson, J.; Muench, S.; Weiland, C.; et al. Invest v1.3: Sustainable Highways Self-Evaluation Tool. Available online: https://www.sustainablehighways.org/files/4735.pdf (accessed on 12 February 2019).
- Envision v3: Sustainable Infrastructure Framework Manual. Available online: https://sustainableinfrastructure.org/envision-version-3/ (accessed on 18 February 2019).
- Opricovic, S. Fuzzy VIKOR with an application to water resources planning. Expert Syst. Appl. 2011, 38, 12983–12990. [Google Scholar] [CrossRef]
- Chou, S.Y.; Chang, Y.H.; Shen, C.Y. A fuzzy simple additive weighting system under group decision-making for facility location selection with objective/subjective attributes. Eur. J. Oper. Res. 2008, 189, 132–145. [Google Scholar] [CrossRef]
- Chu, T.C. Facility location selection using fuzzy TOPSIS under group decisions. Int. J. Uncertain. Fuzziness Knowl. Based 2002, 10, 687–701. [Google Scholar] [CrossRef]
- Li, D.F. A ratio ranking method of triangular intuitionistic fuzzy numbers and its application to MADM problems. Comput. Math. Appl. 2010, 60, 1557–1570. [Google Scholar] [CrossRef] [Green Version]


| Linguistic Variables | TIFN Derived from for Benefit Criteria | TIFN Derived from for Cost Criteria |
|---|---|---|
| Absolutely optimistic (AO) | ||
| Optimistic (O) | ||
| Neutral (N) | ||
| Pessimistic (P) | ||
| Absolutely pessimistic (AP) |
| Linguistic Variables | Triangular Intuitionistic Fuzzy Numbers |
|---|---|
| Extremely high (EH) | |
| Very very high (VVH) | |
| Very high (VH) | |
| High (H) | |
| Medium high (MH) | |
| Medium (M) | |
| Medium low (ML) | |
| Low (L) | |
| Very low (VL) | |
| Very very low (VVL) |
| Linguistic Variables | Triangular Intuitionistic Fuzzy Numbers |
|---|---|
| Very important (VI) | |
| Important (I) | |
| Medium (M) | |
| Unimportant (UI) | |
| Very unimportant (VUI) |
| Sustainability Indicators | Description | ||
|---|---|---|---|
| Sustainability aspects | Social | SoI1: Health | Highlighting on-site sanitation, and the provision of health care |
| SoI2: Education | Number and time of training course to different levels of employees | ||
| SoI3: Culture and heritage | Measure of negative impacts from construction operations on any cultural heritage | ||
| SoI4: Safety | Number of accidents, the supply rate of on-site supervision and training course to employees to provide a safe and reliable workplace | ||
| SoI5: Stakeholder satisfaction | Measure of stakeholder satisfaction by using stakeholder management models | ||
| SoI6: Job opportunities | Providing direct and indirect jobs | ||
| SoI7: Tourism | Impacts on tourism development | ||
| SoI8: Traffic | Vehicle traffic congestion | ||
| SoI9: Access to public transportation | Extension of public transportation services and proximity to it | ||
| Economic | EcI1: Net present value (NPV) | where Rt is the net cash inflow-outflows during a single period t, is the discount rate of return that could be earned in alternative investments and t is the number of time periods | |
| EcI2: Payback period | Initial Investment/Net Cash Flow per Period | ||
| EcI3: Investment planning | Compliance with the investment plan | ||
| EcI4: Benefit–cost ratio | Relationship between the relative costs and benefits of a proposed project expressed in monetary or qualitative terms | ||
| EcI5: Debt–asset ratio | (Short-term Debt + Long-term Debt)/Total Assets | ||
| EcI6: Project budget | Compliance with budget | ||
| EcI7: Internal rate of return (IRR) | where is the net cash inflow during the period t, is the total initial investment cost and t is the number of time periods | ||
| EcI8: Financial risk | Possibility of losing money on the investment | ||
| EcI9: Life-cycle cost | Total cost for a construction project over its life | ||
| Environmental | EnI1: Material consumption | Efficiency rate of using materials and resources | |
| EnI2: Air pollution | Measure of mixture of solid particles and gases in the air | ||
| EnI3: landscape respect | Protection of landscape features during construction | ||
| EnI4: Noise emissions | Rate of noise pollution during the construction phase in the environment of the project | ||
| EnI5: Erosion | Rate of soil erosion during the construction phase in the environment of the project | ||
| EnI6: Ecological impacts | Measure of negative impacts from project to flora, fauna, and ecosystems | ||
| EnI7: Habitat loss and damage | Destructive effects on the living environment for both human being and animals | ||
| EnI8: Soil contamination | Measure of alteration in the physical, chemical and biological characteristics of the soil environment | ||
| EnI9: Aesthetical and visual impacts | Aesthetic quality of the project during the construction phase | ||
| EnI10: Water pollution | Measure of alteration in the physical, chemical and biological characteristics of water environment | ||
| EnI11: Water saving | Rate of reduction water consumption during the construction phase | ||
| EnI12: Hazardous waste | Production rate of hazardous waste |
| Criteria | Criteria Type | Description | |
|---|---|---|---|
| Benefit | Cost | ||
| C1: Measurability | ✓ | Measurability in qualitative or quantitative terms | |
| C2: Applicability | ✓ | Practicality and straightforward use of sustainability indicator (SI) for evaluation | |
| C3: Data availability | ✓ | Relative simplicity to gather the necessary data for evaluation of SI | |
| C4: Acceptant | ✓ | Acceptance of SI by major stakeholders | |
| C5: Complexity | ✓ | Relative difficulty in meaningful interpretation of SI | |
| C6: Time consuming | ✓ | Required time for the evaluation of SI | |
| C7: Uncertainty | ✓ | Ambiguity in assigning the value to SI during evaluation | |
| Experts | E1 | E2 | E3 | E4 | E5 |
|---|---|---|---|---|---|
| Risk attitudes | Neutral | Absolutely optimistic | Pessimistic | Optimistic | Neutral |
| SIs | Experts | Criteria | ||||||
|---|---|---|---|---|---|---|---|---|
| C1 | C2 | C3 | C4 | C5 | C6 | C7 | ||
| SoI1 | E1 | H | VH | ML | VH | L | VL | M |
| E2 | H | VH | M | VVH | VL | VL | MH | |
| E3 | VH | H | M | VVH | VL | VVL | M | |
| E4 | H | VVH | MH | VH | VVL | L | ML | |
| E5 | VH | VVH | M | VVH | VVL | VL | ML | |
| SoI2 | E1 | H | ML | MH | H | L | L | M |
| E2 | M | M | M | MH | VL | ML | M | |
| E3 | MH | M | H | H | L | ML | ML | |
| E4 | M | ML | M | MH | ML | M | M | |
| E5 | MH | L | MH | MH | L | ML | M | |
| SoI3 | E1 | VL | ML | MH | MH | H | MH | VH |
| E2 | L | L | H | H | MH | H | H | |
| E3 | VVL | L | H | VH | VH | H | VH | |
| E4 | VL | VL | VH | H | H | MH | VH | |
| E5 | VL | L | VH | VH | MH | MH | H | |
| SoI4 | E1 | H | MH | H | H | ML | L | ML |
| E2 | VH | MH | VH | VH | M | VVL | L | |
| E3 | H | M | VVH | VH | ML | VL | ML | |
| E4 | H | M | VH | H | L | VVL | L | |
| E5 | VH | MH | VH | VVH | ML | VL | L | |
| SoI5 | E1 | L | H | ML | VH | VH | H | H |
| E2 | VL | VH | L | H | H | MH | VVH | |
| E3 | ML | VH | VL | VVH | H | VH | VH | |
| E4 | ML | VVH | VL | VH | VH | H | VH | |
| E5 | L | VVH | ML | VH | VVH | VH | H | |
| SoI6 | E1 | VH | VH | H | MH | L | L | L |
| E2 | MH | H | H | H | VL | ML | L | |
| E3 | H | H | MH | MH | VL | L | M | |
| E4 | H | VH | MH | M | L | ML | M | |
| E5 | VH | VVH | H | H | L | L | L | |
| SoI7 | E1 | VH | MH | M | H | L | MH | H |
| E2 | VH | H | M | MH | VL | MH | VH | |
| E3 | VVH | H | ML | VH | VL | H | H | |
| E4 | VH | MH | ML | H | VVL | H | MH | |
| E5 | VVH | MH | ML | H | VL | VH | MH | |
| SoI8 | E1 | H | MH | M | MH | L | H | VH |
| E2 | MH | H | MH | MH | VL | VH | VVH | |
| E3 | H | H | MH | M | VL | H | VH | |
| E4 | H | VH | MH | M | VVL | VH | VVH | |
| E5 | VH | H | M | H | L | VH | VH | |
| SoI9 | E1 | VH | MH | L | ML | VL | M | H |
| E2 | H | H | ML | MH | VL | ML | M | |
| E3 | VH | MH | ML | ML | VL | L | M | |
| E4 | H | VH | ML | M | VL | L | H | |
| E5 | H | H | M | M | VVL | ML | MH | |
| EcI1 | E1 | EH | EH | H | ML | VL | VVL | H |
| E2 | EH | VVH | VVH | M | VVL | VVL | MH | |
| E3 | EH | EH | VH | MH | VL | VVL | MH | |
| E4 | EH | VH | VH | MH | VVL | VVL | M | |
| E5 | EH | EH | VVH | ML | VVL | VVL | H | |
| EcI2 | E1 | VVH | H | H | M | L | VL | MH |
| E2 | VH | VH | H | ML | VL | L | H | |
| E3 | VH | H | H | L | L | L | VH | |
| E4 | VH | H | H | L | L | VL | H | |
| E5 | VVH | H | VH | ML | VL | VL | VH | |
| EcI3 | E1 | H | MH | MH | L | M | ML | H |
| E2 | MH | MH | M | VL | M | ML | MH | |
| E3 | H | H | M | L | MH | M | VH | |
| E4 | VH | H | ML | VL | MH | M | MH | |
| E5 | VH | H | M | ML | MH | MH | H | |
| EcI4 | E1 | EH | EH | VH | M | L | ML | ML |
| E2 | EH | VVH | VVH | MH | ML | L | M | |
| E3 | EH | VVH | VVH | M | L | L | ML | |
| E4 | EH | EH | VVH | MH | L | ML | ML | |
| E5 | EH | EH | EH | MH | VL | L | L | |
| EcI5 | E1 | VH | H | H | ML | L | ML | H |
| E2 | H | H | MH | L | L | ML | MH | |
| E3 | VVH | MH | H | L | ML | M | MH | |
| E4 | H | MH | MH | L | L | M | H | |
| E5 | H | H | MH | ML | L | M | MH | |
| EcI6 | E1 | H | VH | H | ML | L | M | MH |
| E2 | VH | VH | H | M | VL | MH | H | |
| E3 | H | H | MH | ML | VVL | M | H | |
| E4 | VH | VH | VH | ML | VL | MH | MH | |
| E5 | VH | VVH | VH | M | VVL | ML | H | |
| EcI7 | E1 | VVH | EH | VH | ML | VL | VL | MH |
| E2 | EH | EH | VH | ML | VVL | VL | H | |
| E3 | EH | EH | VH | M | VVL | VL | MH | |
| E4 | EH | EH | H | M | VL | VVL | MH | |
| E5 | EH | EH | VVH | MH | VVL | VVL | ML | |
| EcI8 | E1 | ML | VVH | M | ML | H | MH | EH |
| E2 | M | H | ML | ML | MH | MH | VVH | |
| E3 | M | H | ML | L | MH | H | VH | |
| E4 | ML | MH | M | L | M | H | VVH | |
| E5 | M | VVH | M | ML | M | MH | VH | |
| EcI9 | E1 | MH | H | M | MH | M | VH | H |
| E2 | MH | VH | ML | H | ML | H | VH | |
| E3 | H | VH | ML | H | MH | VH | VH | |
| E4 | H | H | L | VH | ML | VVH | H | |
| E5 | H | VVH | ML | H | MH | MH | MH | |
| EnI1 | E1 | H | MH | H | MH | L | L | H |
| E2 | H | MH | VH | ML | L | VL | MH | |
| E3 | H | MH | H | ML | VL | VL | M | |
| E4 | H | H | VH | MH | L | L | H | |
| E5 | VH | H | VVH | M | VL | VVL | M | |
| EnI2 | E1 | VH | VH | ML | MH | M | ML | VH |
| E2 | H | H | MH | MH | MH | M | H | |
| E3 | H | H | MH | H | M | ML | VH | |
| E4 | VH | VH | ML | H | MH | ML | H | |
| E5 | H | VVH | MH | H | M | L | H | |
| EnI3 | E1 | ML | L | ML | M | MH | H | VH |
| E2 | L | L | ML | MH | H | H | H | |
| E3 | L | ML | ML | M | MH | VH | MH | |
| E4 | VL | L | ML | M | H | H | MH | |
| E5 | ML | ML | M | MH | MH | H | VH | |
| EnI4 | E1 | M | M | L | M | ML | MH | H |
| E2 | MH | ML | VL | MH | M | M | H | |
| E3 | ML | ML | L | M | ML | ML | MH | |
| E4 | ML | M | L | ML | ML | M | VH | |
| E5 | MH | M | ML | MH | L | ML | MH | |
| EnI5 | E1 | MH | ML | L | ML | H | H | VH |
| E2 | M | L | VL | L | MH | VH | H | |
| E3 | ML | VL | VL | L | H | VH | VH | |
| E4 | ML | L | L | VL | VH | H | H | |
| E5 | MH | L | ML | ML | MH | H | MH | |
| EnI6 | E1 | MH | H | M | M | H | H | H |
| E2 | M | MH | ML | MH | VH | MH | VH | |
| E3 | M | H | M | M | H | MH | H | |
| E4 | MH | H | M | ML | VH | H | MH | |
| E5 | H | VH | MH | MH | VVH | VH | MH | |
| EnI7 | E1 | ML | MH | ML | M | ML | MH | H |
| E2 | M | ML | L | ML | ML | M | MH | |
| E3 | MH | MH | ML | L | M | MH | MH | |
| E4 | M | MH | M | L | M | M | H | |
| E5 | MH | M | M | M | ML | M | H | |
| EnI8 | E1 | H | VH | H | MH | ML | MH | H |
| E2 | MH | H | MH | MH | ML | M | MH | |
| E3 | H | MH | M | H | VL | M | H | |
| E4 | MH | MH | MH | H | ML | MH | VH | |
| E5 | VH | VH | H | H | L | ML | MH | |
| EnI9 | E1 | M | MH | ML | MH | MH | M | VH |
| E2 | ML | H | L | H | H | M | H | |
| E3 | ML | MH | VL | H | H | MH | H | |
| E4 | ML | MH | L | VH | MH | H | MH | |
| E5 | M | H | ML | VH | MH | M | MH | |
| EnI10 | E1 | H | H | MH | H | M | M | M |
| E2 | VH | H | H | H | M | MH | MH | |
| E3 | H | MH | M | VH | M | M | MH | |
| E4 | VH | H | M | H | ML | MH | M | |
| E5 | VVH | VH | MH | VH | ML | M | ML | |
| EnI11 | E1 | H | H | MH | H | VL | M | H |
| E2 | H | MH | H | MH | VL | ML | VH | |
| E3 | H | MH | MH | H | VL | MH | H | |
| E4 | H | H | M | MH | L | ML | H | |
| E5 | VH | VH | MH | VH | VL | ML | MH | |
| EnI12 | E1 | VH | L | MH | MH | VL | ML | VH |
| E2 | H | ML | M | H | L | L | H | |
| E3 | MH | L | H | M | VL | ML | VH | |
| E4 | MH | ML | MH | MH | VL | ML | H | |
| E5 | H | L | H | H | VVL | L | MH | |
| Criteria | Experts | SIs | ||
|---|---|---|---|---|
| SoI6 | EcI4 | EnI10 | ||
| C1 | E1 | |||
| E2 | ||||
| E3 | ||||
| E4 | ||||
| E5 | ||||
| C2 | E1 | |||
| E2 | ||||
| E3 | ||||
| E4 | ||||
| E5 | ||||
| C3 | E1 | |||
| E2 | ||||
| E3 | ||||
| E4 | ||||
| E5 | ||||
| C4 | E1 | |||
| E2 | ||||
| E3 | ||||
| E4 | ||||
| E5 | ||||
| C5 | E1 | |||
| E2 | ||||
| E3 | ||||
| E4 | ||||
| E5 | ||||
| C6 | E1 | |||
| E2 | ||||
| E3 | ||||
| E4 | ||||
| E5 | ||||
| C7 | E1 | |||
| E2 | ||||
| E3 | ||||
| E4 | ||||
| E5 | ||||
| SIs | Experts | Criteria | ||||||
|---|---|---|---|---|---|---|---|---|
| C1 | C2 | C3 | C4 | C5 | C6 | C7 | ||
| SoI6 | E1 | 0.196 | 0.199 | 0.197 | 0.202 | 0.187 | 0.206 | 0.208 |
| E2 | 0.207 | 0.202 | 0.195 | 0.193 | 0.228 | 0.191 | 0.217 | |
| E3 | 0.202 | 0.205 | 0.207 | 0.204 | 0.208 | 0.205 | 0.184 | |
| E4 | 0.199 | 0.198 | 0.204 | 0.207 | 0.190 | 0.190 | 0.184 | |
| E5 | 0.196 | 0.197 | 0.197 | 0.194 | 0.187 | 0.206 | 0.208 | |
| EcI4 | E1 | 0.200 | 0.199 | 0.202 | 0.204 | 0.196 | 0.188 | 0.196 |
| E2 | 0.200 | 0.201 | 0.200 | 0.195 | 0.187 | 0.214 | 0.193 | |
| E3 | 0.200 | 0.201 | 0.200 | 0.207 | 0.195 | 0.204 | 0.197 | |
| E4 | 0.200 | 0.199 | 0.200 | 0.196 | 0.200 | 0.189 | 0.198 | |
| E5 | 0.200 | 0.199 | 0.198 | 0.197 | 0.222 | 0.205 | 0.217 | |
| EnI10 | E1 | 0.204 | 0.199 | 0.199 | 0.202 | 0.196 | 0.202 | 0.200 |
| E2 | 0.197 | 0.197 | 0.191 | 0.200 | 0.200 | 0.198 | 0.196 | |
| E3 | 0.205 | 0.210 | 0.208 | 0.199 | 0.196 | 0.202 | 0.195 | |
| E4 | 0.198 | 0.198 | 0.203 | 0.201 | 0.205 | 0.197 | 0.202 | |
| E5 | 0.197 | 0.195 | 0.199 | 0.198 | 0.203 | 0.202 | 0.208 | |
| Criteria | SIs | ||
|---|---|---|---|
| SoI6 | EcI4 | EnI10 | |
| C1 | |||
| C2 | |||
| C3 | |||
| C4 | |||
| C5 | |||
| C6 | |||
| C7 | |||
| Experts | Criteria | ||||||
|---|---|---|---|---|---|---|---|
| C1 | C2 | C3 | C4 | C5 | C6 | C7 | |
| E1 | I | I | I | I | M | M | I |
| E2 | M | VI | I | VI | I | UI | I |
| E3 | I | I | I | I | I | M | I |
| E4 | M | I | VI | I | M | M | VI |
| E5 | I | VI | I | I | I | M | VI |
| Criteria | Weight Vectors |
|---|---|
| C1 | |
| C2 | |
| C3 | |
| C4 | |
| C5 | |
| C6 | |
| C7 |
| Criteria | Ideal Solutions | |
|---|---|---|
| TIF PIS | TIF NIS | |
| C1 | ||
| C2 | ||
| C3 | ||
| C4 | ||
| C5 | ||
| C6 | ||
| C7 | ||
| Ideal Separation | SIs | Criteria | ||||||
|---|---|---|---|---|---|---|---|---|
| C1 | C2 | C3 | C4 | C5 | C6 | C7 | ||
| PISE | SoI6 | 0.313 | 0.208 | 0.344 | 0.392 | 0.049 | 0.006 | 0.016 |
| EcI4 | 0.000 | 0.028 | 0.000 | 0.490 | 0.022 | 0.000 | 0.063 | |
| EnI10 | 0.211 | 0.348 | 0.486 | 0.156 | 0.146 | 0.215 | 0.188 | |
| NISE | SoI6 | 0.554 | 0.629 | 0.466 | 0.392 | 0.660 | 0.572 | 0.718 |
| EcI4 | 0.867 | 0.810 | 0.810 | 0.294 | 0.633 | 0.578 | 0.670 | |
| EnI10 | 0.656 | 0.490 | 0.324 | 0.628 | 0.465 | 0.363 | 0.545 | |
| SIs | Final Ranking | |||||||
|---|---|---|---|---|---|---|---|---|
| SoI1 | 0.627 | 0.093 | 2.766 | 0.250 | 0.208 | 0.814 | 0.786 | 5 |
| SoI2 | 1.620 | 0.273 | 1.799 | 0.116 | 0.601 | 0.475 | 0.363 | 16 |
| SoI3 | 2.415 | 0.384 | 1.041 | 0.084 | 0.873 | 0.306 | 0.154 | 28 |
| SoI4 | 0.553 | 0.128 | 2.752 | 0.240 | 0.239 | 0.798 | 0.756 | 6 |
| SoI5 | 2.304 | 0.276 | 1.026 | 0.200 | 0.717 | 0.458 | 0.295 | 21 |
| SoI6 | 0.684 | −0.002 | 2.639 | 0.227 | 0.095 | 0.761 | 0.822 | 4 |
| SoI7 | 1.502 | 0.134 | 1.937 | 0.066 | 0.405 | 0.432 | 0.438 | 14 |
| SoI8 | 1.960 | 0.213 | 1.466 | 0.055 | 0.580 | 0.339 | 0.302 | 20 |
| SoI9 | 1.595 | 0.181 | 1.848 | 0.023 | 0.479 | 0.360 | 0.361 | 17 |
| EcI1 | 0.548 | 0.075 | 2.850 | 0.308 | 0.171 | 0.903 | 0.870 | 3 |
| EcI2 | 1.276 | 0.183 | 2.199 | 0.104 | 0.429 | 0.526 | 0.480 | 13 |
| EcI3 | 2.003 | 0.250 | 1.336 | 0.011 | 0.635 | 0.259 | 0.238 | 23 |
| EcI4 | 0.106 | 0.032 | 3.121 | 0.320 | 0.044 | 0.965 | 1.000 | 1 |
| EcI5 | 1.527 | 0.205 | 1.837 | 0.009 | 0.498 | 0.340 | 0.341 | 18 |
| EcI6 | 1.171 | 0.113 | 2.244 | 0.189 | 0.322 | 0.645 | 0.610 | 9 |
| EcI7 | 0.480 | 0.088 | 2.902 | 0.347 | 0.176 | 0.963 | 0.907 | 2 |
| EcI8 | 2.489 | 0.240 | 0.777 | 0.100 | 0.702 | 0.283 | 0.220 | 24 |
| EcI9 | 1.742 | 0.177 | 1.621 | 0.160 | 0.499 | 0.504 | 0.430 | 15 |
| EnI1 | 1.180 | 0.077 | 2.276 | 0.164 | 0.278 | 0.618 | 0.618 | 8 |
| EnI2 | 1.444 | 0.090 | 1.917 | 0.160 | 0.338 | 0.553 | 0.544 | 10 |
| EnI3 | 2.818 | 0.338 | 0.396 | 0.000 | 0.881 | 0.088 | 0.062 | 29 |
| EnI4 | 2.346 | 0.267 | 0.933 | −0.008 | 0.713 | 0.167 | 0.161 | 27 |
| EnI5 | 3.135 | 0.390 | 0.119 | −0.004 | 1.000 | 0.036 | 0.000 | 30 |
| EnI6 | 2.265 | 0.092 | 1.061 | 0.058 | 0.476 | 0.275 | 0.315 | 19 |
| EnI7 | 2.318 | 0.174 | 0.972 | −0.031 | 0.590 | 0.142 | 0.197 | 26 |
| EnI8 | 1.364 | 0.007 | 2.008 | 0.040 | 0.220 | 0.408 | 0.515 | 11 |
| EnI9 | 2.152 | 0.266 | 1.182 | 0.082 | 0.680 | 0.326 | 0.251 | 22 |
| EnI10 | 1.004 | 0.031 | 2.309 | 0.125 | 0.191 | 0.572 | 0.637 | 7 |
| EnI11 | 1.354 | 0.037 | 2.073 | 0.035 | 0.256 | 0.413 | 0.500 | 12 |
| EnI12 | 1.857 | 0.347 | 1.572 | 0.008 | 0.733 | 0.294 | 0.211 | 25 |
| SIs | Proposed Approach | Fuzzy MCDM Methods | ||||||
|---|---|---|---|---|---|---|---|---|
| Fuzzy VIKOR [65] | Fuzzy SAW [66] | Fuzzy TOPSIS [67] | ||||||
| Ranking Score | Preference Order Ranking | Ranking Score | Preference Order Ranking | Ranking Score | Preference Order Ranking | Ranking Score | Preference Order Ranking | |
| SoI1 | 0.786 | 5 | 0.178 | 5 | 0.866 | 5 | 0.648 | 5 |
| SoI2 | 0.363 | 16 | 0.486 | 15 | 0.756 | 16 | 0.483 | 16 |
| SoI3 | 0.154 | 28 | 0.721 | 25 | 0.678 | 24 | 0.391 | 23 |
| SoI4 | 0.756 | 6 | 0.160 | 4 | 0.876 | 3 | 0.680 | 2 |
| SoI5 | 0.295 | 21 | 0.755 | 26 | 0.685 | 23 | 0.401 | 21 |
| SoI6 | 0.822 | 4 | 0.241 | 6 | 0.851 | 6 | 0.628 | 6 |
| SoI7 | 0.438 | 14 | 0.490 | 16 | 0.757 | 15 | 0.490 | 15 |
| SoI8 | 0.302 | 20 | 0.707 | 23 | 0.701 | 21 | 0.389 | 24 |
| SoI9 | 0.361 | 17 | 0.491 | 17 | 0.755 | 17 | 0.465 | 17 |
| EcI1 | 0.870 | 3 | 0.150 | 3 | 0.875 | 4 | 0.667 | 4 |
| EcI2 | 0.480 | 13 | 0.380 | 10 | 0.796 | 10 | 0.537 | 10 |
| EcI3 | 0.238 | 23 | 0.607 | 20 | 0.712 | 20 | 0.405 | 20 |
| EcI4 | 1.000 | 1 | 0.000 | 1 | 0.937 | 1 | 0.735 | 1 |
| EcI5 | 0.341 | 18 | 0.459 | 14 | 0.766 | 14 | 0.492 | 14 |
| EcI6 | 0.610 | 9 | 0.367 | 9 | 0.798 | 9 | 0.560 | 9 |
| EcI7 | 0.907 | 2 | 0.125 | 2 | 0.885 | 2 | 0.674 | 3 |
| EcI8 | 0.220 | 24 | 0.839 | 28 | 0.646 | 28 | 0.306 | 28 |
| EcI9 | 0.430 | 15 | 0.586 | 19 | 0.731 | 18 | 0.457 | 18 |
| EnI1 | 0.618 | 8 | 0.353 | 8 | 0.802 | 8 | 0.564 | 8 |
| EnI2 | 0.544 | 10 | 0.450 | 13 | 0.770 | 13 | 0.503 | 13 |
| EnI3 | 0.062 | 29 | 0.916 | 29 | 0.612 | 29 | 0.250 | 29 |
| EnI4 | 0.161 | 27 | 0.704 | 22 | 0.677 | 25 | 0.370 | 25 |
| EnI5 | 0.000 | 30 | 1.000 | 30 | 0.588 | 30 | 0.195 | 30 |
| EnI6 | 0.315 | 19 | 0.802 | 27 | 0.662 | 27 | 0.310 | 27 |
| EnI7 | 0.197 | 26 | 0.712 | 24 | 0.674 | 26 | 0.364 | 26 |
| EnI8 | 0.515 | 11 | 0.426 | 12 | 0.775 | 12 | 0.529 | 11 |
| EnI9 | 0.251 | 22 | 0.661 | 21 | 0.692 | 22 | 0.396 | 22 |
| EnI10 | 0.637 | 7 | 0.304 | 7 | 0.820 | 7 | 0.603 | 7 |
| EnI11 | 0.500 | 12 | 0.420 | 11 | 0.778 | 11 | 0.527 | 12 |
| EnI12 | 0.211 | 25 | 0.557 | 18 | 0.730 | 19 | 0.441 | 19 |
| Related Literature | Social | Economic | Environmental | ||||||||
|---|---|---|---|---|---|---|---|---|---|---|---|
| SoI1 | SoI4 | SoI6 | EcI1 | EcI4 | EcI6 | EcI7 | EnI1 | EnI2 | EnI10 | ||
| Awasthi et al. [47] | S ** | ✓ * | ✓ | – * | – | ✓ | – | – | – | ✓ | – |
| Shen et al. [56] | S | ✓ | ✓ | ✓ | ✓ | – | ✓ | ✓ | – | ✓ | ✓ |
| Shen et al. [57] | S | ✓ | ✓ | ✓ | – | – | ✓ | ✓ | – | ✓ | ✓ |
| Yao et al. [59] | S | ✓ | ✓ | ✓ | ✓ | ✓ | ✓ | ✓ | – | ✓ | ✓ |
| CEEQUAL [62] | T ** | ✓ | ✓ | ✓ | – | ✓ | – | – | ✓ | ✓ | ✓ |
| Invest [63] | T | ✓ | ✓ | – | – | ✓ | – | – | ✓ | ✓ | ✓ |
| Envision [64] | T | ✓ | ✓ | ✓ | – | ✓ | ✓ | – | ✓ | ✓ | ✓ |
Publisher’s Note: MDPI stays neutral with regard to jurisdictional claims in published maps and institutional affiliations. |
© 2021 by the authors. Licensee MDPI, Basel, Switzerland. This article is an open access article distributed under the terms and conditions of the Creative Commons Attribution (CC BY) license (http://creativecommons.org/licenses/by/4.0/).
Share and Cite
Hashemi, H.; Ghoddousi, P.; Nasirzadeh, F. Sustainability Indicator Selection by a Novel Triangular Intuitionistic Fuzzy Decision-Making Approach in Highway Construction Projects. Sustainability 2021, 13, 1477. https://doi.org/10.3390/su13031477
Hashemi H, Ghoddousi P, Nasirzadeh F. Sustainability Indicator Selection by a Novel Triangular Intuitionistic Fuzzy Decision-Making Approach in Highway Construction Projects. Sustainability. 2021; 13(3):1477. https://doi.org/10.3390/su13031477
Chicago/Turabian StyleHashemi, Hassan, Parviz Ghoddousi, and Farnad Nasirzadeh. 2021. "Sustainability Indicator Selection by a Novel Triangular Intuitionistic Fuzzy Decision-Making Approach in Highway Construction Projects" Sustainability 13, no. 3: 1477. https://doi.org/10.3390/su13031477