Perspective

Insight into the Impact of COVID-19 on Australian Transportation Sector: An Economic and Community-Based Perspective

1
School of Built Environment, University of New South Wales, Kensington, Sydney, NSW 2052, Australia
2
Faculty of Chemical Energy, University of New South Wales, Kensington, Sydney, NSW 2052, Australia
3
School of Computing Engineering and Mathematics, Western Sydney University, Locked Bag 1797, Penrith, NSW 2751, Australia
4
School of Engineering, Deakin University, Geelong, VIC 3216, Australia
*
Author to whom correspondence should be addressed.
Sustainability 2021, 13(3), 1276; https://doi.org/10.3390/su13031276
Submission received: 4 January 2021 / Revised: 19 January 2021 / Accepted: 21 January 2021 / Published: 26 January 2021

Abstract

:
The Coronavirus Disease 2019 (COVID-19) is a major virus outbreak of the 21st century. The Australian government and local authorities introduced some drastic strategies and policies to control the outspread of this virus. The policies related to lockdown, quarantine, social distancing, shut down of educational institute, work from home, and international and interstate travel bans significantly affect the lifestyle of citizens and, thus, influence their activity patterns. The transport system is, thus, severely affected due to the COVID-19 related restrictions. This paper analyses how the transport system is impacted because of the policies adopted by the Australian government for the containment of the COVID-19. Three main components of the transport sector are studied. These are air travel, public transport, and freight transport. Various official sources of data such as the official website of the Australian government, Google mobility trends, Apple Mobility trends, and Moovit were consulted along with recently published research articles on COVID-19 and its impacts. The secondary sources of data include databases, web articles, and interviews that were conducted with the stakeholders of transport sectors in Australia to analyse the relationship between COVID-19 prevention measures and the transport system. The results of this study showed reduced demand for transport with the adoption of COVID-19 prevention measures. Declines in revenues in the air, freight, and public transport sectors of the transport industry are also reported. The survey shows that transport sector in Australia is facing a serious financial downfall as the use of public transport has dropped by 80%, a 31.5% drop in revenues earned by International airlines in Australia has been predicted, and a 9.5% reduction in the freight transport by water is expected. The recovery of the transport sector to the pre-pandemic state is only possible with the relaxation of COVID-19 containment policies and financial support by the government.

1. Introduction

COVID-19 is a highly contagious disease caused by Severe Acute Respiratory Syndrome Coronavirus 2 (SARS-CoV-2). The virus was first discovered in December 2019 in China that later spread to 210 countries as the world entered 2020 [1]. The World Health Organization (WHO) declared it a pandemic on 11 March 2020. This disease is characterized by flu and cold-like symptoms. The symptoms may range from mild sneezing to severe sickness leading to death. The symptoms may also include cough, fever, shortness of breath, and possible pneumonia [2]. The symptoms may be visible for two to fourteen days after the contact. The virus spreads from one person to another within one to two meters distance of each other through coughing or sneezing generally. The transfer can be direct through contact with the infected person or indirect by touching the infected surfaces [2].
The proliferation of the disease is occurring at a rapid rate globally as reported by the number of cases [3]. Due to its highly infectious nature, drastic measures to restrict and limit the outdoor activities of people have been adopted all over the world. Such policies have taken a serious toll on the transportation and mobility patterns of people, as most of the people are now confined to their homes. Many countries like America, Australia, Canada, Spain, Italy, and Norway are observing bans on air travel [4]. This has seriously affected the transport system all over the world. The impact of COVID-19 related rules depends on the mode of transportation. In Budapest, the most prominent reduction in the number of trips has been observed in public transport while cycling faced the least decline [5]. The use of public transport by citizens faced the highest decline in the Netherlands, where the number of trips was reduced by more than 90%. In this country, 88% of people prefer using their transport means rather than using a public or shared mode of transportation [6]. Aloi et al. [7] reported that the mobility of citizens in Spain has been reduced by 76% and public transport observed a 93% reduction in the number of passengers [7]. In the UK, travel restrictions resulted in a 95% decrease in underground travel (Ramos Alfaro, 2020). Canadian Civil Aviation activities and military aviation activities reduced by dropped by 71 and 27%, respectively. At the end of June 2020, Brussels, Singapore, Stockholm, Lyon, Paris, and Moscow were found to have a mobility index higher than 50%. Hong Kong had the highest mobility index of 76% while American cities were found to have a mobility index lower than 20% [8]. Global commercial flight activity during mid-April 2020 was almost 75% below 2019 [9].
Huang et al. [10] investigate the impact of a pandemic on transportation-related behaviours. Travel restrictions were one of the major effective measures taken in Mainland China to control the COVID-19 outbreak. Human mobility data were collected from Baidu Maps and detailed transportation-related behaviours were investigated based on the mode of transportation, type of places visited, preference on “origin-destination” distance, etc. It was observed that during January to April 2020 a dramatic change was observed in the factors in comparison to the same time last year. For example, the origin-destination distance was greater than 300 km in February 2020 as compared to February 2018–2019. Moreover, people preferred zero-touch transportation to reach their destination. Sun et al. [10] conducted an empirical analysis on the air transportation systems using multi-granularity network analysis including international, domestic, and worldwide airport networks from January to May 2020. It was found that flight restrictions were imposed on long-distance international flights, while the impact of pandemic was lower on domestic flights. Based on complex network metrics it was found that each airport lost 50% of its connections on average. Furthermore, Monmousseau et al. [11] investigated the travel restriction implemented in the US air transportation system from a passenger perspective. Four passenger-centric metrics were built using Twitter data, which were available in real-time. From the passengers’ perspective metrics indicated that each airline responded to the pandemic related travel restrictions differently and could be useful for the decision-making process.
In Australia, COVID-19 was confirmed in January 2020. From the start of the pandemic till 23 December 2020, the total number of confirmed cases of the infection reached 28,237. Out of these patients, 25,717 have recovered while 908 died [12]. The graph in Figure 1 shows the number of new COVID-19 cases reported each day starting from March 2020. This graph shows that on 10 March 2020, 21 new COVID-19 cases were reported. Sharp spikes in the number of new COVID-19 cases were observed in the months of March and July. The highest number of cases was reported on 30 July when this number reached to 721.
After August 2020, this number again declined and reached 25 new cases on 16 November 2020. To limit the spread of the virus in Australia, the governments of different states have taken several drastic measures, such as social distancing, ban on social gatherings, lockdown, and quarantine policies. People do their jobs while working from home. Online shopping has become the new preferred way of shopping as the national average of online shopping transactions has been raised by 41% for the year 2020 [13]. The educational institutes like schools, colleges, and universities are closed with more than one million students now adapting to the online learning practices [14]. The people who have to go outside for getting essentials are asked to maintain a 1.5 m distance from all the other people [12]. Thus, with the pandemic situation, the outdoor activities of citizens have reduced. This has resulted in a drastic reduction in the use of public transport like buses and trains in cities. Various travel restrictions are imposed to limit travel to and from Australia. A limited number of flights are currently available, and people are not allowed to travel except for a few exemptions. All passengers arriving in Australia must observe a quarantine period for at least 14 days. Hence, the new government policies for limiting the spread of COVID-19 have severely affected the transport sector of the country, as the people are limiting physical contact with each other, are observing quarantine and do not leave their homes out of fear of catching the virus. Due to the reduction in the number of passengers, the transport sector is facing a serious financial decline.
A detailed overview of the COVID-19 related literature shows a lack of research on the impact of a pandemic on the transport sector. The consequences of the COVID-19 policies from economic and health perspectives have been studied by McKibbin and Fernando [15], who expected a negative global macroeconomic impact due to the pandemic and predicted the same impact in China. Estrada et al. [16] studied the impact of COVID-19 on tourism, global trade, and air travel in China and predicted a decline in these sectors along with a rise in electricity consumption and an increased demand for medical facilities [16]. Wang et al. [17] studied the health implications on children due to being extensively confined in homes for a long time [17]. Most of the existing studies report the pandemic impact in China where the virus started and other Asian and European countries. However, the implications of a pandemic situation in Australia particular to the transport sector have not been studied in the existing literature.
This paper aims to analyse the effect of COVID-19 related restrictions and policies on the transport sector in Australia. Three major components of transportation are considered in this study. These are public transport, freight transport, and air travel. The effect of COVID-19 on these three components will be studied focusing on the impact on several passengers, fare rates, and overall revenue earned by the transport service providers because of the pandemic situation. The impact of a pandemic on public transport in cities is studied as cities and metropolitan areas are quite populated and, therefore, are more susceptible to the health-related crisis [18]. Hence, it is important to understand the transport behaviour of citizens and their impact on the transport systems during the pandemic. Ivanov identified the necessity of planning the supply chain for transport networks during the pandemic to determine the components of risk preparedness and recovery [19,20]. In line with this research, we aim to further probe the existing and post-pandemic risks to the transport sector.
The study aims to analyse how the policies adopted by government and transportation authorities have affected the transport industry in Australia. Precisely, this study aims to determine how the pandemic has affected the demand for public transport and the travel patterns of consumers. Furthermore, the impact of a pandemic on air travel and freight transport system in Australia and its influence on the revenue generation will be investigated.
The paper is organized as follows: The next section describes the methodology followed and the materials used to conduct this research. Section three discusses the measures adopted by the Australian government and local authorities against the virus outbreak. The fourth section investigates the impact of these measures on the transport system of the country. Section five discusses the findings of this research. Section six concludes the study while drawing some recommendations for improving the current and post-pandemic conditions of the transport sector.

1.1. Problem Statement

This paper analyses the impact of COVID-19 on transportation sector of Australia based on economic and community perspective as cities and metropolitan areas are quite populated and, therefore, are more susceptible to the health-related crisis. Hence, it is important to understand the transport behaviour of citizens and their impact on the transport systems during the pandemic. Ivanov identified the necessity of planning the supply chain for transport networks during the pandemic to determine the components of risk preparedness and recovery [19]. In line with this research, we aim to further probe the existing and post-pandemic risks to the transport sector. Further, this study aims to analyse how the policies adopted by government and transportation authorities have affected the transport industry in Australia.

1.2. Global Impact of COVID-19 Outbreak on Transport Systems

For many public transportation systems in the United States, the COVID-19 pandemic and associated limitations have led to a substantial decrease in transit demand. A comprehensive study of the dynamics of this extraordinary decline and its aspects was conducted [21]. Using transit demand data from a frequently used transit navigation app, they formulated logistical functions to model the decline in daily demand and extract key parameters: base value, apparent minimum demand level and peak and base points, reflecting the initial date when the decline in transit demand started and the final date when the rate of decline attenuated. Regression analysis revealed minimum demand for public transport was observed during COVID-19 in communities with higher proportions of critical employees and vulnerable groups (African American, Hispanic, Female, and people over 45 years of age). Around half of the agencies suffered a decline before the local spread of COVID-19 possibly began; most of these are in the Midwest of the United States [22,23]. Figure 2 shows the graph representing the per hour demand for transport at the MTA New York City subway. The COVID curve (blue) clearly shows the significant decrease in demand when compared with the demand curve generated for a pre-pandemic period (red).
The COVID-19 pandemic and related limitations prompted significant travel request decrease for some open travel frameworks in the United States. This paper is a deliberate examination of the elements and measurements of this exceptional decay. Utilizing travel request information got from a broadly utilized travel route application, we fit strategic capacities to display the decrease in everyday interest and determine key boundaries: base worth, the obvious insignificant degree of interest and bluff and base focus, speaking to the underlying date when travel request decay started and the last date when the decrease rate lessened. Relapse investigations uncover that networks with higher extents of fundamental labourers, weak populaces (African American, Hispanic, Female, and individuals more than 45 years of age), and more COVID Google look through, will in general, keep up more elevated levels of insignificant interest during COVID-19. Around half of the organizations encountered their decrease before the neighbourhood spread of COVID-19 probably started; the greater part of these is in the US Midwest. Practically no travel frameworks completed their decay periods before the neighbourhood network spread. We additionally look at hourly interest profiles for every framework previously and during COVID-19 utilizing customary Procrustes distance examination. The outcomes show considerable take-offs from ordinary workday hourly interest profiles. Our outcomes give bits of knowledge into public travel as a basic help during a pandemic.
Air terminals assume a focal part in the worldwide economy, the travel industry economy, and future recuperation endeavours. The panic caused by the onset of the novel COVID-19 has forced the governments to take drastic measures, which include bans on international travel and closure of airports [24]. With the inception of a pandemic, a gradual decrease was observed worldwide in the daily number of flights. This number fell to 64% in late March 2020 when travel restrictions were enforced in America and Europe [25]. The density of the global network of flights also decreased by 51% during this time. A survey conducted on the impact of COVID-19 related restrictions in European countries concluded that each airport lost 50% of its connections in the global airport network [10]. Travel limitations and closure of borders debilitatingly affected the air terminals and the avionics sectors of the travel industry. With aircrafts grounded, the airports transformed into parking areas and apparition towns. With this, there were radical decreases in landing, flight charges, and non-aeronautical income. Hence, the airlines could not raise sufficient incomes to maintain numerous air terminals. Worldwide, the closure of airports additionally influenced approximately 6 million individuals directly who were working in these air terminals in administrations, shops, vehicle rental departments, air terminal cafés, and navigation departments [26]. The study recommended that monetary help must be extended to the avionics business as awards, tax exclusions, special credits, and funds.
While passenger traffic dropped significantly as the COVID-19 pandemic struck, truck traffic remained reasonably steady. Demand for deliveries skyrocketed with residents and staff staying home, just one of the big impacts on the freight industry of the pandemic. Senior Transportation Planner Daniel Haake, American Planning Association (AICP), recently summarized the U.S. effects on freight movement of the pandemic for the Industrial Technology Education (ITE) Report, the Institute of Transportation Engineers’ monthly publication. One of the pandemic’s most notable impacts was the dramatic growth in e-commerce and home delivery. Supply chains that relied on regional distribution centres and regular deliveries were also strained by panic buying and abrupt changes in customer demand. Around the same time, fewer cars and commuters on the roads meant that freight bottlenecks across the U.S. were removed, at least temporarily. Although the long-term ramifications of these changes remain unclear, the significance of intelligent freight planning, both locally and regionally, is highlighted. It also offered a strong example of the value of demand management strategies for passenger travel as a method for freight planning. Less traffic and fewer jams meant that average driving speeds for trucks increased by almost 25 mph and goods were shipped quicker than ever to customers and hospital patients [27].

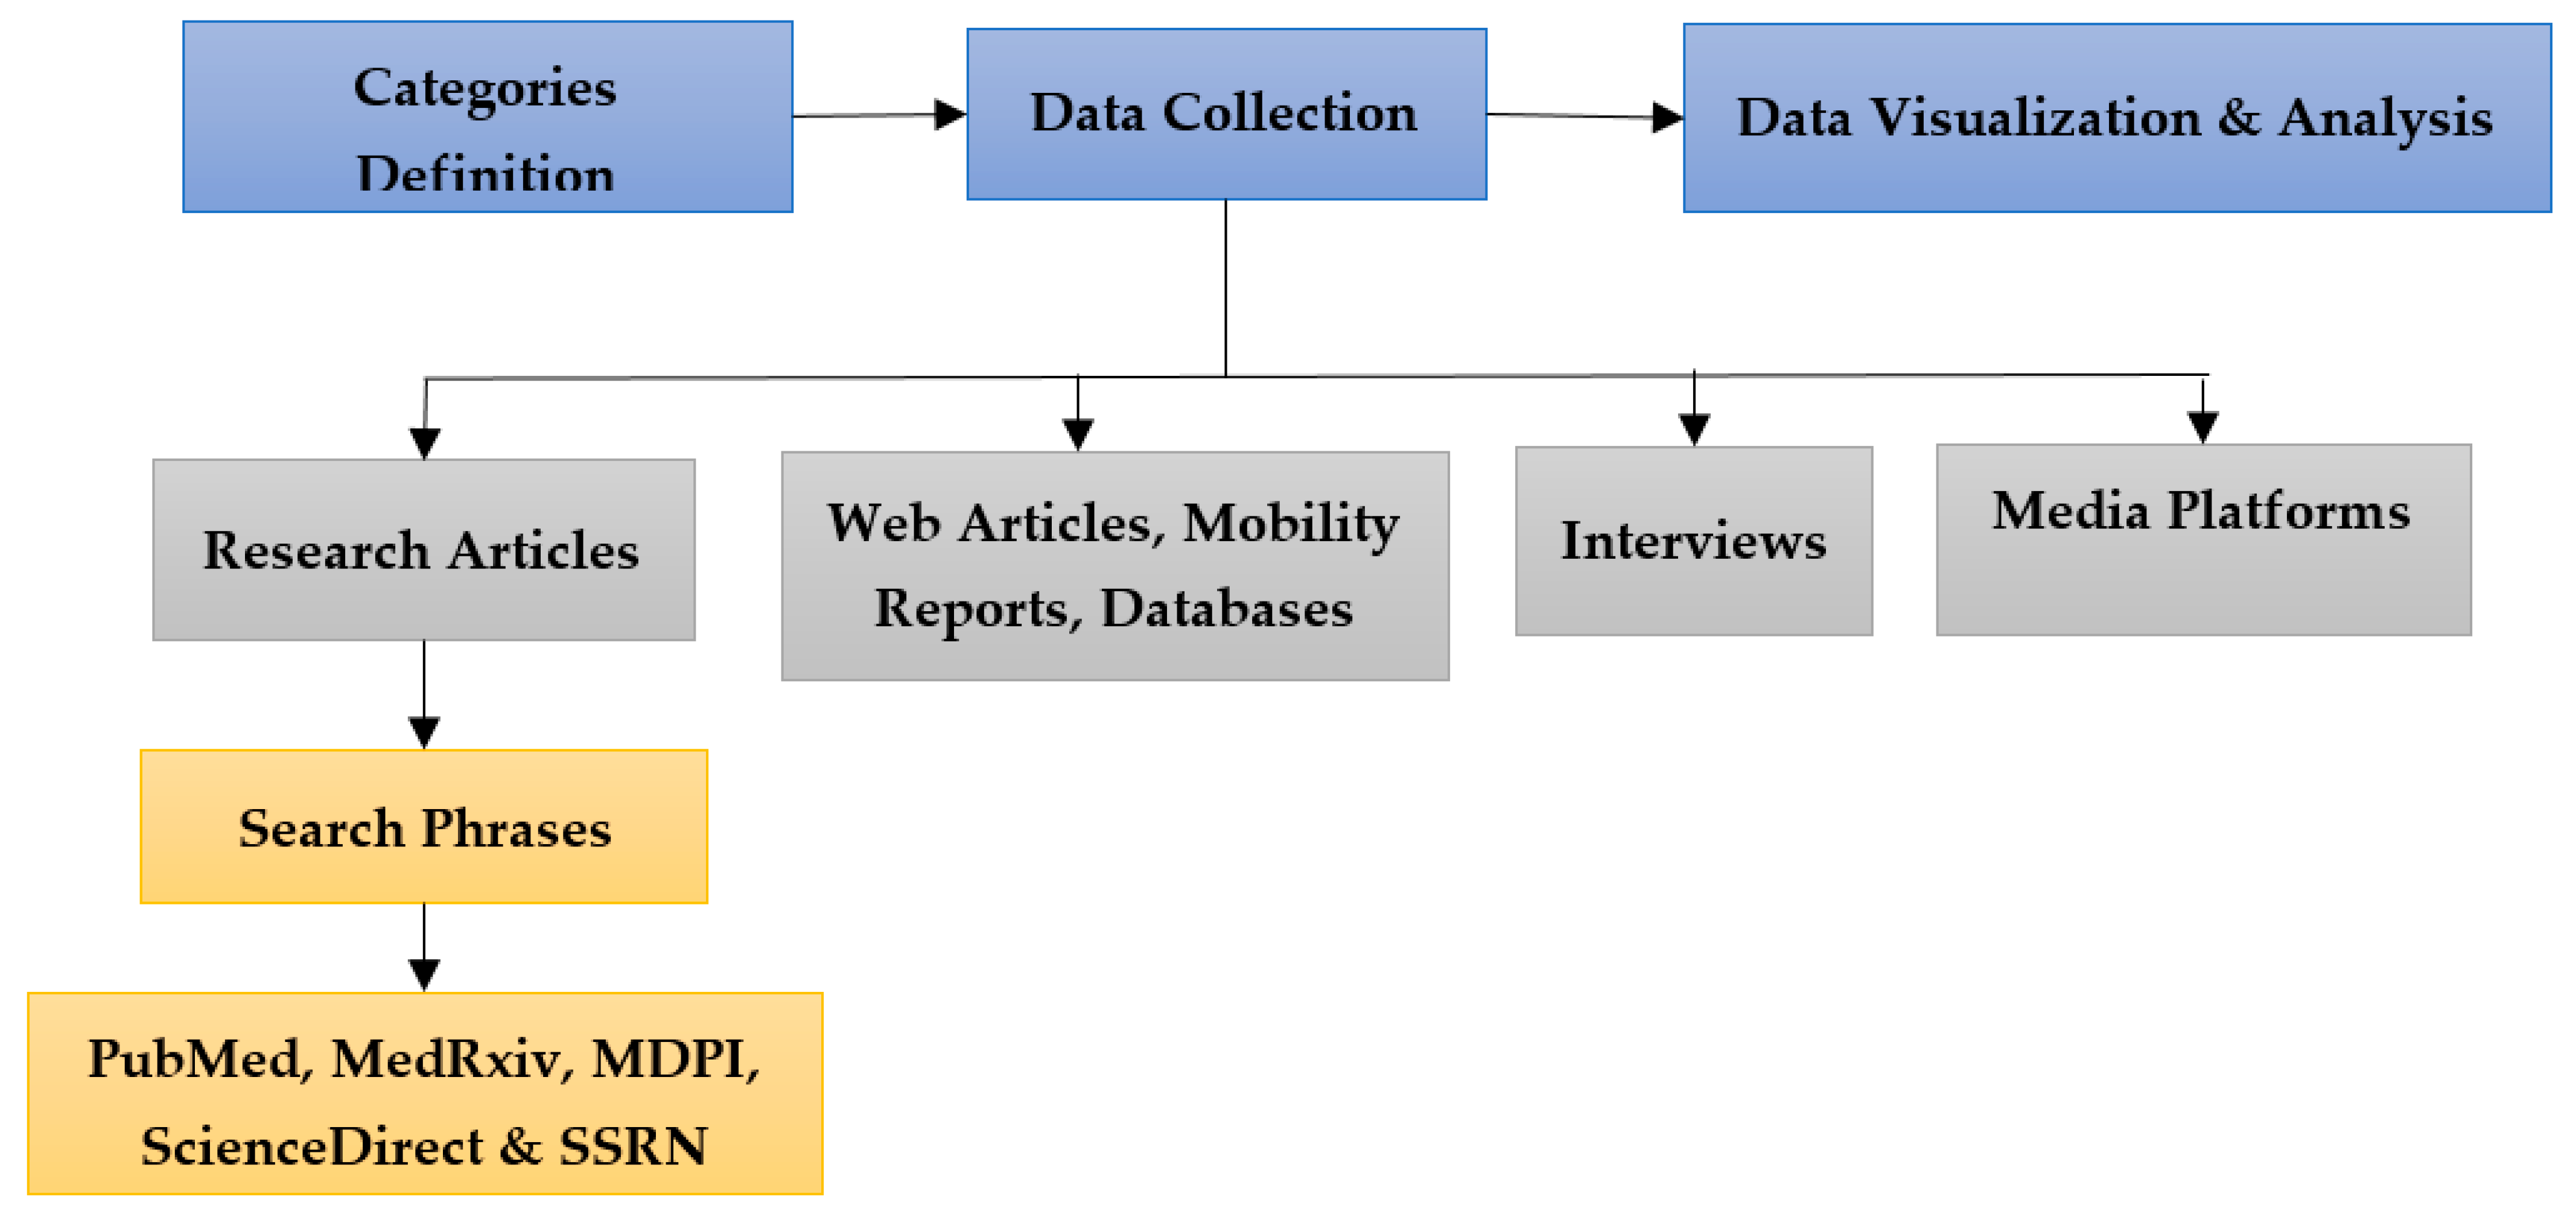
2. Materials and Methods

This paper studies the impact of the recent pandemic policies on the transportation system in Australia while focusing on three important sectors, which are: public transport, air travel, and freight transport. In this section, the method, materials, and resources used to conduct this study are presented. Figure 3 shows the overall methodology followed for the study. To facilitate the data collection process, three major categories of data were defined. These categories were defined, keeping in mind the research questions addressed in the study. The defined categories are listed below:
  • Cat-1: Response to COVID-19
  • Cat-2: The impact of COVID-19.
  • Cat-3: Impact of COVID-19 on transport systems in Australia.
    • Cat-3.1: Impact of COVID-19 on Public Transport
    • Cat-3.2: Impact of COVID-19 on Air Travel
    • Cat-3.3: Impact of COVID-19 on Freight Transport
To retrieve articles related to each category, we first consulted the primary sources, which are official websites of journals and conferences. The websites chosen for the study are PubMed, MedRxiv, MDPI, Elsevier, ScienceDirect, and SSRN. VOSviewer software tool was used to visualize the bibliometric networks from different databases. Search phrases to be used on the search engines of these websites were carefully designed to exhaust the database of each website and retrieve a maximum number of relevant articles. For instance, the search phrases formulated for Cat-1 included phrases like “COVID-19 policies”, “COVID-19 restrictions,” and “coronavirus response”. The idea is to use various sequence of keywords related to each category. Similarly, for Cat-2 the search phrases included “Impact of COVID-19” and “effects of coronavirus”. For Cat-3, we used specific keywords for each subcategory. Such phrases included “coronavirus and public transport in Australia”, “coronavirus effect on air travel in Australia,” and “coronavirus impact on freight transport in Australia”.
To refine the selection of keywords, a list of basic keywords is generated. More keywords related to these set of keywords are searched. The initial selection of keywords used for this search includes, “Australian transport”, “COVID-19”, “air travel”, “public transport”, “freight transport,” and “effect on transport revenues”. After carrying out the keywords search, the most repetitive keywords found in the literature includes “Coronavirus”, “vaccine”, “travel restriction”, “air pollution level”, “aviation restriction,” and “tourism” etc., as shown in Figure 4. These keywords showed that the data collected for this research revolved around the Coronavirus effects on transport revenues. Using keywords from this list, both separately and in combinations, the article search process was extended to retrieve a maximum number of relevant articles from the search engines.
As a result of these searches, a list of ranked research articles was retrieved from each website. A screening method was applied to assess and filter the articles. Each article was assessed based on the following criteria:
  • Published in 2020
  • English language only
  • Article type should be research paper, review, or book chapter
  • No duplicates
After an initial screening of the articles, the articles were downloaded. Each paper was then studied and carefully analysed for its relevance. This involved reading the abstract, introduction, and results section of each paper. Each article was finalized only after it has been found relevant to any of the defined categories. At the end of the article’s retrieval process, a total of 11 research papers were found relevant to the study and met all the assessment criteria. These articles are listed in Table 1 along with their sources. Out of these papers, two belonged to Cat-1, eight belonged to Cat-2, while one belonged to Cat-3.
Due to limited published research related to Cat-3, the data related to this category was obtained from various online resources. These include the official website of the Australian government and reports by IBISWorld [12]. The data about freight route performance under COVID-19 was obtained from the Department of Infrastructure, Transport, Regional Development, and Communication, Australian government. To view the latest statistics, some online resources were consulted. The transportation data for Australia was generated from Apple mobility reports, Google mobility trends, and Moovit mobility patterns. The mobility reports retrieved from these sources show the trends of movement with time and according to geography. Category wise mobility reports show the community movement trends in areas such as parks, transits, pharmacies, residencies, and workplaces. To collect data related to most recent policies adopted by the government of Australia, the official website of the Australian government was consulted.
The interstate travel restrictions and various transport-related policies during the pandemic were also collected from this website. The raw data was visualized in charts in Microsoft Excel. Facts and figures were gained from media platforms, which include BBC News, 7news, University World News, and Mirage News. The analysis was completed by taking interviews from stakeholders belonging to various sectors of the transport industry. In the air travel sector, we conducted interviews with aviation experts, airport workers, and managers. To analyse the freight transport, we interviewed freight transport providers, freight vehicle drivers, and freight suppliers. To examine the impact of COVID-19 on public transport, we interviewed transport companies’ managers and operators of public transport as well as the public to study their current behaviour and future preferences regarding the public transport usage.

3. Impact on Australian Transport System

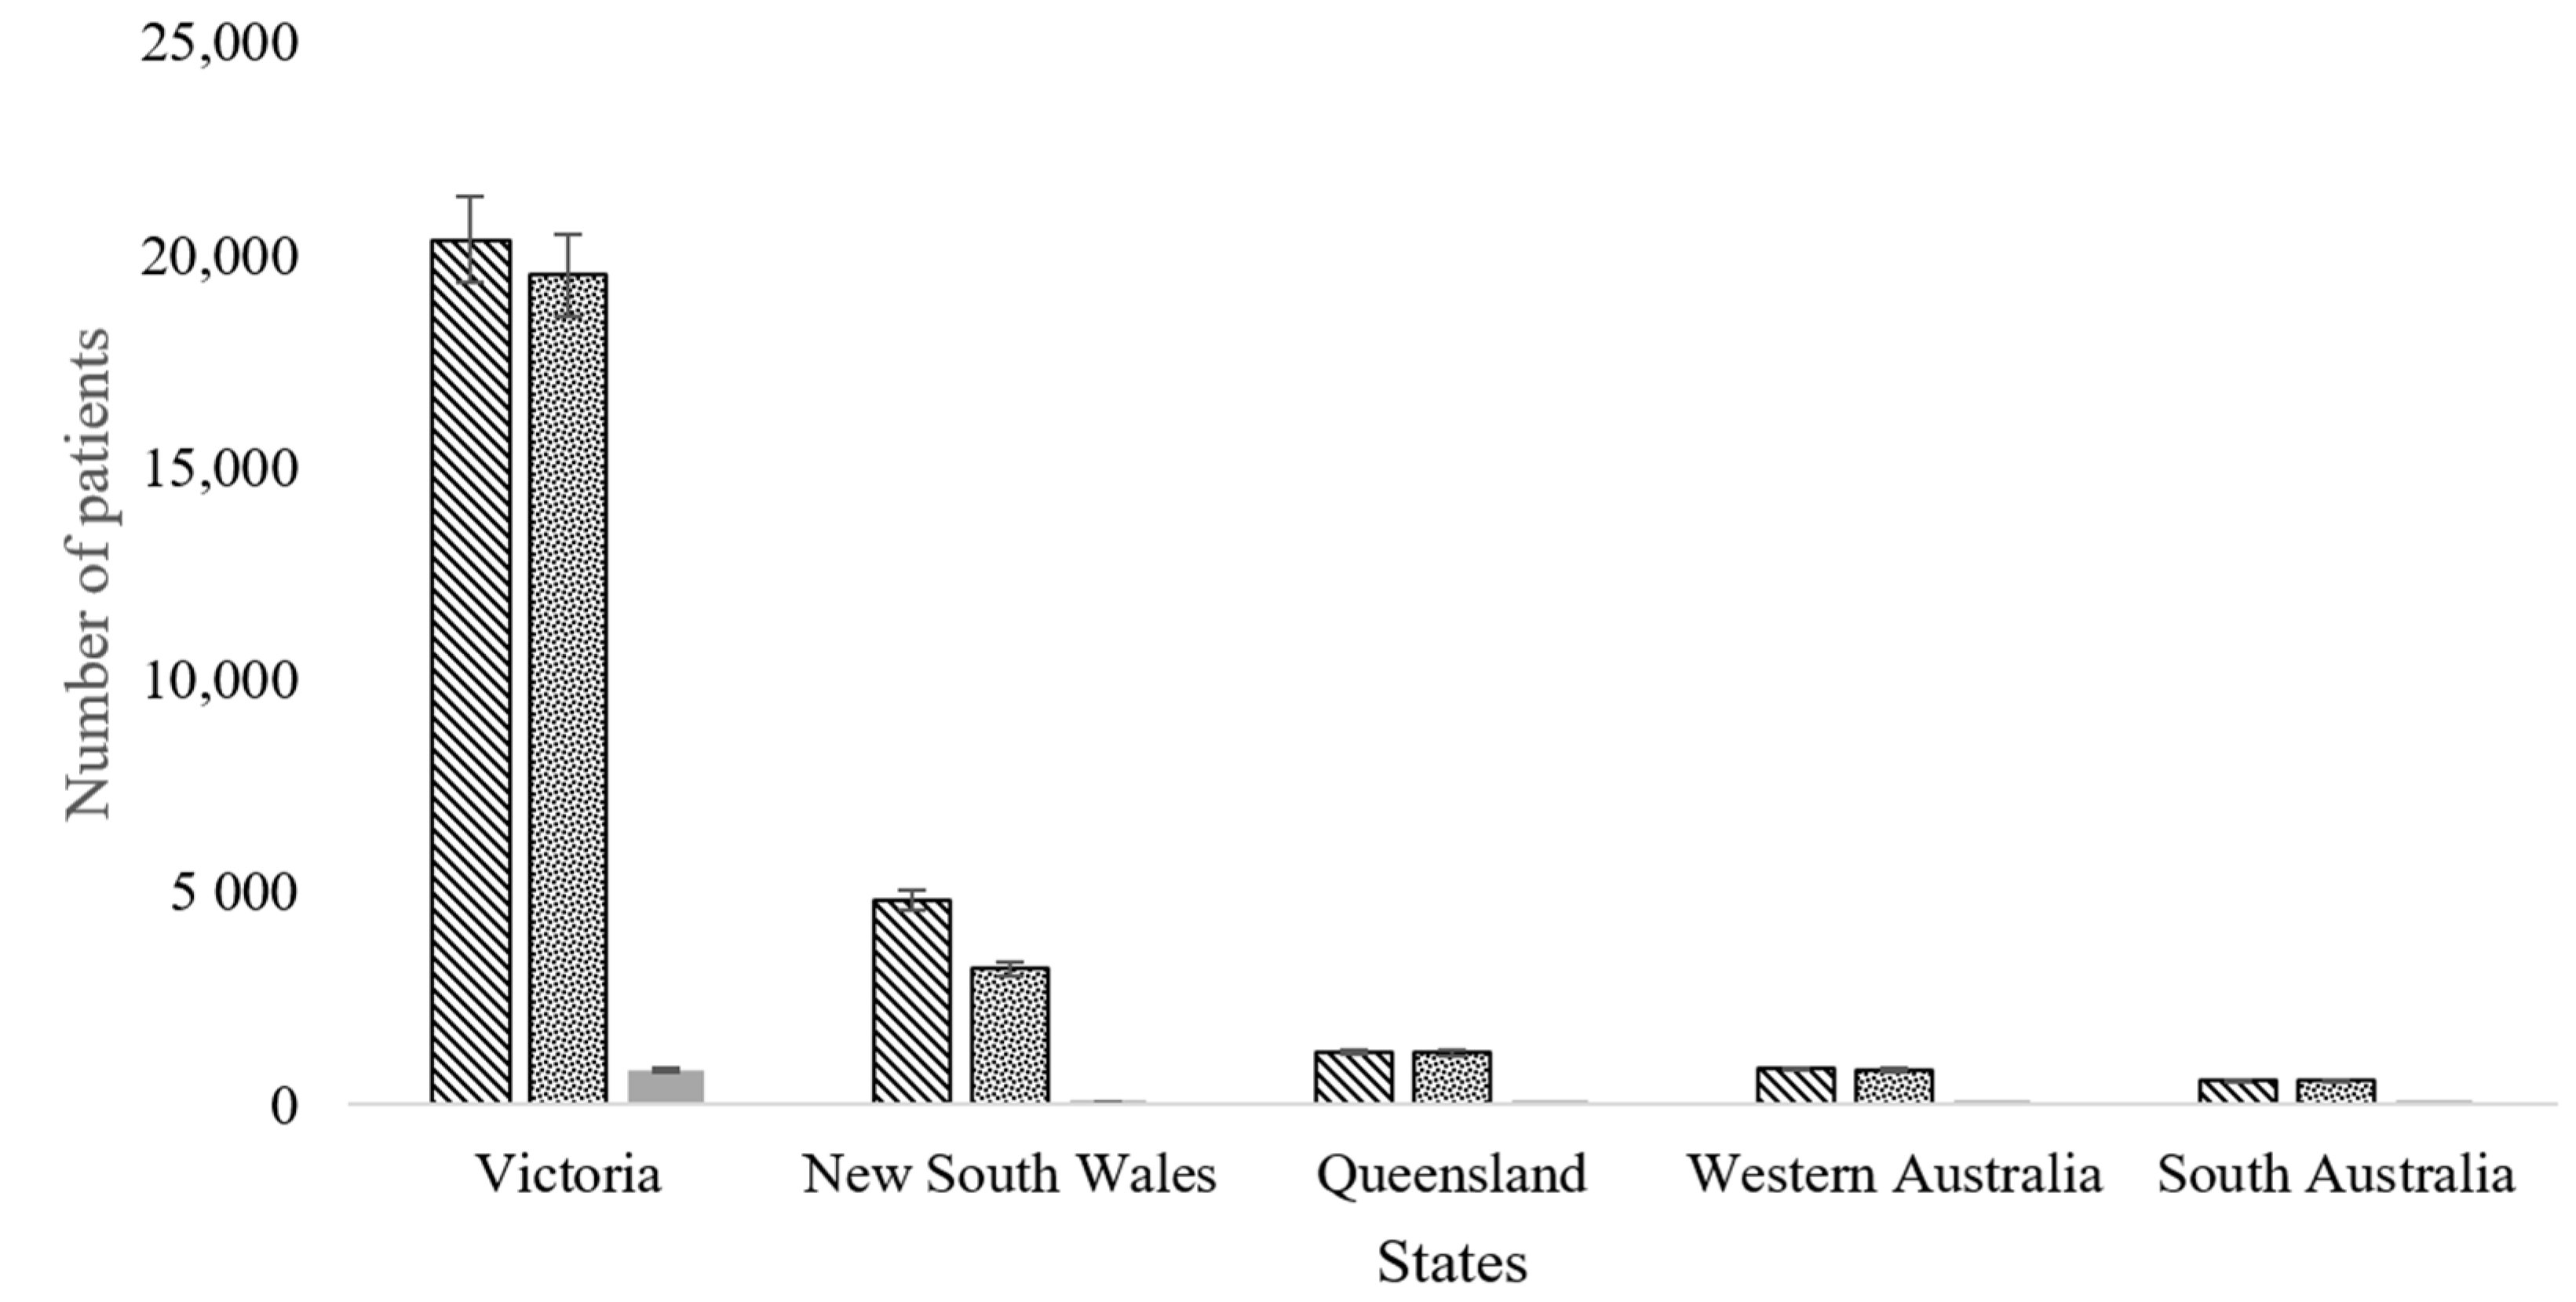
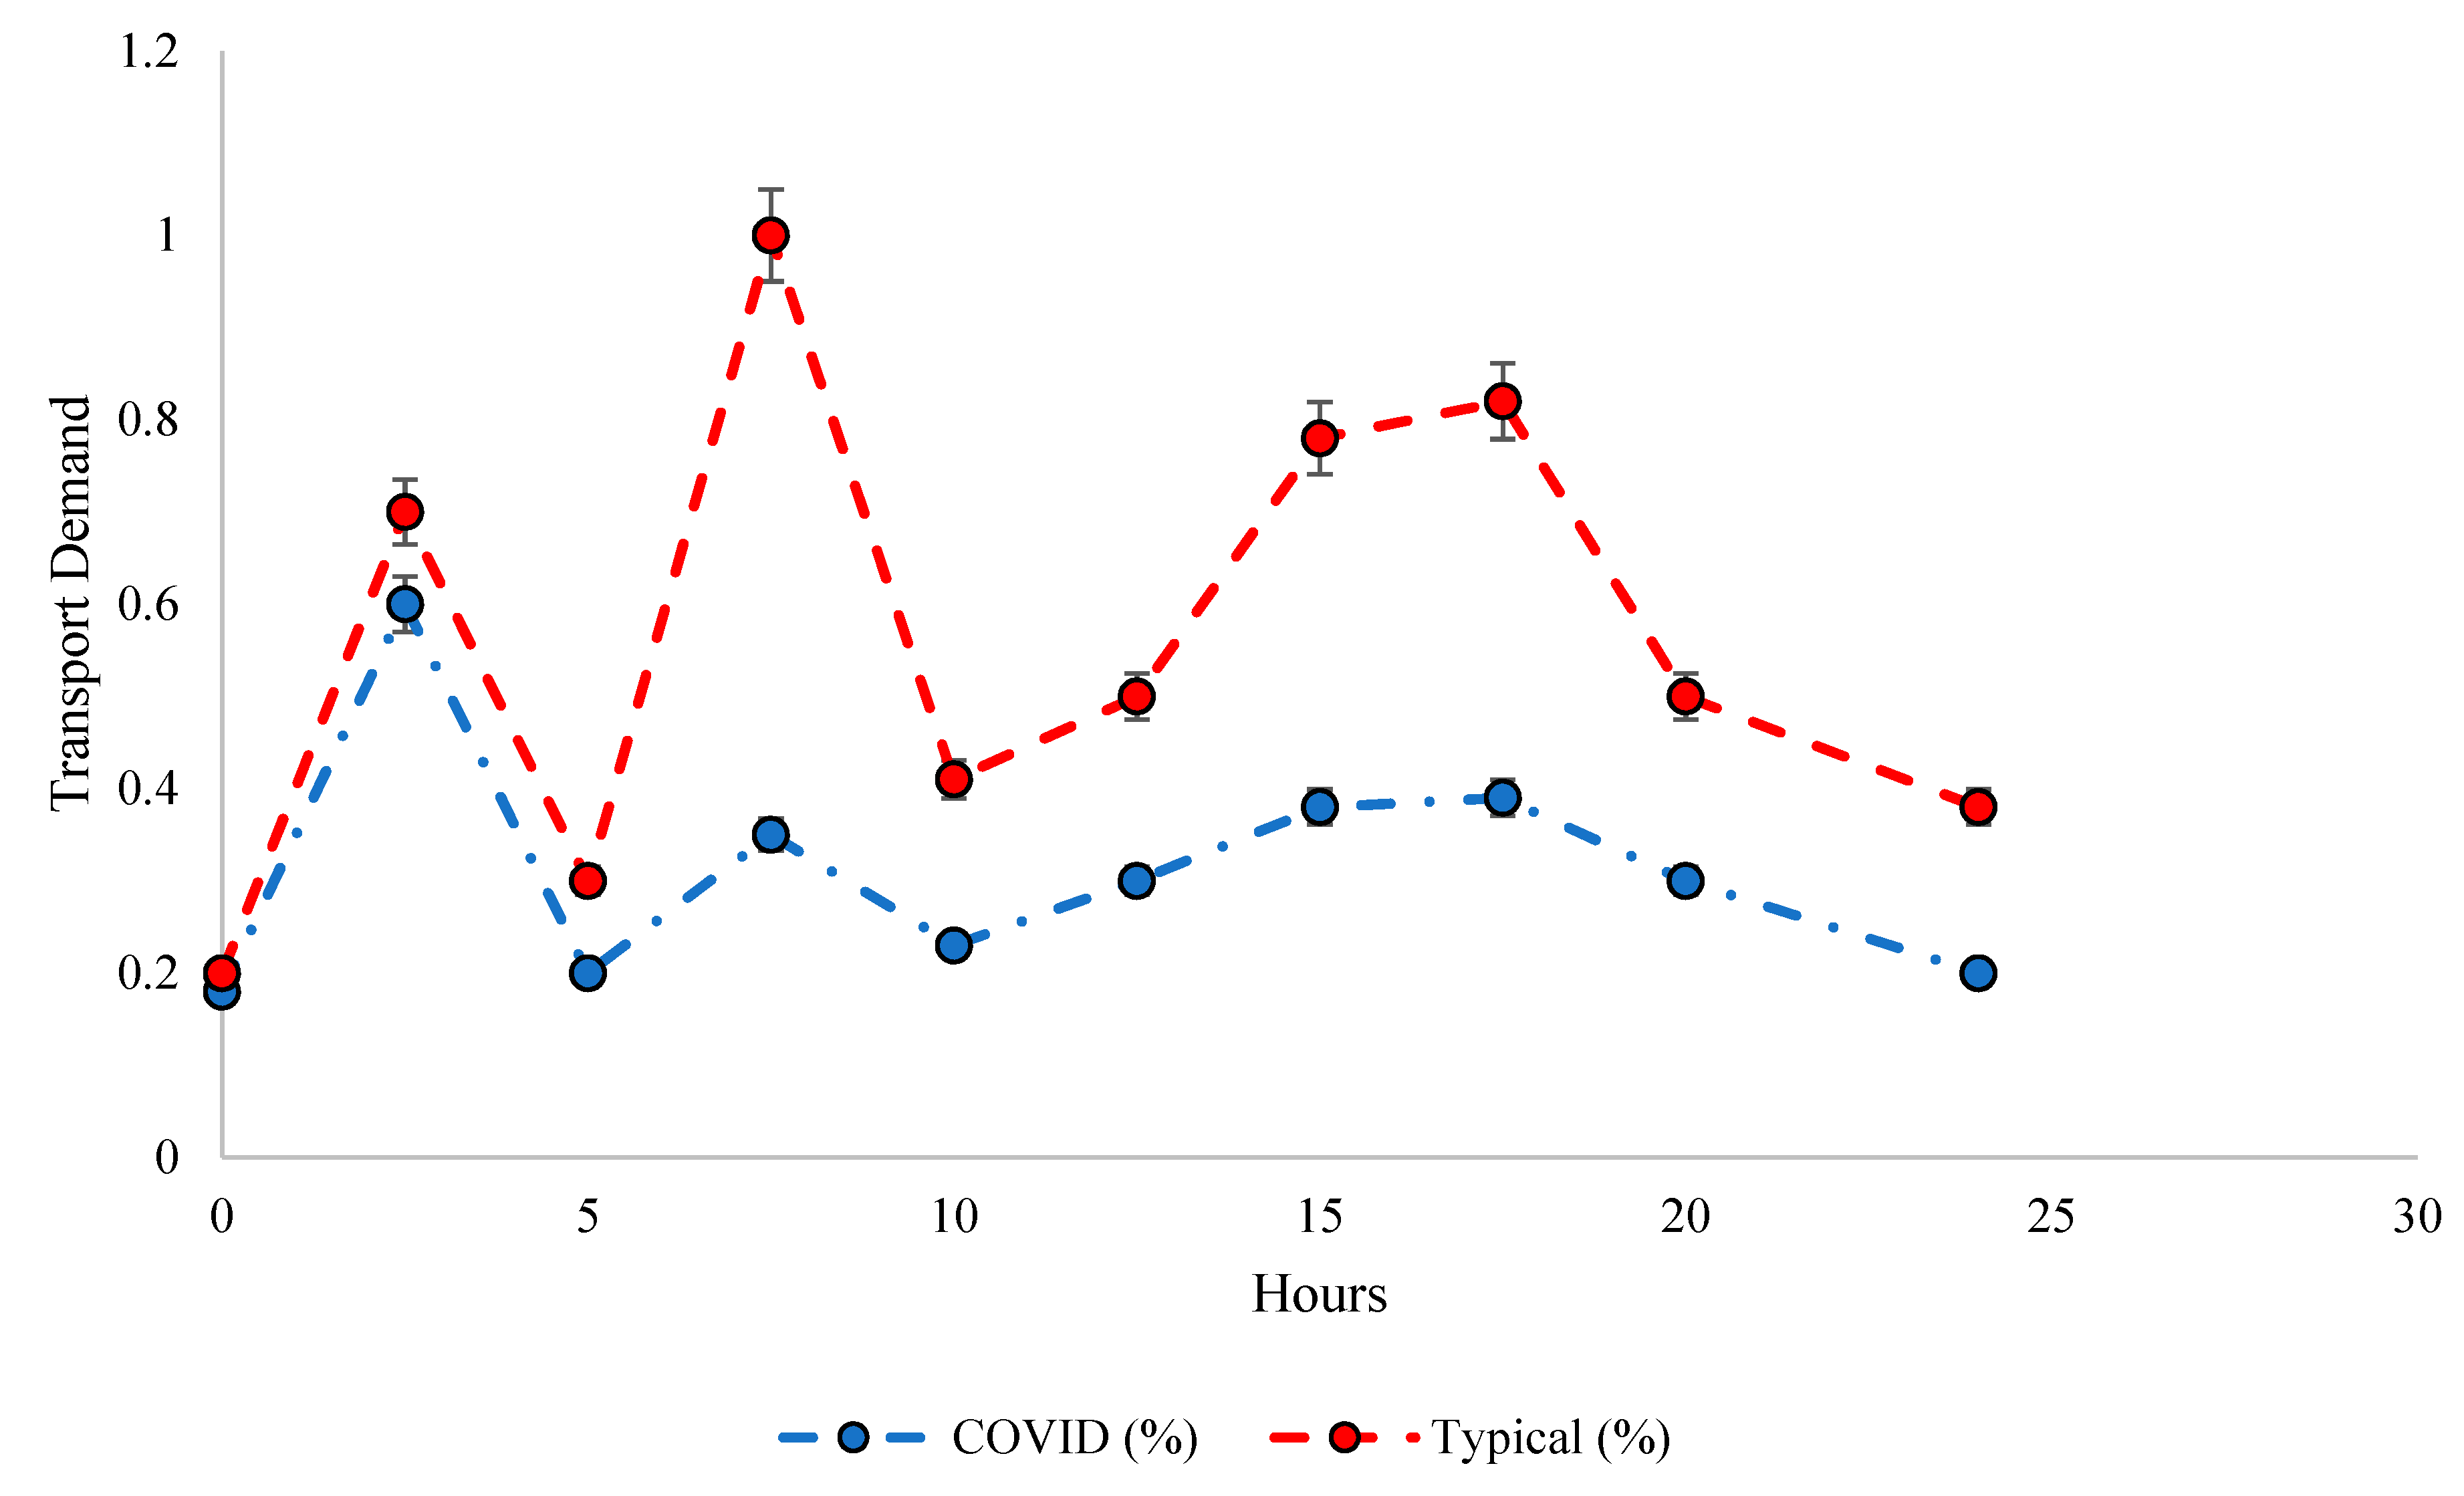
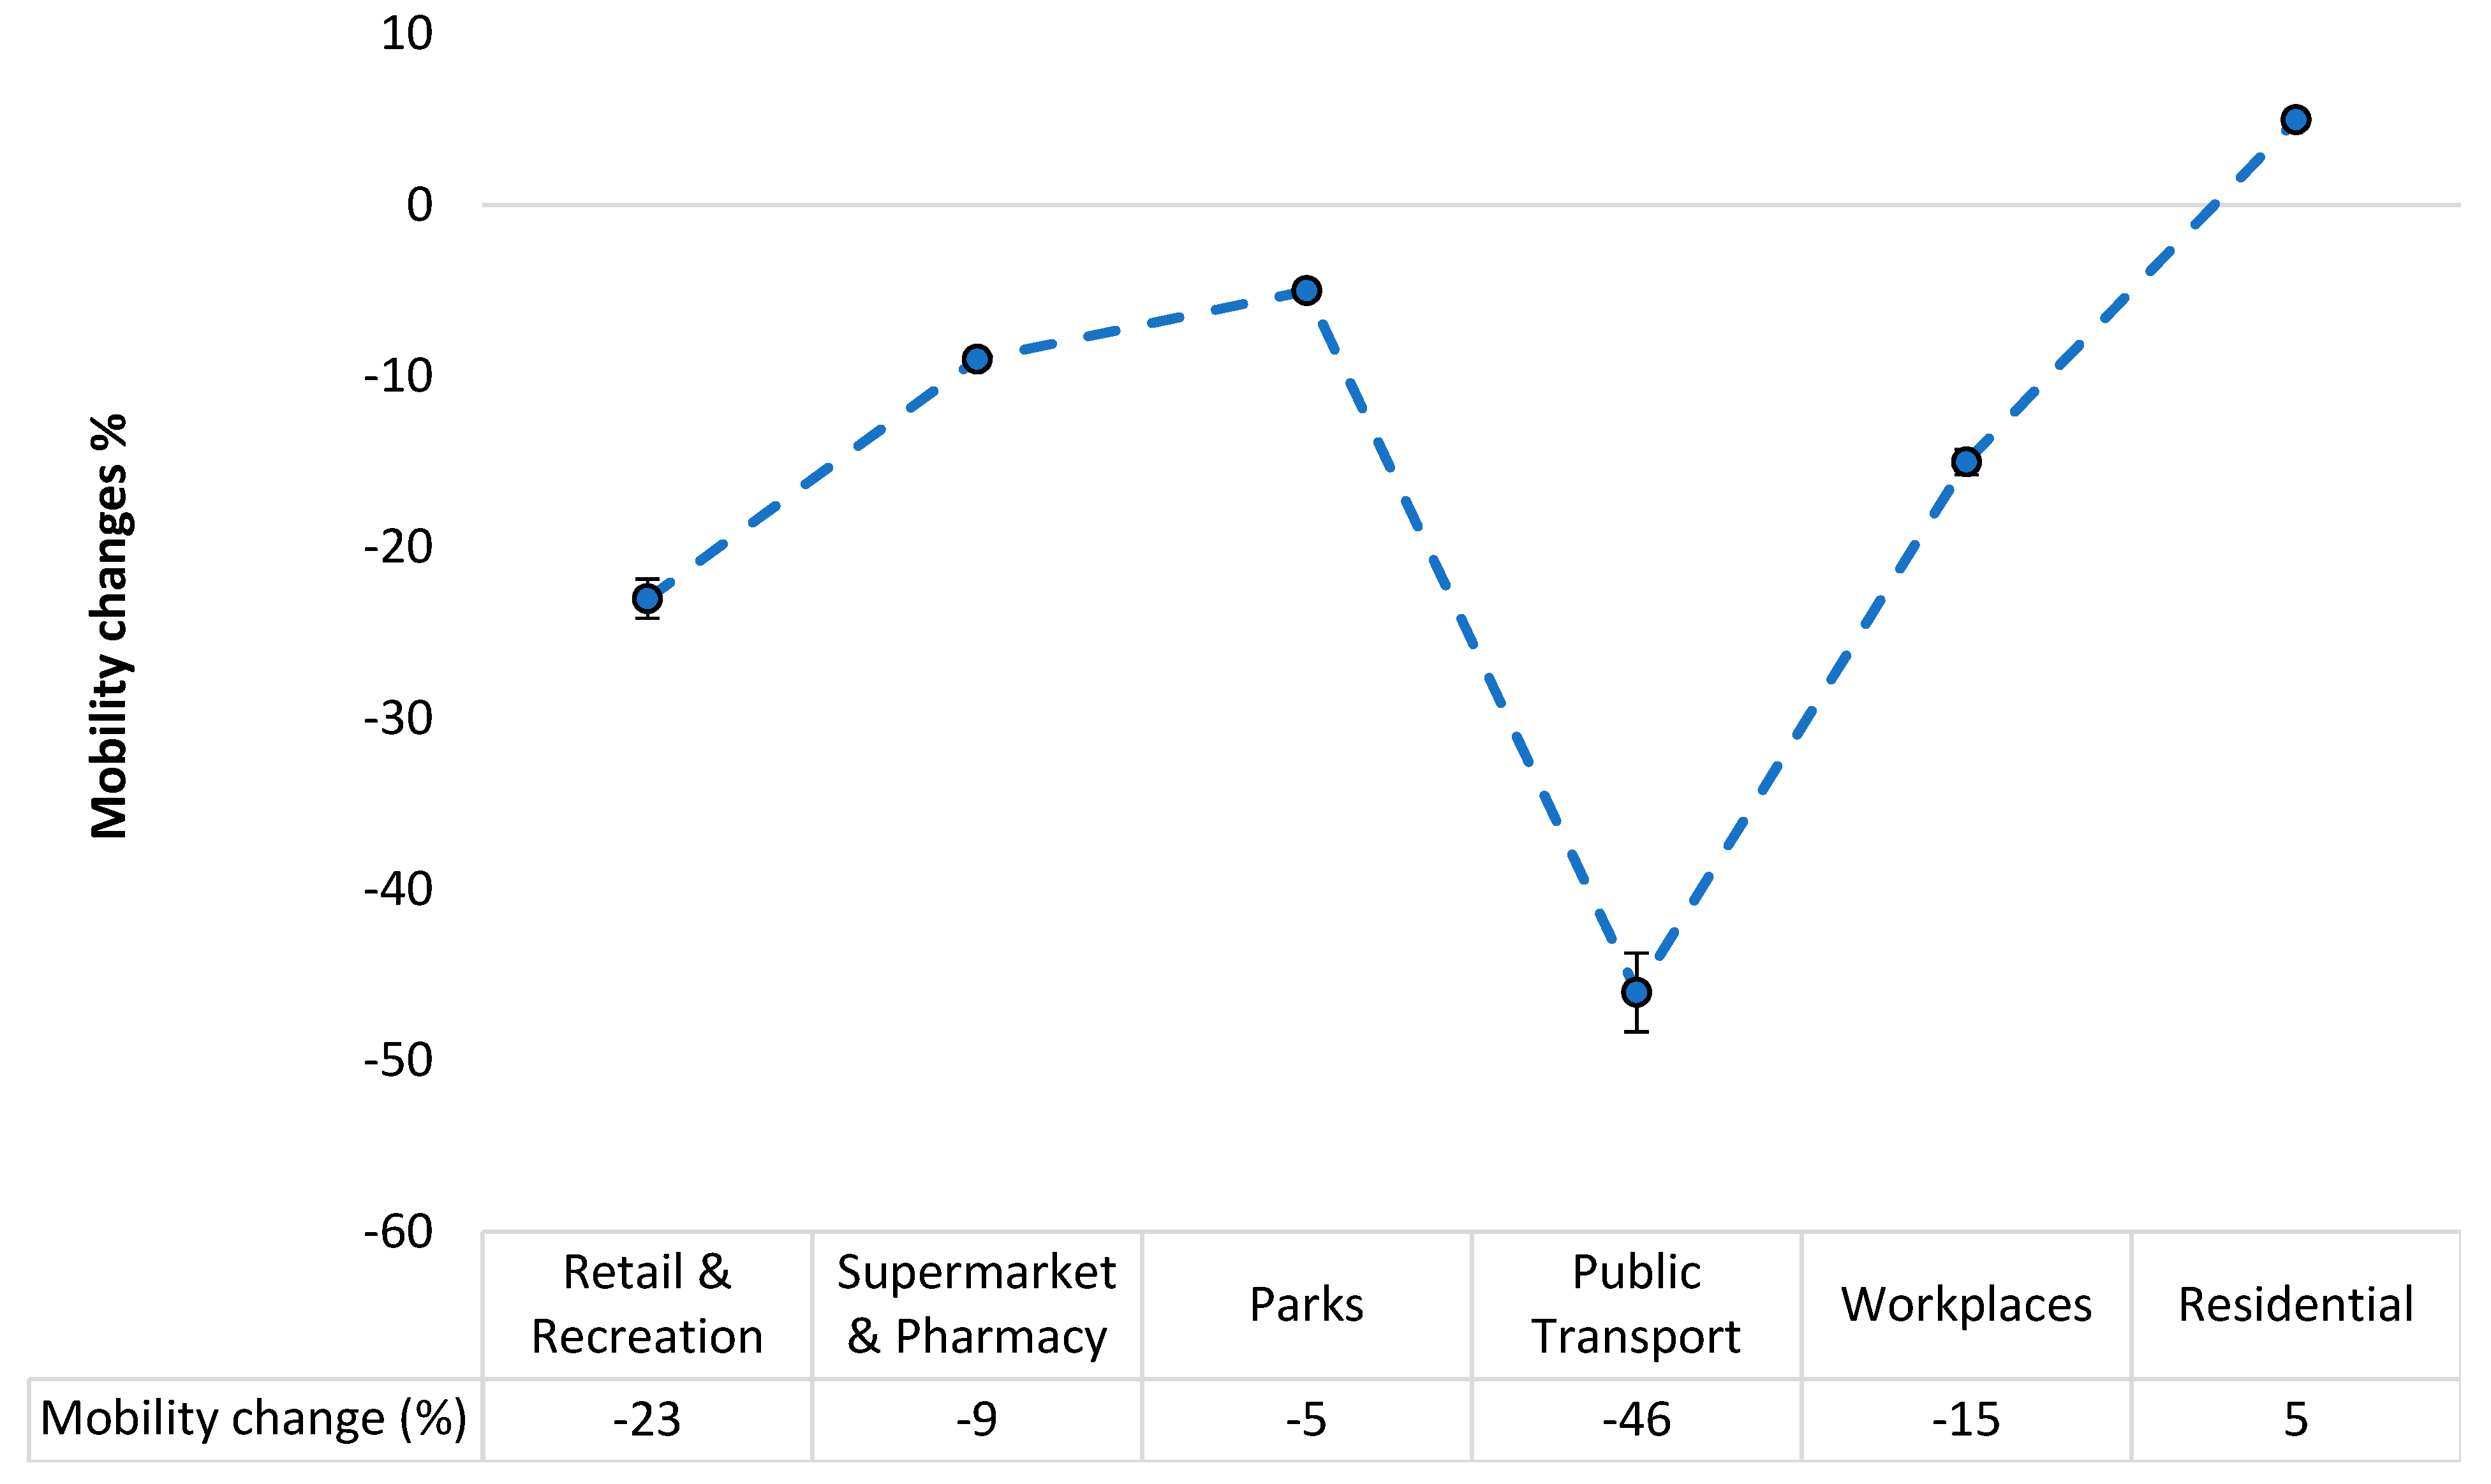
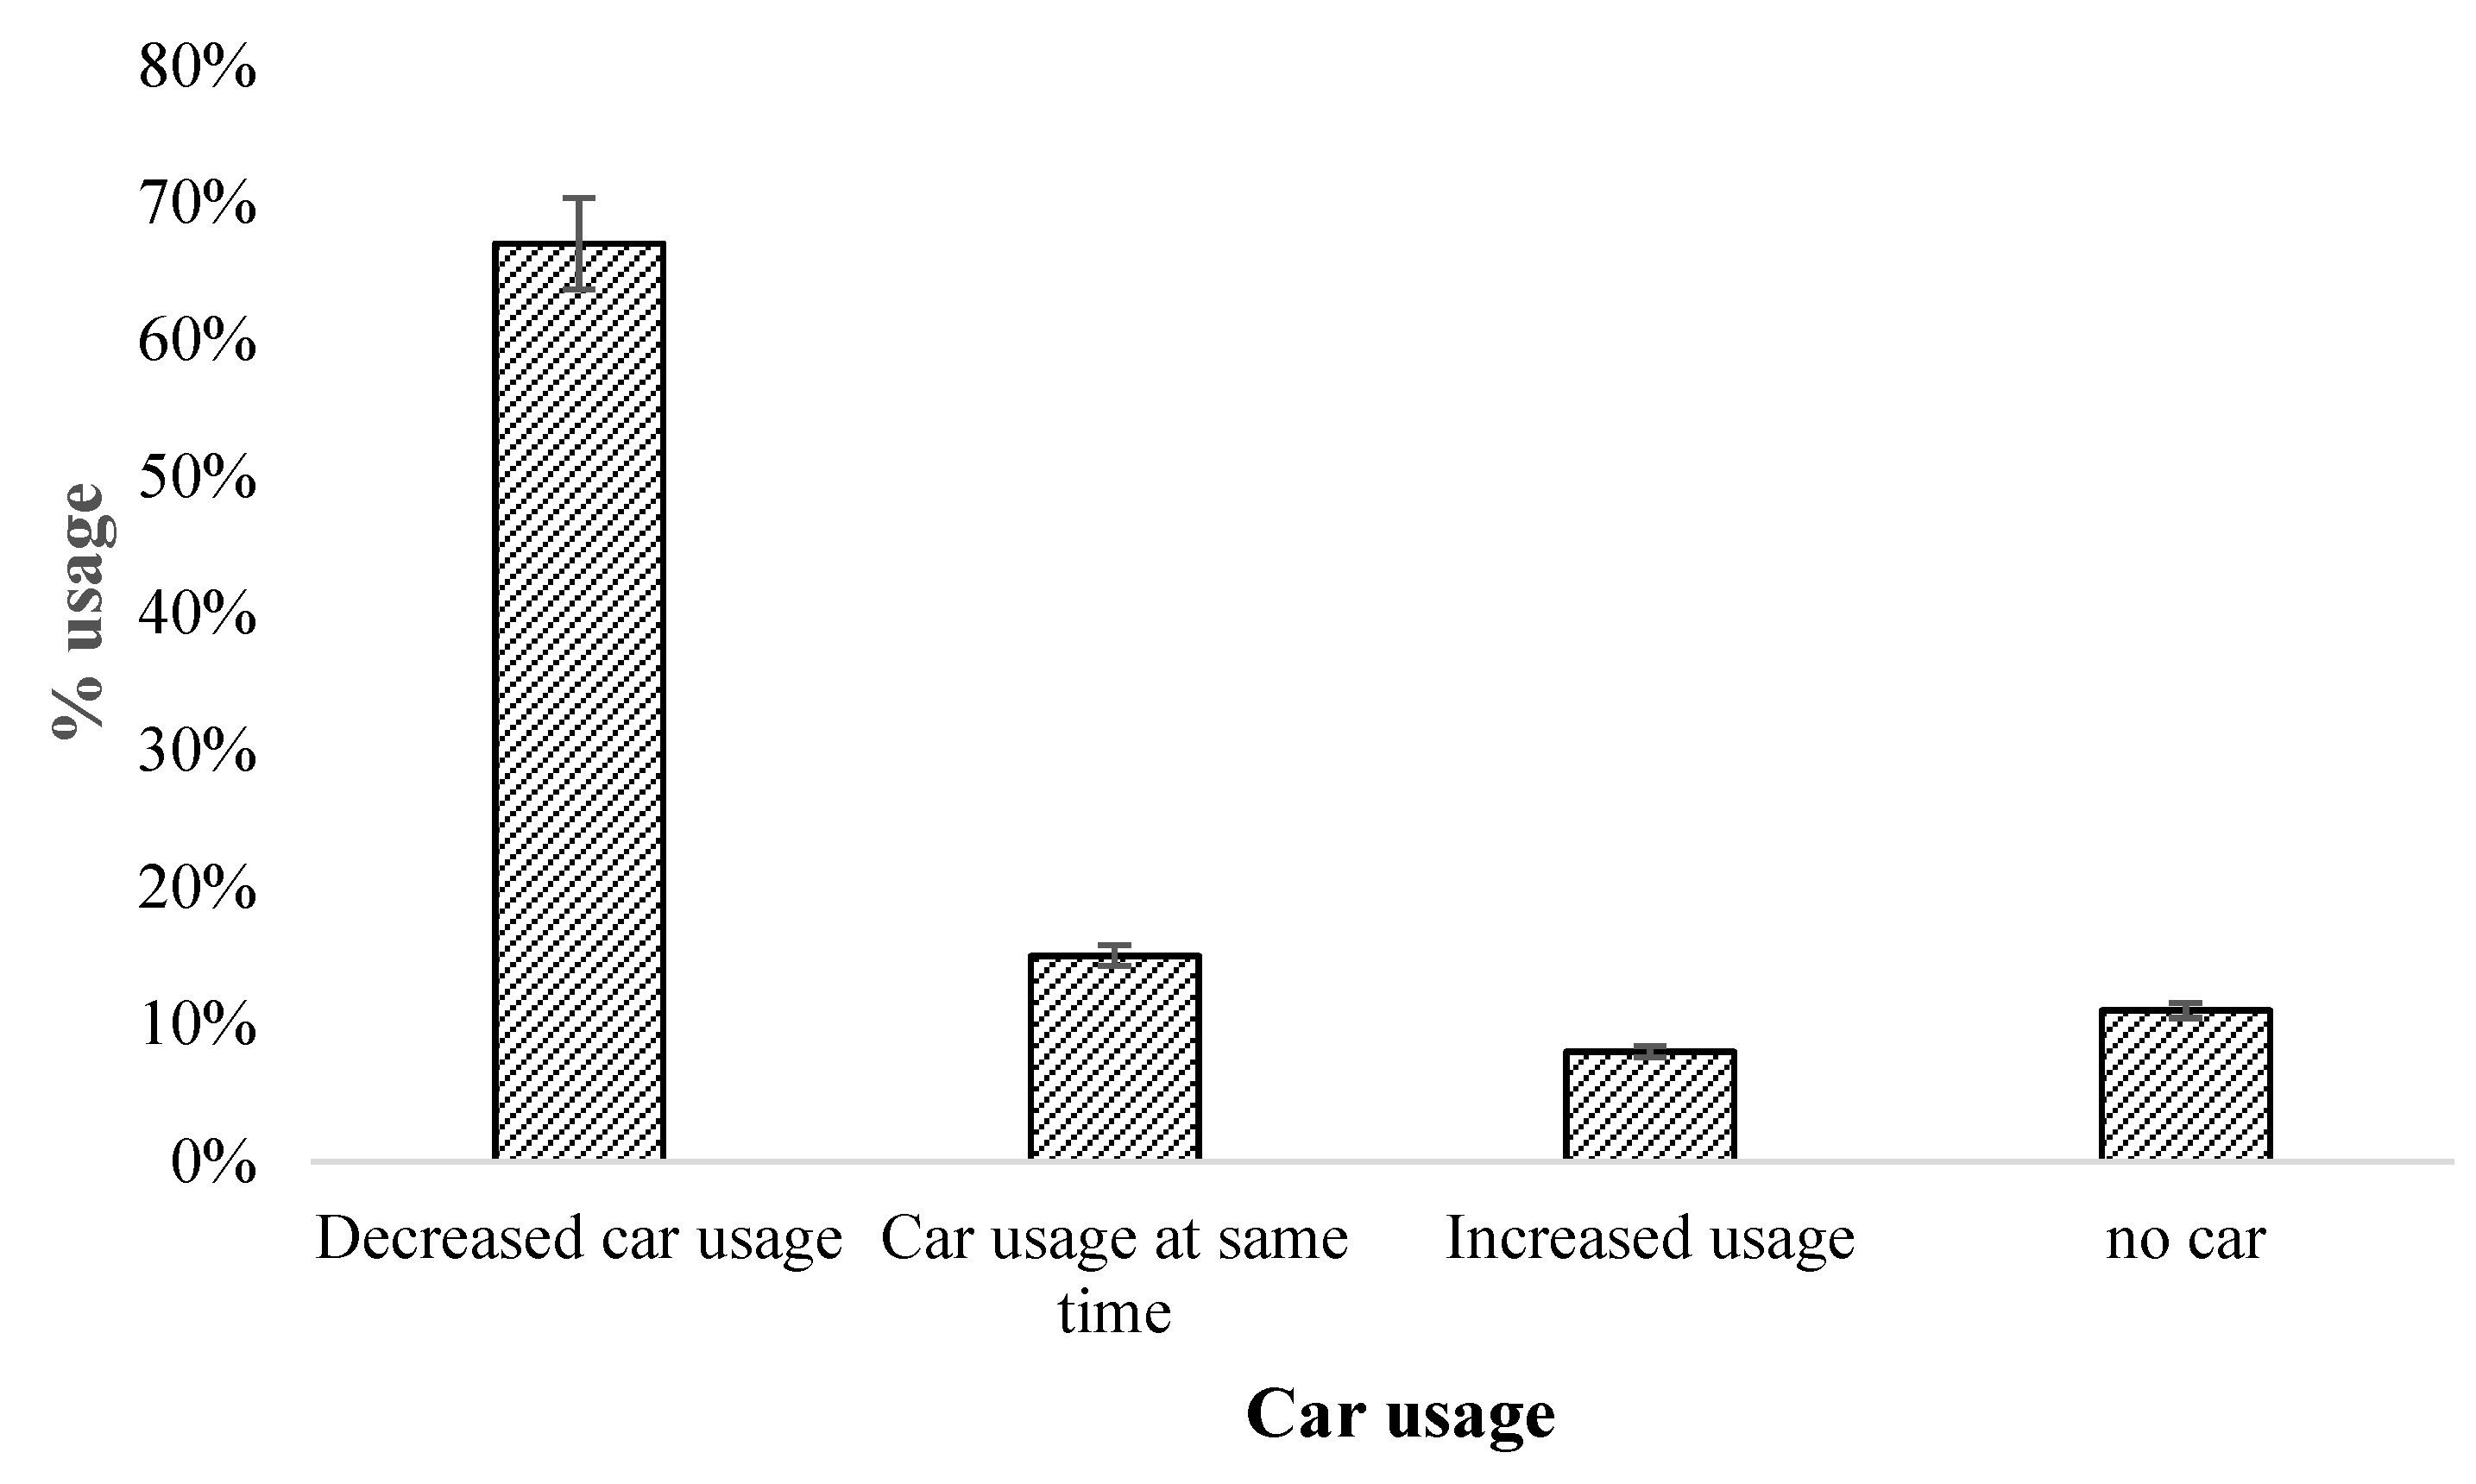
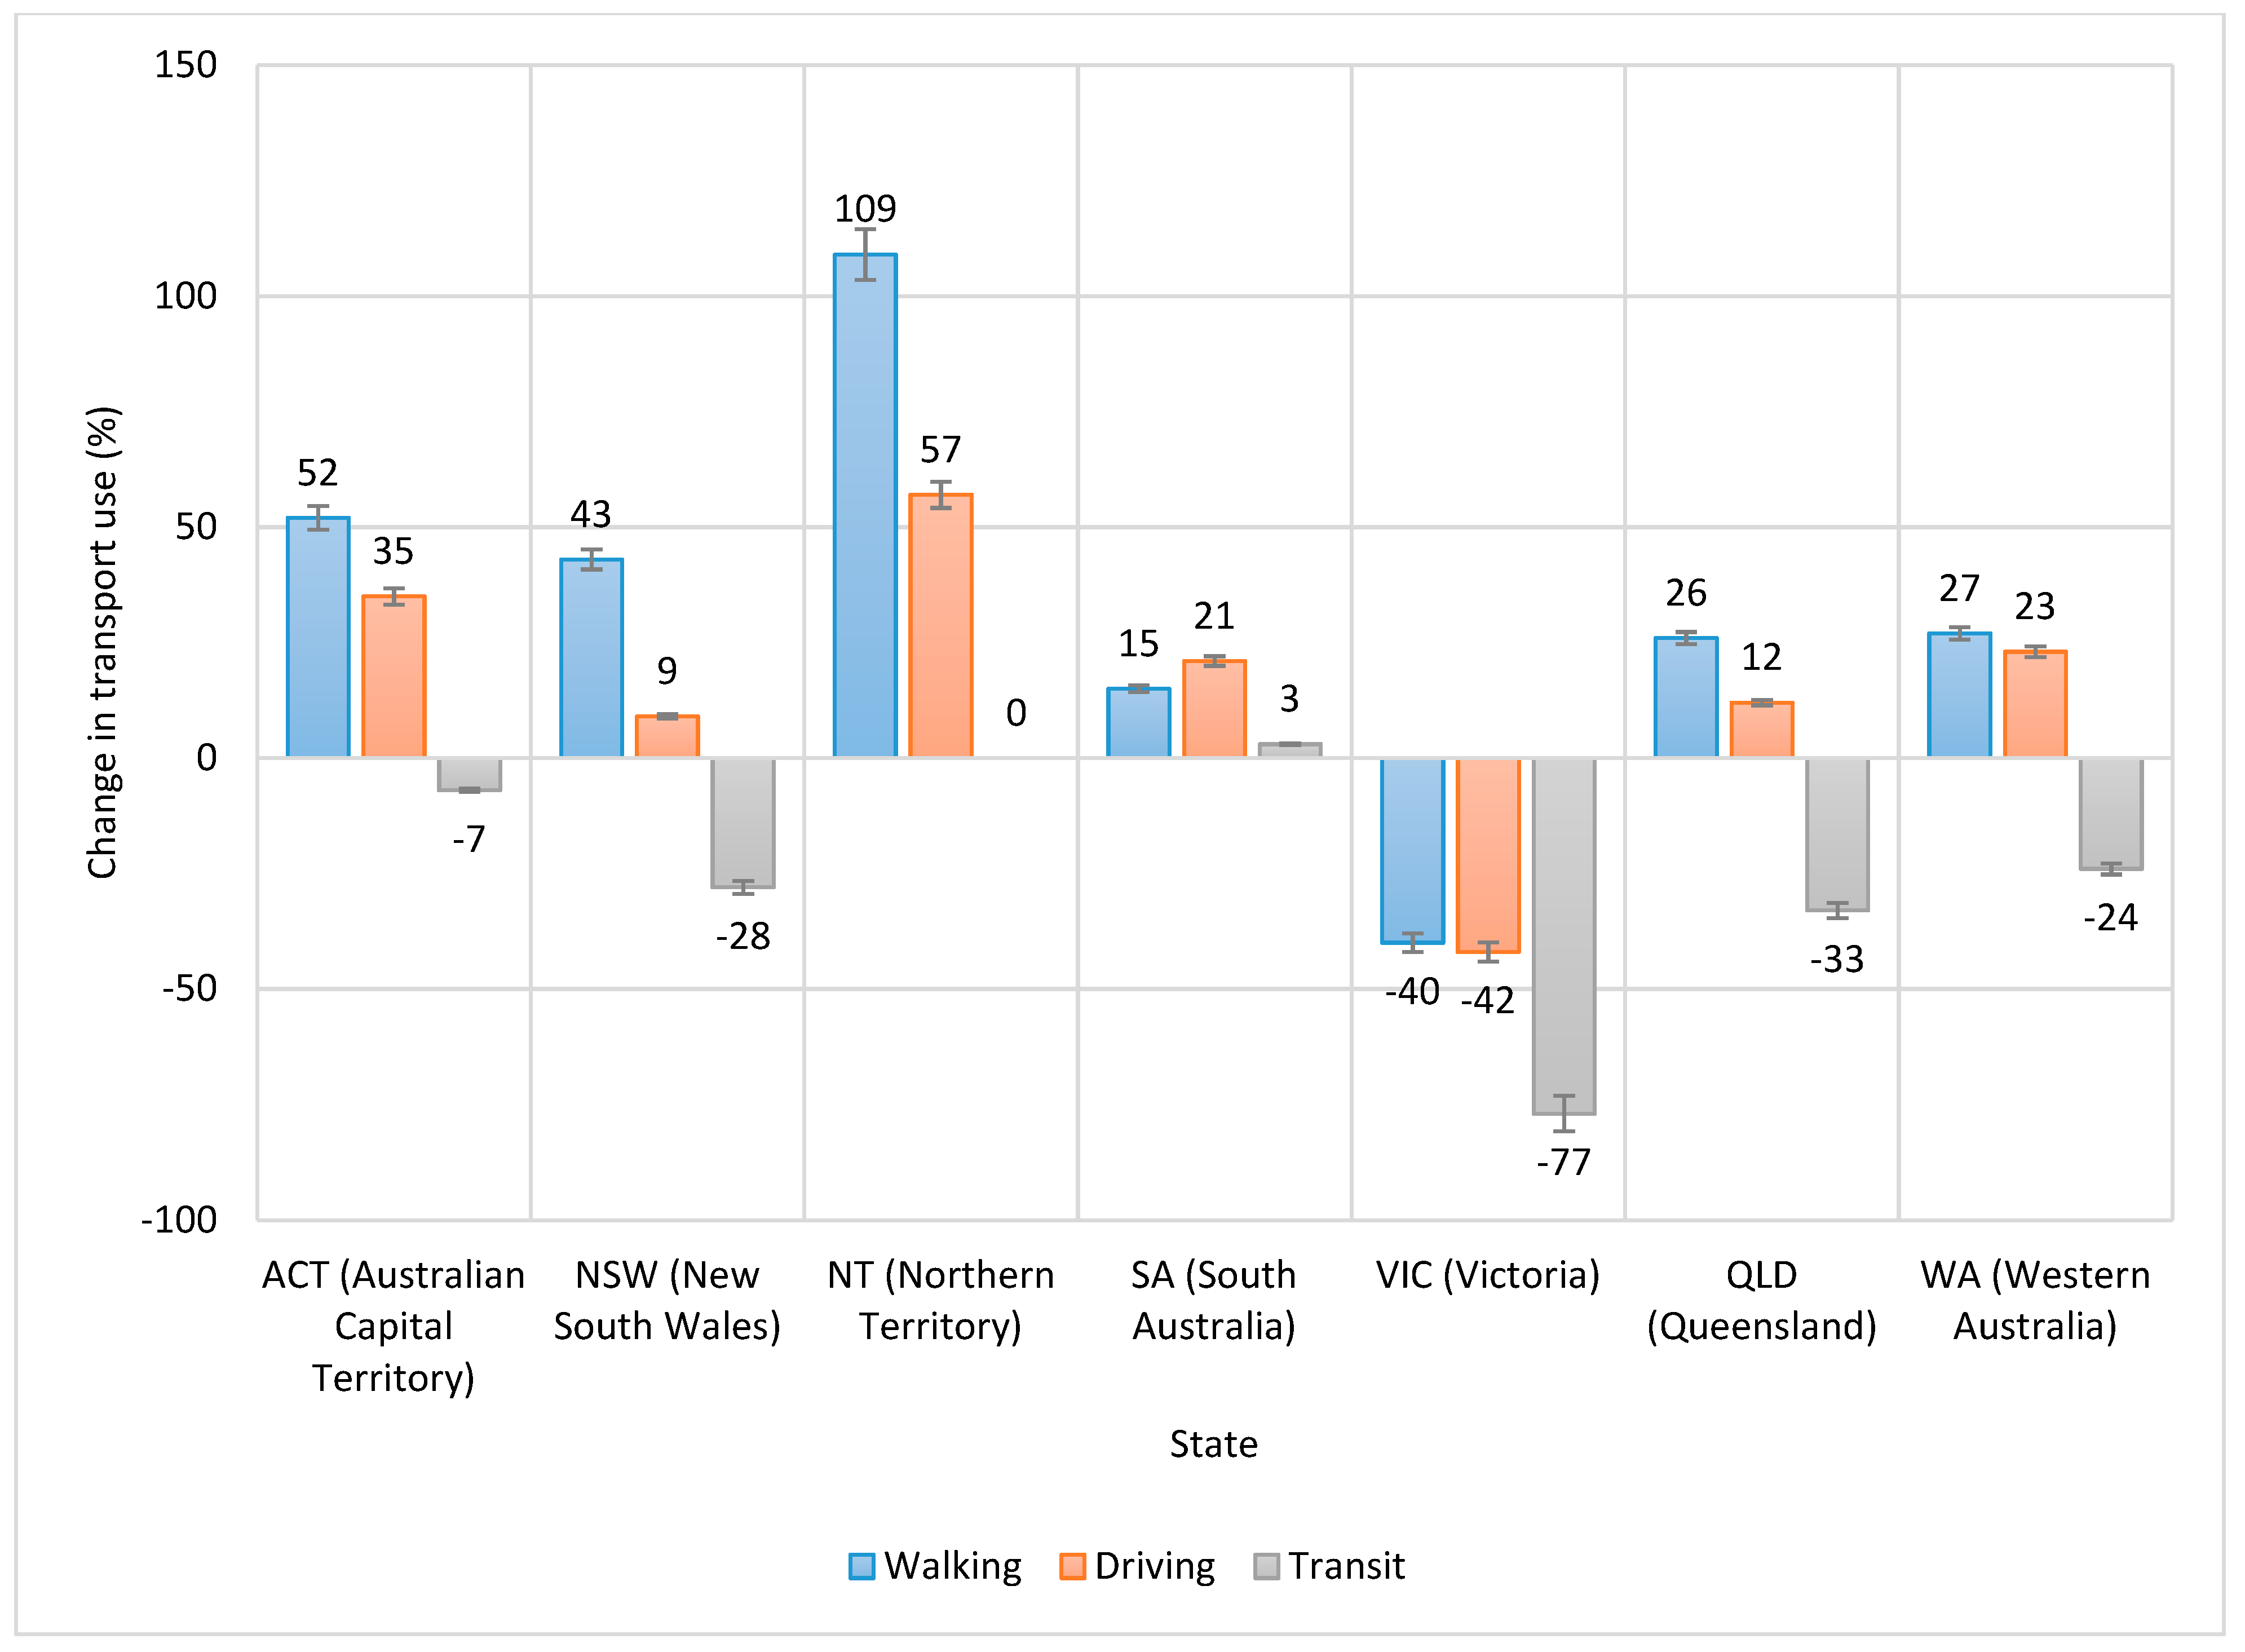
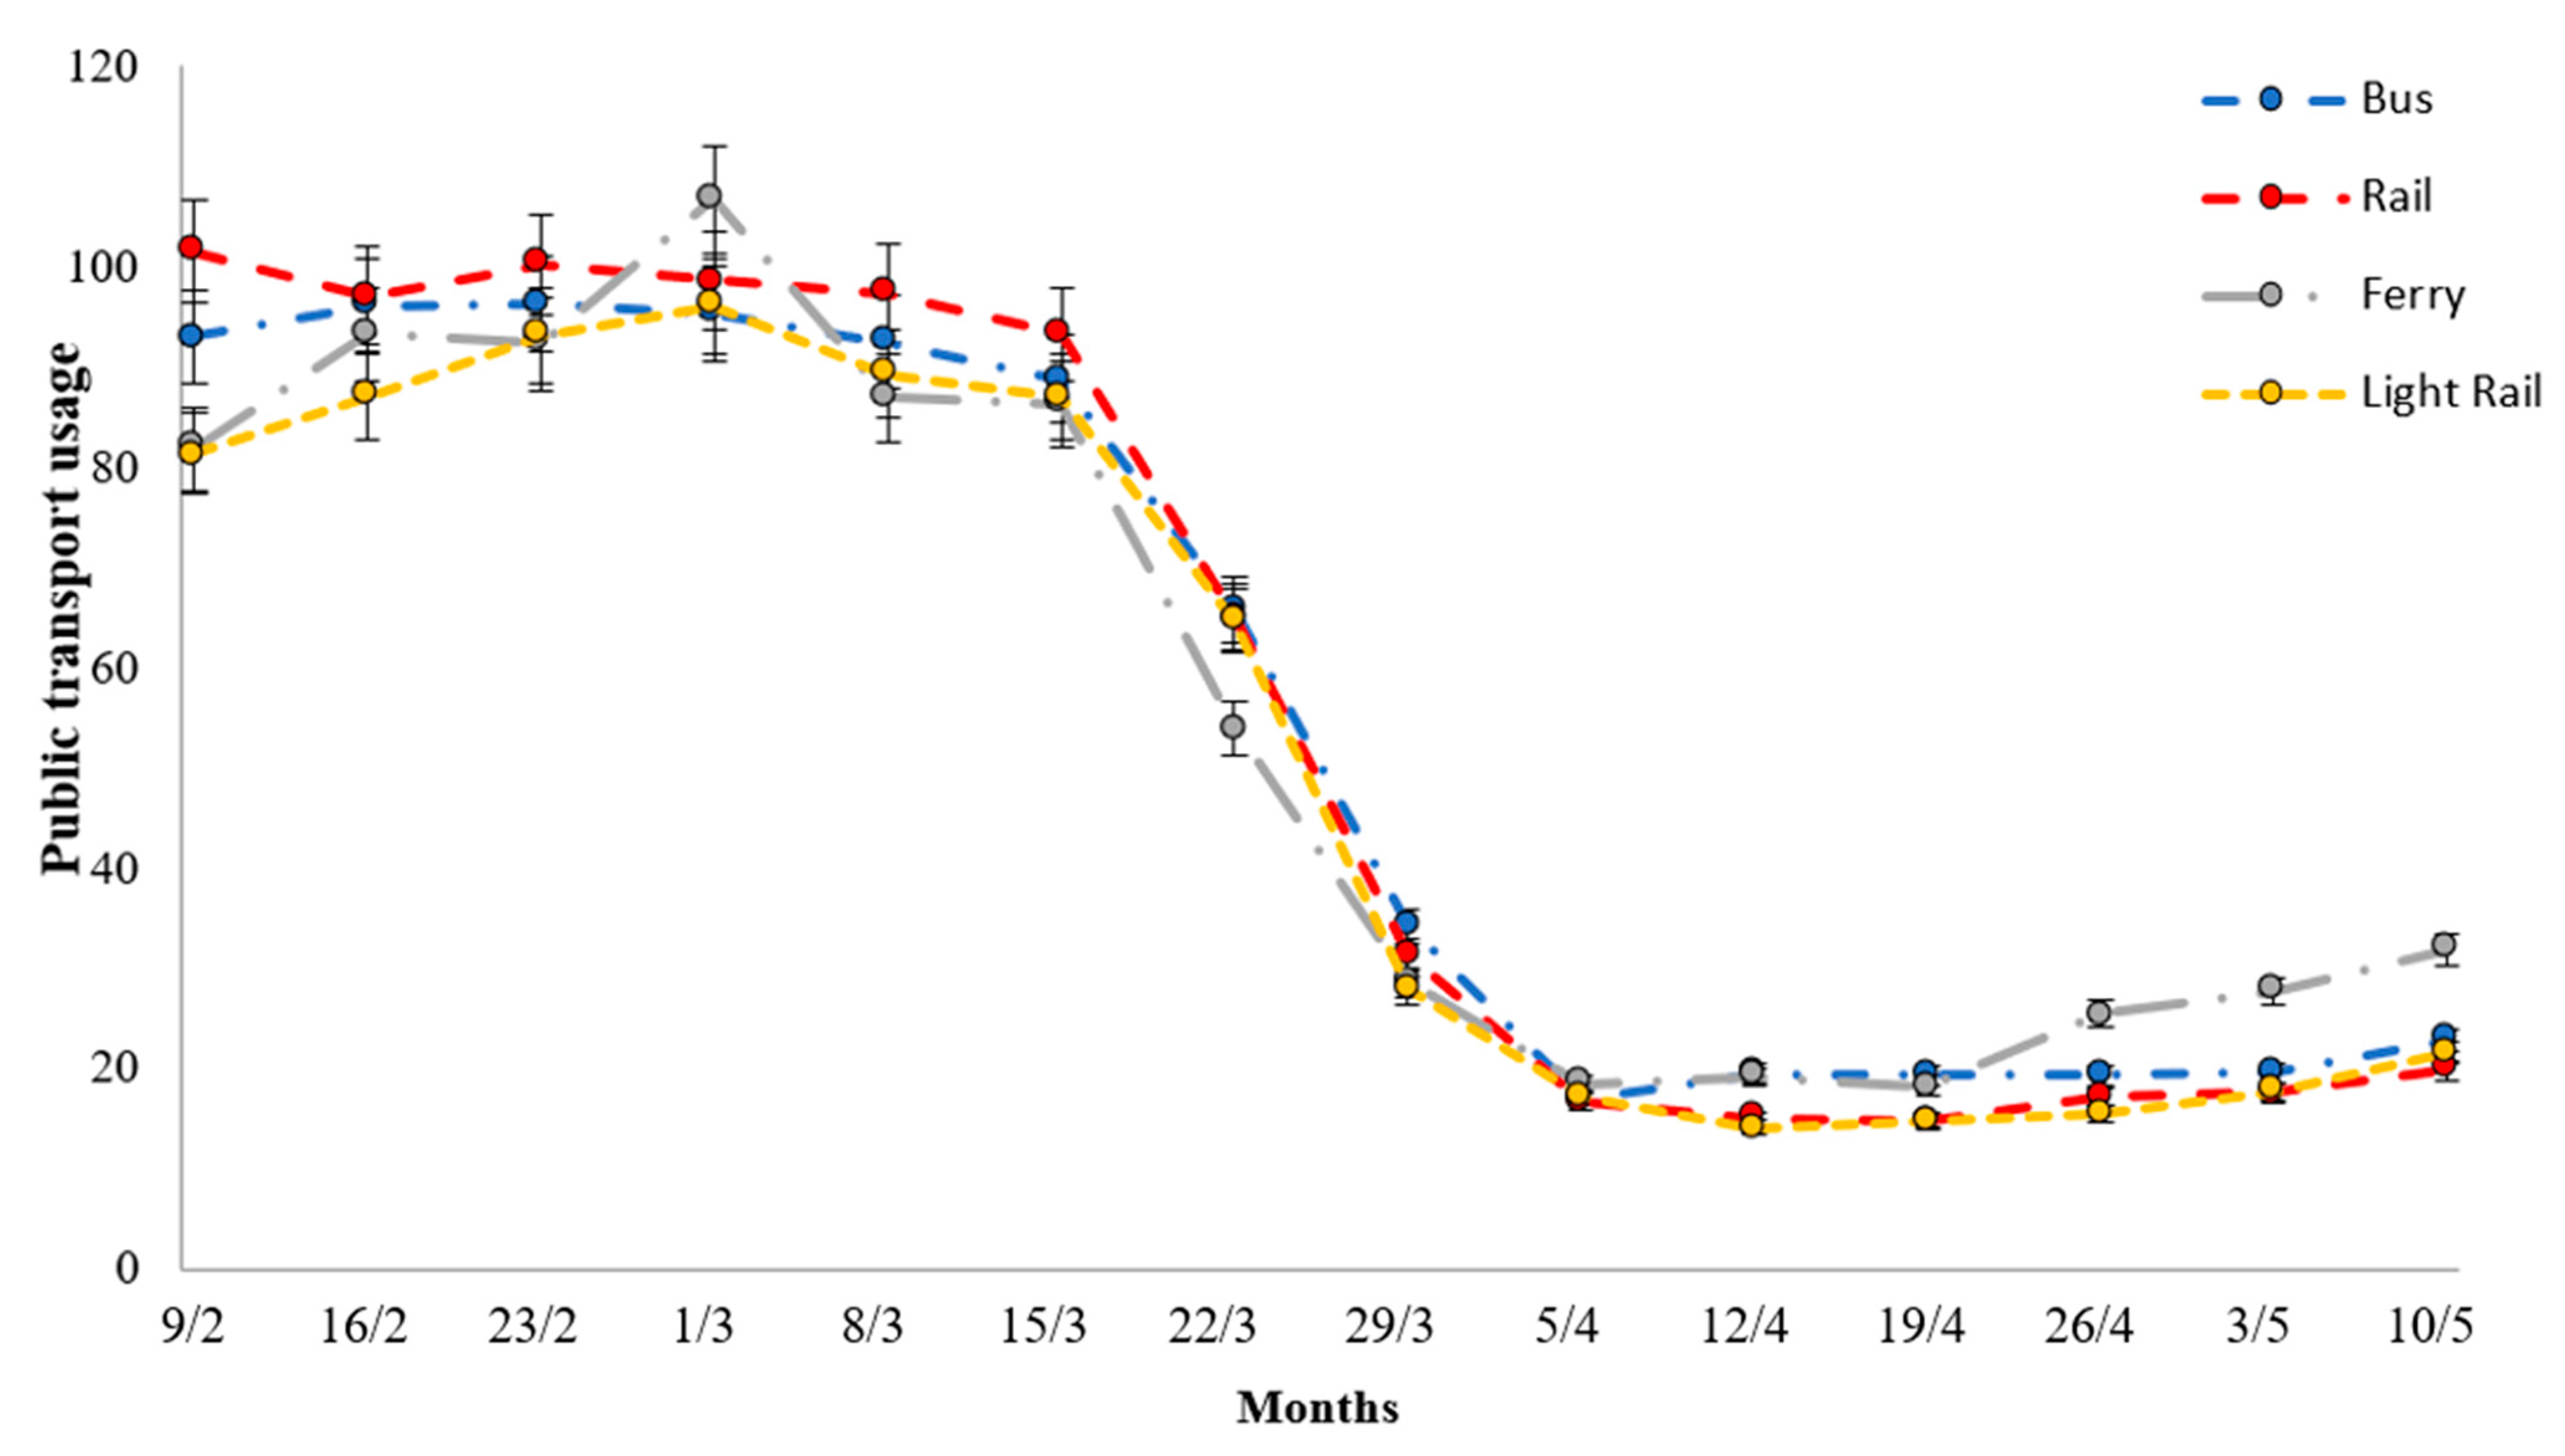
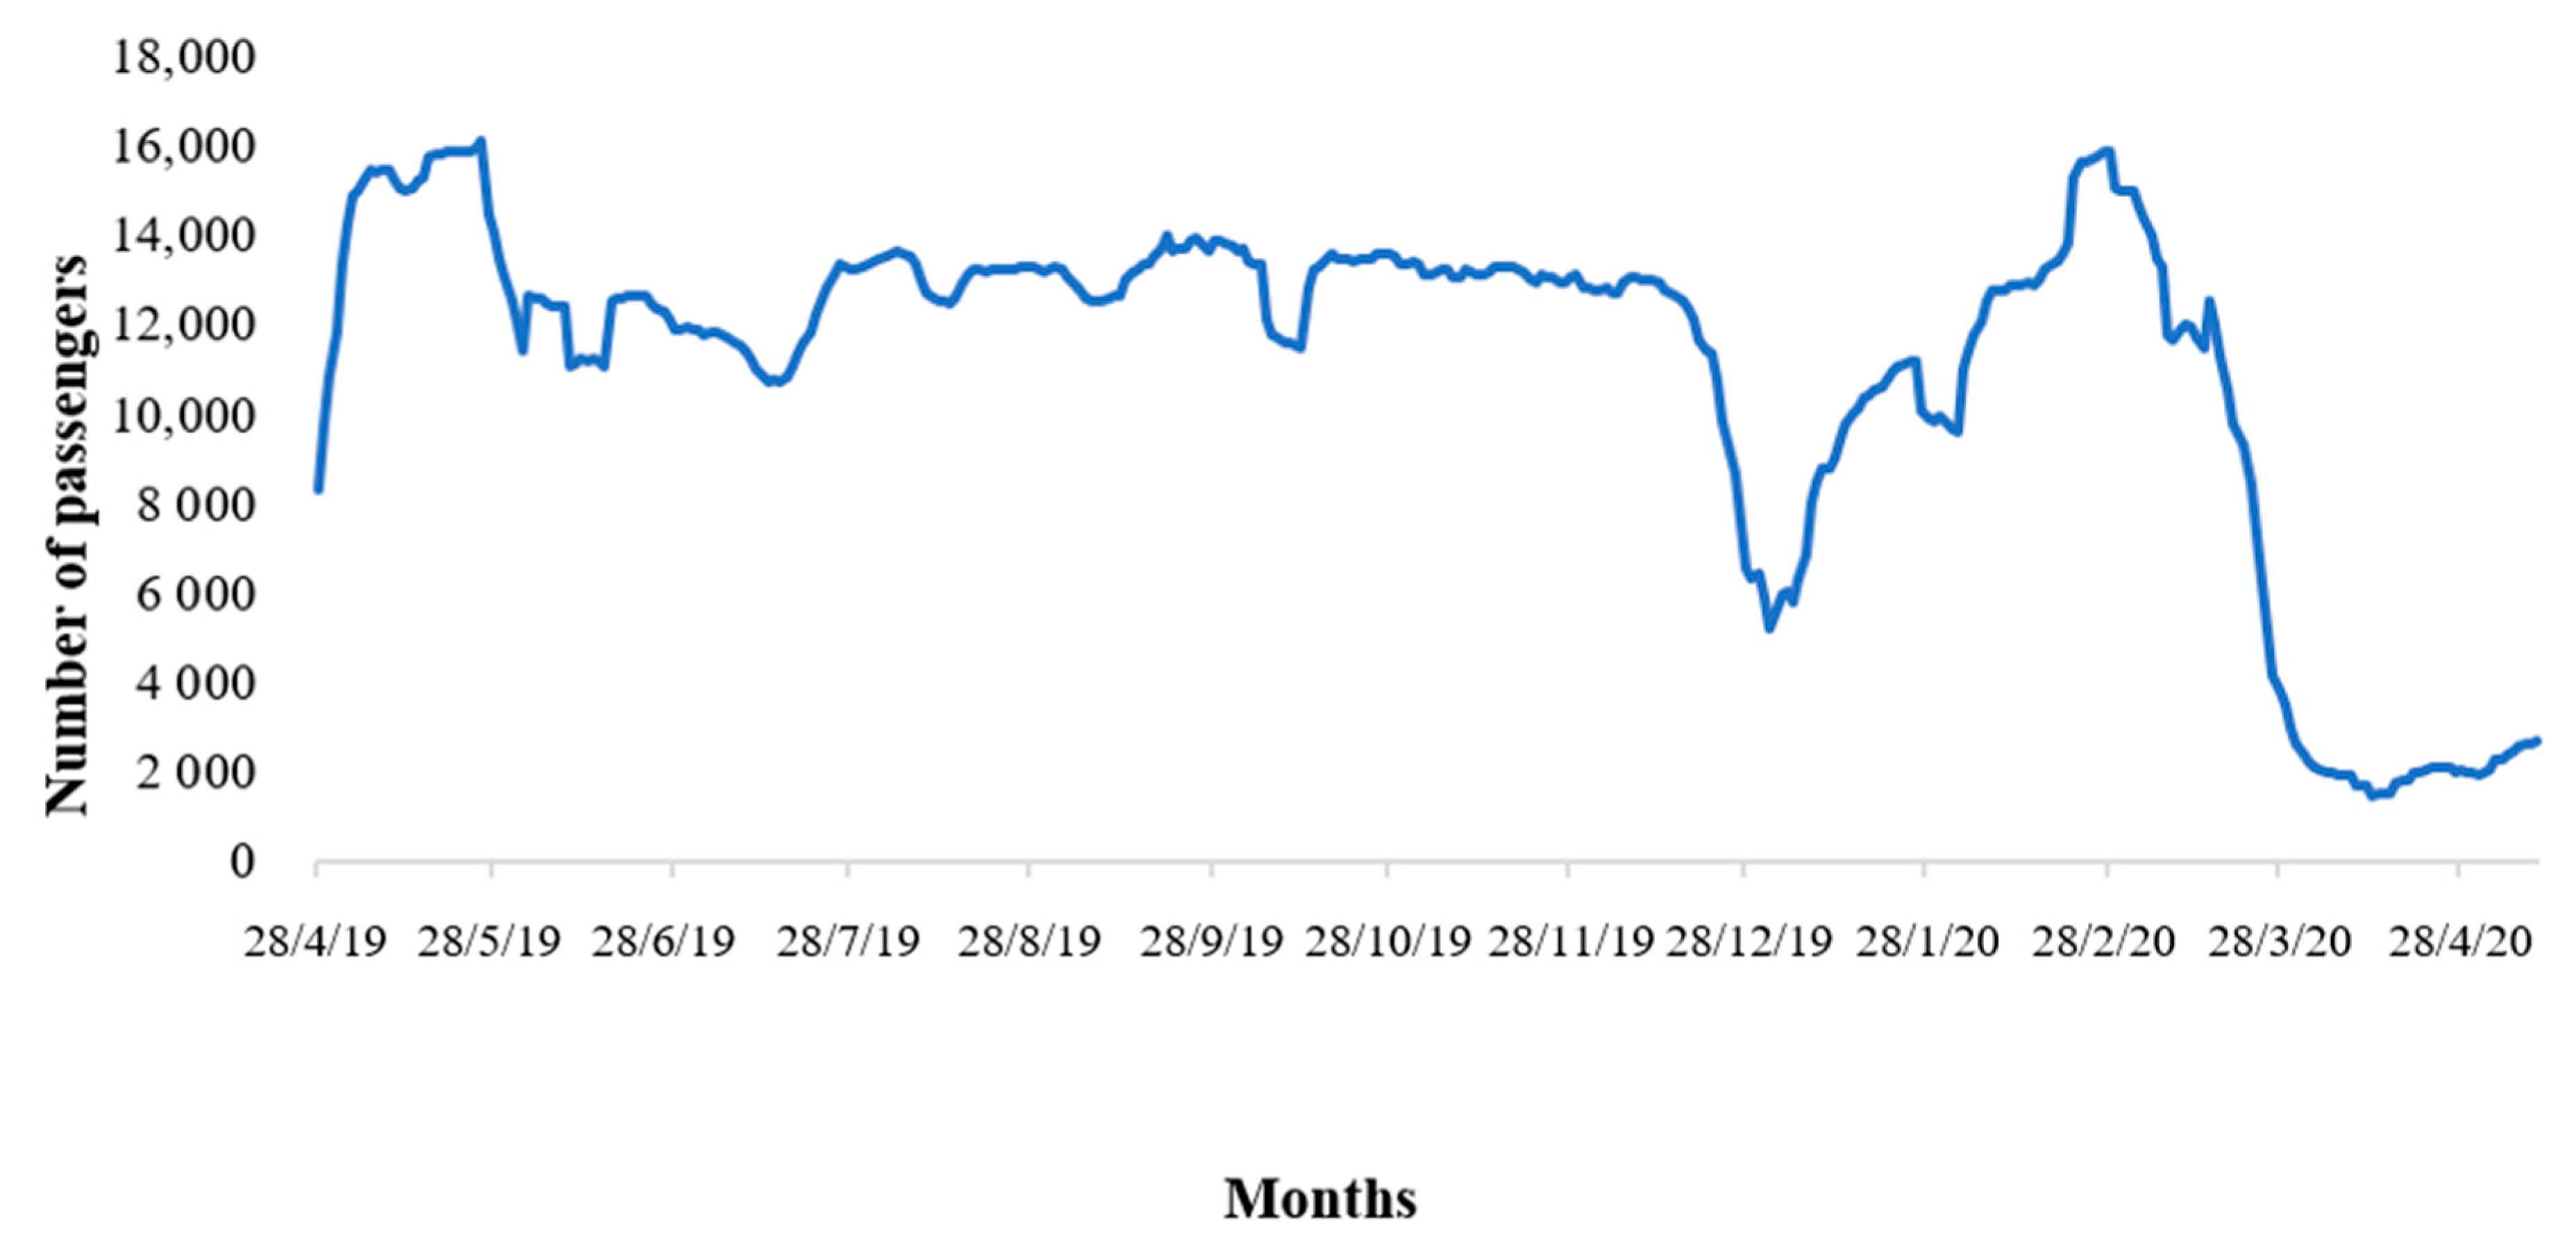
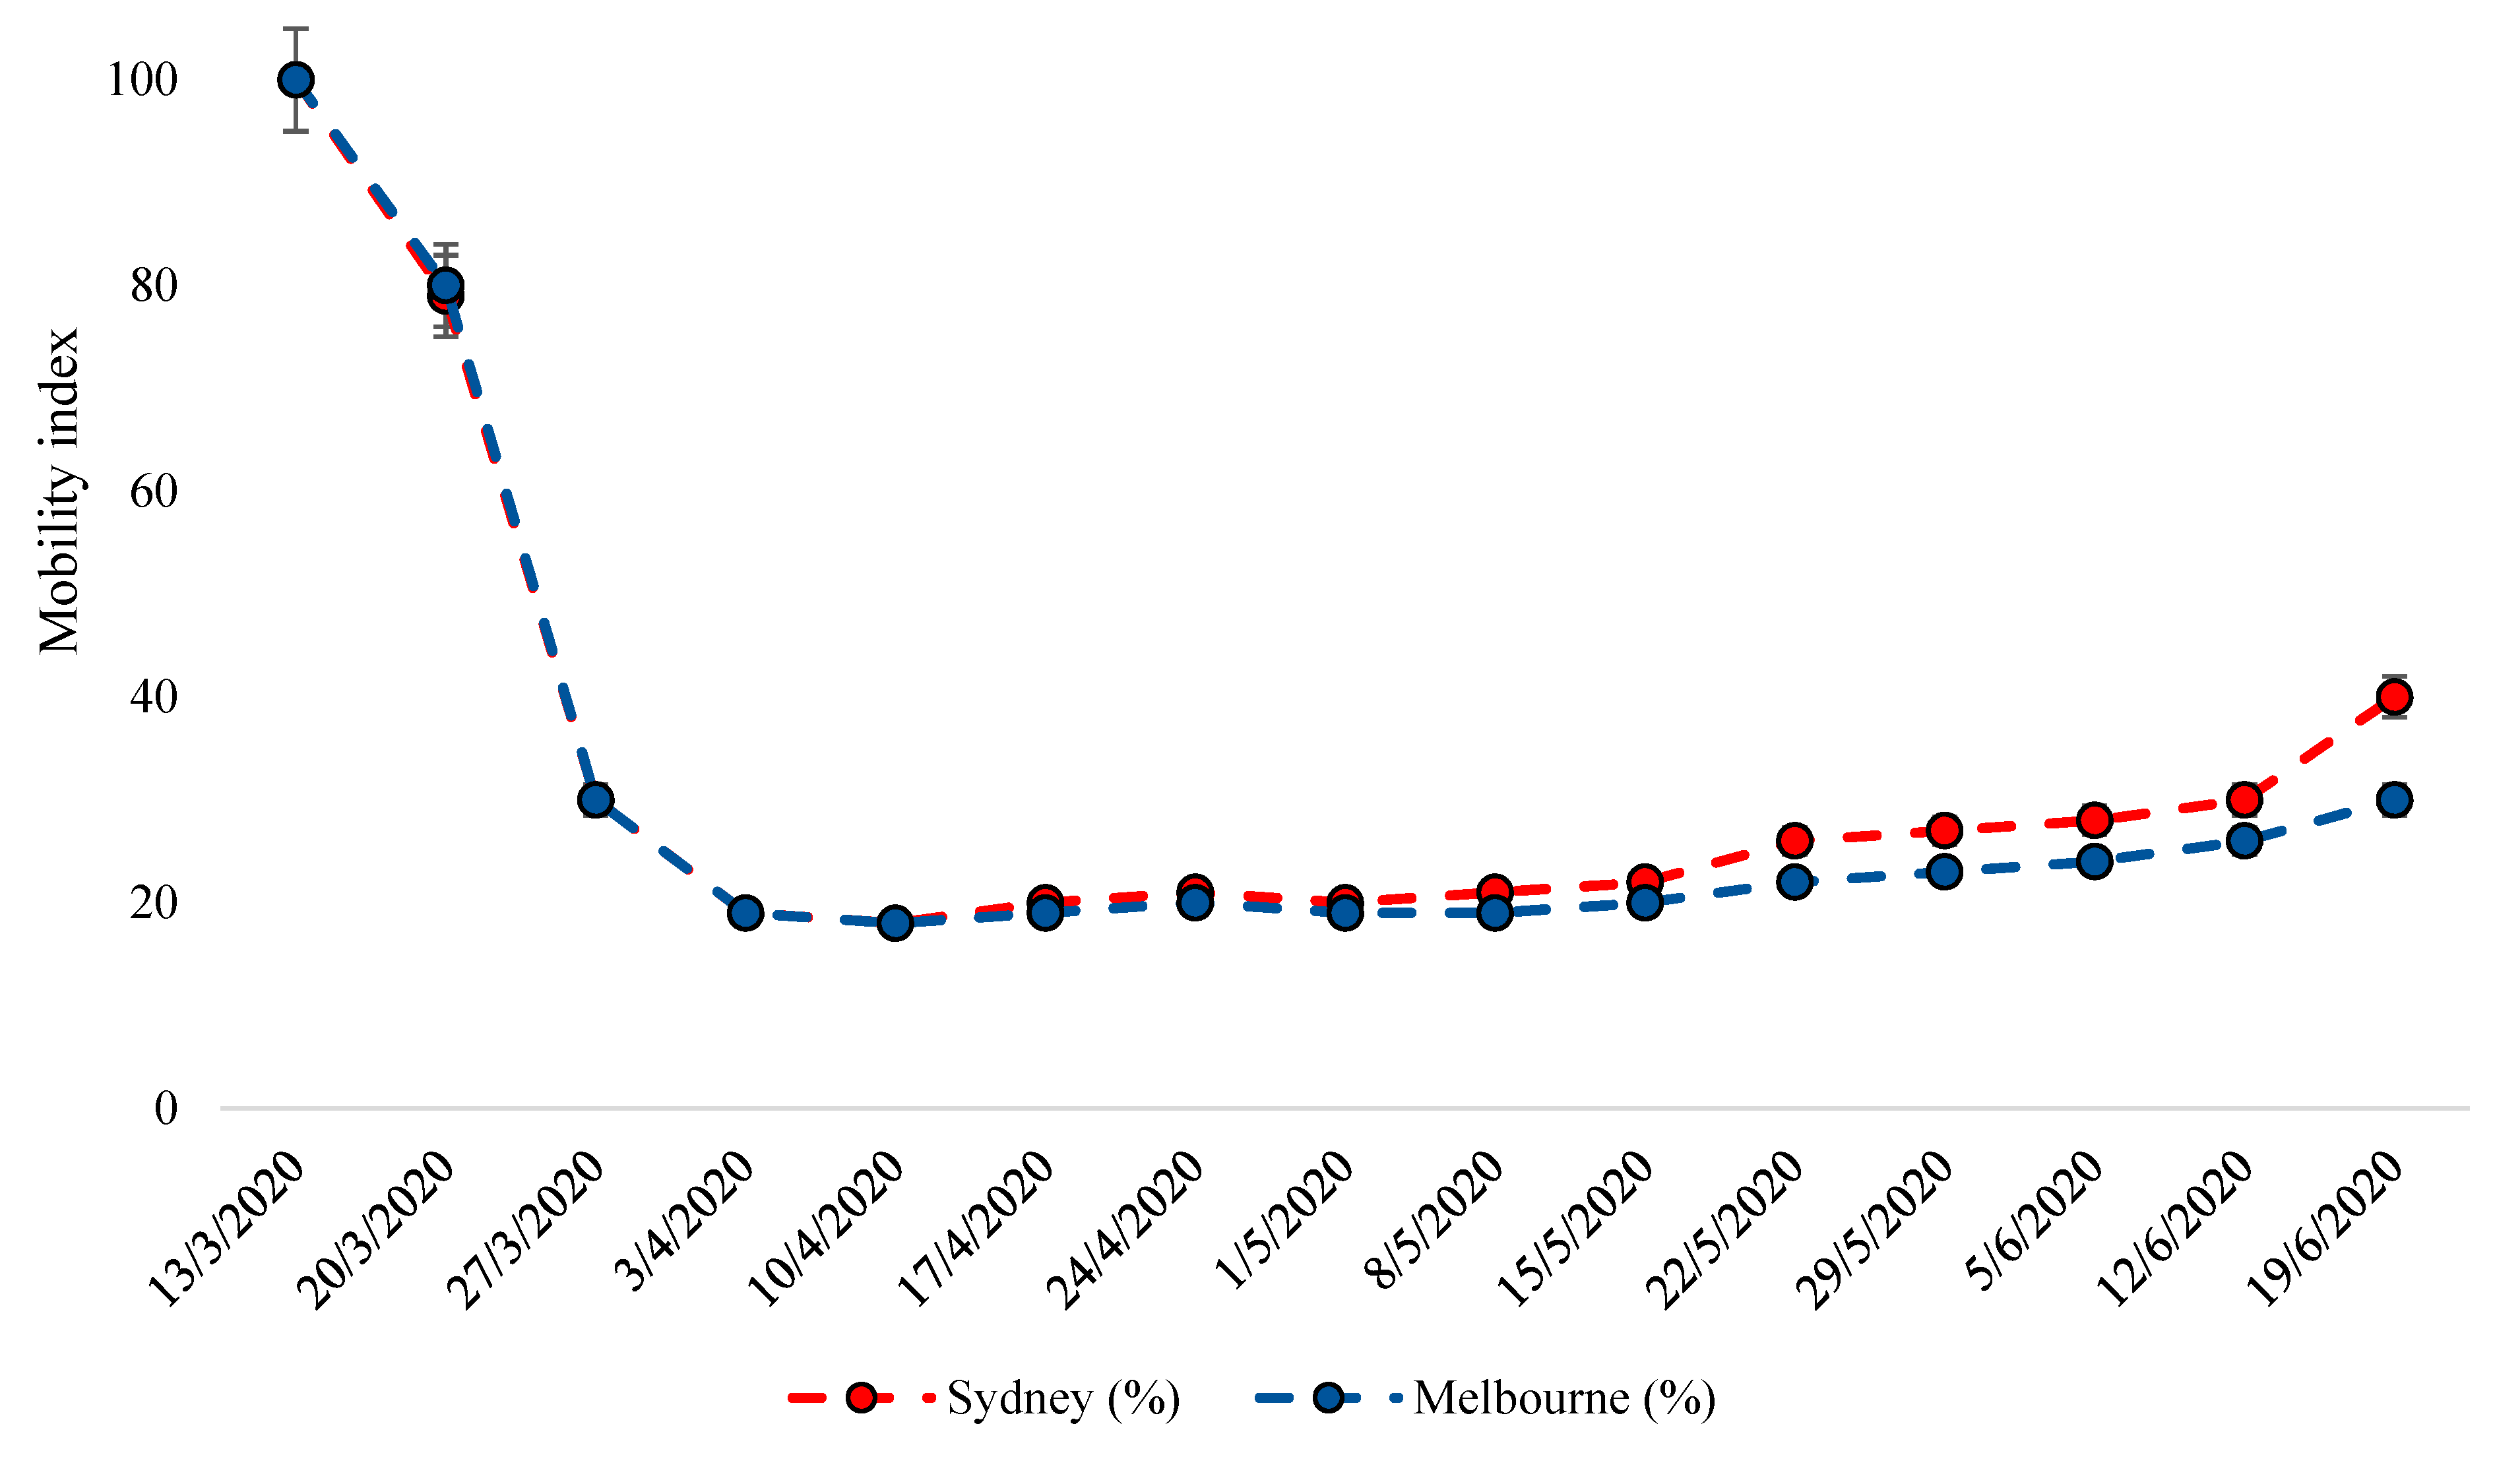
3.1. Public Transport
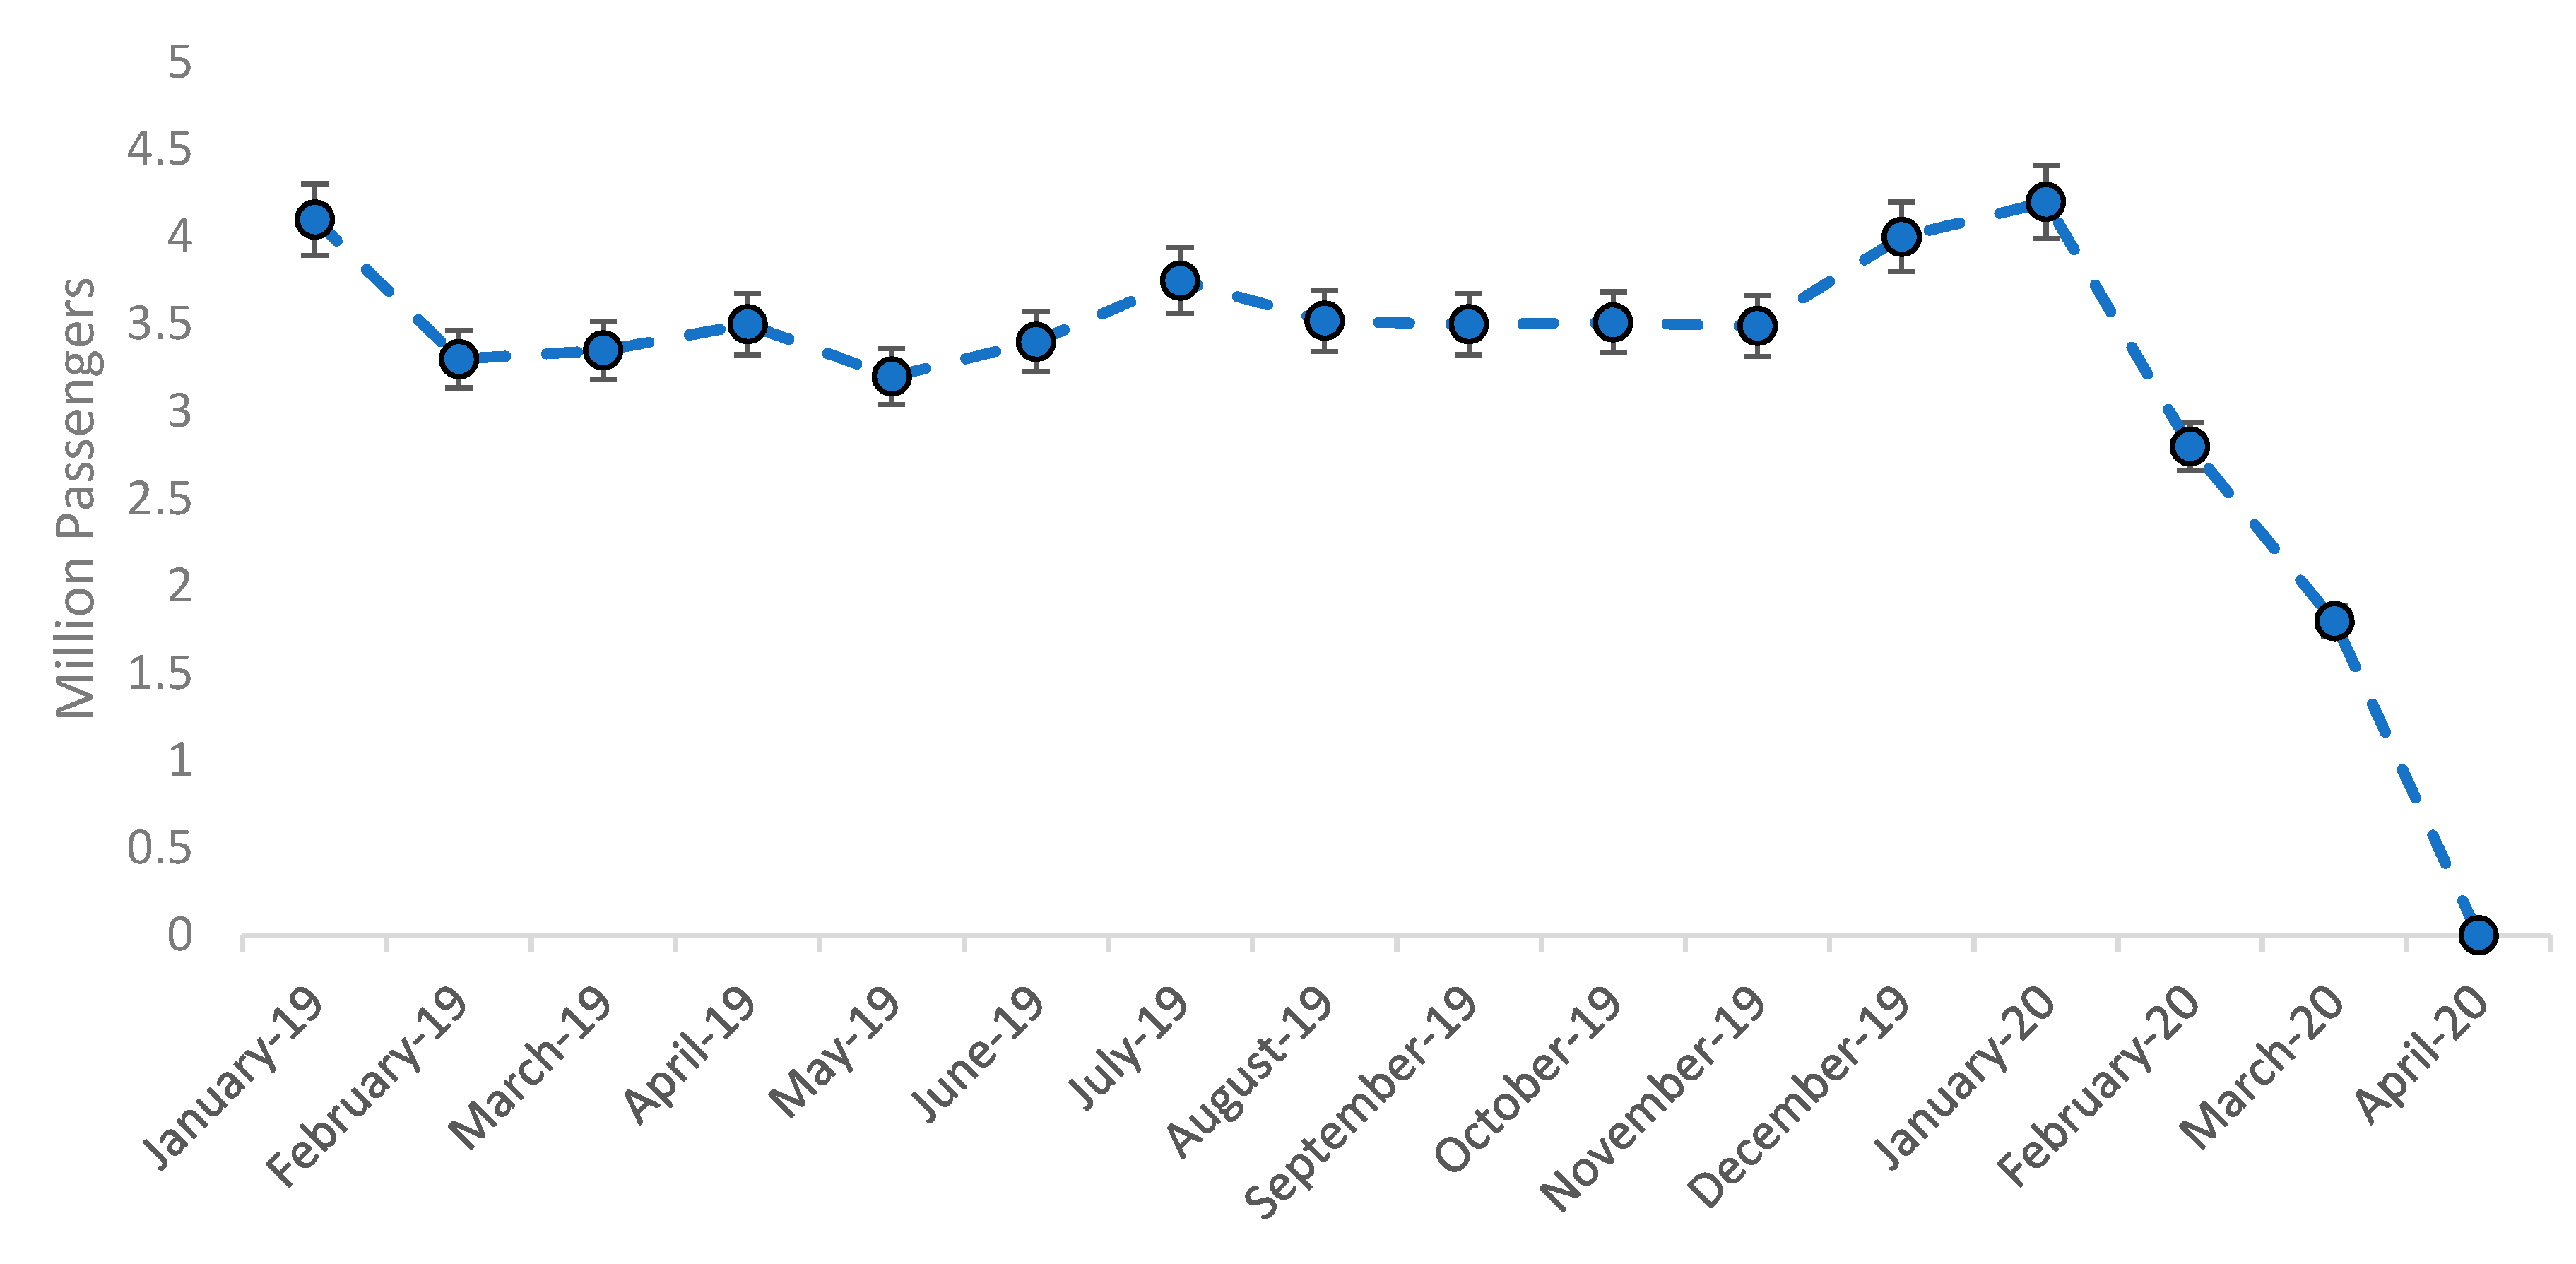
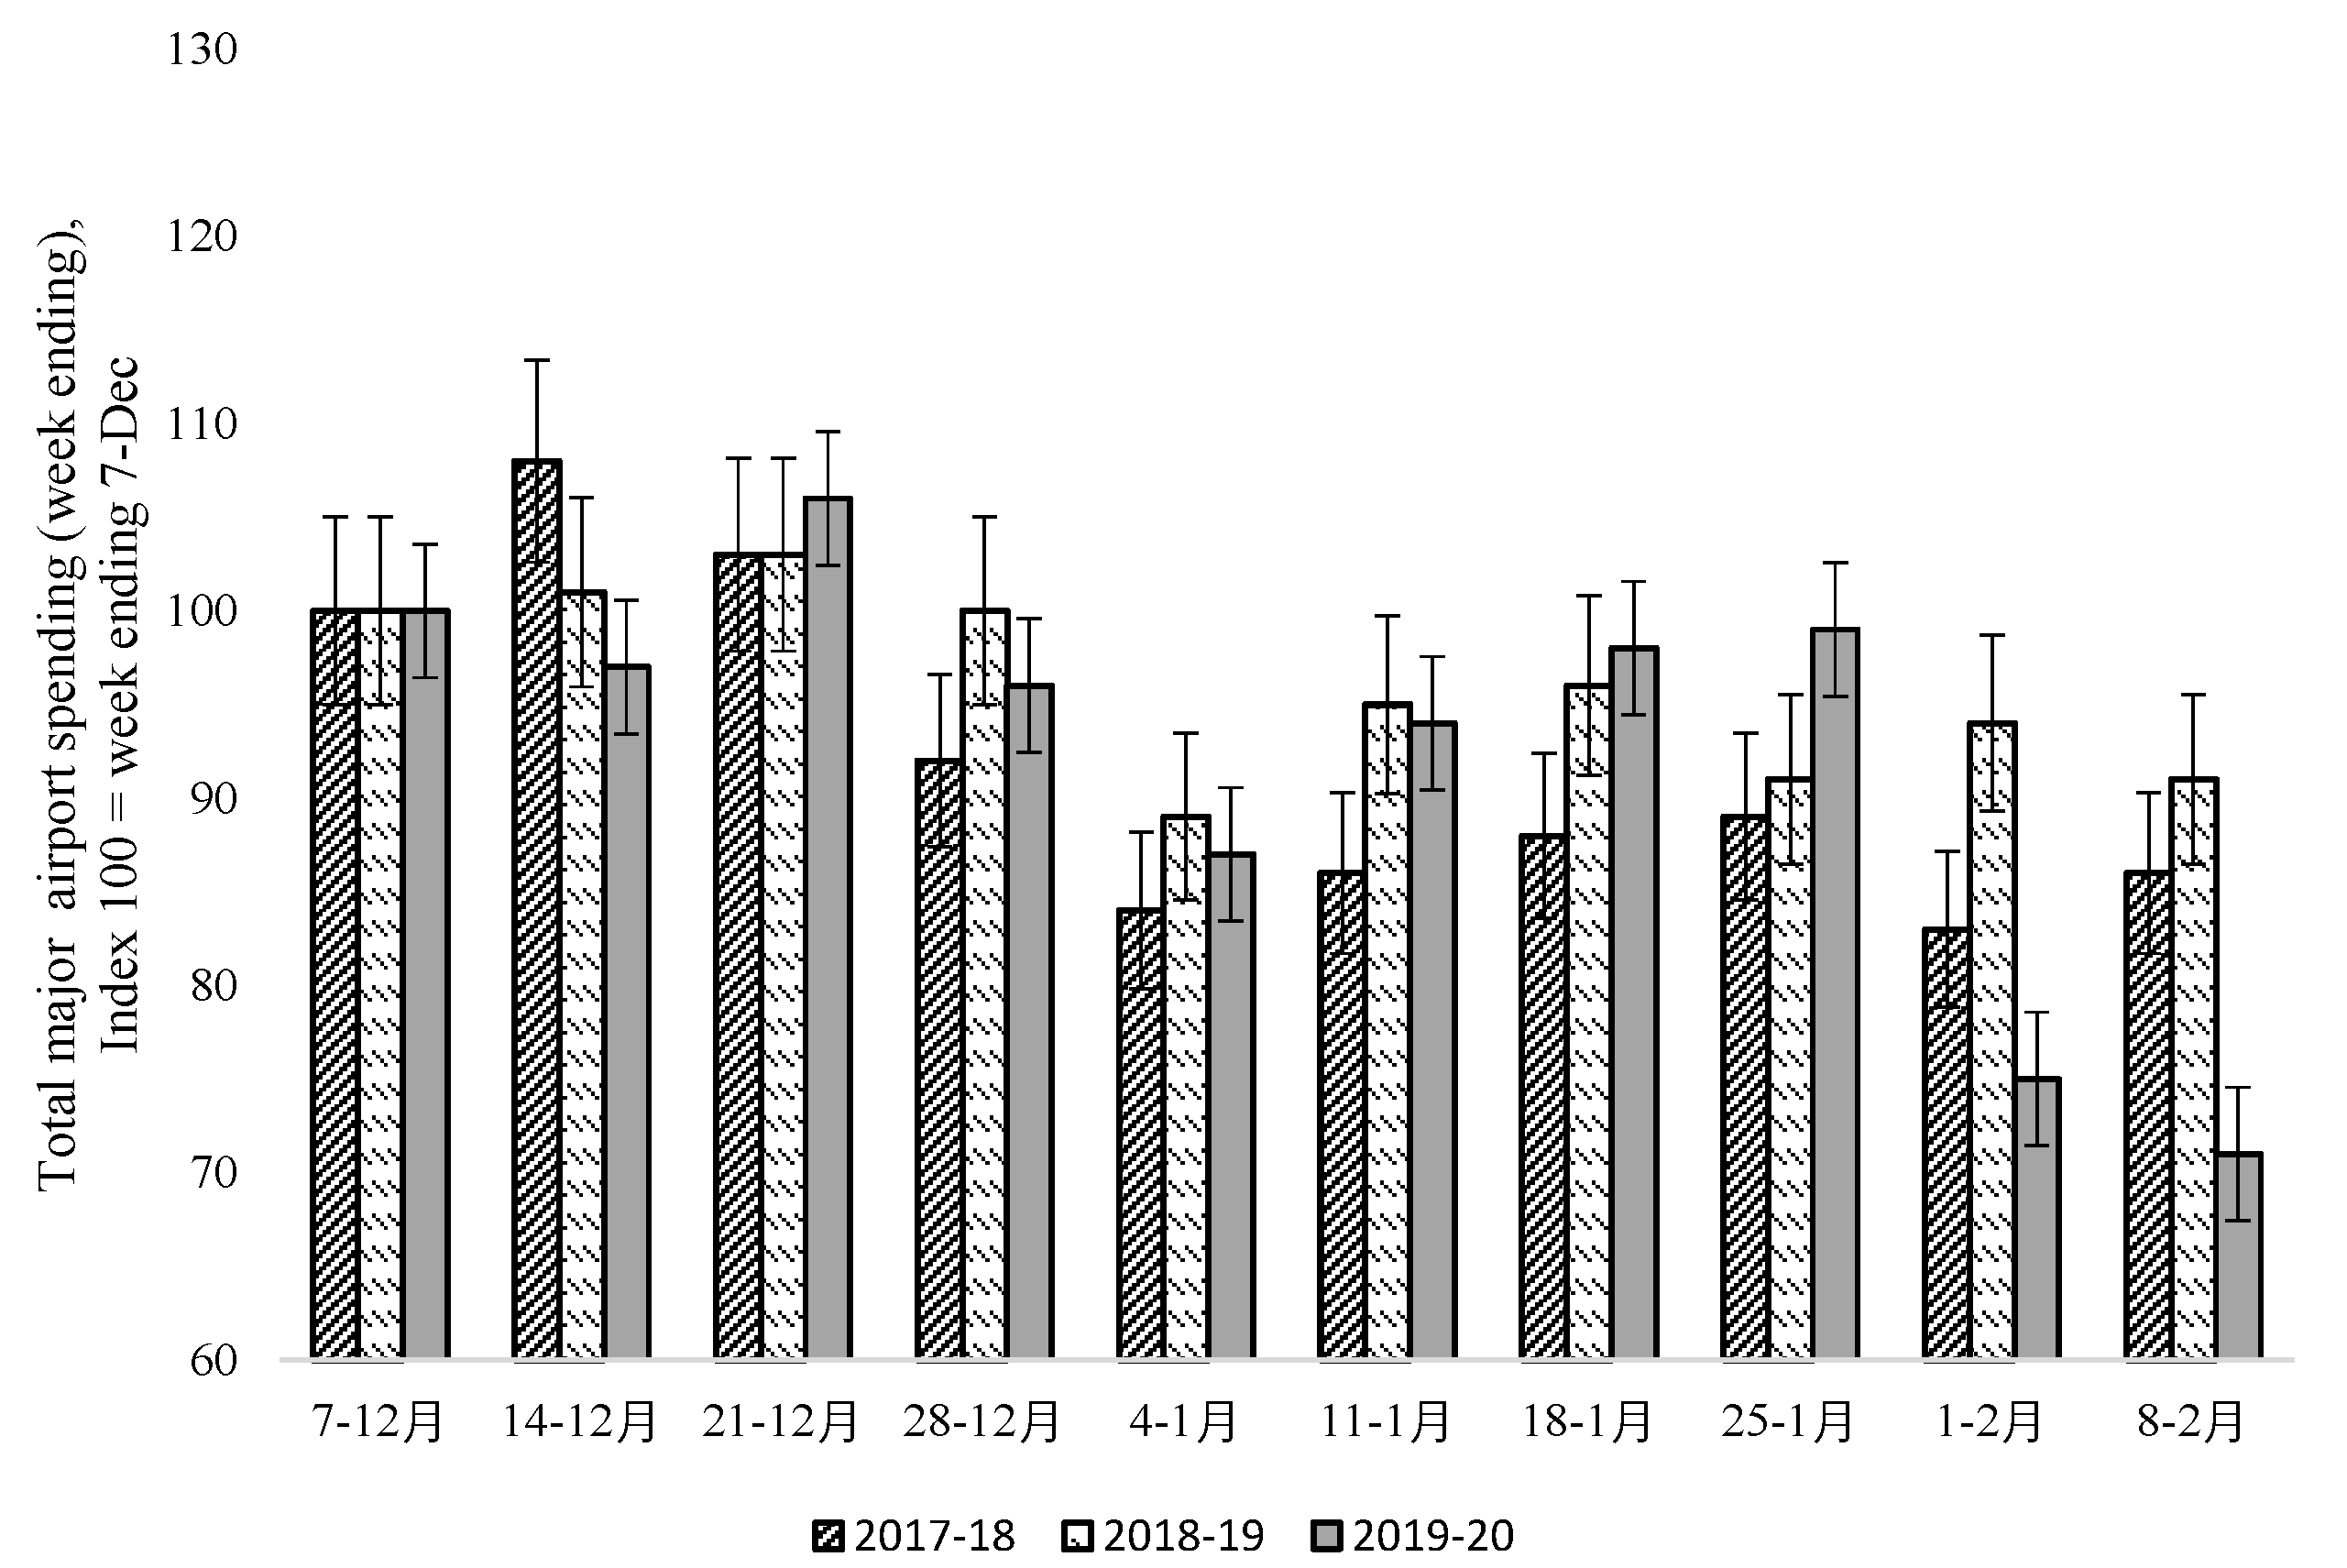
RQ-1. How the demand for public transport is affected due to the pandemic?
Public transport systems are essential for daily life activities like connecting people to their workplaces, schools, homes, and other essential services. The critical need to keep physical distance and practice safety and hygiene measures influence these services’ capacity. Like all other countries, the Government of Australia advised the citizens to minimize unnecessary travel for nonessential items and purposes [12]. Hence, a considerable decrease in the use of both private motor vehicles and public transport travel has been observed. At the onset of the virus in Australia in Mid-March 2020, the COVID-19 cases increased. Therefore, governments imposed strict travelling restrictions. In early April 2020, public transport consumption was consistently 80% lower than the daily usage relative to the pre-COVID-19 days [31]. Now, as the cities are trying to recover from COVID-19 and reopen their services, the number of passengers is expected to increase and move towards normality.
RQ-2. What is the impact of a pandemic on the travel patterns of people who use public transport?
It is imperative to study and investigate the pre-COVID-19 travel patterns and behaviour of public transport users in Australia. This will estimate the number of potential users and the plans may be devised accordingly for accommodating them. In the next stage, the lockdown situation needs to be evaluated. A complete lockdown stage was observed in April 2020 throughout Australia with the preventive measures of physical distancing, restricted outdoor activities, and business closures. Therefore, a considerable decrease in public transport usage was observed and its usage was restricted to essential purposes only. Majority of the services kept operating at the same pace as in pre-COVID-19 stage; however, stricter physical distancing rules were implemented. To ensure the drivers and passengers’ protection and safety, steps such as boarding from the rear and alighting were introduced. These restrictions and the fear of catching the virus from a fellow passenger reduced public transport usage in Australia.
While Australia has been relatively successful in battling the health, the risk posed by COVID-19, the impacts on the public mental health and the overall economy is significant. According to a recent survey by the Australian Bureau of Statistics, in mid-August almost (46%), Australians felt nervous at some point of time during the pandemic crises. Resultantly, there has been a significant decrease in economic activities and people going outdoors for shopping and work. A staggering 58% of Australians were reported wearing facemasks due to COVID-19, including all Victorians [32]. This explains the statistics of mobility changes the Australians observed during the pandemic (Figure 5). The numbers show how the visits to places like parks and shops are changing in each geographic location. According to the database of Google COVID-19 Community Mobility Reports [33], the mobility trends for the use of public transport such as underground buses and trains have drastically dropped to 46%. The mobility for recreational places like cafes, shopping malls, restaurants, theme parks, museums, libraries, and cinemas had dropped by 23%, followed by the visits to workplaces about 15% [33]. The results showed that people are concerned about the outbreak of the disease and are strictly following the governments’ directions. In response to these trends, it is expected by the Australian Bureau of Statistics (ABS) that around 1.5–2 million people would be unemployed due to COVID-19 [34,35].
During the initial phase of stage 2 restrictions imposed by the Australian government, a sudden surge was observed in personal car usage (Figure 6). Except for Melbourne, self-driving has increased throughout the country and is now notably greater than the pre-pandemic phase [36]. Figure 7 shows public transport consumption is well below baseline levels; however, it is slowly and gradually recovering, except for Melbourne. The statistical analysis of the overall decline in public transport due to various factors is given in Table 2. The outlier is South Australia, where the public transport usage is slightly above the baseline and has not been impacted by the pandemic [37]. This is due to the lack of COVID-19 cases in the state walking shows better statistics than public transport usage for Australia. South Australia, Queensland, and Western Australia are moderately above the baseline in walking to jobs. Victoria is way below the baseline about walking, whereas the Northern Territory is stable with 109%. The Northern Territory shows no significant usage of public transport, whereas Southern Australia shows that public transportation usage is only slightly above the baseline. Speaking of the safest mode about the spread of the virus, walking and self-driving have been most popular among the Australians. Interestingly, in all the states except Victoria, people have either opted for driving or walking instead of using public transportation [38]. Due to the increasing cases of COVID-19 in Victoria, the mobility trends in the state have been below the baseline as they were asked to follow the protocols by their government.
However, a noteworthy mention in this regard is that the COVID-19 curve did not flatten so easily as initially, people in various regions of the country were still commuting on the public transport system. For instance, even before the ease in restrictions, the signs of commuters returning to public transport could be observed. Figure 8 represents public transport users’ data from 9 February to 10 May, from the Queensland government [39]. Rail usage in the South East Queensland during the early months of COVID-19 was still lower than a fifth of historic levels but was seen rising more than a third in May (Figure 8). During 9 February, a relatively less light rail usage and ferry usage was observed, showing almost 81% on the graph, whereas the bus and the rail were being used more. In the following days from 9 February to almost mid of March, passengers used bus, rail, and light rail facilities, showing almost the same trend. An anomalous behaviour was observed for ferry usage on 1 March, showing a peak of 106.7 [40]. Later, in the second half of March till 5 April, public transport was not preferred by the passengers due to the government orders. Eventually, as the government eased the restrictions and allowed the public transport consumption, there was a slight improvement in all public transport forms, except ferry users with a relatively better peak at 31.8.).
The similar trend could be observed in the transport usage across the entire country. Figure 9 shows the 7-day average of the light rail passengers, acquired from the Australian Capital Territory (ACT) government. The pre-COVID-19 usage of light rail depicts the weekly average consumption of the service among the Canberra passengers [41]. The declining graph on 28 December 2019 shows the average of Christmas holidays week. However, the 2020 patronage of the passengers were alarming, as Canberra’s light rails also showed rebounding signs of patronage in March–April. The highest peak at 15,904 was observed on the weekly average of February 2020. The graph shows how the patronage of light rail was rising, although the authorities continued urging against complacency. Although quite gradually, the passengers were observed to comply after March and the trend showed a decline.
Since the beginning of the virus outbreak, up until most recently, a steady state of low numbers of new cases has been reported in Australia [42]. In the country’s largest economic centres and most populated cities, Sydney (NSW) and Melbourne, this state resulted in easing of COVID-19 restrictions and consequently a steady rise in travel and activity (VIC). The aggregate information gathered by the CityMapper Mobility Index is shown in Figure 10 and shows that mobility has been increasing relative to the baseline period in Sydney at a slightly faster pace than in Melbourne. While mobility is now at double the amount of activity compared to early April, mobility is still less than half that measured during the baseline period (four weeks between 6 January and 2 February 2020).

3.2. Air Travel

RQ-3. What is the impact of a pandemic on the air travel patterns of people in Australia?
To prevent the spread of COVID-19, various travel restrictions and biosecurity measures are in place in Australia [12]. The borders have been closed, overseas travel has been banned, and only four types of people are permitted to travel to Australia:
  • Residents
  • Citizens of Australia
  • Close family members
  • Travellers who have stayed in New Zealand for the past two weeks
On arriving in Australia, the travellers are screened to identify any symptoms of an infectious disease. If a person shows signs of an infection while being on an international flight, he is reported to biosecurity officers who check his health before the person gets off the plane. On arrival, the person is either quarantined or admitted to a hospital. The Australian government arranges quarantine for such travellers by providing them with quarantine accommodation and a transport service for carrying them to this accommodation from the location of their arrival. The test for COVID-19 is done, first within 48 h of quarantine and then between the 10th and 12th day of quarantine [12]. In some states, the patient also must pay a particular cost for quarantine.
The borders of Australia are closed, and only a limited number of international flights are currently available. As travelling to and from Australia is now prohibited, the number of international students in Australian universities continues to drop. The enrolment of foreign students in Australian institutes is dropping in all cities. It is expected that by July 2021, there will be a 50% reduction in the number of international students [43]. This loss will be even higher if the borders remain close for longer than that. There is 80% to 90% reduction in the number of applications for international student visas as compared to 2019. The International education crisis is predicted to cause a loss of 57% annual revenue that comes from international education [43].
In the next 12 months, more emphasis will be paid on local air travel as domestic tourism is expected to increase. Rules about interstate travelling differ in each state as states and territories apply their restrictions. Table 3 shows the interstate travelling rules observed in each Australian state during the pandemic [44]. In New South Wales (NSW), anyone can enter unless they have been in Victoria in the past 14 days, which is a declared COVID-19 hotspot. Travellers from Victoria must provide an exemption and quarantine for 14 days on their arrival. Similar restrictions are in place for entry in South Australia and Australian Capital Territory (ACT). In Victoria, there are currently no restrictions for entry. People coming from COVID-19 hotspots are prohibited from entering Queensland, Tasmania, and the Northern Territory. These declared hotspots are the states of Victoria and South Australia, Greater Sydney, and Melbourne [44]. The interstate border in Western Australia is closed, thus, interstate travel to and from this state is not possible. No restrictions are in place for leaving the states of NSW, Queensland, Tasmania, Northern Territory, and ACT. Travellers leaving Victoria must provide a permit to enter the states of Tasmania, NSW, ACT, and Western Australia while travelling to South Australia is restricted. Similar restrictions are in place in South Australia, where interstate travel ban is in place after being declared a COVID-19 hotspot.
Figure 11 shows the graph based on the data collected by BITRE Aviation Statistics and IBISWorld about the passengers in the Australian International Airline between January 2019 and April 2020. This graph shows that the number of passengers fell to just 69,000 in the month of April 2020. This is a drastic fall when the numbers are compared to the previous year data, which clearly shows 3.5 million passengers in the month of April 2020.
RQ-4. What is the impact of a pandemic on the revenues of the air travel industry?
With the onset of a pandemic, the airlines have been pushed to the brink of extinction. In Australia, hundreds of aeroplanes are parked in airports due to bans on the interstate and out of the country travelling. It has been reported that the pandemic situation will have a long-term effect on air travel in Australia and this condition is expected to linger even in the post-pandemic era [45]. Lack of parking space for many free aeroplanes has become another problem for airlines. To address this issue, Brisbane airport is offering parking space to aeroplanes, but it is also very costly for the airlines. One hundred and twenty-five local aeroplanes have been grounded by an airline called Virgin Australia. This airline has requested from the Australian government a loan of 1.4 billion dollars to stay in the competition and maintain its staff of 9500 people. This airline is expected to go extinct if the pandemic situation remains for another four to five months [28]. Till now, the government has provided some funds but is not willing to recreate this airline due to the ongoing pandemic related crisis and the financial decline of the travel industry. The Qantas airline is in much better financial condition than Virgin Australia. However, it also needs funds worth 4.2 billion dollars from the government to compete with other established airlines [40,45]. Any new airline coming into the market will face a hard time surviving and competing due to the ongoing economic regression. The Australian dollar has dropped equally to only 60 US cents. This has resulted in the situation that the cost of each aeroplane is further increased while the revenue of the air travel industry has declined to result in more loss at the end of airlines. In 2020 to 2021, as international borders remain closed, revenue in International Airlines in Australia is predicted to fall by 31.5% [46].
The impact of COVID-19 on the airlines’ industry is evident from the chart shown in Figure 12. It shows that spending declined in major airports in Australia, as soon as COVID-19 cases started being reported worldwide [47]. In mid to late January, a drastic fall in the spending was seen. This was the same time when Chinese government-imposed travel bans to contain the spread of COVID-19. In February, a sharp drop in spending in major airports in Australia is observed, which reflects the travel bans and decline in the number of international travellers due to the pandemic. The major airports include Brisbane, Melbourne, Sydney, and Perth. This condition is limited to international travel only as the spending in smaller airports was much steadier during this time [47].

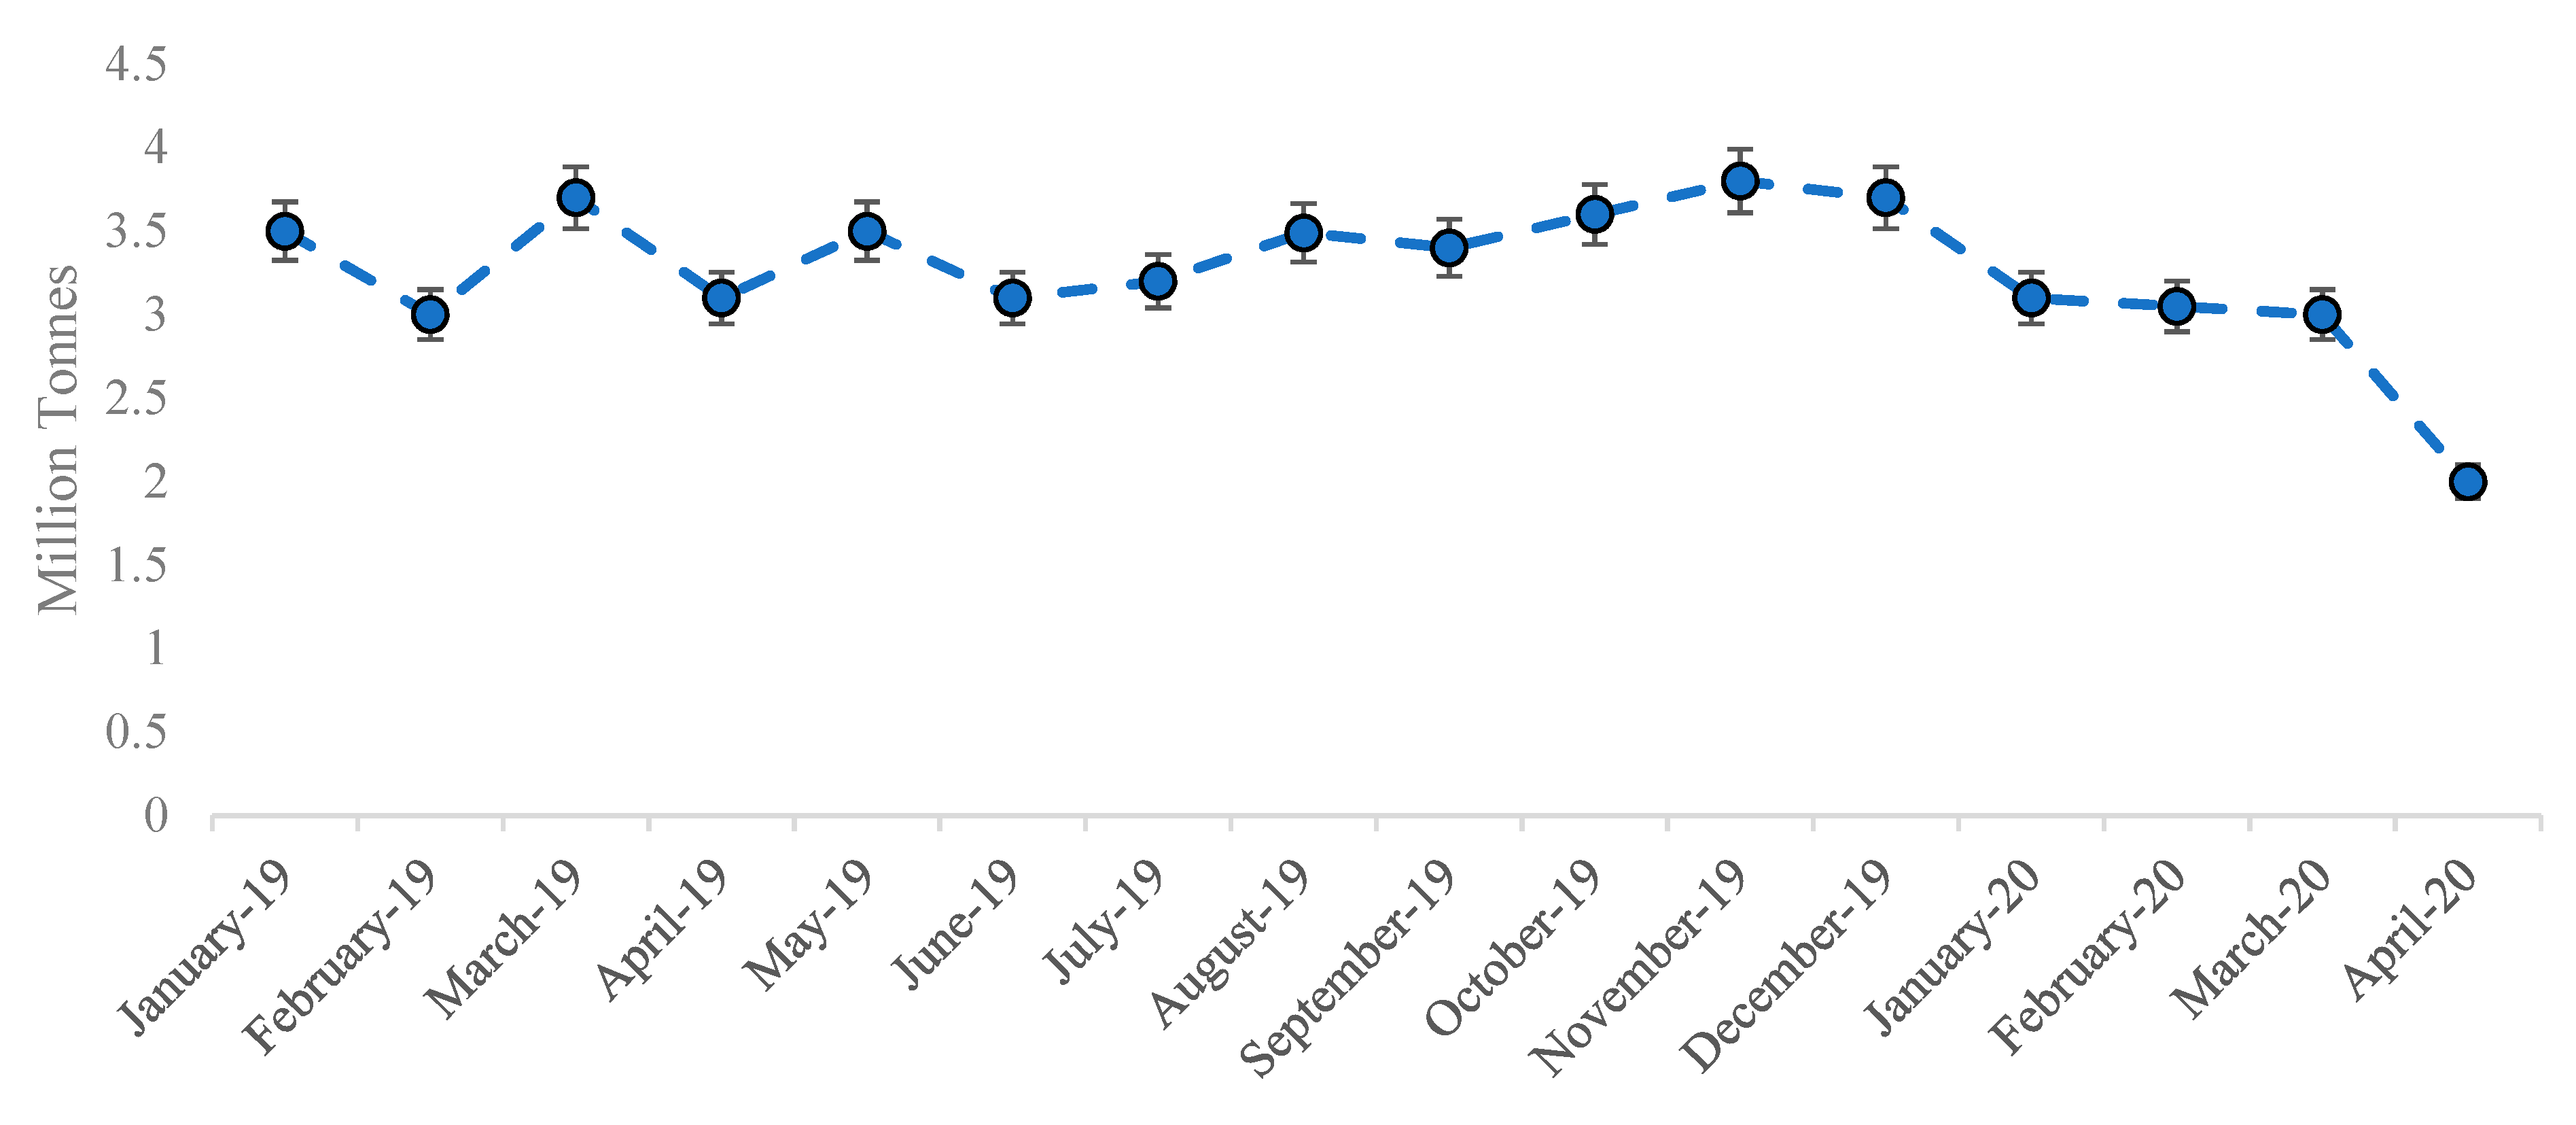
3.3. Freight Transport

RQ-5. How freight transport systems are affected by pandemic?
Transportation of commodities and goods in bulk by air, water, or land is referred to as freight transport. Freight services by road include transporting goods by road, hiring trucks for freight transport, vehicle towing services, and keeping a log of the carried/delivered goods. In road freight transport, bulk goods are carried by large vehicles. The work environment includes drivers, vehicles, roads, vehicle service stations, pick-up, and delivery points like warehouses and freight terminals [48]. The data provided by official Australian government website shows the impact of COVID-19 on freight transport by road in major Australian cities during the initial stage of the pandemic. The results show that no major difference in the traffic volumes of freight vehicles have been recorded in the observed period (Australian government, 2020). With the onset of a pandemic, the educational institutes were closed, and people started working from home. This resulted in reduced traffic congestion on roads. As a result, the travel times of the freight vehicles became more predictable and much shorter. This assisted the freight industry in maintaining the supply chains on the onset of COVID-19 [48].
Airfreight is more costly than shipping, but much quicker as well. For this purpose, airfreight, such as horticultural products, boxed beef, and chilled seafood, is used to transport perishable Australian exports. In the International Airlines industry, passenger flights usually provide the bulk of airfreight capacity in Australia and, in addition to passenger luggage, generally hold commercial cargo. As shown in Figure 13 total freight from 84.8 million kilograms in January 2020 was reduced to 54.5 million kilograms in April 2020 due to a major decrease in air transport. In May and June, freight is estimated to have decreased more, in line with a further decline in total flights. In response to COVID-19, although demand for air freight dropped, supply declined even more dramatically, exerting upward pressure on airfreight prices. The airfreight capacity shortage is too high to be covered by dedicated cargo aircraft alone. In the Non-Scheduled Air Transport business, passenger airlines were encouraged to convert passenger aircraft to carry freight only and to divert freight capacity away from regularly scheduled flights to the more lucrative charter market.
RQ-6. How the revenues generated by the freight transport industry are affected by pandemic?
With time, like other components of the transport division suffered due to the pandemic, freight transport was also severely affected by the COVID-19 related restrictions. The domestic and international trade has declined, which has reduced the demand for freight transport. In 2020, the global cost of crude oil has dropped 42.5% [49]. This resulted in a reduction in operational charges for freight transport providers. With lower operational costs and the current domestic and foreign travel restrictions, the transport providers obtained a marginal profit. Australia export products like coal, iron ore, wheat, and grains. As these commodities have a large weight, they are transported by sea rather than by air using specially built bulk carriers. In the years 2019 to 2020, Australia was predicted to export goods near to 1520 million tons using the sea. However, due to ongoing pandemic conditions, the water freight transport industry, which is responsible for the shipment of Australian goods to international ports, is predicted to drop by 9.5% [49].

4. Discussion

RQ-7. Based on recent mobility trends and travel restrictions, how likely it is to achieve a fast recovery to the pre-pandemic conditions once the pandemic ends?
The restrictions to minimize the diffusion and impacts of the pandemic had a large-scale impact on people’s lives and the energy consumption across various economies. The pandemic has largely impacted all forms of transportation, from cars, and public transport in cities, to trains, buses, and planes nationally and internationally. The majority of the population has significantly lowered the use of public transport. Does this lead to a greater concern of whether the crises will result in the permanent behavioural change in passengers or the transport systems will return to the pre-COVID-19 patterns?
Currently, Australia is in the transition stage, where the travel restrictions are progressively relaxed. Businesses and shops will eventually reopen, encouraging safe economic, and societal recovery. Before the epidemic immunity, some important precautions need to be taken with regular monitoring to ensure the virus does not return. People will eventually resume using public transport when they feel safe and confident about the mitigation. This stage is expected to be different for each state. Restrictions will be gradually relaxed, but the monitoring and response management will be critical to avoid the second wave of the virus. Once the population develops adequate immunity or the vaccine is developed and approved, restrictions might be lifted. The last stage of recovery and normalization is getting used to the new normal where COVID-19 will no longer be a major issue. This stage may arrive through various approaches that will differ globally, for instance, herd immunity or vaccination. It is also expected that the travel patterns and behaviours of the passengers will be changed as compared accordingly. Funding to enhance pandemic preparedness may not be that beneficial with other pressing health issues and burden of diseases. The pandemic risk must be first characterized, and then existing gaps in pandemic preparedness are identified. This will prioritize the tasks and with targeted efforts to meet the desired goals. The frequency and severity of the pandemic can be modelled to quantify the risks across each state and the usefulness of investing in pandemic preparedness can be evaluated [28,50]. Hence, the new normal stage will most likely have different response across different travelling platforms. Currently, Australia is in the transition phase and certain restrictions have been eased across various states.
Post COVID-19, a significant change in the travelling behaviour of public transport users is expected. Additionally, the policymakers of the companies can gain the benefits of positive work practices; like work from home and video conferencing, thus, lowering the need to travel. However, a risk of congestion could be expected with the increased usage of single-occupancy car travels, as people may be reluctant to use public transport for a foreseeable future. Hence, the effective utilization of public transportation and proactive planning to encourage users to come back progressively and healthily may be required. The progression and recovery from the pandemic will be possible in various stages that can be described through the lens of public transport supply in Australia [12]. Hence, it is essential to look at four key aspects: earlier travel patterns, lockdowns, transition stage, and adopting the new normal. Earlier studies have observed that such disruptions can catalyse the behavioural shifts towards more sustainable behaviour; however, curbing a return to pre-pandemic behaviours will require governments to make strict and responsible decisions [51].
A recent study led by Monash University predicted that in Melbourne, even after relaxation in the COVID-19 related restrictions, the patronage is expected to return to only 80% of the pre-COVID baselines [52]. This survey found that most of the pre-COVID commuters will prefer to work from home and nine per cent of the commuters would opt for their vehicle to drive to the workplace instead of using a bus or a train. The result would be more traffic congestion, a situation referred to as “post-pandemic gridlock”, along with a substantial decrease in the use of public transport.
According to Jetstar, the low-cost carrier operated by Qantas Airways, Australia, by March 2021, it will return to 110% of its pre-pandemic schedule, as more than 850 weekly flights will be resumed across 55 routes. By contrast, according to U.K.-based OAG Aviation Worldwide, the U.S. is currently running at around 42% capacity compared to the same time a year earlier [53,54]. A significant reduction in air travel was observed in the pandemic and pre-pandemic periods with a reduction in passenger departures (−52%). It was observed that domestic flights, travelling to neighbouring countries, essential business travels, and visiting family were found to be resilient with the fastest recovery flow. Travel restrictions have limited impact in containing the virus, there are numerous other factors with varying degree of impacts such as the size of the pandemic, timing of restrictions and its duration, the transmission of the virus and the travel pattern of the customers. Placing passengers in quarantine who are travelling from destination with outbreak will delay the spread or re-introduction of the virus in the community [50,55].
For freight transport service providers, the ongoing conditions are not encouraging. However, a strong recovery is expected in the next five years. In 2020, the net worth of world trade is predicted to fall by 11.6% due to the pandemic [56,57]. Within the next five years, this value is expected to recover at an annual rate of 5.6%. This recovery is only possible if the global economies survive the COVID-19 pandemic. One significant change during the pandemic is the increased preference of people towards online shopping rather than in-store shopping. In Australia, the shift towards online shopping along with increased production of commodities can increase the country’s net local freight task to 903.3 billion tons km within the next five years. The existing trade barriers are expected to be lifted by 2021–2022 as the COVID-19 related restrictions are relaxed. This will enable freight transport providers to resume normal tasks and break the existing economic chains. Despite the predicted economic growth in the next five years, the transport industries are not expected to generate revenue that is comparable to the peak that was observed in 2018 to 2019 [58,59].
As the perceived risks of travelling through public transport continue, people are most likely to opt for more energy-intensive transport options than cycling, mainly due to practical reasons. In several cities, private cars had been a dominant mode of transportation before the pandemic, and the earlier crises show car usage could increase post-COVID-19 [60,61,62,63]. However, governments can influence and impact the transport behaviours and suggesting permanent behaviour after the pandemic [64]. The inclusion of electric vehicles and other means of renewable energy will boost the economic sector along with state-of-the-art wireless technologies [65,66,67,68,69,70,71,72]. The appropriate infrastructure investments can be essential for regaining trust in public and active transport. Infrastructure for boosting cycling safety is essentially important for increasing the cycling option in underrepresented parts of the masses like women, who view traffic safety from a different lens. Hence, the cycling infrastructure may include well-designed cycleways and quality trip facilities to enhance safety and convenience [20,73,74,75,76,77].
Additionally, pricing and regulatory policies can facilitate in incentivizing less energy-intensive transport behaviour after the crises. The cost of different modes of transport will be a major determinant of the people’s behaviour regarding which option they will avail. As the oil prices have significantly dropped to an iconic low, appropriate policies can help get a correct balance of costs and benefits as the demand reappears. Moreover, public behaviour change drives and campaigns can also be performed to encourage the masses to make suitable choices based on sound risk analysis. This will depend on various factors, including the trust in government and the extent to which they relate to other measures. Emphasizing the benefits of sustainable mobility options like better air quality and enhanced health is likely to be a successful campaign component.

5. Conclusions

This study investigates how the measures and policies adopted by the Australian government and transport authorities affect the transport division of the country. Three components of the transport system were studied in detail including public transport, air travel, and freight transport. Primary data was obtained using the official website of the Australian government, Google Mobility reports, and recent research on COVID-19. Secondary data was gathered by interviewing the relevant transport authorities and using authentic online resources like databases, articles, and websites. The study found out that:
  • In early April 2020, public transport consumption was consistently 80% lower than the average daily usage relative to the pre-COVID-19 crisis.
  • In February 2020, a sharp drop in spending in major airports in Australia was observed reflecting travel bans and a decline in the number of international travellers due to the pandemic.
  • Total freight dropped from 84.8 million kg in January 2020 to 54.5 million kg in April 2020 due to a major decrease in air transport.
  • The water freight transport industry responsible for the shipment of Australian goods to international ports is predicted to drop by 9.5%.
The immediate effect of COVID-19 on the roads and public transport systems is pronounced, but the long-term impacts of the activities and behaviour are not known clearly. This gives rise to speculation of the new normal and what that will look like. While the restrictions on public transport use are gradually being relaxed, there is still a good portion of the population concerned about the risk of commuting in public platforms. Although the number of new cases of COVID-19 is lowered, people are still not completely confident in using public transport. About 46% decrease in public transport places have been observed. The transport patterns show that a majority of people are now opting towards walking and using their vehicles instead of using public transport. Consequently, it has increased the trend of online shopping, which showed the highest usage in history. The long-term behavioural shift of public transport users towards self-driving vehicles could be expected due to the prolonged duration of restrictions and COVID-19. However, the behavioural impact of COVID-19 regarding public transport can be facilitated by the governments and the introduction of user-friendly measures.
In the air travel industry, major declines in revenues have been observed because of international and interstate travel bans. The statistics show that with the onset of the COVID-19 pandemic, the number of passengers and the spending in airports started to drop even before any travel ban was in place. Airlines like Virgin Australia are expected to go extinct without aid by the government if the current pandemic restrictions persist in the coming year. The increased costs of aeroplanes and lack of parking space in airports are other problems faced by the airlines in the pandemic related crisis. Till 2021, the profit in International Airlines in Australia is predicted to fall by 31.5%. According to one study, the border closure and travel ban restrictions in Australia have reduced the importations of COVID-19 cases in the country by 87.68% between January and June 2020 [63]. Hence, these measures have proven to be effective when it comes to containing the spread of COVID-19. The government should fund the falling airlines such that they can survive the current crisis. With the availability of a vaccine for COVID-19, the measures may be relaxed. However, it will take a considerable amount of time for the situation of the air travel industry to return to the pre-pandemic state.
The freight transport industry has also faced a downfall in the present crisis. Due to less traffic congestion, freight transport routes have become shorter and more predictable. However, the demand for freight transport is reduced, cost of products and operational costs of transport service providers are decreased along with a decline in international and domestic trade. This has resulted in minimal profits earned by transport service providers. Till 2021, a 9.5% decline in the water freight transport industry is expected. However, this situation is expected to improve within the next five years, provided the global trade restrictions are eased. Still, the revenues earned by the freight transport industry in the post-pandemic era are not expected to be comparable to the revenues earned in 2018–2019.
To overcome negative consequences, the governments should provide grants to transport service providers so that they can maintain the transport supply and observe the social distancing measures in the vehicles to avoid crowdedness. There is a need to characterize the pandemic risk, prioritize the action to be taken, and find the existing gaps in pandemic preparedness concerning transport industry. Rules such as enforcing the use of facemasks, checking the temperature of the passengers, and sanitizing them before entering the vehicle are essential to control the spread of the virus. By analysing the results of various surveys, we conclude that the present state of the transport sector in the country is not expected to change even in the post-covid-19 phase, without proper intervention by the governments.
In urban areas, the traffic congestion levels are dropped, resulting in several positive side effects. One positive outcome is that traffic safety problems are reduced. With fewer vehicles on roads, some environmental advantages are also achieved such as lower pollution and noise. Carbon emissions will be eliminated from the atmosphere during the pandemic due to reduced economic activities for prolonged periods [58,64].
This research has mainly focused on the revenues and losses in various sectors of the transport system in Australia. Future research in this area should focus on the effect of COVID-19 containment policies on travel patterns and activities at the individual level. The impact of strategies that have been adopted to serve as an alternative for the transport facilities, such as the shift towards personal cars or bicycles, should also be examined to come up with a viable solution to the current transport problems in the pandemic.

Author Contributions

Conceptualization, H.S.M., Z.Q. and S.I.K.; methodology H.S.M., Z.Q. and S.I.K. and software, H.S.M., Z.Q.; validation, S.I.K.; formal analysis, H.S.M., Z.Q. investigation, H.S.M., Z.Q. and S.I.K. resources, A.Z.K.; data curation, M.A.P.M.; writing—original draft preparation, H.S.M., Z.Q. and S.I.K. funding acquisition, M.A.P.M. All authors have read and agreed to the published version of the manuscript.

Funding

This research received no external funding.

Institutional Review Board Statement

Not applicable.

Informed Consent Statement

Not applicable.

Data Availability Statement

Not applicable.

Conflicts of Interest

The authors declare no conflict of interest.

References

  1. Lai, C.-C.; Shih, T.-P.; Ko, W.-C.; Tang, H.-J.; Hsueh, P.-R. Severe acute respiratory syndrome coronavirus 2 (SARS-CoV-2) and corona virus disease-2019 (COVID-19): The epidemic and the challenges. Int. J. Antimicrob. Agents 2020, 55, 105924. [Google Scholar] [CrossRef] [PubMed]
  2. Carfì, A.; Bernabei, R.; Landi, F. Persistent Symptoms in Patients After Acute COVID-19. JAMA 2020, 324, 603–605. [Google Scholar]
  3. Struyf, T.; Deeks, J.J.; Dinnes, J.; Takwoingi, Y.; Davenport, C.; Leeflang, M.M.G.; Spijker, R.; Hooft, L.; Emperador, D.; Dittrich, S.; et al. Signs and symptoms to determine if a patient presenting in primary care or hospital outpatient settings has COVID-19 disease. Cochrane Database Syst. Rev. 2020, 7, CD013665. [Google Scholar] [CrossRef] [PubMed]
  4. Coffey, C.; Doorley, K.; O’Toole, C.; Roantree, B. The Effect of the COVID-19 Pandemic on Consumption and Indirect Tax in Ireland. Available online: https://www.esri.ie/system/files/publications/BP202103.pdf (accessed on 1 October 2020).
  5. Bucsky, P. Modal share changes due to COVID-19: The case of Budapest. Transp. Res. Interdiscip. Perspect. 2020, 8, 100141. [Google Scholar]
  6. de Haas, M.; Faber, R.; Hamersma, M. How COVID-19 and the Dutch ‘intelligent lockdown’change activities, work and travel behaviour: Evidence from longitudinal data in the Netherlands. Transp. Res. Interdiscip. Perspect. 2020, 6, 100150. [Google Scholar]
  7. Aloi, A.; Alonso, B.; Benavente, J.; Cordera, R.; Echániz, E.; González, F.; Ladisa, C.; Lezama-Romanelli, R.; López-Parra, Á.; Mazzei, V. Effects of the COVID-19 Lockdown on Urban Mobility: Empirical Evidence from the City of Santander (Spain). Sustainability 2020, 12, 3870. [Google Scholar] [CrossRef]
  8. Abu-Rayash, A.; Dincer, I. Analysis of mobility trends during the COVID-19 coronavirus pandemic: Exploring the impacts on global aviation and travel in selected cities. Energy Res. Soc. Sci. 2020, 68, 101693. [Google Scholar] [CrossRef]
  9. Albers, S.; Rundshagen, V. European airlines′ strategic responses to the COVID-19 pandemic (January-May, 2020). J. Air Transp. Manag. 2020, 87, 101863. [Google Scholar] [CrossRef]
  10. Huang, J.; Wang, H.; Fan, M.; Zhuo, A.; Sun, Y.; Li, Y. Understanding the impact of the COVID-19 pandemic on transportation-related behaviors with human mobility data. In Proceedings of the 26th ACM SIGKDD International Conference on Knowledge Discovery & Data Mining, San Diego, CA, USA, 22–27 August 2020; pp. 3443–3450. [Google Scholar]
  11. Monmousseau, P.; Marzuoli, A.; Feron, E.; Delahaye, D. Impact of Covid-19 on passengers and airlines from passenger measurements: Managing customer satisfaction while putting the US Air Transportation System to sleep. Transp. Res. Interdiscip. Perspect. 2020, 7, 100179. [Google Scholar] [CrossRef]
  12. Government, A. 3-Step Framework for a COVIDSafe Australia. Available online: https://www.health.gov.au/resources/publications/3-step-framework-for-a-covidsafe-australia (accessed on 1 October 2020).
  13. Chang, H.-H.; Meyerhoefer, C.D. COVID-19 and the Demand for Online Food Shopping Services: Empirical Evidence from Taiwan. Available online: https://www.nber.org/system/files/working_papers/w27427/w27427.pdf (accessed on 1 October 2020).
  14. Al-Maroof, R.S.; Salloum, S.A.; Hassanien, A.E.; Shaalan, K. Fear from COVID-19 and technology adoption: The impact of Google Meet during Coronavirus pandemic. Interact. Learn. Environ. 2020, 13, 1–6. [Google Scholar] [CrossRef]
  15. Gössling, S.; Scott, D.; Hall, C.M. Pandemics, tourism and global change: A rapid assessment of COVID-19. J. Sustain. Tour. 2020, 29, 1–20. [Google Scholar]
  16. Ruiz Estrada, M.A.; Khan, A. Globalization and Pandemics: The Case of COVID-19. Available online: https://ssrn.com/abstract=3560681 (accessed on 1 October 2020).
  17. Wang, G.; Zhang, Y.; Zhao, J.; Zhang, J.; Jiang, F. Mitigate the effects of home confinement on children during the COVID-19 outbreak. Lancet 2020, 395, 945–947. [Google Scholar] [CrossRef]
  18. Budd, L.; Ison, S. Responsible Transport: A post-COVID agenda for transport policy and practice. Transp. Res. Interdiscip. Perspect. 2020, 6, 100151. [Google Scholar]
  19. Ivanov, D. Predicting the impacts of epidemic outbreaks on global supply chains: A simulation-based analysis on the coronavirus outbreak (COVID-19/SARS-CoV-2) case. Transp. Res. Part E Logist. Transp. Rev. 2020, 136, 101922. [Google Scholar] [CrossRef] [PubMed]
  20. Ullah, F.; Sepasgozar, S.M.E. A Study of Information Technology Adoption for Real-Estate Management: A System Dynamic Model. Available online: https://www.worldscientific.com/doi/abs/10.1142/9789813272491_0027 (accessed on 1 October 2020).
  21. Arellana, J.; Márquez, L.; Cantillo, V. COVID-19 Outbreak in Colombia: An Analysis of Its Impacts on Transport Systems. J. Adv. Transp. 2020, 2020, 8867316. [Google Scholar] [CrossRef]
  22. Liu, L.; Miller, H.J.; Scheff, J. The impacts of COVID-19 pandemic on public transit demand in the United States. PLoS ONE 2020, 15, e0242476. [Google Scholar] [CrossRef]
  23. Campisi, T.; Basbas, S.; Skoufas, A.; Akgün, N.; Ticali, D.; Tesoriere, G. The Impact of COVID-19 Pandemic on the Resilience of Sustainable Mobility in Sicily. Sustainability 2020, 12, 8829. [Google Scholar] [CrossRef]
  24. Tay, D.; Du, K.; Ho, J.; Liu, F.; Chan, C.; Cao, C. The Aviation Industry: Tackling the turbulence caused by COVID-19. IETI Trans. Econ. Manag. 2020, 1, 44–56. [Google Scholar]
  25. Suzumura, T.; Kanezashi, H.; Dholakia, M.; Ishii, E.; Napagao, S.A.; Pérez-Arnal, R.; Garcia-Gasulla, D. The Impact of COVID-19 on Flight Networks. arXiv 2020, arXiv:2020.02950. [Google Scholar]
  26. Nhamo, G.; Dube, K.; Chikodzi, D. Impact of COVID-19 on the Global Network of Airports. In Counting the Cost of COVID-19 on the Global Tourism Industry; Springer: Berlin, Germany, 2020; pp. 109–133. [Google Scholar]
  27. Mofijur, M.; Fattah, I.M.R.; Alam, M.A.; Islam, A.B.M.S.; Ong, H.C.; Rahman, S.M.A.; Najafi, G.; Ahmed, S.F.; Uddin, M.A.; Mahlia, T.M.I. Impact of COVID-19 on the social, economic, environmental and energy domains: Lessons learnt from a global pandemic. Sustain. Prod. Consum. 2021, 26, 343–359. [Google Scholar] [CrossRef]
  28. Cui, J.; Dodson, J.; Hall, P.V. Planning for Urban Freight Transport: An Overview. Transp. Rev. 2015, 35, 583–598. [Google Scholar] [CrossRef]
  29. Hensher, D.A.; Wei, E.; Beck, M.; Balbontin, C. The impact of COVID-19 on cost outlays for car and public transport commuting-The case of the Greater Sydney Metropolitan Area after three months of restrictions. Transp. Policy 2021, 101, 71–80. [Google Scholar] [CrossRef]
  30. McKibbin, W.J.; Fernando, R. The Global Macroeconomic Impacts of COVID-19: Seven Scenarios. Available online: http://www.sensiblepolicy.com/download/2020/2020WorkingPapers/2020_19_CAMA_COVID19_mcKibbin_fernando_0.pdf (accessed on 12 November 2020).
  31. Moovit. Moovit Aps Usage of the Previous 7 Days in Each City Compared to a Typical Week before the Outbreak Began. Available online: https://moovit.com/ (accessed on 12 November 2020).
  32. Munawar, H.S. International Journal of Wireless and Microwave Technologies (IJWMT); MECS Press: Hong Kong, 2020; pp. 1–8. [Google Scholar]
  33. COVID-19 Community Mobility Reports 2020. Available online: https://arxiv.org/abs/2004.04145 (accessed on 12 November 2020).
  34. ABS. Characteristics of Employment; In Australian Bureau of Statistics: Canberra, Australia, 2019. [Google Scholar]
  35. Munawar, H.S. Applications of Leaky-Wave Antennas: A Review; MECS Press: Hong Kong, 2020. [Google Scholar]
  36. Aktay, A.; Bavadekar, S.; Cossoul, G.; Davis, J.; Desfontaines, D.; Fabrikant, A.; Gabrilovich, E.; Gadepalli, K.; Gipson, B.; Guevara, M.; et al. Google COVID-19 Community Mobility Reports: Anonymization Process Description (Version 1.0). Available online: https://arxiv.org/pdf/2004.04145v2.pdf (accessed on 17 November 2020).
  37. Munawar, H.S.; AAwan, A.A.; Khalid, U.; Munawar, S.; Maqsood, A. Revolutionizing Telemedicine by Instilling H. 265. Int. J. Image Graph. Signal Process. 2017, 9, 20–27. [Google Scholar] [CrossRef] [Green Version]
  38. Munawar, H.S.; Awan, A.A.; Maqsood, A.; Khalid, U. Reinventing Radiology in Modern ERA. I.J. Wirel. Microw. Technol. 2020, 4, 34–38. [Google Scholar]
  39. QLD. Queensland Government, Open Data Portal. Available online: https://www.data.qld.gov.au/dataset?groups=transportation (accessed on 17 November 2020).
  40. Munawar, H.S.; Khalid, U.; Jilani, R.; Maqsood, A. Version Management by Time Based Approach in Modern Era. Int. J. Educ. Manag. Eng. 2017, 4, 13–20. [Google Scholar] [CrossRef] [Green Version]
  41. Muhammad, A.; Dias, C.; Muley, D.; Shahin, M. Exploring the impacts of COVID-19 on travel behavior and mode preferences. Transp. Res. Interdiscip. Perspect. 2020, 8, 100255. [Google Scholar]
  42. Beck, M.J.; Hensher, D.A. Insights into the Impact of Covid-19 on Household Travel, Working, Activities And Shopping in Australia–the early days under Restrictions. Transp. Policy 2020, 96, 76–93. [Google Scholar] [CrossRef]
  43. Sandhu, P.; de Wolf, M. The impact of COVID-19 on the undergraduate medical curriculum. Med Educ. Online 2020, 25, 1764740. [Google Scholar] [CrossRef]
  44. Prentice, C.; Chen, J.; Stantic, B. Timed intervention in COVID-19 and panic buying. J. Retail. Consum. Serv. 2020, 57, 102203. [Google Scholar] [CrossRef]
  45. Zachreson, C.; Mitchell, L.; Lydeamore, M.J.; Rebuli, N.; Tomko, M.; Geard, N. Risk mapping for COVID-19 outbreaks in Australia using mobility data. J. R. Soc. Interface 2021, 18, 20200657. [Google Scholar] [CrossRef]
  46. Flew, T.; Kirkwood, K. The impact of COVID-19 on cultural tourism: Art, culture and communication in four regional sites of Queensland, Australia. Media Int. Aust. 2020, 1329878X20952529. [Google Scholar] [CrossRef]
  47. Hughes, D. In the frame, road map for Australian sport on an uncertain journey through COVID-19. J. Sci. Med. Sport 2020, 23, 636–638. [Google Scholar] [CrossRef] [PubMed]
  48. Ghaderi, H.; Cahoon, S.; Nguyen, H.-O. An Investigation into the Non-bulk Rail Freight Transport in Australia. Asian J. Shipp. Logist. 2015, 31, 59–83. [Google Scholar] [CrossRef]
  49. Allen, J.; Browne, M.; Woodburn, A.; Leonardi, J. The Role of Urban Consolidation Centres in Sustainable Freight Transport. Transp. Rev. 2012, 32, 473–490. [Google Scholar] [CrossRef]
  50. Munawar, H.S. An Overview of Reconfigurable Antennas for Wireless Body Area Networks and Possible Future Prospects. Int. J. Wirel. Microw. Technol. 2020, 10, 1–8. [Google Scholar] [CrossRef] [Green Version]
  51. Przybylowski, A.; Stelmak, S.; Suchanek, M. Mobility Behaviour in View of the Impact of the COVID-19 Pandemic—Public Transport Users in Gdansk Case Study. Sustainability 2021, 13, 364. [Google Scholar] [CrossRef]
  52. Team, V.; Manderson, L. How COVID-19 Reveals Structures of Vulnerability. Med. Anthropol. 2020, 39, 671–674. [Google Scholar] [CrossRef]
  53. Pombal, R.; Hosegood, I.; Powell, D. Risk of COVID-19 During Air Travel. JAMA 2020, 324, 1798. [Google Scholar] [CrossRef]
  54. Munawar, H.S.; Qayyum, S.; Ullah, F.; Sepasgozar, S. Big Data and Its Applications in Smart Real Estate and the Disaster Management Life Cycle: A Systematic Analysis. Big Data Cogn. Comput. 2020, 4, 4. [Google Scholar] [CrossRef] [Green Version]
  55. Bielecki, M.; Patel, D.; Hinkelbein, J.; Komorowski, M.; Kester, J.; Ebrahim, S.; Rodriguez-Morales, A.J.; Memish, Z.A.; Schlagenhauf, P. Reprint of: Air travel and COVID-19 prevention in the pandemic and peri-pandemic period: A narrative review. Travel Med. Infect. Dis. 2020, 38, 101939. [Google Scholar] [CrossRef]
  56. Eroğlu, H. Effects of Covid-19 outbreak on environment and renewable energy sector. Environ. Dev. Sustain. 2020, 1–9. [Google Scholar] [CrossRef]
  57. Munawar, H.S.; Hammad, A.; Ullah, F.; Ali, T.H. After the flood: A novel application of image processing and machine learning for post-flood disaster management. In Proceedings of the International Conference on Sustainable Development in Civil Engineering (ICSDC 2019), Jamshoro, Pakistan, 5–7 December 2019; pp. 5–7. [Google Scholar]
  58. Ho, S.-J.; Xing, W.; Wu, W.; Lee, C.-C. The impact of COVID-19 on freight transport: Evidence from China. MethodsX 2021, 8, 101200. [Google Scholar] [CrossRef] [PubMed]
  59. Nižetić, S. Impact of coronavirus (COVID-19) pandemic on air transport mobility, energy, and environment: A case study. Int. J. Energy Res. 2020, 44, 10953–10961. [Google Scholar] [CrossRef]
  60. Hensher, D.A. What might Covid-19 mean for mobility as a service (MaaS)? Transp. Rev. 2020, 40, 551–556. [Google Scholar] [CrossRef]
  61. Beck, M.J.; Hensher, D.A. Slowly coming out of COVID-19 restrictions in Australia: Implications for working from home and commuting trips by car and public transport. J. Transp. Geogr. 2020, 88, 102846. [Google Scholar] [CrossRef]
  62. Munawar, H.S. Flood Disaster Management. Mach. Vis. Insp. Syst. 2020, 1, 115–146. [Google Scholar] [CrossRef]
  63. Liebig, J.; Najeebullah, K.; Jurdak, R.; El Shoghri, A.; Paini, D. Should International Borders Re-Open? The Impact of Travel Restrictions on COVID-19 Importation Risk. Available online: https://www.medrxiv.org/content/10.1101/2020.10.11.20211060v1.article-metrics (accessed on 17 November 2020).
  64. Munawar, H.S.; Zhang, J.; Li, H.; Mo, D.; Chang, L. Mining Multispectral Aerial Images for Automatic Detection of Strategic Bridge Locations for Disaster Relief Missions; Springer International Publishing: Cham, Switzerland, 2019; pp. 189–200. [Google Scholar]
  65. Qadir, Z.; Ever, E.; Batunlu, C. Use of Neural Network Based Prediction Algorithms for Powering Up Smart Portable Accessories. Neural. Process. Lett. 2021, 1–36. [Google Scholar] [CrossRef]
  66. Al-Turjman, F.; Qadir, Z.; Abujubbeh, M.; Batunlu, C. Feasibility analysis of solar photovoltaic-wind hybrid energy system for household applications. Comput. Electr. Eng. 2020, 86, 106743. [Google Scholar] [CrossRef]
  67. Qadir, Z.; Tafadzwa, V.; Rashid, H.; Batunlu, C. Smart Solar Micro-Grid Using ZigBee and Related Security Challenges. In Proceedings of the 2018 18th Mediterranean Microwave Symposium (MMS), Istanbul, Turkey, 31 October–2 November 2018; pp. 299–302. [Google Scholar] [CrossRef]
  68. Qadir, Z.; Al-Turjman, F.; Khan, M.A.; Nesimoglu, T. ZIGBEE Based Time and Energy Efficient Smart Parking System Using IOT. In Proceedings of the 2018 18th Mediterranean Microwave Symposium (MMS), Istanbul, Turkey, 31 October–2 November 2018; pp. 295–298. [Google Scholar] [CrossRef]
  69. Qadir, Z.; Abujubbeh, M.; Mariam, A.; Fahrioglu, M.; Batunlu, C. Hydropower Capacity of Different Power Sectors in Pakistan. In Proceedings of the 2019 1st Global Power, Energy and Communication Conference (GPECOM), Nevsehir, Turkey, 12–15 June 2019; pp. 408–412. [Google Scholar] [CrossRef]
  70. Abujubbeh, M.; Marazanye, V.T.; Qadir, Z.; Fahrioglu, M.; Batunlu, C. Techno-Economic Feasibility Analysis of Grid-Tied PV-Wind Hybrid System to Meet a Typical Household Demand: Case Study-Amman, Jordan. In Proceedings of the 2019 1st Global Power, Energy and Communication Conference (GPECOM), Nevsehir, Turkey, 12–15 June 2019; pp. 418–423. [Google Scholar] [CrossRef]
  71. Qadir, Z.; Ullah, F.; Munawar, H.S.; Al-Turjman, F. Addressing disasters in smart cities through UAVs path planning and 5G communications: A systematic review. Comput. Commun. 2021. [Google Scholar] [CrossRef]
  72. Qadir, Z.; Khan, S.I.; Khalaji, E.; Munawar, H.S.; Fadi Al-Turjman, M.A.; Mahmud, P.; Kouzani, A.Z.; Le, K. Predicting the energy output of hybrid PV–wind renewable energy system using feature selection technique for smart grids. Energy Rep. 2021. [Google Scholar] [CrossRef]
  73. Ullah, F.; Sepasgozar, S.M.; Wang, C. A systematic review of smart real estate technology: Drivers of, and barriers to, the use of digital disruptive technologies and online platforms. Sustainability 2018, 10, 3142. [Google Scholar] [CrossRef] [Green Version]
  74. Ullah, F.; Sepasgozar, S.M.; Siddiqui, S. An investigation of real estate technology utilization in technologically advanced marketplace. In Proceedings of the 9th International Civil Engineering Congress (ICEC-2017),“Striving Towards Resilient Built Environment”, Karachi, Pakistan, 22–23 December 2017; pp. 22–23. [Google Scholar]
  75. Ullah, F.; Samad, S.P.; Ali, T.H. Real estate stakeholders technology acceptance model (RESTAM): User-focused big9 disruptive technologies for smart real estate management. In Proceedings of the 2nd International Conference on Sustainable Development in Civil Engineering (ICSDC 2019), Jamshoro, Pakistan, 5–7 December 2019; pp. 5–7. [Google Scholar]
  76. Low, S.; Ullah, F.; Shirowzhan, S.; Sepasgozar, S.M.; Lee, C.L. Smart digital marketing capabilities for sustainable property development: A case of Malaysia. Sustainability 2020, 12, 5402. [Google Scholar] [CrossRef]
  77. Ullah, F.; Shinetogtokh, T.; Samad, S.P.; Ali, T.H. Investigation of the users’ interaction with online real estate platforms in Australia. In Proceedings of the 2nd International Conference on Sustainable Development in Civil Engineering (ICSDC 2019), Jamshoro, Pakistan, 5–7 December 2019; pp. 25–27. [Google Scholar]
Figure 1. Several COVID-19 cases in different states.
Sustainability 13 01276 g001
Figure 2. Transport demand per hour at the MTA New York City subway. (Source: Liu et al., 2020 [22]).
Sustainability 13 01276 g002
Figure 3. Methodology for article retrieval and review process.
Sustainability 13 01276 g003
Figure 4. Keywords found in literature related to Covid-19 effects on transport revenues.
Sustainability 13 01276 g004
Figure 5. Mobility changes observed in Australians during the COVID-19 [Source: Google Mobility Report].
Sustainability 13 01276 g005
Figure 6. Reduction in a private car during the initial phase of stage 2 restrictions.
Sustainability 13 01276 g006
Figure 7. Percentage of changes in transport use during January–October 2020 (Apple Mobility Trends).
Sustainability 13 01276 g007
Figure 8. South East Queensland public transport usage during COVID19 (Source: Queensland government).
Sustainability 13 01276 g008
Figure 9. A 7-day average of the passengers availing the light rail service in Canberra (Source: Australian Capital Territory (ACT) government).
Sustainability 13 01276 g009
Figure 10. Weekly averages of Mobility Index in Sydney and Melbourne (CityMapper, 2020).
Sustainability 13 01276 g010
Figure 11. Australian International air passengers [Source: IBISWorld, BITRE Aviation Statistics].
Sustainability 13 01276 g011
Figure 12. Weekly spending in major airports dropping before travel bans (Source: ANZ Research).
Sustainability 13 01276 g012
Figure 13. Australian International airfreight transport (Source: IBISWorld, BITRE Aviation Statistics).
Sustainability 13 01276 g013
Table 1. Retrieved research articles.
CategoryTitleSourceRef.
Cat-1New Insights on a Rapidly Changing EpidemicPubMed[28]
Globalization and Pandemics: The Case of COVID-19SSRN[16]
Cat-2How COVID-19 and the Dutch ‘intelligent lockdown’ change activities, work and travel behaviour: Evidence from longitudinal data in the NetherlandsScienceDirect[29]
Effects of the COVID- 19 lockdowns on urban mobility: empirical evidence from the city of Santander (Spain)MDPI[7]
Modal share changes due to COVID-19: the case of BudapestScienceDirect[5]
The global macroeconomic impacts of COVID-19: seven scenariosSSRN[30]
Mitigate the effects of home confinement on children during the COVID-19 outbreakPubMed[17]
Predicting the impacts of epidemic outbreaks on global supply chains: a simulation-based analysis on the coronavirus outbreak (COVID-19/SARS-CoV-2 [19]) caseScienceDirect[19]
What might Covid-19 mean for mobility as a service (MaaS)Transport Reviews [8]
Should international borders re-open? The impact of travel restrictions on COVID-19 importation riskmedRxiv[10]
Cat-3Insights into the impact of COVID-19 on household travel and activities in Australia—The early days of easing restrictionsTransport Policy (Elsevier)[18]
Table 2. The magnitude of decreased public transport usage.
R20.100
Adj. R20.089
F (8689)9.56
Fsig0
Std. Err. Est.24.479
VariableCoefficientStd. ErrtValue
Constant−35.103.5−8.67
Change in days of employment −2.980.6−5.89
Change in days worked from home 2.980.55.91
Daily grocery affected by COVID-19 −7.271.98−32.67
Catch up with friends and family affected by COVID-19 outbreak−6.933.21−2.58
Work cannot be done from home6.892.872.78
Drive the car as main mode −6.782.36−3.01
Table 3. Interstate travel restrictions in Australia.
StateEnteringLeaving
NSWNo restrictions, except for those who have been in Victoria in the past 14 daysNo restrictions
VictoriaNo restrictionsPermit required to enter Tasmania, NSW, ACT, or Western Australia. Travel to South Australia is restricted.
QueenslandThose coming from COVID-19 hotspots are restrictedNo restrictions
TasmaniaThose coming from COVID-19 hotspots are restrictedNo restrictions
Western AustraliaInterstate border is closedInterstate border is closed
South AustraliaNo restrictions, except for those who have been in Victoria in the past 14 daysInterstate travel restrictions after being declared a COVID-19 hotspot
Northern TerritoryThose coming from COVID-19 hotspots are restrictedNo restrictions
ACTNo restrictions, except for those who have been in Victoria in the past 14 daysNo restrictions
Publisher’s Note: MDPI stays neutral with regard to jurisdictional claims in published maps and institutional affiliations.

