Article

Transmission Path Tracking of Maritime COVID-19 Pandemic via Ship Sailing Pattern Mining

1
College of Merchant Marine, Shanghai Maritime University, Shanghai 201306, China
2
College of Naval Architecture and Maritime, Zhejiang Ocean University, Zhoushan 316022, China
3
College of Navigation, Jimei University, Xiamen 361021, China
4
National-Local Joint Engineering Research Center for Marine Navigation Aids Services, Xiamen 361021, China
*
Author to whom correspondence should be addressed.
Sustainability 2021, 13(3), 1089; https://doi.org/10.3390/su13031089
Submission received: 7 December 2020 / Revised: 15 January 2021 / Accepted: 17 January 2021 / Published: 21 January 2021

Abstract

:
Since the spread of the coronavirus disease 2019 (COVID-19) pandemic, the transportation of cargo by ship has been seriously impacted. In order to prevent and control maritime COVID-19 transmission, it is of great significance to track and predict ship sailing behavior. As the nodes of cargo ship transportation networks, ports of call can reflect the sailing behavior of the cargo ship. Accurate hierarchical division of ports of call can help to clarify the navigation law of ships with different ship types and scales. For typical cargo ships, ships with deadweight over 10,000 tonnages account for 95.77% of total deadweight, and 592,244 berthing ships’ records were mined from automatic identification system (AIS) from January to October 2020. Considering ship type and ship scale, port hierarchy classification models are constructed to divide these ports into three kinds of specialized ports, including bulk, container, and tanker ports. For all types of specialized ports (considering ship scale), port call probability for corresponding ship type is higher than other ships, positively correlated with the ship deadweight if port scale is bigger than ship scale, and negatively correlated with the ship deadweight if port scale is smaller than ship scale. Moreover, port call probability for its corresponding ship type is positively correlated with ship deadweight, while port call probability for other ship types is negatively correlated with ship deadweight. Results indicate that a specialized port hierarchical clustering algorithm can divide the hierarchical structure of typical cargo ship calling ports, and is an effective method to track the maritime transmission path of the COVID-19 pandemic.

1. Introduction

With the popularity of ship-borne automatic identification systems, the data of ship trajectory have increased exponentially, which provide data support for the analysis of ship sailing patterns. A lot of studies in the literature have performed cluster analysis on ship trajectory data in a certain area, and clarified the ship sailing pattern in this area. Based on existing ship sailing patterns, the real-time trajectory of the ship is predicted to realize ship tracking [1,2]. However, few studies in the literature [3] analyze the ship behavior mode from the perspective of ship berthing port. As the node of the shipping network, the port of call is an important factor to predict the navigation behavior of ships.
Since the spread of the COVID-19 pandemic, the volume of maritime cargo transportation has shrunk significantly [4,5,6] in order to effectively prevent the spread of the pandemic at sea. However, affected by the internal demand of economic recovery in various countries, sea freight volume has steadily increased in the second half of 2020. In order to continuously and effectively monitor the spread of marine epidemics, it is very important to use the big data of ship automatic identification systems to monitor ship navigation behavior.
In order to effectively monitor the ship’s navigation behavior, the information of the ship’s berthing port is mined according to the ship’s speed and position, based on the typical cargo ship trajectory data provided by the ship-borne automatic identification system. According to classification of ship types and sizes, the classification model of specialized terminals (ports) is established, and the contribution of each ship type to port capacity (i.e., ship type importance) and the contribution of each ship scale to port-specific ship type capacity (i.e., ship scale importance) are calculated. The probability distribution of ships berthing at corresponding ports (ship type and size) can accurately reflect the behavior pattern of ships, which could provide an effective way to track the marine transmission path of the COVID-19 pandemic.
This paper is organized as follows: a literature review is presented in Section 2. A classification model of ports with special purpose terminals are established in Section 3. Then, a simulation is employed and the results are discussed in Section 4. Finally, this paper ends with a conclusion including suggestions for future works.

2. Literature Review

2.1. Construction of Cargo Transportation Network Considering Ship Type

Concerning maritime transportation of bulk cargo and container cargo, cargo throughput (that is, the total amount of cargo loading and unloading at a port during a period of time) is mainly used as a measure of port importance. Based on the coal transportation data of China’s coastal ports from 1973 to 2013, Ref. [7] construct a port space agglomeration evaluation model to evaluate the spatial agglomeration level and evolution law of coal transportation for ports. Based on the proportion of GDP in the area along the Maritime Silk Road in 2010–2013 and the proportion of regional port container throughput, Ref. [8] excavate hot spot ports along the Silk Road. Based on the GDP and container throughput of China’s major coastal ports in 2015, Ref. [9] make use of complex network theory to construct a network evolution model under the dual factors of port attraction and interport maritime distance. Based on the container throughput data of important ports along the Maritime Silk Road in 1995, 2005, and 2015, Ref. [10] analyze the evolution process of the international shipping network of China by using the hub degree model, complex network method, and Hirschman–Herfindahl Index (HHI). Based on berthing data of global Ro-Ro ships in 2012–2014, Ref. [11] excavate the important domestic and international ro-ro terminals. Ref. [12] use statistics of the frequency of port calls in the maritime network based on the container shipping schedule of COSCO Container Lines and the Maersk Line in 2014, and assess the status of Asian ports in the maritime network by using the node importance research method in complex network theory.
Ref. [13] make use of a clustering algorithm to identify abnormal berthing outside the port and anchorage based on the container ship mooring data of Shanghai Waigaoqiao Port in 2016. Ref. [14] construct a container shipping network in the Asian region based on the liner route, schedule, and capacity data, and analyze its structural characteristics and evolution model. Ref. [15,16] build a container shipping network based on shipping data of important liner companies around the world, divide the network level, and analyze its anti-jamming capability. Ref. [17,18] build a container shipping network, sort the network hierarchy based on the shipping data of the world’s major container liner shipping companies, and analyze the impact of the navigation of the Arctic routes on the network. Based on global container liner shipping company route data from 2015 to 2016, Ref. [19] establish a global container shipping network to evaluate port importance. Ref. [20] build a global container shipping network based on the data of the world’s major container liner shipping companies in 2004 and 2014, and analyze its vulnerability. Ref. [21,22] analyze the central extent of the world’s important container ports in the shipping network topology, based on the world’s major container liner shipping company route data. Ref. [23] build a container shipping network based on the main route data of global container shipping in 2002–2014, and have measured the joint strength of the node space. Ref. [24] build a global container shipping network based on the cargo throughput of 25 major container ports around the world in 2010. The above literature only counts the distribution of important ports of a ship type and establishes a regional or global maritime network, without considering the importance of the ship type in relation to the port.

2.2. Hierarchical Clustering of Ports Considering Ship Type

Based on AIS data, Ref. [25] count the top 20 ports of the major cargo ships in the world in 2005 (including seven types of tankers, such as tankers, container ships, and bulk carriers) with a total capacity of 10,000 tons or more. Ref. [26] construct a global shipping network (including port transit information) of tankers, container ships, and bulk carriers, and evaluate the importance of ports in the entire marine transportation network according to node degree and intermediary centrality. Based on a shipping company’s 1977–2008 ship (including container ships, dry bulk cargo, liquid bulk cargo, and other six types of ship) capacity, port of call, and route data, Ref. [27] build a variety of cargo ship shipping networks, and port throughput is taken as the importance of network nodes in sorting the network hierarchy. Based on the AIS data of the Maritime Silk Road, the BRICS countries, and the important economic development areas of the United States, Japan, and South Korea from 2013 to 2016, Ref. [28] construct a shipping network of tankers, container ships, and bulk carriers in the region, and analyze the evolution of time and space. Based on AIS data of global tankers, container ships, and bulk carriers in 2007, Ref. [29] build a shipping network and comparatively analyze the characteristics of various types of typical cargo ships. Ref. [30] build a global container ship, bulk carrier, and tanker shipping network based on AIS data of global cargo ship in 2015, and analyze the network’s anti-interference ability. The above literature shares statistics on the distribution of important ports for a variety of cargo ships, but it does not compare the contribution of various ship types to port throughput, and ignores the contribution of ship scale to port throughput. The established shipping network cannot accurately reflect the importance of ship type and ship scale to the port.
With the popularity of ship borne AIS equipment, full coverage of AIS base stations, and maturity of data management technologies, AIS data can accurately reflect global shipping port records and could be used to construct cargo transportation network. Based on global shipping port records, this paper comprehensively considers category type and size of port, builds classification model of specialized port and frequent port, and analyzes ship sailing pattern of typical cargo ships.

3. Method

The data in this paper are derived from on-board AIS equipment, transmitted by VHF, satellite, or network. In order to accurately describe the berthing ships, the set of the ship called S is defined as follows:
S = S 1 , S 2 , , S i , , S m
In Formula (1), m means the max number of ship types and S i is the set of i type ships. According to Table 1, it is defined as follows:
S i = S i 1 , S i 2 , , S i j , , S i n
In Formula (2), n means the max number of ship scales; S i j is the set of i type i scale ships, which is defined as Formula (3):
S i j = S i j 1 , S i j 2 , , S i j k , , S i j p
In Formula (3), p means the max number of ship calls, S i j k is the set of i type j scale k ship, which is defined as Formula (4):
S i j k = m i j k t , c i j k t , d i j k t , p i j k t
In Formula (4), t means the time of port call for the ship, m ijkt is the maritime mobile identification code of i type j scale k ship, c ijkt is the ship type, d ijkt is the total deadweight of the ship, and p ijkt is the port name.
According to statistical model of berthing ships in the port [31], we obtain records of typical global cargo ships with deadweight more than 10,000 in 2020, including 155,227 bulk carrier records, 240,944 container ship records, and 196,073 tanker records, as seen in Table 2.

3.1. Classification Model of Ports with Special-Purpose Terminals

In order to mine ship sailing pattern, referring to the classification of ship types and scales, port capacity of corresponding ships are calculated based on ship’s AIS data. Comprehensively considering the proportion of transport capacity of a major maritime cargo merchant fleet and port capacity ratio for each ship type and size, it can reflect the contribution of each ship type and size to port capacity to a certain extent—that is, the importance degree of ship type and size, which is an important dimension of port hierarchy.
n ijkl is defined as the arrival frequency of l port for i type j scale k ship, which means the number of ships berthing at l port for i type j scale k ship within a certain period of time. d ijkl stands for the capacity of l port for i type j scale k ship, the calculation method of which is shown in Formula (5):
d ijkl = d i j k n i j k l
d ijl is defined as the capacity of l port for i type j scale ships, as seen in Formula (6); d il is defined as the capacity of l port for i type ships, as seen in Formula (7); d l is defined as the capacity of l port for all ships, as seen in Formula (8):
d i j l = k d i j k l
d i l = j k d i j k l
d l = i j k d i j k l
d ijl   /   d il is defined as the capacity ratio of j scale in i type ships at l port, l d ijl   /   l d il is defined as the proportion of transport capacity of j scale cargo merchant fleet for i type ships, I ijl is defined as the importance degree of i type j scale ship for port l , which means the capacity ratio of i type j scale ships for port l , the calculation of which is shown in Formula (9). d il   /   d l is defined as the capacity ratio of i type ships at l port, l d il   /   l d l is defined as the proportion of transport capacity for i type cargo merchant fleet, I il is defined as the importance degree of i type ships for port l , which means the capacity ratio of i type ships for port l , the calculation of which is shown in Formula (10):
I ijl = d ijl l d il d il l d ijl / j d ijl l d il d il l d ijl
I il = d il l d l d l l d il / i d il l d l d l l d il

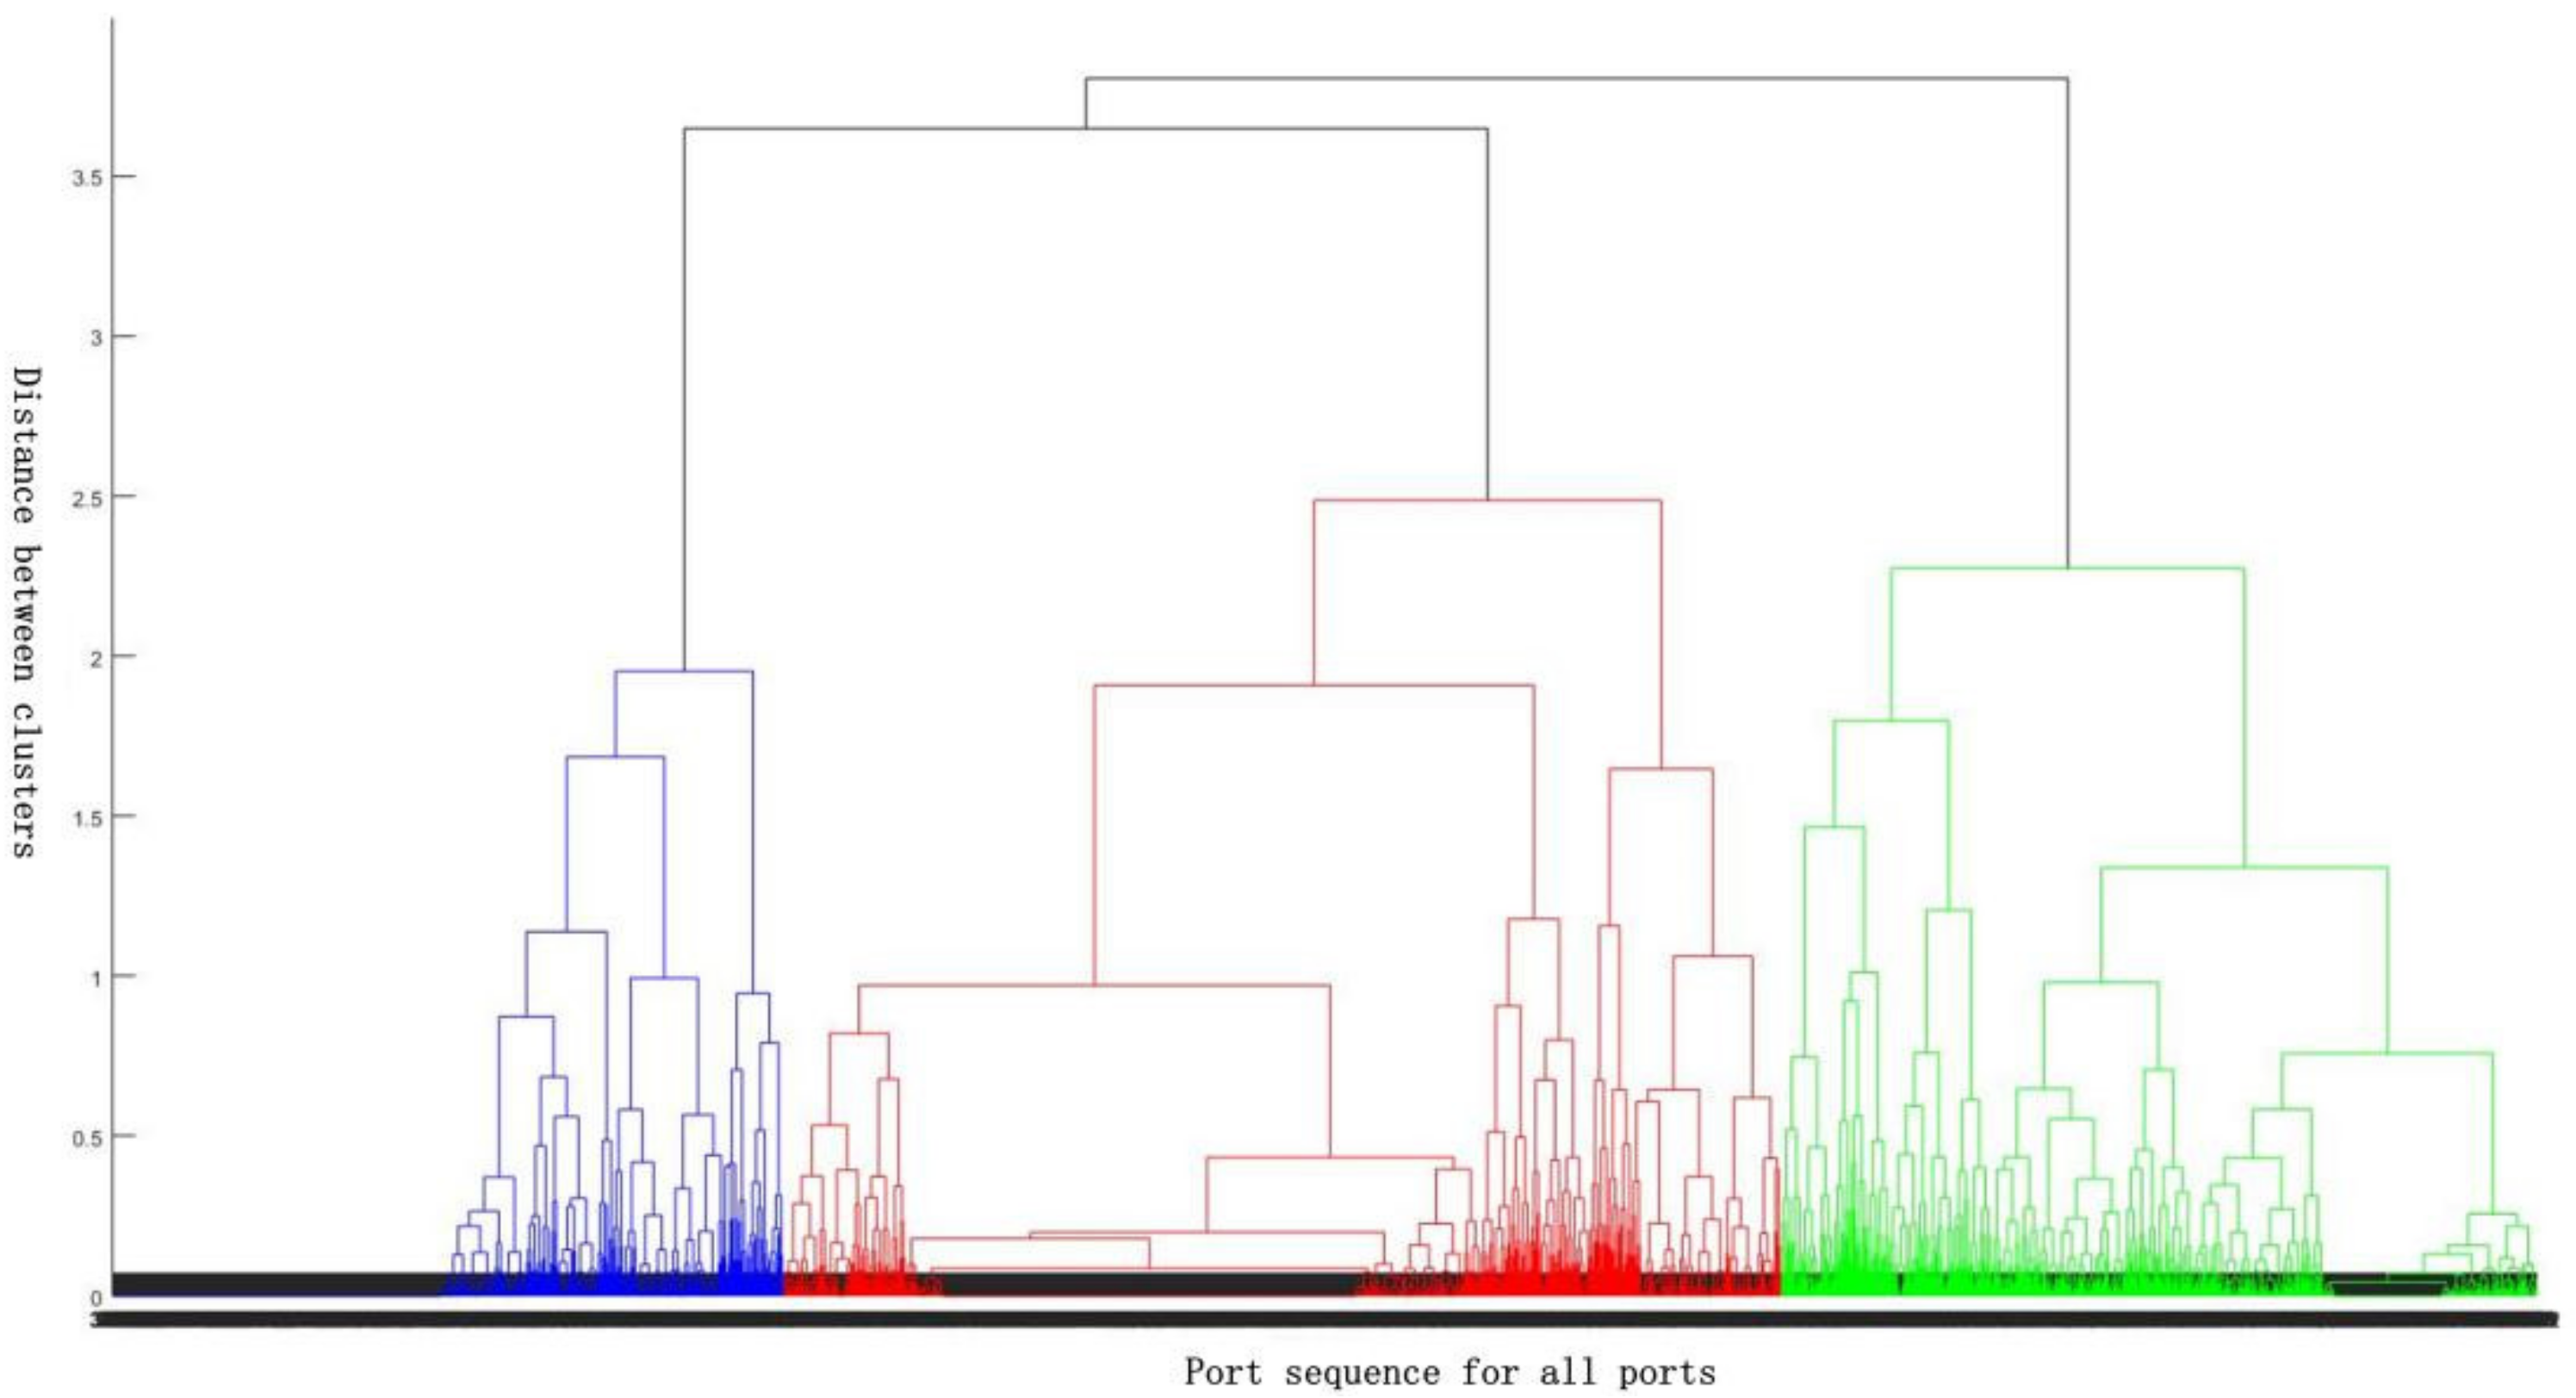
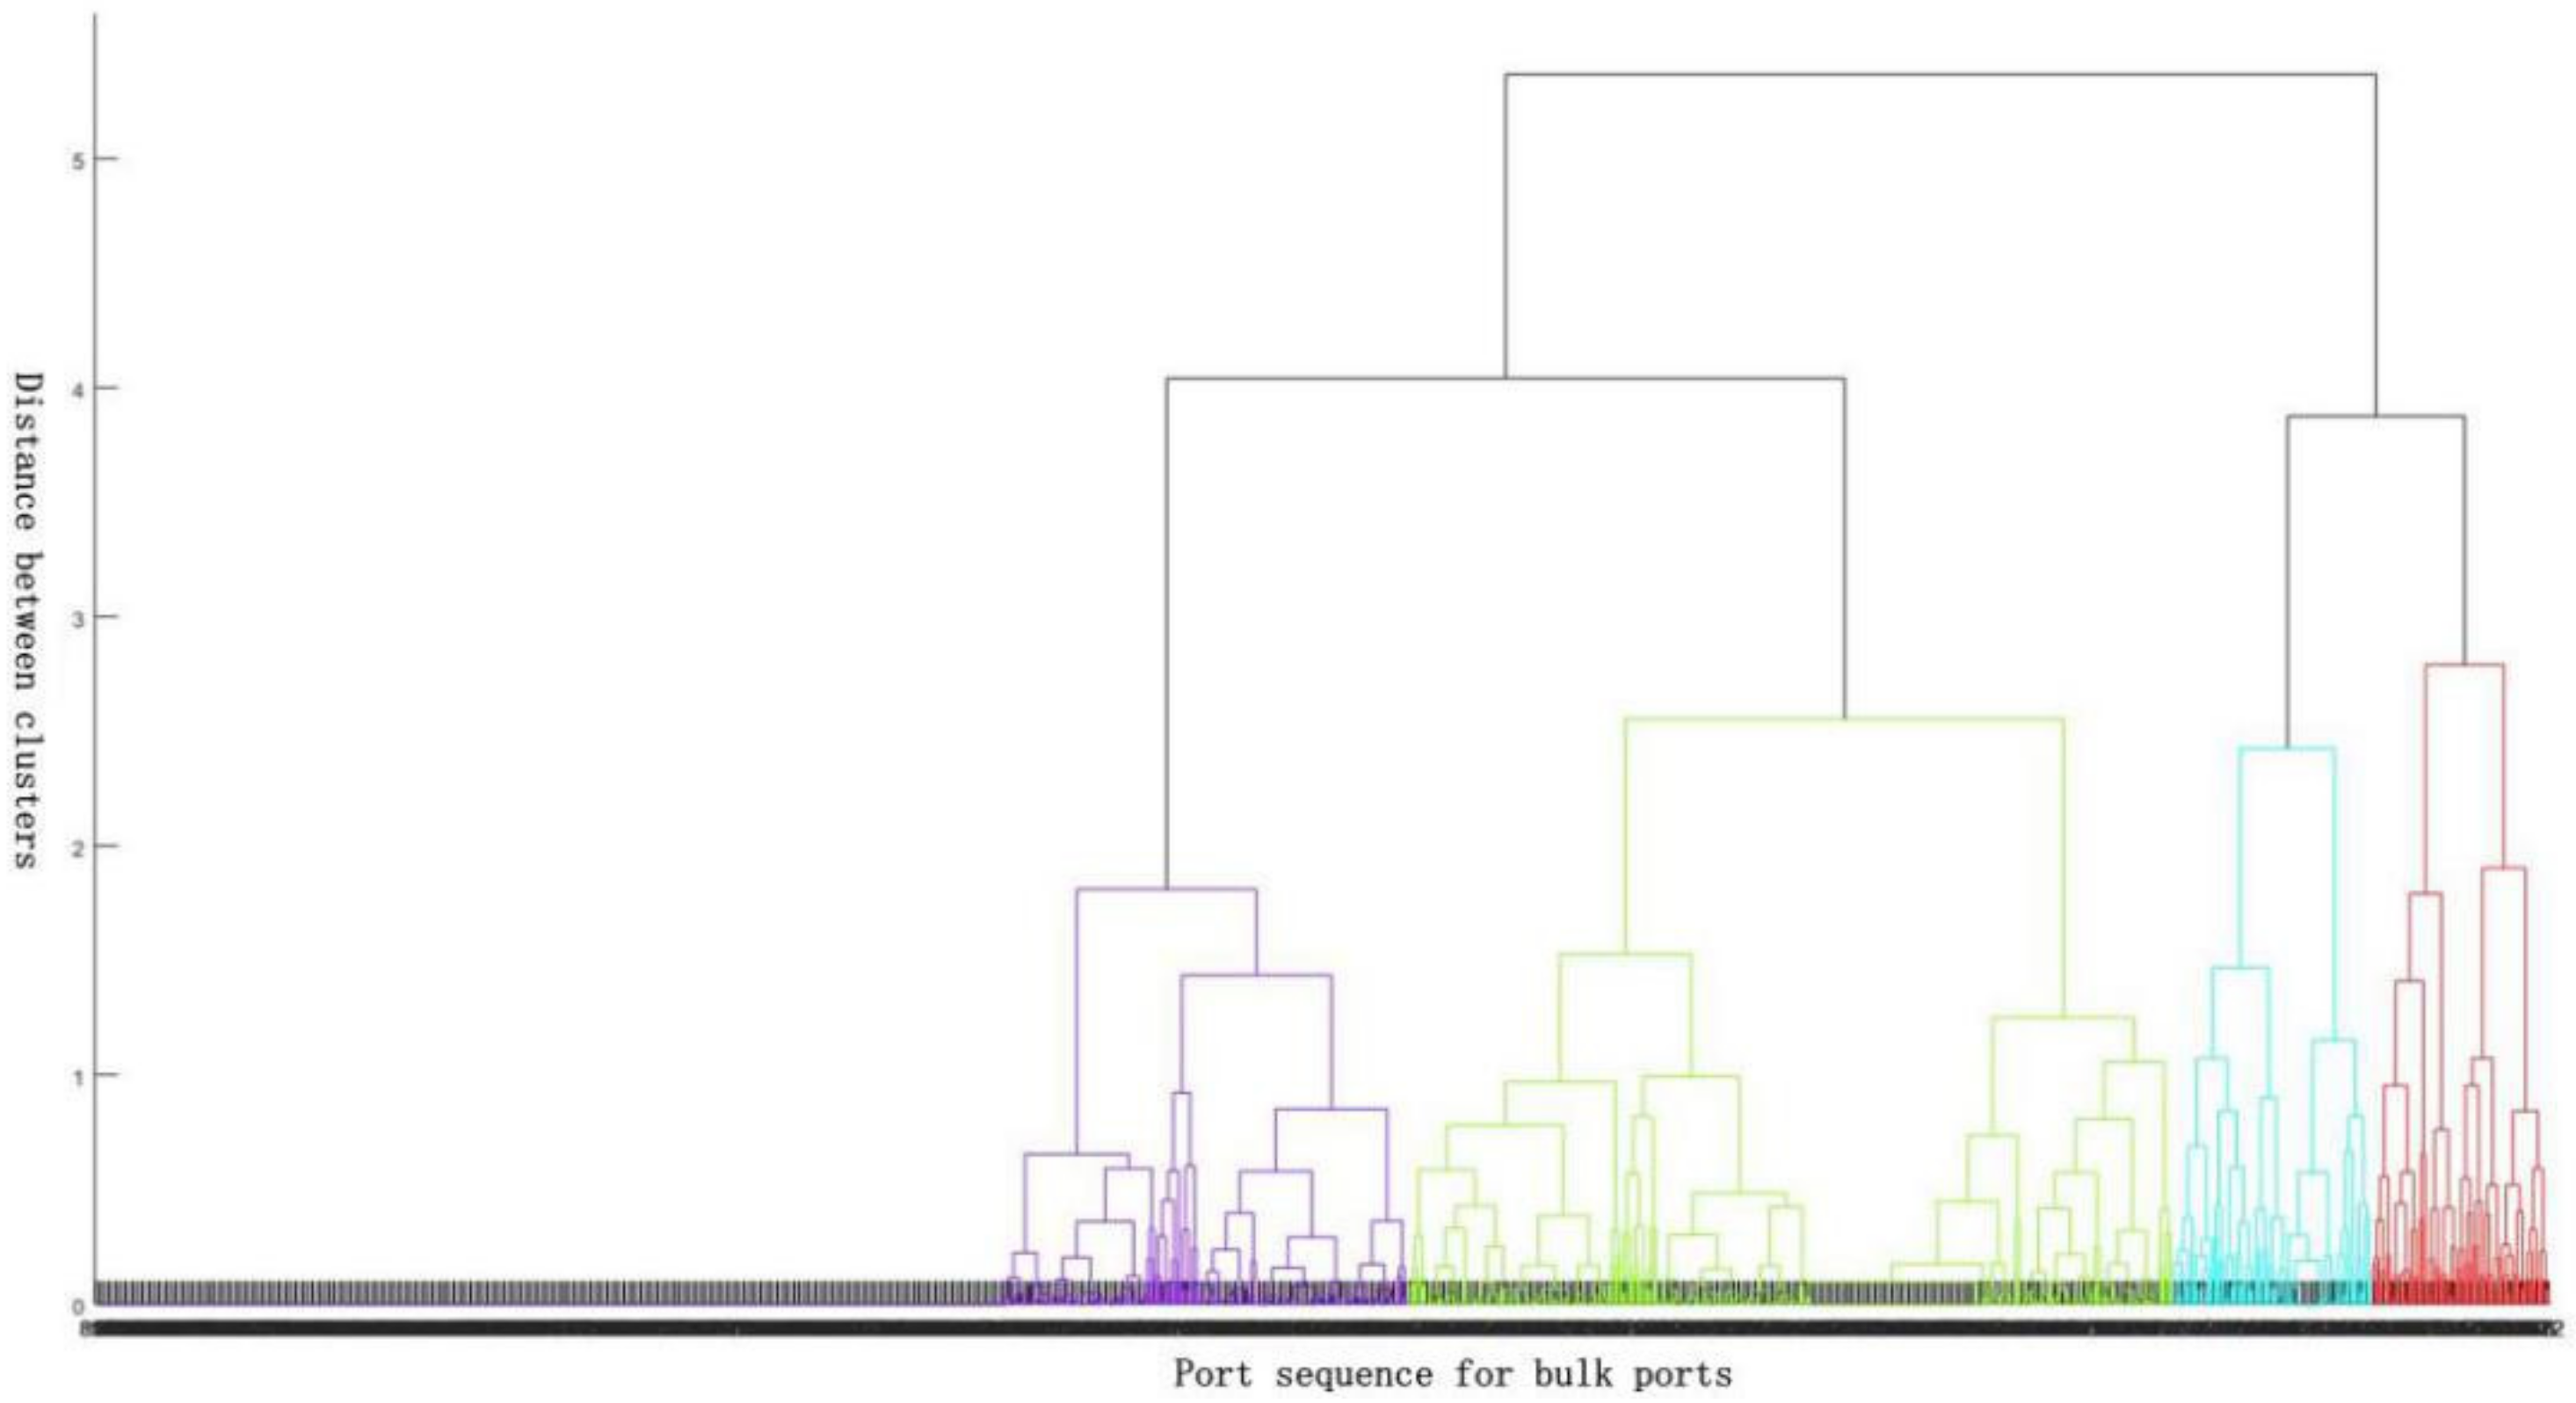
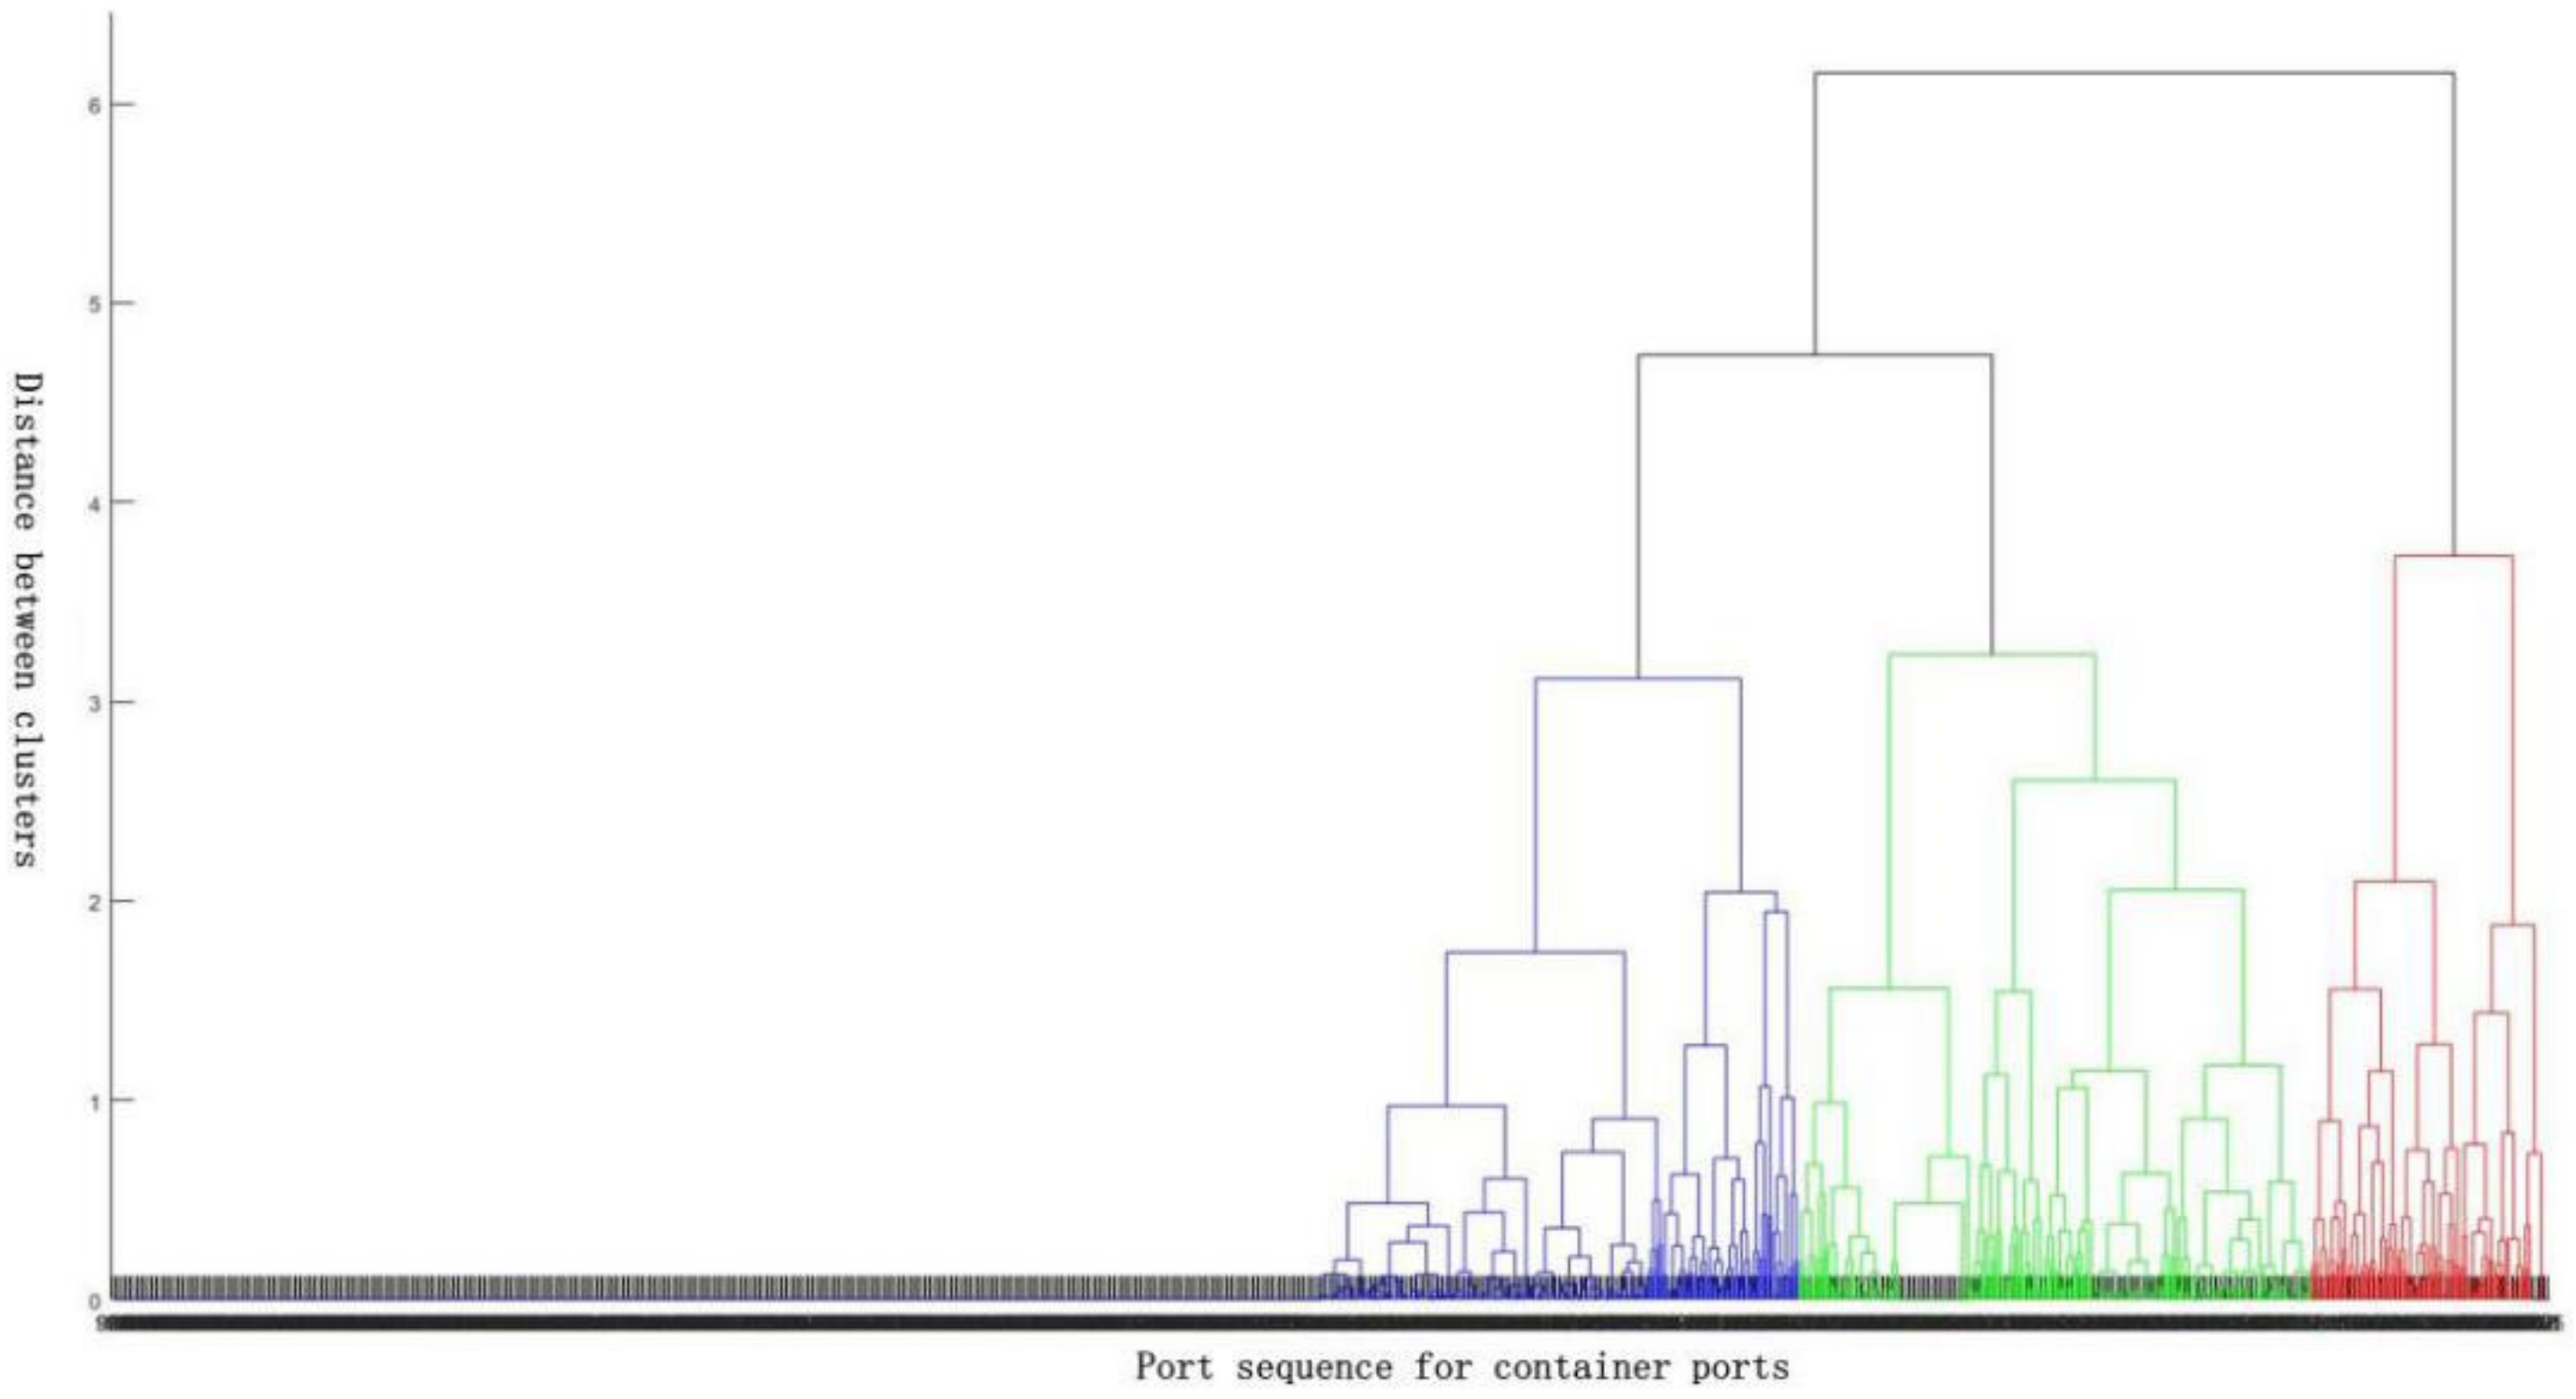
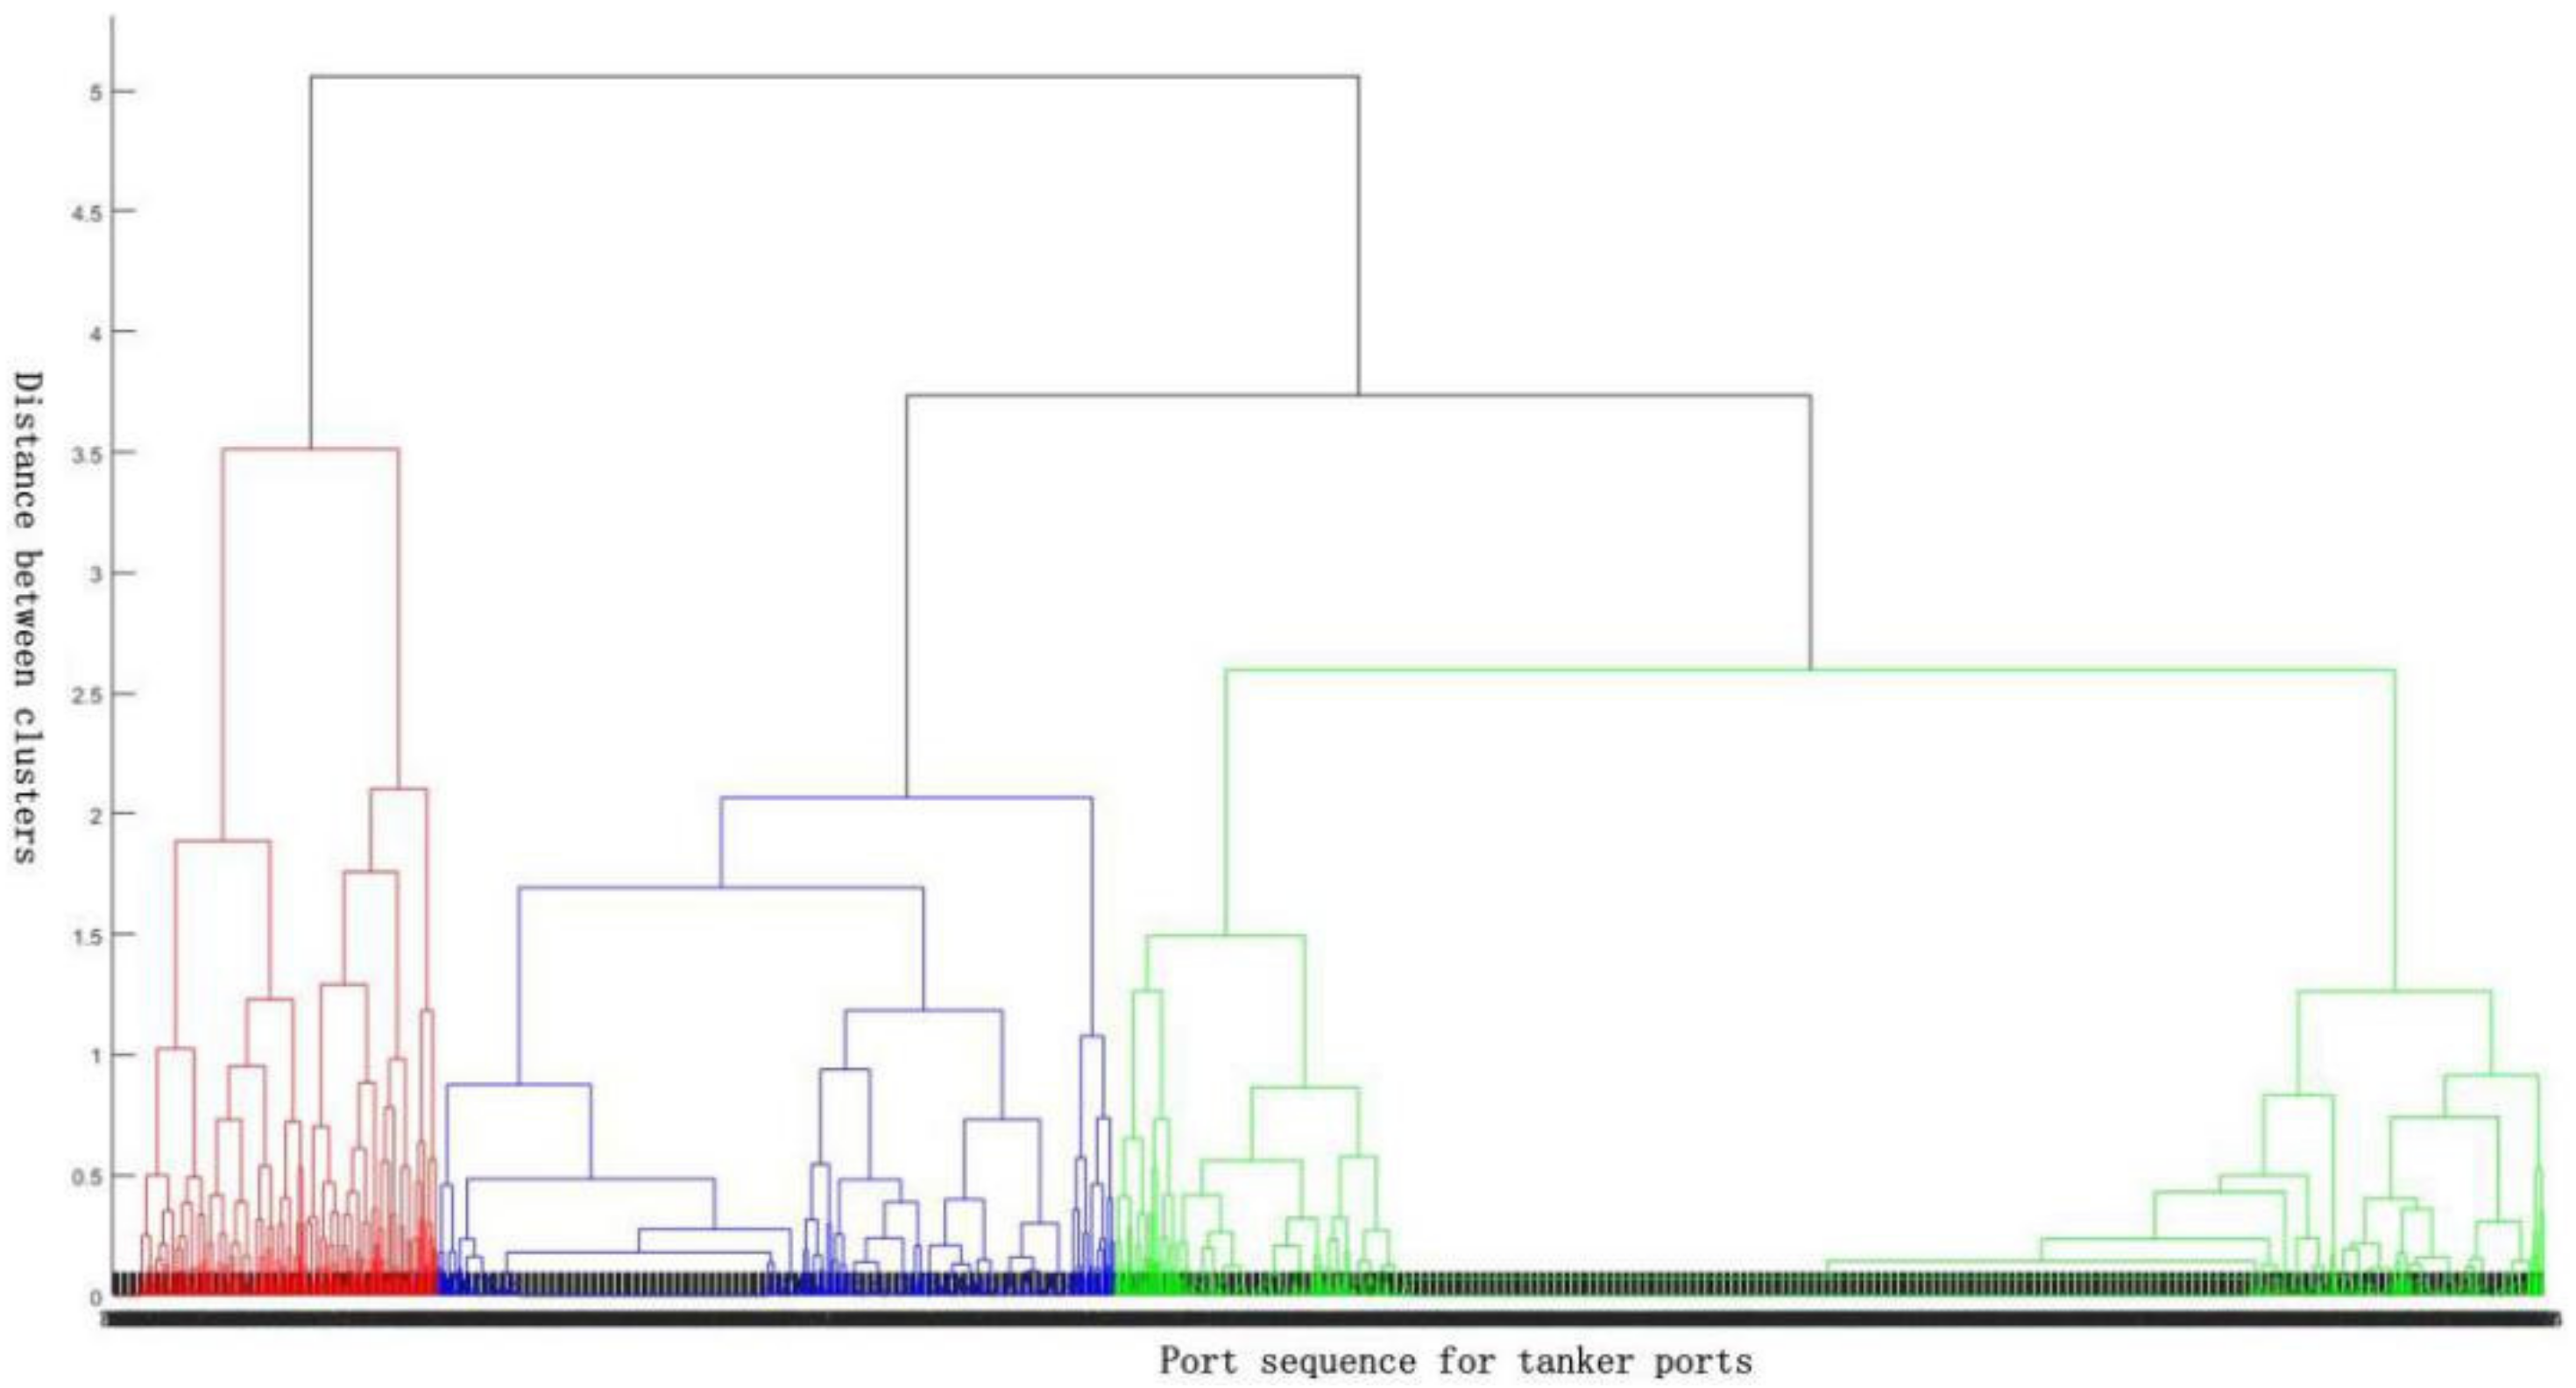
3.2. Hierarchical Clustering of Ports of Call

The set of port of call P is as follows:
P = p l , I il | 1 i m , 1 l q
According to Formula (11), overall number of ports equals to q , and overall number of ship types equals to m . The distance between two ports can be calculated by Formula (12), which stands for port similarity on importance degree of i type ship for port l :
s ( p 1 , p 2 ) = i = 1 m I i 1 I i 2 2
The set of special purpose port of call P i is as follows:
P i = p l , I i j l | 1 j n , 1 l q i
In Formula (13), overall number of special purpose ports for i type ship equals to q i .
According to Formula (13), overall number of ports equals to q i , and overall number of ship scales for i type ship equals to n . The distance between two ports can be calculated by Formula (14), which stands for port similarity on importance degree of i type j scale ship for port l :
s ( p 1 , p 2 ) = j = 1 n I i j 1 I i j 2 2
The algorithm flow is as follows:
  • Input: the set of port call P ( P i ), cluster distance measure function s ( s ), and cluster number k .
  • Process:
    (1)
    assume that each sample point is a cluster, the cluster class is divided into C = C 1 , C 2 , , C q , and the number of clusters is q .
    (2)
    The distance between two clusters is calculated by means of mean link. For instance, the distance between C j and C k is the average distance between C j and all samples.
    (3)
    C j and C k would be merged into the same cluster class if the distance between them is the smallest, and repeat calculating the cluster number.
    (4)
    Repeat step (2), until the number of clusters equals to k .
  • Output: cluster partitioning C = C 1 , C 2 , , C k .

3.3. Classification Model of Port Arrival Frequency Degree for Ships with Different Type and Scale

n ijl is defined as the arrival frequency of l port for i type j scale ships, as seen in Formula (15):
n ijl = k n ijkl
l n ijl is defined as the arrival frequency of all ports which i type j scale ships called at, f ijl is defined as arrival frequency degree of l port which i type j scale ships called at, calculation of which is shown in Formula (16).
f ijl = n ijl l n ijl

4. Result

4.1. Number Distribution of Ports with Special Purpose Terminals

According to the statistics of typical cargo ships calling from January to October 2020, 3022 ports of call were obtained. According to the classification model of ports with special purpose terminals, the importance degree of i type j scale ships and the importance degree of i type ships for each port l are calculated by Formulas (9) and (10), as shown in Table 3.
According to the model of special purpose port hierarchical clustering, these ports were classified into special purpose ports of bulk, containers, and tankers, the numbers of which are 1125, 684, and 1213 respectively. Meanwhile, according to hierarchical clustering of the ports of call, bulk ports are divided into handy size, canal size, and cape size, the numbers of which are 642, 338, and 145, respectively. Container ports are divided into 1st to 3rd generation, 4th to 5th generation, and 6th generation, the numbers of which are 447, 149, and 88, respectively. Crude oil ports are divided into handy size, canal size, and VLCC size, the numbers of which are 634, 416, and 163, respectively, as shown in Figure 1, Figure 2 and Figure 3 and Table 4.
In Figure 1, hierarchical clustering for all ports is listed, which are divided into three categories, including bulk ports, container ports, and tanker ports. In Figure 2, hierarchical clustering for bulk ports is listed, which are divided into three categories, including handy size bulk ports, canal size bulk ports, and cape size bulk ports. In Figure 3, hierarchical clustering for container ports is listed, which are divided into three categories, including 1st to 3rd generation container ports, 4th to 5th generation container ports, and 6th generation container ports. In Figure 4, hierarchical clustering for tanker ports is listed, which are divided into three categories, including handy size tanker ports, canal size tanker ports, and VLCC tanker ports.

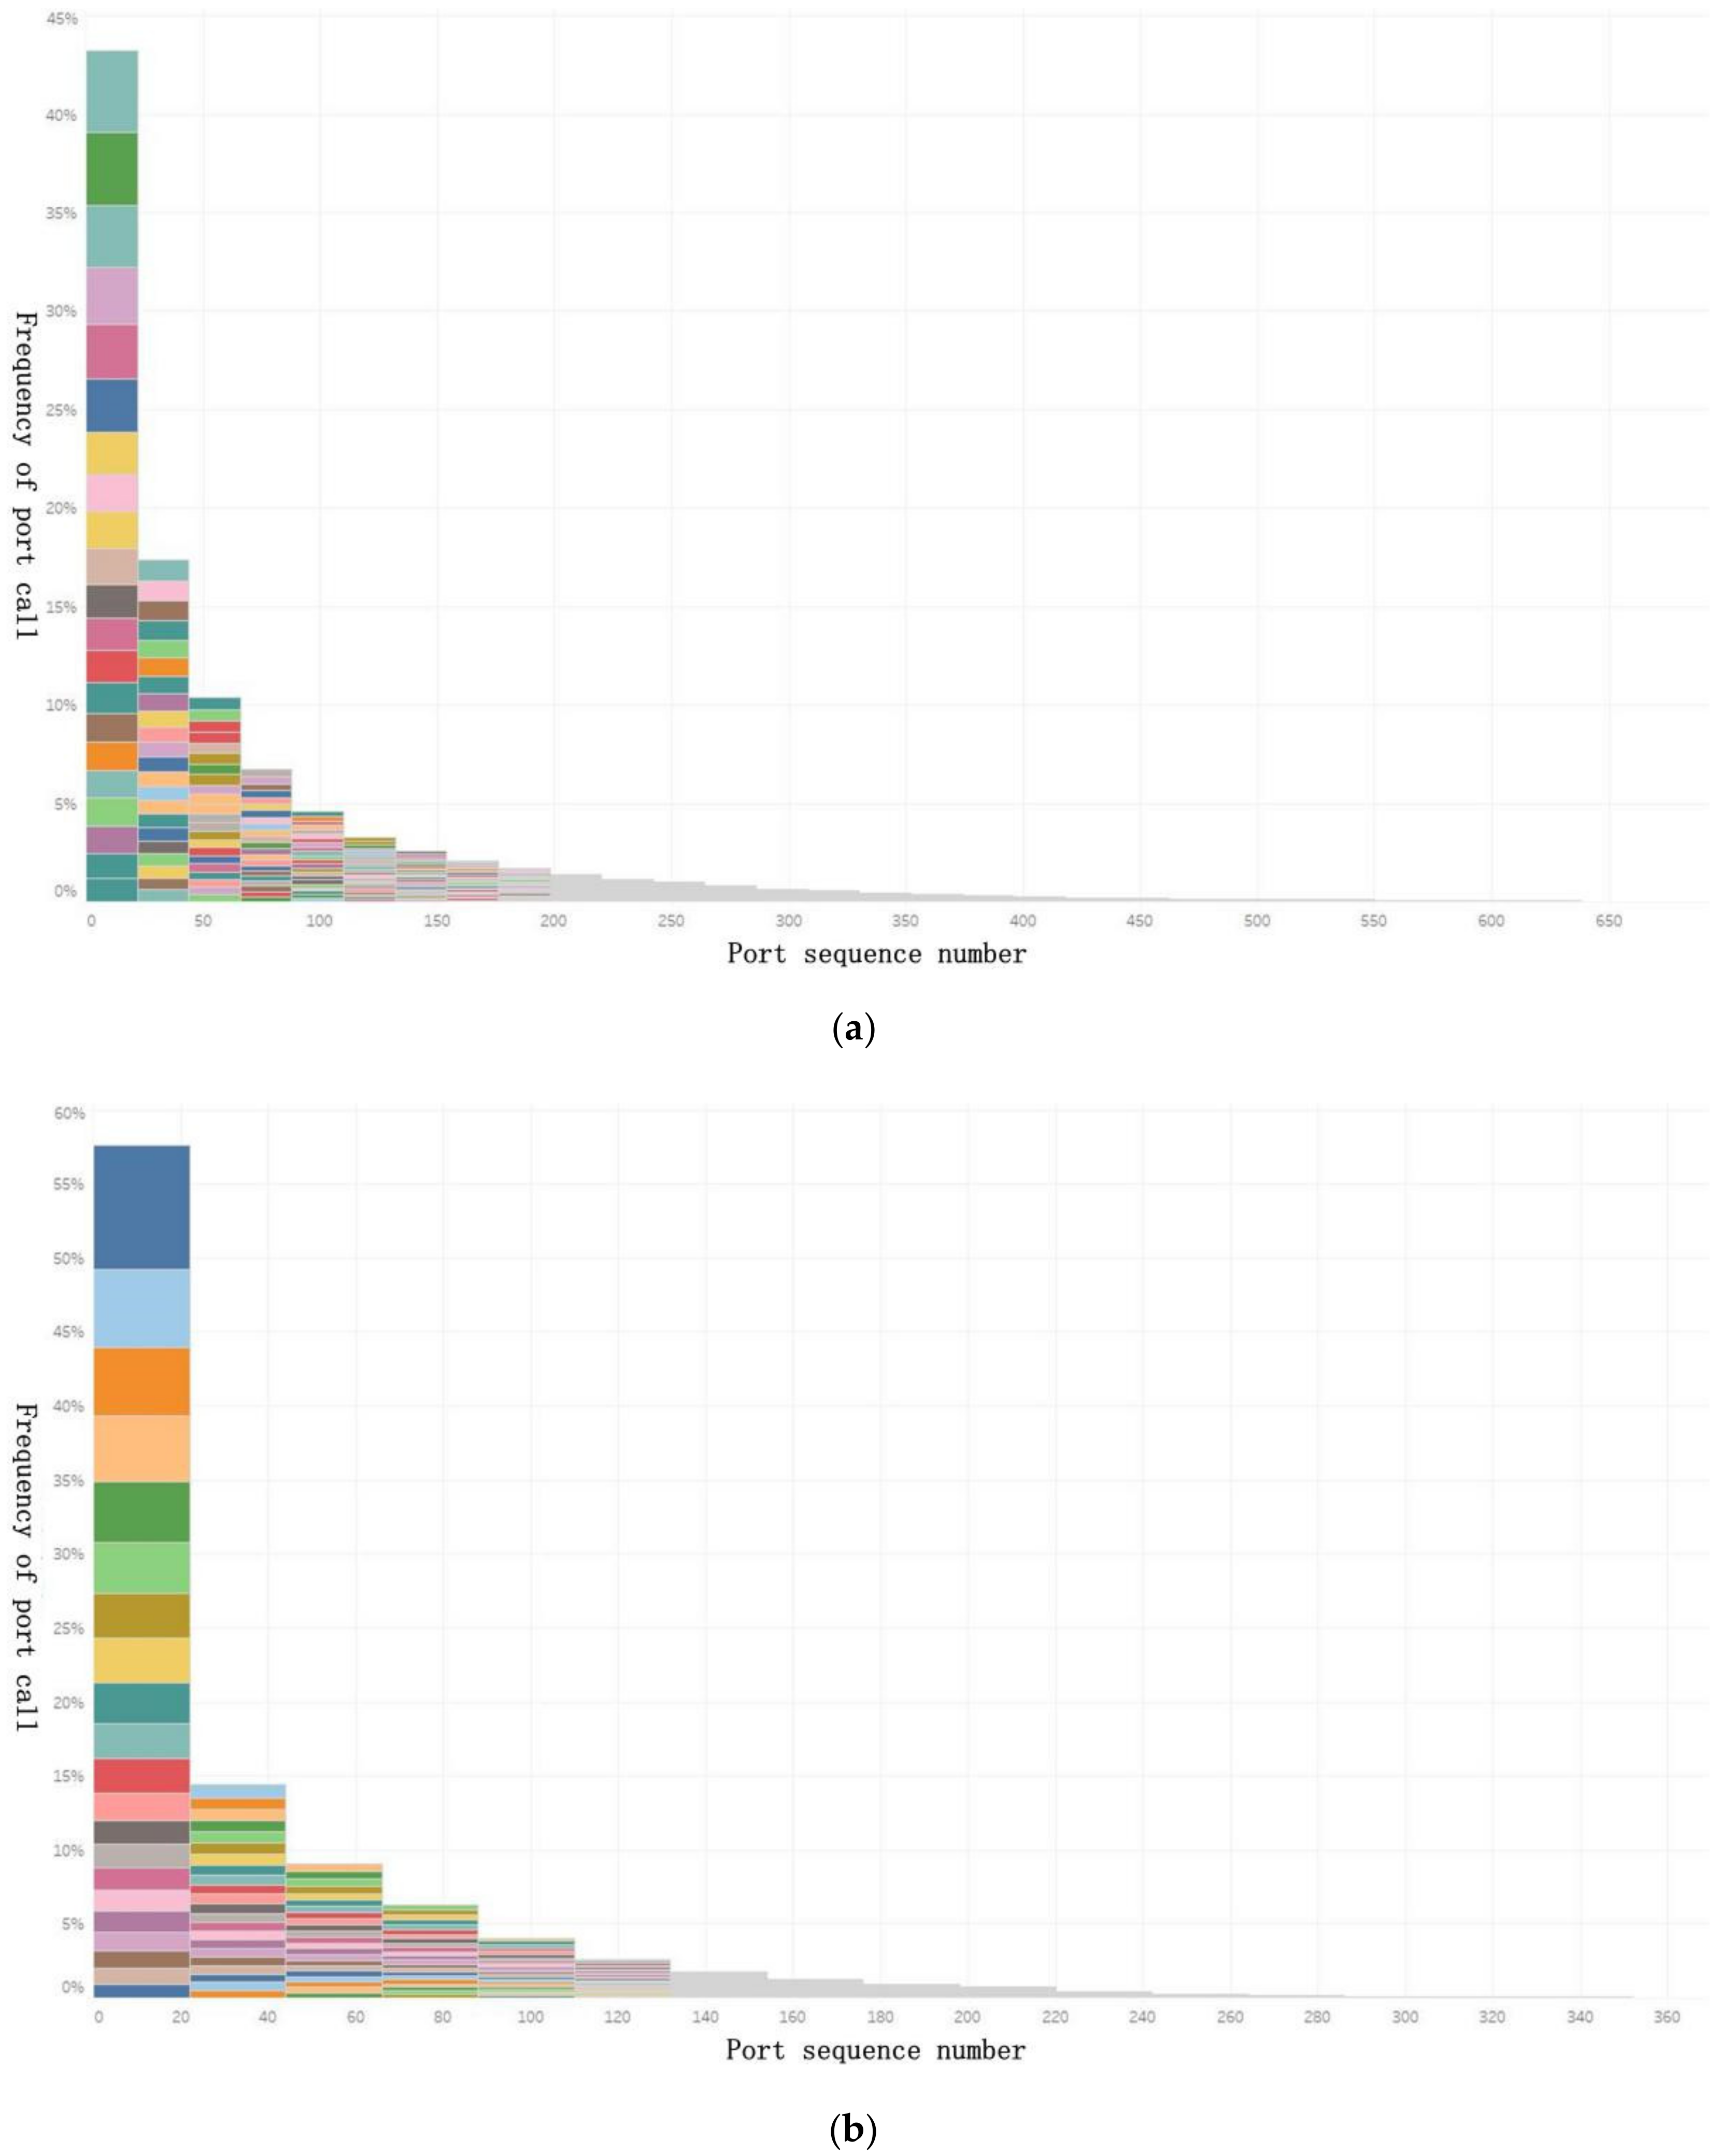
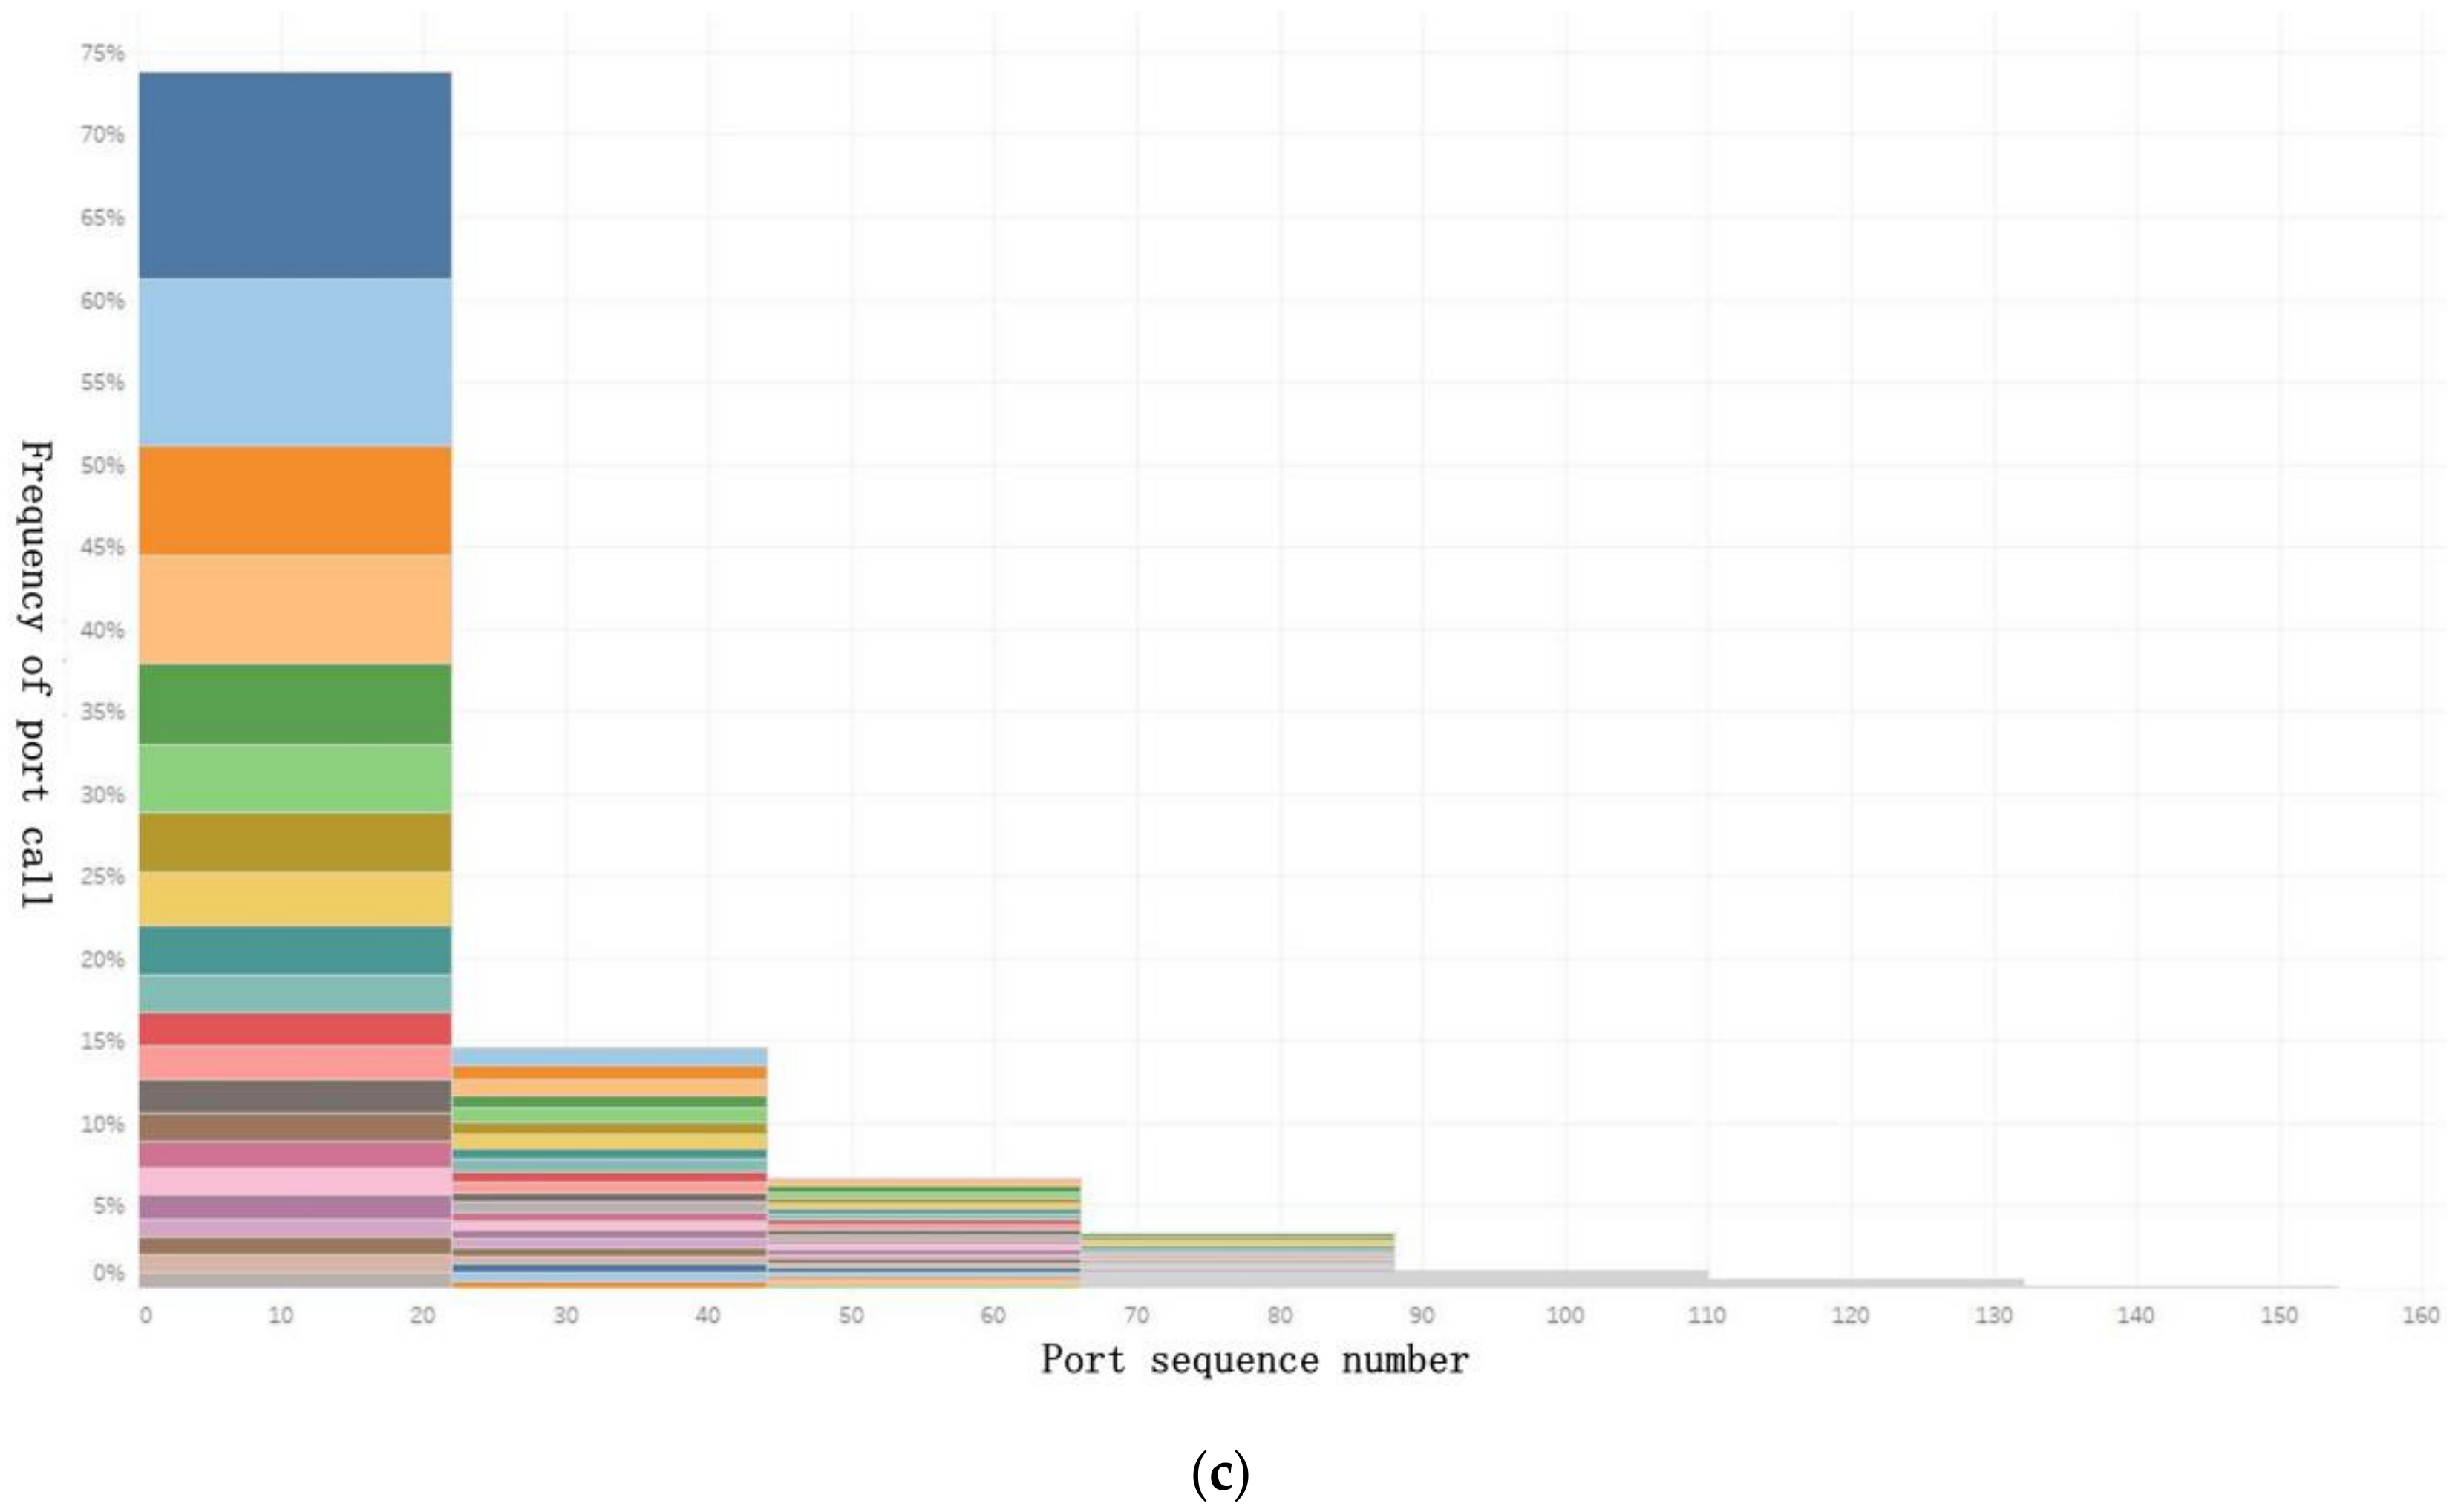
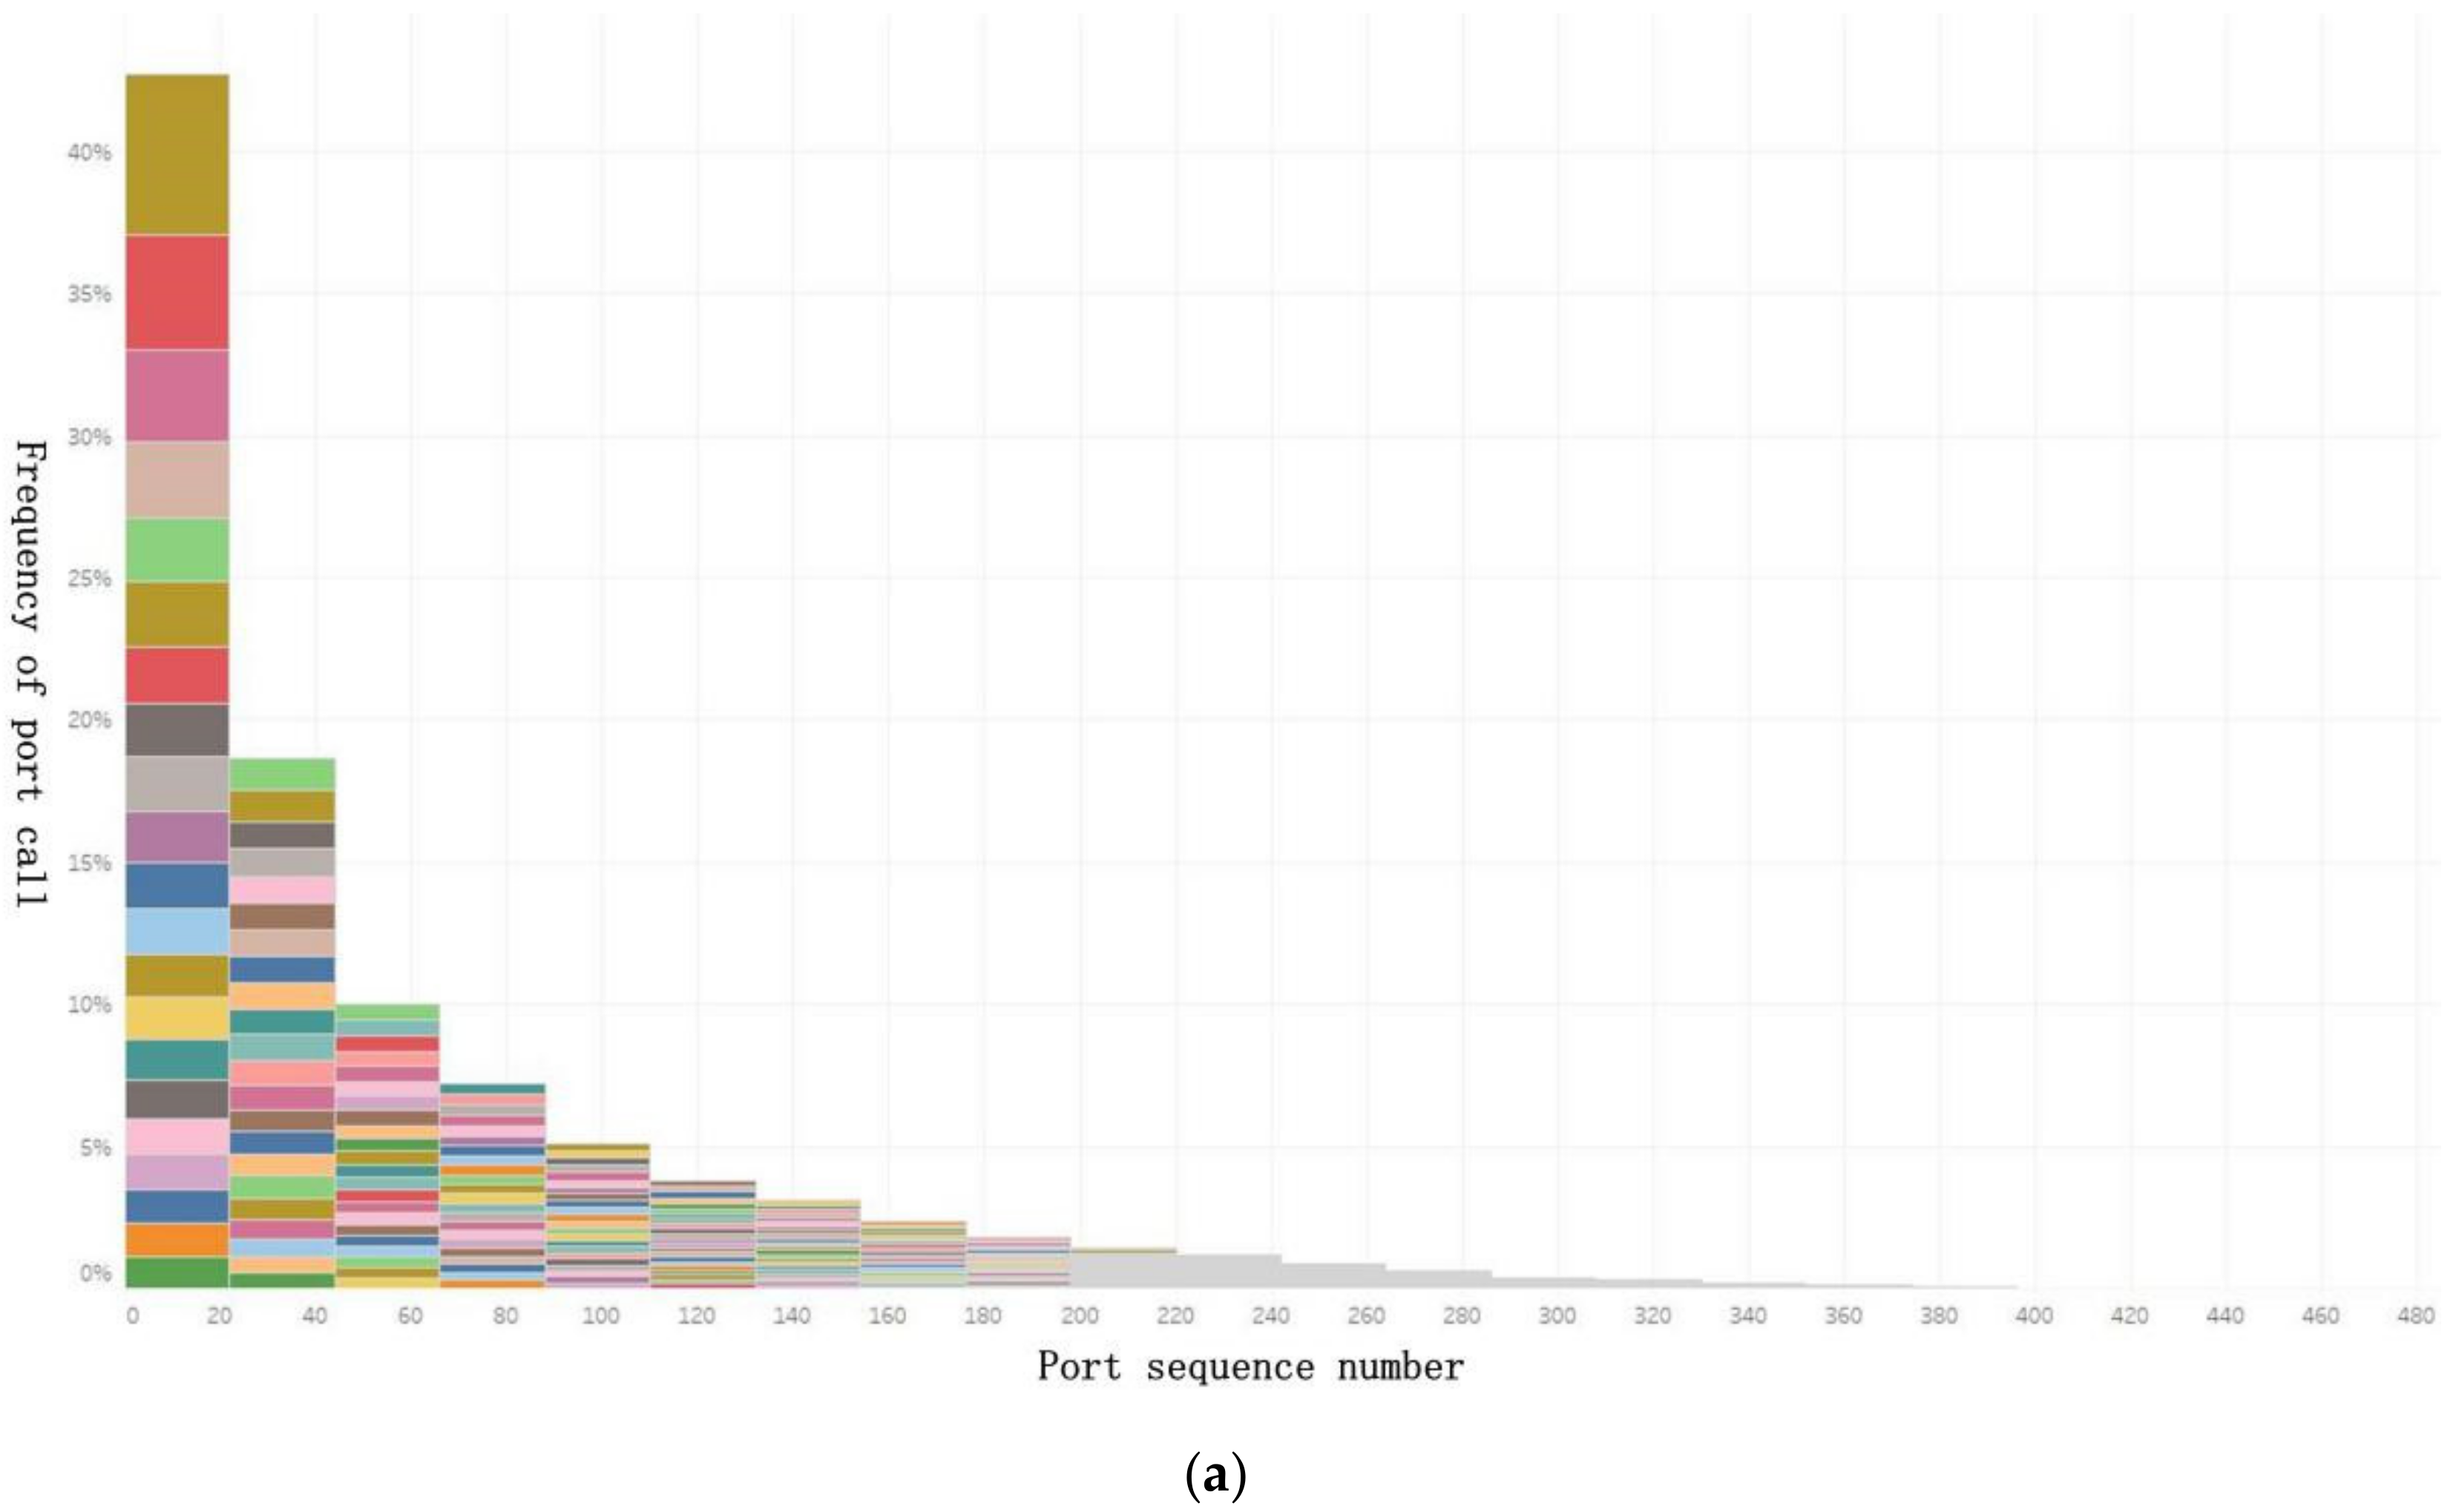
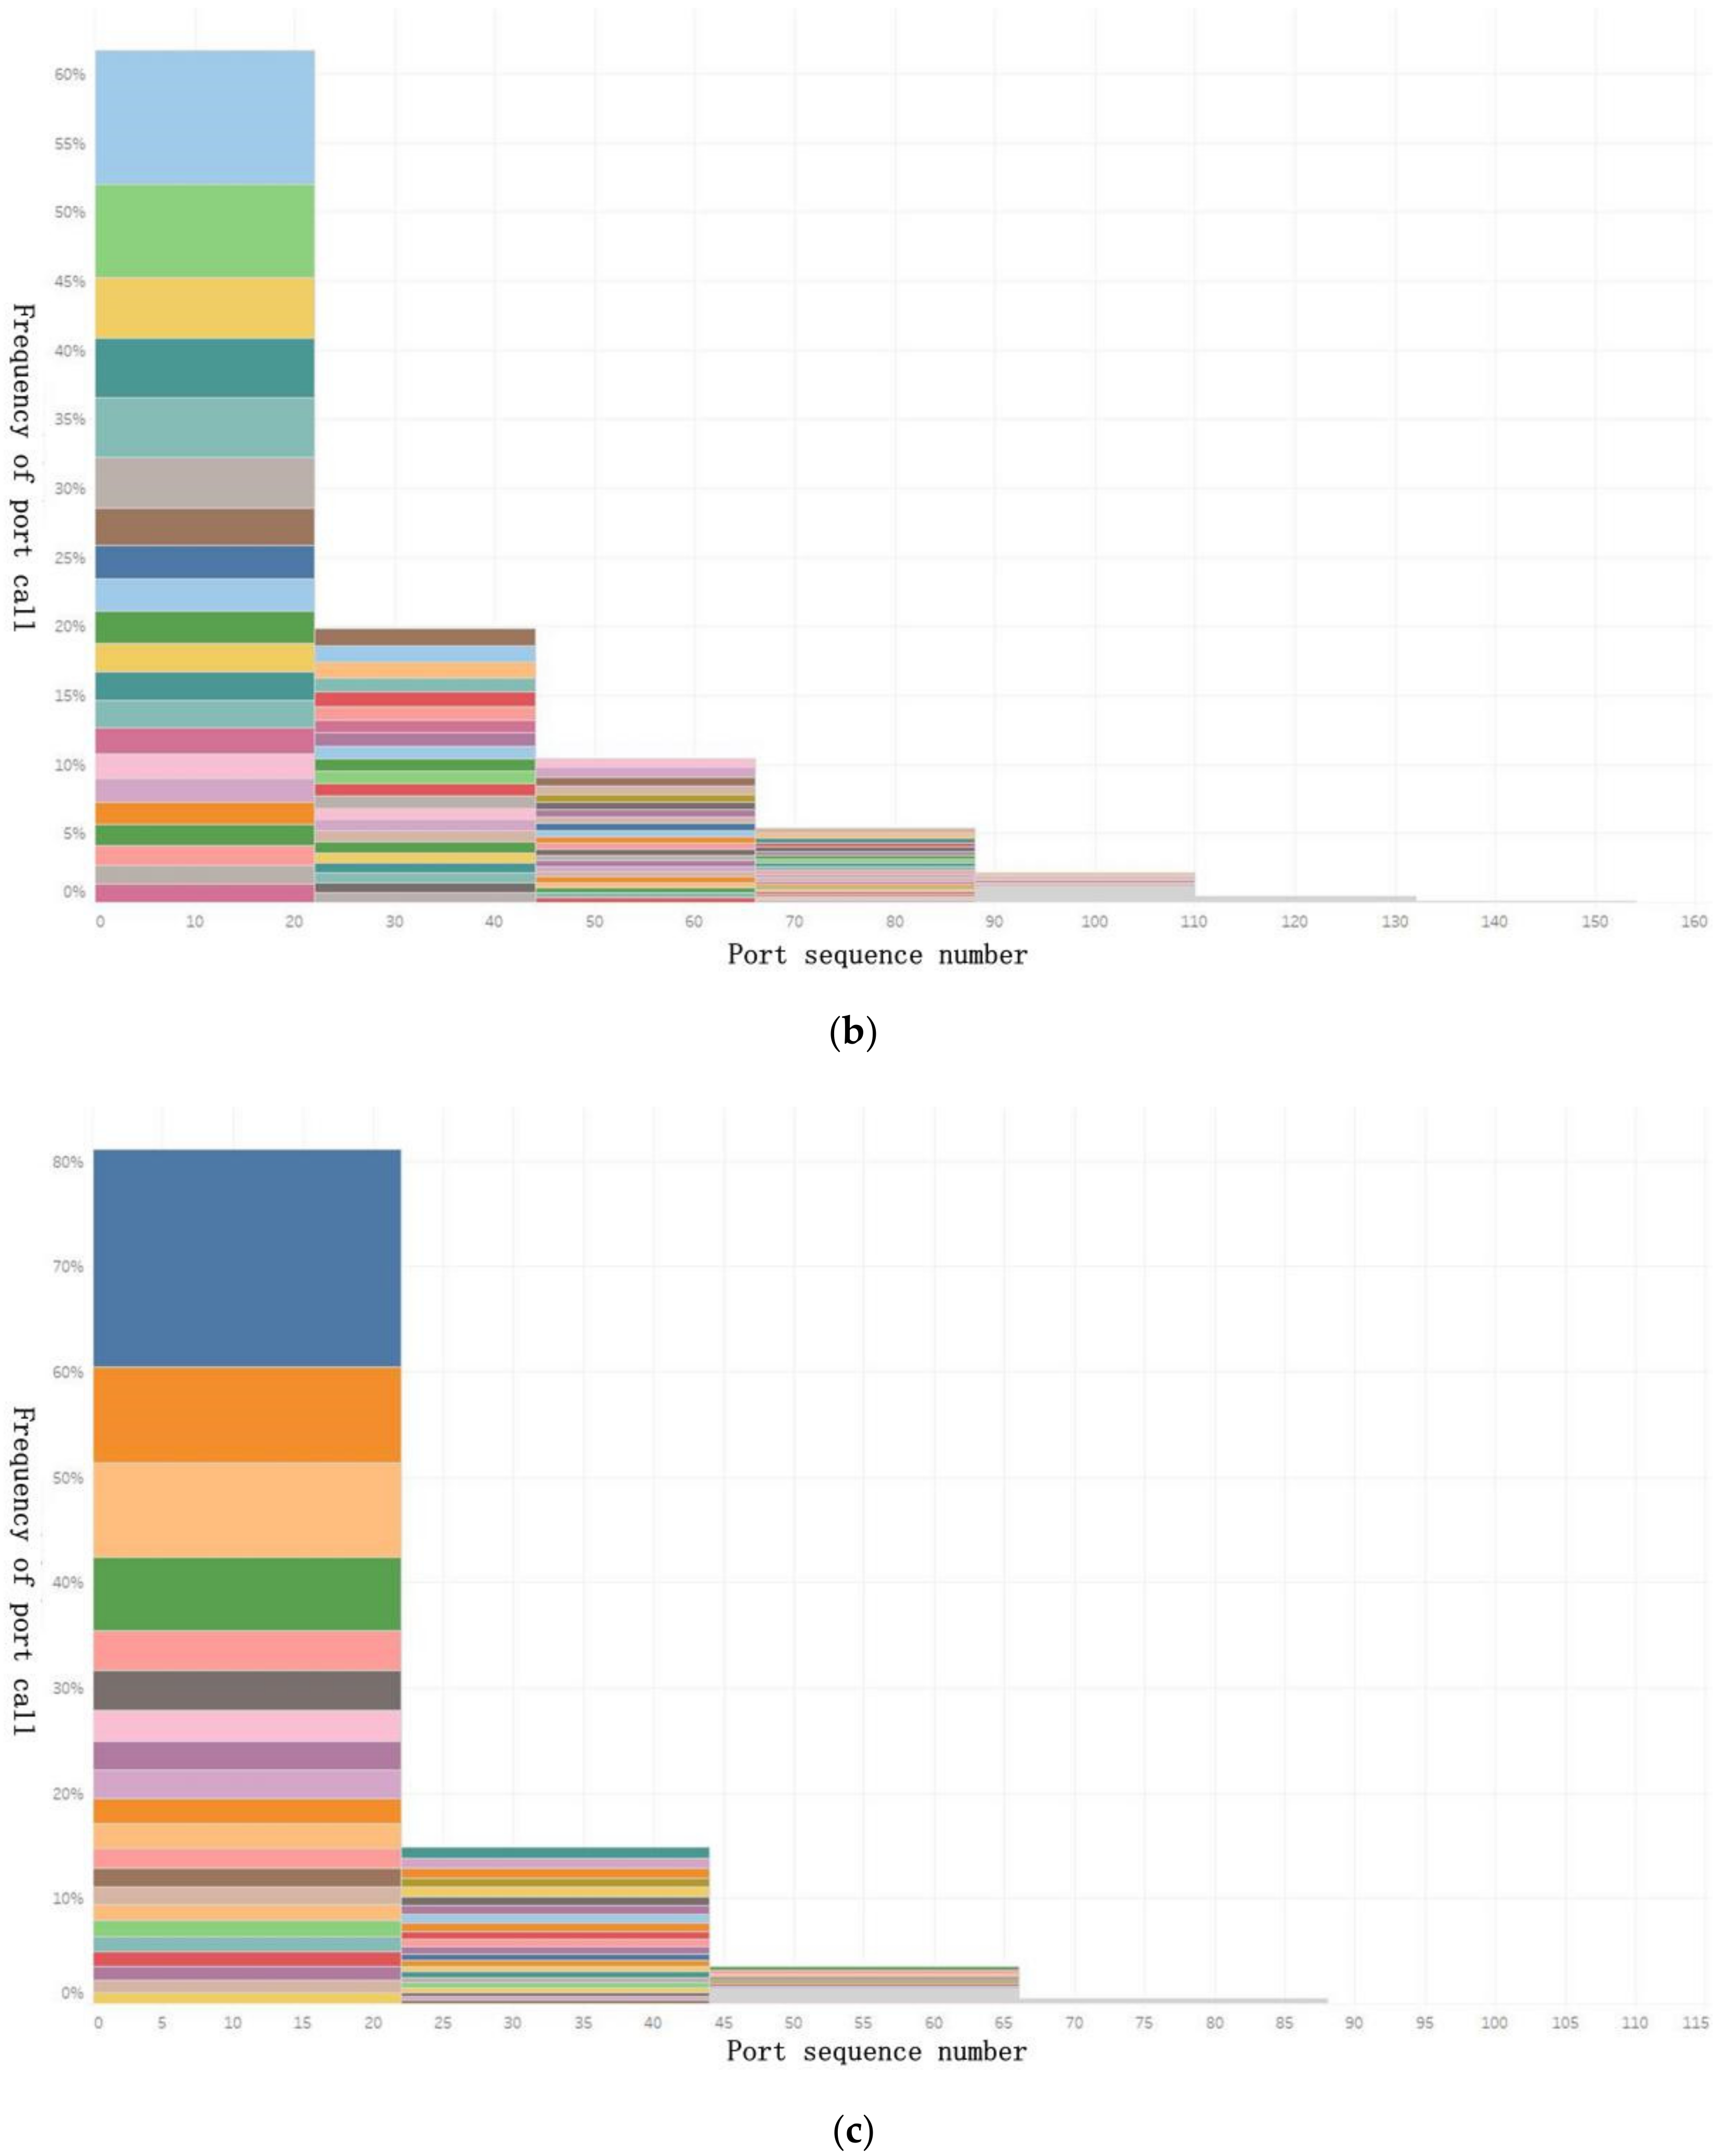
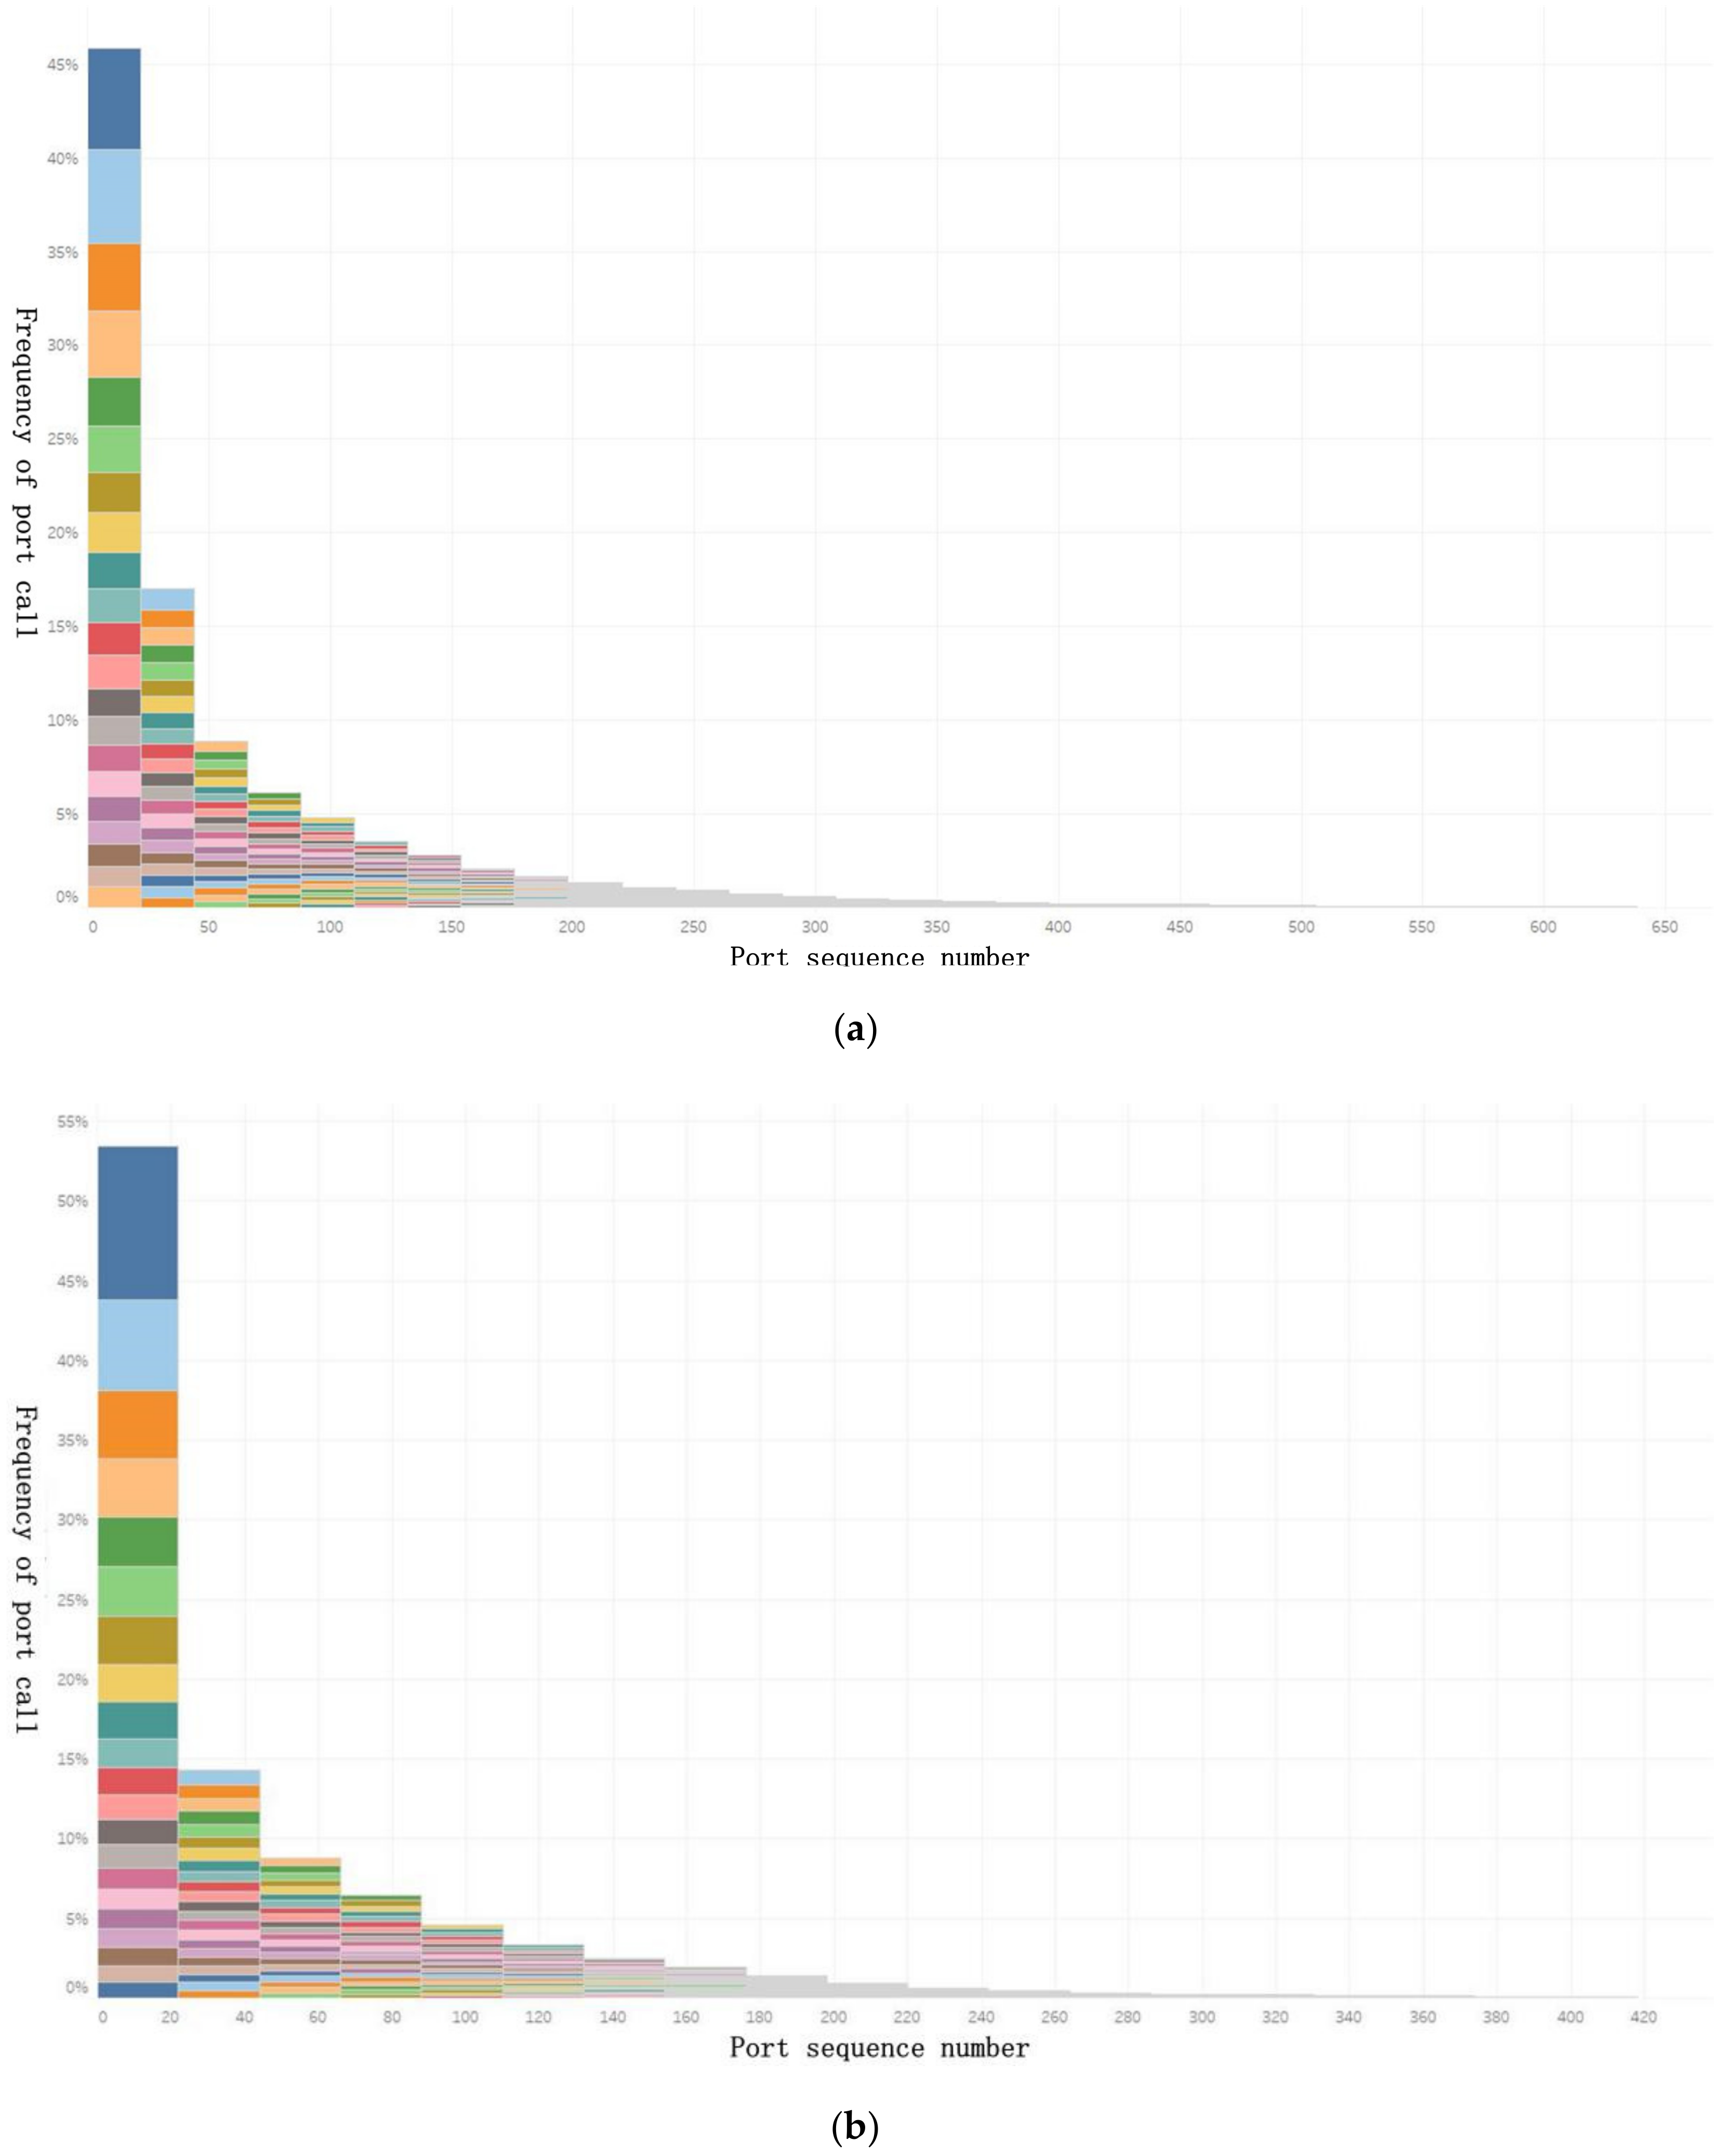
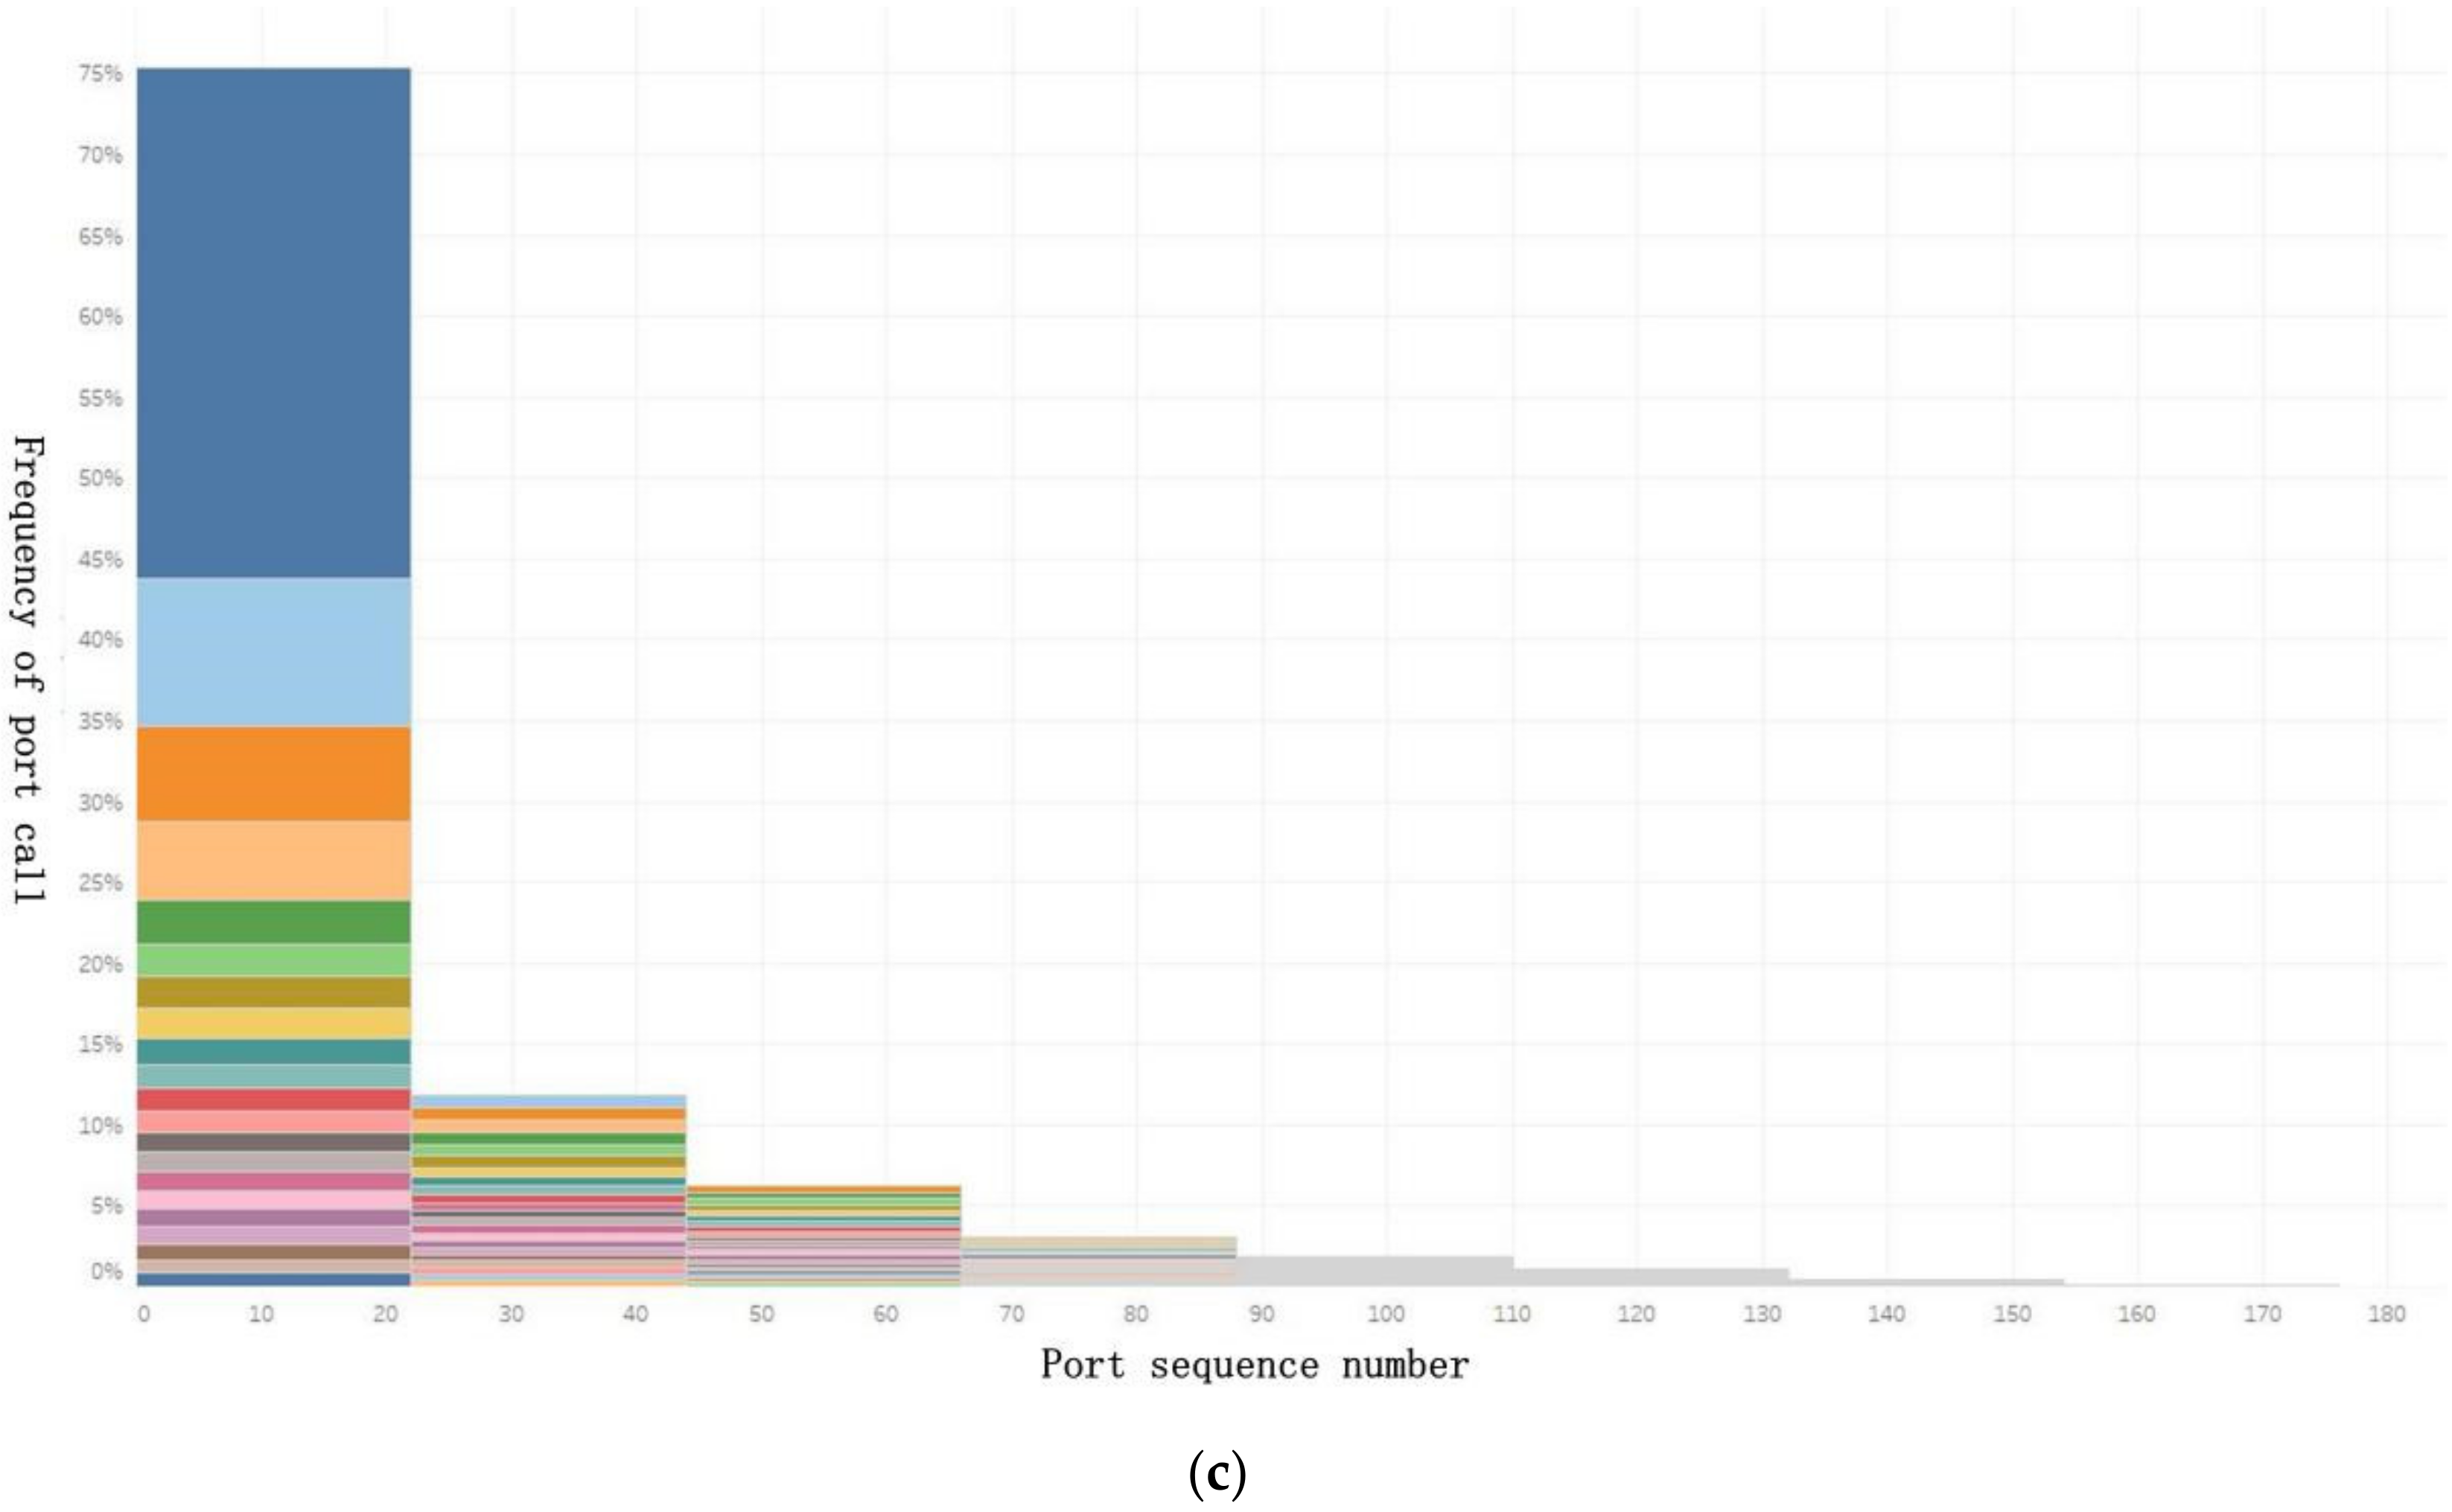
4.2. Arrival Frequency Degree Distribution for Ports with Special-Purpose Terminals

According to Formula (16), we calculated the arrival frequency degree of specialized ports for each scale, and drew the distribution figure of the specialized port’s arrival frequency degree, as shown in Figure 5, Figure 6 and Figure 7. The ordinate indicates the arrival frequency degree of the specialized port, and the abscissa indicates the serial number of the specialized port. The specialized port numbers are arranged in descending order according to the port’s frequency degree. The figure shows that a few ports are frequently called by ships, which belong to important specialized ports.
In Figure 5, Figure 6 and Figure 7, different colored legends stand for different ports, and the size of the histogram indicates the arrival frequency proportion for a certain port. In Figure 5a, for handy size bulk ports, the top 22 ports accounted for 44% of the frequency degree, the 23rd to 44th 17%, and the 45th to 66th accounted for 10%. In Figure 5b, for canal size bulk ports, the top 22 ports accounted for 57.5%, the 23rd to 44th 14%, and the 45th to 66th accounted for 9%. In Figure 5c, for cape size bulk ports, the top 22 ports accounted for 74%, the 23rd to 44th 14%, and the 45th to 66th accounted for 6%.
In Figure 6a, for 1st–3rd generation container ports, the top 22 ports accounted for 42.5%, the 23rd to 44th 19%, and the 45th to 66th accounted for 10%. In Figure 6b, for 4th–5th generation container ports, the top 22 ports accounted for 62%, the 23rd to 44th 20%, and the 45th to 66th accounted for 10%. In Figure 6c, for 6th generation container ports, the top 22 ports accounted for 81%, the 23rd to 44th 15%, and the 45th to 66th accounted for 3%. In Figure 7a, for handy size tanker ports, the top 22 ports accounted for 46% of the total frequency degree, the 23rd to 44th 17%, and the 45th to 66th accounted for 8.5%. In Figure 7b, for canal size tanker ports, the top 22 ports accounted for 53.2%, the 23rd to 44th 14.5%, and the 45th to 66th accounted for 8.5%. In Figure 7c, for VLCC tanker ports, the top 22 ports accounted for 75%, the 23rd to 44th 12%, and the 45th to 66th accounted for 6.5%.
According to the specialized port frequency distribution map of each scale, set t h f ij equals to 0.005. According to the model of the frequent port calls division, 391 frequent ports of call for typical cargo ships are selected. The number of frequent bulk ports for handy size, canal size, and cape size is 51, 46, and 40, respectively. The number of frequent container ports for 1st to 3rd generation, 4th to 5th generation, and 6th generation is 51, 50, and 38, respectively. The number of frequent tanker ports for handy size, canal size, and VLCC size is 44, 40, and 31, respectively.
The arrival frequency degree distribution for ports with special purpose terminals show that for a specialized terminal (port), ships frequently call at some ports, which are destination ports for the corresponding ship type (size), and are closely related to the prediction of ship navigation behavior.

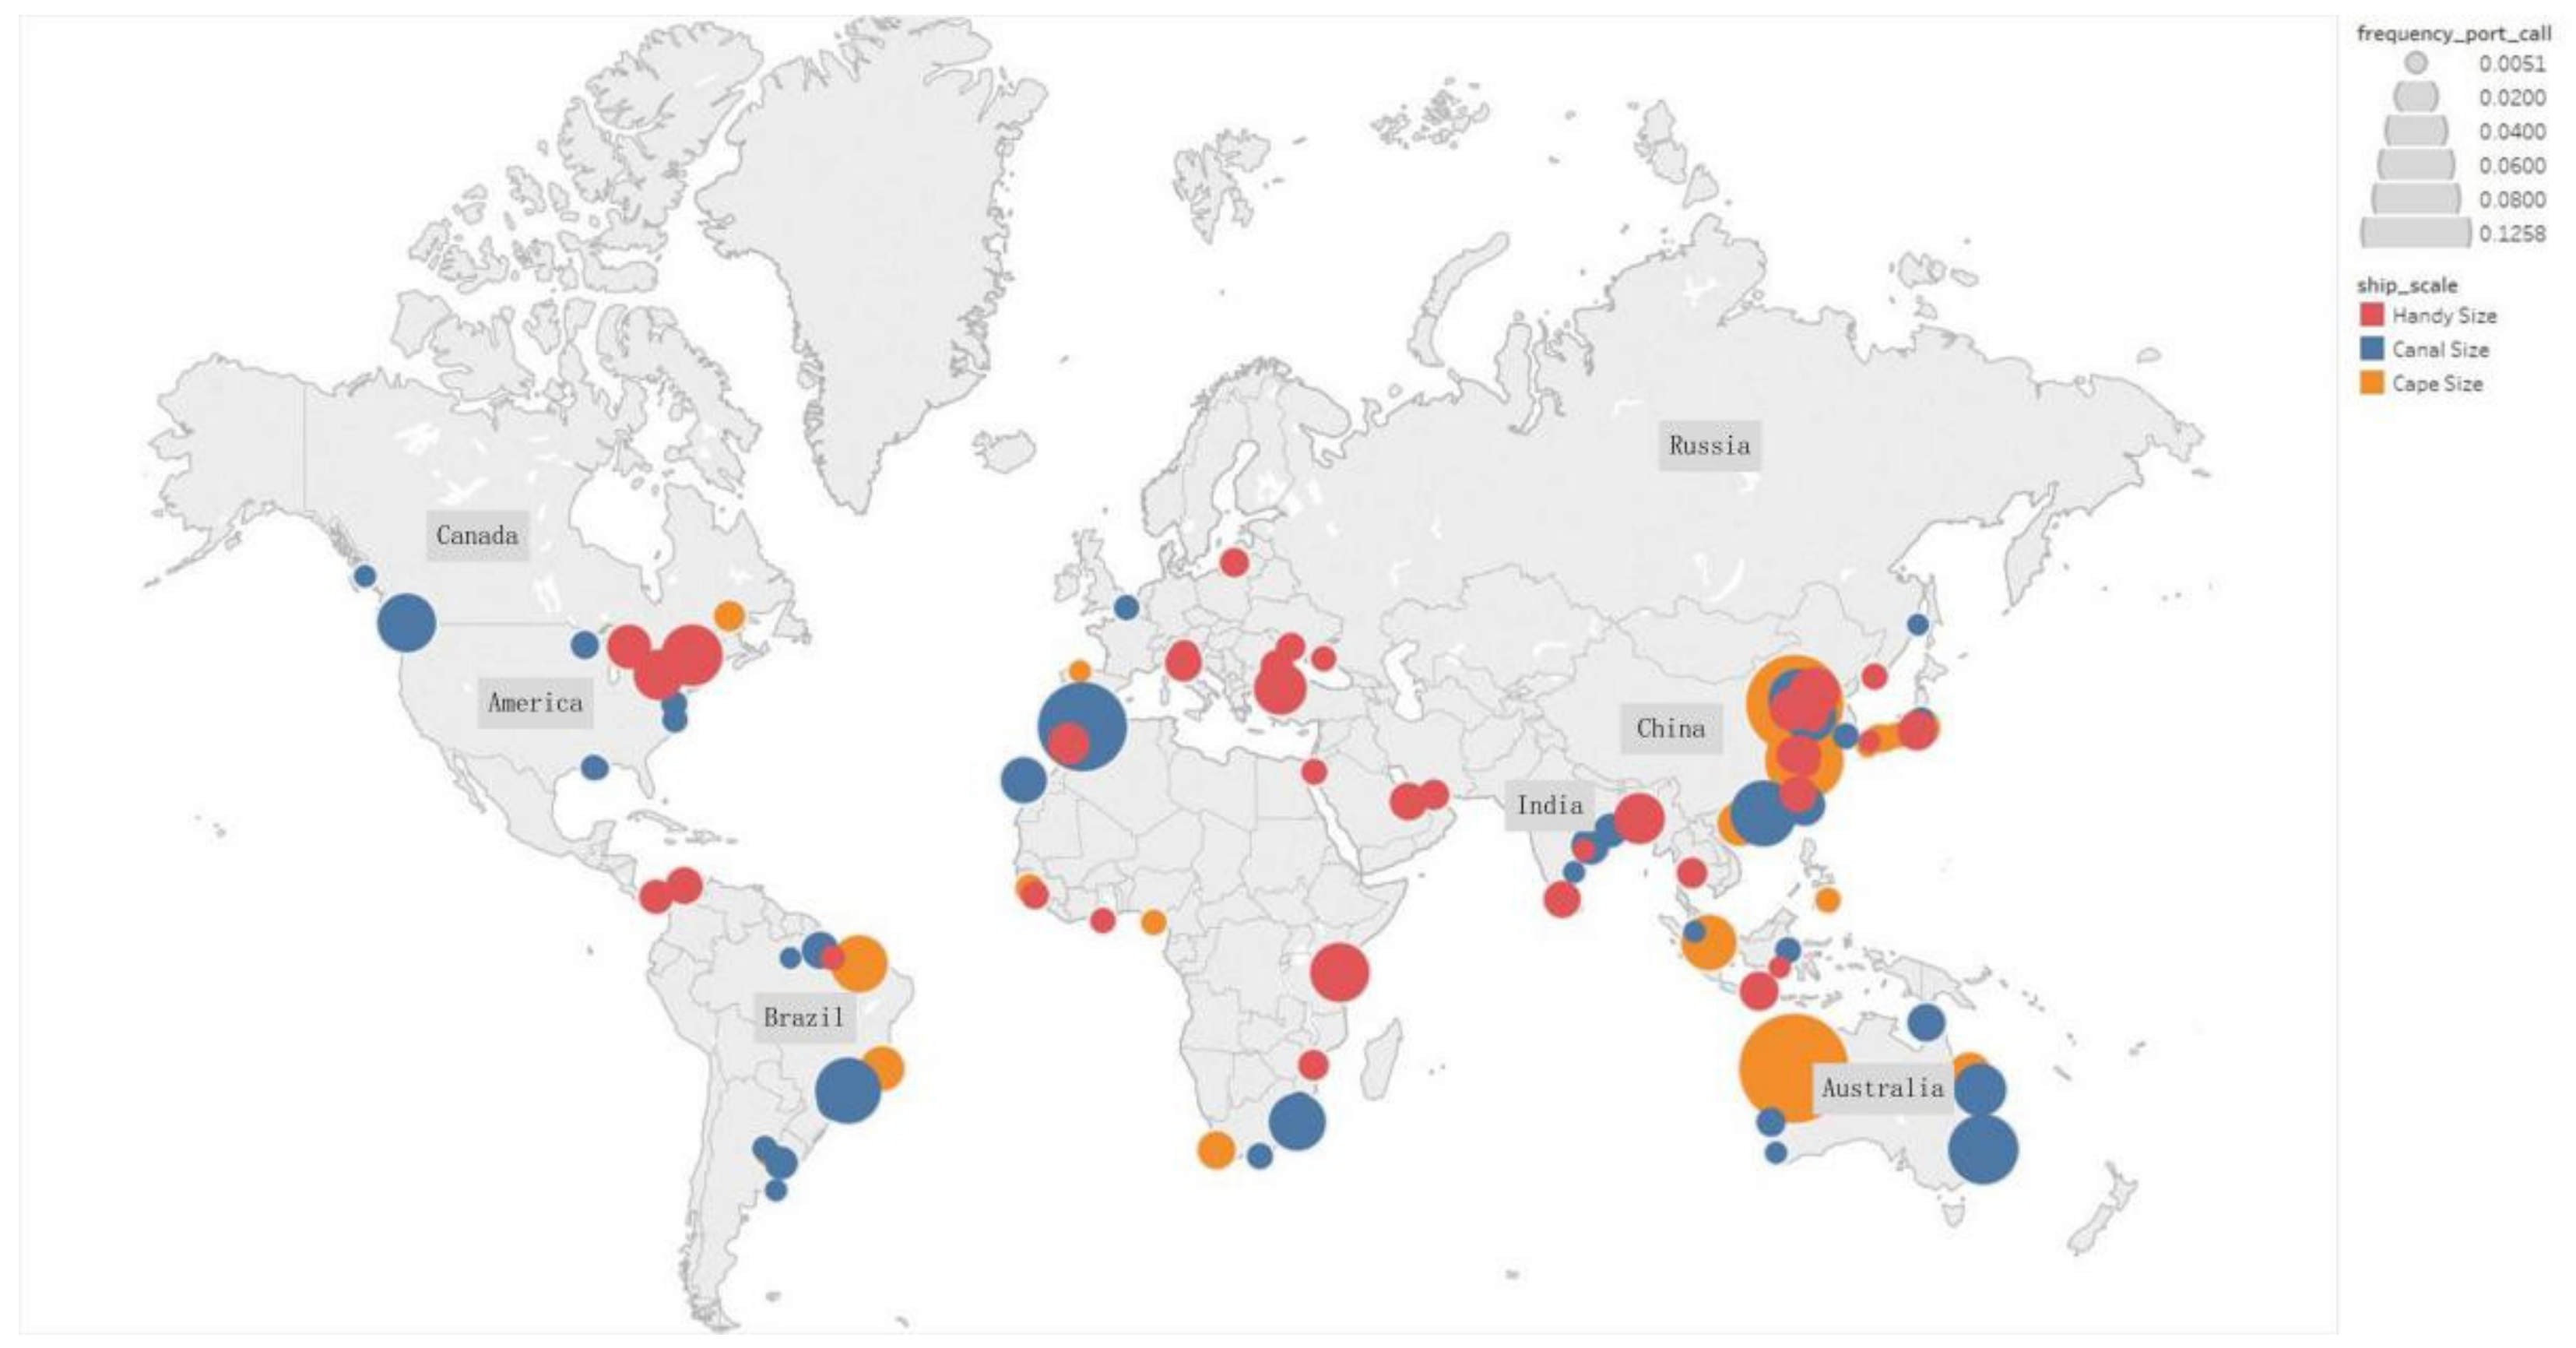
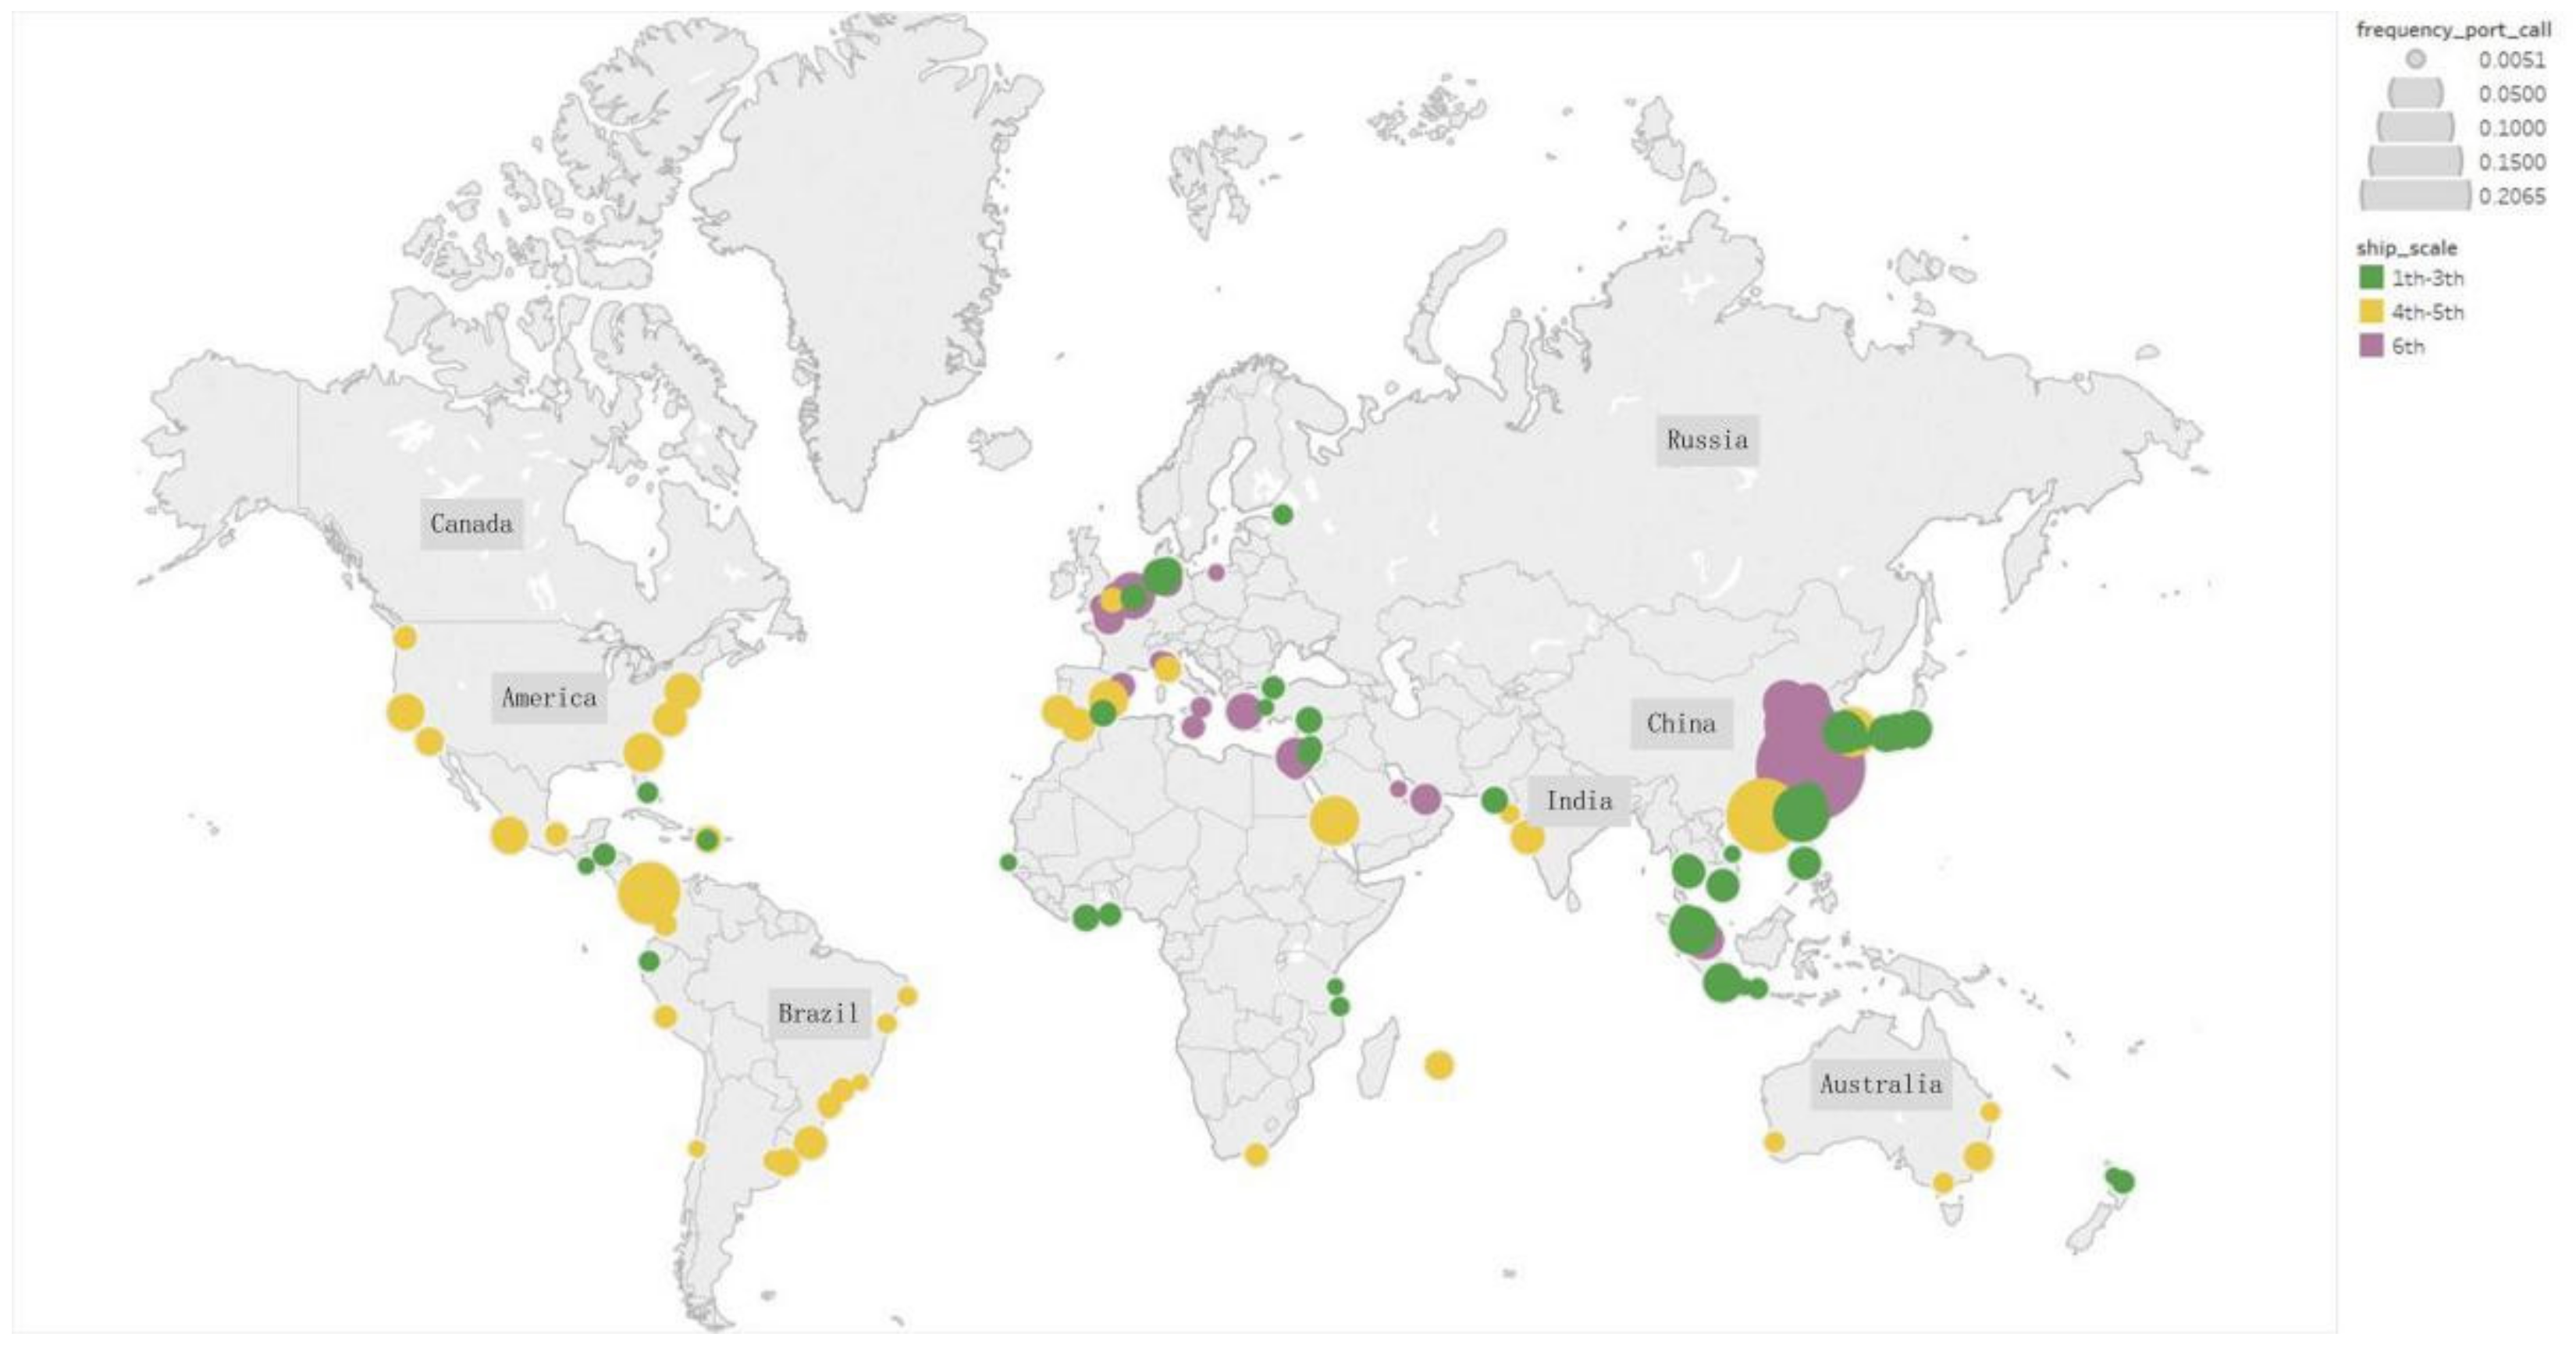
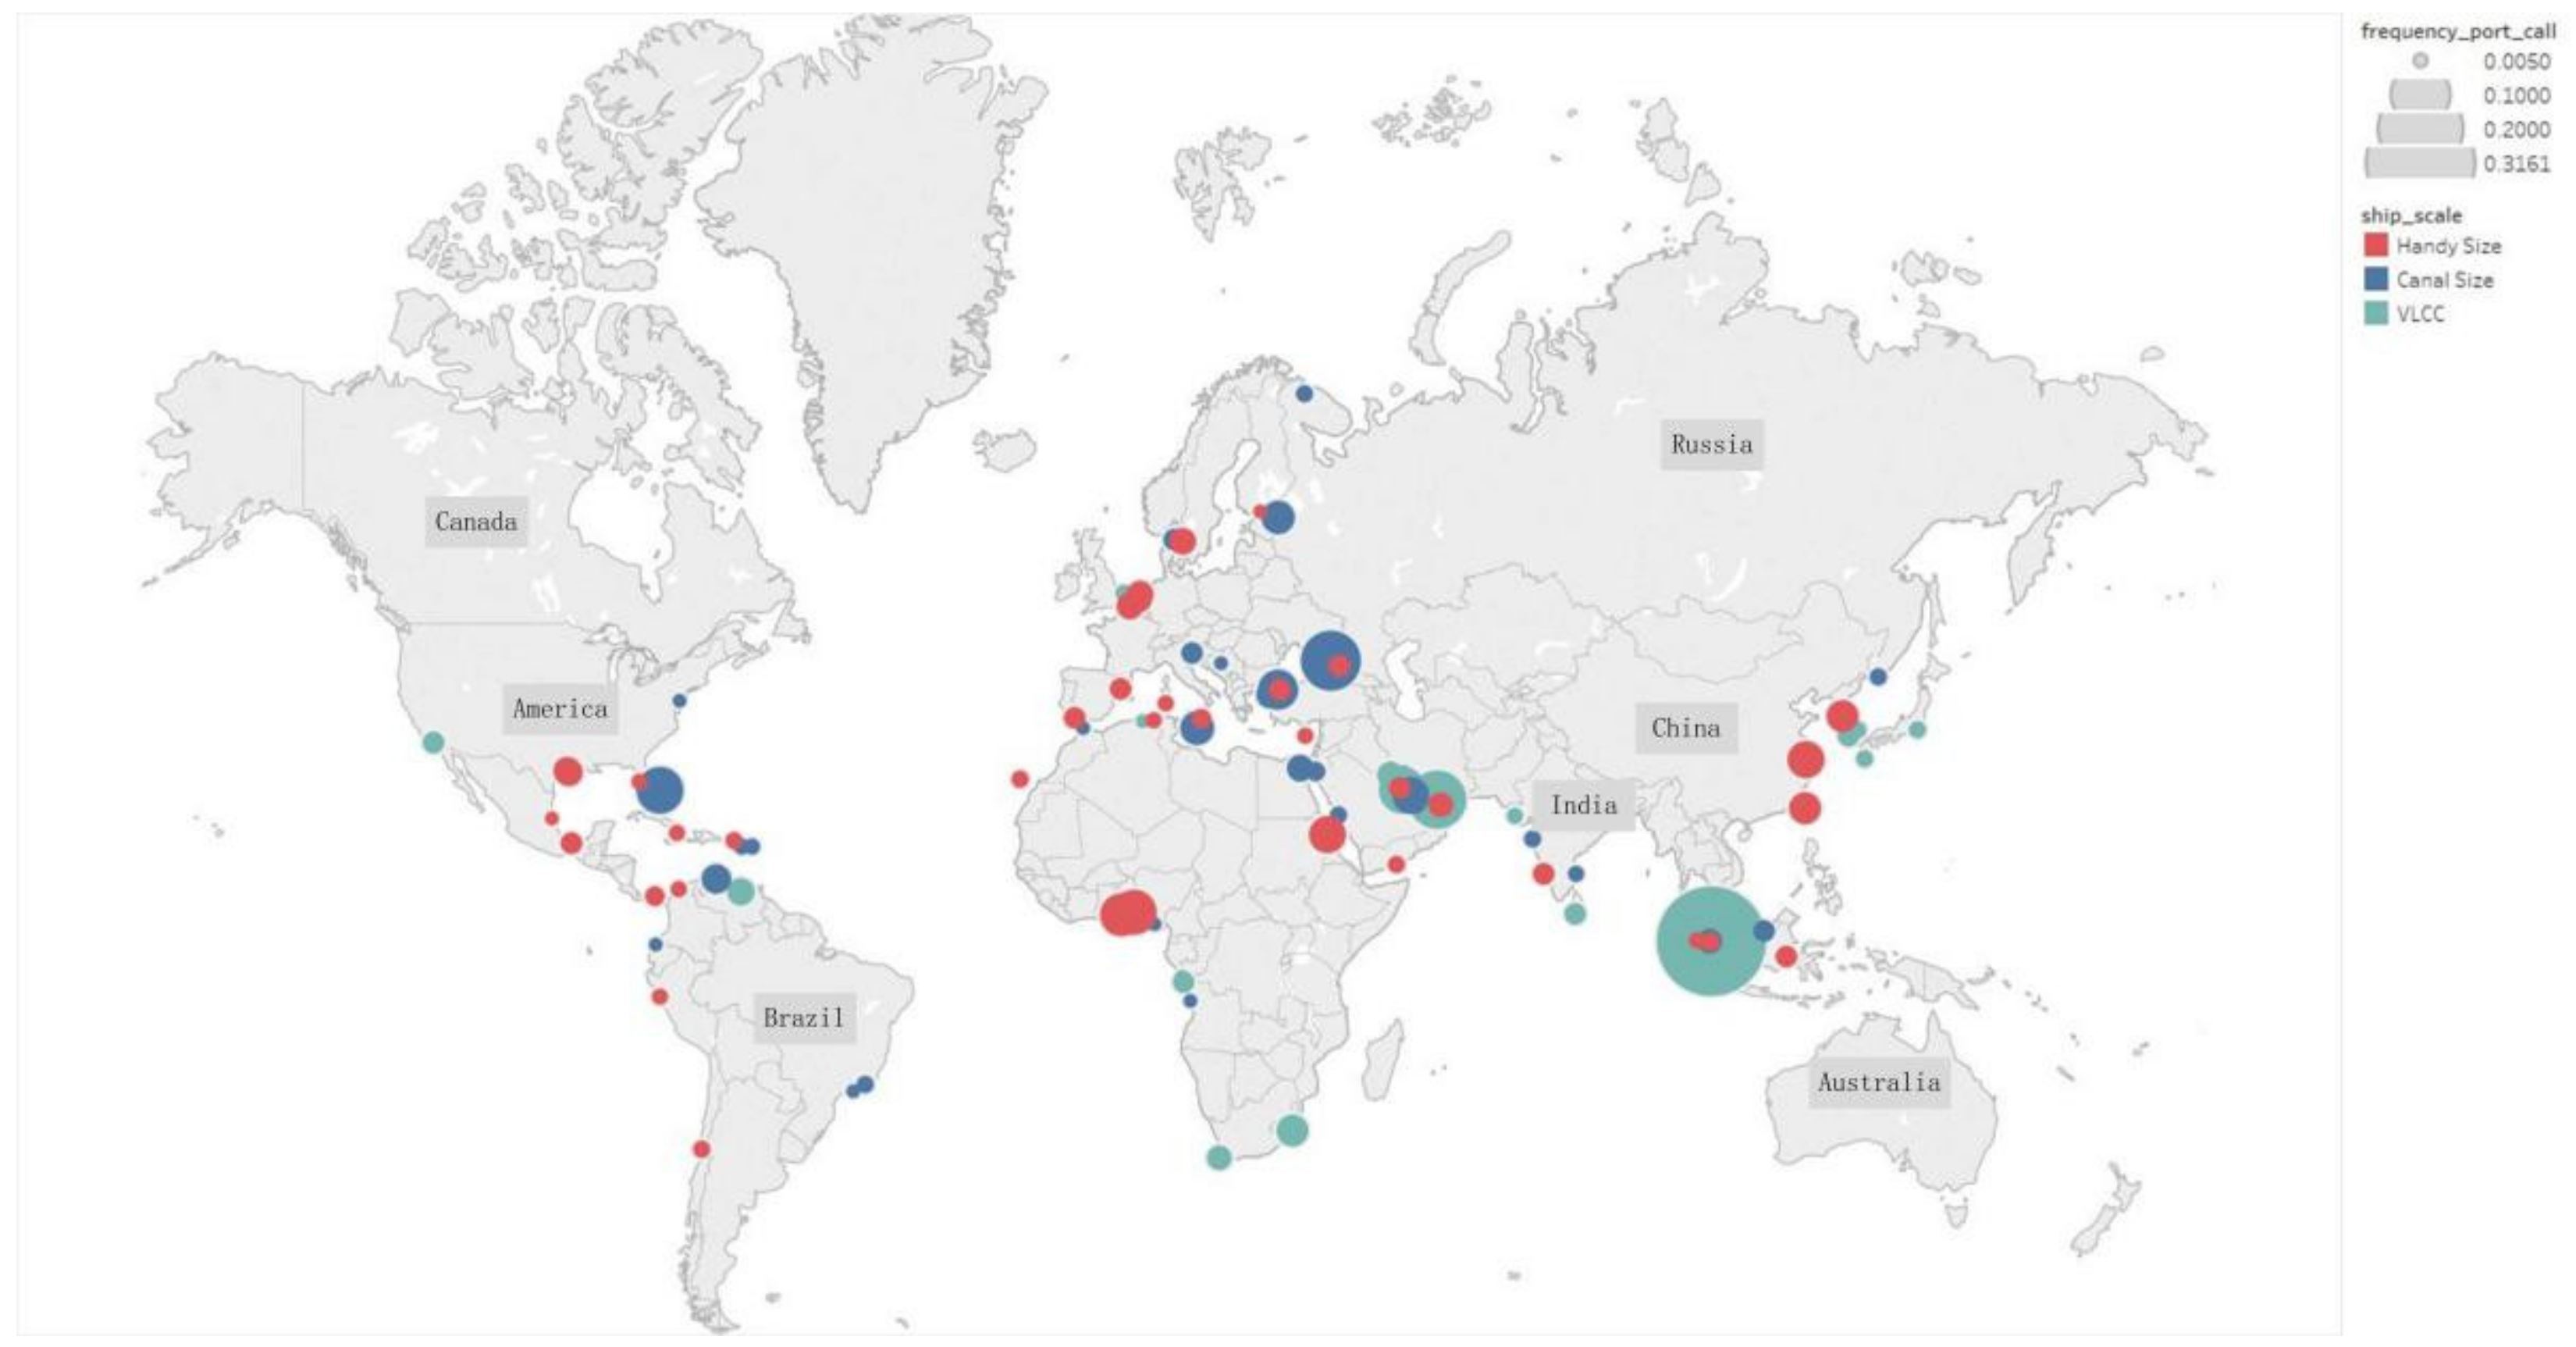
4.3. Geographical Distribution of Frequent Ports of Call for Typical Cargo Ships

According to the location information of the ports in the frequent specialized port collections, the geographical distribution maps of frequent specialized ports are drawn. The frequency of port calls are differentiated by symbol size, as shown in Figure 8, Figure 9, Figure 10 and Figure 11.
In Figure 9, twenty-three of handy size bulk cargo ports are located in Asia, thirteen located in Europe, seven located in North America, five located in Africa, and three are located in South America. The figure shows that location advantage of Asian and North American ports for handy size bulk carriers are obvious, especially for port of Montreal, Chittagong, Yingkou, Thorold, Sault Ste. Marie, Port Colborne, Huanghua, Changzhou, Chiba, and Gresik.
Seventeen of the canal size bulk cargo ports are located in Asia, nine located in South America, eight located in North America, six located in Australia, three located in Europe, and three are located in Africa. The figure shows that Spain, Australia, Brazil, South Africa, and China have significant location advantage for canal size bulk carriers, especially for port of Gibraltar, Newcastle, Guangzhou, Santos, Qinhuangdao, Richards Bay, Yantai, Zhuhai, Gladstone, and Las Palmas.
Twenty-one of the cape size bulk cargo ports are located in Asia, eight located in South America, five located in Australia, three located in Africa, two located in North America, and one is located in Europe. The figure shows that Australian and Chinese ports have significant location advantage for cape szie bulk carriers, especially for port of Hedland, Tangshan, Port Walcott, Suzhou, Dampier, Lianyungang, and Rizhao.
In Figure 10, twenty-nine of 1st to 3rd generation container ports are located in Asia, ten located in Europe, five located in Africa, five located in South America, and two are located in Australia. The figure shows that location advantage of East Asian and Southeast Asian ports for 1st to 3rd generation container ships are obvious, especially for port of Kaohsiung, Port Kelang, Gwangyang, Jakarta, Kobe, Ben Nghe, Manila, Laem Chabang, Keelung, and Yokohama.
Twelve of 4th to 5th generation container ports are located in North America, nineteen located in South America, eight located in Asia, five located in Europe, four located in Australia, and two located in Africa. The figure shows that Asian, Panamanian, and US ports have significant location advantage for 4th to 5th generation container ships, especially for port of Hong Kong, Cristobal, Jeddah, Rodman Pier, Busan, Taboguilla Terminal, Oakland, Kill van Kull, and Coco Solo North.
Fourteen of 6th generation container ports are located in Asia, twenty located in Europe, and four are located in Africa. The figure shows that China, the Netherlands, and Malaysia have obvious location advantage for 6th generation container ships, especially for port of Ningbo-Zhoushan, Qingdao, Shenzhen, Shanghai, Rotterdam, Tianjin, Xiamen, Tanjung Pelepas, and Dalian.
In Figure 11, fourteen of handy size tanker ports are located in Europe, twelve located in Asia, seven located in South America, six located in North America, and five are located in Africa. The figure shows that Gulf of Guinea, East Asia, North America, and Europe have significant location advantage for handy size tankers, especially for port of Lagos, Lome, Al-Khair Terminal, Mailiao, Incheon, Galveston, Baytown, Nieuwport, Ijmuiden, Vlaardingen, and Gothenburg.
Eighteen of canal size tanker ports are located in Europe, nine located in South America, eight located in Asia, four located in Africa, and one is located in North America. The figure shows Black Sea and America have obvious location advantage for canal size tankers, especially for port of Novorossiysk, Freeport, Ambarli, Istanbul, Sint Michielsbay, Haydarpasa, Icdas Port, Bullenbaai Terminal, and Fuikbay.
Nineteen of VLCC size tanker ports are located in Asia, six located in Africa, four located in South America, one located in North America, and one is located in Europe. The figure shows that Persian Gulf, East Asia, and South Africa have obvious location advantage for VLCC size tankers, especially for port of Singapore, Fujairah, Ras Tanura, Khor Fakkan, Durban, Das Island, Shuaiba, Cape Town, and Ju’aymah.

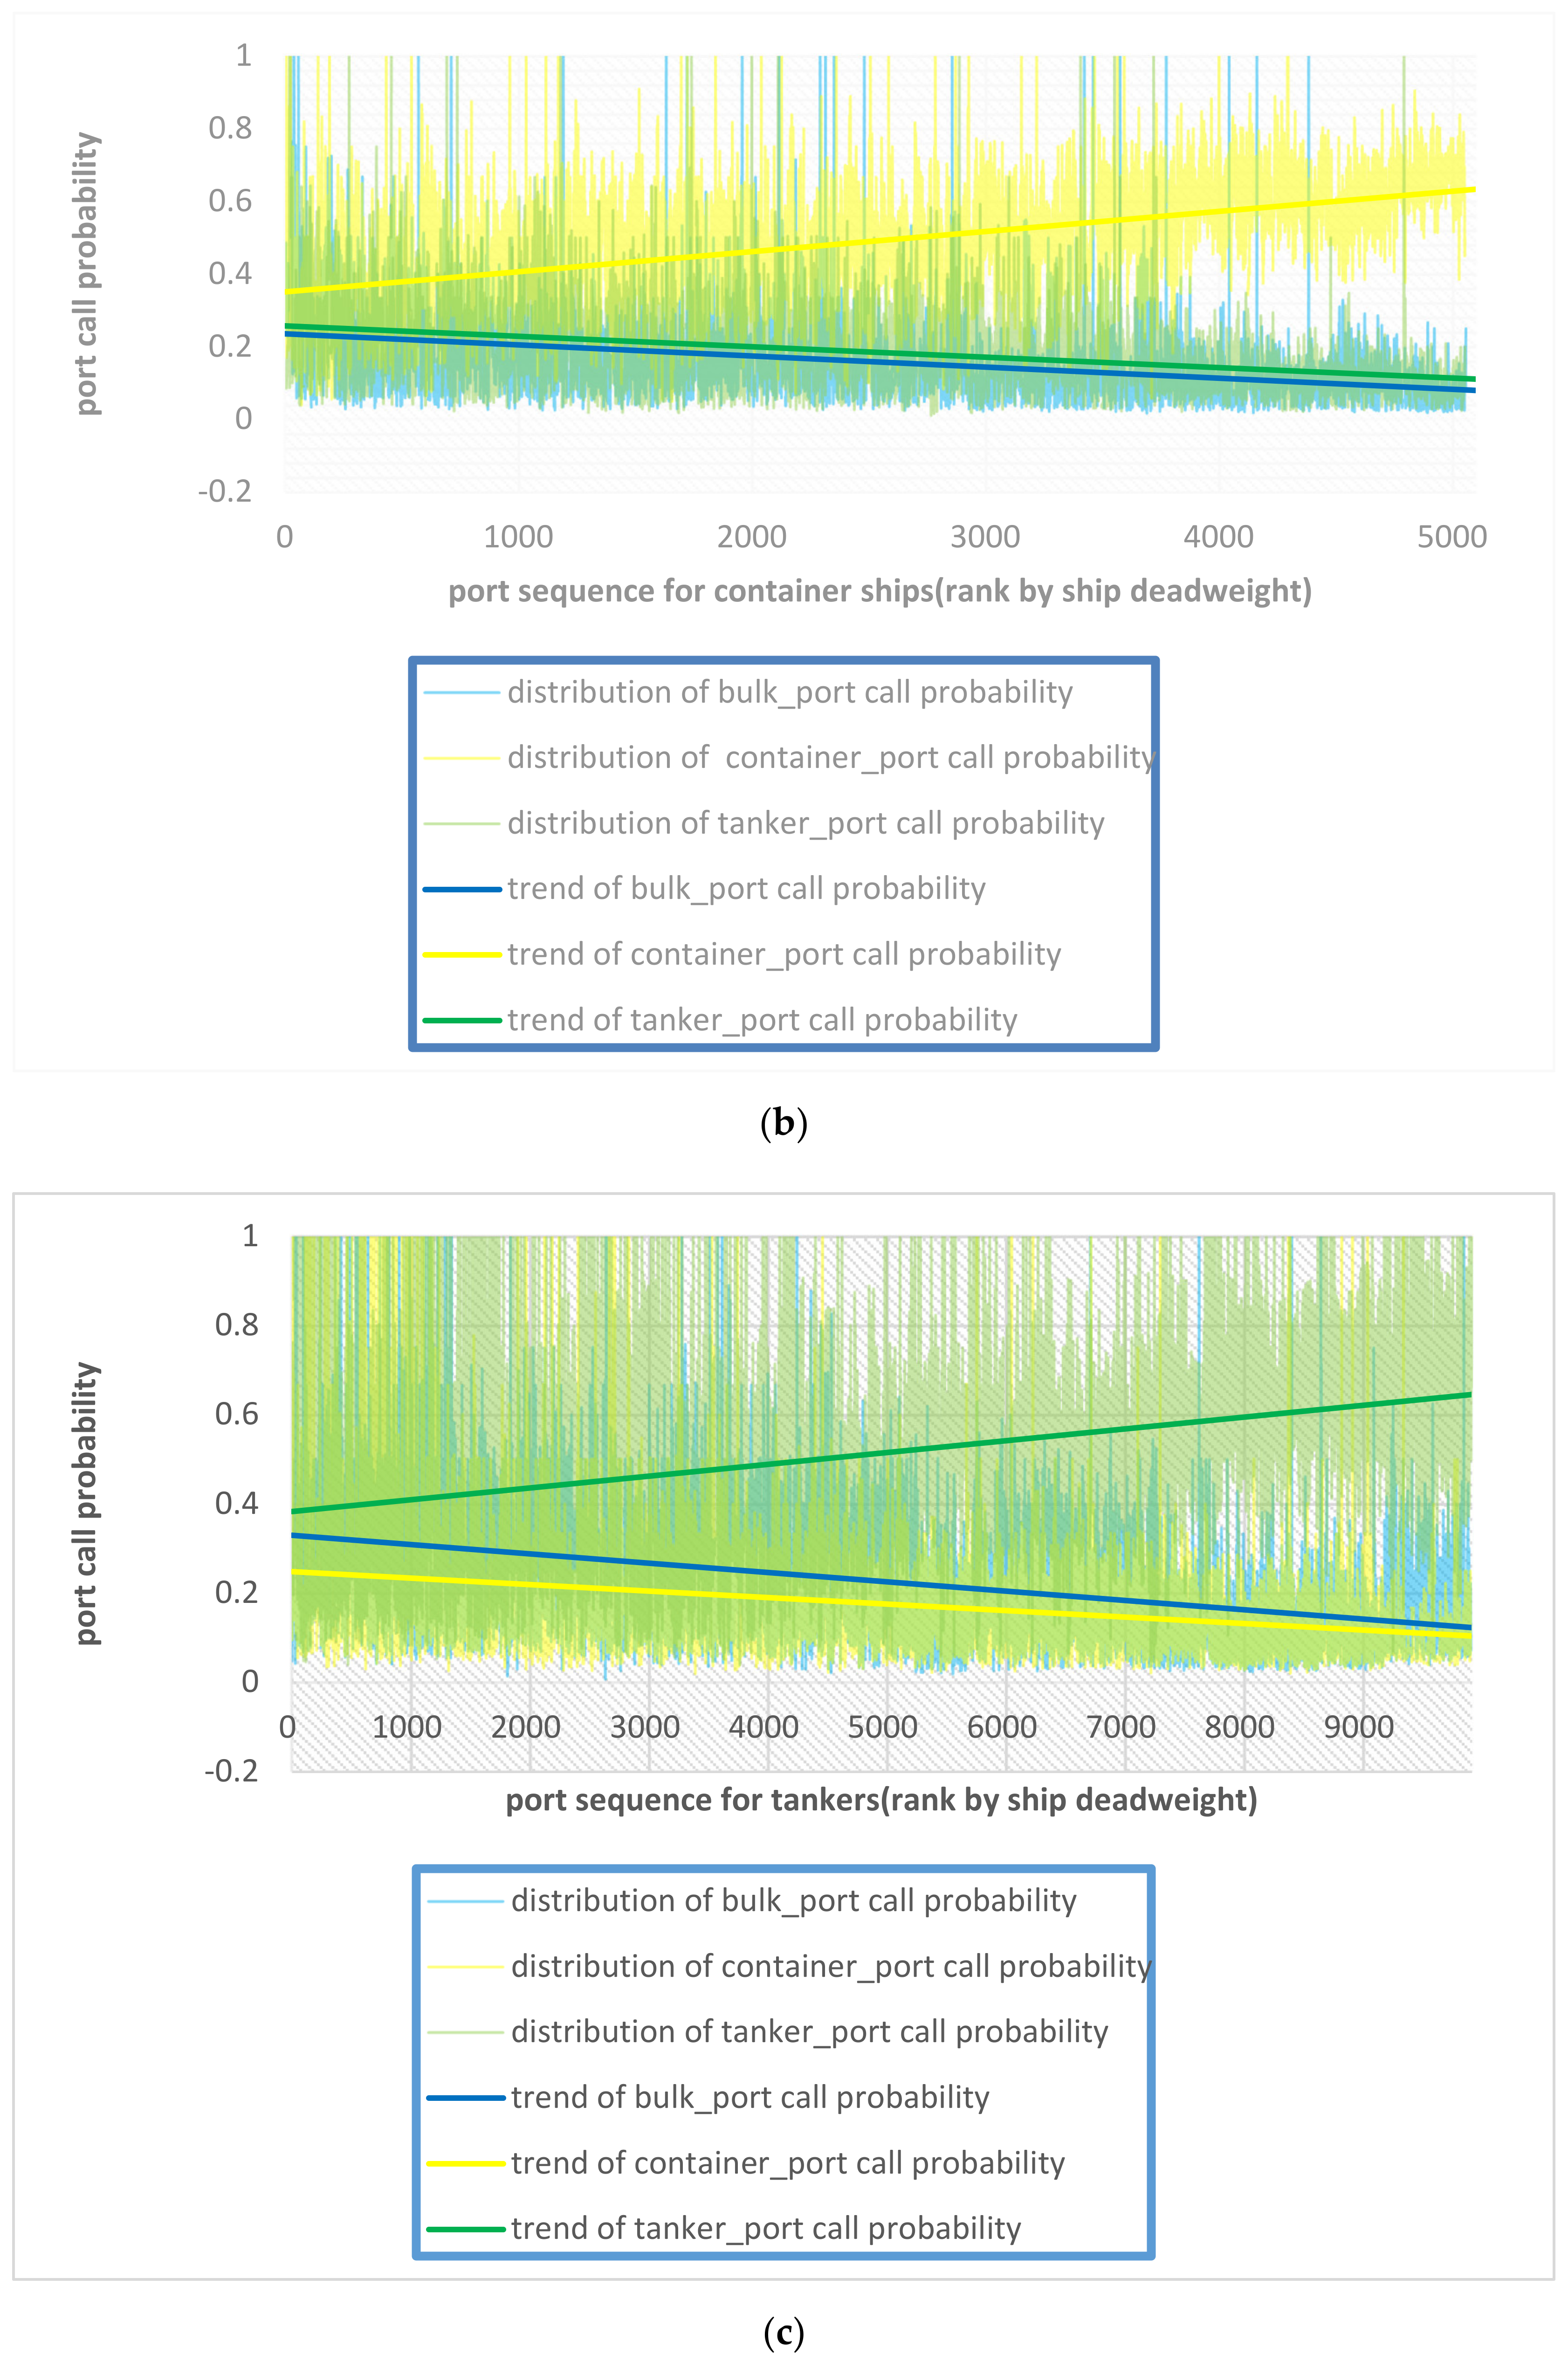
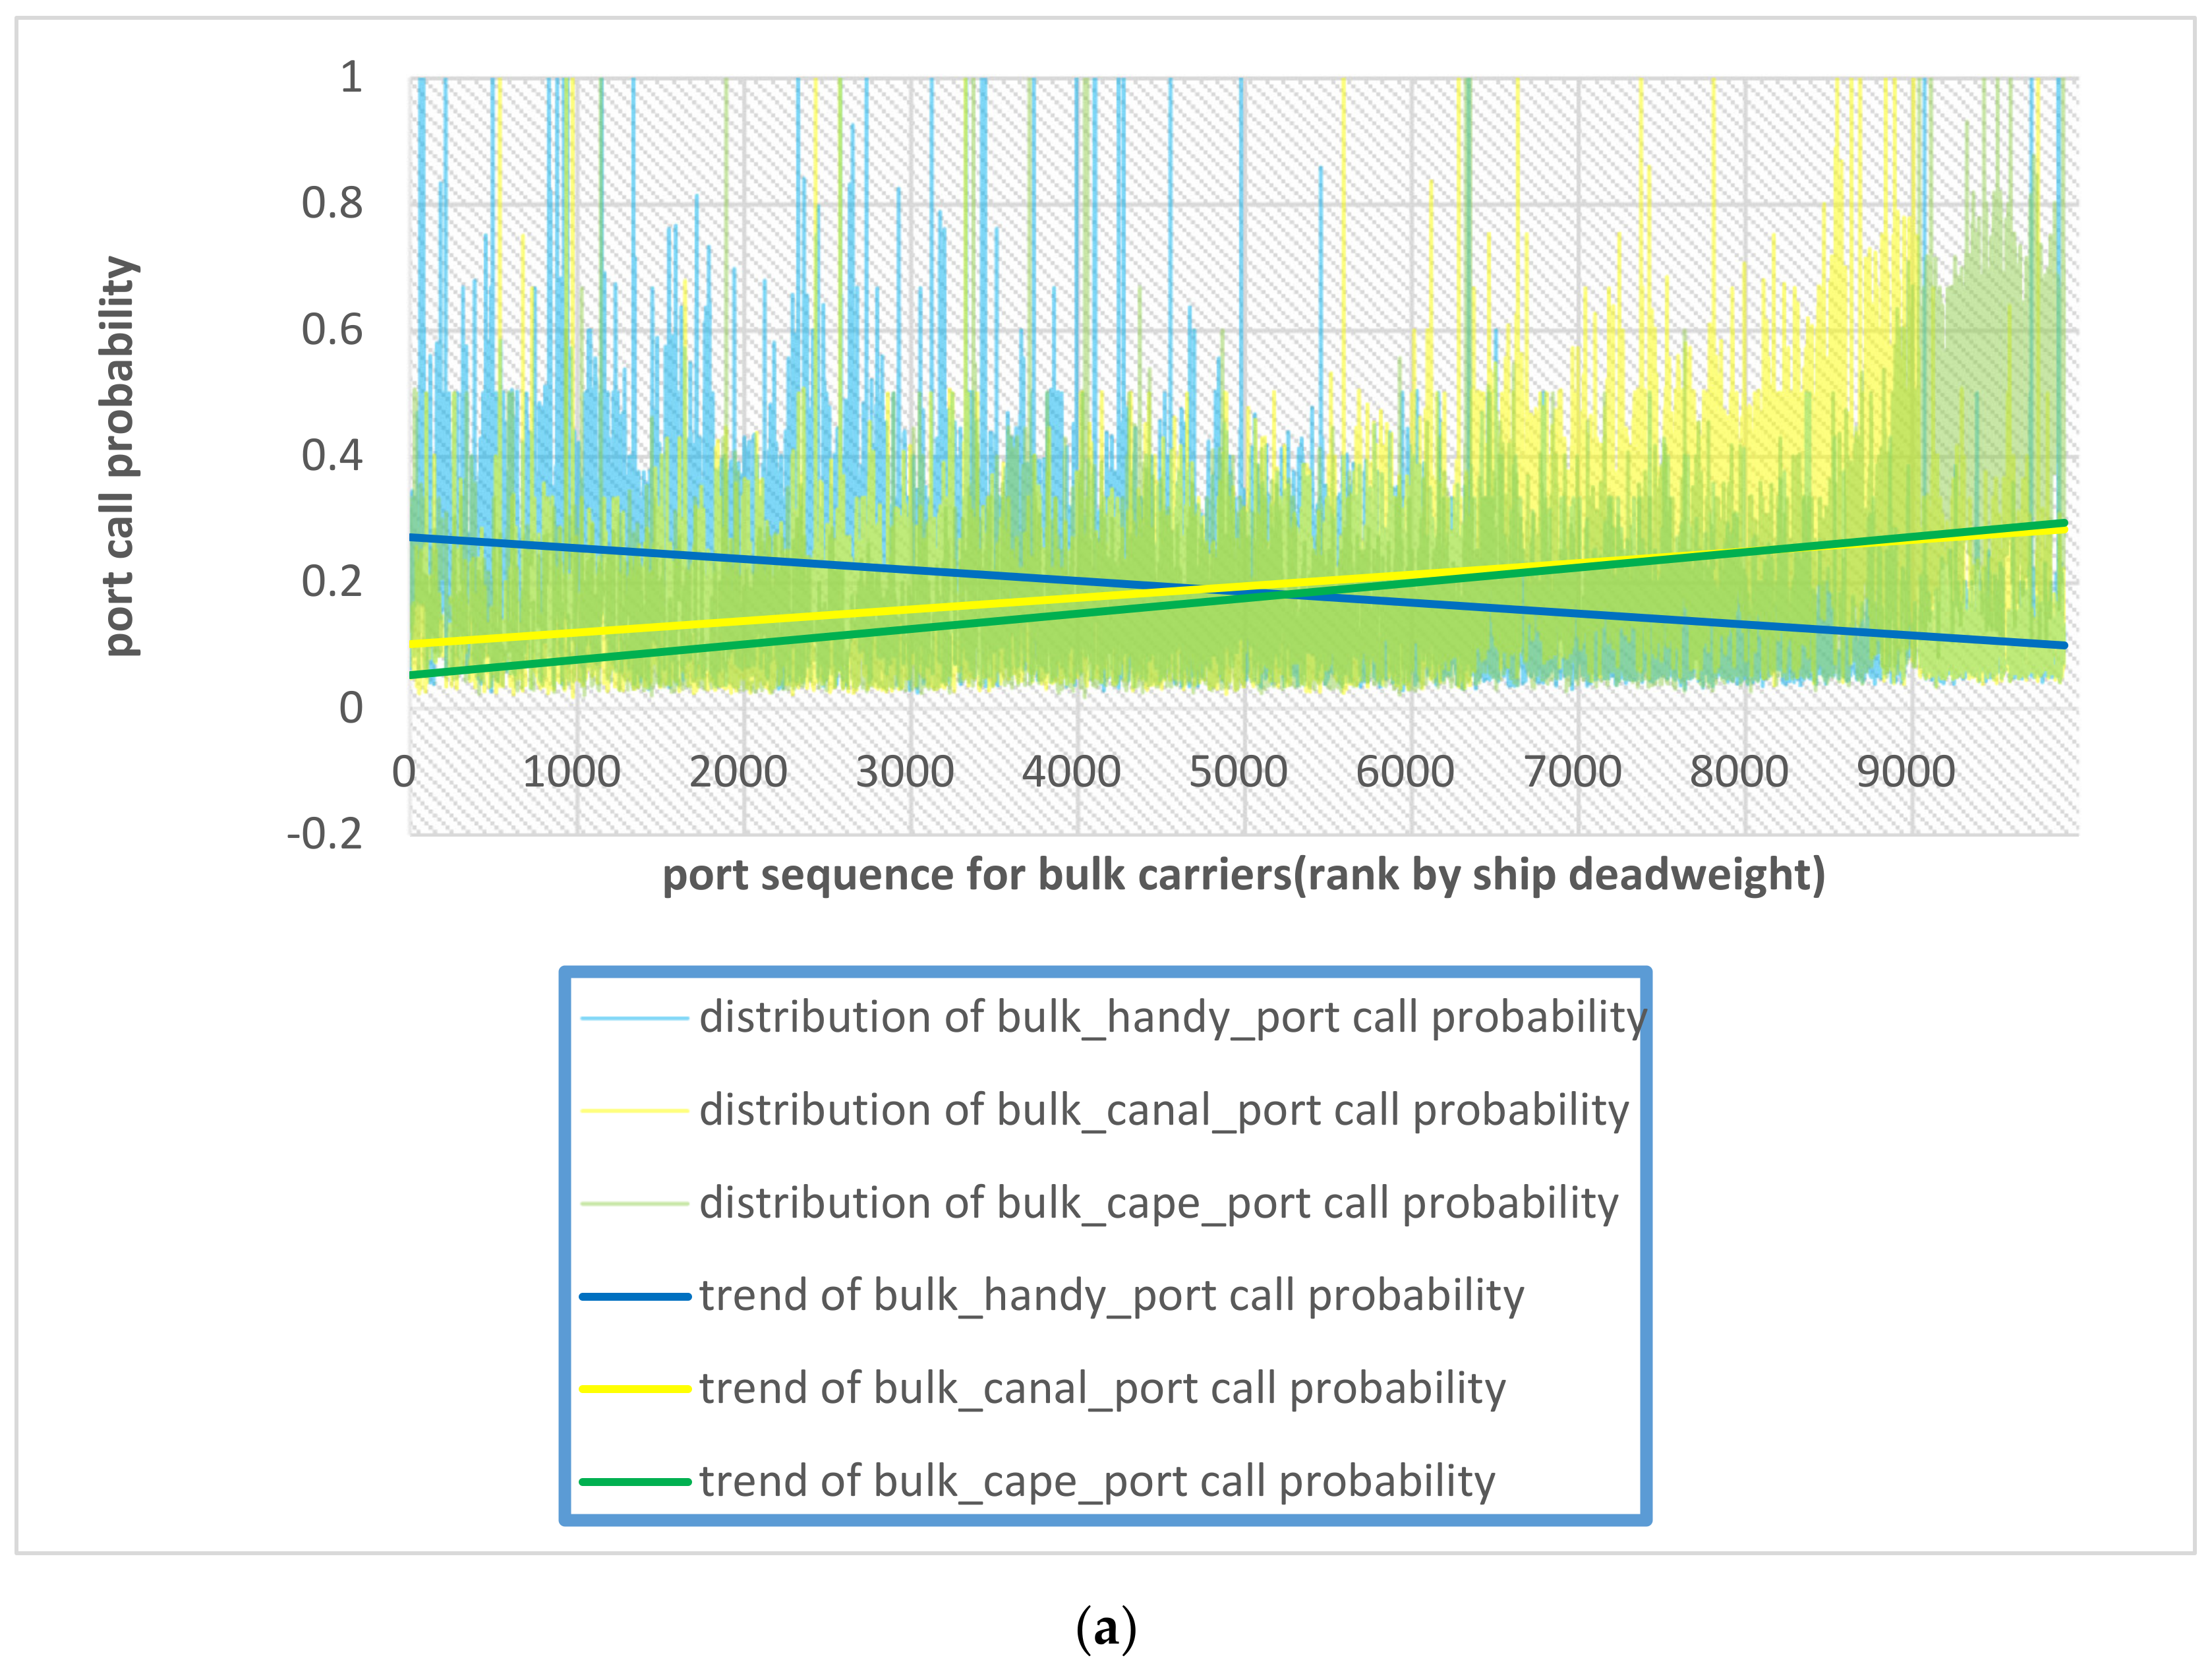
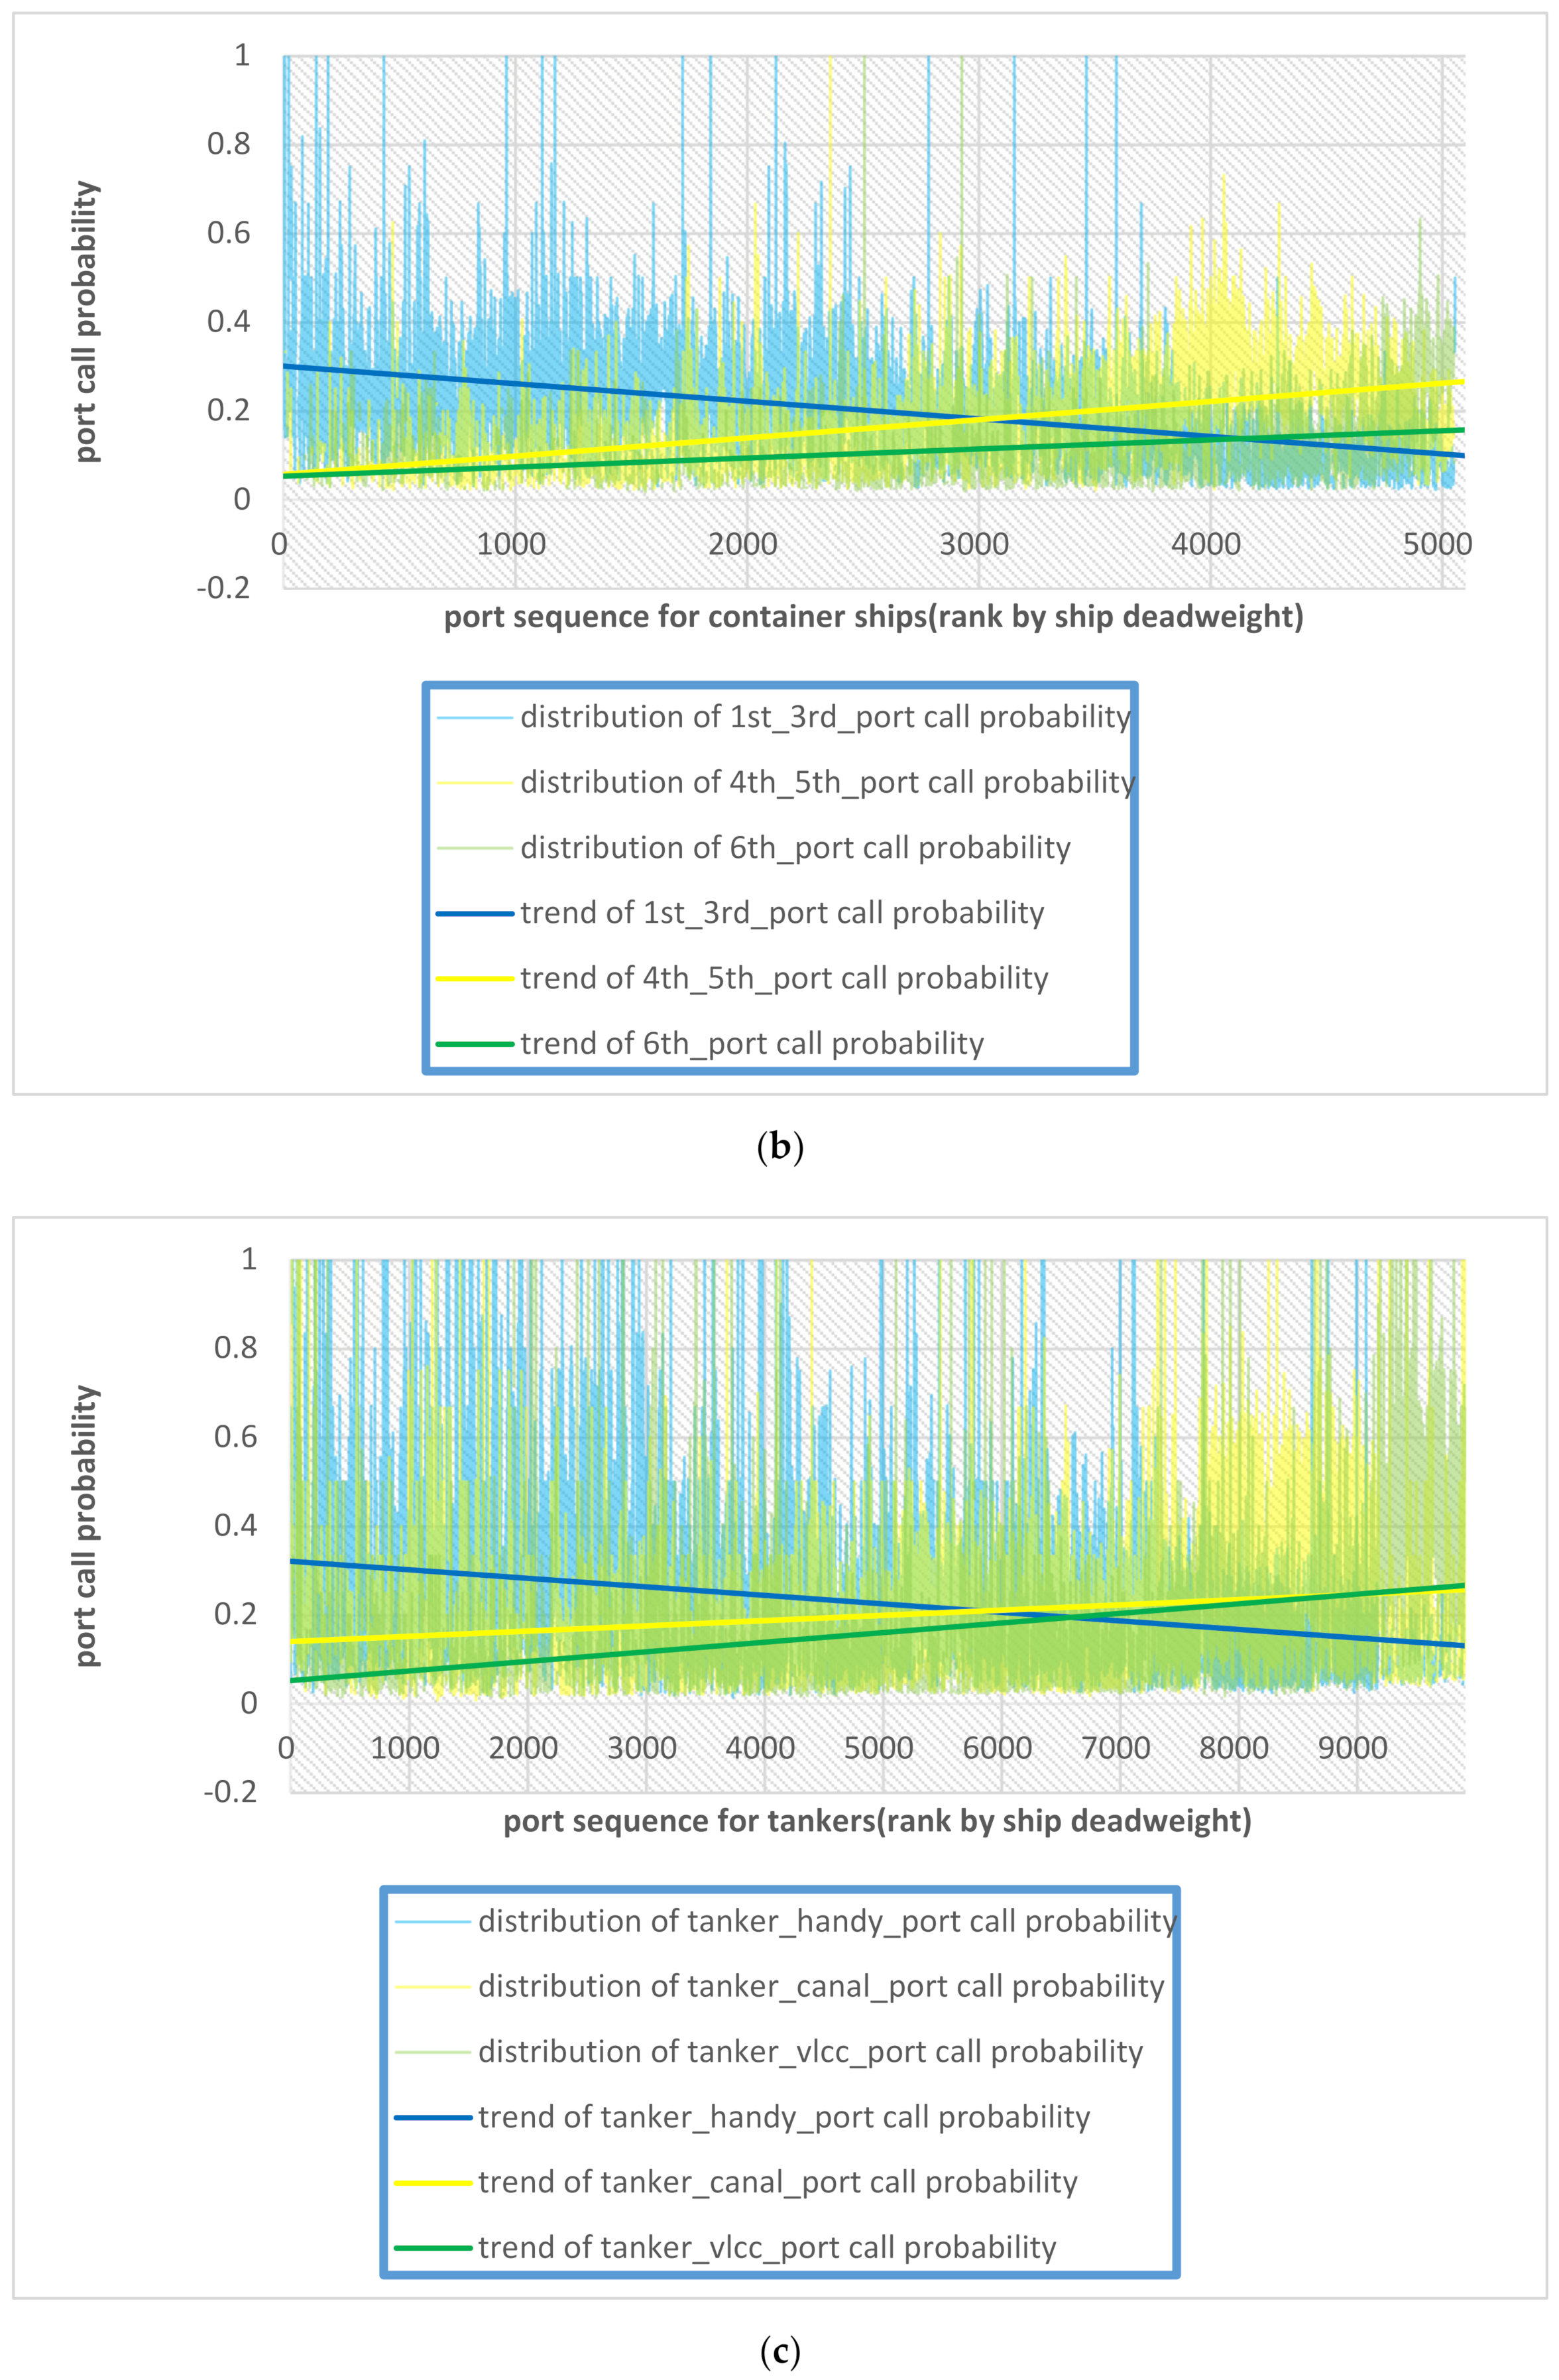
4.4. Port Call Probability Distribution for Typical Cargo Ships

According to ship type and scale list in Table 1, specialized port call probability distributions for typical cargo ships are exhibited in Figure 12 and Figure 13.
In Figure 12a, bulk port call probability for bulk carriers increases with deadweight growth. However, container port call probability for bulk carriers decreases with deadweight growth, and tanker port call probability for bulk carriers decreases with deadweight growth. In Figure 12b, container port call probability for containers increases with deadweight growth. However, bulk port call probability for the container ship decreases with deadweight growth, and tanker port call probability for the container ship decreases with deadweight growth. In Figure 12c, tanker port call probability for tankers increases with deadweight growth. However, bulk port call probability for tankers decreases with deadweight growth, and container port call probability for tankers decreases with deadweight growth.
For all types of specialized ports (regardless of ship scale), port call probability for the corresponding type ship is higher than for other type ships. Moreover, port call probability for corresponding type ships are positively correlated with ship’s deadweight, while port call probability for other type ships are negatively correlated with ship’s deadweight.
In Figure 13a, bulk handy size port call probability for bulk carriers decreases with deadweight growth. However, bulk canal size port call probability for bulk carriers increases with the deadweight growth, and bulk cape size port call probability for bulk carriers increases with deadweight growth.
In Figure 13b, container 1st–3rd port call probability for container ships decreases with deadweight growth. However, container 4th–5th port call probability for container ships increases with deadweight growth, and container 6th port call probability for container ships increases with deadweight growth. In Figure 13c, tanker handy size port call probability for tankers decreases with deadweight growth. However, tanker canal size port call probability for tankers increases with deadweight growth, and tanker VLCC port call probability for tankers increases with deadweight growth.
For certain types of special ports (considering ship scale), port call probability for the corresponding ship scale is higher than for other ships. Moreover, port call probability is positively correlated with ships’ deadweight if port scale is bigger than ship scale. Otherwise, port call probability is negatively correlated with ships’ deadweight.

5. Discussions and Conclusions

5.1. Discussions

Based on the specialized port classification model, berthing ports for typical cargo ships are divided into specialized bulk, container, and tanker ports. The number of each specialized port are 1125, 684, and 1213, respectively.
What’s more, bulk ports are divided into handy size, canal size, and cape size ports, the number of which are 642, 338, and 145 respectively; container ports are divided into 1st to 3rd generation, 4th to 5th generation, and 6th generation container ports, the numbers of which are 447, 149, and 88 respectively; tanker ports are divided into handy size, canal size, and VLCC size, the number of which are 634, 416, and 163 respectively.
Calculating the arrival frequency degree of port for each specialized port, the results indicate that top 66 handy size bulk ports account for 71%, canal size bulk ports account for 80.5%, and cape size bulk ports account for 94%. Top 66 1st to 3rd generation container ports account for 71.5%, 4th to 5th generation container ports account for 92%, and 6th generation container ports account for 99%. Top 66 handy size tanker ports account for 71.5%, canal size tanker ports account for 76.2%, and VLCC tanker ports account for 93.5%.
Based on the model of frequency of port of call, top 391 important ports of call for a typical global cargo ship in 2020 are mined by setting arrival frequency degree threshold, which account for 80% of the total deadweight tons of all ports. The number of frequent bulk ports for handy size, canal size, and cape size are 51, 46, and 40 respectively; the number of frequent container ports for 1st to 3rd, 4th to 5th, and 6th generations are 51, 50, and 38 respectively; the number of specialized ports for handy size, canal size, and VLCC size are 44, 40, and 31 respectively.
Handy size bulk carriers mainly call at Asia and North America, especially for port of Montreal, Chittagong, Yingkou, Thorold, Sault Ste. Marie, Port Colborne, Huanghua, Changzhou, Chiba, and Gresik; canal size bulk carriers mainly call at Australia, China, and ports of Brazil, Spain, and South Africa, especially for port of Gibraltar, Newcastle, Guangzhou, Santos, Qinhuangdao, Richards Bay, Yantai, Zhuhai, Gladstone, and Las Palmas; cape size bulk carriers mainly call at Australia, China, Brazil, and Indonesia, especially for port of Hedland, Tangshan, Port Walcott, Suzhou, Dampier, Lianyungang, and Rizhao.
1st to 3rd generation container ships mainly call at East and Southeast Asia, especially for port of Kaohsiung, Port Kelang, Gwangyang, Jakarta, Kobe, Ben Nghe, Manila, Laem Chabang, Keelung, and Yokohama; 4th to 5th generation container ships mainly call at China, Panama, the United States, and Spain, especially for port of Hong Kong, Cristobal, Jeddah, Rodman Pier, Busan, Taboguilla Terminal, Oakland, Kill van Kull, and Coco Solo North; 6th generation container ships mainly call at China, the Netherlands, and Malaysia, especially for port of Ningbo-Zhoushan, Qingdao, Shenzhen, Shanghai, Rotterdam, Tianjin, Xiamen, Tanjung Pelepas, and Dalian.
Handy size tankers mainly call at Gulf of Guinea, Sudan, the United States, and the Netherlands, especially for port of Lagos, Lome, Al-Khair Terminal, Mailiao, Incheon, Galveston, Baytown, Nieuwpoort, Ijmuiden, Vlaardingen, and Gothenburg; canal size tankers mainly call at Russia, Turkey and Dutch, especially for port of Novorossiysk, Freeport, Ambarli, Istanbul, Sint Michielsbay, Haydarpasa, Icdas Port, Bullenbaai Terminal, and Fuikbay; VLCC mainly call at UAE, Singapore, Saudi Arabia, and South Africa, especially for port of Singapore, Fujairah, Ras Tanura Khor Fakkan, Durban, Das Island, Shuaiba, Cape Town, and Ju’aymah.

5.2. Conclusions

For all types of specialized ports (regardless of ship scale), port call probability for corresponding ship type is higher than other ships. Moreover, port call probability for the corresponding ship type is positively correlated with the ship deadweight, while port call probability for the other type ship is negatively correlated with ship deadweight. For certain types of special type ports (considering ship scale), port call probability for the corresponding ship scale is higher than other ships. Moreover, port call probability is positively correlated with ship deadweight if port scale is bigger than ship scale. Otherwise, port call probability is negatively correlated with ship deadweight.
According to port call probability distribution of typical cargo ships, all possible destination ports’ geographical distribution for specific ship types and ship scales can be clearly shown, which provides an effective way for tracking maritime transmission path of the COVID-19 pandemic.
In future research, we will collect the cases of marine COVID-19 pandemic transmission and verify the real effect of this model in the tracking of marine pandemic transmission paths through simulation experiments.

Author Contributions

Conceptualization, H.Z.; methodology, C.Y.; software, Q.M.; validation, formal analysis, H.Z. and Q.H.; writing—original draft preparation, J.C.; writing—review and editing, H.Z.; supervision, Q.H. All authors have read and agreed to the published version of the manuscript.

Funding

This research was funded by Major projects of Shanghai Science and Technology Commission and Education Commission, grant number 18DZ1206300; National Natural Science Foundation of China, grant number 41501490; Project of Zhejiang Education Department, grant number Y202044638; key Project of the Chinese Academy of Sciences, grant number ZDRW-ZS-2016-6-3; Fujian Provincial Educational Department Foundation, grant number B16095; Project of Zhoushan science and Technology Bureau, grant number 2021C21010.

Institutional Review Board Statement

Not applicable.

Informed Consent Statement

Not applicable.

Data Availability Statement

Restrictions apply to the availability of these data. Data was obtained from [Shanghai Meili Shipbuilding Technology Co., Ltd.] and are available [at “http://www.hifleet.com/prelogin.do”] with the permission of [Shanghai Meili Shipbuilding Technology Co., Ltd.].

Conflicts of Interest

The authors declare no conflict of interest.

References

  1. Chen, X.; Xu, X.; Yang, Y.; Wu, H.; Tang, J.; Zhao, J. Augmented Ship Tracking Under Occlusion Conditions from Maritime Surveillance Videos. IEEE Access 2020, 8, 42884–42897. [Google Scholar] [CrossRef]
  2. Chen, X.; Lu, J.; Zhao, J.; Qu, Z.; Yang, Y.; Xian, J. Traffic Flow Prediction at Varied Time Scales via Ensemble Empirical Mode Decomposition and Artificial Neural Network. Sustainability 2020, 12, 3678. [Google Scholar] [CrossRef]
  3. Wang, Z.; Claramunt, C. Risk Assessment of the Overseas Imported COVID-19 of Ocean-Going Ships Based on AIS and Infection Data. Int. J. Geo-Inf. 2020, 9, 351. [Google Scholar] [CrossRef]
  4. March, D.; Metcalfe, K.; Tintoré, J.; Godley, B. Tracking the global reduction of marine traffic during the COVID-19 pandemic. Online Resour. July 2020. [Google Scholar] [CrossRef]
  5. Millefiori, L.M.; Braca, P.; Zissis, D.; Spiliopoulos, G.; Marano, S.; Willett, P.K.; Carniel, S. Covid-19 impact on global maritime mobility. arXiv 2020, arXiv:2009.06960. [Google Scholar]
  6. Zhu, J.; Qiu, W.; Jian, W. Evaluating Impacts of the COVID- 19 Pandemic on China’s Container Ports Based on AIS Big Data. J. Phys. Conf. Ser. 2020, 1624, 032050. [Google Scholar] [CrossRef]
  7. Wang, W.; Wang, C. Spatial evolution of coal transportation of coastal ports in China. Acta Geogr. Sin. 2016, 71, 1752–1766. [Google Scholar] [CrossRef] [Green Version]
  8. Zeng, Q.; Wu, K.; Teng, T. Spatial Distribution Features of Ports in Maritime Silk Road. J. Dalian Univ. Technol. (Soc. Sci.) 2016, 37, 25–30. [Google Scholar]
  9. Jian, L.; Li, D.; Zhao, S. China’s Coastal Port Complex Network Evolution. Econ. Geogr. 2016, 36, 96–103. [Google Scholar]
  10. Wang, L.; Zhu, Y. The evolution of China’s international maritime network based on the “21st Century Maritime Silk Road”. Acta Geogr. Sin. 2017, 72, 2265–2280. [Google Scholar]
  11. Ding, Z.Y.; Yao, D.; Wu, L.; Bi, J.P.; Zhao, R.L. A dock mining algorithm for massive vessel location data based on improved DBSCAN. Comput. Eng. Sci. 2015, 37, 2061–2067. [Google Scholar]
  12. Li, Z.; Shi, Y.; Xu, M.; Zhang, X. Position of the Asian Container Ports in Global Liner Shipping Network. Econ. Geogr. 2016, 36, 91–98. [Google Scholar]
  13. Zheng, H.; Hu, Q.; Yang, C.; Chen, J.; Mei, Q. Clustering Analysis and Anomaly Detection of Berthing Ships at Waigaoqiao Harbour District of Shanghai. J. Geo-Inf. Sci. 2018, 20, 640–646. [Google Scholar]
  14. Fang, L.; Wang, J.; Liang, J.; Zhang, M. Structural characteristics and evolution model of Intra-Asia shipping network. J. Dalian Marit. Univ. 2015, 41, 57–61. [Google Scholar]
  15. Liu, C.; Hu, Z. Robustness research of global container shipping network based on complex network. J. Guangxi Univ. (Nat. Sci. Ed.) 2016, 41, 1441–1448. [Google Scholar]
  16. Liu, C.; Hu, Z. Hierarchy System Research about the Maritime Silk Road Shipping Network. Econ. Geogr. 2017, 37, 27–32. [Google Scholar]
  17. Li, Z.; Jiang, S.; Xu, M.; Shi, Y.; Zhang, X. Study on the Shipping Network Evaluation under the Arctic Route. Complex Syst. Complex. Sci. 2015, 12, 55–60. [Google Scholar]
  18. Li, Z.; Shi, Y.; Xu, M.; Zhang, X.; Jiang, S. Hierarchical structure in the global liner shipping network. Syst. Eng. -Theory Pract. 2016, 36, 981–988. [Google Scholar]
  19. Wang, J.; Hu, Z. Research on regions relationship based on shipping network. J. Guangxi Univ. (Nat. Sci. Ed.) 2016, 41, 1432–1440. [Google Scholar]
  20. Wang, N.; Dong, L.L.; Wu, N. The change of global container shipping network vulnerability under intentional attack. Acta Geogr. Sin. 2016, 71, 293–303. [Google Scholar]
  21. Xu, M. Complexity in the Global Container Shipping Network: Regions, Ports and Flows. Ph.D. Thesis, Dalian Maritime University, Dalian, China, 2016. [Google Scholar]
  22. Xu, M. Research of Centrality in the Complex Network of Global Shipping. Ph.D. Thesis, Dalian Maritime University, Dalian, China, 2013. [Google Scholar]
  23. Li, Q.; Zhen, H. Spatial Linkage Intensity and Evolution Path of Container Shipping Network. Navig. China 2016, 39, 111–114. [Google Scholar]
  24. Wang, J.; Li, X.; Wang, X. Complex Network Evolution of Different Scale Shipping Based on Improved BA Model. J. Transp. Syst. Eng. Inf. Technol. 2013, 13, 103–110. [Google Scholar]
  25. Peng, C. Study on Frequencies of Port Call for Global Ships. Water Transp. Sci. Res. 2007, 48–49. [Google Scholar]
  26. Peng, P.; Cheng, S.; Liu, X.; Mei, Q.; Lu, F. The robustness evaluation of global maritime transportation networks. Acta Geogr. Sin. 2017, 72, 2241–2251. [Google Scholar]
  27. Ducruet, C. Multilayer dynamics of complex spatial networks: The case of global maritime flows (1977–2008). J. Transp. Geogr. 2017, 60, 47–58. [Google Scholar] [CrossRef] [Green Version]
  28. Yu, H.; Fang, Z.; Lu, F.; Peng, P.; Zhao, Z.; Feng, M. Spatial-temporal Evolution Patterns of Maritime Networks between Important Economic Developing Zones Revealed. J. Geo-Inf. Sci. 2018, 20, 582–592. [Google Scholar]
  29. Kaluza, P.; Kölzsch, A.; Gastner, M.T.; Blasius, B. The complex network of global cargo ship movements. J. R. Soc. Interface 2010, 7, 1093–1103. [Google Scholar] [CrossRef]
  30. Peng, P.; Cheng, S.; Chen, J.; Liao, M.; Wu, L.; Liu, X.; Lu, F. A fine-grained perspective on the robustness of global cargo ship transportation networks. J. Geogr. Sci. 2018, 28, 881–899. [Google Scholar] [CrossRef] [Green Version]
  31. Zheng, H.; Xiang, X.; Hu, Q. Statistics and Analysis of Regional Shelved Ships Based on AIS data. Navig. China 2012, 35, 8–12. [Google Scholar]
Figure 1. Hierarchical clustering for all ports.
Sustainability 13 01089 g001
Figure 2. Hierarchical clustering for bulk ports.
Sustainability 13 01089 g002
Figure 3. Hierarchical clustering for container ports.
Sustainability 13 01089 g003
Figure 4. Hierarchical clustering for tanker ports.
Sustainability 13 01089 g004
Figure 5. Frequencies of port call distribution for bulk ports: (a) Frequencies of port call distribution for bulk_handy ports, (b) Frequencies of port call distribution for bulk_canal ports, (c) Frequencies of port call distribution for bulk_cape ports.
Sustainability 13 01089 g005aSustainability 13 01089 g005b
Figure 6. Frequencies of port call distribution for container ports: (a) Frequencies of port call distribution for 1st–3rd generation ports, (b) Frequencies of port call distribution for 4th–5th generation ports, (c) Frequencies of port call distribution for 6th generation ports.
Sustainability 13 01089 g006aSustainability 13 01089 g006b
Figure 7. Frequencies of port call distribution for tanker ports: (a) Frequencies of port call distribution for tanker_handy ports, (b) Frequencies of port call distribution for tanker_canal ports, (c) Frequencies of port call distribution for tanker_vlcc ports.
Sustainability 13 01089 g007aSustainability 13 01089 g007b
Figure 8. Geographical distribution of frequent specialized ports with different frequency degrees.
Sustainability 13 01089 g008
Figure 9. Geographical distribution of frequent bulk ports with different scales.
Sustainability 13 01089 g009
Figure 10. Geographical distribution of frequent container ports with different scales.
Sustainability 13 01089 g010
Figure 11. Geographical distribution of frequent tanker ports with different scales.
Sustainability 13 01089 g011
Figure 12. Special type port call probability distribution for typical cargo ships: (a) Special type port call probability distribution for bulk carriers, (b) Special type port call probability distribution for container ships, (c) Special type port call probability distribution for tankers.
Sustainability 13 01089 g012aSustainability 13 01089 g012b
Figure 13. Special scale port call probability distribution for typical cargo ships: (a) Special scale port call probability distribution for bulk carriers, (b) Special scale port call probability distribution for container ships, (c) Special scale port call probability distribution for tankers.
Sustainability 13 01089 g013aSustainability 13 01089 g013b
Table 1. Scale list of typical cargo ships.
Ship TypeSerial NumberShip ScaleTotal Deadweight (104 Tonnage)
Bulk carrier1Handy size1–6
2Canal size6–15
3Cape sizemore than 15
Container ship11st to 3rd generation1–6
24th to 5th generation6–12
36th generationmore than 12
Tanker1Handy size1–6
2Canal size6–16
3Very large crude carrier (VLCC)more than 16
Table 2. List of overall deadweight for typical global berthing cargo ships in 2020.
Serial NumberShip TypeNumber of Berthing Ships for Ship (More than 104 Tonnage)Overall Deadweight of Berthing ShipsDeadweight Ratio
1Bulk carrier155,22710,711,024,20298.88%
2Container ship240,94411,638,659,34497.75%
3Tanker196,07314,051,460,41391.75%
Table 3. Port capacity ratio for all kinds of typical global berthing cargo ships in 2020.
Port SequencePort NamePort Capacity Ratio for Different Category Type
Bulk CarriersContainer ShipsTankers
Port Capacity Ratio for Different Category Size
Handy SizeCanal SizeCape Size1st to 3rd4th to 5th6thHandy SizeCanal SizeVLCC
1Singapore0.160.490.35
0.280.320.40.350.280.370.330.360.31
2Ningbo-Zhoushan0.160.740.1
0.260.230.510.190.310.50.520.180.3
3Fujairah0.130.020.85
0.550.340.110.720.2800.240.290.47
4Hongkong0.10.840.06
0.350.420.230.410.310.280.640.290.07
5Shenzhen0.010.990
0.20.610.190.210.280.51000
Table 4. Number distribution of special purpose ports for typical global berthing cargo ships in 2020.
Port TypePort ScalePort Number
BulkHandy size642
Canal size338
Cape size145
Container1st to 3rd generation447
4th to 5th generation149
6th generation88
TankerHandy size634
Canal size416
VLCC163
Publisher’s Note: MDPI stays neutral with regard to jurisdictional claims in published maps and institutional affiliations.

