Article

Numerical Study of Cylindrical Tropical Woods Pyrolysis Using Python Tool

by
Nidhoim Assoumani
1,
Merlin Simo-Tagne
1,2,3,*,
Fatima Kifani-Sahban
1,
Ablain Tagne Tagne
4,
Maryam El Marouani
5,
Marcel Brice Obounou Akong
4,
Yann Rogaume
2,
Pierre Girods
2 and
André Zoulalian
6
1
Team of Modeling and Simulation in Mechanics and Energetic, Department of Physics, Faculty of Sciences, Mohammed V University, Av Ibn Battouta, PO Box 1014, Rabat 10000, Morocco
2
INRAE, LERMAB, ERBE-F, University of Lorraine, 27 rue Philippe Seguin, CS 60036, 88026 Epinal, France
3
Department of Forestry and Agriculture, CFA-CFPPA of Mirecourt, 22 rue du Docteur Grosjean, 88500 Mirecourt, France
4
Department of Science, University of Yaoundé I, Yaoundé P.O. Box 812, Cameroon
5
Department of Chemistry, College of Sciences, University of Hafr Al Batin, Hafr Al Batin P.O. Box 39524, Saudi Arabia
6
INRAE, LERMAB, ERBE, Faculty of Sciences and Techniques, University of Lorraine, P.O. Box 70239, 54506 Vandœuvre-lès-Nancy, France
*
Author to whom correspondence should be addressed.
Sustainability 2021, 13(24), 13892; https://doi.org/10.3390/su132413892
Submission received: 20 November 2021 / Revised: 11 December 2021 / Accepted: 13 December 2021 / Published: 15 December 2021
(This article belongs to the Collection Advances in Biomass Waste Valorization)

Abstract

:
In this paper, the thermal behavior of large pieces of wood pyrolysis has been modeled. Two mathematical models coupling heat transfer equations to chemical kinetics were used to predict the pyrolytic degradation of a 25 mm radius wood sample, assumed to be dry in the first model and wet in the second, when heated to 973.15 K. The reactions involved in the pyrolysis process are assumed to be endothermic. The diffusion of bounded water during the process is taken into account in the second model, where the heat transfer equation has been coupled to that of the diffusion of moisture. This model, although simple, provides more information on the drying and pyrolysis processes during the heating of wood, which is its originality. It can therefore be advantageously used to calculate the temperature distribution in a pyrolysis bed. The equations of the two models, discretized by an explicit finite difference method, were solved numerically by a program written in Python. The validation of both models against experimental work in the literature is satisfactory. The two models allow examination of the temperature profile in the radial direction of wood samples and highlighting of the effect of temperature on some thermal, physical and physicochemical characteristics.

1. Introduction

Renewable energies are of growing importance from an environmental point of view as a substitute for fossil fuels. These renewable energies use inexhaustible sources of energy of natural origin such as the sun, the wind, without forgetting the biomass which in the energy field of this document, will concern only the products of vegetable origin, or more precisely the wood. Wood from tropical forests is the object of a strong attraction both in tropical and temperate countries [1]. This wood is used not only to satisfy the construction needs of buildings, works of art and furniture, but also for the production of energy [1].
Africa is currently experiencing a period of sustained economic growth and transformation, with a rapidly increasing population and growing and diversifying economies. To be sustainable, such growth requires massive investment in the energy sector. In Africa, fossil fuels are scarce, costly to exploit as a source of energy or for the production of raw materials and have a negative environmental impact (greenhouse gas emissions). Good governance and improved access to energy are undoubtedly the challenges that Africa must overcome to maintain its economic growth. The use of traditional biomass is prevalent in Africa, where it is burned directly for cooking and lighting in the residential sector or, to a lesser extent, in the industrial sector. This has negative consequences not only for the health of the population but also for the environment [2]. The main source of traditional biomass on the African continent is fuelwood or firewood with a total forest stock estimated at 130 billion tons in 2010 spread over Central Africa and parts of Southern Africa [2]. However, the amount of wood available each year, without risk of deforestation, is much smaller. It would therefore be beneficial to exploit the little biomass-wood available to produce maximum heat by using advanced techniques such as combustion and pyrolysis to obtain secondary products such as biochar, bio-oil and gas whose calorific values are much higher than that of wood.
The energy situation in Comoros is characterized by a close dependence on two energy sources: wood and petroleum products. Wood fuels and petroleum products make up 57% and 41% respectively of the country’s energy mix; the remaining 2% comes from electricity [3]. Wood energy is mainly used for domestic cooking (93%) and for the distillation of ylang-ylang flower (7%) [3]. The wood collected is used in traditional equipment with low energy efficiency and from which harmful fumes are emitted. The petroleum products consumed in the country are all imported and are used mainly for transport, electricity production and domestic use. Renewable energy, particularly solar photovoltaic energy, is gradually entering the market, but its share of the energy mix remains negligible compared with conventional energy sources.
The Comoros archipelago, due to its geographical position and geological situation (volcanic archipelago), is subject to various natural hazards, such as cyclones, floods, volcanic eruptions, etc., which lead to the destruction of infrastructure and threaten the archipelago with extinction. The massive collection of firewood and the unbridled consumption of fossil fuels contribute significantly to the increase in the frequency and intensity of these natural hazards. Dependence on fuelwood, exacerbated by population growth, is leading to the degradation of large areas of forest habitat, which in turn leads to landslides. It is estimated that only 3.4% of the original forest cover remains. Land degradation has reached 57%, and desertification continues. The country has no more cultivable space. Possible expansion of agriculture can only be undertaken at the expense of the remaining forest areas [4]. In 2010, a report by the Food and Agriculture Organization of the United Nations (FAO) on the assessment of the country’s forest resources (Mayotte not included) sounded the alarm: the area of natural forests in the country has decreased from 10,372 ha in 1990 to 1612 ha in 2010 [5]. As for fossil fuels, problems related to global warming are attributed to greenhouse gas emissions from their unbridled consumption.
We are therefore in the context where biomass energy, in this case wood, which is a renewable energy, is used in the country but its regeneration and consumption are not planned in a sustainable way; fossil fuels, with their heavy pollution, complete the grim picture. The question arises as to how to reduce dependence on firewood and how to control the consumption of fossil fuels. The use of thermochemical conversion processes, such as pyrolysis, to convert biomass into bio-oil, charcoal and gas would reduce this dependence and move away from fossil fuels. Pyrolysis products can be used to produce heat, electricity and can even be used as a transportation fuel after an upgrade or combination with fossil fuels.
The design and optimization of pyrolysis/combustion plants require the control of their fundamental processes. Several simultaneous reactions occur rapidly during pyrolysis, including dehydration, depolymerization, decarboxylation, char formation, and others [6]. Due to the complexity of biomass, a large number of studies have been conducted that address the pyrolysis process in various kinetic approaches often coupled, to provide a more real description, to heat and mass transfer phenomena.
Many authors have simply considered a global reaction, converting wood into volatile products and charcoal [7,8,9,10], while others have used kinetic models involving two or more parallel or successive, irreversible, first-order reactions [11,12,13]. Most of these works were carried out on small wood samples and do not include, with a few exceptions, the effect of the water content of the wood. They assume initially dry wood samples. However, initially dry wood generally has at best an equilibrium moisture content of between 0.08 and 0.1 kg/kg in North Africa and between 0.2 and 0.12 kg/kg in Sub-Saharan Africa. It would therefore be somewhat incorrect to study pyrolysis from an anhydrous state of the wood.
In addition, when pyrolysis is conducted on small particles of low mass, physical limitations are overcome, chemical kinetics being the only limiting step. On the other hand, for massive samples, relevant to applications that are artisanal as well as industrial, coupling between the chemical kinetics and the physical limitations takes place. It is therefore necessary to take into account, during process modelling, the complex nature of wood (anisotropy, hygroscopy, etc.), the coupling between chemical kinetics, the heat transfer and the mass transfer which take place during the pyrolysis process.
Furthermore, experimental and theoretical studies have been carried out for large wet biomass particles by Shen et al. [12] and Chan et al. [14]. They translated the evaporation of bounded water during the heating process into a chemical drying reaction. Saastamoinen and Richard [15] proposed a mathematical model to evaluate the drying and pyrolysis of wood samples. They found that for large particles, drying and pyrolysis overlap during thermal decomposition, and that moisture in the particles significantly delays pyrolysis and reduces its rate. Furthermore, the volatile materials released during the pyrolysis process can lead to convective heat transfer near the surface, thus delaying the passage of the conductive wave into the solid [15,16].
Taking into account previous studies in literature reviews, and in order to optimize the heat treatment, we proposed, in this work, to model the thermal behavior of a large piece of tropical wood subjected to pyrolysis.

2. Materials and Methods

a
Assumptions
To model the pyrolysis of solid wood samples, a number of assumptions must be made. For the purpose of this study, we will assume that:
  • The studied sample is of cylindrical geometry, of infinite length, heated through its surface by convection and radiation;
  • Samples are directly exposed to the heat fixed numerically, thus the heating rates are neglected.
  • Pyrolysis does not generate any change in the volume of the sample and the latter is considered isotropic;
  • For simplicity, heat is assumed to be transmitted inside the solid particle by conduction only;
  • The heat and mass transfer of the volatile products and the vapor inside the solid are ignored;
  • The volatile products and the vapor leave the solid as soon as they are produced. They are in thermal equilibrium with the solid matrix and therefore the rate of solid mass loss is taken as the mass flux of the volatiles;
  • Secondary reactions of the volatile products are not taken into account;
  • The chemical reactions of pyrolysis are described by the Arrhenius law of first order.
b
Setting in equation of the pyrolysis of wood
We propose to establish the equations that govern the pyrolysis of a cylindrical wood sample. The study of the process will be undertaken by means of two kinetic approaches: a uni-reactionary approach and a multi-reactionary one. The first is a global reaction, developing uniformly in the particle and converting the wood into volatile products and charcoal. The second, proposed by Shen et al. [12], is a one-step multi-reaction model formed by three competitive reactions (one reaction for the drying step and two others composing the pyrolysis step).
Based on the above assumptions, let us establish the material and energy balances.
Uni-reactional approach [7]:
In this approach, wood is assumed to decompose into charcoal and volatile products in a single, endothermic, irreversible reaction of order 1. In addition to the assumptions made above, the physical properties of the sample, including C p and λ are assumed to be constant. The energy balance translating the heat accumulation, coming from the contribution of the diffusive heat flow and the reactions over time is coupled to the material balance which is the speed of the reaction. Bamford et al. [7] are written as follows (model 1):
  • Heat balance
ρ C b T t = λ r r ( r T r ) Q ρ t  
  • Mass balance
ρ t = A ρ e E / R g T  
Multi-reactional approach [12]:
In this approach, we consider all the phenomena that take place during the pyrolysis process of a wet wood sample, including the formation of water vapor, gases and charcoal [12]. The reactions involved in the process are characterized by three rate constants (associated with the formation of charcoal, gases and steam) obeying the Arrhenius law. For this second model, in addition to the coupling between heat transfer and chemical kinetics, we have taken into account the diffusion of bounded water during the heating process. This has allowed us to follow the spatio-temporal evolution of the humidity and to evaluate its influence. The heat balance and mass conservation equations for solids, gases, steam and liquid are written as follows (model 2):
  • Heat balance
T ( ρ i C p i ) t = λ r r ( r T r ) + Q r  
where:
( ρ i Cp i ) = ρ b C b + ρ c C c + ρ l C l
Q r = k 1 ρ b [ Δ h 1 0 + ( C c C b ) ( T T 0 ) ] + k 2 ρ b [ Δ h 2 0 + ( C g C b ) ( T T 0 ) ] + k 3 ρ l [ Δ h 3 0 + ( C v C l ) ( T T 0 ) ]
λ , in (W/m. K), is the thermal conductivity of the solid. It is calculated, taking into account the effect of moisture (H) and carbonaceous residue ( λ c ), as follows:
λ = η λ c + ( 1 η ) λ b
with:
η =   ρ c   ρ c + ρ b
λ b = 0.166 + 0.396 H
The humidity (H) is obtained by solving the following equation:
H t = D h r r ( r H r )
D h , is the mass diffusion coefficient, and is expressed in [m2/s]. It is calculated as follows:
D h = exp ( 9.9 + 9.8 χ eq 4300 T a )
χ eq , is the moisture content at equilibrium. It is calculated according to the relation of Simpson and TenWolde taken from Simo-Tagne [17]:
χ eq = 18 A ( B × RH 1 B × RH + C × B × RH + 2 × C × D × B 2 × RH 2 1 + C × B × RH + C × D × B 2 × RH 2 )
where RH is the relative humidity (%/100) and the parameters A, B, C and D are calculated as follows:
A = 349 + 1.29 T a + 0.0135 T a 2
B = 0.805 + 0.000736 T a 0.00000273 T a 2
C = 6.27 0.00938 T a 0.000303 T a 2
D = 1.93 + 0.0407 T a 0.000293 T a 2
with T a , the temperature of the surrounding air expressed in (°C).
  • Mass balances of wood, charcoal, gas, liquid and steam:
{ ρ b t = ( k 1 + k 2 ) ρ b ρ c t = k 1 ρ b ρ g t = k 2 ρ b ρ l t = k 3 ρ l ρ v t = k 3 ρ l  
  • Initial and boundary conditions
The initial and boundary conditions of the problem are:
-
At t = 0 ,
ρ = ω 0   and   H = H 0  
T is equal to the ambient air temperature. The density of the gases and steam is initially 0   kg / m 3 .
-
Due to the cylindrical symmetry, the condition at the center gives:
( T r ) r = 0 ,     t > 0 = 0 ( H r ) r = 0 ,     t > 0 = 0  
-
At the surface of the sample, in r = R, we have:
λ ( T r ) r = R ,   t > 0 = h c ( T f T ) + ε σ ( T f 4 T 4 ) D h ( H r ) r = R ,   t > 0 = h m ( χ e q H )  
with:
h m = h c D a λ a ( α a D a ) 1 / 3
Under these conditions, the equations including the moisture content of the wood are associated with the multi-reaction approach. To solve the equations established in this study, we propose to use the explicit finite difference method. The differentiation scheme used is centered. The fictitious node approach has been used to discretize the boundary conditions [18]. The obtained equations were solved numerically by a program written in Python.
c
Numerical values of the model constants
The numerical values of the parameters used in this work are summarized in the Table 1. In the absence of Comorian wood samples, the parameters (thermo-physical and kinetic) used in this study were all taken from the literature. To discretize all equations obtained above, a global explicit scheme has been used using the finite differences method. Thus, the uni-reactional approach gives:
{ T i n + 1 = A 1 i n T i n + A 2 i n T i + 1 n + A 3 i n T i 1 n + A 4 i n ρ i n + 1 = ρ i n ( 1 A Δ texp ( E RT i n ) )
with:
A 1 i n = 1 2 κ ( Δ t Δ r 2 ) A 2 i n = κ Δ t ( 1 Δ r 2 + 1 2 r i Δ r ) A 3 i n = κ Δ t ( 1 Δ r 2 1 2 r i Δ r ) A 4 i n = κ Δ t ( Q λ ) ( ρ i n Aexp ( E RT i n ) ) κ = λ ρ C b
In the case of multi reactional approach, we have:
{ T i n + 1 = A 11 i n T i n + A 12 i n T i + 1 n + A 13 i n T i 1 n + A 14 i n ρ b i n + 1 = ρ b i n [ 1 Δ t ( A 1 exp ( E 1 RT i n ) + A 2 exp ( E 2 RT i n ) ) ] ρ c i n + 1 = ρ c i n + ρ b i n A 1 Δ texp ( E 1 RT i n ) ρ g i n + 1 = ρ g i n + ρ b i n A 2 Δ texp ( E 2 RT i n ) ρ l i n + 1 = ρ l i n ( 1 A 3 Δ texp ( E 3 RT i n ) ) ρ v i n + 1 = ρ v i n + ρ l i n A 3 Δ texp ( E 3 RT i n )
with:
A 11 i n = 2 ( ρ b i n C b + ρ c i n C c + ρ l i n C l ) ( ρ b i n + 1 C b + ρ c i n + 1 C c + ρ l i n + 1 C l ) 2 λ ( Δ t Δ r 2 ) ρ b i n C b + ρ c i n C c + ρ l i n C l A 12 i n = λ Δ t ( 1 Δ r 2 + 1 2 r i Δ r ) ρ b i n C b + ρ c i n C c + ρ l i n C l A 13 i n = λ Δ t ( 1 Δ r 2 1 2 r i Δ r ) ρ b i n C b + ρ c i n C c + ρ l i n C l A 14 i n = Q r i n Δ t ρ b i n C b + ρ c i n C c + ρ l i n C l
To have moisture content in the position i, we have:
H i n + 1 = B 11 i n H i n + B 12 i n H i + 1 n + B 13 i n H i 1 n
with:
B 11 i n = 1 2 D h ( Δ t Δ r 2 ) B 12 i n = D h Δ t ( 1 Δ r 2 + 1 2 r i Δ r ) B 13 i n = D h Δ t ( 1 Δ r 2 1 2 r i Δ r )
Equations given as boundary conditions have also been discretized. At the axis level (r = 0), we have:
Case of uni-reactional approach:
T 1 n = T 1 n
i = 1 , is a fictive position with a fictive temperature T 1 n located at the left of the axis. Using Equation (21) with i = 0, we have:
T 0 n + 1 = B 1 0 n T 0 n + B 2 0 n T 1 n + B 3 0 n
where:
B 1 0 n = 1 2 κ ( Δ t Δ r 2 ) B 2 0 n = 2 κ ( Δ t Δ r 2 ) B 3 0 n = κ Δ t ( Q λ ) ( ρ 0 n Aexp ( E RT 0 n ) )
For the exterior surface (r = R for i = m), we have:
T m + 1 n T m 1 n = 2 Δ r λ ( h c ( T f T m n ) + ε σ ( T f 4 T m n 4 ) ) = f ( T m n )
i = m + 1 , is a fictitious node at the fictitious temperature T m + 1 n located at the right of the radial axis. Replacing the expression for T m + 1 n in the equation (Equation (21)), for   i = m , we obtain:
T m n = C 1 m n T m n + C 2 m n T m 1 n + C 3 m n
with:
C 1 m n = 1 2 κ ( Δ t Δ r 2 ) C 2 m n = 2 κ ( Δ t Δ r 2 ) C 3 m n = κ Δ t λ ( Q ρ m n Aexp ( E RT m n ) ) + κ Δ t ( 1 Δ r 2 + 1 2 r m Δ r ) f ( T m n )
In the case of multi reactional approach, boundary equations are given by:
Humidity:
H 0 n + 1 = C 11 0 n H 0 n + C 12 0 n H 1 n
H m n = D 11 m n H m 1 n + D 12 m n H m 1 n + D 13 m n
with:
C 11 0 n = 1 2 D h ( Δ t Δ r 2 ) C 12 0 n = 2 D h ( Δ t Δ r 2 ) D 11 m n = 1 2 D h Δ t [ 1 Δ r 2 + h m D h ( 1 Δ r + 1 2 r m ) ] D 12 m n = 2 D h ( Δ t Δ r 2 ) D 13 m n = 2 h m Δ t ( 1 Δ r + 1 2 r m ) χ eq m n
Temperature:
T 0 n + 1 = E 11 0 n T 0 n + E 12 0 n T 1 n + E 13 0 n
T m n + 1 = F 11 m n T m n + F 12 i n T i 1 n + F 13 i n
with:
E 11 0 n = 2 ( ρ b 0 n C b + ρ c 0 n C c + ρ l 0 n C l ) ( ρ b 0 n + 1 C b + ρ c 0 n + 1 C c + ρ l 0 n + 1 C l ) 2 λ ( Δ t Δ r 2 ) ρ b 0 n C b + ρ c 0 n C c + ρ l 0 n C l E 12 0 n = 2 λ ( Δ t Δ r 2 ) ρ b 0 n C b + ρ c 0 n C c + ρ l 0 n C l E 13 0 n = Q r 0 n Δ t ρ b 0 n C b + ρ c 0 n C c + ρ l 0 n C l F 11 m n = 2 ( ρ b m n C b + ρ c m n C c + ρ l m n C l ) ( ρ b m n + 1 C b + ρ c m n + 1 C c + ρ l m n + 1 C l ) 2 λ ( Δ t Δ r 2 ) ρ b m n C b + ρ c m n C c + ρ l m n C l F 12 m n = 2 λ ( Δ t Δ r 2 ) ρ b m n C b + ρ c m n C c + ρ l m n C l F 13 i n = Q r m n Δ t + λ Δ t ( 1 Δ r 2 + 1 2 r m Δ r ) f ( T m n ) ρ b m n C b + ρ c m n C c + ρ l m n C l

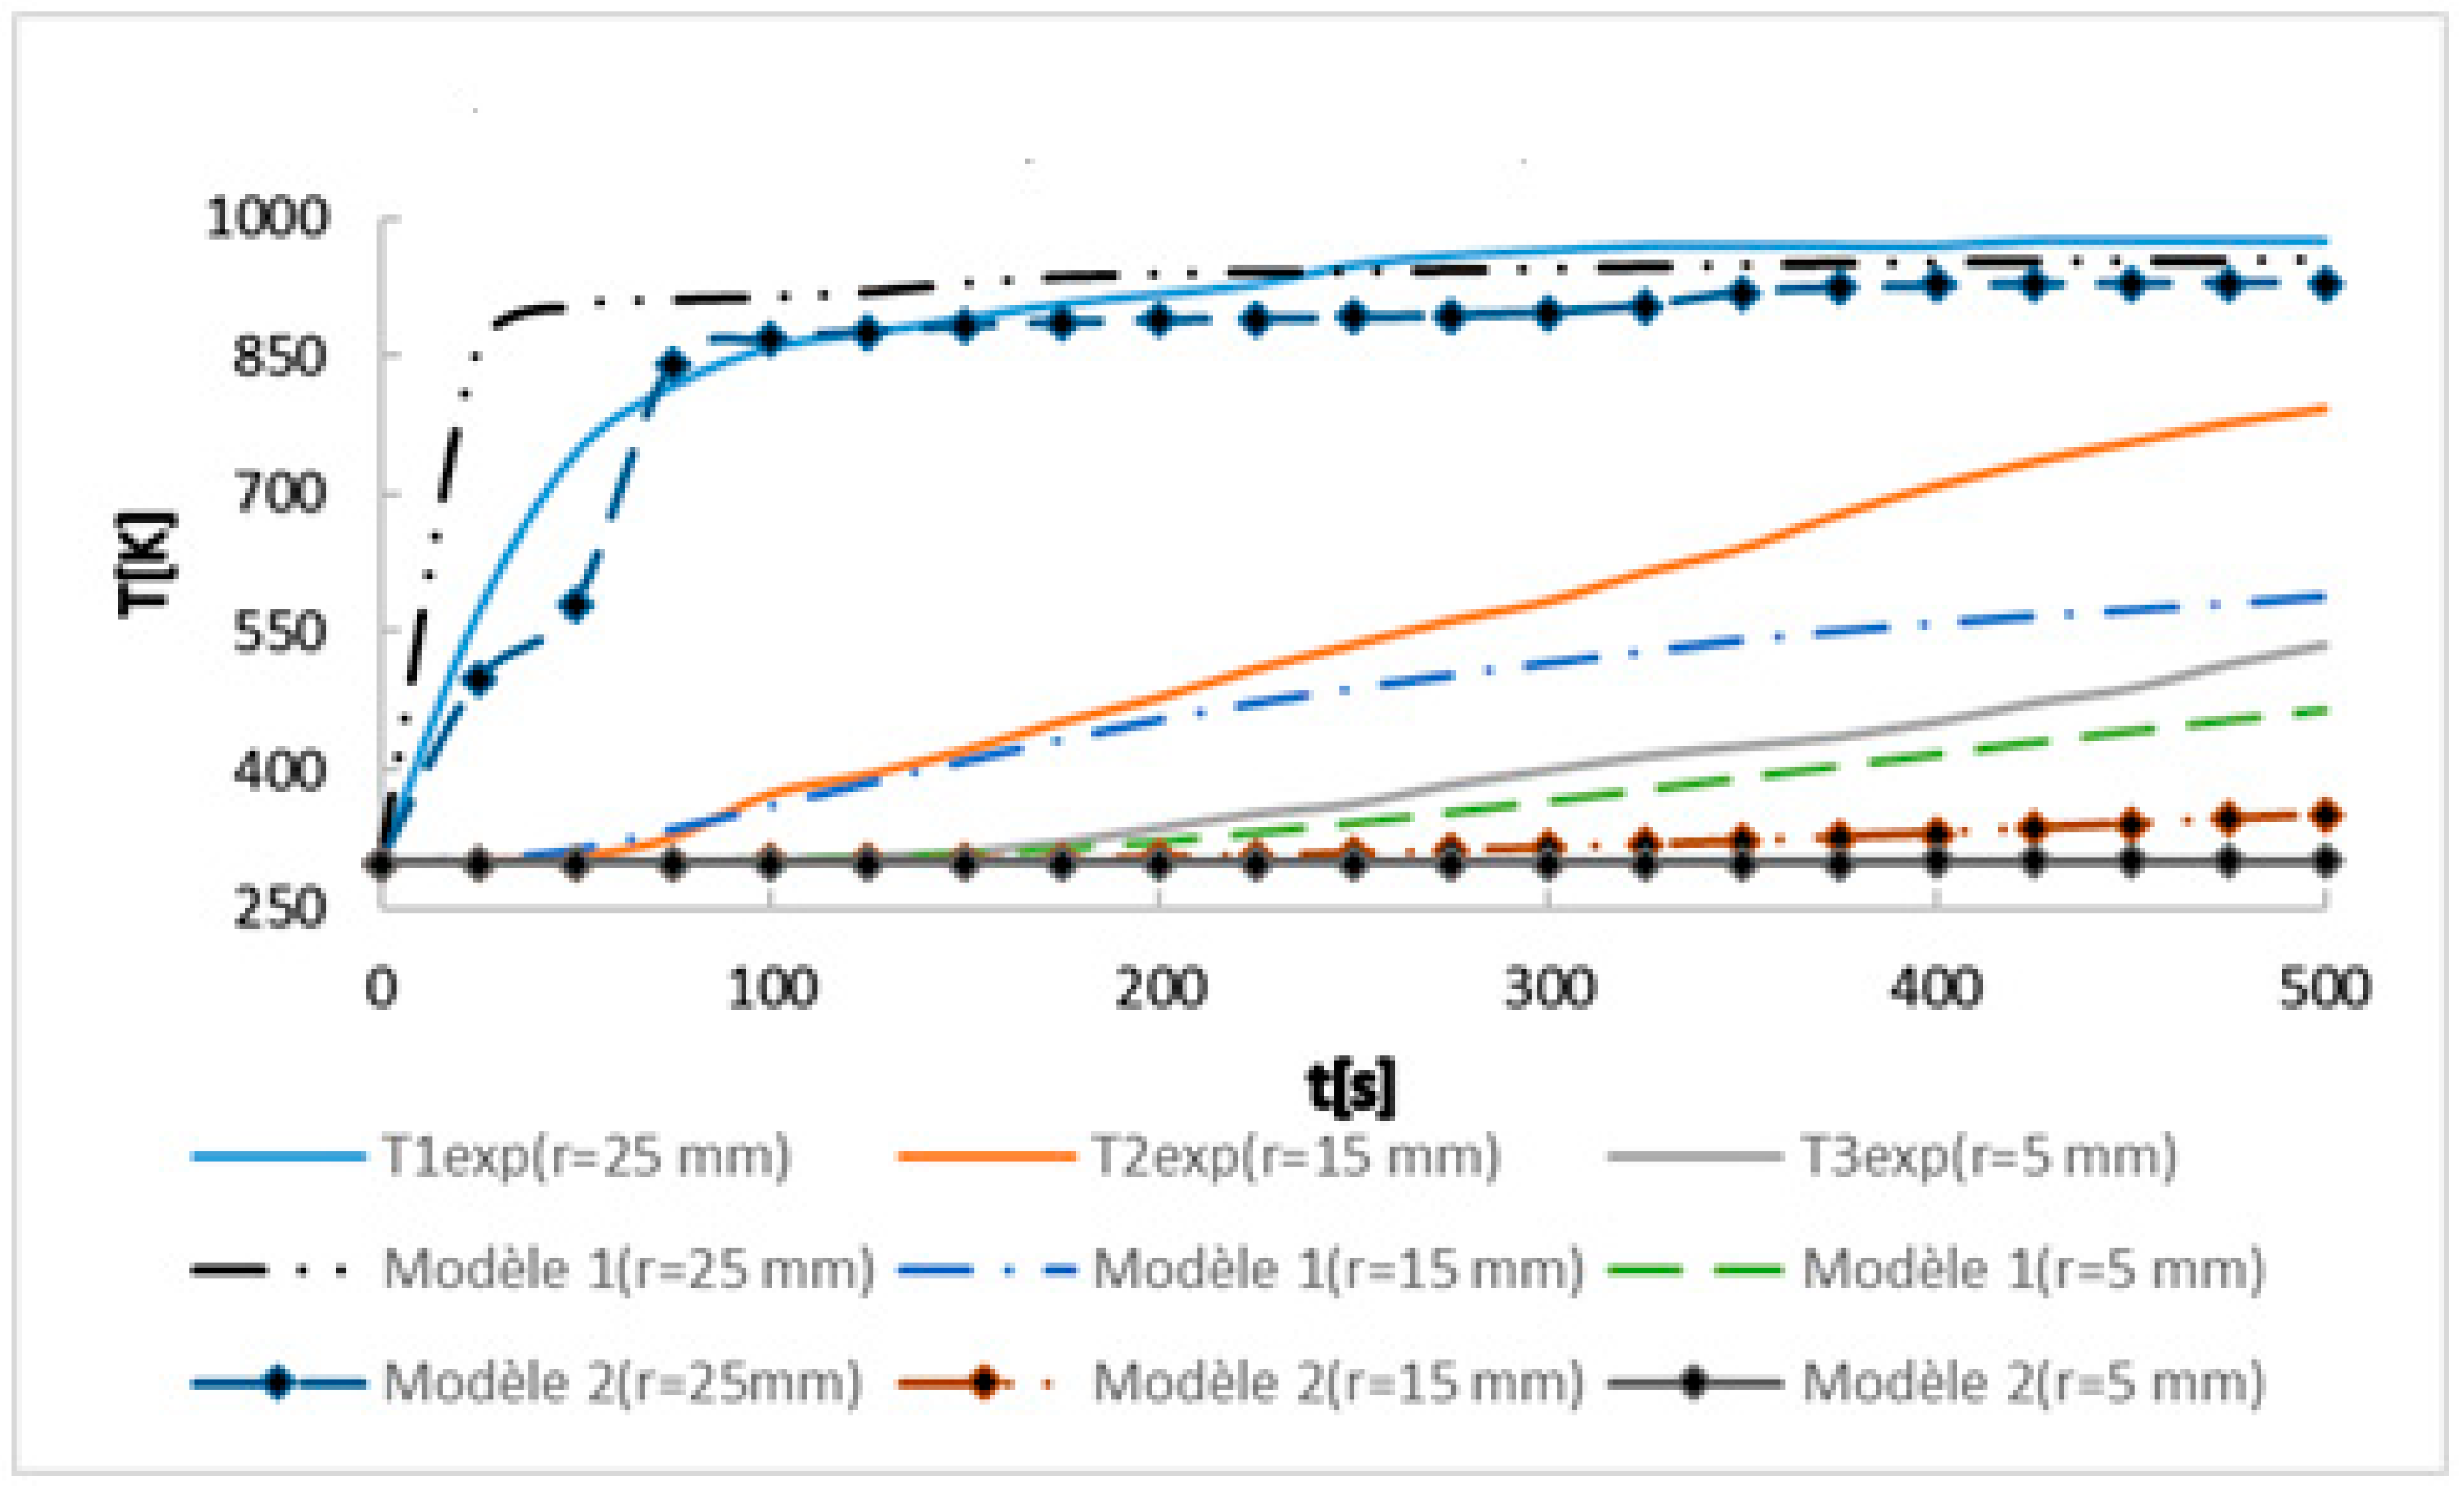
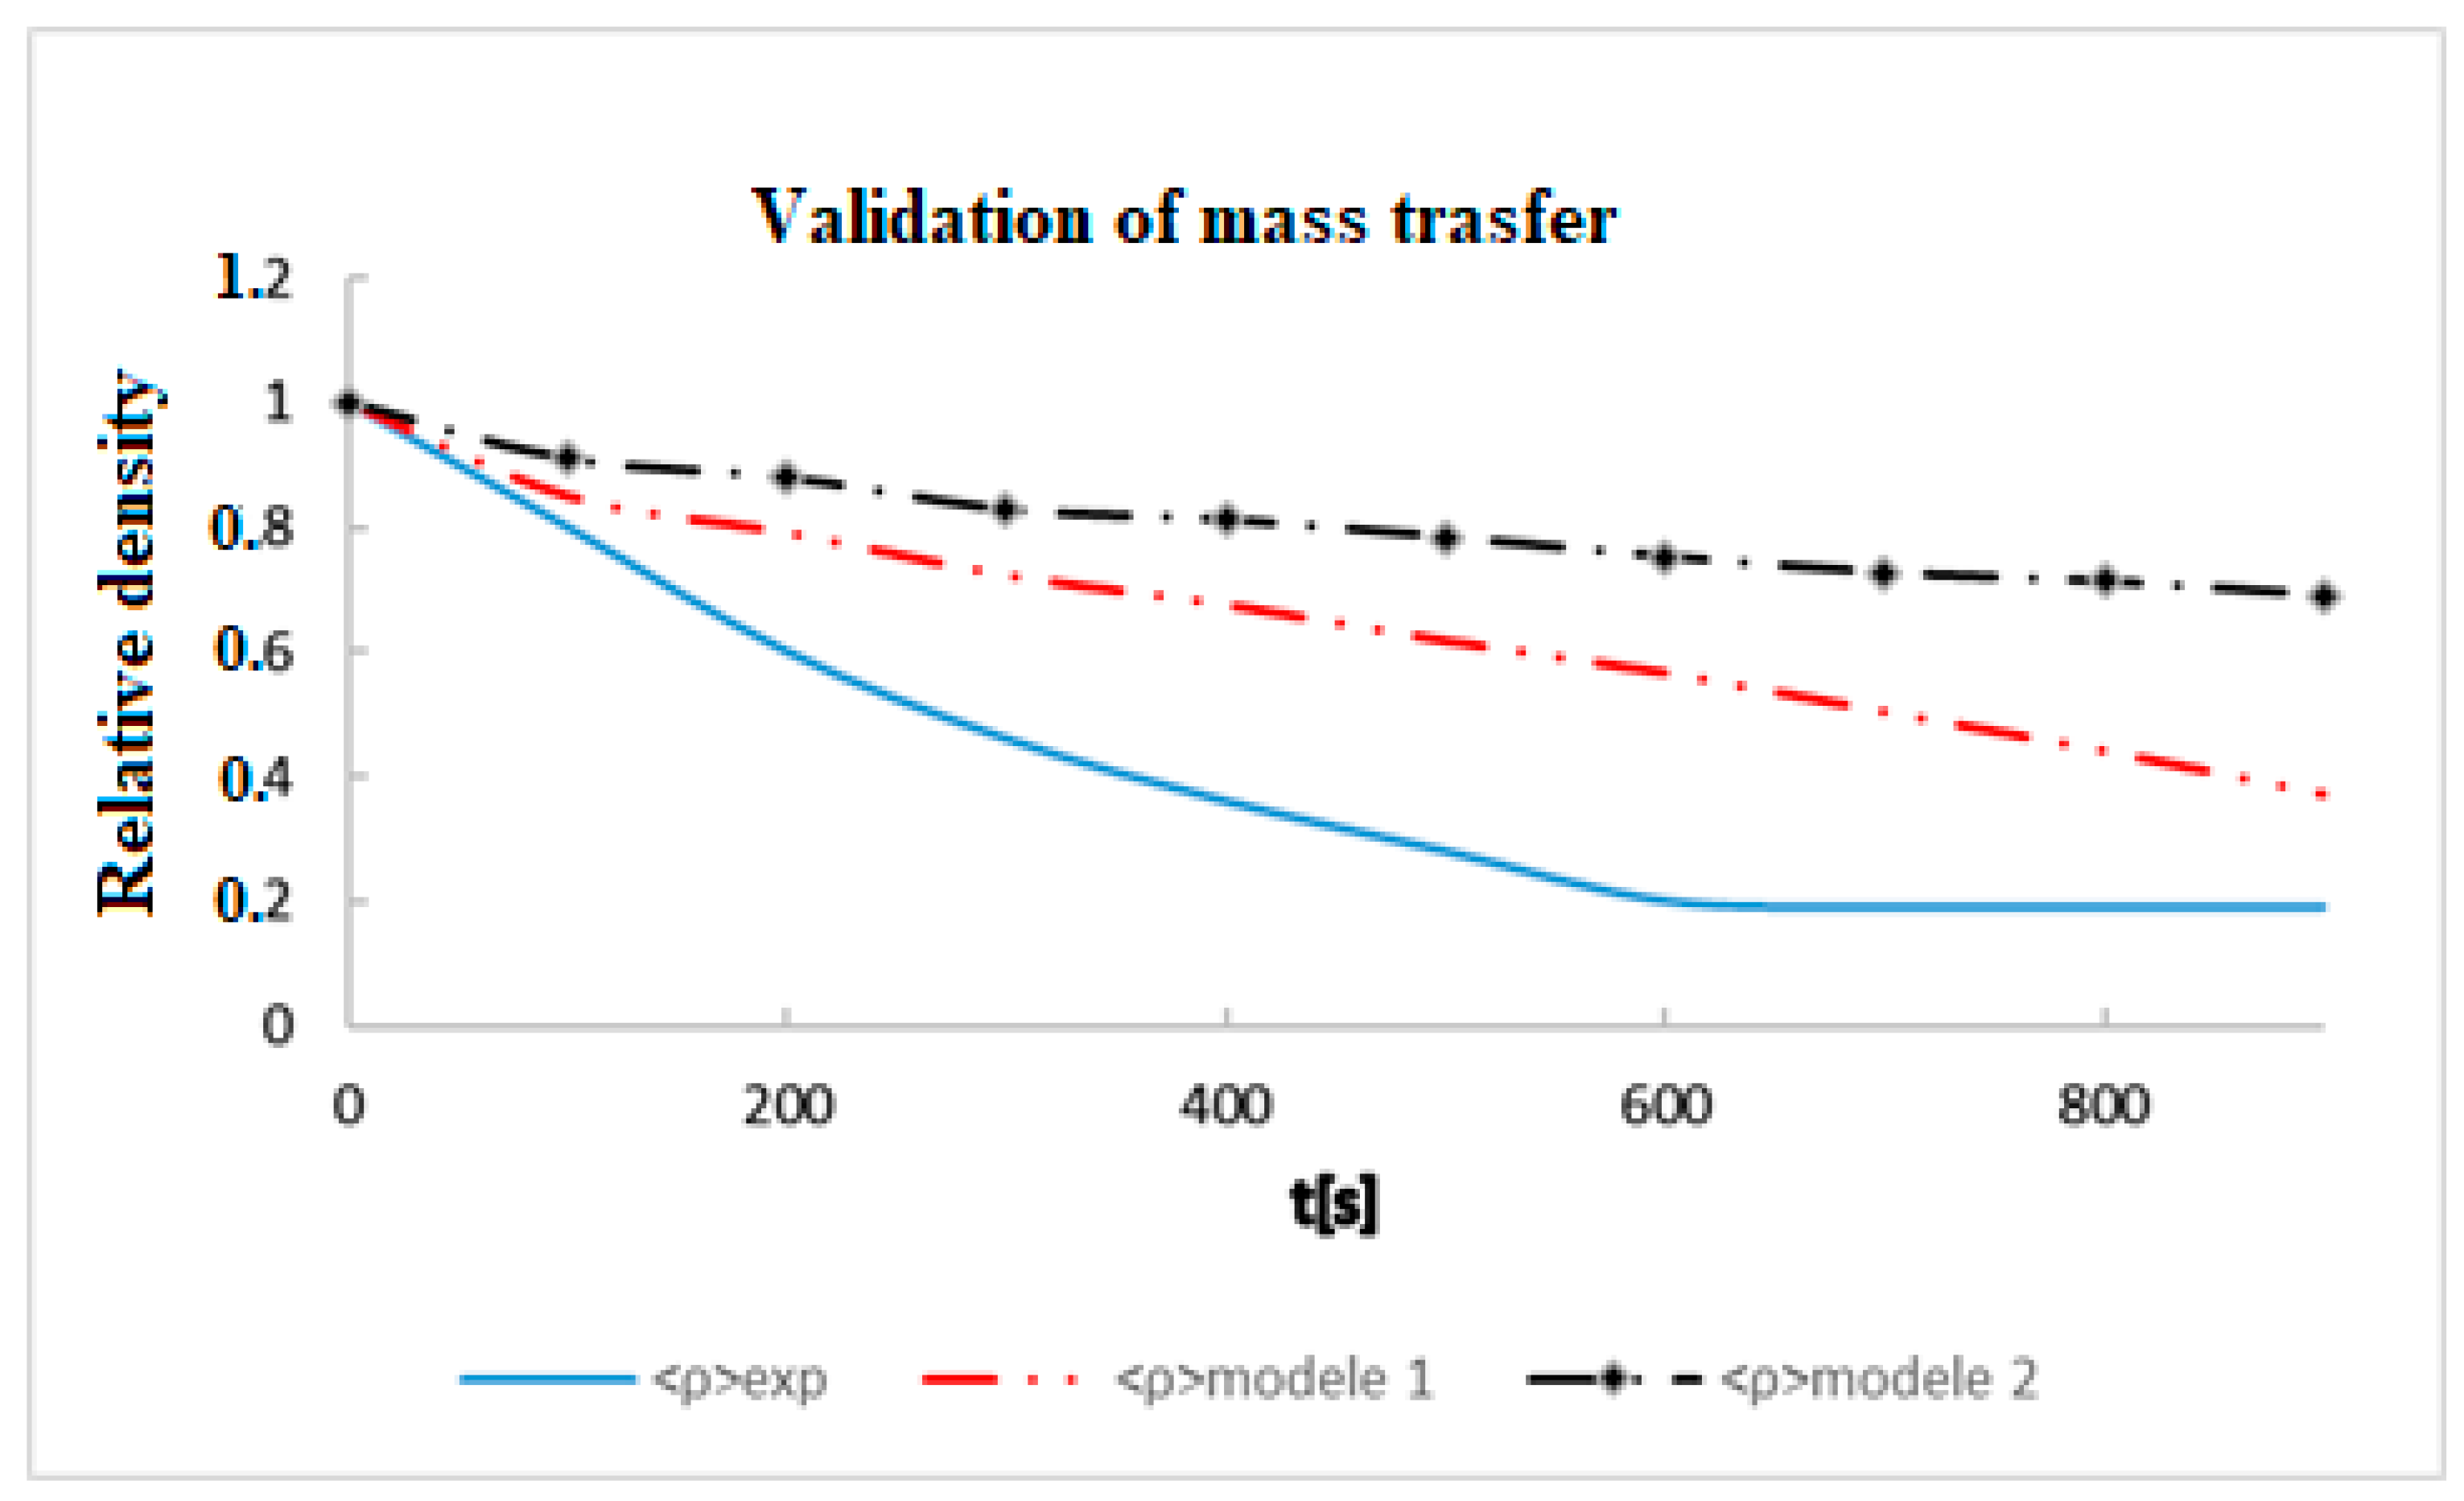
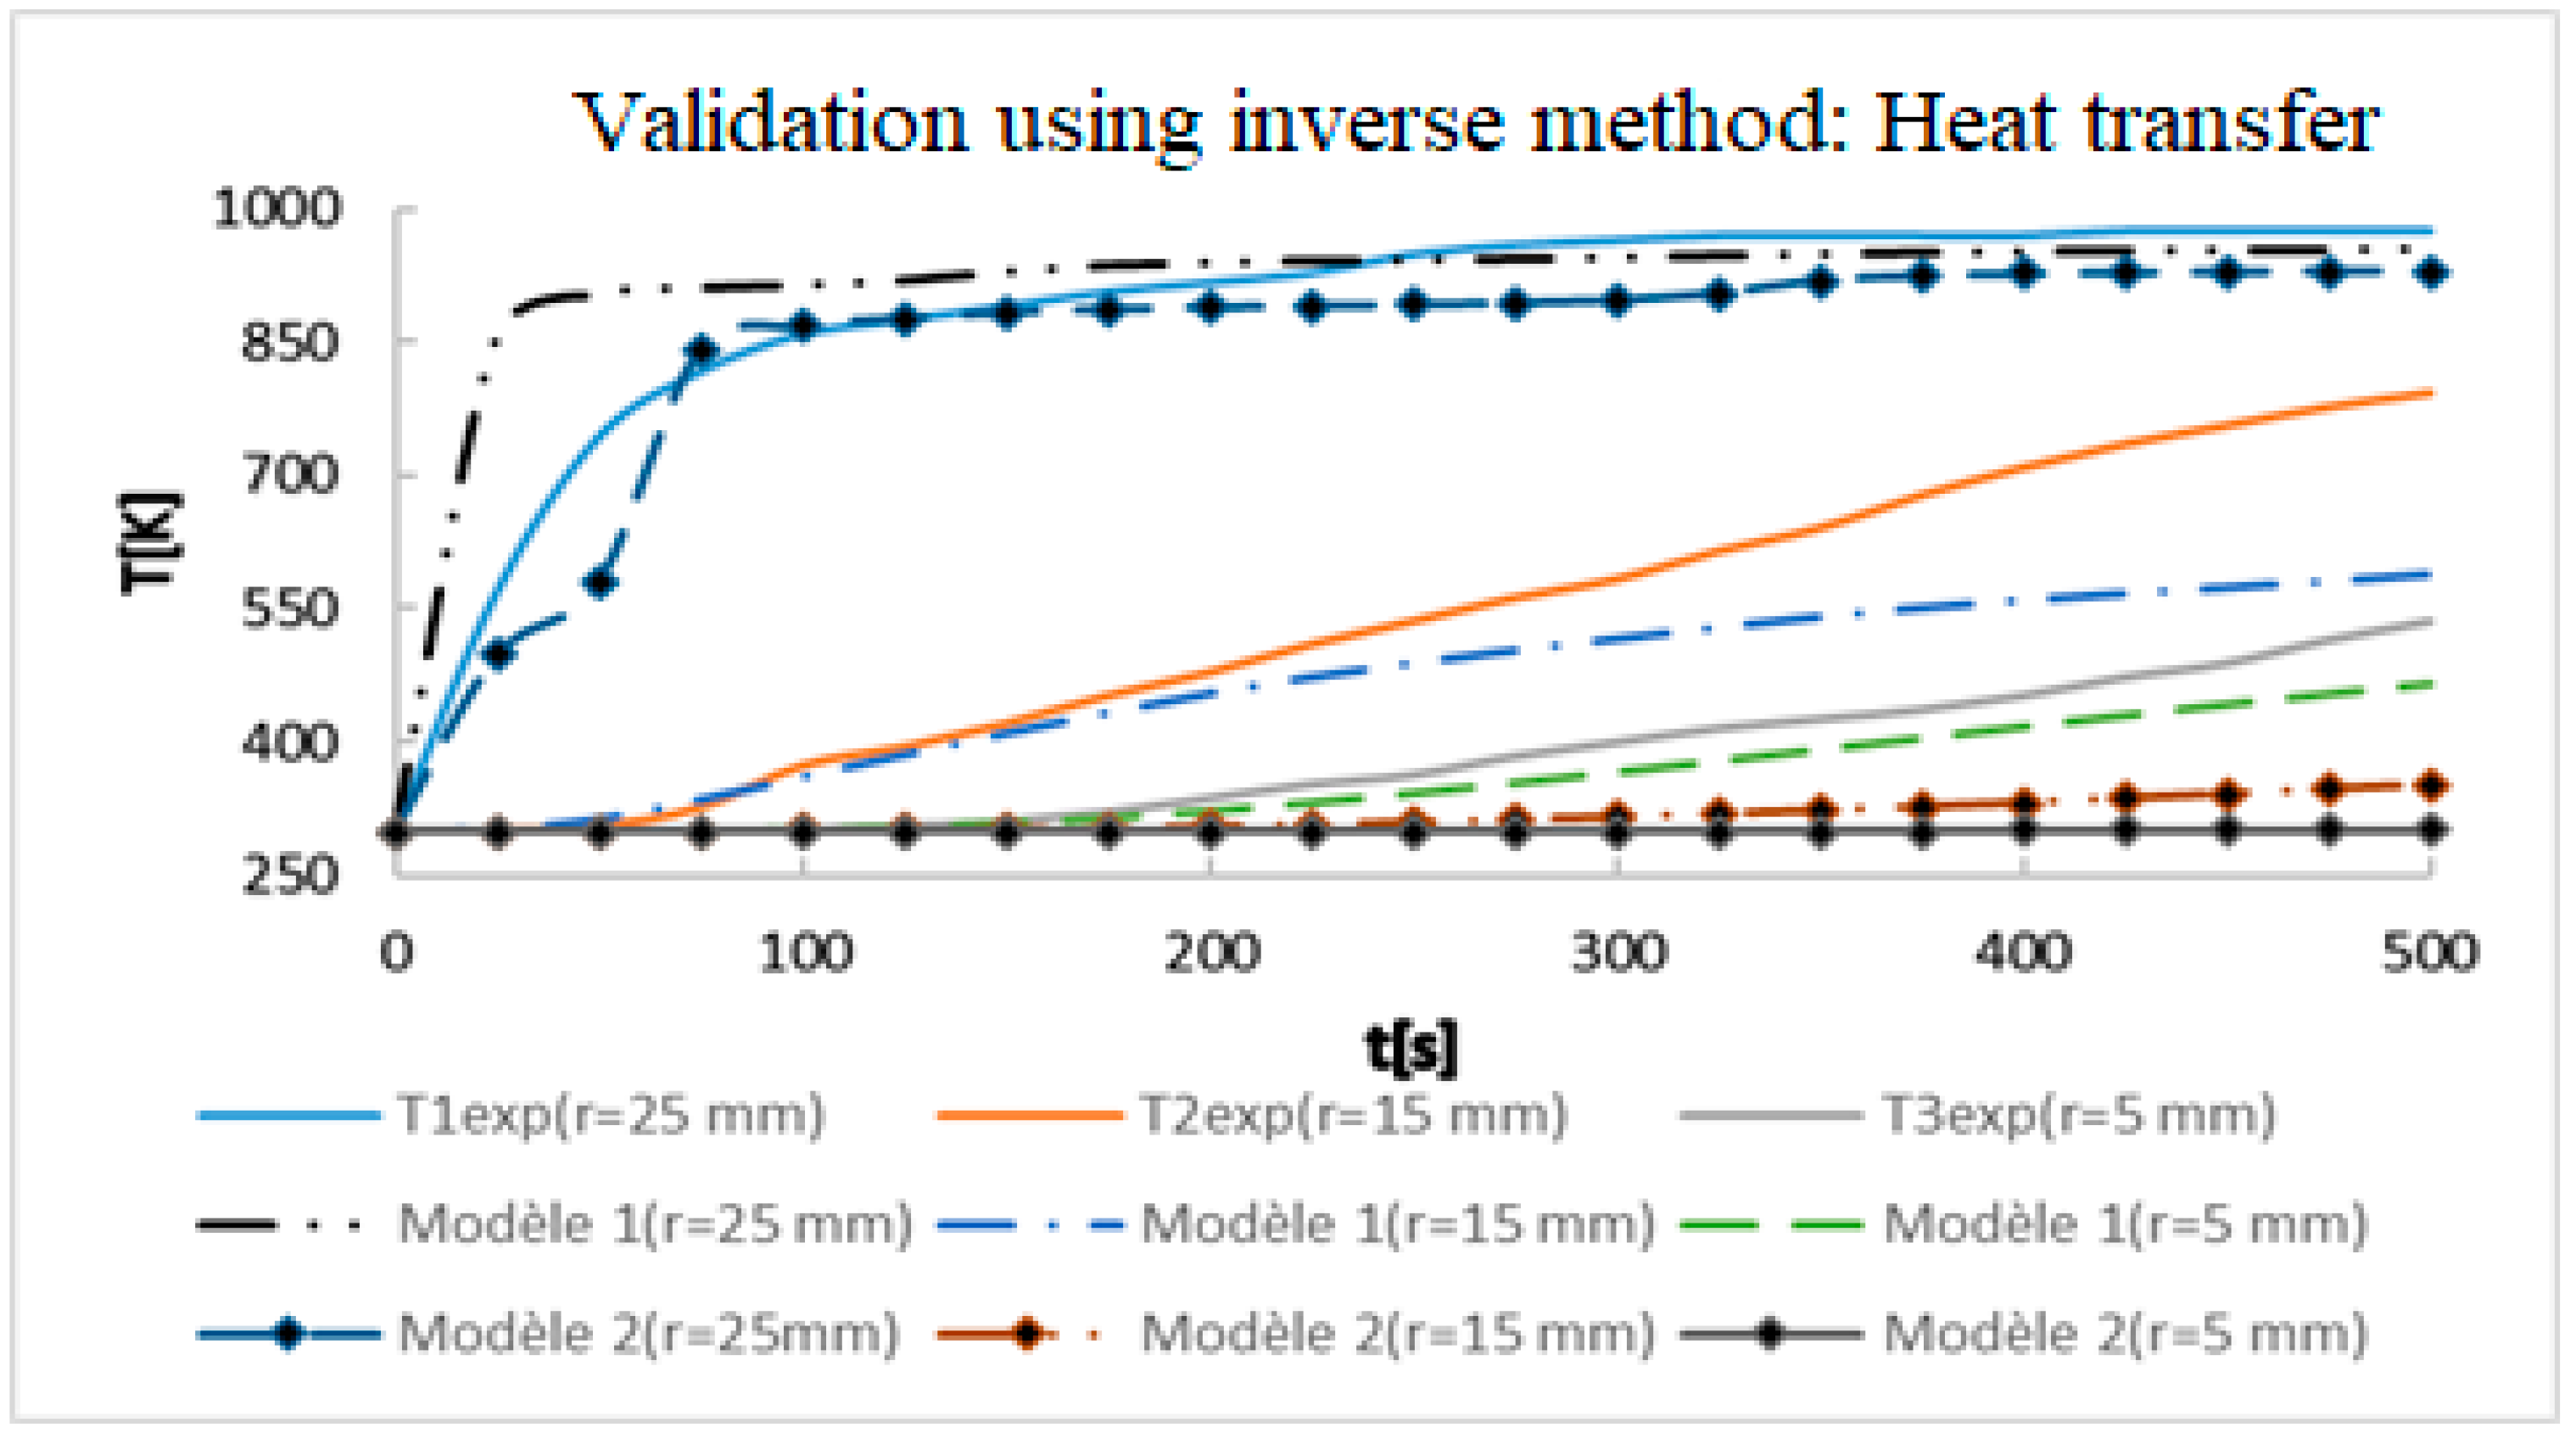
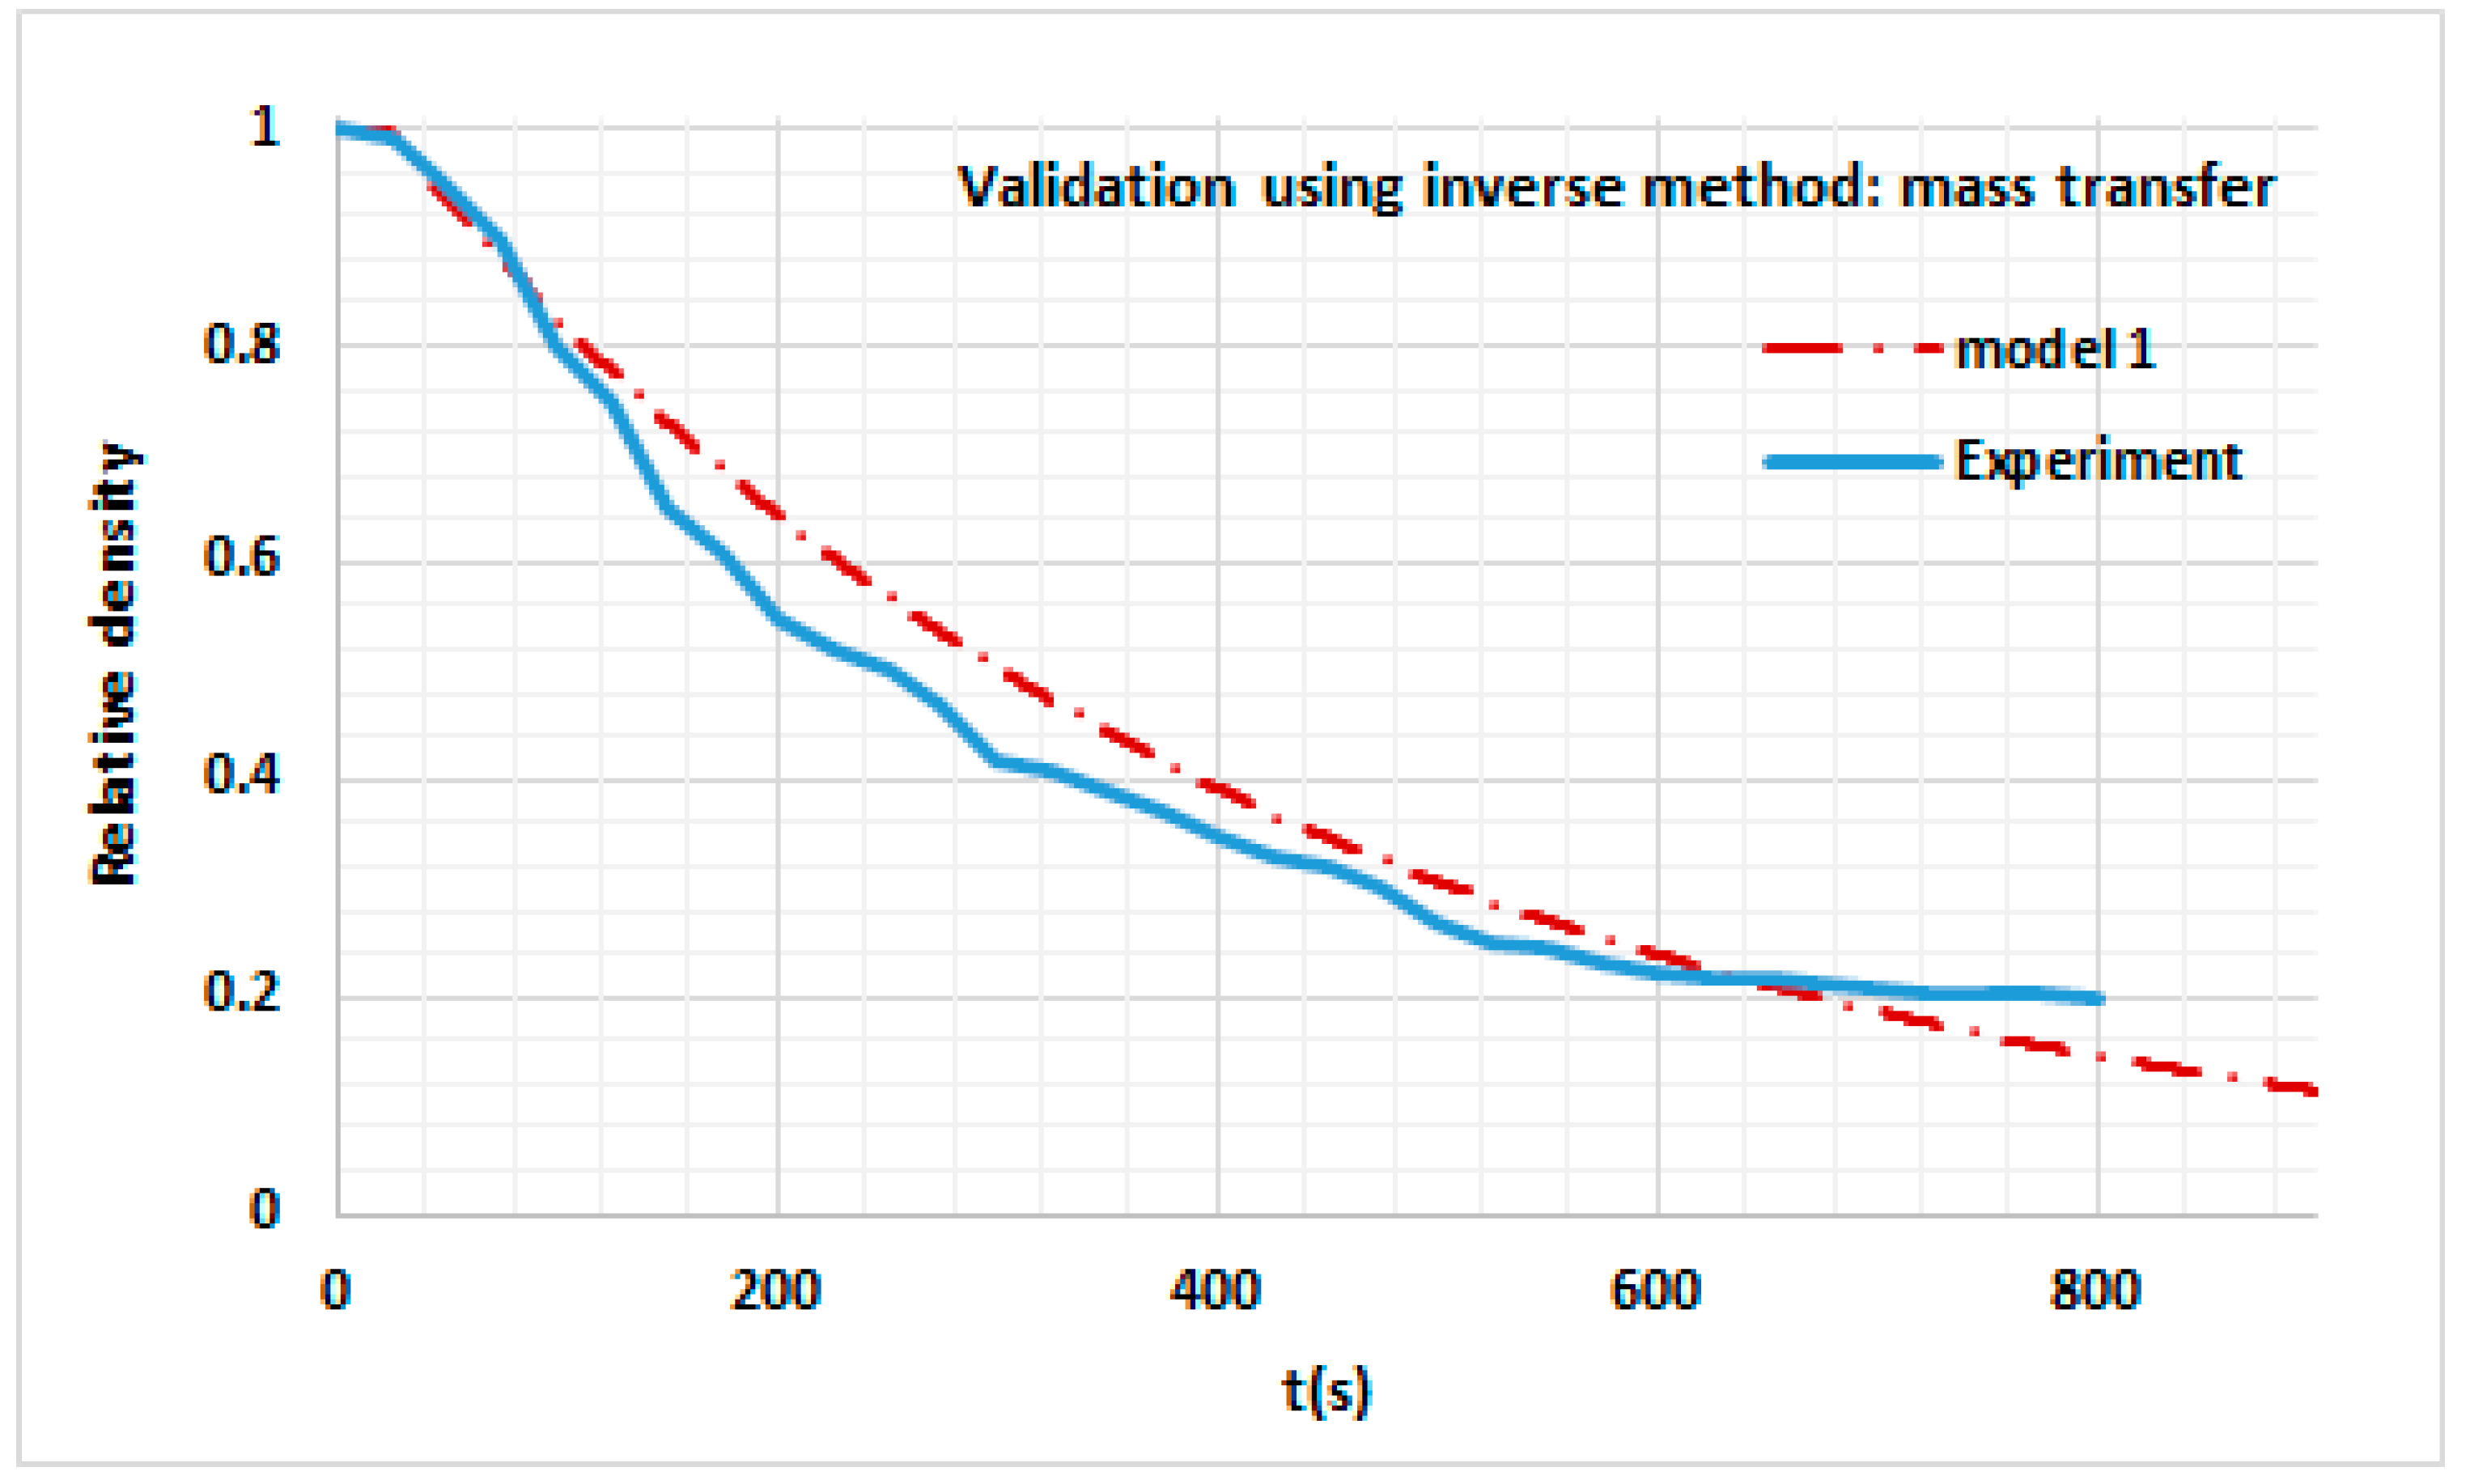
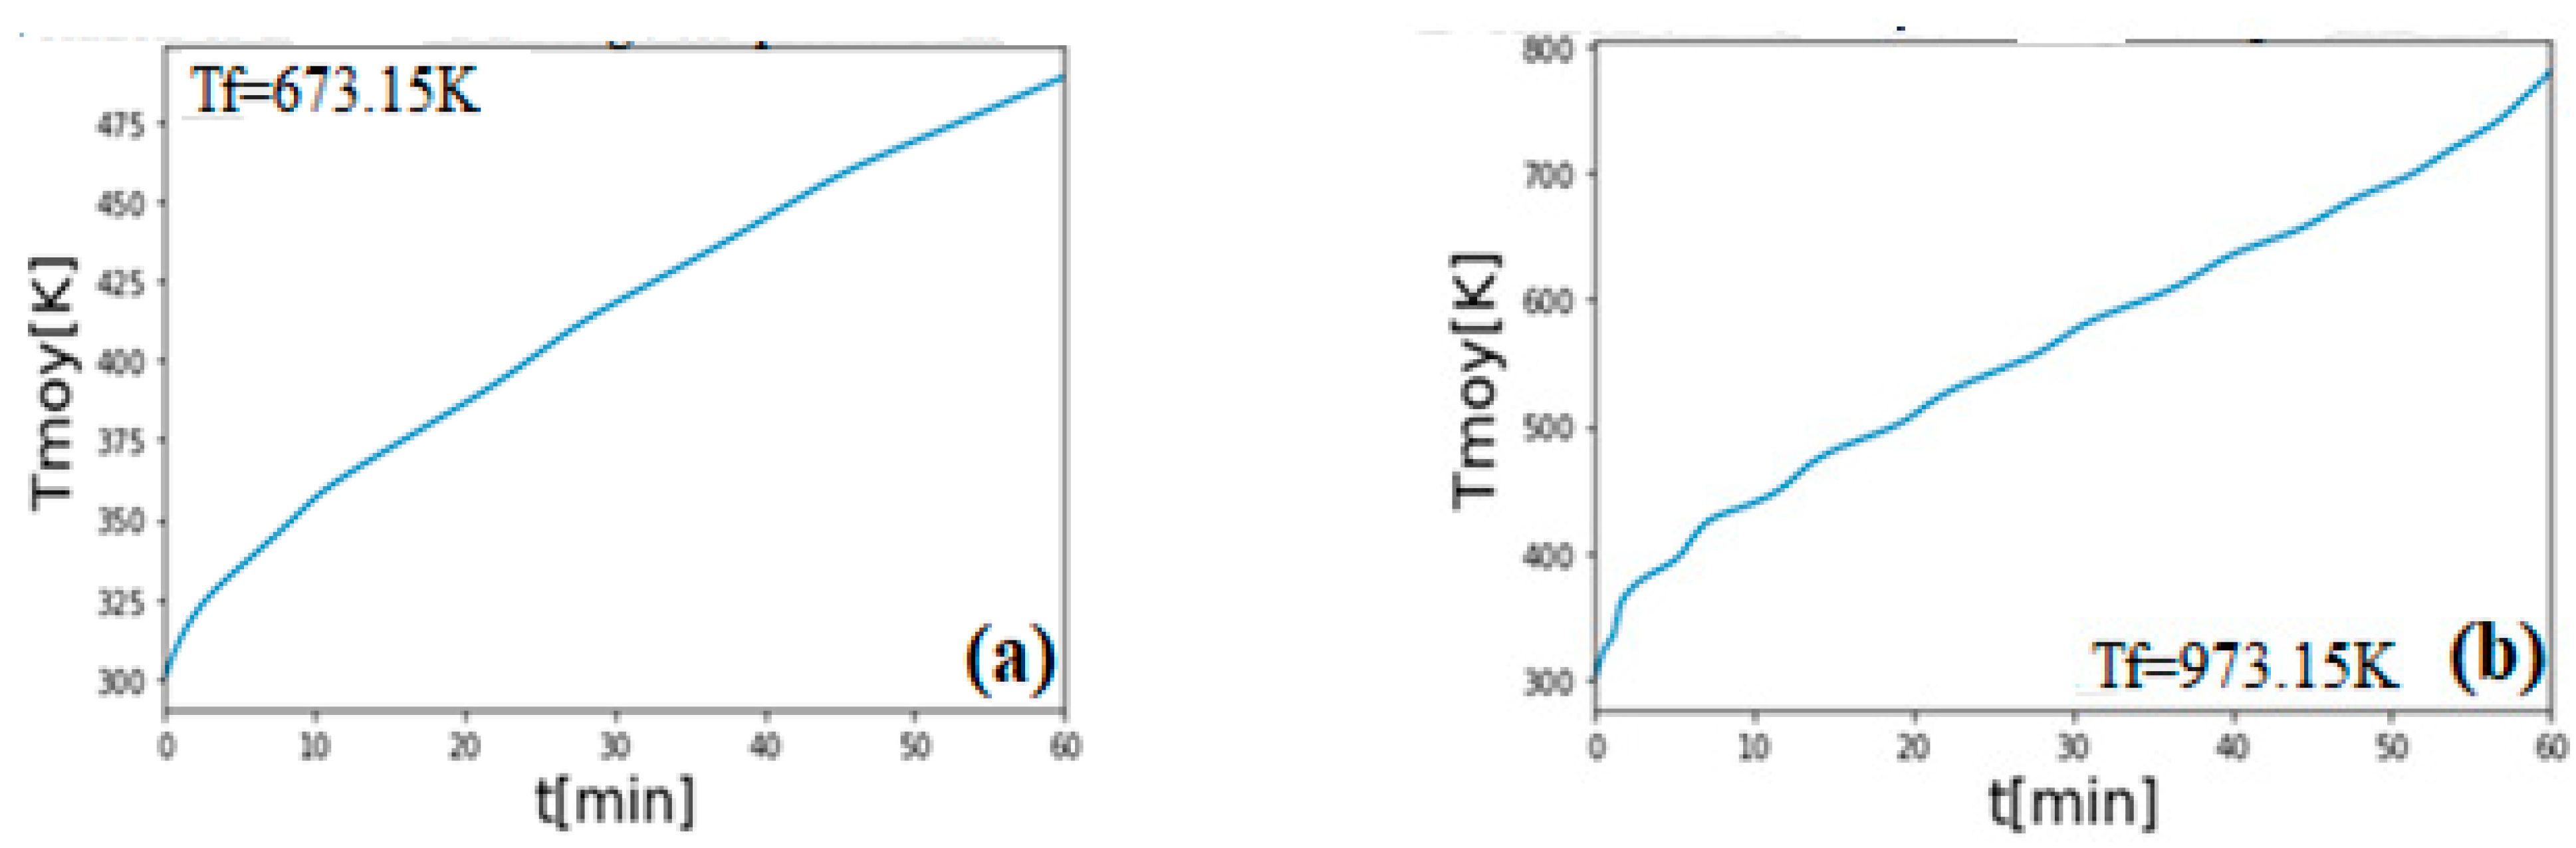
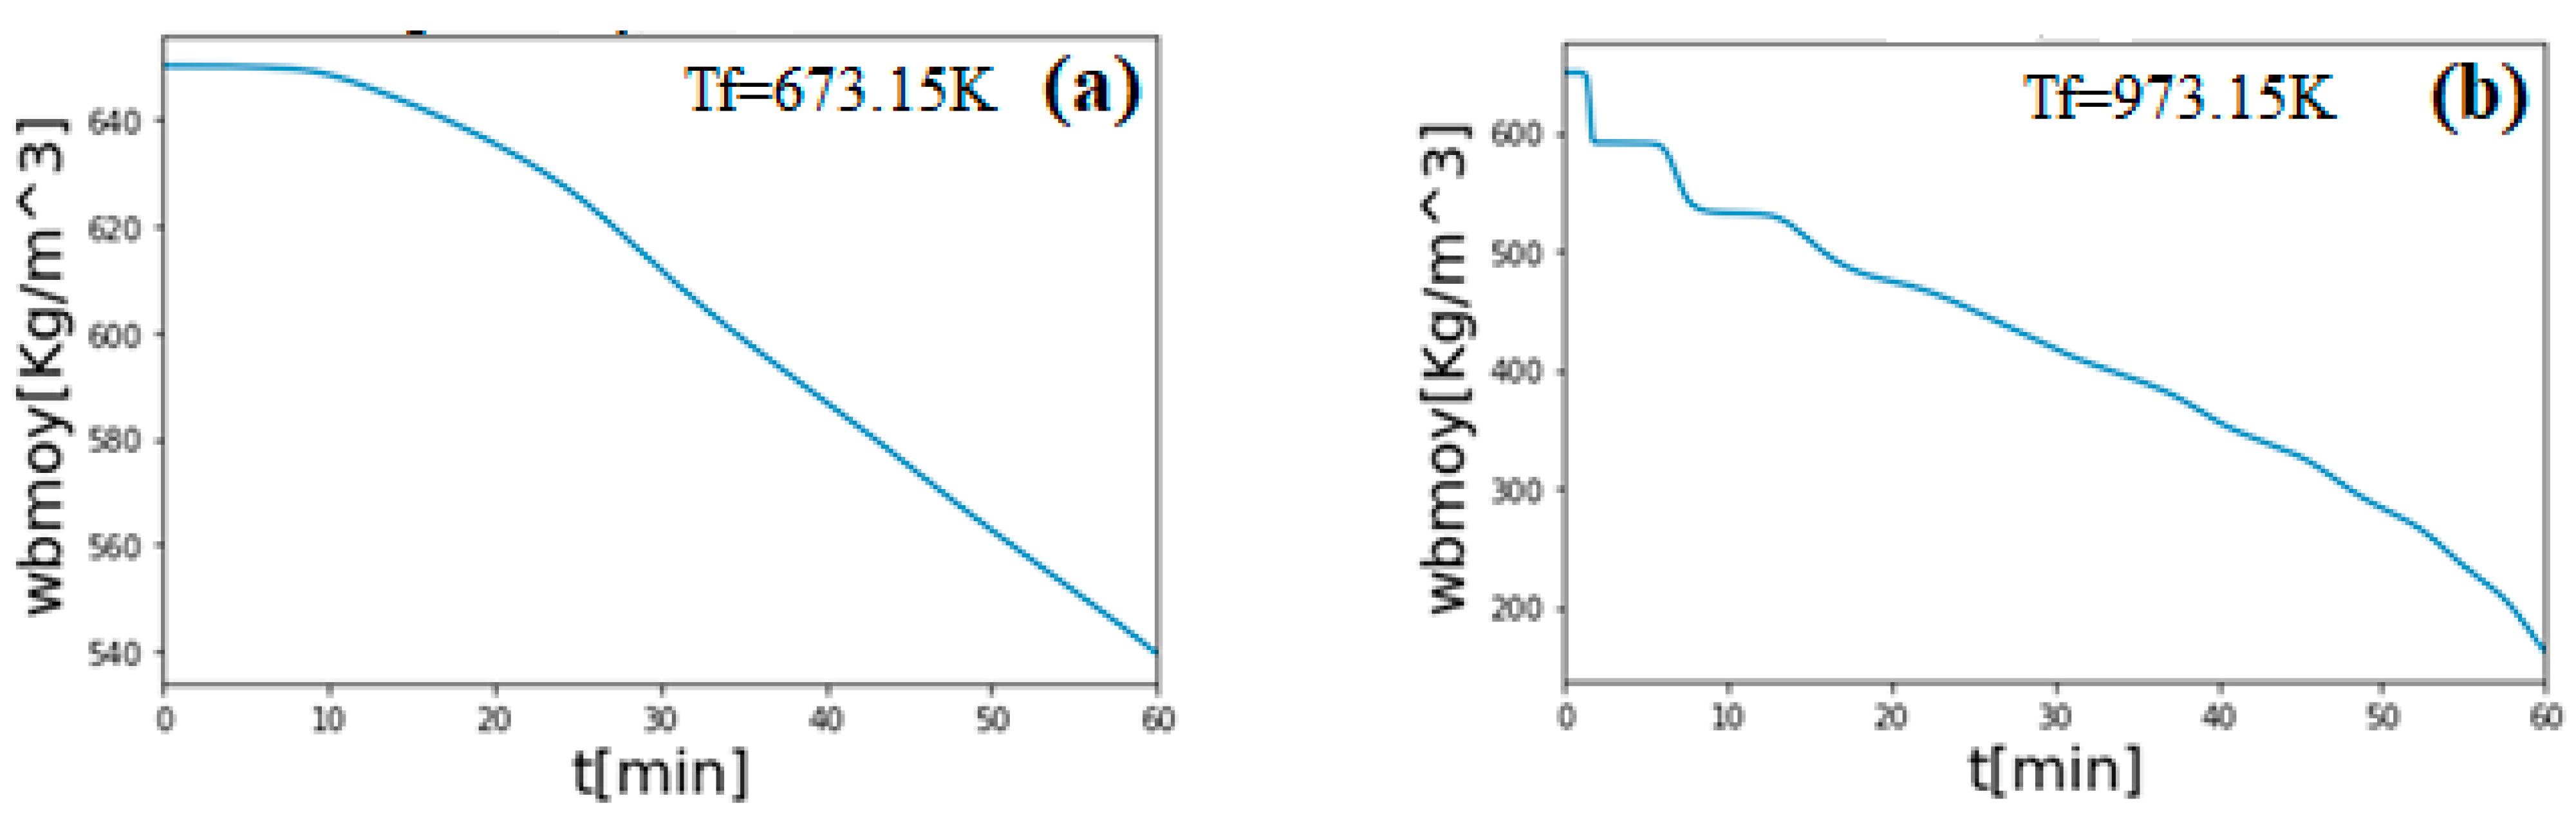
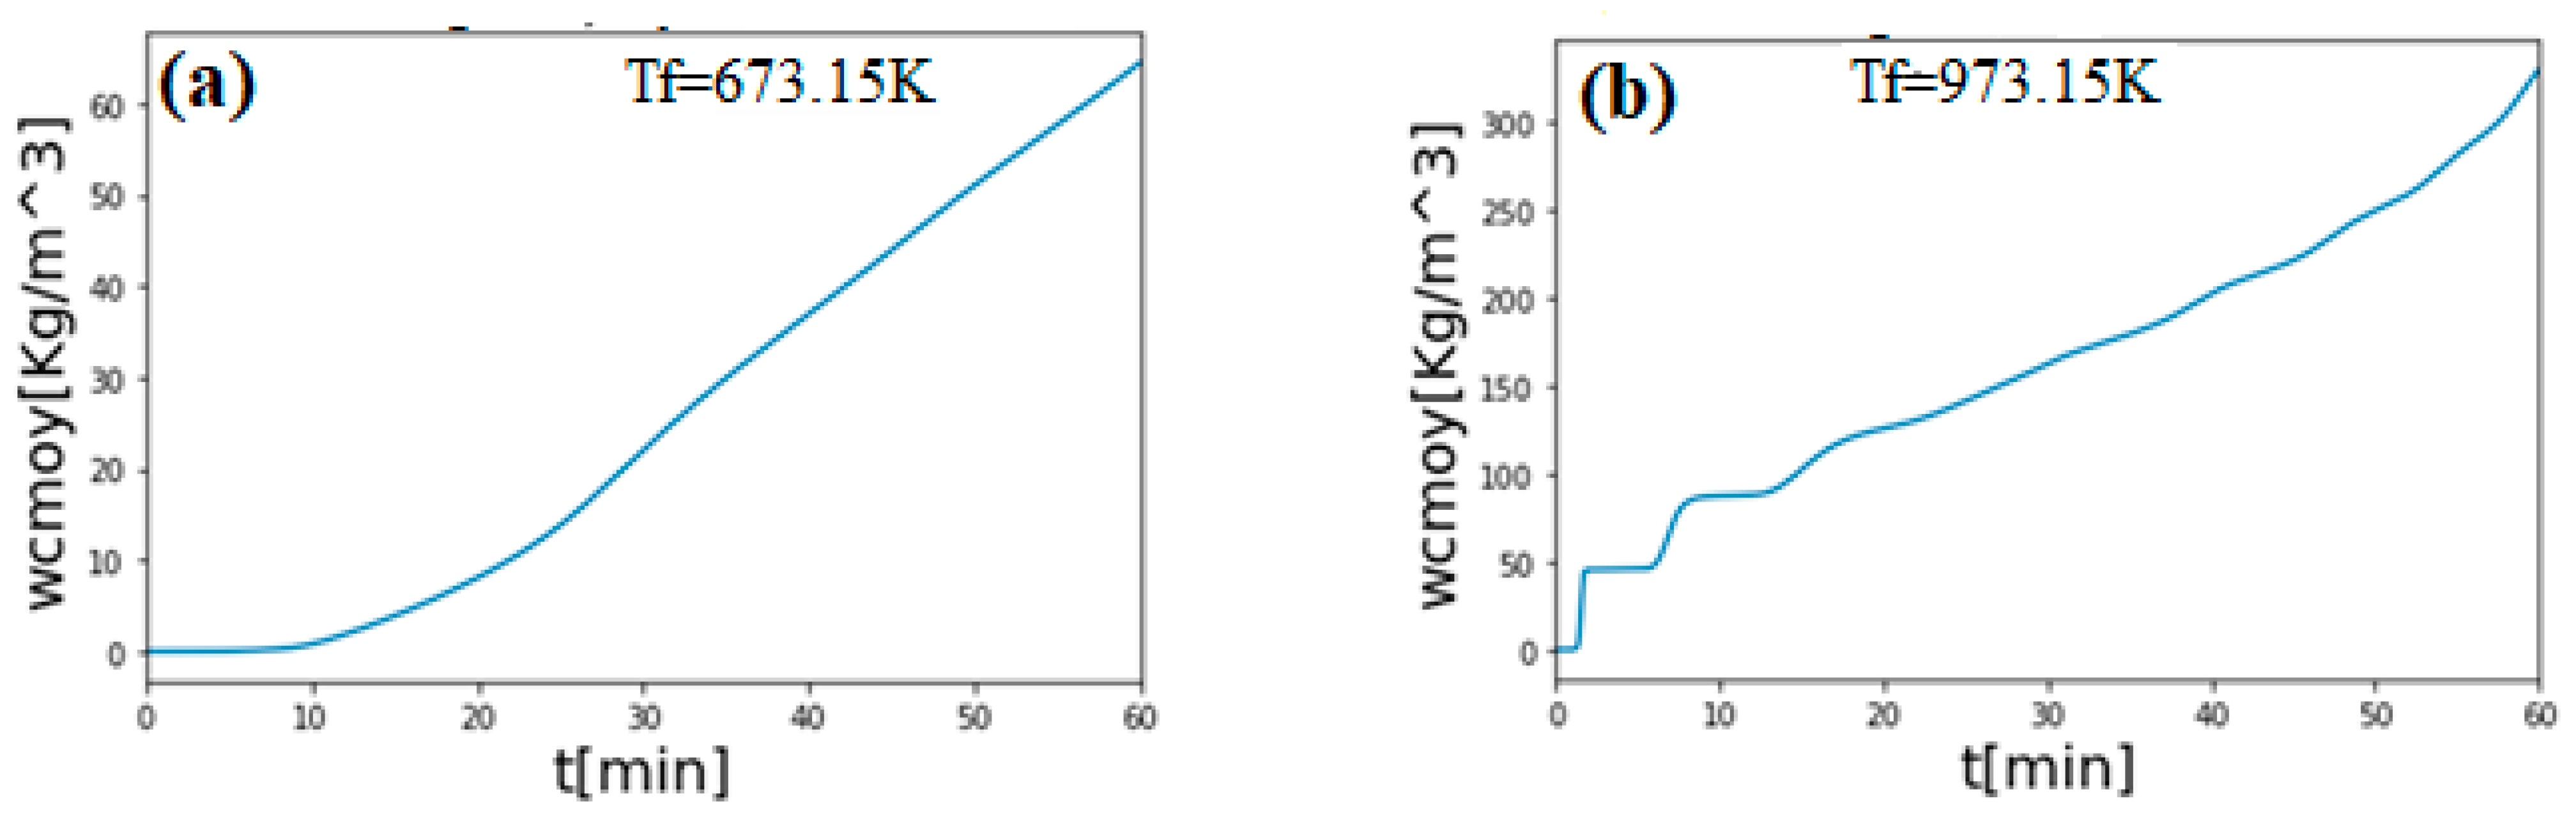
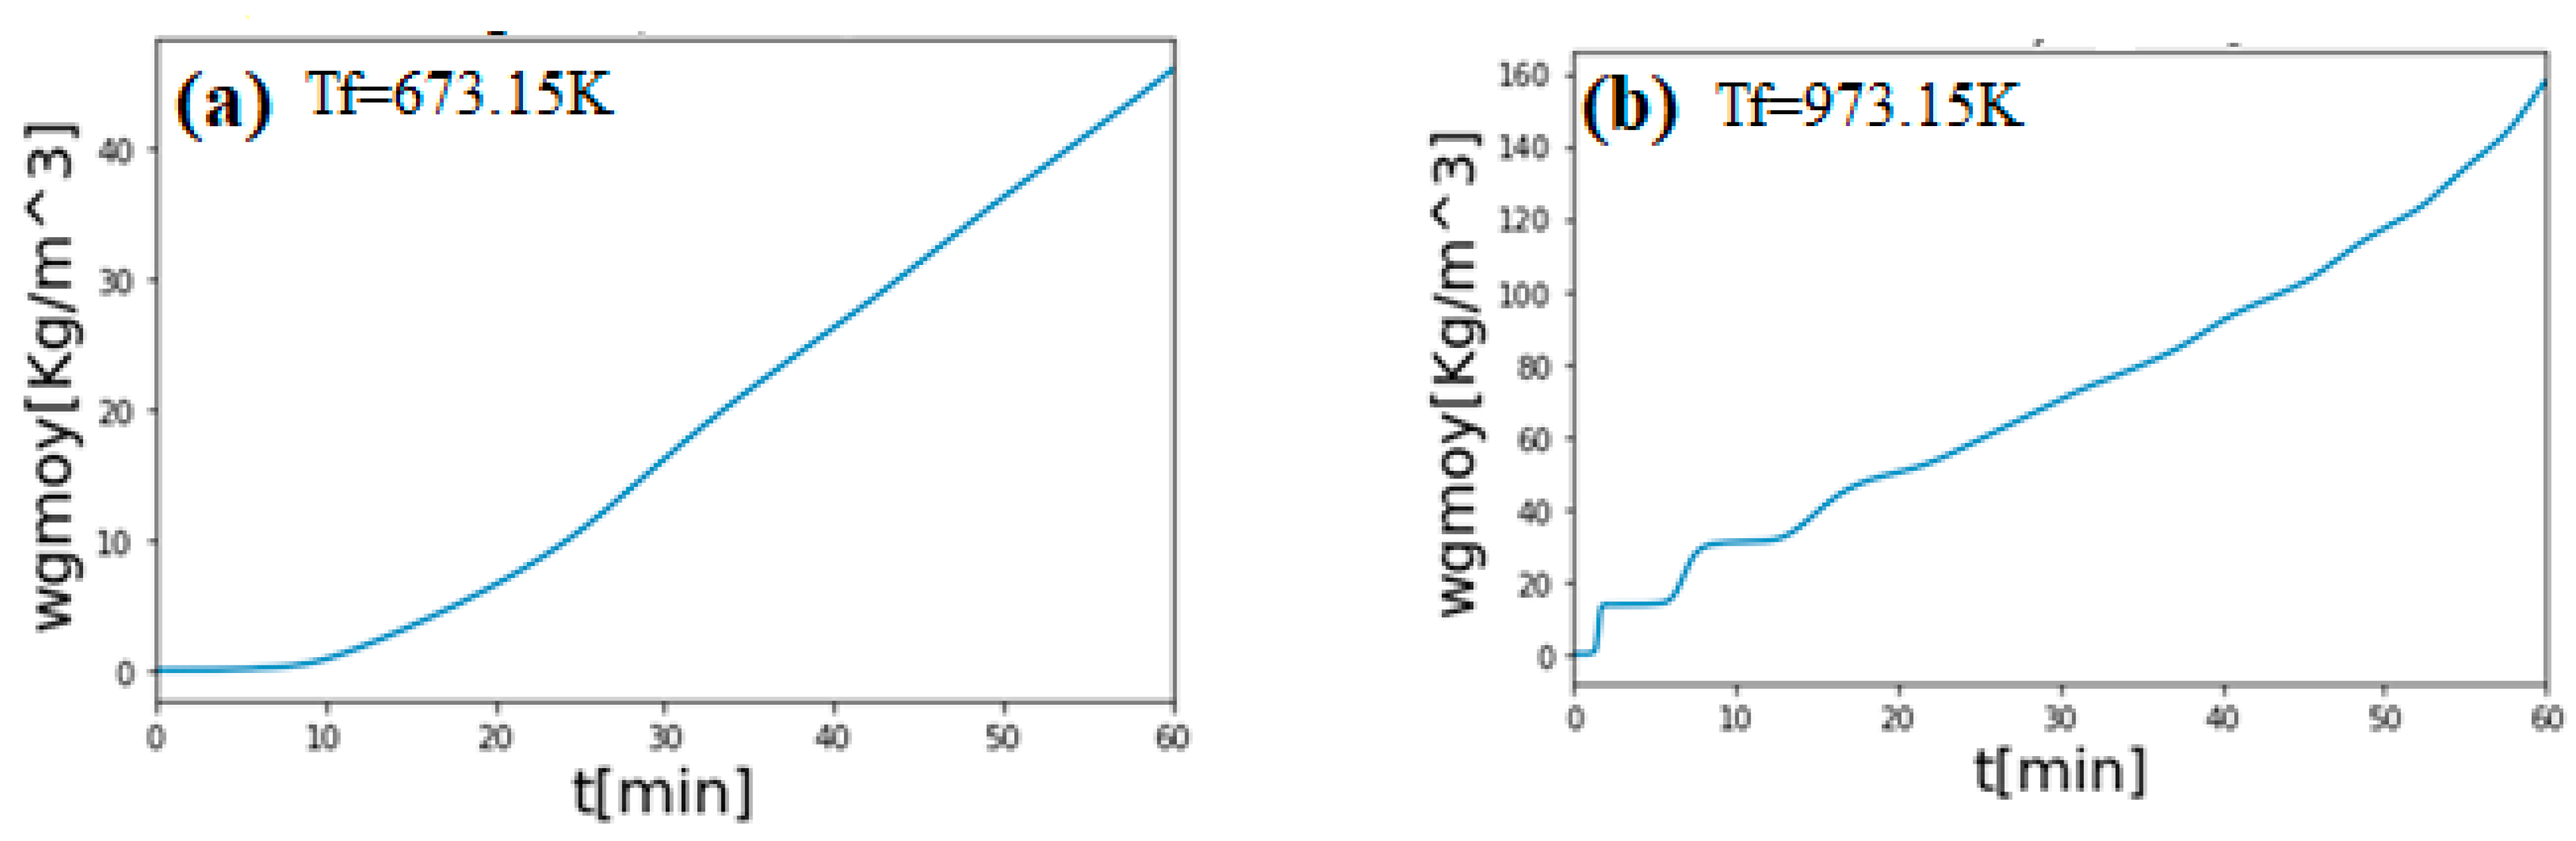
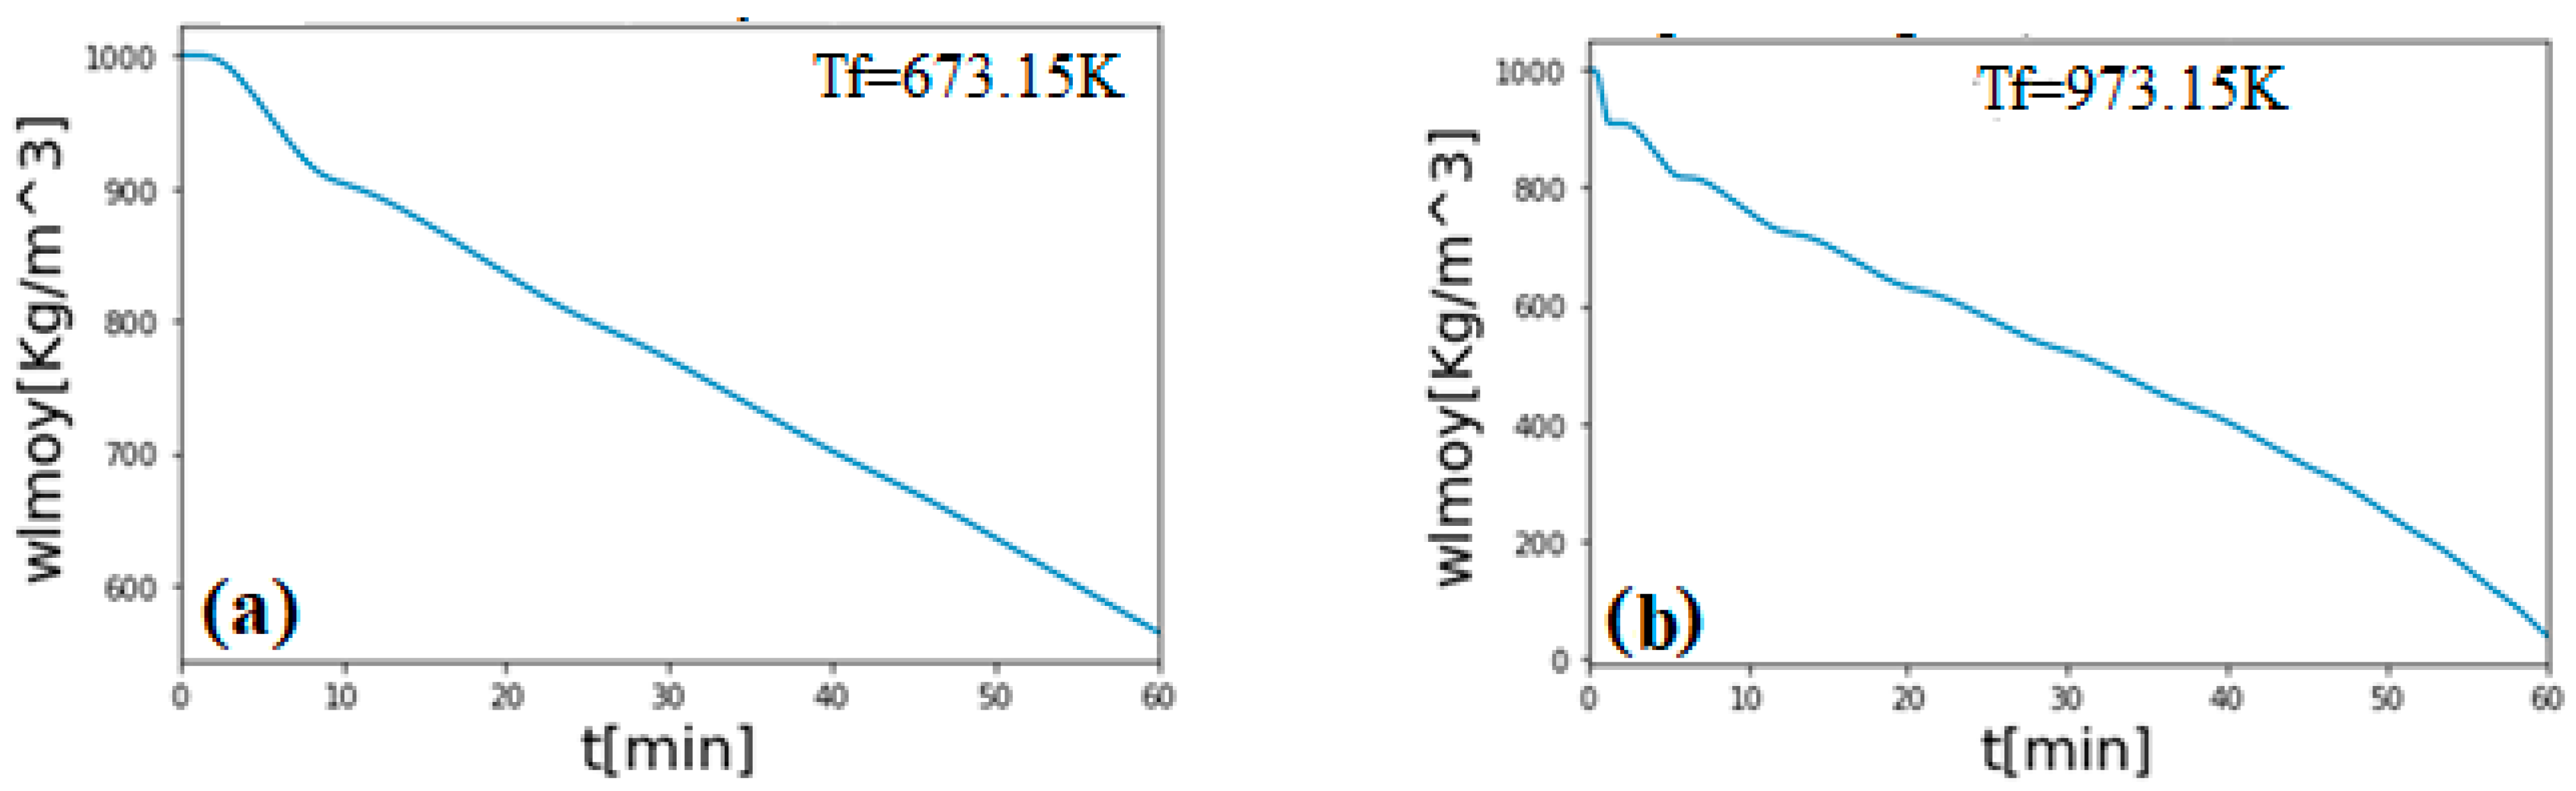
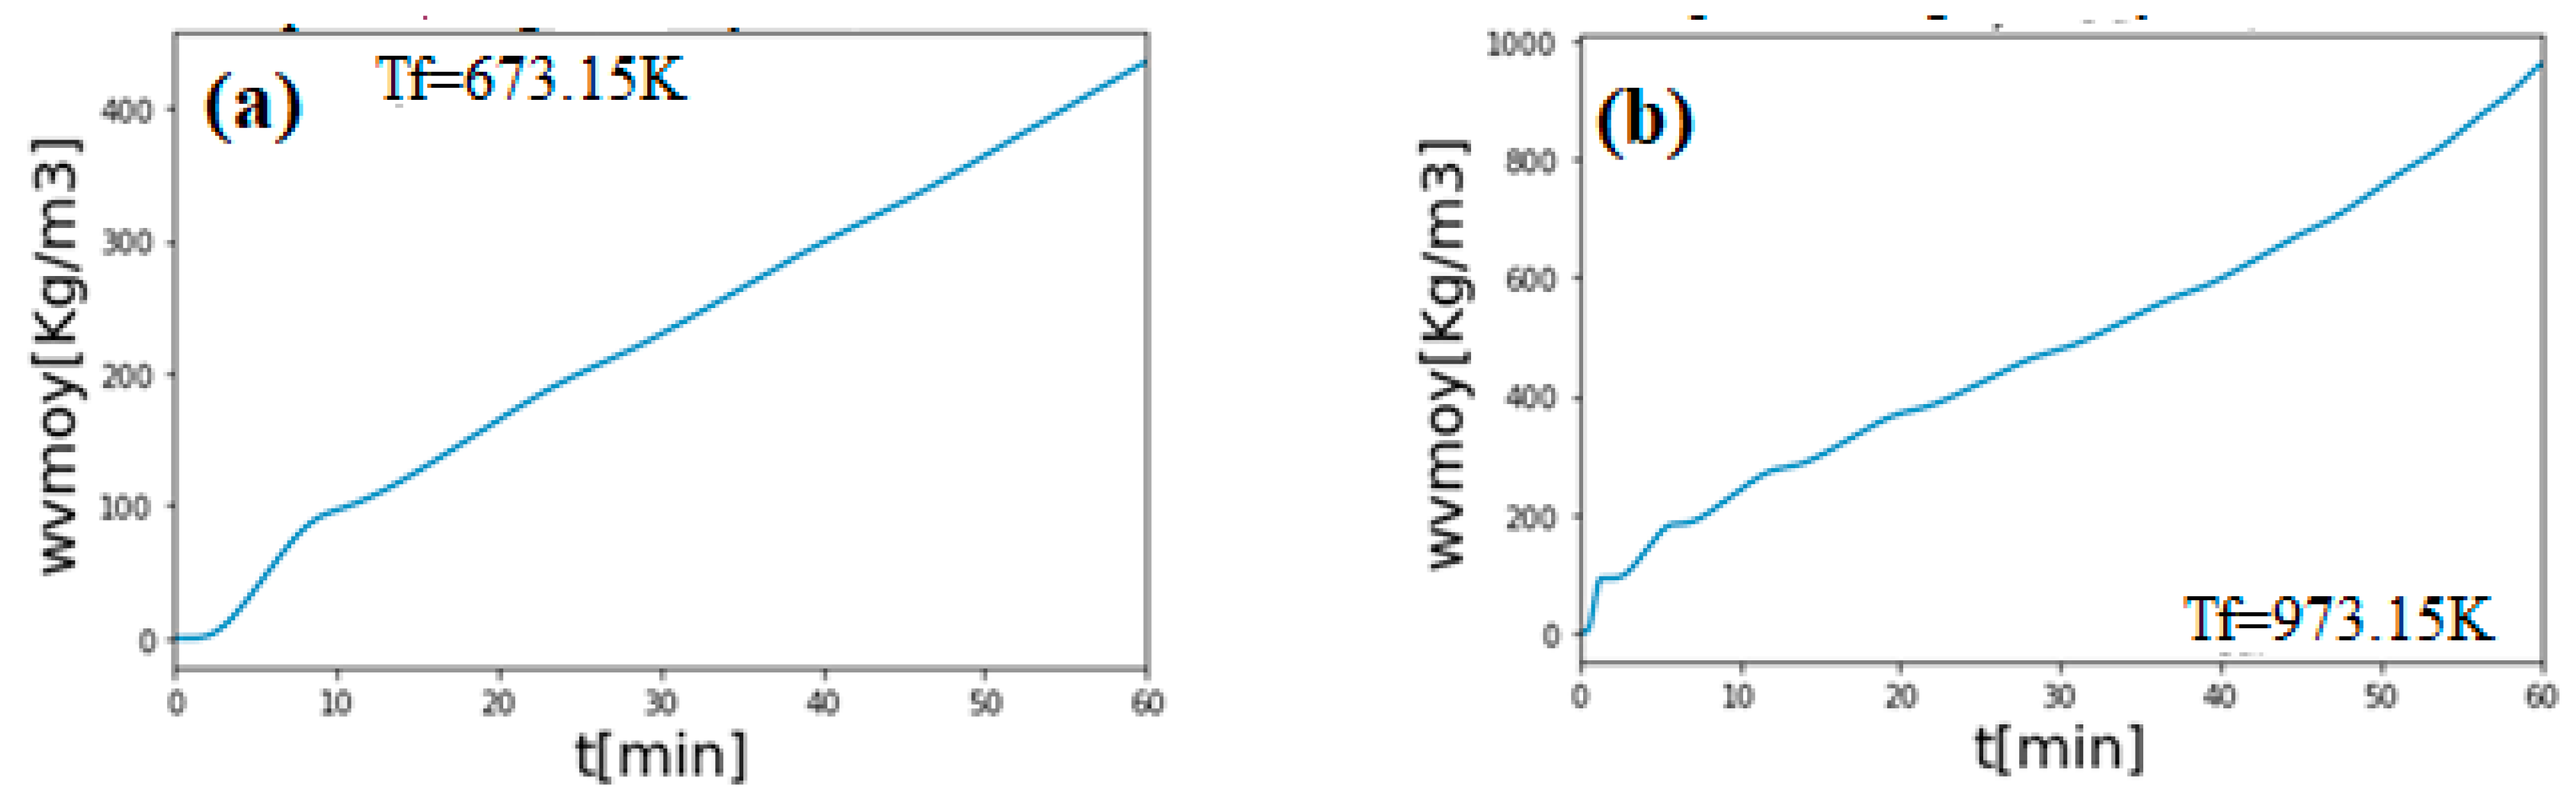
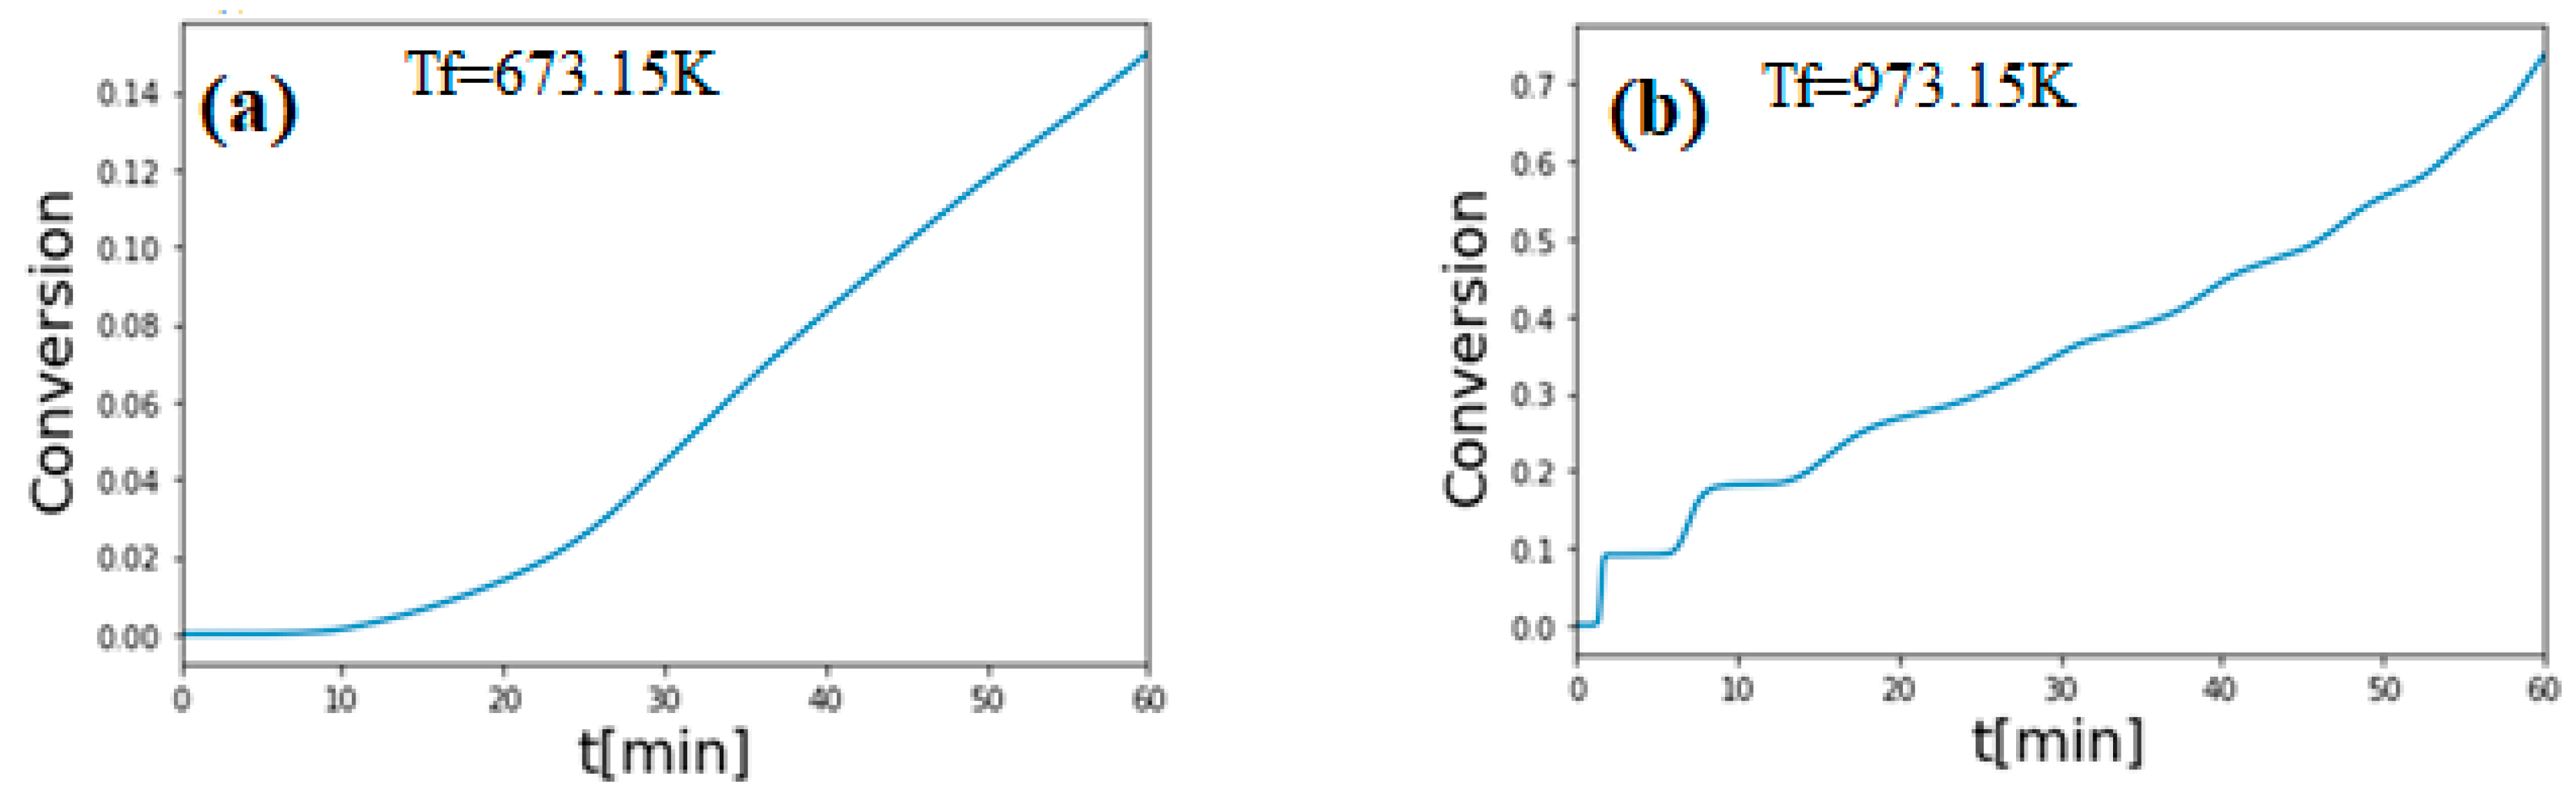
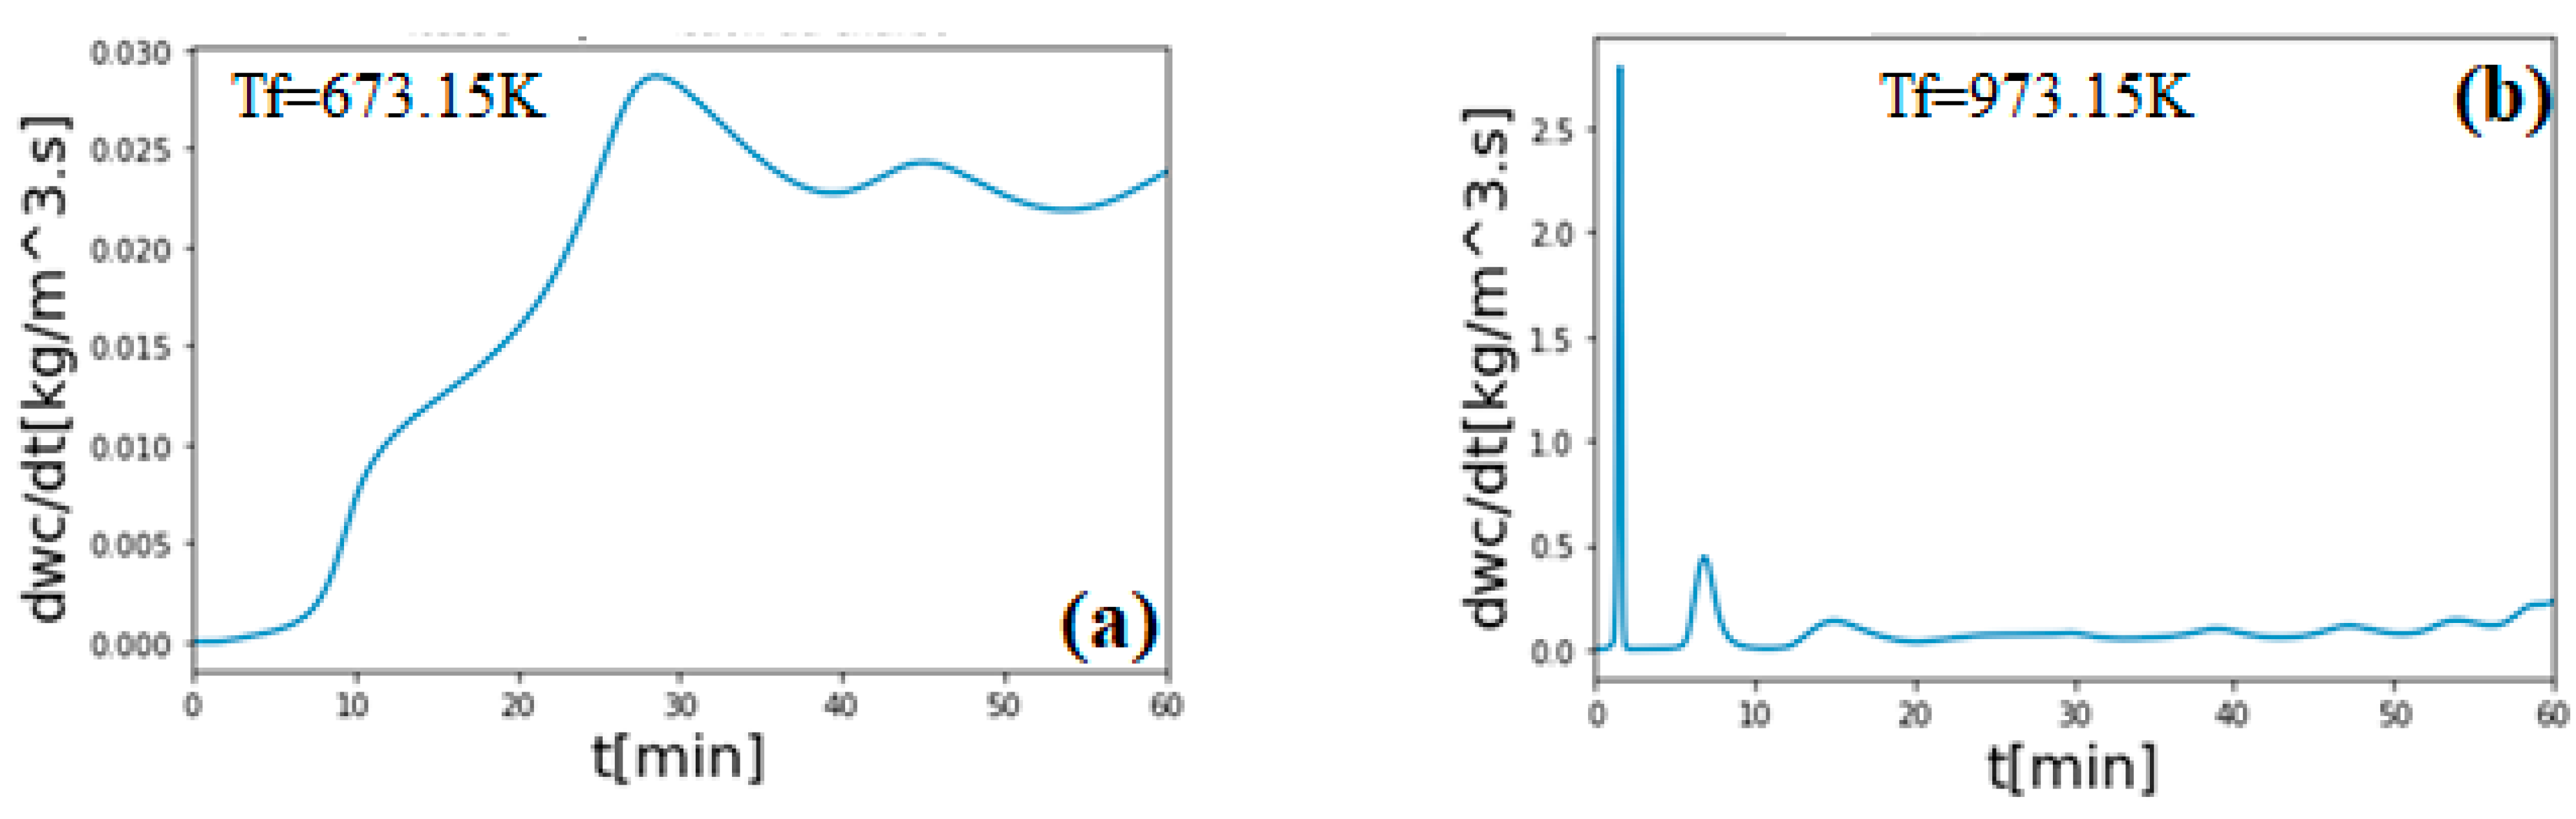
3. Results and Discussion

Based on the mathematical formulation of the pyrolysis process of solid wood samples, established in the previous sections, Python language has been used to generate numerical results. This model allowed us to examine the impact of the oven temperature, the heat conduction, the moisture content and the particle size on the pyrolysis process of a cylindrical wood sample.

Validation of the Model

The pyrolysis model was validated against the experiments of Larfeldt et al. [21]. The latter presented measurements of temperature distribution and mass loss on dry, solid wood cylindrical samples during pyrolysis in an inert atmosphere heated to 973.15 K. They considered cylindrical birch wood samples with a radius of 25 mm, a length of 300 mm and an average density of 410 kg/m3. Figure 1 presents the wood temperature evolutions at the surface (r = 25 mm), at 5 mm, and 15 mm to the axis of the cylindrical wood. In general, temperature increases from the surface to the center because parts near the surface are more heated than parts far from the surface. Model 1 (one-reactional model) gives acceptable results that are more satisfactory than model 2 (multi-reactional model).
Figure 2 shows relative density evolution versus time of process. Model 1 gives more satisfactory results than Model 2. Humidity in wood explains the poor results given by Model 2. In effect, when humidity is taken into account, water content absorbs an amount of energy and decreases the kinetics of the process as observed by several researchers [22]. In addition, the distance between experimental data and the models are presented in Figure 1 and Figure 2 and can be explained by empirical data used in Models 1 and 2. Activation energy and frequency coefficients used are not specified to the studied wood. Thus, constants for the activation energies of production charcoal, gases and water vapor must be determined according to each wood type in order to have a good representation of experimental data. Also, all thermodynamic parameters, such as specific heat mass, enthalpy and thermal conductivity must be obtained after precise experiments. Using Figure 2, it is clear that thermodynamic parameters used for theoretical data must be obtained with experimental data. Figure 3 and Figure 4 present evolutions of temperature and relative density of the cylindrical wood using inverse method. We found the values of A and E parameters to have theoretical curves near to the experimental curves given by Model 1. Thus, it was observed that when A and E are respectively equal to 1 × 10⁵ s−1 and 127.4 kJ/kg, experimental and theoretical curves of the wood’s relative density are close to each other. A space step of 0.05 s has been used. In effect, Di-Blasi et al. [23] show that pyrolysis reaction heat depends on the produced char and the type of studied materials. Using a cylindrical temperate sample of 3 cm diameter, Preau [24] found that temperatures of all parts of the sample increase until they reach the value of the oven (400 °C), this value is reached after 1000 s. At 1.5 cm diameter, the oven temperature (420 °C) is obtained after 400 s [25]. Influences of the heating rates experimentally considered can also increase this distance, as revealed in literature reviews [25,26].
Figure 5 presents the heat mass gradients when the temperatures in the oven are 673.15 K and 973.15 K. In a given time of the process and at the same distance of the center of the cylindrical wood sample, temperature is high when the oven temperature increases. From surface to the center, temperature decreases. When the process takes longer, internal parts of the cylindrical wood are hotter and the temperature increases. The thermal degradation of wood will begin from the surface to the center of samples. The average temperature increases with the duration of the process, but the limit of this evolution is near the temperature of the oven and this is because of the endothermic nature of the pyrolysis reaction, assumed in our simulation. During the first hour of the process, Figure 6 shows that the rate of temperature evolution increases with the temperature of the oven (source), and with the duration of the process.
Figure 7 presents the evolution of the wood’s relative density at 673.15 K and 973.15 K. After 600 s, only 5 mm of the wood is degraded when the temperature of the oven is equal to 673.15 K (see Figure 7a). At 973.15 K, 10 mm of wood is degraded, with 5 mm entirely degraded (see Figure 7b). A high heating temperature accelerates the degradation process. Using a low radius of wood particles with integration of the oxidation of char, Benkoussas et al. obtained the similar variations [27].
Figure 8 shows that the thermal degradation of wood proceeds progressively from the surface to the center. Velocity of degradation is high with the oven temperature. The propagation of the pyrolysis front through the non-pyrolyzed solid is shown in Figure 8 where the spatial evolution of the pyrolysis reaction rate, at various times and for a heating temperature of 673.15 K and 973.15 K, is represented. The reaction rate increases rapidly, reaches a maximum and then decreases to zero. Thus, volatiles are initially produced rapidly; the rate of production slows as the pyrolysis process continues. Figure 9 shows that the average velocity of degradation increases during the start of the process but some times decreases during the process. In effect, during the degradation, wood thermal capacity decreases when wood average temperature is near the temperature of the source. Figure 10 presents the wood conversion rate versus the duration of the process. It shows that wood is progressively transformed to other components during the process. After 60 min, 57% of the wood has been transformed when the oven temperature is equal to Tf = 673.15 K. At 973.15 K, cylindrical wood is totally transformed after 40 min. The conversion should vary from 0 at the beginning of the pyrolysis to 1 at the end. As the sample is considered dry, no latency period, which would be due to moisture evaporation, is to be noted in both cases. However, at low heating temperatures, the conversion increases slowly due to the fact that the temperature of the sample has not reached the temperature of the beginning of pyrolysis; during this time, the sample is only heated but no degradation takes place.
Along with Preau, Figure 11 permits the conclusion that sample temperature increases rapidly with a low diameter and an increasing temperature is influenced by the value of the diameter of samples [24].
Figure 11 presents the influence of the size of cylindrical wood on the evolution of temperature (Figure 11a) and wood conversion rate (Figure 11b) at Tf = 973.15 K. When the mass of wood increases, temperature takes time to heat all of the product. After 1000 s, all cylindrical wood of 15 mm radius is totally transformed, 2500 s are needed to totally transform a cylindrical wood with 25 mm of radius, while after 3000 s cylindrical wood with a radius higher than 35 mm is not totally transformed. The temperature increases more rapidly with small diameter samples as observed by Preau [24] in his experiments on the pyrolysis of solid wood samples.
Figure 12 presents the influence of initial moisture content on the surface temperature of cylindrical wood versus the duration of the process using Model 2 (multi-reactional model) at Tf = 973.15 K, R = 25 mm, RH = 0.3. When the wood is in non-hygroscopic domain (moisture content higher than 30%), free water is rapidly dried on the surface and evolutions of temperature at the surface of the cylindrical wood are almost the same. In hygroscopic domain (moisture content lower than 30%), the surface of the wood heated rapidly. However, after 400 s all curves align because the effects of the initial moisture content have been cancelled. Figure 13 shows that average moisture content in the cylindrical wood decreases exponentially and all curves align after 400 s. The samples are totally dried after 800 s. Figure 14 shows the distribution of temperature during the process at five positions of the cylindrical wood using Model 2. It is clear that wood samples will degrade progressively from the surface to the center because temperature takes time to heat internal parts of the cylindrical wood. After 500 s, the temperature of the surface is near the temperature of the source (973.15 K) but the temperature at the center has not changed. After 3500 s, the temperature of the position located at 10 mm to the axis of the cylindrical wood is equal to 750 K. Literature also shows similar experimental results [24].
Figure 15 shows that the cylindrical wood surface rapidly equaled the equilibrium moisture content. Internal parts of the wood are heated rapidly when temperature of the source was high. When Tf = 673.15 K, the axial part of the wood had 0.175 kg/kg moisture content after 600 s duration (Figure 15a). After 1200 s, the axial part of the wood was equal to 0.015 kg/kg (Figure 15b). It is clear from these curves that high heating temperatures accelerate the drying process. Figure 16 shows that after 600 s, the temperature of parts located at 10 mm of the axis have the same temperature as at the start of the process. Thus, variation of moisture content near the axis presented in Figure 15 is not explained by an increase in the temperature. However, as found by Di Blasi et al. [22], the presence of moisture slows down the pyrolysis process to the point that near the center, the temperature remains constant at its initial value during the evaporation of moisture. Once the drying process is over, in which case the region near the center has reached the equilibrium moisture content, this temperature increases. Indeed, a significant amount of energy is used for the evaporation of the water contained in the wood and only a small amount is transferred to the virgin wood. When the temperature at the surface of the sample reaches about 500 K, the pyrolysis reaction starts and a layer of charcoal forms near the surface, while the temperature in the center remains constant at its initial value. It can therefore be concluded that drying and pyrolysis take place successively, at high heating temperatures, at the same positions along the radius of the pyrolyzed solid wood sample.
Figure 17 shows that the rate of temperature increase is high when the temperature of the source increases. This average temperature continues to increase until the temperature of all parts of the wood is near to that of the source Tf. Figure 18 shows that the density of wood decreases progressively. When the temperature of the source is equal to 673.15 K, wood density starts to decrease after 10 min. When Tf = 973.15 K, the density of the wood decreases after the first seconds of the process. In effect, Figure 16 shows that after 10 min of the process at Tf = 673.15 K, some millimeters of the wood’s surface reaches a temperature equal to 500 K, the temperature from which charcoal is produced [22]. When Tf = 973.15 K, a part of the sample reaches 500 K at 150 s, thus charcoal is produced rapidly. Figure 19 and Figure 20 show that when the wood density decreases, charcoal and gas are directly produced. Figure 19a,b show that during slow pyrolysis (Figure 19a), the density of charcoal obtained is lower than that obtained during the fast pyrolysis (Figure 19b). Values of densities found are not far from those obtained by Teixeira et al. [28] using wood pellets and wood chips at 700 °C. Figure 20 shows that the gas obtained has a density greater than 10 kg/m3 after the first minutes of the process. Thus, it is possible to have some gas in a liquid state in order to justify the great value of gas density obtained. As showed in the literature, gas produced by the wood pyrolysis process is a mixture of many known gases such as CO, CH4, C, CO2, H2, H2O and O2 [28]. In the liquid state, it is possible that these gases give a high density value. In addition, it has been shown that fast and slow pyrolysis give 13% and 35% of gas, respectively, near the solid products ratio given by the process [29]. Commandré et al. [30] confirm this ratio of gas density obtained during pyrolysis process and show experimentally that this ratio can reach up to 40%.
Works of Widiyannita et al. and Charvet et al. permit us to notice that the percentage of each component given by the pyrolysis depends on the product used [31,32].
Vapor and liquid states are highly related. In effect, Figure 21 and Figure 22 show that the evolutions of these two pyrolysis products are directly opposite because the concentration of vapor is influenced by the pressure and temperature of liquid water in the cylindrical wood. Thus, liquid density firstly decreases (Figure 21) in order to produce the liquid vapor (Figure 22). It has been seen that during the process, liquid in the wood is firstly transformed to gas (steam). If this gas is not evacuated to the system, it is transformed to a liquid form again (see Figure 22).
Figure 23 presents the wood conversion rate versus duration of the process in the two studied temperatures. It is clear that when the temperature of the source increases, wood is degraded rapidly. Thus, charcoal, gas and water vapor are also rapidly produced (Figure 24, Figure 25 and Figure 26). At 673.15 K, the average velocity of charcoal production increases progressively until 0.025 kg/(m3.s) and oscillates near this value. When Tf = 973.15 K, a great variation is presented during the first 10 min of the process before reaching a stability near 0.1 kg/(m3.s). These two variations are also seen during production of gas and water vapor. At a given temperature, water vapor is more rapidly produced than charcoal, and charcoal more rapidly produced than gas (Figure 24, Figure 25 and Figure 26).
The influence of wood pyrolysis temperature is clearly presented in Figure 23. The increasing temperature increases the wood conversion and changes the physical morphology of the charcoal (volume, form), thus the charcoal density as shown by Ananias et al., Hanif et al. and Arous et al. [33,34,35].

4. Conclusions

In this work, we have mathematically modeled the pyrolysis process of large pieces of wood using two kinetic models: a uni-reactionary and a multi-reactionary one step model. In the absence of Comorian wood samples, the parameters (thermo-physical and kinetic) used in this study were all extracted from the literature. The mathematical formulation of the model was used as a basis to develop a numerical model in Python.
The suggested numerical model has allowed us to follow the evolution of the pyrolysis reaction and to better understand the influence of the oven temperature, the particle size and the water content of the wood in the pyrolytic conversion process. We note that during the pyrolysis of solid wood samples, the drying and pyrolysis reactions take place successively. The water content is a factor that slows down the pyrolysis process and it is therefore recommended to use dry samples. The oven temperature has a significant influence on the temperature profile and the reaction rates; a high oven temperature reduces the drying and conversion time while it increases the rate of the production of volatile products. A wet wood sample has no obvious drying behavior at high heating temperatures. The size of the particles is also a factor influencing the process, which can longer or shorter depending on the size of the sample.
Among the two studied models in this work, the multi-reaction model better describes the process because it takes into account the effect of the water content and allows us to follow the evolution of various substances produced during the pyrolysis. This model, which is simple and does not require a long calculation time, can be used to calculate the temperature distribution in a pyrolysis bed.
However, since water content, furnace temperature and particle size are not the only factors to be controlled for an efficient and optimal pyrolysis, further studies are needed to better understand the process.
In order to specify the results of this study to Comorian wood samples, it is recommended that in future work, an extensive experimental measurement campaign be carried out to determine frequency factors, densities, thermal and mass conductivities, gas permeability, activation energies, desorption isotherms, among others, so that the numerical results of pyrolysis/combustion are more specific to Comorian woods and subsequently, to dimension pyrolysis/combustion/gasification equipment taking into account the specificity of these woods. Influence of the heating rates must be also studied in order to describe progressively very well all thermophysical processes.

Author Contributions

Conceptualization, M.S.-T. and N.A.; methodology, N.A., M.S.-T. and F.K.-S.; software, N.A. and M.S.-T.; validation, N.A., M.S.-T., A.T.T., A.Z. and F.K.-S.; formal analysis, N.A. and M.S.-T.; investigation, N.A. and M.S.-T.; resources, N.A.; data curation, N.A., M.S.-T. and F.K.-S.; writing—original draft preparation, N.A. and M.S.-T.; writing—review and editing, N.A., M.S.-T., F.K.-S., A.T.T., M.E.M. and A.Z.; visualization, F.K.-S., M.B.O.A., Y.R., P.G. and A.Z.; supervision, M.S.-T., F.K.-S., M.E.M., M.B.O.A., Y.R., P.G. and A.Z.; project administration, M.S.-T. and F.K.-S. All authors have read and agreed to the published version of the manuscript.

Funding

This research received no external funding.

Institutional Review Board Statement

Not applicable.

Informed Consent Statement

Not applicable.

Data Availability Statement

Not applicable.

Conflicts of Interest

The authors declare no conflict of interest.

Nomenclature

ParametersUnitsDescriptions
Latin letters
A 1 / s Frequency factor
C p J / ( kg . K ) Specific heat
D m 2 / s Mass diffusivity
E kJ / mol Activation energy
h W / ( m 2 . K ) Convective exchange coefficient
H kg / kg Moisture content
Δ h kJ / kg Enthalpy of the reaction
k 1 / s Rate constant
Q kJ / kg Heat of pyrolysis
Q r kW / m 3 Heat source
RH % / 100 Relative humidity
R g J / mol Perfect gas constant
T K Temperature
Greek letters
ε Emissivity
η Conversion
κ m 2 / s Thermal diffusivity
λ W / ( m . K ) Thermal conductivity
ρ kg / m 3 Density
σ W / ( m 2 . K 4 ) Stefan-Boltzmann constant
χ eq kg / kg Equilibrium moisture content
Indices
0 Initial
a Air
b Wood
c Charcoal
g Gas
h Wet
i Component
t Tar
moy average

References

  1. Simo-Tagne, M.; Ndukwu, M.C.; Azese, M.N. Experimental modelling of a solar dryer for wood fuel in epinal (France). Modelling 2020, 11, 39–52. [Google Scholar] [CrossRef]
  2. Berahab, R. Energies Renouvelables en Afrique: Enjeux; Défis et Opportunités; Policy Center for the New South: Rabat, Morocco, 2019. [Google Scholar]
  3. Commission Economique des Nations Unies Pour l’Afrique. Développement des Statistiques du Bilan Energétique et d'un Modèle de Système Energétique Pour l'Union des Comores. Available online: https://archive.uneca.org/sites/default/files/images/SROs/EA/French/developpement_des_statistiques_du_bilan_energetique_et_dun_modele_de_systeme_energetique_pour_lunion_des_comores.pdf (accessed on 20 November 2021).
  4. Union des Comores, Strategie Nationale et Plan D’action Actualisés Pour la Diversité Biologique. Available online: https://www.cbd.int/doc/world/km/km-nbsap-v2-fr.pdf (accessed on 20 November 2021).
  5. Evaluation des Ressources Forestières Mondiales 2010—Rapport National: Comores. Available online: https://www.fao.org/publications/card/fr/c/423807a6-f7a9-5458-80a1-e6e3b437c44d/ (accessed on 20 November 2021).
  6. Vikram, S.; Rosha, P.; Kumar, S. Recent modeling approaches to biomass pyrolysis: A review. Energy Fuels 2021, 9, 7406–7433. [Google Scholar] [CrossRef]
  7. Bamford, C.H.; Crank, J.; Malan, D.H. The combustion of wood, part 1. Camb. Philos. Soc. Proc. Biol. Sci. 1946, 42, 166–182. [Google Scholar] [CrossRef]
  8. Tinney, E.R. The combustion of wooden dowels in heated air. Combust. Inst. 1965, 10, 925–930. [Google Scholar] [CrossRef]
  9. Di-Blasi, C. Modeling and simulation of combustion processes of charring and non-charring solid fuels. Prog. Energy Combust. Sci. 1993, 19, 71–104. [Google Scholar] [CrossRef]
  10. Akita, K.; Kase, M. Determination of kinetic parameters for pyrolysis of cellulose and cellulose treated with ammonium phosphate by differential thermal analysis and thermal gravimetric analysis. J. Polym. Sci. 1967, 5, 833–848. [Google Scholar] [CrossRef]
  11. Di-Blasi, C. Analysis of convection and secondary reaction effects within porous solid fuels undergoing pyrolysis. Combust. Sci. Technol. 1993, 90, 315–340. [Google Scholar] [CrossRef]
  12. Shen, D.; Fang, M.; Luo, Z.; Cen, K. Modeling pyrolysis of wet wood under external heat flux. Fire Saf. J. 2007, 142, 210–217. [Google Scholar] [CrossRef]
  13. Park, W.C.; Atreya, A.; Baum, H.R. Experimental and theoretical investigation of heat and mass transfer processes during wood pyrolysis. Combust. Flame 2010, 157, 481–494. [Google Scholar] [CrossRef]
  14. Chan, W.-C.R.; Kelbon, M.; Krieger, B.B. Modelling and experimental verification of physical and chemical processes during pyrolysis of a large biomass particle. Fuel 1985, 64, 1505–1513. [Google Scholar] [CrossRef]
  15. Saastamoinen, J.; Richard, J.-R. Simultaneous drying and pyrolysis of solid fuel particles. Combust. Flame 1996, 1106, 288–300. [Google Scholar] [CrossRef]
  16. Larfeldt, J.; Leckner, B.; Melaaen, M.C. Modelling and measurements of heat transfer in charcoal from pyrolysis of large wood particles. Biomass Bioenergy 2000, 118, 507–514. [Google Scholar] [CrossRef]
  17. Simo-Tagne, M. Contribution à L’étude du Séchage des Bois Tropicaux au Cameroun: Aspects Caractérisation, Modélisation Multi-Echelle et Simulation. Le cas des bois D’ayous (Triplochiton Scleroxylon) et d’ébène (Diospyros Crassiflora). Ph.D. Thesis, University of Yaoundé 1, Yaounde, Cameroon, 2011. [Google Scholar]
  18. Özisik, M.N.; Orlande, H.R.; Colaço, M.J.; Cotta, R.M. Finite Difference Methods in Heat Transfer. 2017. Available online: https://www.taylorfrancis.com/books/mono/10.1201/9781315121475/finite-difference-methods-heat-transfer-necati-%C3%B6zi%C5%9Fik-helcio-orlande-marcelo-jos%C3%A9-cola%C3%A7o-renato-machado-cotta (accessed on 20 November 2021).
  19. Di-Blasi, C. Processes of flames spreading over the surface of charring fuels: Effects of the solid thickness. Combust. Flame 1994, 197, 225–239. [Google Scholar] [CrossRef]
  20. Thurner, F.; Mann, U. Kinetic investigation of wood pyrolysis. Ind. Eng. Chem. Process. Des. Dev. 1981, 20, 482–488. [Google Scholar] [CrossRef]
  21. Larfeldt, J.; Leckner, B.; Melaaen, M. Modelling and measurements of the pyrolysis of large wood particles. Fuel 2000, 179, 1637–1643. [Google Scholar] [CrossRef]
  22. Di-Blasi, C.; Hernandez, E.G.; Santoro, A. Radiative pyrolysis of single moist wood particles. Ind. Eng. Chem. Res. 2000, 139, 873–882. [Google Scholar] [CrossRef]
  23. Di-Blasi, C.; Branca, C.; Masotta, F.; De-Biase, E. Experimental analysis of reaction heat effects during beech wood. Energy Fuels 2013, 27, 2665–2674. [Google Scholar] [CrossRef] [Green Version]
  24. Preau, A. Etude de la Pyrolyse de Composés Lignocellulosiques et Modélisation de ce Processus. Ph.D. Thesis, Institut National Polytechnique de Lorraine, Nancy, France, 2007. [Google Scholar]
  25. Sharma, P.; Diwan, P. Study of thermal decomposition process and the reaction mechanism of the eucalyptus wood. Wood Sci. Technol. 2017, 51, 1081–1094. [Google Scholar] [CrossRef]
  26. Bhardwaj, G.; Kumar, M.; Mishra, P.; Upadhyay, S. Kinetic analysis of the slow pyrolysis of paper wastes. Biomass Convers. Biorefinery 2021, 1–15. [Google Scholar] [CrossRef]
  27. Benkoussas, B.; Consalvi, J.-L.; Porterie, B.; Sardoy, N.; Loraud, J.-C. Modelling thermal degradation of woody fuel particles. Int. J. Therm. Sci. 2007, 46, 319–327. [Google Scholar] [CrossRef]
  28. Teixeira, G.; Van de Steene, L.; Martin, E.; Gelix, F.; Salvador, S. Gasification of char from wood pellets and from wood chips: Textural properties and thermochemical conversion along a continuous fixed bed. Fuel 2012, 102, 514–524. [Google Scholar] [CrossRef] [Green Version]
  29. Mayhead, G.; Snell, R.; Shelly, J.R. Pyrolysis of Woody Biomass. pp. 1–6. Available online: https://ucanr.edu/sites/woodybiomass/files/78980.pdf (accessed on 11 December 2021).
  30. Commandré, J.-M.; Lahmidi, H.; Salvador, S.; Dupassieux, N. Pyrolysis of wood at high temperature: The influence of experimental parameters on gaseous products. Fuel Process. Technol. 2011, 92, 837–844. [Google Scholar] [CrossRef] [Green Version]
  31. Widiyannita, A.M.; Cahyono, R.B.; Budiman, A.; Sutijan; Akiyama, T. Study of pyrolysis of ulin wood residues. AIP Conf. Proc. 2016, 1755, 050004. [Google Scholar] [CrossRef] [Green Version]
  32. Charvet, F.; Silva, F.; Ruivo, L.; Tarelho, L.; Matos, A.; Figueiredo da Silva, J.; Neves, D. Pyrolysis characteristics of undervalued wood varieties in the portuguese charcoal sector. Energies 2021, 14, 2537. [Google Scholar] [CrossRef]
  33. Ananias, F.D.J.; Rosi, P.E.; Álison, M.da.-S.; Aécio, D.S.J.; Oliveira, M.P.; Brito, J.O.; Napoli, A.; Magalhães, B.B. Investigating the pyrolysis temperature to define the use of charcoal. Eur. J. Wood Wood Prod. 2020, 78, 193–204. [Google Scholar] [CrossRef]
  34. Arous, S.; Koubaa, A.; Bouafif, H.; Bouslimi, B.; Braghiroli, F.L.; Bradai, C. Effect of pyrolysis temperature and wood species on the properties of biochar pellets. Energies 2021, 14, 6529. [Google Scholar] [CrossRef]
  35. Hanif, M.U.; Zwawi, M.; Capareda, S.C.; Iqbal, H.; Algarni, M.; Felemban, B.F.; Bahadar, A.; Waqas, A. Influence of pyrolysis temperature on product distribution and characteristics of anaerobic sludge. Energies 2020, 13, 79. [Google Scholar] [CrossRef] [Green Version]
Figure 1. Wood temperature evolutions versus time of process for a cylindrical wood sample and validation using model 1, model 2 and experimental data taken from Larfeldt et al. [21].
Sustainability 13 13892 g001
Figure 2. Wood density evolutions versus time of process of a sample of cylindrical wood and validation using Model 1, Model 2 and experimental data taken from Larfeldt et al. [21].
Sustainability 13 13892 g002
Figure 3. Wood temperature evolutions versus time of process of a sample of cylindrical wood and validation using Model 1, Model 2 and experimental data taken from Larfeldt et al. [21]. A = 1 × 10⁵ s−1, A1 = 36.9 × 10⁵ s−1, A2 = 7.2 × 10⁴ s−1, A3 = 5.13 × 10⁶ s−1, E = 127.4 kJ/kg, E1 = 88.75 kJ/kg, E2 = 73.83 kJ/kg, E3 = 88 kJ/kg.
Sustainability 13 13892 g003
Figure 4. Wood relative density evolutions versus time of process of a sample of cylindrical wood and validation using Model 1 and experimental data taken from Larfeldt et al. [21]. A = 1 × 10⁵ s−1, E = 127.4 kJ/kg.
Sustainability 13 13892 g004
Figure 5. Heat transfer gradient using Model 1 at Tf = 673.15 K (a) and Tf = 973.15 K (b).
Sustainability 13 13892 g005
Figure 6. Evolution of average temperature versus the time of process using Model 1 at Tf = 673.15 K (a) and Tf = 973.15 K (b).
Sustainability 13 13892 g006
Figure 7. Wood relative density gradient using Model 1 at Tf = 673.15 K (a) and Tf = 973.15 K (b).
Sustainability 13 13892 g007
Figure 8. Wood’s velocity of degradation gradient using Model 1 at 673.15 K (a) and 973.15 K (b).
Sustainability 13 13892 g008
Figure 9. Evolution of the velocity of degradation using Model 1 at Tf = 673.15 K (a) and Tf = 973.15 K (b).
Sustainability 13 13892 g009
Figure 10. Wood conversion rate versus the duration of the process using Model 1 at Tf = 673.15 K (a) and Tf = 973.15 K (b).
Sustainability 13 13892 g010
Figure 11. Influences of the wood size on wood temperature (a) and wood conversion rate (b) evolutions versus the duration using Model 1 at Tf = 973.15 K.
Sustainability 13 13892 g011
Figure 12. Evolutions of the surface temperature versus the duration using Model 2, influence of initial moisture content at Tf = 973.15 K and RH = 0.3%/100.
Sustainability 13 13892 g012
Figure 13. Influence of initial moisture content on the evolution of the average moisture content using Model 2 at Tf = 973.15 K, RH = 0.3%/100 and R = 25 mm.
Sustainability 13 13892 g013
Figure 14. Evolutions of temperature in five positions versus duration of the process using Model 2 at Tf = 973.15 K, RH = 0.3%/100, R = 25 mm and Ho = 20%.
Sustainability 13 13892 g014
Figure 15. Evolution of the wood’s average humidity gradient using Model 2 at Tf = 673.15 K (a) and Tf = 973.15 K (b). RH = 0.3%/100, R = 25 mm and Ho = 20%.
Sustainability 13 13892 g015
Figure 16. Evolutions of the wood’s temperature gradient using Model 2 at 673.15 K (a) and 973.15 K (b) RH = 0.3%/100, R = 25 mm and Ho = 20%.
Sustainability 13 13892 g016
Figure 17. Evolutions of the wood’s average temperature using Model 2 at 673.15 K (a) and 973.15 K (b). RH = 0.3%/100, R = 25 mm and Ho = 20%.
Sustainability 13 13892 g017
Figure 18. Wood average density versus duration using Model 2 at Tf = 673.15 K (a) and Tf = 973.15 K (b). RH = 0.3%/100, R = 25 mm and Ho = 20%.
Sustainability 13 13892 g018
Figure 19. Charcoal average density versus duration using Model 2 at Tf = 673.15 K (a) and Tf = 973.15 K (b). RH = 0.3%/100, R = 25 mm and Ho = 20%.
Sustainability 13 13892 g019
Figure 20. Gas average density versus duration using Model 2 at Tf = 673.15 K (a) and Tf = 973.15 K (b). RH = 0.3%/100, R = 25 mm and Ho = 20%.
Sustainability 13 13892 g020
Figure 21. Liquid average density versus duration using Model 2 at Tf = 673.15 K (a) and Tif = 973. 15 K (b). RH = 0.3%/100, R = 25 mm and Ho = 20%.
Sustainability 13 13892 g021
Figure 22. Vapor average density versus duration using Model 2 at Tf = 673.15 K (a) and Tif = 973. 15 K (b). RH = 0.3%/100, R = 25 mm and Ho = 20%.
Sustainability 13 13892 g022
Figure 23. Wood conversion rate versus duration using Model 2 at Tf = 673.15 K (a) and Tf = 973.15 K (b) RH = 0.3%/100, R = 25 mm and Ho = 20%.
Sustainability 13 13892 g023
Figure 24. Average velocity of charcoal production versus duration using Model 2 at Tf = 673.15 K (a) and Tf = 973.15 K (b). RH = 0.3%/100, R = 25mm and Ho = 20%.
Sustainability 13 13892 g024
Figure 25. Average velocity of gas production versus duration using Model 2 at Tf = 673.15 K (a) and Tf = 973.15 K (b). RH = 0.3%/100, R = 25 mm and Ho = 20%.
Sustainability 13 13892 g025
Figure 26. Average velocity of water vapor production versus duration using Model 2 at Tif = 673. 15 K (a) and Tf = 973.15 K (b). RH = 0.3%/100, R = 25 mm and Ho = 20%.
Sustainability 13 13892 g026
Table 1. Numerical data of constants used.
ParametersNumerical ValuesReference
Uni-Reactionary Approach
λ (W.m−1.K−1 ) 10.5 × 10 5 [19]
ε 0.8[12]
ω 0 (kg.m−3)650[19]
C b (J.kg−1.K−1)1.46[19]
h c (W.m−2.K−1)20[13]
Q (kJ.kg−1)−418[20]
A (s−1) 1.0 × 10 8 [9]
E (kJ.mol−1) 125.4 [9]
Multi-reaction approach
Pyrolysis reactionDrying reaction
k 1 (s−1) k 2 (s−1) k 3 (s−1)
A i (s−1) 1.38 × 10 5 1.44 × 10 4 5.13 × 10 6 [12,20]
E i (kJ.mol−1)106.588.688[12,20]
Δ h i 0 (kJ.kg−1)−420−420−2440[12]
C p (J.kg−1.K−1) C b = 1950
C c = 1390
C g = 2400
C l = 4180
C v = 1580
[12]
κ a (m2.s−1) 2.77 × 10 5 In this work
λ c (W.m−1.K−1 )0.105
λ a (W.m−1.K−1 ) 0.024
D a (m2.s−1) 2.55 × 10 5
H 0 (kg.kg−1)0.2
RH (%⁄100) 0.3
Publisher’s Note: MDPI stays neutral with regard to jurisdictional claims in published maps and institutional affiliations.

