1. Introduction
The role that city form plays in building more sustainable cities has been intensely investigated in the past decades [
1,
2,
3,
4]. In this work, numerous urban form descriptors linked to sustainability were recurrently discussed, including compactness, density, and land use mix and diversity [
5]. From a transportation research point of view, these descriptors are often organized under the conceptual framework known as the 3Ds, denoting density, diversity and, importantly given the focus of this paper, design [
6]. Since its publication, this framework was instrumental in the development of numerous studies on sustainable transportation, outlining how in compact, dense, and diverse cities, origins and destinations locate closer together, making walking and cycling viable, and making the operation of transit systems more efficient. Thus, in sustainable transportation research, city form is seen as a means by which to effect modal shifts, reducing the use of automobiles and, consequently, reducing fossil fuels consumption, air pollution, and greenhouse gas emissions [
7,
8,
9,
10,
11].
In terms of design, researchers have often focused on street network connectivity, analyzing the networks themselves, and associated elements such as block sizes and lengths, intersection types, and overall road pattern descriptions such as curvilinear and gridiron [
12,
13,
14]. However, despite the large number of articles that studied street connectivity as a key component linking urban form to more sustainable transportation modes, not much work has concentrated on superblocks and superblocks-built cities. In fact, with some recent exceptions, few studies addressed the connectivity of these urban street systems, even when constituting a key component in the urbanization strategy of many countries worldwide, and particularly the Middle East [
15,
16,
17,
18,
19].
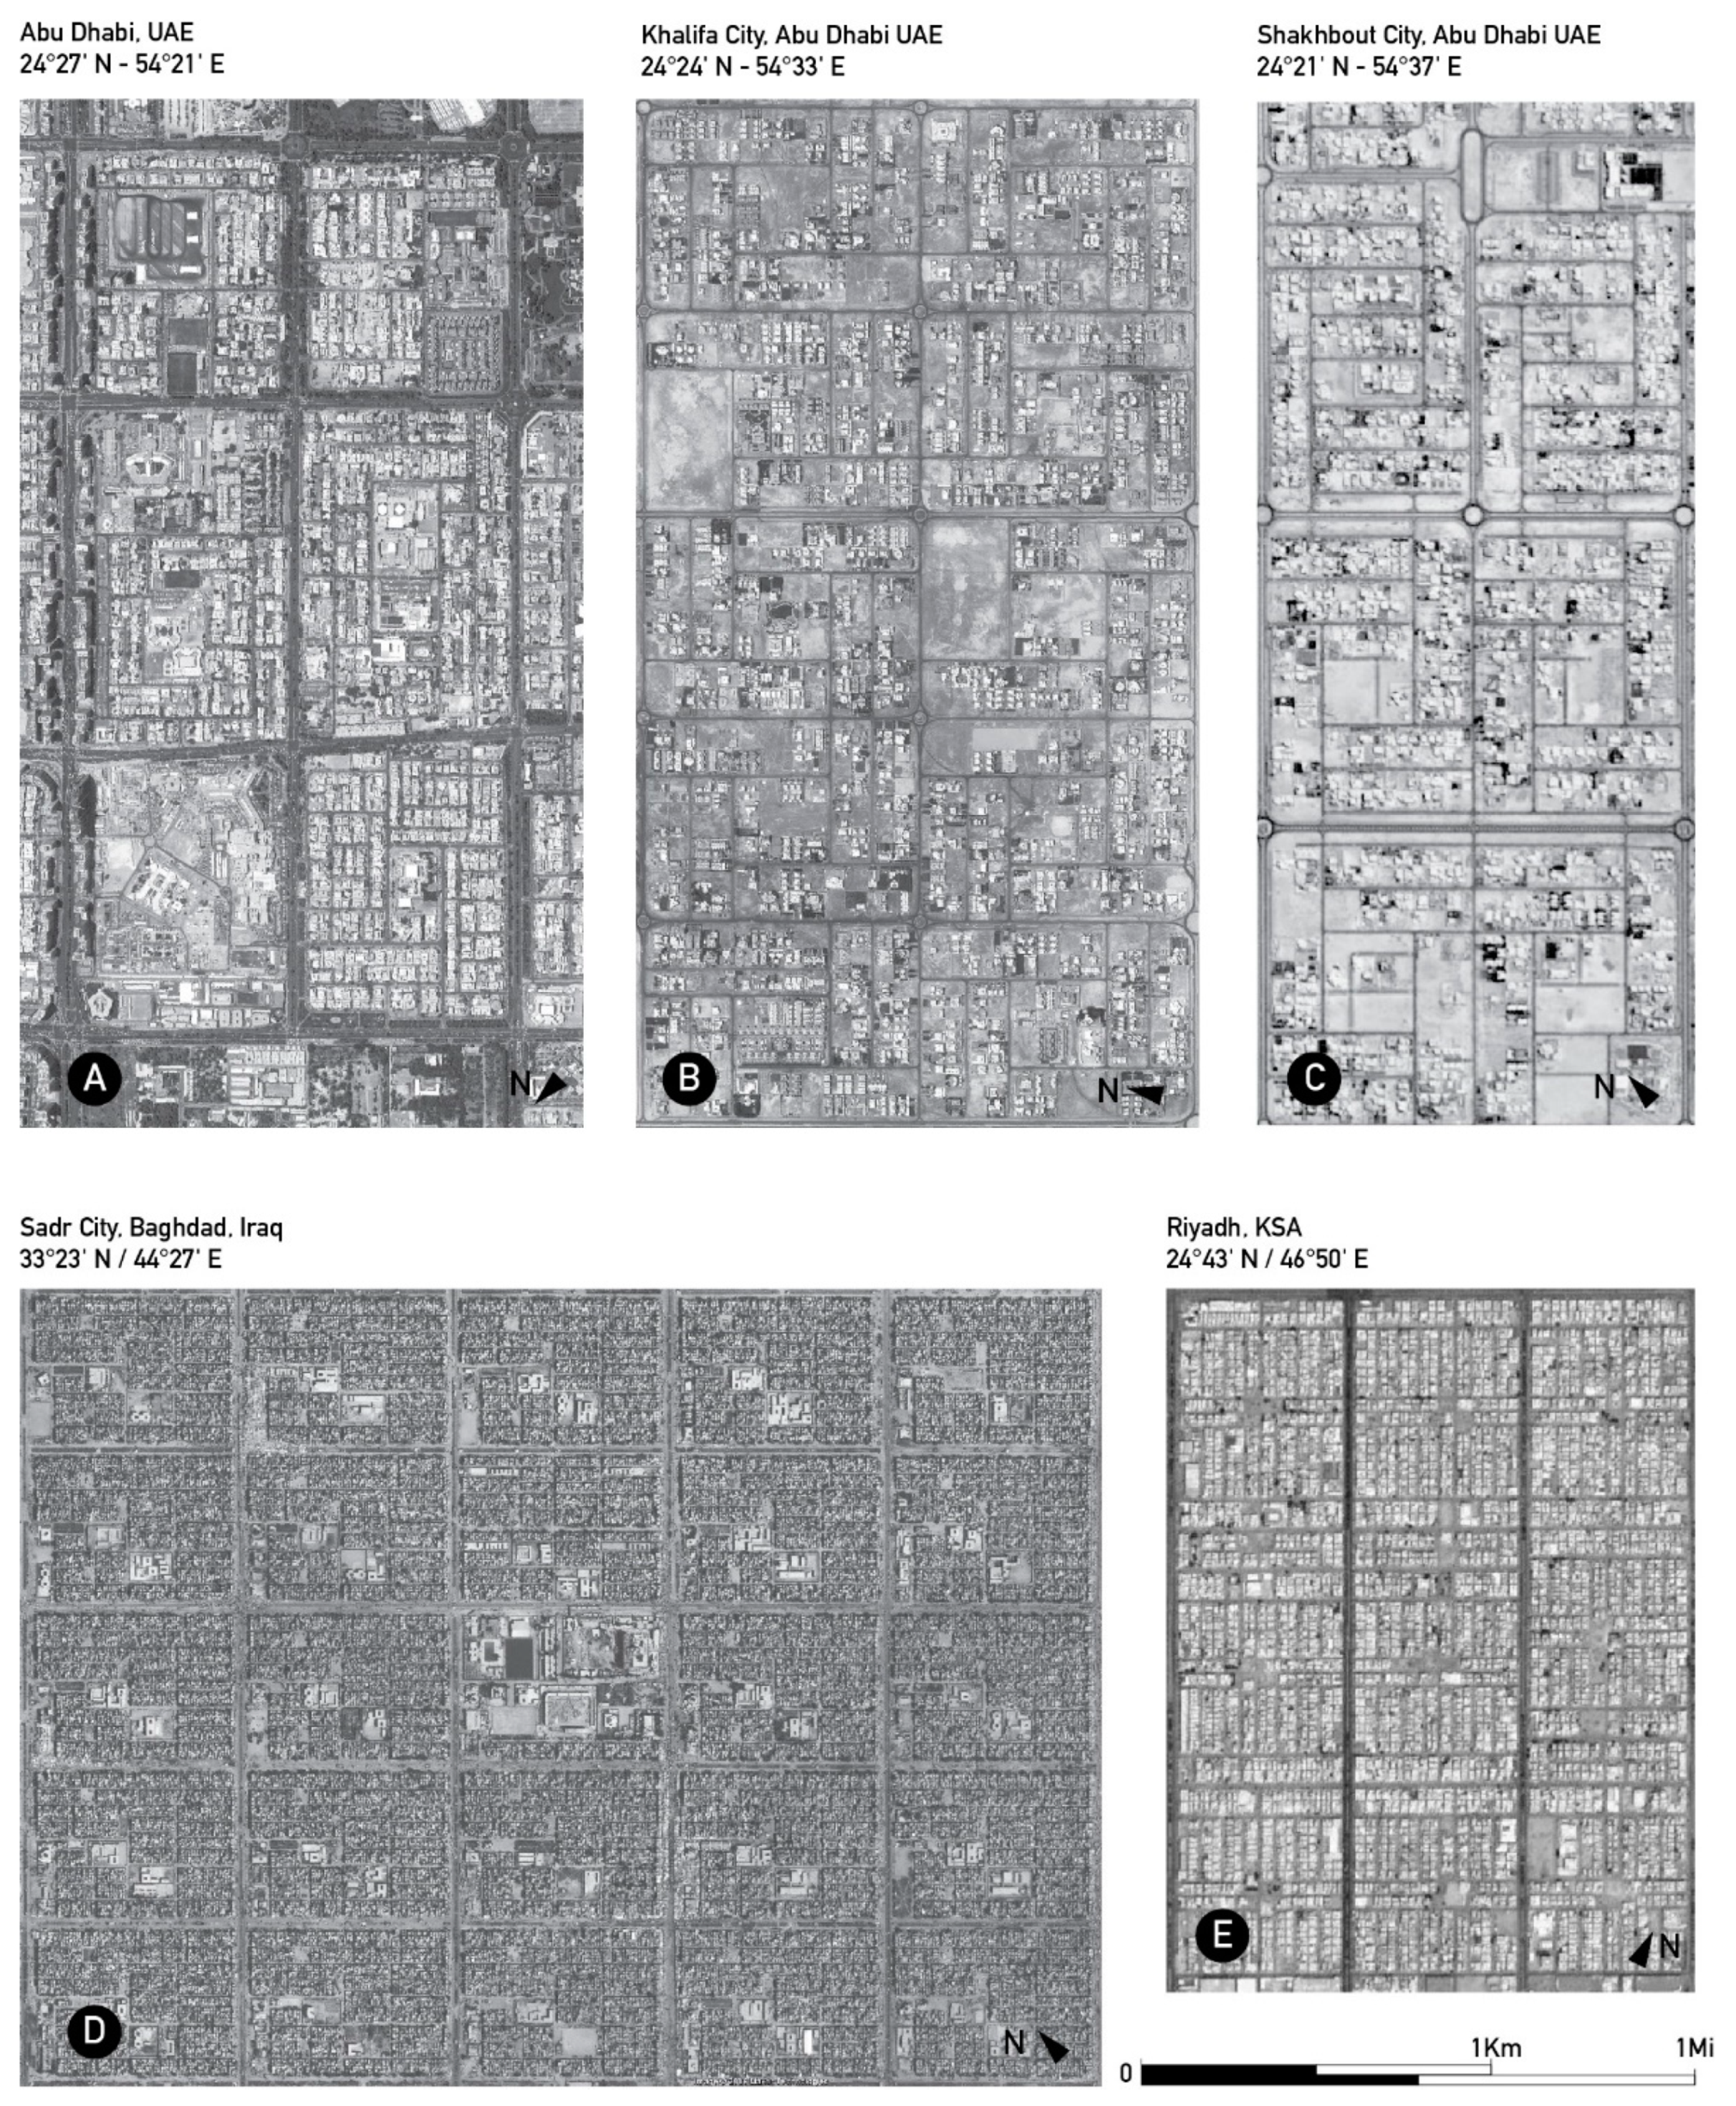
Superblocks can be initially and summarily described as large tracts of land bounded by arterial roads, whose land use planning is strongly connected to the Perry’s neighborhood planning unit concept [
20,
21,
22], and to planning the principles outlined by key figures of the modern movement in architecture [
23]. In the United Arab Emirates—and in Abu Dhabi in particular—superblocks are key to its urban development, as is the case in countries of the Gulf Council Cooperation (GCC), which includes Bahrain, Kuwait, Qatar, Oman, and Saudi Arabia. However, despite their widespread use, much remains to be understood regarding their connectivity properties.
This article addresses this research gap, focusing on understanding how different superblock network designs connect residents to one another, as well as to surrounding areas. More precisely, several metrics are applied to measure the connections between plots inside the superblocks, addressing their internal connectivity properties, as well as connections between plots and the superblocks corners—points from which to access surrounding areas—so addressing their external connectivity. In this latter case, this paper foregrounds the need to better understand how superblocks integrate with one another, acting as modules in a city building strategy and not as isolated communities.
Connectivity is examined using three metrics. These are distance, route directness, and a measure of route diversity. Using these metrics, three different but related questions about the internal and external connectivity of different superblocks network designs are addressed. First, how metrically close to one another are plots in the different designs studied, and how far are these plots from the superblocks’ corners? Second, and noting that not only distance, but also the availability of direct routes between origins and destinations affects pedestrian access [
24,
25,
26], the question is: how direct are the routes connecting residents of superblocks to one another, and to the superblock corners? Lastly, the third question asks: how many alternative routes, i.e., how much route diversity, is available to residents traversing the superblocks in search of internal destinations and corners? This last metric addresses the extent to which different networks provide alternative routes to pedestrians, allowing paths to mix and overlap, increasing the potential for social encounter and economic opportunity [
27].
When planners and designers are confronted with the decision of which network design to adopt, there is not much research that can support their decision-making process. Addressing, how long, how direct, and how diverse pedestrian routes are in different designs, as studied in this paper, provides information that could assist in the evaluation of design alternatives. With street forming being the long-term framework over which cities grow, and with streets taking a key role in supporting more sustainable transportation modes, these are seen as timely questions to address.
3. Materials and Methods
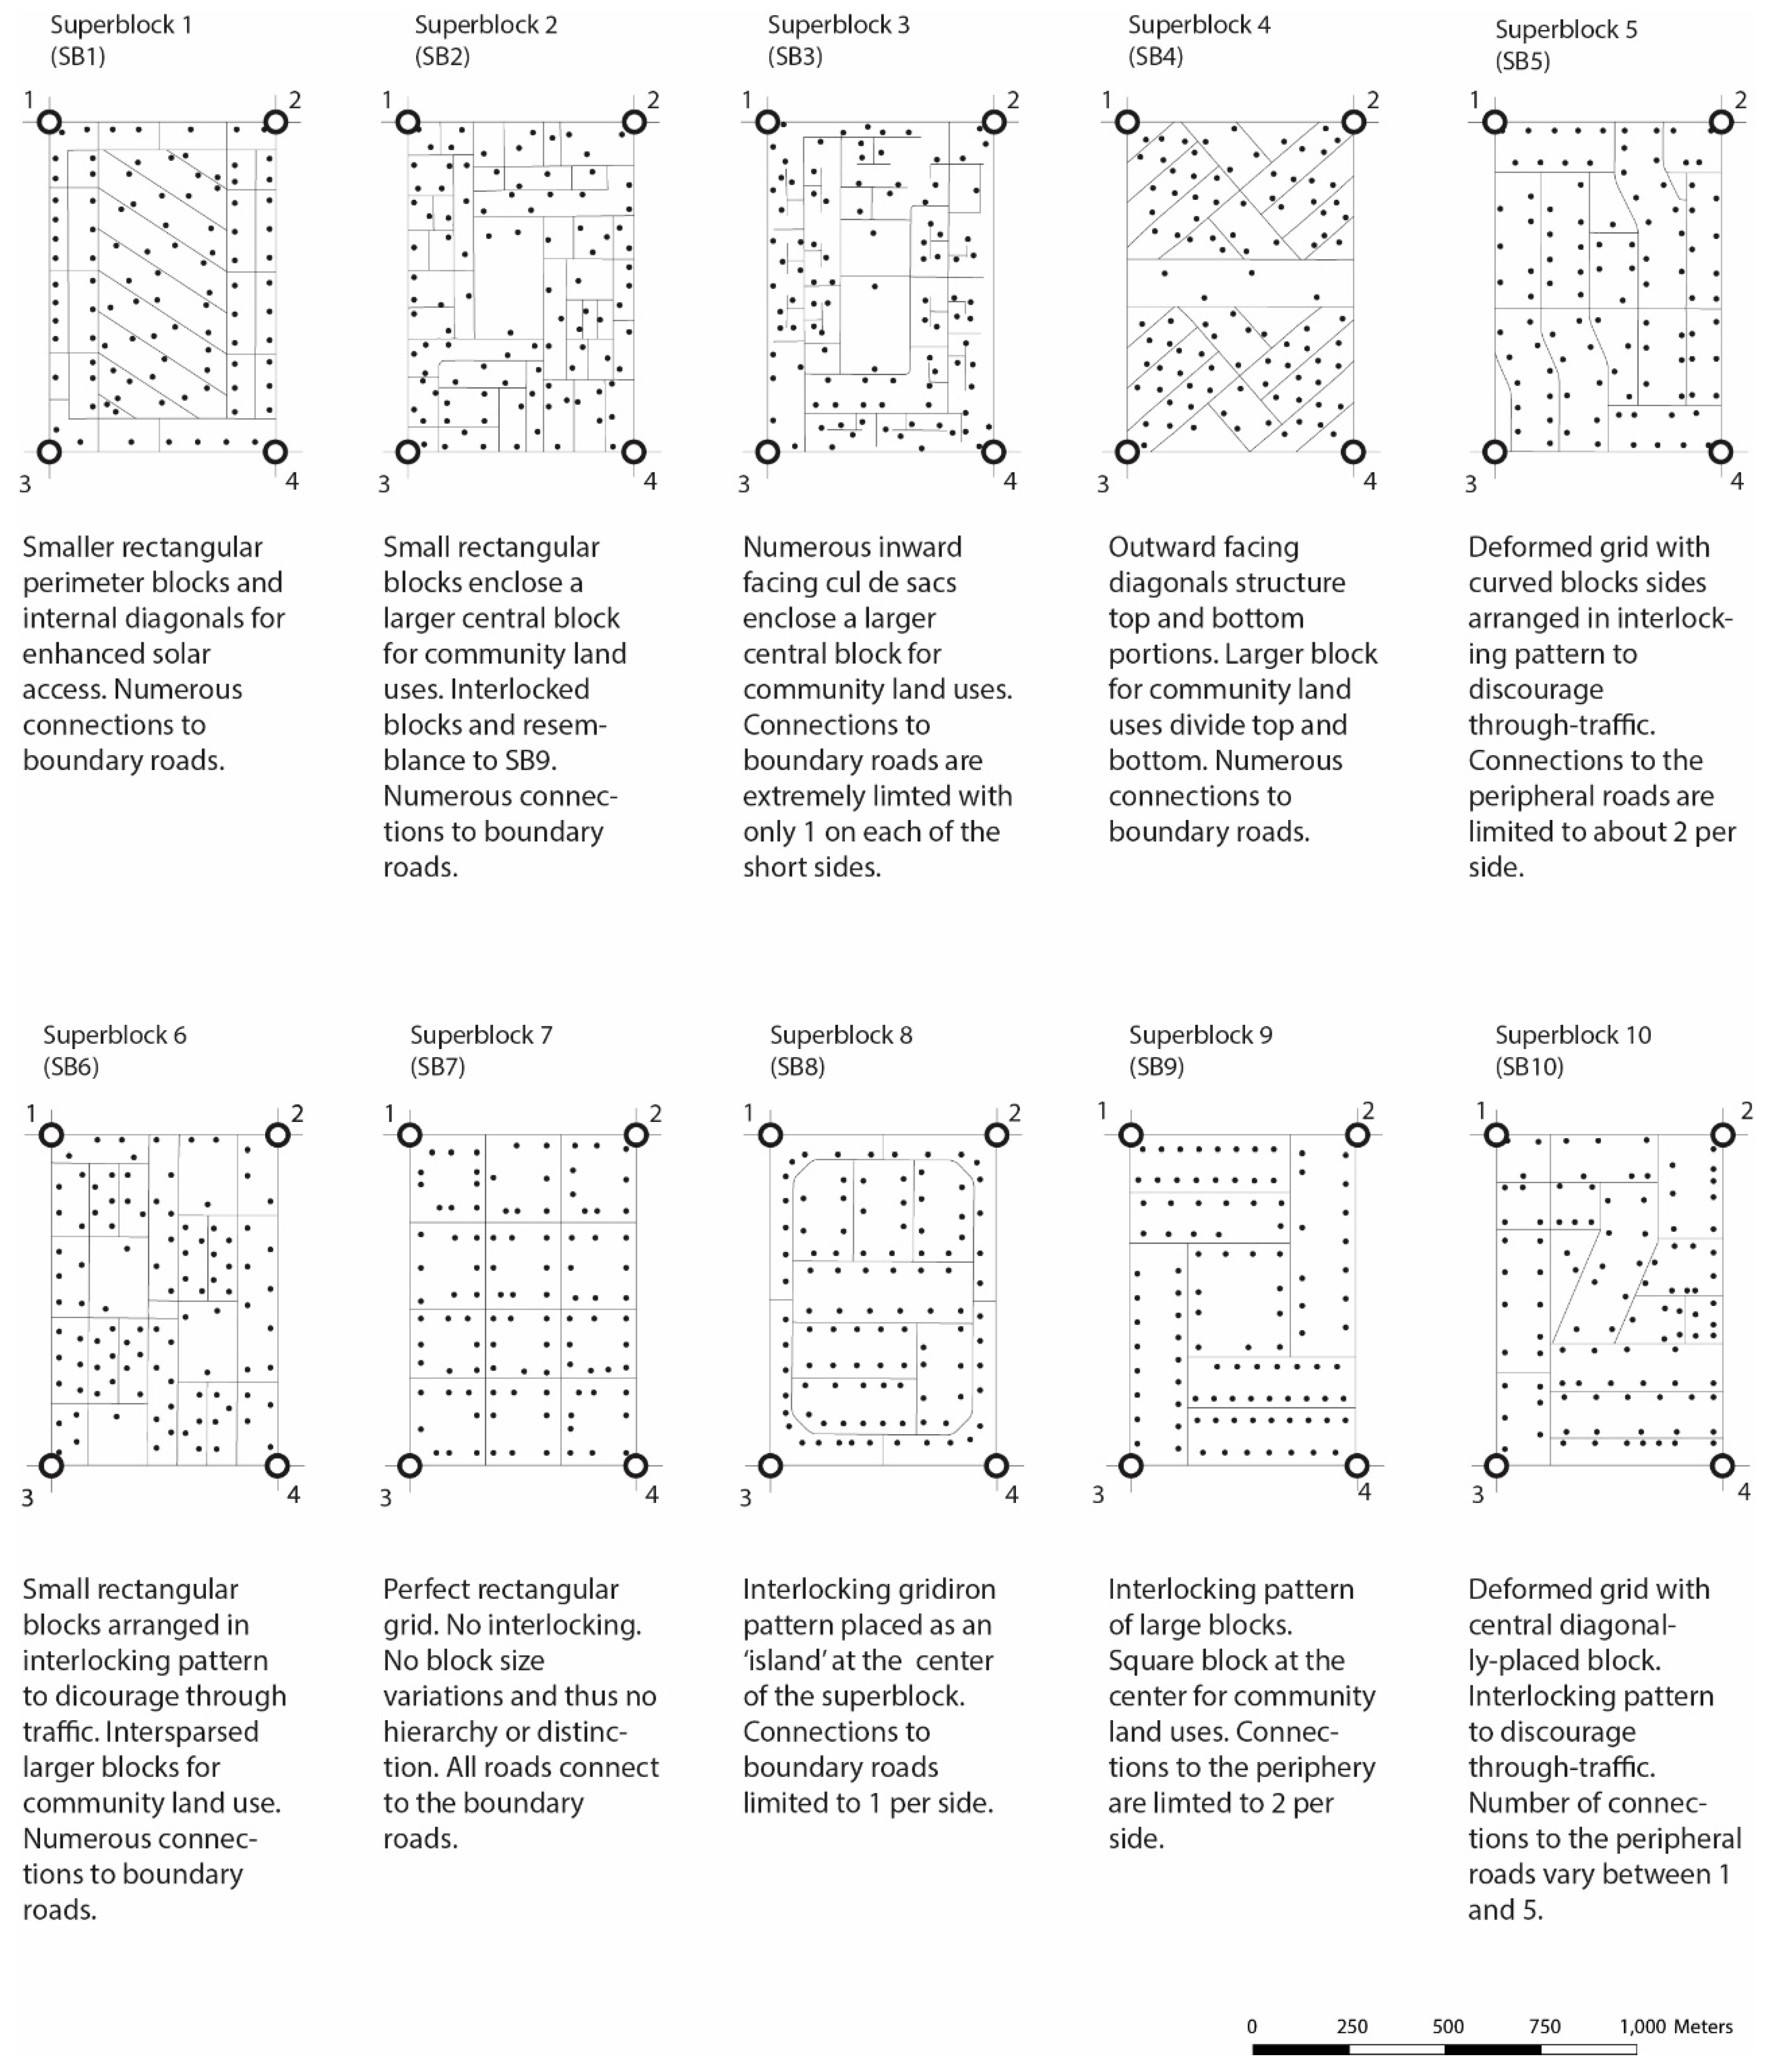
The analyses presented in this paper were conducted using standard representations of streets networks used in urban and transportation planning. That is, the superblocks’ street networks are represented and studied as sets of nodes and links, with nodes representing origins and/or destinations for trips, and links representing the street centerlines over which travel occurs. The ten street networks studied are presented in
Figure 2, along with a description of their general characteristics.
These networks were derived from real cases found in Abu Dhabi—often in its suburbs—and were slightly adjusted to make fair comparisons possible among them. Specifically, all designs were formatted to have the exact same size (860 m × 590 m), with dimensions that correspond to the average size of superblocks found in new neighborhood developments in this city. Further, non-orthogonal superblocks were squared, so to have parallel sides and boundary roads that meet at 90-degree angles. In sum, by controlling and removing shape distortions, and by keeping their sizes constant, network distances could be fairly measured and evaluated across the sample. In terms of origins and destinations, 100 plots were randomly distributed along the superblock streets. Keeping the origins and destinations constant permitted, as well, fair comparisons among the different networks studied, and simplifying of the interpretation of the results.
Lastly, the corners of the superblocks were also placed as nodes in the network, noting that, in most cases, these are key points from which it is possible to access the adjacent superblocks/neighborhoods. The analysis of how long, direct, and diverse the routes are to the corners complemented the analysis of the internal connectivity of the different designs in the sample.
Figure 2 shows how plots were distributed over the ten street networks’ designs studied while their general network and block subdivision characteristics are presented in
Table 1.
The data presented in
Table 1 provide important additional information regarding the designs studied. One of the main differences found between the different designs relates to the street length needed to structure each of them. Further variations across the different designs are found in terms of block lengths, the number and type of intersections, as well as the number of internal blocks that the street networks define. As expected, the bigger the road length, the smaller the blocks and the higher the number of intersections.
Table 1 shows that SB2 and SB9 tend to concentrate, respectively, most of the maxima and minima across the sample of studied designs. Interestingly, these two designs share some common traits, such as the large central block with T-intersections at its four corners. These two network designs show the extremes to which superblocks in Abu Dhabi are fractioned or aggregated. Values range from 43 blocks of 1.18 hectares on average in SB2, to 7 blocks of 7.24 hectares in SB9. Average block faces, on the other hand, vary from 73 to 262 m long, while intersections range from 80 to only 12, and a doubling of the road length in SB2 (11.7 km) when compared to SB9 (5.7 km). These extreme road length differences foreground that the costs involved in building and maintaining roads can vary quite substantially between different designs.
3.1. Addressing Internal and External Connectivity
With the superblock street networks built, the analyses focused on the ability of the different designs to perform two different but related tasks. These were, first, the ability to connect residents to one another, facilitating intra-neighborhood connectivity and pedestrian movement. In this sense, these analyses addressed the notion of superblocks as well-defined communities where destinations are accessible within a 5 min walk, as outlined in the original neighborhood planning unit (NPU) concept [
20]. The second task addressed the ability of the different designs to provide residents of the studied superblocks with access to adjacent areas. In this case, each plot was defined as an origin for trips, and the four corners of the superblock were set as the destinations. Corners are, in most cases, the locations where pedestrian infrastructure such as traffic lights and zebra crossings are found, thus supporting safe crossings into adjacent superblocks. In sum, the analyses conducted addressed both the internal or inter-plot connectivity, as well as the external or inter-block connectivity.
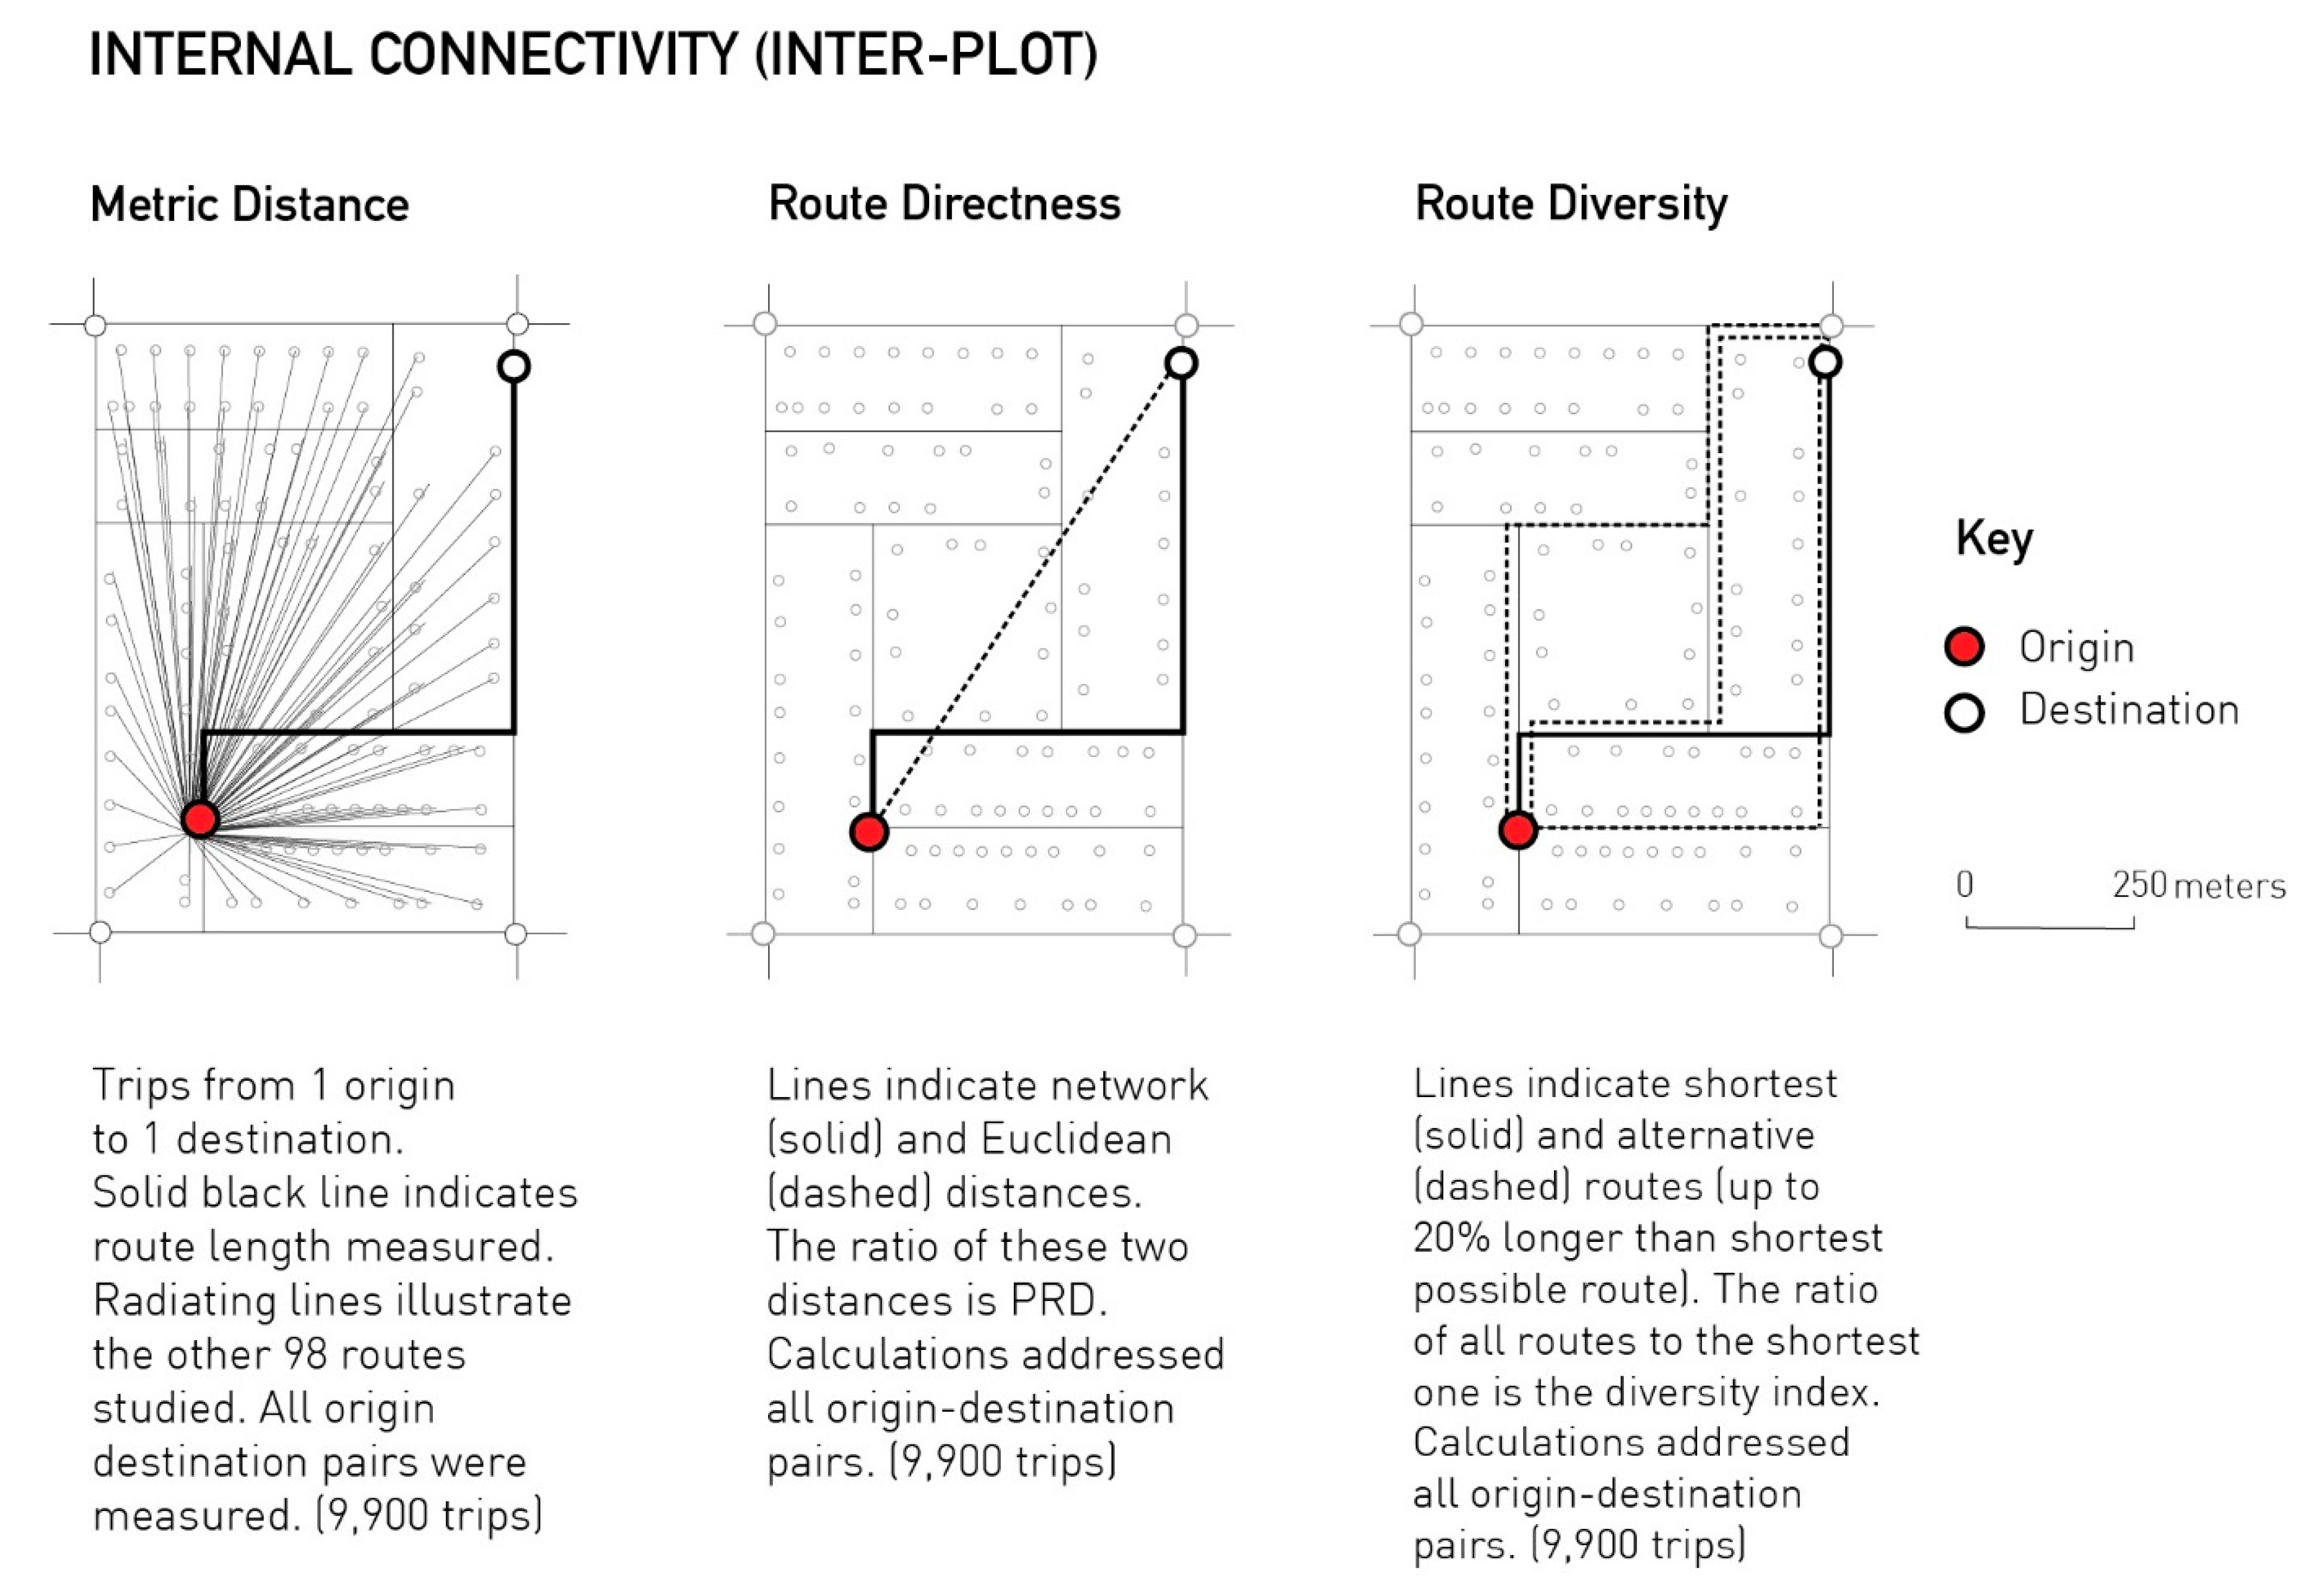
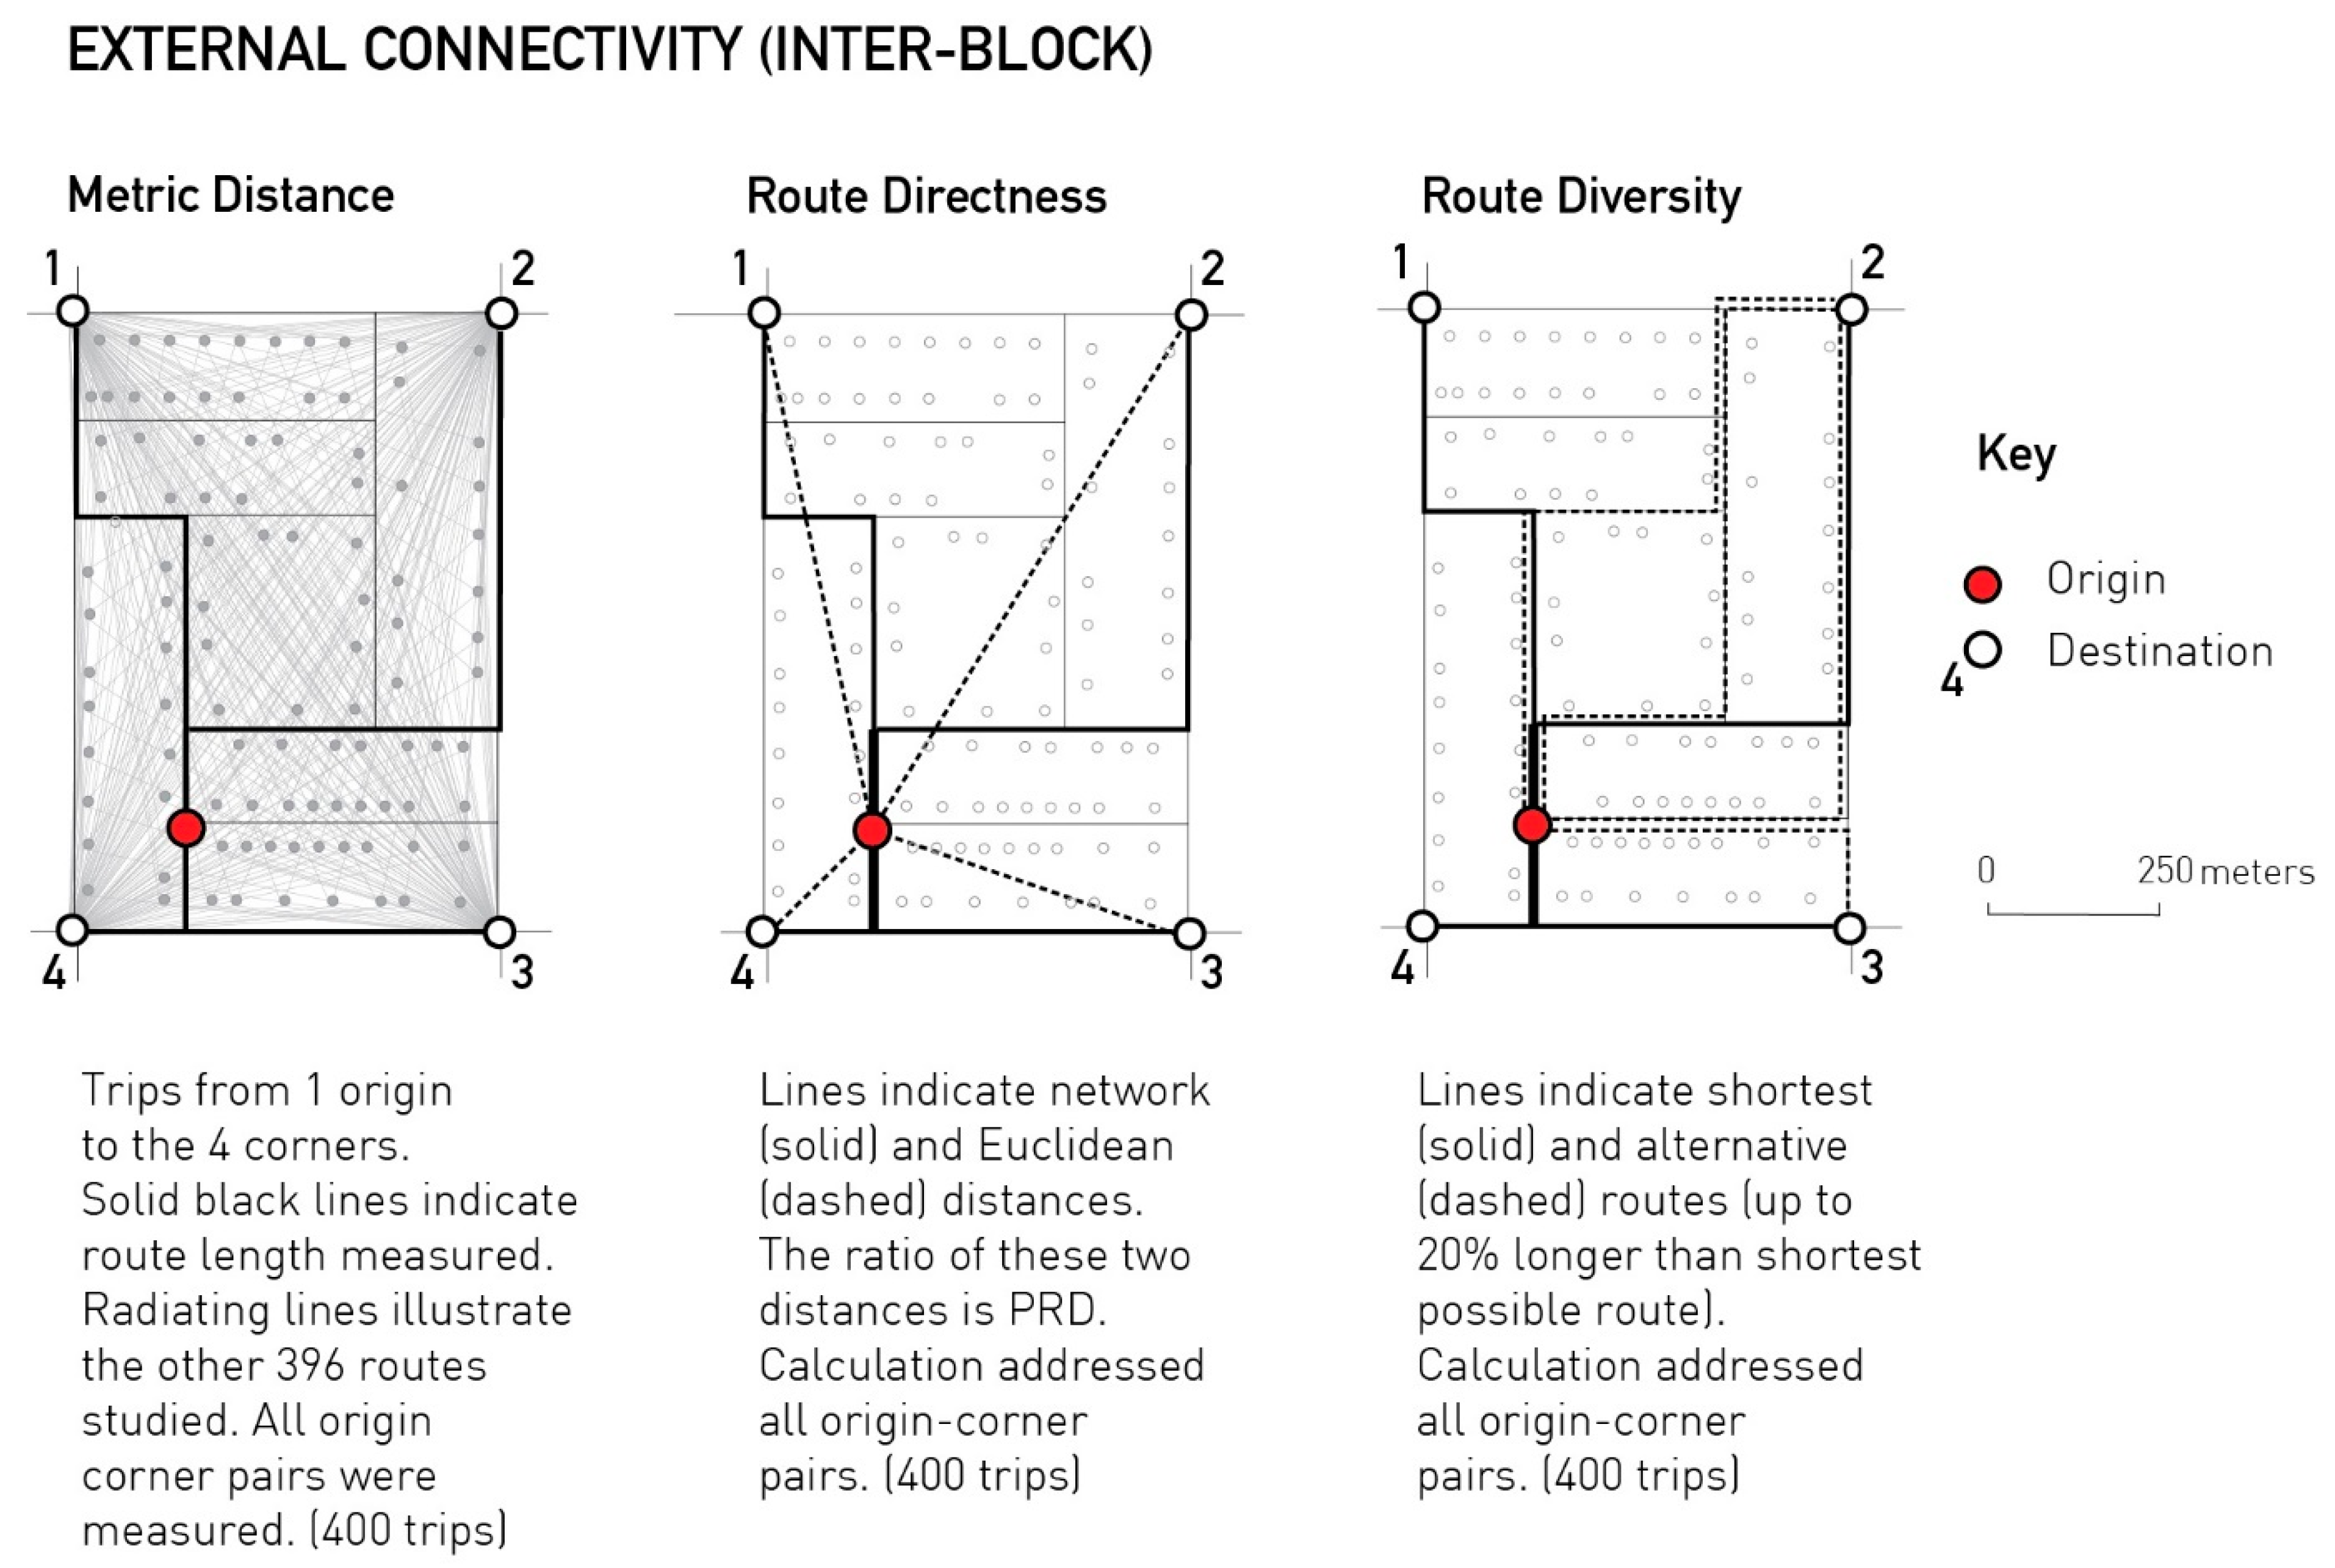
In terms of the analyses, intra-neighborhood connections were studied by measuring connectivity and routes between each individual plot and its 99 neighbors, a process that was repeated for each plot in each superblock, totaling 9900 trips once the all-plots-to-all-plots analyses were completed for a given design. External connectivity, the ability of residents to reach points from which they can cross into surrounding areas, was studied by setting all 100 plots in the superblocks as origins for trips and measuring the characteristics of the routes connecting the plots to the four corners, i.e., the destinations. As the analyses were completed, each plot completed a total of four trips, one to each corner, so a total of 400 trips to the corners were analyzed in each superblock design.
3.2. Measuring Distance, Directess, and Diversity
The internal and external connectivity of the ten network designs was quantified using three different metrics. The first focused on a key, though often overlooked, metric in street network analyses: distance. Specifically, the analysis of travel distances was conducted using ESRI’s ArcMap Network Analyst, recording the shortest trip lengths between origins and destinations. Using this software’s origin-destination (OD) cost matrix, calculations were performed using a proprietary multiple-origin, multiple-destination algorithm based on Dijkstra’s [
51] shortest path algorithm. These analyses answer the question of how far apart from each other are, on average, the plots in each of the studied designs. Further, graphic details about the calculation of this metric are presented in
Figure 3 and
Figure 4, while Equation (1) below shows a formal definition of this metric.
where
is the shortest network distance
from origin plot
to all destinations
, with
being plots or corners depending on whether the analyses are of internal or external connectivity, and
is the total number of destinations reached.
The second metric focused on the efficiency by which each of the studied networks connects the origins and destinations sets. The metric used in this case was pedestrian route directness, or PRD, and was also calculated using ArcMaps’s Network Analyst. In this case, the shortest network routes obtained in the previous analyses were divided by the length of straight lines that connect origins and destinations. Used frequently in sustainable planning regulatory instruments, such as Abu Dhabi’s own Estidama Sustainability Rating System [
52], this ratio is easy to calculate and interpret indicating, as a percentage, how much longer than the shortest possible route is the actual travel distance. A formal definition is introduced in Equation (2), while a graphic representation of this metric is introduced in
Figure 3 and
Figure 4.
where
is the directness value of origin plot
is the shortest network distance from origin plot
to all destinations
, with
being plots or corners depending on whether the analyses are of internal or external connectivity;
is the Euclidean or crow-fly distance from origin plot
to all destinations
, and
is the total number of destinations reached.
Once calculated, the PRD results obtained for each plot and in each design were evaluated using a PRD test [
12,
17,
50,
53,
54]. This test permits the quantification of the efficiency of the studied designs by identifying the number (or percentage) of plots that have values above or below a given threshold number. Previous studies have set this threshold at 1.6, while a value of 1.5 has been outlined in the connectivity guidelines of Abu Dhabi’s Estidama [
55]. Considering this, the two thresholds were studied and the total number of plots that meet these thresholds were reported and interpreted.
Lastly, an additional metric was computed to evaluate route diversity in the different superblock designs. This property of the networks was addressed using the urban network analysis (UNA) toolbox’s redundancy index [
56,
57]. This index considers that while a single shortest route connects an origin and a destination, additional longer routes could also be considered as viable alternatives to gain a better understanding of the potential offered by urban street layouts. In setting up the analysis of redundancy, a detour ratio needed to be established. This value is used to determine the extra length that is permitted to be travelled between an origin and a destination. A detour ratio of 20%, as used in this study, considered that routes that are up to 20% longer than the shortest one are valid options, and their lengths were thus measured.
A mathematical formulation of the redundancy index, based on the results of the empirical testing of the metric is presented in Equation (3).
where
denotes the redundacy index between an origin
and a destination
;
is the shortest path connecting
and
; and
is the length of paths connecting
and
. In this paper, this sum is restricted to paths that obey this condition:
in
. This index thus, expresses the diversity of paths as a ratio between all available paths within a 20% detour distance, and the shortest path. A value of 2, for example, would indicate a doubling of the shortest route experience, while a value of 1 would indicate that no alternative routes are available.
Figure 3 and
Figure 4, show a graphic representation of this metric for the internal and external connectivity cases.
The results of the redundancy calculations are, in this paper, interpreted and discussed in terms of the diversity of routes provided by each design. This interpretation is preferred, given that the notion of redundancy in traffic analysis and infrastructure system management, is linked not only to route availability, but also spare capacity [
58,
59]. Considering that spare and carrying capacities are not a concern of this study, and that the metric authors foreground route choice as a valued quality of urban environments in terms of the everyday experiences they provide [
60], the use of diversity is thus preferred.
Further, a valuable theoretical basis for the need to address route diversity in urban networks can be found in Jane Jacobs’s discussion of the need for small blocks in cities [
27]. The insightful discussion presented in this chapter highlights the ills of “self-isolating streets” and the “long sterile promenades” that are characteristic of superblock projects. Smaller blocks and denser road networks, in contrast, are discussed as key elements that bring life and vibrancy to the city streets. As blocks get smaller, route alternatives increase, along with the opportunity for city dwellers to mix their paths. In addition, the potential number of users of any given street would also increase, providing businesses a larger pool of potential customers. Measuring route diversity, thus, could provide insights regarding the potential for social interaction, as well as economic opportunity, that each street network provides.
4. Results
4.1. Addressing Trip Length and Metric Properties of the Routes
Measuring travel distance from each plot to all its neighboring plots in the superblock provided answers to two key questions. First, how far from one another do plots tend to be in the different designs studied? Second, and perhaps more importantly, are there significant variations in travel distances between plots in the different network designs studied?
The results presented in
Table 2 indicate that even though network designs are substantially different, plots tend to be, on average, within 576.47 m from one another (SD = 102.71). Within the sample, superblock design 7 (SB7), the perfect orthogonal grid, provides for the closest average proximity between neighbors with inter-plot trips distances averaging 502 m.
On the other hand, in superblock design 3 (SB3), a largely introverted network design with many cul-de-sacs, inter-plot trips average 716 m. Following SB3, the next highest inter-plot distances are found in network designs SB9 and SB4, while the remaining superblocks’ average distances are below 600 m. Maximum trip lengths tend to stay relatively constant, and in the 700 m range, except for SB3 at 1140 m. These maximum distances describe the distances from the worst located plot in each of the studied superblocks. At the other end, minimum trip lengths show more variability, although SB3 still features the longest inter-plot distances with 533 m, about 40% longer that the minimum trip lengths provided by SB7 and SB6. In other words, the best located plot in SB3 is located 533 m away from all other plots, while the best located plots in SB7 and SB6 are, respectively, 373 and 376 m away from all other plots.
The second step addressed external connectivity, by checking how metrically far away are the superblock corners from each plot in the sample of superblocks. In this case, the results are quite striking. The values of trips to the corners of seven out of 10 superblocks designs indicate that their networks provide access to the corners within a narrow band of values ranging from 713 to 724 m. The exception cases are designs SB3, SB4, and SB8. In the case of design SB4, this has the lowest values in the sample, a likely product of the diagonals that characterize the outward oriented design of this superblock. These diagonals effectively connect the plots to the corners, reducing the overall travel distances and resulting in this being the only design with values below 700 m. At the other end, the highest values are found in SB3, already noted as the most introverted design in the sample, and in SB8 which also features an introverted street design pattern. Lastly, it is worth noting that the standard deviation of the length of trips to the corners shows several cases with values under 1 m.
4.2. Addressing Route Efficiency and Directness Properties of the Routes
Route efficiency was addressed by following the PRD test method, as earlier described. The tests were conducted using the two established thresholds, thus also evaluating the sensibility of the test. Once again, internal and external connectivity were tested, and the results are presented in
Table 3. In the case of internal connectivity, the tested thresholds indicate that there exist variations in the efficiency of the routes connecting plots to one another depending on the network design. Extreme cases are SB3 and SB7, showcasing, respectively, the lowest and highest numbers of plots passing the test, regardless of the threshold used. More precisely, all plots pass the test—irrespective of the threshold used—in the case of SB7, while only a single plot passes the test in SB3 when the more demanding threshold is used. When the threshold is relaxed, only eight plots pass the test in SB3. The remaining cases vary, with SB9 performing quite low in both tests, followed by SB4. The remaining cases oscillate between 40 and 60 plots passing when the threshold of 1.5 is used, and above 70 in all cases when the 1.6 threshold is used. These results indicate that in contrast to the relatively homogeneous performances observed when studying metric distances, different superblock designs provide quite extreme differences in terms of the route efficiencies enjoyed by their occupants. They also show that the choice of threshold could affect the interpretation of results.
When studying the connectivity of plots to the corners, thus addressing the possibility of crossing over to surrounding areas, most superblock designs perform quite well, with all plots meeting the limits of the two thresholds tested. The exceptions are SB3 and SB8, characteristically introverted designs where the connection of the internal network to the peripheral roads (and thus the corners) occurs at only a few locations. It is only in these two cases that the average value of PRD exceeds 1.3, and the only two cases where the number of plots passing the PRD test is less than the totality. It is worth noting that PRD values approximating 1.3 are characteristic of regular grids, that is, orthogonal grids where roads tend to intersect at 90-degree angles.
4.3. Addressing Route Diversity
The last series of analyses involved the measurement of route diversity. As in the previous two sets of analyses, internal and external connections were evaluated. The results, presented in
Table 4, indicate that there are wide variations in terms of what different designs can offer, if the study of connectivity between origin–destination pairs is relaxed to include routes that are up to—in this paper’s case—20% longer than the shortest possible ones. The results indicate that plots in SB2 can access neighboring plots with an exposure of up to 3.25 times the length of the shortest path. At the lower end, SB9 provides a much more limited experience and range of opportunities for route alternatives, with only 1.58 times the length of the shortest path accessible, if up to 20% longer routes are allowed when connecting origins and destinations. Across the ten design samples, five designs show diversity index values below two, indicating that in all these cases, the potential for alternative route building exists, although it does not reach a doubling of what is provided by the shortest route. Four cases show that the shortest route length is at least doubled, while a high tripling of values is only found in one case, the previously discussed SB2.
When looking at access to the superblock corners, there are similar variations, although route diversity numbers tend to be larger across the sample and only two cases, SB8 and SB9, show values below 2. When considering the diversity of routes to the corners, the results indicate that most designs offer alternative routes adding up to two-and-a-half times, or more, the length of the shortest possible one.
4.4. Network Properties and Block Subdivision Characteristics in Relation to Connectivity
With the results of the three sets of analyses completed it is now possible to outline observations that link these connectivity analyses to the general characteristics of the network designs. A summary of the analyses performed is presented to
Table 5. In the first columns, the network design characteristics show that the length of the road systems varies quite substantially across the sample. Expectedly, and as earlier noted, this network length increase is associated with a higher number of intersections, and a higher number of blocks, and consequently smaller blocks with shorter faces. Following these columns, the results of the internal and external connectivity analyses are reintroduced.
Table 5 gives a comprehensive overview of the characteristics and performance of each of the designs studied.
It is worth reviewing
Table 5 and noting the large differences in the length, and consequently in the building costs, that characterize these different networks. The lengths of streets in the studied networks vary from slightly more than 11 km in SB 1, 2, and 3 to about almost exactly half of that length in SB9’s 5.7 km. The remaining designs fill the middle ground in terms of total roads’ lengths.
Table 5 serves as a comprehensive reference capturing the network characteristics and connectivity properties of all the studied designs. However, the relationship between differences in road length, intersections, and block sizes, and the results of the distance, directness, and diversity analyses, can be more clearly understood by studying their correlation. These are presented in
Table 6.
The analyses indicate that road lengths, intersections, and block sizes are only significantly associated to internal and/or external route diversity values. More precisely, correlations are strong and positive in the case of road lengths and, particularly, intersections. As expected, correlations between internal and external route diversity and block size are negative, foregrounding how route diversity increases as blocks get smaller. Distances between plots, and plots and corners are in all cases weak and not significant. Lastly, average values of PRD are also found to be weakly associated to road length, intersections, and block sizes.
5. Discussion
Ten superblock designs were tested to better understand their internal and external connectivity characteristics. In the case of internal connectivity analyses, the focus was placed on their ability to support connections between residents of the superblocks. These analyses thus examined how different designs support the formation of well-connected and walkable communities which could, in turn, support the formation of vibrant neighborhood life. Further analyses concentrated on accessing the corners of the superblocks, addressing the ease with which residents of superblocks could, by foot, cross over to and access adjacent areas. In doing this, external connectivity analyses addressed the need to consider superblocks as modules of a city building strategy and not as isolated units.
Results of the analyses indicate, first, that trips within the ten superblocks network designs studied tend to remain within walkable distances. Regardless of the design adopted, the average distance from a plot to its neighbors was found to be, in most cases, within a 500 to 600 m range. When trips to the corners, so the possibility of reaching surrounding areas, are considered, the results show that corners are located at walkable, and quite constant, average distances from the plots. In this case, at approximately 720 m. Several observations can be derived from these results.
The first is that superblocks—in this paper sized to approximate average sizes found in Abu Dhabi—provide for walkable distances, especially when considering the standard 5 and 10-min walking ranges used in transportation studies [
61] and present in the original NPU concept [
20]. These distances correspond to quarter and half mile radii, or 400 and 800 m, respectively. However, the most notable finding is that this relatively constant distribution of trips’ distances, for internally and externally oriented trips, is obtained with widely different road network designs. Designs that have, as well, widely different road lengths. These results highlight that the extension of the road networks does not significantly affect the length of trips that connect superblocks’ residents to one another. Further, network designs have no significant effect on the length of trips linking residents to the corners, the points from which they can access surrounding areas.
The study of directness complemented the results of the metric distance analyses, highlighting the role that the network design has on trip efficiency. The results indicate, first, that internal connectivity efficiency can vary quite substantially depending on the network design used. In this case, two PRD test thresholds were evaluated, and the results indicate that the different networks provide differently in terms of the directness with which other plots could be accessed. First, it was found that the perfect grid (SB7) is the most efficient street system of all those studied, with all plots passing the test regardless of the threshold used. Second, SBs 1, 2, 5, 6, and 8, were found to have about 50% of their plots passing the test when the more demanding threshold was used. These values logically increased as the threshold was slightly relaxed. Lastly, superblocks SB3, 4, and 9, were the worst performing ones, with values below 50 regardless of the threshold used. When analyzing the efficiency of trips to the corners, most designs performed remarkably well (all plots passed the tests) except for SB3 and SB8.
The analysis of directness also allows for several important observations. First, the results indicate that routes between plots and the corners tend to be quite efficient. Except for cases where internal roads have limited connections to the boundary arterials—SB3 and SB8—plots can reach corners with direct routes. It is also clear that the efficiency of routes to the corners is not affected by the two thresholds tested. Lastly, and importantly, designs that have widely different road lengths, tend to provide highly efficient routes to the corners. Internal connectivity efficiency, on the other hand, presents a more complex scenario. In the first place, there exist substantial variations in the efficiency of the routes between plots, touching on extremes: note SB3 and SB7. Secondly, results were found to be sensitive to threshold variations. Still, designs with different road lengths provide substantially different internal trips efficiencies. For example, SB9, one of the worst performing cases in terms of internal connectivity efficiency, performs better than SB3 and SB4, designs with almost double the street length. In another key example, all the plots of the regular grid of SB7, one of the shortest networks, reach all other plots with PRD values below the two thresholds studied.
Finally, the study of the route diversity, based on the measurement of redundancy, shows that the richness of routes and potential for path overlap and open-ended exploration offered by the different designs can be markedly different. From the dearth of alternatives offered by SB9, to the richness of paths offered by the dense grid of SB2. Trips connecting plots to one another, as well as trips to the corners, tend to be more diverse as the availability of streets, as described by the length of the street network, increases.
While based on a sample of ideal conditions, and in need of validation with real cases, these results provide insightful information for neighborhood planning and design, as well as decision making. More specifically, the results indicate that when confronted with the decision to adopt one design over another, distances between plots and between plots and corners, tend to remain within walkable ranges in all the designs studied. If trip distances were the only walkability criteria applied for selecting a particular design, decisions could gravitate towards the costs associated to road building, knowing that access would not be compromised. The same criteria could be adopted in the case of the efficiency of routes to the corners. Knowing that most designs provide efficient access to the corners, the decision making could also be tied to the costs associated with road building. Still, the results indicate that internal connectivity efficiency can vary quite substantially and that test thresholds, road lengths, and importantly the design of the network play key roles in the efficiency of internal trips. In this case, more research is needed to provide reliable conclusions.
Lastly, the diversity of routes offered, as measured by the redundancy index, is the only factor directly and significantly associated with the road lengths of the studied designs. This is the case both in terms of internal connections, and in terms of connections between plots and the superblock corners. While this is, in retrospect, an expected result, the fact that it was quantified and associated to specific network designs makes the study of route diversity in superblocks particularly rewarding. It provides a simple and interpretable quantitative means to evaluate the potential for route-building of each network.
As research on superblocks continues, questions regarding the maximization of desirable characteristics for superblock networks, such as increased route diversity, proximity, and efficiency, while minimizing the costs of road building, are expected to be addressed. However, the results of this paper contribute, at this point, to enlarge recent research on superblocks’ street networks by including metrics that were not previously discussed, applied, or investigated. Indeed, while syntactic properties of superblocks were recently studied [
16,
19], and so were route directness, walking sheds, and betweenness centrality [
17,
18], the evaluation of route distance and diversity add new information to the ongoing research on superblocks. Further, current discussions about the use of superblocks in Chinese cities [
62], as well as the study of the adaptation of Cerda’s plan in Barcelona to accommodate sustainable mobility modes by aggregating several blocks into superblocks [
63,
64], highlight the ongoing need to better understand superblocks as a well-established urban planning strategy. The study of Middle Eastern cities’ superblocks and their connectivity contributes to this global discussion.
In closing, it should finally be noted that the methods and results presented in this paper could already inform planning practice. More specifically, decisions regarding which design to adopt could be more sharply addressed by considering their connectivity and walkability, as well as the costs associated with their construction. Further, the metrics and methods used in this study could be easily replicated as they were performed using standard planning software, such as geographic information systems (GIS) and computer aided design (CAD) systems.
6. Conclusions
Cities in the United Arab Emirates, as well as numerous other cities in the Gulf Cooperation Council (GCC), adopted superblocks as the backbone of their urban development strategy. Built and planned following modernist principles and in a context of increased motorization, they provided a solution to the fast-paced urbanization needs that these cities faced. In Abu Dhabi, superblocks have historically supported the city’s growth and expansion and, notably, they continue to do so today. This is particularly the case in the city suburbs, which are often built through the aggregation of numerous identical superblocks. However, the current and pressing need to reduce energy consumption and greenhouse gas emissions, along with renewed notions about the role that urban form plays in building more sustainable cities, calls for a re-examination of this enduring approach to urban planning and development.
This paper contributed to this task by looking at the connectivity of superblocks’ street networks and their ability to accommodate walking trips. Findings indicate that distances are walkable, and routes often direct—particularly to corners—in all the studied designs. In contrast, the availability of alternative paths differed across the sample, and was found to be linked to the total road length of the different street systems. If cost minimization prevails in the decision-making process, network designs with the least amount of streets could be favored when planning new neighborhoods. Walking distances and directness would not be greatly affected if this alternative is preferred. A more involved cost–benefit approach, on the other hand, would be appropriate if path diversity is considered. In this latter case, the benefits could be associated to the concepts quite sharply outlined, long ago, by Jane Jacobs, such as the fluidity of use and the mixing of paths that dense street networks with small blocks support.
Clearly, it is not through street network design alone that vibrant streets and walkable communities and cities are shaped. Key urban form variables, such as density and land use diversity and mix, would also need to be carefully evaluated when planning cities where walking, and eventually cycling, are viable transportation options. Cultural and climatic factors should, as well, be carefully considered. However, despite the noted challenges, it is worth noting that Abu Dhabi’s community planning guidelines, as well as its sustainability rating framework Estidama, currently call for a transition towards more livable communities where walking, cycling, and public transportation use are supported by well-connected street networks [
52,
65,
66]. The results of this paper are thus expected to contribute to both research and practice on walkability and sustainable mobility, in Abu Dhabi in particular, and in superblock-planned cities in general.


