1. Introduction
The evolution of the urban environment through dynamic processes of innovation contributes to the transformation of the original territorial dimension of a city. From an economic-estimative point of view, it is possible to identify—and monitor—the impact of these changes by observing variations in the real estate market.
Changes to the structure of the city [
1], the introduction of new infrastructures or facilities in an urban area or further variations to the urban fabric resulting from political-administrative decisions [
2,
3] and/or spatial management are all factors with a positive or negative influence on the formation of real estate prices [
4]. They can also modify the functional aspects of spaces and, as a reflection, the quality of life for residents.
Dynamic conditions and the need for administrations to produce development plans [
5] and adopt approaches that confirm changes taking place return the city to the centre of debate: to understand the scarcity and abundance of the characteristics of which the urban environment is a global expression in order to select and implement appropriate strategies for pursuing a sustainable increase in urban quality [
6].
Typical problems of large cities such as the degradation of neighbourhoods, the increase in road traffic, socio-economic deprivation, physical and mental health inequalities, have become central political issues in most EU countries. This is reflected in the local environmental quality and European and governmental strategies of individual states with respect to housing, spatial planning and national and local environmental policies [6].
Consequently, every decision taken within the urban environment has the ability to increase or diminish the value—qualitative and economic—of the environment with which it interacts, with further considerations of the fact that interventions involving settlements, or the conservation of urban natural elements, are not always associated with economic benefits [
7]. The entity of their value can be quantified by studying the variation in property values situated in proximity to interventions (land value recapture), and this includes the work of architecture, improvement in services, creation of public space or rehabilitation of environmental resources.
The case study is located in the Abruzzo region, where the inland areas are affected by demographic decline exacerbated by the consequences of the 2009 earthquake. While this has resulted in a stagnation of real estate values [
8], coastal areas—where the city of Pescara is located—have a much more dynamic real estate market. As with indicators that, on a large scale, make it possible to
detect changes in land use to allow for the implementation of appropriate control and planning actions [
9], the intention, for the Pescara real estate market, was to create an articulated variable at the urban level—the Urban Quality Index—that considers a series of peculiarities of the urbanised environment and the sum of services innervating it in relation to market real estate values [
10,
11]. The principal challenge involved retracing and surveying measurable physical and univocally interpretable aspects within the urban environment and verifying their statistical significance—market appreciation—by using a multiple linear regression model. As is known, multiple regression is used to explain the entity of a dependent variable (in our case market value) by using a set of independent variables clearly held to influence the entity of the dependent variable [
12]. Despite their relevant incidence, these independent variables—the characteristics of the city—can be very difficult to identify.
The concept of urban quality was, thus, defined in relation to the appreciation manifested by the real estate market for property location and using a unique variable to define different levels of quality in diverse parts of the city.
The effects of social, economic and cultural dynamics that, certainly,
play a decisive role in the decision-making processes on urban strategies [
13] and the indicators which more generally define the quality of life of citizens such as the level of access to health or social services [
14,
15], while not directly explicated in the indicator, structured atop an appropriate subsystem used to quantify their presence can nonetheless be said to have been considered as they are directly connected with spaces-services (public gathering spaces, public and private offices, places offering services to people or the community, etc.) and are physically identified and quantified.
In Italy, property values are currently determined by the Cadastral Registry—now the Revenue Agency (Agenzia delle Entrate ex Agenzia del Territorio). Calculations consider numerous variables, including both intrinsic and extrinsic. Nonetheless, the scheme for defining cadastral income based on an obsolete structure and organised by rigid schemes is unable to capture urban, typological and socioeconomic changes to the city. To date, revisions and adaptations have focused exclusively on the fiscal-monetary side of estimation tariffs and introducing percentage multipliers to correct the distortive effects of inflation, and it is unable to capture urban, typological and socio-economic changes in the city.
The results of this study make it possible to affirm that an increase in the values identifiable in diverse areas of the city must be redistributed in a balanced manner in order to permit a general increase in property values. In light of emerging data, this translates into a higher quality of both the urban habitat and services in proximity to properties, with a consequent benefit to users and an effective administrative tool for reading the territory that assists the decision maker in choosing the policies to be implemented, as has happened, for example, in recent years in Italy, with a view toward decommissioning, adaptively reusing or redeveloping public building stock [
16].
2. Materials and Methods
The definition of the Urban Quality Index is triggered by a reading of the urbanised fabric. This process began by subdividing the municipal territory into homogenous zones (in accordance with Decree of the President of the Republic dated 23 March 1998 n. 138 138/98) and identifying all of their characteristic elements; successively, these elements were related to corresponding values referred to the entire municipal territory.
The surveying process followed the indications contained in the bill dated 15 June 2012 in matters of taxation and developed in accordance with the following operative criteria:
Territorial segmentation: In reference to municipal territory, a perimeter was established to form microzones as defined in the Decree of the President of the Republic dated 23 March 1998 n. 138 by utilising market values from 2014.
Utilisation of normal values: As defined in art. 9 of the Consolidated Tax Act (TUIR Testo Unico delle Imposte sui Redditi), these values are intended as average prices, for comparable goods and services, under free market conditions. Specifically, they indicate the market value of the property and represent the estimated price of a good during a free sales negotiation referred to the date of valuation.
Use of statistical functions: The representation of the urban territory as a set of variables, with a more or less evident corelation. Given the subsistence of a criteria of objectivity, the study of variables is linked to the use of statistic-analytical models and the statistic dependence of a dependent variable on multiple independent variables is referred to as multiple regression analysis.
2.1. Territorial Investigation
The first phase involved the gathering of information and data that represent the urban situation: This process made use of maps from WebGIS Regione Abruzzo, Carta Tecnica Regionale Numerica (C.T.R.N.), DataBase Territoriale Regionale and the Cadastral Maps conserved by the Revenue Agency. In addition to information provided by institutional sources, a “virtual” survey was also carried out by using the internet and geographic software (Google Maps, Google Street View and Google Earth), together with a direct survey, and both were useful for comparing the state of the art with maps to verify eventual anomalies and quantitively and qualitatively implement available information.
Spatial data gathered were aggregated in a Geographic Information System (GIS) using Open Source QGIS software with which it was possible to weigh geographical data with statistical analysis [
17] through normalization operations, obtaining empirical models that allow the reading of urban phenomena that contribute to the definition of quality-quantitative indices. Indicators were subsequently used for the elaboration of a multiple linear regression model on SPSS Statistical Analysis Software.
Four reference macrosystems were identified to define the Urban Quality Index: Environmental System, Infrastructural System, Settlement System and Services System, each with its own set of subsystems that are univocally quantifiable and representative of the variation in quality of each macrosystem.
2.2. Framework Summary
The analysis of the four macrosystems generated a framework for interpreting the entire municipal territory and is described in a summary chart (
Figure 1) listing the number of residents and territorial area of each microzone and its relationship with the areas of the four macrosystems identified.
2.3. Evaluation Model
The evaluative study of the data gathered began with the elaboration of a model capable of capturing the underlying relations of urban phenomena; the observation of a large number of cases permitted the elaboration of a multiple linear regression model. The equation of linear regression is described as follows:
where
= Urban Quality Index;
= gross floor area;
= building age coefficient;
= building typology (single unit in a detached home);
= garage;
= floor level, while the value
represent the non-standardised coefficients to which the model attributes a value–an increase or decrease–as a function of the identified statistical unit (€/m
2). The results obtained from the product of the coefficients and their respective variables describe the level of appreciation, in economic terms, for the characteristics analysed by users (citizens).
This statistical approach allowed the identification and quantification of the elements, correlated with one another, and permitted the reproduction of phenomena observed in a simplified manner, free of superficial aspects.
The trends and expectations of the user-citizen who prefers urban zones over others are confirmed in the formation of real estate prices. In fact, aside from the intrinsic characteristics of each property, the values of real estate transactions also reflect the combined characteristics of the urbanised environment. This highlights the close interdependence between market value and urban quality [
18]. In virtue of this relation, the choice was made to develop the Urban Quality Index as a direct expression of market property, “Estimative market analysis focuses on clarifying typical trends by identifying and studying prices and characteristics considered influential; these characteristics are generally aimed at summarising how operators perceive the formation of a market price” [
19].
2.3.1. Identification and Construction of Variables
The multiple regression model was used to determine a function capable of expressing the relationship between a dependent variable and independent variables. The dependent variable selected for the present case study was the unit value (€/m
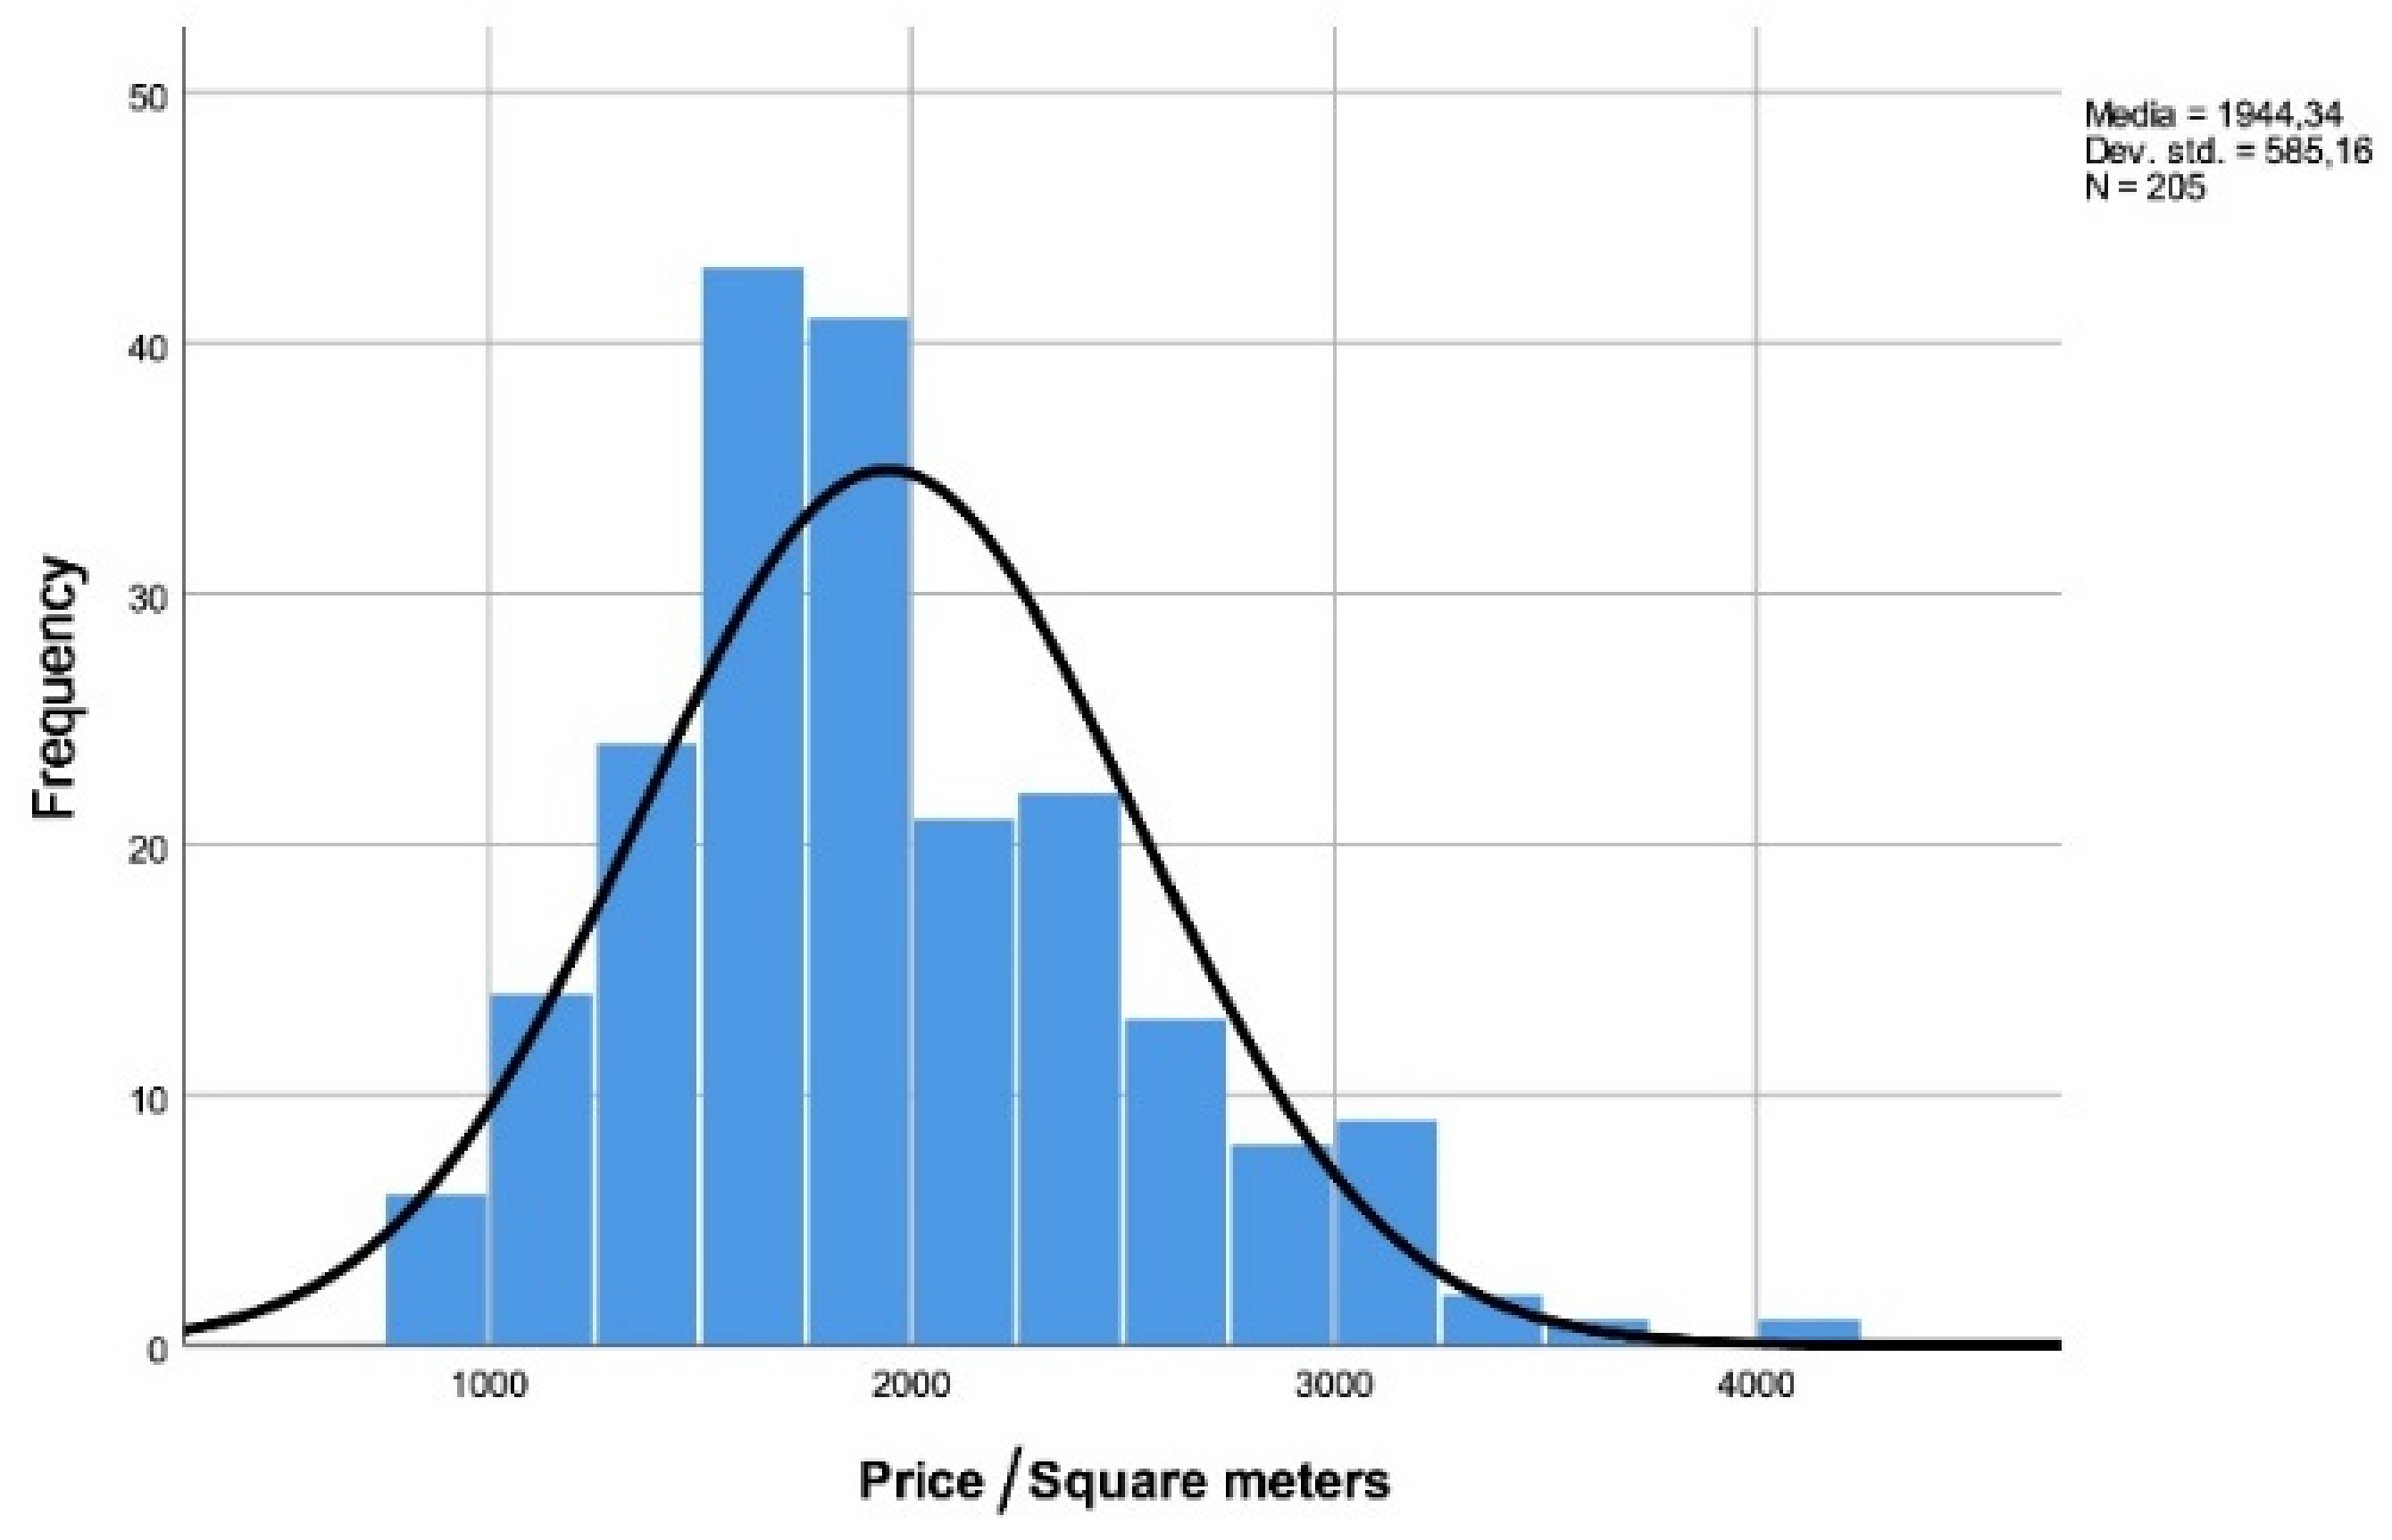
2) of transacted properties. Data collected to prepare the evaluative framework included transactions involving category A (residential) properties, excluding category A10 (offices), registered in the city of Pescara for the year 2014. The reference sample included 205 cases with sufficient variability (
Figure 2) of intrinsic characteristics in terms of area, typology, era of construction and state of conservation. This heterogeneity of characteristics and the consequent unit rates of sale are an indicator of how these observations describe a representative and statistically significant framework of the urban territory.
The data elaborated refer to a suitable variability (normal distribution Kolmogorov–Smirnov Sign
p-value 0.000081 and Shapiro–Wilk
p-value 0.000141) in the properties analysed: They present areas between 30 m
2 and 253 m
2 built between 1939 and 2014. Roughly 36% of the properties feature a garage; 6% belong to the typology “properties in detached or semi-detached homes”; 9.8% of the units analysed are situated on the ground floor; 49.3% are situated on the first or second floor; 28.8% are situated on the third or fourth floor; and 12.2% are situated on or above the fifth floor. Prices range from between €830/m
2 and €5356/m
2, for an average value of €1944/m
2, to a standard deviation of 585.16. The construction of the model considers intrinsic and extrinsic characteristics [
20] grouped in homogeneous clusters in order to simplify the input of data and to represent the explanatory variables (
) in the regression equation.
With reference to surveyed property prices (on a monthly basis), there is no significant temporal trend in property prices: after the negative peak in 2008/2009, property prices in Italy remained stable except for the property market segment of the highest quality. The data collected for the elaboration of the model (2014) refer to a year of absolute stagnation in prices and therefore it was not necessary to elaborate time trend lines (also because the sample of properties is not homogeneous both for intrinsic and extrinsic characteristics). From a partial analysis of the data, there is no significant price trend that could lead to conclusions different from those elaborated: in urban area B1 (
Figure 3), for example, there was substantial stability in average property prices.
2.3.2. Intrinsic Variables
Intrinsic characteristics, linked to the material and architectural properties of real estate units [
21], can be easily identified from the information listed in deeds of sale. They permit an understanding of the location, use, dimensions (m
2) and state of maintenance of each single unit and/or building. Additional aspects, to which particular attention was paid during the processing of the data, were related to verifying criteria for measuring—to some degree quantifiable—the direct proportionality between the parameters and the value of the statistical unit expressed in €/m
2 and the absence of phenomena of self-correlation [
22] among the selected parameters.
The specific elements of the different properties were based on the consideration of five essential aspects with the greatest impact on pricing:
Total floor area: commercial floor area, including balconies and other accessory areas;
Period of construction or renovation of the unit or building: these data provide an indication of a drop in value imputable to the passage of time and, therefore, represent, to all effects and purposes, the aging coefficient;
Floor level: a proportional increase in property value was assigned to higher floor levels by considering the advantages—in terms of natural light, views, privacy, greater protection against atmospheric and acoustic pollution—offered by upper storeys with respect to lower ones. The qualities attributed to the “ground floor” were considered inferior to those recognised for levels above; this characteristic was assigned the value “0”;
Building typology: There is a differentiation between properties in multi-family buildings and those in single-family constructions (single-family or two-family detached and semi-detached homes). For this reason, it was considered useful to introduce a dichotomic variable that would express this differential by assigning the value of “1” to units in detached/semi-detached homes and “0” to those in other building typologies;
Garage: This element, which has a notable influence on the formation of property value, was identified with the associated presence of a garage intended as both covered and exclusive. This aspect was evaluated in the model by introducing a dichotomic variable: “1” when a garage is present and “0” when absent.
2.3.3. Extrinsic Variables: Building the Urban Quality Index
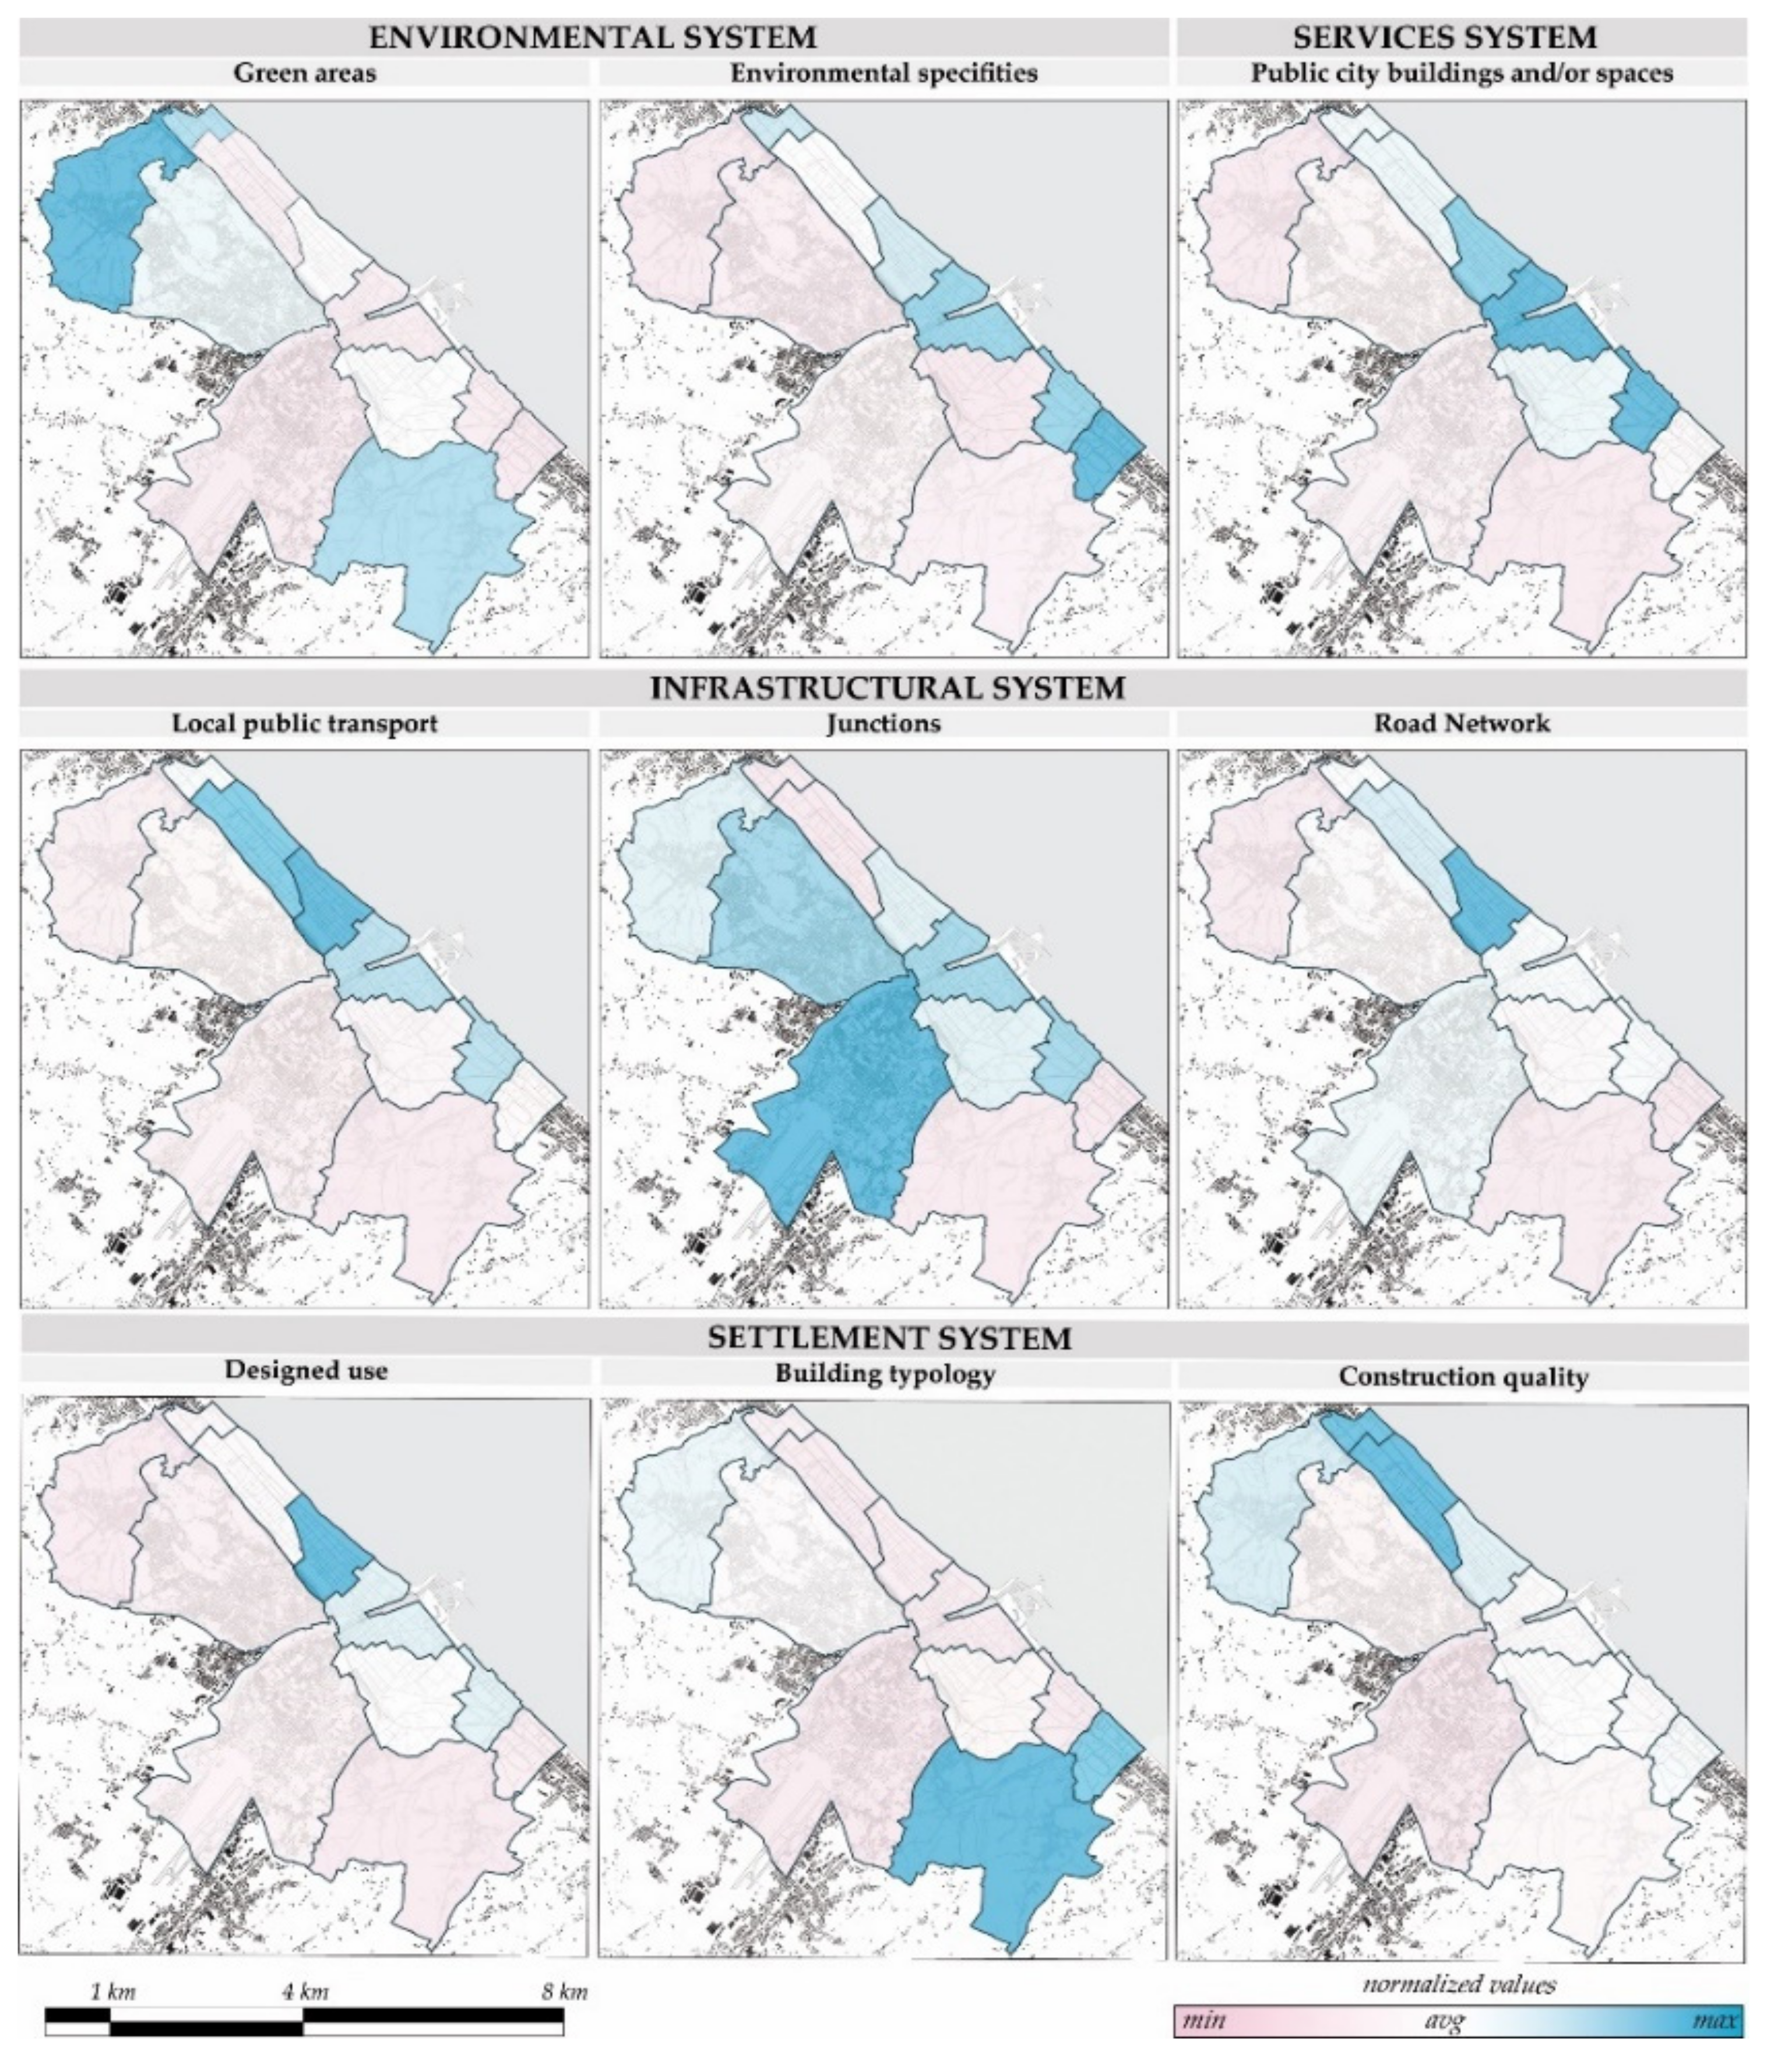
The definition of the extrinsic variable involved elaborations of the four macrosystems—environment, infrastructure, settlement and services (each broken down into subsystems) (
Figure 4)—obtaining values in an ordinal scale [
23] for which its sum expresses the Urban Quality Index (
UQI).
In order to permit a comparison between the elements that participate in the formation of the Urban Quality Index in the 10 microzones of the city of Pescara, it was necessary to introduce a procedure of normalisation. For each characteristic observed, the characteristic that represented the most important presence or feature was attributed a value of ”1” and utilised as a benchmark for scaling values in the other microzones. This approach was necessary to make a comparison among the values obtained in a single microzone and those necessary to describe the entire municipal territory.
Environmental System
This system represents the quantity, in square and linear metres, of natural areas for which its influence on the quality of public spaces and the landscape is considered an improvement [
24]. The Environmental System was then subdivided and analysed in 2 subsystems:
Green/landscaped areas
Parks and Public spaces (PP);
Peripheral Agricultural Lands (AL) (cultivated, uncultivated and forests);
Tree-Lined streets (TL): given the particularity of the city of Pescara, the analyses also examined other elements of environmental value, such as the River Front (RF).
Table 1 shows how to define the Reference Value Calculation and the Normalised Value Calculation.
- 2.
The specific environments of the city of Pescara
The River Front (
RF): considering the presence of the river in terms of real estate appreciation and both for its environmental qualities and for the aesthetic, recreational and socio-cultural functions it represents [
25];
The Sea Shoreline (S): This latter environment was constructed by analysing 190 properties in the microzones along the coast to identify and measure the influence of this characteristic on the formation of prices. These analyses, conducted using an ad hoc multiple linear regression model, made it possible to define the area within which the influence of the waterfront has a significant effect on real estate market value within a limit of 250 metres from the coastline.
All measurements (in square and linear metres) were compared to the territorial area of the
i-th microzone. Successively, the benchmark for normalisation (the maximum value) was identified among the values obtained in the same category. The sum of the normalised values expresses a part of the Urban Quality Index ascribable to the Environmental System.
Table 2 shows how to define the Reference Value Calculation and the Normalised Value Calculation.
Infrastructural System
The Infrastructural System includes the areas, paths and number of services subordinate to public transport, private vehicles or for use by bicycle/on foot. The Infrastructural System was then subdivided and analysed in 3 subsystems:
Table 3 shows how to define the Reference Value Calculation.
Table 4 shows how to define the Reference Value Calculation.
Table 5 shows how to define the Reference Value Calculation.
- 2.
Road-based Local Public Transport (LPT) (the city of Pescara does have a rail-based transport network) was analysed in relation to two factors:
The length in linear metres of urban bus lines (Bus Lines (1)—BL (1)) in the i-th microzone in relation to the territorial area of the same microzone (in hectares);
The number of lines (Bus Lines (2)—BL (2)) traversing each single microzone.
The benchmark for normalisation was identified in an obvious availability of transport services (
max) among all of the values obtained in the same category.
Table 6 shows how to define the Reference Value Calculation and the Normalised Value Calculation.
- 3.
A survey of Junctions (J) or points of access to principal networks:
Rail Way Junctions (RWJ);
Road-based mobility (Road Junctions—RJ): considering their presence, in absolute numbers, in the i-th microzone.
The benchmark for normalisation was identified in an obvious availability of transport services (
max) among all of the values obtained in the same category.
Table 7 shows how to define the Reference Value Calculation and the Normalised Value Calculation.
Settlement System
Developing the construction index of the Settlement System (SS) required a detailed analysis of all 17,603 buildings present in the city of Pescara.
The following factors were calculated:
Total floor area;
The construction/maintenance quality of buildings or Building Quality Score (BQS);
Building Typology Score (BTS);
Building Designed Use (BDU).
For the two sub-indexes, Building Quality Score and Building Typology, reference was made to a previous study by the authors from 2012 [
26]. Part of this study fixed the principles for assigning points with respect to elements linked to a state of maintenance, while another part, after processing a series of interviews with residents of the city of Pescara, defined a system of points based on appreciation for building typologies.
Regarding construction/maintenance quality, the direct observation of building façades made it possible to verify the presence of prized materials and/or detailing or, vice versa, of deteriorations, all of which have a powerful impact on the perception of a building and, as a reflection, on its surroundings [
27].
The assignment of points (QS(n))—from 1 to 4 (in order of growing appreciation)—made it possible to measure the overall level of quality within the i-th microzone in percentage terms with respect to the maximum number of points in the microzone itself.
The maximum ideal score (
QS(
max)) was obtained by hypothesising an ideal situation defined by the exclusive presence of properties in an optimum state and assigned the highest value of 4.
Table 8 shows how to define the Reference Value Calculation and the Normalised Value Calculation.
For the Building Typology subsystem, in terms of building design [
28], 8 typologies were noted, and points were assigned based on the results obtained during interviews with citizens. The points (
TS(
n)) were assigned as follows:
Industrial warehouses (score = 1);
Towers, multistorey and isolated non-residential towers (score = 3);
Row housing, block housing or courtyard hosing (score = 5);
Detached and semi-detached homes (score = 7).
The points calculated make it possible to measure the presence of determinant typologies within the
i-th microzone as a percentage of the maximum points possible in a specific microzone. The maximum ideal score (
TS(
max)) was obtained by hypothesising a situation defined by the exclusive presence of detached and semi-detached homes and assigned the highest score of 7.
Table 9 shows how to define the Reference Value Calculation and the Normalised Value Calculation.
The benchmark selected for normalisation was the highest possible score (max) among the values obtained in the same category.
The sub-index of Building Use was constructed by identifying the use of each unit inside a single building. Three building categories were established:
Exclusively Residential Buildings (RB);
Mixed-Use Buildings (MB);
Buildings used exclusively for tertiary activities or as public offices (Services Buildings) (SB).
The survey examined the number of buildings present in the territory, classified in one of the three categories, as a percentage of the total number of buildings in the
i-th microzone (Total Buildings) (
TotBMi).
Table 10 shows how to define the Subsystem and the Reference Value Calculation.
Property values provided by the Real Estate Market Observatory (OMI) demonstrate how average real estate values (for residential buildings) in Microzone n. 4 were the highest in the entire municipal territory: these data resulted in the selection of a benchmark based on the combination of uses present in Microzone n. 4 (30% exclusively residential, 59% mixed-use and 11% tertiary, plus public and private offices).
These values were then used to normalise the values measured in the other microzones.
Services System
The presence of public and private services (Public/Private services System) (PPS) offered to citizens was considered a positive factor. The survey divided the services present in the city of Pescara into the following categories:
Basic education (nurseries, kindergartens, schools and junior high schools) and higher education (high schools, universities and research centres);
Hospitals, care facilities and healthcare structures;
Libraries, museums, cinemas, theatres, auditoriums and exhibition halls;
Places of worship;
Facilities for sport, free time, shopping and private services (large and small shops, restaurants, bars, markets, hotels, artisans’ shops, tertiary, banks and agencies), public squares and spaces of public gathering.
The resulting values express the relationship between the number of services present in the
i-th microzone without considering the radius of influence proximity can have on the formation of real estate prices, although it can reasonably be considered positive [
29].
Table 11 shows how to define the Reference Value Calculation and the Normalised Value Calculation.
The benchmark for normalisation was the maximum number of services (
max) from a comparison of values in all microzones (
Figure 5).
Thus, by applying Formula (1) to the values obtained for each of the systems studied, it was possible to explicate the variable of urban quality for each of the 10 microzones in the city of Pescara (
Figure 6).
3. Results
All data were processed and modelled using SPSS Statistics software; the results demonstrate how the variables inserted, particularly those relative to urban quality, are both effective and significant and prove that the model can be considered very reliable.
The determination coefficients R-squared (R2 = 0.866) and R-squared adjusted (Adjusted R2 = 0.862) are very high, demonstrating how the proportion of variance in the dependent variable (price per square metre) is explained by the independent variables.
The correlation test showed a high correlation between the variable “Price Square meters” and the variable “Urban Quality Index” (Pearson coefficient 0.457).
The Analysis of Variance (ANOVA) demonstrates how the statistical significance of the regression model less than 0.05 provides an overall indication that the model has a significant capacity to statistically forecast the resulting variable.
The Table of Coefficients (
Table 12) lists the values of the marginal prices implicit of all the characteristics/variables considered. As shown, the implicit marginal price relative to the Urban Quality Index affects the formation of the price of each single unit by €189.978/m
2 (square metres of Gross area). Furthermore, the relative standardised coefficient of regression (β) demonstrates how the Urban Quality Index is the first among all of the variables identified that contributes to the definition of the model.
4. Discussion
The statistical indicators demonstrate the legitimacy of the model constructed. The index of determination R
2—in this study, it is equal to 0.863—assigns the model a predictive capacity. In other words, the explanatory variables show a good ability to predict the value of the dependent variable since the Analysis of Variance has a
p-value equal to 1.9706
while the
t-tests (
Table 12) confirm the significance of the entire model and the individual variables used.
Finally, the percentage error, intended as the ratio between standard error and the average values of the dependent variables (representing the percentage shift of data from the regression line), is equal to 11% and, thus, is amply below the critical values expressed in literature.
Other than the correct identification and quantification of an index capable of fully defining the elements that bring urban quality, the present research also shows how the model can be further developed for different purposes, the least of which is linked to taxation.
The following figure (
Figure 7) shows the difference between the real value (listed in deeds), the value calculated using the model and the fiscal value (or cadastral value, that is, the value used to calculate diverse taxations) for the sample analysed. In particular, the real value and the predicted value, although different, develop according to a similar trend, while the taxable value appears to be wholly separate from market dynamics and has a largely divergent trend with respect to real values. In all cases except one, cadastral values were significantly lower than both real values and those calculated using the model. It is, therefore, evident that the city of Pescara (similarly to many Italian cities) suffers from considerable forms of fiscal inequality.
In light of these economic-fiscal considerations, an Urban Quality Index constructed in this manner may represent an innovative tool for political decision makers and/or public administrations in rebalancing taxation and, at the same time, proposing a more balanced and sustainable form of planning.
Composed of a consistent quota of environmental factors—planted and landscaped areas, infrastructures and services—in addition to qualitative factors intrinsic to urban properties and given the notable significance assigned by the regression model to this index, the UQI becomes a detector of criticalities and shortcomings in the consolidated urbanised fabric and indicates a possible approach to rebalancing existing disparities and managing future actions of planning.
To cite an example, an increase in property values in the presence of a garage reveals how urban movements make widespread use of private vehicles. This reading of the urban environment may suggest that local governments intervene by improving the system of public transport, triggering an improvement to the index and, consequentially, to the quality of services—and the urban environment in general—utilised by citizens.
5. Conclusions
The index developed by the model based on a reading of property values has permitted the definition of all of the physical (and thus measurable) characteristics that participate in the definition of urban quality. The model is objective, replicable and scalable:
Objective, because it is structured by quantitative elements devoid of any form of subjective alteration;
Replicable, because the systems considered comprise the structural components of the city;
Scalable, because the essential elements of the city can be found at diverse scales.
The model considers a set of elements that affect market values, beginning with the Urban Quality Index defined within the “institutional polygons” represented by microzones. As imaginable, the model expresses different levels in different parts of the city of Pescara.
The other quota of variability explained by the model results from the specific characteristics of each real estate unit (floor area, era of construction, level, building typology and presence or not of a garage).
After verifying the statistical acceptability of the model by using statistical and estimative tests, two aspects emerge powerfully and clearly from its use: The first is linked to the Urban Quality Index. It is worth underlining that this elaboration is triggered by, belongs to and is circumscribed exclusively to the appreciation manifested by the real estate market in relation to the location of a building. In this regard, it is possible to consider the following: if this index considers a series of urban characteristics, for which its density must be read in positive terms and if the t-test of significance of the variable constructed in this manner is the highest among the variables input into the model, then it is possible to recognise that this index has the ability to describe and interpret parts of the city that are of use to the decision-making processes and that characterise urban policies.
Further specific aspects could be considered for the refinement of the assessment such as air pollution due to the high rate of urbanisation—and population—the high density of means of transport or the proximity of industrial settlements to urban areas [
30] criticalities linked to the presence of publicly owned areas and buildings, mostly industrial complex [
31] and abandoned military barracks [
32], that occupy large urban portions and the potential they would offer in terms of urban quality by undertaking appropriate recovery plans on these assets [
33]. Assessments, with modern computational methodologies of estimation, their market value or their recovery value [
34] or, again, knowing detailed information on the energy characteristics of the buildings—in light of the energy efficiency incentives undertaken by the Italian State and the plans for the following decade [
35]—and its appreciation in economic terms should all be undertaken [
36].
The second aspect is linked to physicality: The difference between predicted value (aligned with the value listed in deeds of sale) and taxable value (cadastral value) suggests a profound reflection of the inappropriateness of the current taxation system, which calculates value using procedures considered improper and “completely disconnected from real market values” [
37].
Thus, the proposed model would consent to a mass appraisal capable of producing property values that more correctly reflect the real situation and, in turn, consenting greater fiscal equity among taxpayers, while helps in stimulating the real estate market [
38].
Author Contributions
Conceptualization, S.C., M.F. and D.S.; methodology, S.C., M.F. and D.S.; software, S.C., M.F. and D.S.; validation, S.C., M.F. and D.S.; formal analysis, S.C., M.F. and D.S.; investigation, S.C., M.F. and D.S.; resources, S.C., M.F. and D.S.; data curation, S.C., M.F. and D.S.; writing—original draft preparation, S.C., M.F. and D.S.; writing—review and editing, S.C., M.F. and D.S.; visualization, S.C., M.F. and D.S.; supervision, S.C., M.F. and D.S.; project administration, S.C., M.F. and D.S.; funding acquisition, S.C., M.F. and D.S. All authors have read and agreed to the published version of the manuscript.
Funding
This research received no external funding.
Institutional Review Board Statement
Not applicable.
Informed Consent Statement
Not applicable.
Data Availability Statement
Data are not publicly available, although the data may be made available upon request from the corresponding author.
Conflicts of Interest
The authors declare no conflict of interest.
References
- Gargiulo, C.; Travascio, L.C.; De Ciutiis, F. Una Lettura dei Processi di Valorizzazione in Atto Nelle Realtà Urbane. 2016. Available online: http://www.fedoa.unina.it/1261/1/Paper_Gargiulo_Travascio_deCiutiis.pdf (accessed on 8 December 2021).
- Carbonara, S.; Stefano, D.; Di Prinzio, A. Transforming surface rights into property rights: An analysis of current estimation procedures and a comparison with an alternative. Valori Valutazioni. Teor. Esperienze 2020, 24, 5–17. [Google Scholar]
- Carbonara, S.; Stefano, D. The Transformation of Surface Rights into Property Rights. A Financial Resource for Rebalancing Municipal Budgets. The Case of Pescara. In Appraisal and Valuation. Contemporary Issues and New Frontiers; Morano, P., Oppio, A., Rosato, P., Sdino, L., Tajani, F., Eds.; Springer: Berlin/Heidelberg, Germany, 2021; pp. 91–101. [Google Scholar]
- Rosen, S. Hedonic Prices and Implicit Markets: Product Differentiation in Pure Competition. J. Political Econ. 1974, 82, 34–55. [Google Scholar] [CrossRef]
- Carbonara, S.; Stefano, D. The Valorisation of Public Real Estate Assets in Italy: A Critical Reconstruction of the Legislative Framework. In New Metropolitan Perspectives. Knowledge Dynamics and Innovation-Driven Policies towards Urban and Regional Transition Volume 2; Smart Innovation, Systems and Technologies 2; Bevilacqua, C., Calabrò, F., Della Spina, L., Eds.; Springer: Berlin/Heidelberg, Germany, 2021; pp. 475–485. [Google Scholar]
- Wolfram, M.; Frantzeskaki, N. Cities and Systemic Change for Sustainability: Prevailing Epistemologies and an Emerging Research Agenda. Sustainability 2016, 8, 144. [Google Scholar] [CrossRef] [Green Version]
- Ferreira, V.; Barreira, A.P.; Loures, L.; Antunes, D.; Panagopoulos, T. Stakeholders’ Engagement on Nature-Based Solutions: A Systematic Literature Review. Sustainability 2020, 12, 640. [Google Scholar] [CrossRef] [Green Version]
- Carbonara, S.; Stefano, D. Building recovery, property values and demographic decline after the 2009 Abruzzo earthquake. In New Metropolitan Perspectives. Knowledge Dynamics and Innovation-Driven Policies towards Urban and Regional Transition Volume 2; Bevilacqua, C., Calabrò, F., Della Spina, L., Eds.; Springer: Berlin/Heidelberg, Germany, 2021; pp. 779–790. [Google Scholar]
- Fiorini, L.; Marucci, A.; Zullo, F.; Romano, B. Indicator engineering for land take control and settlement sustainability. WIT Trans. Ecol. Environ. 2018, 217, 437–446. [Google Scholar] [CrossRef] [Green Version]
- Rosato, P.; Breil, M.; Giupponi, C.; Berto, R. Assessing the Impact of Urban Improvement on Housing Values: A Hedonic Pricing and Multi-Attribute Analysis Model for the Historic Centre of Venice. Buildings 2017, 7, 112. [Google Scholar] [CrossRef] [Green Version]
- Trovato, M.R.; Clienti, C.; Giuffrida, S. People and the City: Urban Fragility and the Real Estate-Scape in a Neighborhood of Catania, Italy. Sustainability 2020, 12, 5409. [Google Scholar] [CrossRef]
- Morena, M.; Cia, G.; Baiardi, L.; Rodríguez Rojas, J.S. Residential Property Behavior Forecasting in the Metropolitan City of Milan: Socio-Economic Characteristics as Drivers of Residential Market Value Trends. Sustainability 2021, 13, 3612. [Google Scholar] [CrossRef]
- Della Spina, L. Multidimensional Assessment for “Culture-Led” and “Community-Driven” Urban Regeneration as Driver for Trigger Economic Vitality in Urban Historic Centers. Sustainability 2019, 11, 7237. [Google Scholar] [CrossRef] [Green Version]
- Discoli, C.; Martini, I.; Gustavo, S.J.; Barbero, D.; Dicroce, L.; Ferreyro, C.; Esparza, J. Methodology aimed at evaluating urban life quality levels. Sustain. Cities Soc. 2014, 10, 140–148. [Google Scholar] [CrossRef] [Green Version]
- Faka, A.; Kalogeropoulos, K.; Maloutas, T.; Chalkias, C. Urban Quality of Life: Spatial Modeling and Indexing in Athens Metropolitan Area, Greece. ISPRS Int. J. Geo-Inf. 2021, 10, 347. [Google Scholar] [CrossRef]
- Mangialardo, A.; Micelli, E. Grass-roots participation to enhance public real estate properties. Just a fad? Land Use Policy 2021, 103, 105290. [Google Scholar] [CrossRef]
- Faisal, K.; Shaker, A. Improving the Accuracy of Urban Environmental Quality Assessment Using Geographically-Weighted Regression Techniques. Sensors 2017, 17, 528. [Google Scholar] [CrossRef] [Green Version]
- Wang, D.; Li, V.J.; Yu, H. Mass Appraisal Modeling of Real Estate in Urban Centers by Geographically and Temporally Weighted Regression: A Case Study of Beijing’s Core Area. Land 2020, 9, 143. [Google Scholar] [CrossRef]
- Abbozzo, P.; Gaetano, M. Modelli di Valutazione ed Analisi Estimativa di Beni Complessi. Aestimum 2009, 40. [Google Scholar] [CrossRef]
- Čeh, M.; Kilibarda, M.; Lisec, A.; Bajat, B. Estimating the Performance of Random Forest versus Multiple Regression for Predicting Prices of the Apartments. ISPRS Int. J. Geo-Inf. 2018, 7, 168. [Google Scholar] [CrossRef] [Green Version]
- Forte, C.; De’Rossi, B. Principi di Economia ed Estimo; Etas Libri: Milano, Italy, 1974. [Google Scholar]
- Grillenzoni, M.; Grittani, G. Estimo. Teoria, Procedure di Valutazione e Casi Applicativi; Calderini: Bologna, Italy, 1994. [Google Scholar]
- Garau, C.; Pavan, V.M. Evaluating Urban Quality: Indicators and Assessment Tools for Smart Sustainable Cities. Sustainability 2018, 10, 575. [Google Scholar] [CrossRef] [Green Version]
- Zhang, Y.; Dong, R. Impacts of Street-Visible Greenery on Housing Prices: Evidence from a Hedonic Price Model and a Massive Street View Image Dataset in Beijing. ISPRS Int. J. Geo-Inf. 2018, 7, 104. [Google Scholar] [CrossRef] [Green Version]
- Nicholls, S.; Crompton, J.L. The effect of rivers, streams, and canals on property values. River Res. Appl. 2017, 33, 1377–1386. [Google Scholar] [CrossRef]
- Carbonara, S. The Effect of Infrastructural Works on Urban Property Values: The asse attrezzato in Pescara, Italy. In Proceedings of the International Conference on Computational Science and Its Applications, Salvador de Bahia, Brazil, 18–21 June 2012; Springer: Berlin/Heidelberg, Germany, 2012; Volume 7334, pp. 128–143. [Google Scholar] [CrossRef]
- Gavrilidis, A.A.; Ciocănea, C.M.; Niţă, M.R.; Onose, D.A.; Irina Iulia, N. Urban Landscape Quality Index–Planning Tool for Evaluating Urban Landscapes and Improving the Quality of Life. Procedia Environ. Sci. 2016, 32, 155–167. [Google Scholar] [CrossRef] [Green Version]
- Rong, H.H.; Yang, J.; Kang, M.; Chegut, A. The Value of Design in Real Estate Asset Pricing. Buildings 2020, 10, 178. [Google Scholar] [CrossRef]
- Liebelt, V.; Bartke, S.; Schwarz, N. Urban Green Spaces and Housing Prices: An Alternative Perspective. Sustainability 2019, 11, 3707. [Google Scholar] [CrossRef] [Green Version]
- Fang, C.; Liu, H.; Li, G.; Sun, D.; Miao, Z. Estimating the Impact of Urbanization on Air Quality in China Using Spatial Regression Models. Sustainability 2015, 7, 15570–15592. [Google Scholar] [CrossRef] [Green Version]
- Della Spina, L.; Giorno, C.; Galati Casmiro, R. An Integrated Decision Support System to Define the Best Scenario for the Adaptive Sustainable Re-Use of Cultural Heritage in Southern Italy; Springer International Publishing: Cham, Switzerland, 2020; pp. 251–267. [Google Scholar]
- Camerin, F.; Camatti, N.; Gastaldi, F. Military Barracks as Cultural Heritage in Italy: A Comparison between before-1900- and 1900-to-1950-Built Barracks. Sustainability 2021, 13, 782. [Google Scholar] [CrossRef]
- Morena, M.; Cia, G.; Migliore, A.; Mantella, S. Exploring Tools for Public Real Estate Enhancement in Italy: From Criteria to Decisions. Sustainability 2021, 13, 622. [Google Scholar] [CrossRef]
- Mirarchi, C.; Pinti, L.; Munir, M.; Bonelli, S.; Brizzolari, A.; Kiviniemi, A. Understand the Value of Knowledge Management in a Virtual Asset Management Environment; Taylor & Francis: New York, NY, USA, 2018. [Google Scholar]
- ENEA. Agenzia nazionale per le nuove tecnologie Rapporto Annuale Sull’efficienza Energetica 2020. In Analisi e Risultati Delle Policy di Efficienza Energetica del Nostro Paese; ENEA: Rome, Italy, 2020. [Google Scholar]
- Mecca, U.; Moglia, G.; Piantanida, P.; Prizzon, F.; Rebaudengo, M.; Vottari, A. How Energy Retrofit Maintenance Affects Residential Buildings Market Value? Sustainability 2020, 12, 5213. [Google Scholar] [CrossRef]
- Rocco, C.; Elena, F. Equità, Equità, Catasto e Governo del Territorio. Una Proposta Metodologica a Supporto Della Pubblica Amministrazione. 2013. Available online: .https://www.agenziaentrate.gov.it/portale/documents/20143/324519/Una+proposta+metodologica+a+supporto+della+Pubblica+Amministrazione_28-45_Curto.pdf/d16f080d-6cbb-4856-f13a-e7f1ee762ebf (accessed on 8 December 2021).
- Manganelli, B.; Morano, P.; Rosato, P.; De Paola, P. The Effect of Taxation on Investment Demand in the Real Estate Market: The Italian Experience. Buildings 2020, 10, 115. [Google Scholar] [CrossRef]
Figure 2.
Normal distribution of the sample analysed.
Figure 2.
Normal distribution of the sample analysed.
Figure 3.
Trend of average market prices in urban area B1.
Figure 3.
Trend of average market prices in urban area B1.
Figure 4.
Schematic diagram of the process used to calculate the Urban Quality Index (UQI).
Figure 4.
Schematic diagram of the process used to calculate the Urban Quality Index (UQI).
Figure 5.
Representation of the normalised values for the subsystems.
Figure 5.
Representation of the normalised values for the subsystems.
Figure 6.
Urban Quality Index (UQI) aggregated in the 10 microzones of the City of Pescara.
Figure 6.
Urban Quality Index (UQI) aggregated in the 10 microzones of the City of Pescara.
Figure 7.
Comparison between real value (from deeds of sale), predicted value (using the model) and cadastral value.
Figure 7.
Comparison between real value (from deeds of sale), predicted value (using the model) and cadastral value.
Table 1.
Environmental macrosystem: division into subsystems of green areas.
Table 1.
Environmental macrosystem: division into subsystems of green areas.
| Subsystem | Reference Value Calculation | Normalised Value Calculation |
|---|
| Agricultural Lands | | |
| Parks and Public spaces | | |
| Tree-Lined street/avenue | | |
Table 2.
Environmental macrosystem: division into the own subsystems of the City of Pescara.
Table 2.
Environmental macrosystem: division into the own subsystems of the City of Pescara.
|
Subsystem
| Reference Value Calculation | Normalised Value Calculation |
|---|
|
Riverfront
| | |
|
Sea shoreline
| | |
Table 3.
Infrastructural macrosystem: division of the subsystem “Road Network”.
Table 3.
Infrastructural macrosystem: division of the subsystem “Road Network”.
| Subsystem | Reference Value Calculation |
|---|
|
Main roads
| |
|
Secondary roads
| |
Table 4.
Infrastructural macrosystem: division of the subsystem “Sustainable Mobility”.
Table 4.
Infrastructural macrosystem: division of the subsystem “Sustainable Mobility”.
| Subsystem | Reference Value Calculation |
|---|
|
Cycling Lanes
| |
|
Routes in Parks
| |
Table 5.
Infrastructural macrosystem: division of the subsystem “Other Vehicular Areas”.
Table 5.
Infrastructural macrosystem: division of the subsystem “Other Vehicular Areas”.
| Subsystem | Reference Value Calculation |
|---|
|
Limited Traffic Zones
| |
|
Parking Areas
| |
Table 6.
Infrastructural macrosystem: division of the subsystem “Local Public Transport”.
Table 6.
Infrastructural macrosystem: division of the subsystem “Local Public Transport”.
| Subsystem | Reference Value Calculation | Normalised Value Calculation |
|---|
|
Bus Lines (1) | | |
|
Bus Lines (2) | | |
Table 7.
Infrastructural macrosystem: division of the subsystem “Nodes”.
Table 7.
Infrastructural macrosystem: division of the subsystem “Nodes”.
| Subsystem | Reference Value Calculation | Normalised Value Calculation |
|---|
|
Road junctions
| | |
|
Railway junctions
| | |
Table 8.
Settlement macrosystem: subsystem of the Building Quality Score.
Table 8.
Settlement macrosystem: subsystem of the Building Quality Score.
| Subsystem | Reference Value Calculation | Normalised Value Calculation |
|---|
Building Quality Score
(Construction Quality Score)
| | |
Table 9.
Settlement macrosystem: subsystem of building typologies.
Table 9.
Settlement macrosystem: subsystem of building typologies.
| Subsystem | Reference Value Calculation | Normalised Value Calculation |
|---|
Building Typology Score
(Building Typology Score)
| | |
Table 10.
Settlement macrosystem: subsystem of Building Uses.
Table 10.
Settlement macrosystem: subsystem of Building Uses.
| Subsystem | Reference Value Calculation |
|---|
|
Exclusively Residential Buildings
| |
|
Mixed-Use Buildings
| |
|
Exclusively Tertiary and Public Services Buildings
| |
|
Total Buildings
| |
Table 11.
Macrosystem of services.
Table 11.
Macrosystem of services.
| Sistema | Reference Value Calculation | Normalised Value Calculation |
|---|
| Public/Private Services System | | |
Table 12.
Table of coefficients a.
Table 12.
Table of coefficients a.
| Model | Non-Standardised
Coefficients | Standardised
Coefficients | t | p-Value |
|---|
| B | Standard Error (SE) | Beta (β) |
|---|
| 1 | (Costante) | 1089.030 | 72.111 | | 15.102 | 8.6649 |
| Urban Quality Index | 189.978 | 6707 | 828 | 28.325 | 1.4355 |
| Gross Floor Area | −3852 | 481 | −224 | −8010 | 9.6296 |
| Building Age Index | −308.356 | 14.203 | −654 | −21.711 | 2.8602 |
| Building Typology | 461.572 | 66.764 | 193 | 6914 | 6.3518 |
| Garage | 346.767 | 35.366 | 297 | 9805 | 9.437 |
| Floor Level | 56.682 | 7627 | 207 | 7432 | 3.1419 |
| Publisher’s Note: MDPI stays neutral with regard to jurisdictional claims in published maps and institutional affiliations. |
© 2021 by the authors. Licensee MDPI, Basel, Switzerland. This article is an open access article distributed under the terms and conditions of the Creative Commons Attribution (CC BY) license (https://creativecommons.org/licenses/by/4.0/).


