Article

The Valorization of Biolignin from Esparto Grass (Stipa tenacissima L.) Produced by Green Process CIMV (Compagnie Industrielle de la Matière Végétale) for Fertilization of Algerian Degraded Soil: Impact on the Physicochemical and Biological Properties

1
Process Engineering Laboratory, University of Laghouat, P.O. Box 37, Laghouat 03000, Algeria
2
Mechanics Laboratory, University of Laghouat, P.O. Box 37, Laghouat 03000, Algeria
3
Biological and Agronomic Sciences Laboratory, University of Laghouat, P.O. Box 37, Laghouat 03000, Algeria
*
Author to whom correspondence should be addressed.
Sustainability 2021, 13(23), 13462; https://doi.org/10.3390/su132313462
Submission received: 18 October 2021 / Revised: 13 November 2021 / Accepted: 15 November 2021 / Published: 6 December 2021
(This article belongs to the Collection Advances in Biomass Waste Valorization)

Abstract

:
This study proposes a new use for a paper industry waste material, lignin, in agriculture and agronomy as a fertilizer for arid soils, while following a strategy aiming to both increase the amount of organic matter in these soils and decrease the impact of pollution caused by industrial discharges that contain organic and/or inorganic pollutants generated by the paper industry. In fact, this method works to improve soil quality through a new carbon-rich bioorganic fertilizer (biolignin) that results from a green method called CIMV, a targeted depollution objective of the paper industry. Over the course of 180 days, we monitored the physicochemical and biological characteristics of degraded soils treated with three different biolignin treatments of 0 (D0), 2 (D1), and 4 (D2) g/kg. The humification was then evaluated by the equation E4/E6. A remarkable variation of the physicochemical and biological parameters was observed in D1 and D2: temperature 12–38 °C, humidity 9–29%, and pH 7.06–8.73. The C/N ratio decreased from 266 to 49. After 180 days, the improvement in soil carbon content for the three treatments D0, D1, and D2 was 14%, 19%, and 24%, respectively. A maximum bacterial biomass of 152 (CFU/g soil) was observed on the 30th day for D1. Maximum laccase activity for D2 was observed on the 120th day. D1 and D2 recorded a significant degree of humification compared to D0. The best indicator of humification E4/E6 was observed in D1, where the value reached 2.66 at the end of the treatment period. The D2 treatment showed a remarkable effect improving the fertility of the degraded soil, which confirms that biolignin is a good fertilizer.

1. Introduction

After cellulose, lignin is the most plentiful biopolymer present on our planet. It is regarded as a significant waste product of the paper industry, as it is co-produced from low-value black liquor (paste reduction liquor) [1].
The paper industry causes serious environmental hazards by producing black liquor [2], which pollutes rivers [3]. It is necessary to limit the discharge of color waste effluents into running water in order to protect the natural environment [2].
In Algeria and Tunisia, cell PAP factories bake Esparto grass into pulp [4], producing a high-quality paste, but lignin and hemicellulose are used in low-value-added applications, such as power generation processes. Moreover, the silicon compound that is initially found in Esparto grass makes recycling chemicals even more complicated [5].
For this, the treatment of papermill sludges should be solved in order to reduce the major environmental problems caused by the paper industry. This can be accomplished by the development of new biomolecules sourced from paper wastes, rather than from the petrochemical industry. Due to the chemical compositions of some major biomolecules, organic materials—such as cellulose and lignin extracts—and inorganic compounds—such as lime, clay, calcium carbonates, and trace metals—are used to enhance soil fertility and reduce waste. Paper mill sludge (black liquor) can also be modified and changed into a useful agricultural fertilizer and used as a soil amendment to improve the availability of nutrients for crops [2,6].
Various studies indicate that black liquor from the paper industry can be used as a soil amendment or used for the enhancement of crop yields. O’Brien et al. [7] reported an improvement in the cultivation of Zea mays L. in soil treated with black liquor. However, Xiao et al. [8] reported that due to the complex composition of ash and sludge, as well as their metal leaching ability, they do not seem likely to be a beneficial by-product when added to agricultural fields, and their high pollution potential can actually harm the environment.
In another study, Chirenje and Ma [9] reported that the application of wood derivative boiler ash to forests causes an improvement in soil’s physical properties such as an increase in macronutrients (Ca, Mg, K, and P) and micronutrients (Fe, Mn, Cu, and Zn). However, the application of large quantities of boiler ash also adds significant amounts of trace metals and other elements that may be harmful to plants and the environment in general. Nevertheless, the application of black liquor, as studied by Kannan and Oblisami [10,11] and Xiao et al. [12], revealed an increase in organic carbon content with an improvement in the enzymatic activities in the soil.
Zhang et al. [6] preferred lignin as an organic soil treatment, rather than other unnatural biosolids, since it can be easily obtained from the pulp and paper industry byproducts. Lignin also contains numerous significant functional groups, such as phenol acid, hydroxyl, carboxyl, benzyl alcohol, methoxy, and aldehyde, etc. [13]. Lignin acts as a precursor substance for the formation of humus in the upper layer of soil due to the microbial degradation of phenols, carbohydrates, and amino acids [2,14,15].
Similarly, the study of Xiao et al. [2] confirmed that the application of acidified lignin obtained from Kraft rice straw improves irrigation efficiency and soil fertility. The effect of lignin as an organic treatment for barren soils varies from study to study. In the last 30 years, research has been carried out on lignin that explains its dynamics in soil degradation/mineralization and maturation in relation to the source of the plant, the climate, and different soil environmental conditions (physical and biological) [16].
However, the evaluation of maturation often remains a limiting factor; this makes it difficult to compare results from different studies. Francou [17] argues that the maturity term is often ambiguous, although it is frequently cited in the literature. In the majority of articles, stability and maturity are only defined implicitly [18].
In addition, we can assume that extracted lignin is an organic treatment for agronomic purposes, especially if it is produced by environmentally friendly paper mill processes.
A new lignocellulosic biorefinery technology addresses these needs through the use of organic or hydro-organic media where vapor explosions have recently been developed to produce cellulose, hemicelluloses, and lignins from plant biomass without significant degradation or modification of these three biopolymers [19]. These processes enable the production of more valuable pure-cellulose lignins for the paper industry [1]. The process—which was developed through the organosolv process of the Compagnie Industrielle de la Matiere Vegetale (CIMV) (Biomass Industrial Company)—was applied to Tunisian Esparto grass and proved to be very suitable for the separation of the three main components (cellulose, hemicellulose, and lignin) [19] for which the production agents are easily recyclable [5].
Until now, there is no research in the literature on the biolignin CIMV from Esparto grass in the field of improving or conserving degraded lands in arid environments, but it is assumed that lignin directly or indirectly influences the structure of soil microbial communities, which in turn controls soil quality by providing several key ecosystem services, such as reducing greenhouse gas emissions [14].
According to the harmlessness criteria of organic amendments as adopted by the AFNOR [20] standard for pathogenic microbes, organic trace compounds, and unwanted inert substances and heavy metals, it is observed that biolignin does not contain pathogens. This may have come from the proper management of biolignin by the CIMV extraction method, as well as its extraction protocol, which requires a temperature of 105 °C for 5 h. The major pathogenic microbes causing disease are inhibited at temperatures between 55 °C and 71 °C, in a time interval between a few minutes and a few hours depending on the type of microbe [21]. Biolignin does not contain any toxic substances because of the chemical structure of Esparto grass lignin, which was identified by Nadji et al. [4] and Abdelkafi et al. [19] and by the classification of toxic substances that it may contain [21].
In Algeria, it is estimated that there are more than 3 million hectares of Esparto grass located in steppes [22]. In the country, three factories (Celpap Company) produce whitened pulp using Esparto grass fibers as a raw material [23]. Additionally, the Algerian steppes, which are the source of the plant, are areas for grazing and extensive sheep farming [22,24]; the extracted biolignin from Esparto grass will therefore not come from industrial zones, and the risk of its contamination by heavy metals is therefore excluded. That will be more reassuring in terms of the biological and ecotoxicological quality of the extracted product if used in soil fertilization.
For ecological and economic reasons, we hypothesized that the recycling and valorization of Esparto grass lignin from the green extraction process (CIMV) used as an organic amendment could improve degraded soil quality.
A 180-day experiment on degraded soil with three biolignin treatments (0, 2, and 4 g/kg) was carried out. Our objectives are to evaluate the effect of these treatments on: physical (temperature, soil moisture), chemical (C%, N%, C/N, pH), and biological (bacteria, fungi, laccase) soil characteristics.

2. Materials and Methods

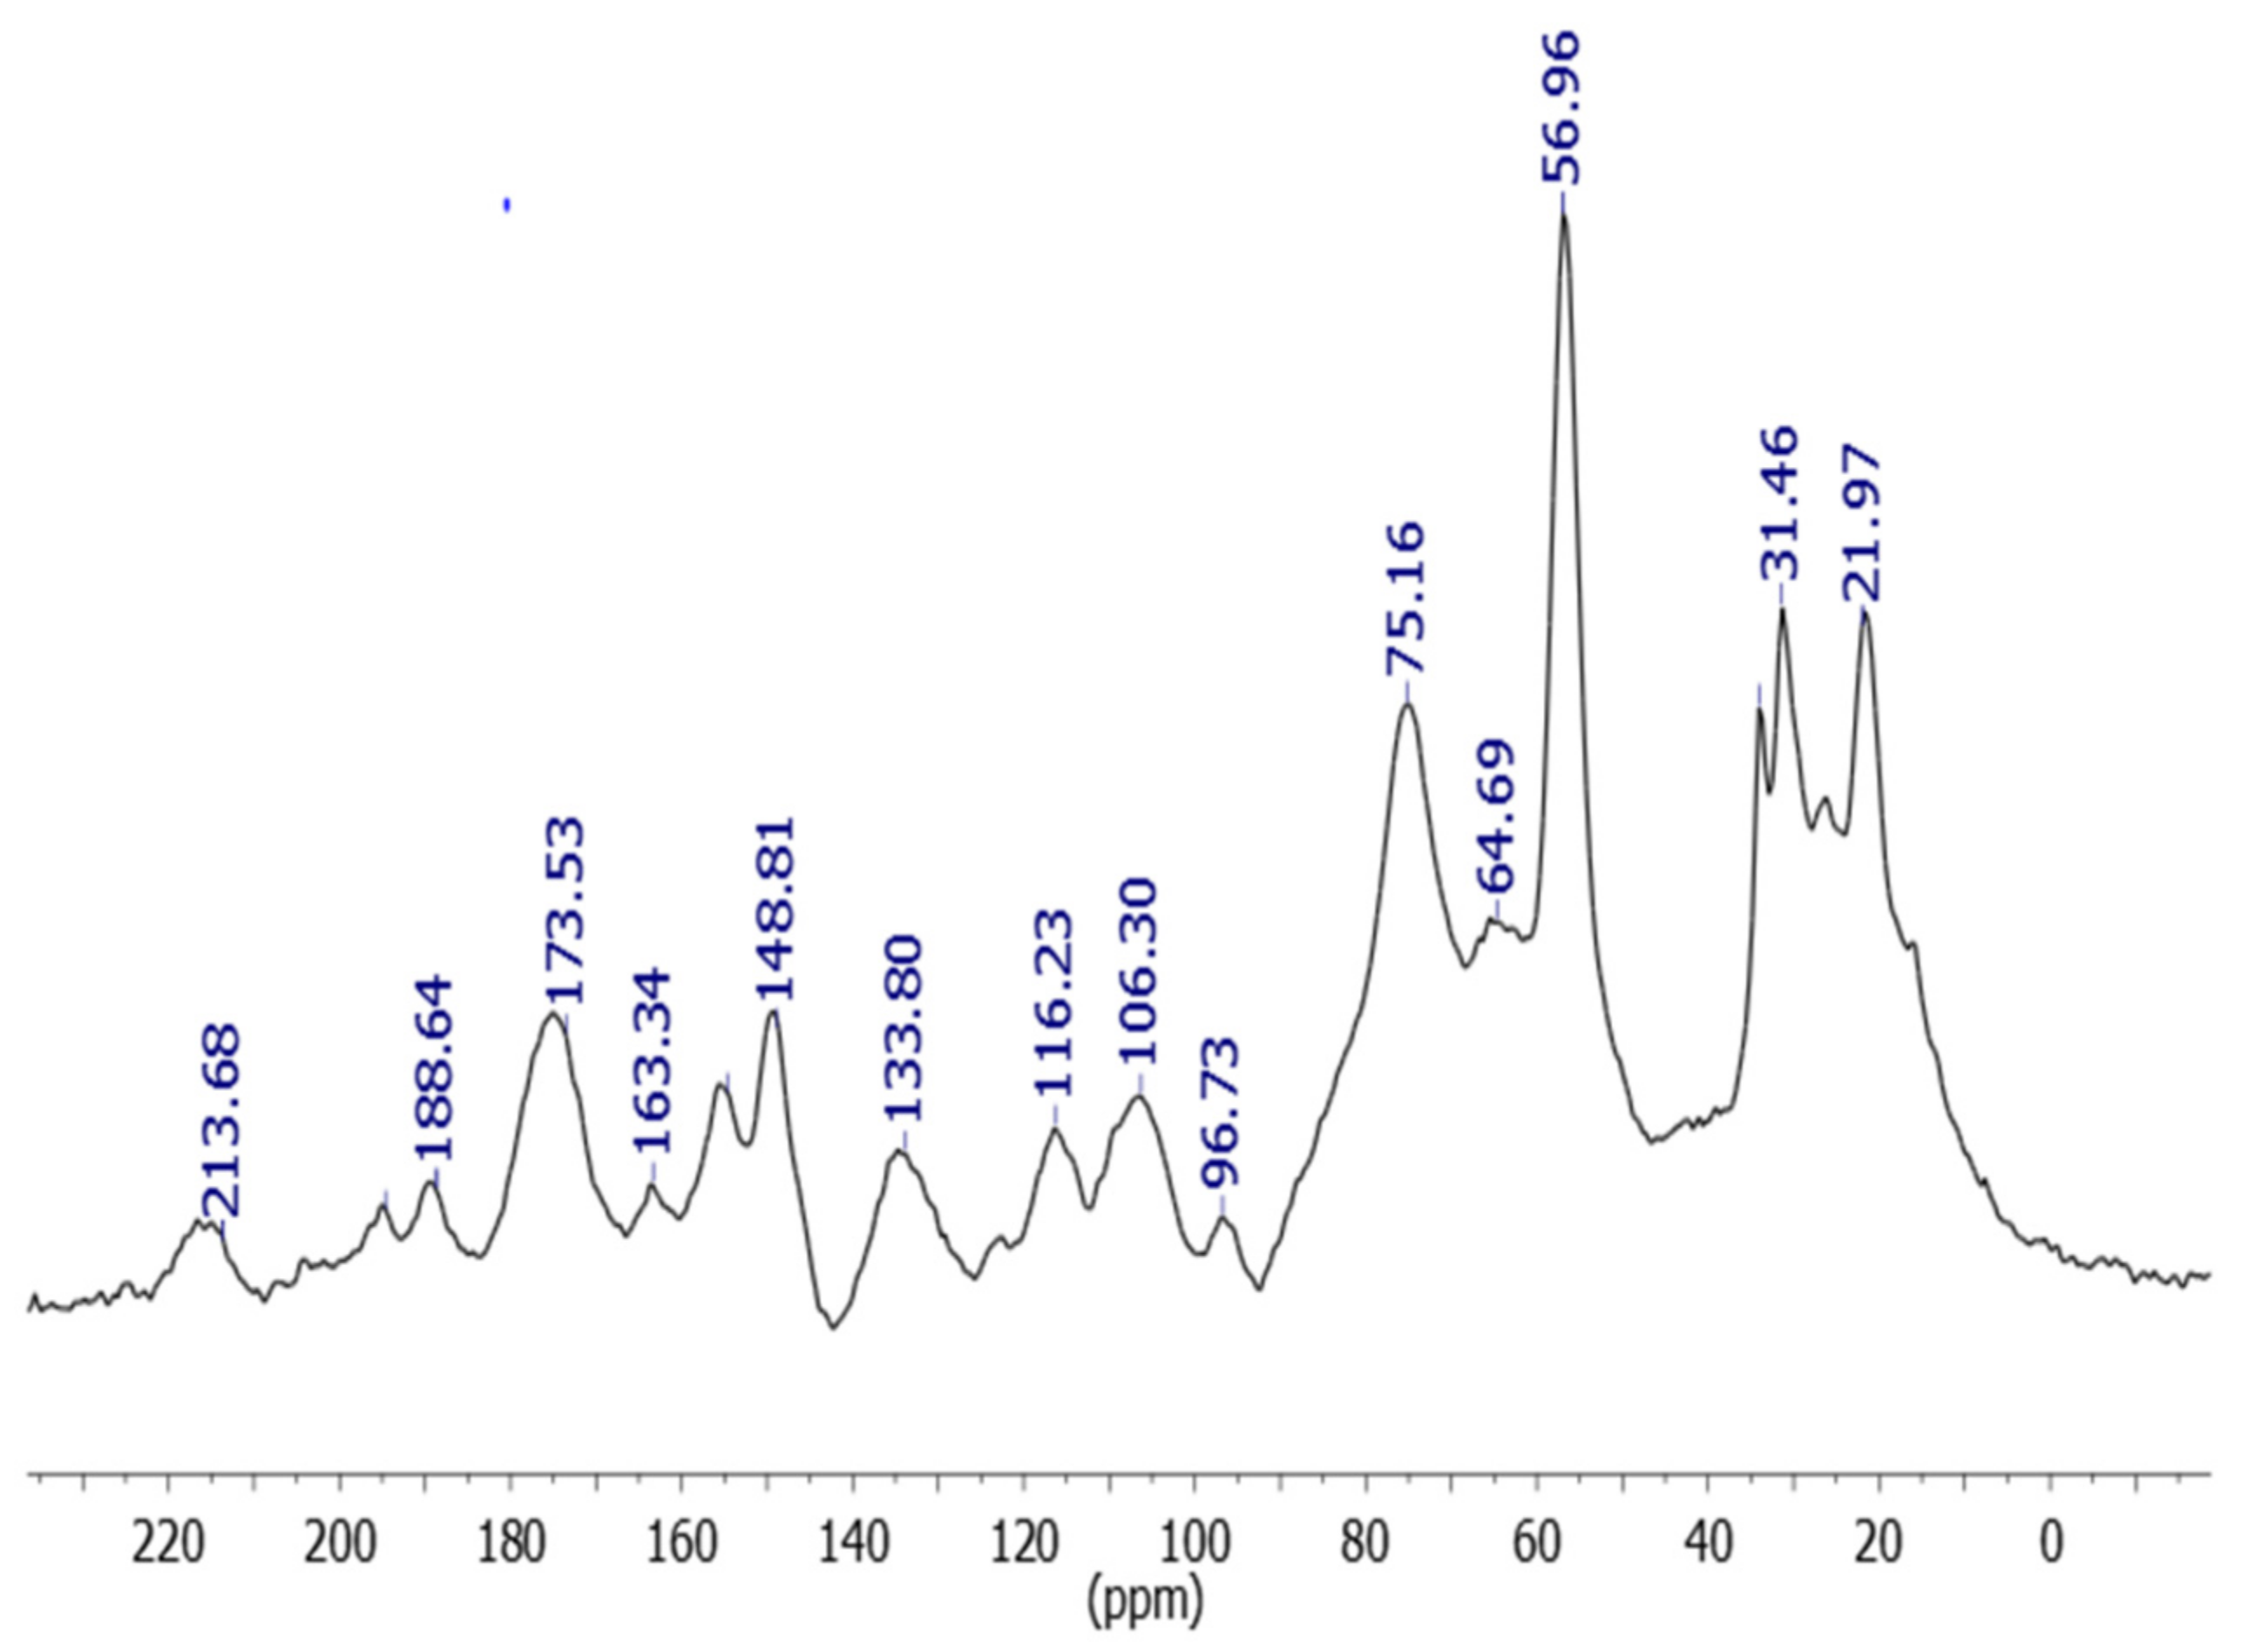
2.1. Biolignin Extraction and Analysis

Esparto grass fibers were collected in September 2016 from Houita (33°37′36″ N, 2°26′23″ E) located in Laghouat Province (Algeria). To extract biolignin from the plant, the CIMV process was used as described by Abdelkafi et al. [19]. Seven-centimeter-long pieces of Esparto grass (30 g) were soaked with a mixture of formic acid, acetic acid, and water (30:50:20 v/v/v, 300 mL) at 60 °C for 1 h. The resulting mixture was heated to 107 °C for 3 h, biolignin from the Esparto grass was removed from the boiling liquor, gained through filtration of the unbleached samples by evaporation of water and acids, and it was isolated by precipitation in water. The precipitate was dried at 40 °C for 28 h. This precipitate is a mixture of organic components such as lignin and polysaccharides and other inorganic nutrients (referred to as lignin) [2,19]. The obtained extract was first analyzed by a solid-state 13 C NMR using a spectrophotometer Bruker Advance 500 MHz at room temperature [13] to identify its main function for organic synthesis in soil: aliphatic 22–34 ppm, methoxyl groups 57 ppm, aliphatic hydroxyl 65–75 ppm, aromatic carbons 106–154 ppm, carboxylic groups 173 ppm [4,13] (Figure 1). The extract was secondarily subjected to physicochemical analysis (Table 1).

2.2. Experimental Design for Soil Fertilization

For enhancing soil fertility, a soil fertilization test was performed with three biolignin treatments 0, 2, and 4 g/kg denoted as D0, D1, and D2, respectively. A completely randomized design (CRD) with three replicates for each concentration was used. However, a major advantage of the CRD is the simplicity in the computation of its analysis of variance (ANOVA), especially when the number of replications is not uniform for all treatments [25].
Small PVC containers, approximately 10 cm in diameter and 14 cm in height with a capacity of nearly 500 g, were used for this purpose, and a mixture of lignin and soil was prepared according to different treatment concentrations and filled within all of the containers with almost equal weights of 250 g and drainage holes at the bottom for excess water loss. Soil moisture contents were kept at 60% by adding water after every two days because of the optimal progress of various enzymatic and biochemical reactions that are necessary for the degradation of the lignin in the soil [2]. This experiment was performed at the Laboratory of Process Engineering of the University of Laghouat from 15 March to 15 September 2017 (180 days). The substrate (soil) used was collected from the agricultural perimeter of Mokrane (33°48′1.56″ N, 2°48′21.95″ E) located 4 km west of Laghouat city. The soil is not very differentiated. It is simply made up of a single horizon type and identified as Entisols according to the soil taxonomy [26].
According to Houyou et al. [24], the textural class of the used soil (substrate) is sandy, with particle percentages of 98% sand and 2% silt and clay. The main soil (0–20 cm) physicochemical characteristics are presented in Table 1. The samples were collected from the containers. The soil sample was taken every fifteen days for various physicochemical analyses, and biological analysis and humification were performed every thirty days.

2.3. Physicochemical Analysis of Soil Samples and Biolignin

The physicochemical analysis was performed following the procedures described by Mathieu and Pieltain [27,28]: the K, Ca, and Na contents in soil samples were determined by using a PFP7 Industrial Flame Photometer (United Kingdom), and P concentrations by inductively coupled argon plasma spectrometer 61 model (Thermo Jarrell Ash, Franklin, MA). Biolignin was digested using HNO3–H2O2 [2]. The digestion solution was measured for Na, K, Ca, and P concentrations by inductively coupled argon plasma spectrometer 61 model (Thermo Jarrell Ash, Franklin, MA). pH and electrical conductivity (EC) measurements were made in an aqueous solution (1:5) ratio (lignin:water) (soil sample: water) shaken for 30 min, and then measured using a digital pH meter (HI2002) and EC meter (WTW Inolab conductivity meter Level 1). Soil sample temperature was determined by electrical sounding, and soil sample moisture content was determined by drying at 105 °C until it reached a constant weight. Organic matter was estimated by drying and subsequent ignition at 650 °C/for 5 h [28]. Total soil nitrogen (N) was determined using the Kjeldahl method [29].

2.4. Soil Sample Biological Analysis

Degraded soil amendments can be performed by the monitoring of biological analysis to understand the relationship between microbial successions (bacteria, fungi) and laccase enzyme.

2.4.1. Enumeration of Bacteria and Fungi

For microbial enumeration, two agar mediums were used: potato dextrose medium for fungi and yeast peptone glucose medium for bacteria [30]. The microbiological analysis was carried out using a suspension of 1 g of soil in 9 mL of sterile distilled water. The suspension was then stirred manually for 30 min to release as much of the microbial load as possible. For the enumeration of bacterial and fungal microflora, serial dilutions were prepared according to the following concentrations in sterile distilled water (NaCl 0.85%): 10−4, 10−5, 10−6, 10−7, 10−8, and 10−9. Then, these dilutions were used to inoculate agar media on Petri dishes by taking 0.1 mL of each dilution. Culturable bacteria were quantified on yeast peptone glucose agar (LPGA) (yeast extract 5 g/L, peptone 5 g/L, glucose 7.5 g/L, agar 15 g/L) after two days of incubation [31]. Fungi were quantified in potato dextrose agar (PDA) (potato infusion 200 g, dextrose 20 g, agar 20 g, distilled water 1 liter) after three days of incubation [32]. All microbial groups were replicated thrice and incubated at 30 °C.

2.4.2. Laccase Activity Extraction

Laccase activity was performed to better understand the dynamics of organic matter. As the studied organic material is lignin, monitoring the dynamics of laccase activity is essential due to the recalcitrant nature of lignin degradation. It is necessary to understand how the degradation of biolignin takes place by the phenomenon of oxidation/polymerization of humic substances. This also allows us to understand the relation of the degradation of biolignin with the physicochemical factors and with the microbial biomass that contributes to its humification. In the present study, the selected method for laccase activity was performed by different methods, i.e., phenoloxidases: laccase and lignin peroxidase, but only the laccase responded.
Laccase enzyme extraction was carried out in a 0.1 (mol/L) phosphate-buffered solution (pH 6) at laboratory temperature for 2 h on a reciprocal shaker, then at 4 °C for 24 h, followed by filtration through Whatman 5 filter paper to remove floating debris material, followed by centrifugation at 12,000 rpm for 20 min [33,34].

2.4.3. Laccase Activity Measurement

The measurement of the laccase activity was carried out in 2 ml of 0.1 (mol/L) phosphate buffer, containing 50 μL of guaiacol (0.1 ml of the guaiacol stock solution 98% in 10 mL of DMSO). The oxidation was monitored at 470 nm after the addition of 100μL of enzymatic extract [35] (Gouzi, Flurkey, and Abdelhafid 2007). One unit of enzyme activity is defined as the amount of enzyme forming 1 mmol of reaction product per minute and is expressed as Ug soil (mmol min−1 g soil) [33].

2.5. Humification Degree of the Soil

Ultraviolet–visible spectroscopy was carried out in the present study to reveal the degree of humification. This technique is widely used for determining the molecular properties of humic material (humic or fulvic acids) by the ratio E4/E6 calculation, which provides important information on the structure of humic acid [36,37]. According to Reddy et al. [38], the E4/E6 ratio is used as a significant humification index. The ratio E4/E6 is determined from absorbance measurements at 472 nm (E4) and 665 nm (E6). The absorbance at 472 nm (E4) characterizes organic matter at the beginning of humification and the absorbance at 665 nm (E6) corresponds to highly humified and condensed materials with abundant aromatic groups [39]. At the beginning of humification, 472 nm rather than 665 nm was performed to avoid the increased absorption in the UV region of the spectrum of proteins and carbohydrates, which are non-humified materials [40]. In the present case, the method was adapted from that of [41,42]: 1 g of soil and 50 mL of 0.5 (mol/L) NaOH were stirred continuously for 2 h, followed by centrifugation (30 min, 3000 rpm), and the UV–visible absorption spectra of the samples were recorded using a spectrophotometer (Jenway 6405 UV/Vis).

2.6. Statistical Analysis

Results were subject to ANOVA, RMANOVA in XLSTAT version 2016.02.28451. Grouping and significant differences for all statistical tests were evaluated at the level of p ≤ 0.05 (Tukey 95%). PCA (principal component analysis) and RDA (redundancy analysis) were adopted in the same software for evoking physicochemical and biological soil properties and biolignin treatment relationships during the test.
PCA was used to synthesize and complete the lack of information on the evolution of the amendment by visualizing the best correlations that can be observed between physical, chemical, and biological factors and for the results of the degradation of organic matter. RDA was carried out to study the direct relationship between biological and physicochemical factors and their impact on the degradation of organic matter and its humification.

3. Results

The ANOVA test (S1 and S2) was performed at p ≤ 0.05 (Tukey 95%) by comparing the means of each measured soil parameter and by considering the same time under the three treatments. We found that there are interactions between treatments and sampling times for all measured parameters. It was confirmed by RMANOVA (Table 2 and Table S1) that the effect of the treatment has a significant impact on all the soil parameters except for carbon (p = 0.084). On one hand, the effects of the repeated measurement, which is, in our case, time, show (Table 2 and Table S1) that time has a significant impact on all the characteristics of the soil (p < 0.001). On the other hand, the interaction between time and treatment has a significant impact on all soil characteristics (p < 0.001) except temperature (p = 0.126). It appears that treatment and time significantly affect the measured characteristics of the fertilized soil.

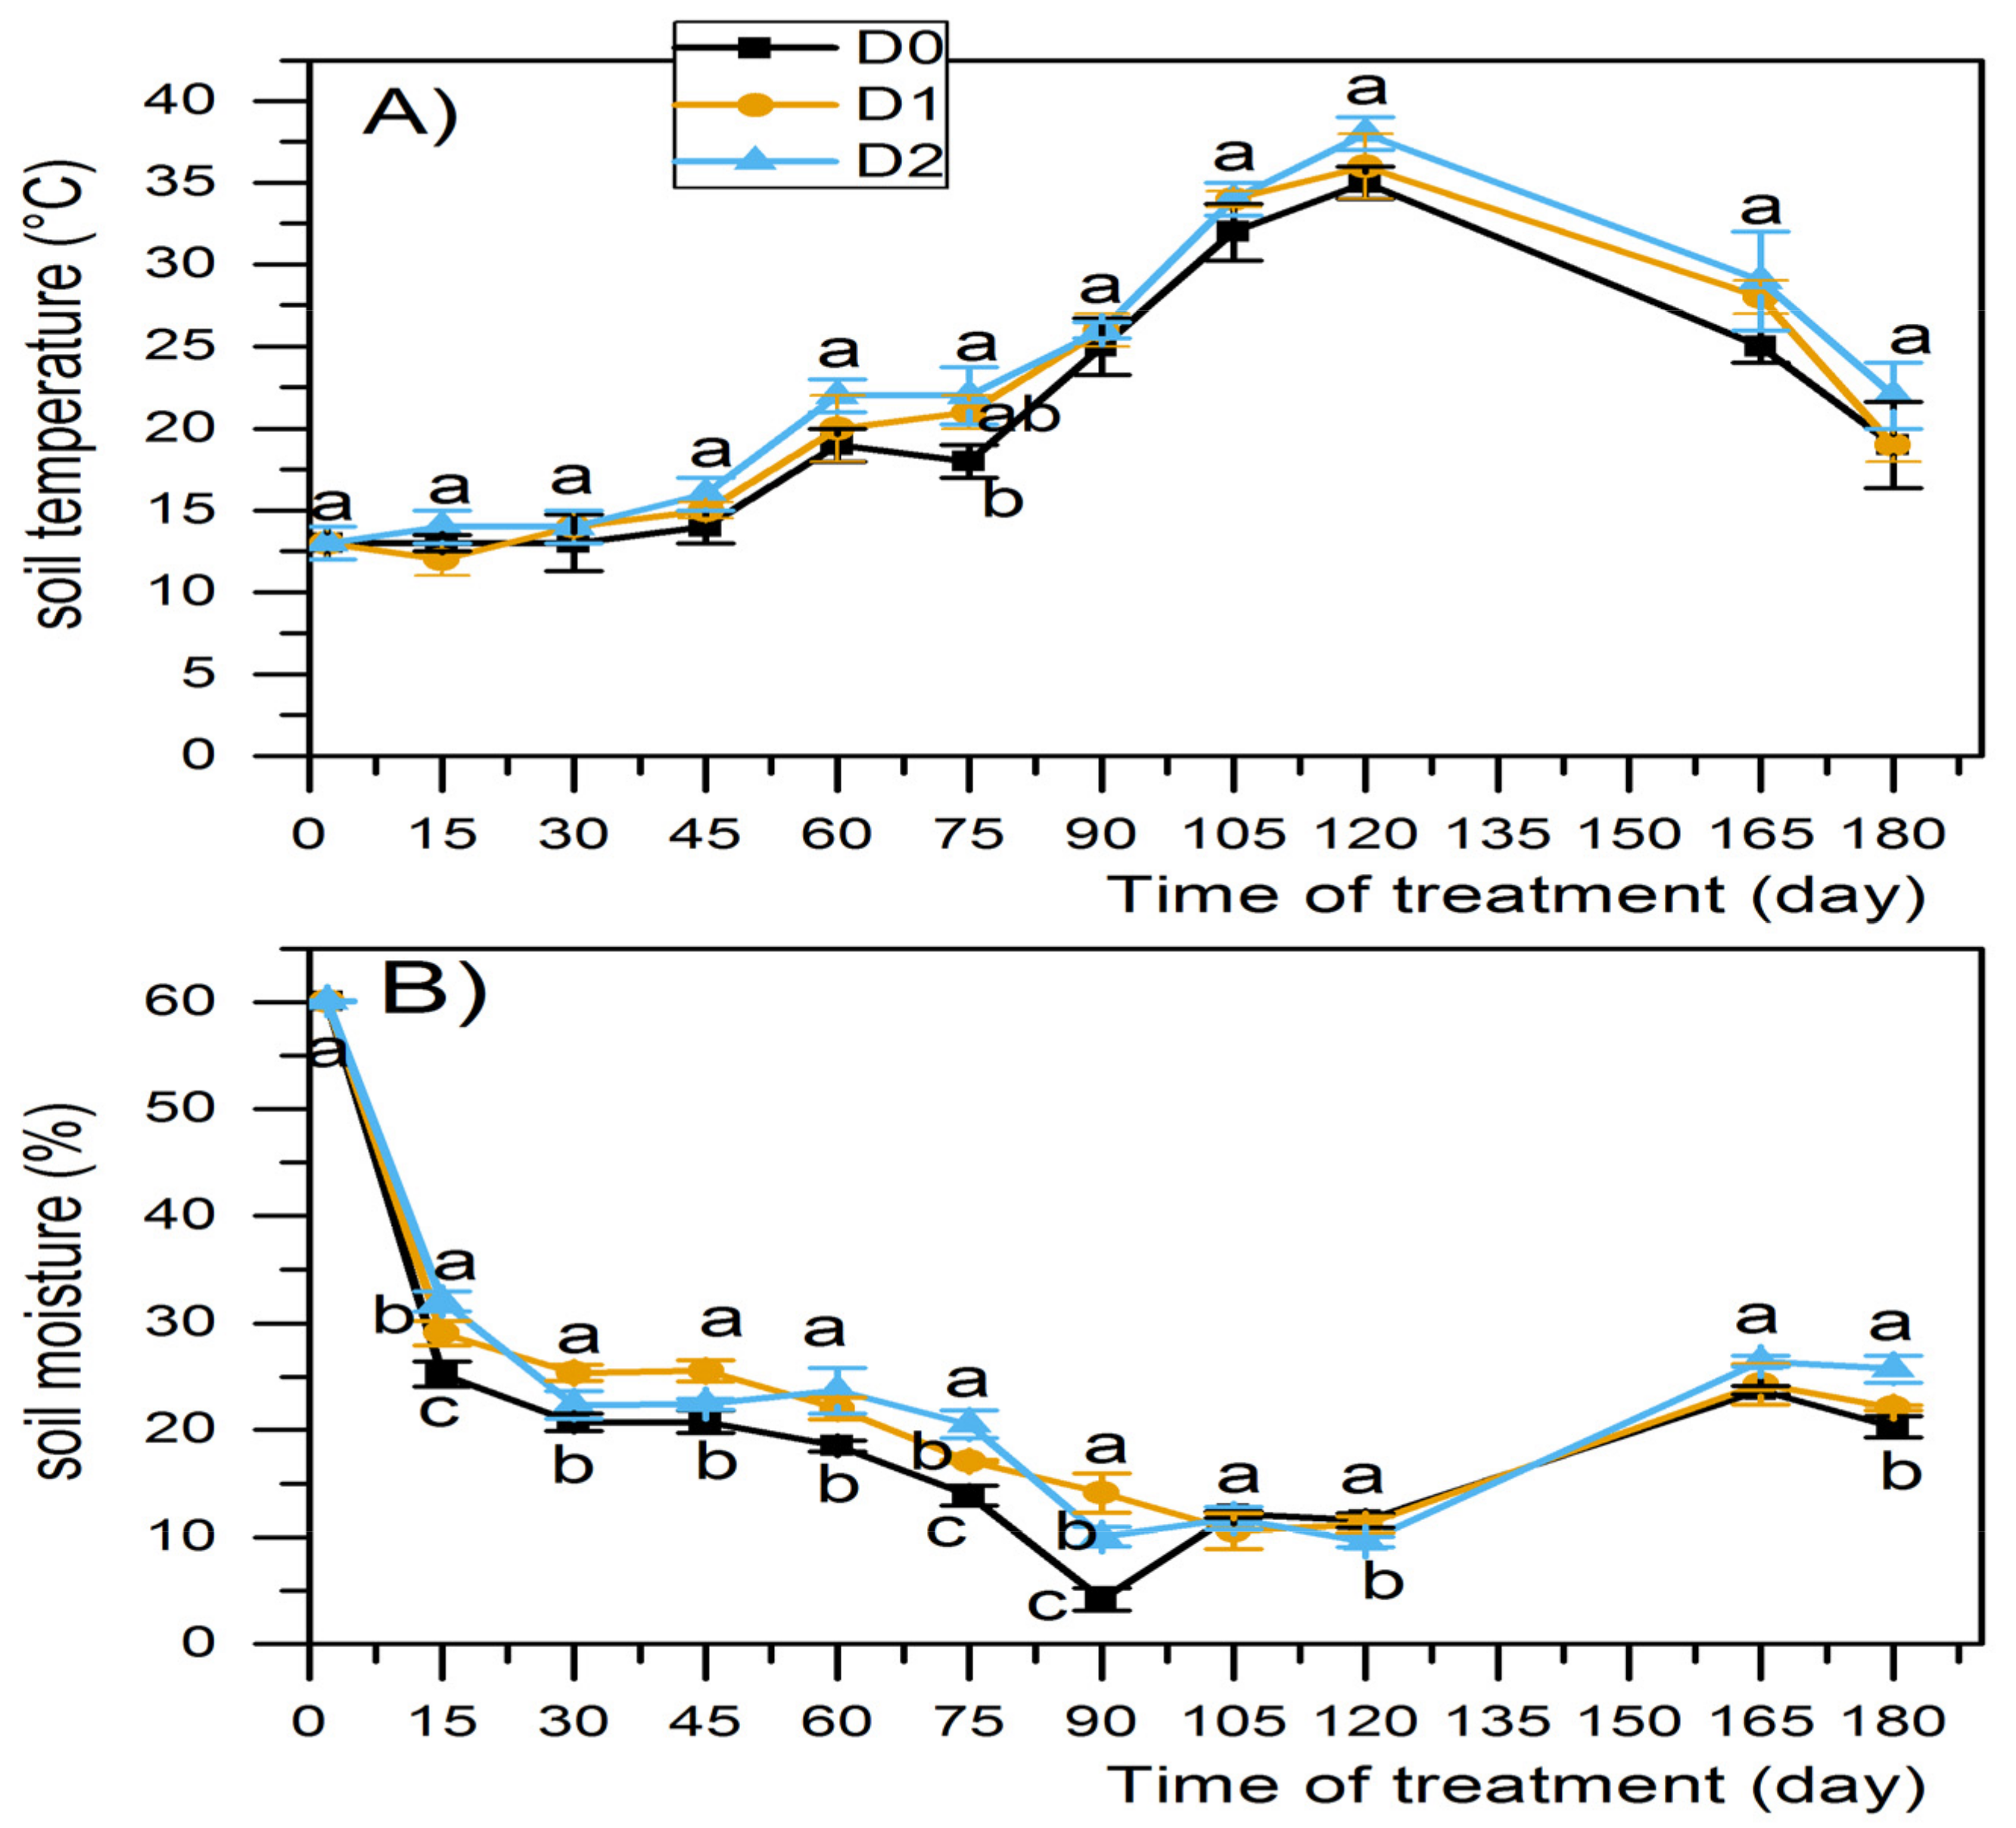
3.1. Physical Factors

3.1.1. Temperature

The effect of the lignin treatment on soil temperature variation is well highlighted (Figure 2A). It was noted that temperature fluctuates over 180 days in two different phases. In the first phase, temperature evolves between 13 and 38 °C, while in the 2nd phase a good decline is observed. The phase of distribution is recorded as an increasing phase at 0 to 120 days, during which a soil temperature is significant at 75 days and a maximum of 38 °C was reached. The second phase involved a decrease between 120 and 180 days, during which a fall of 19 °C was observed.

3.1.2. Soil Moisture

A fluctuation is observed in soil moisture contents with the application of lignin (Figure 2B). At the beginning of the experiment at 0–15 days, the soil moisture dropped by about 25%. Following this, alternating phases of very slight stabilization/fall are observed for up to 120 days. From this point until 165 days, the soil moisture content increased by nearly 23%, 24%, and 26% for D0, D1, and D2, respectively. However, during the last 15 days, D0 and D1 show a slight drop of 20% and 22%, while D2 shows certain stability.

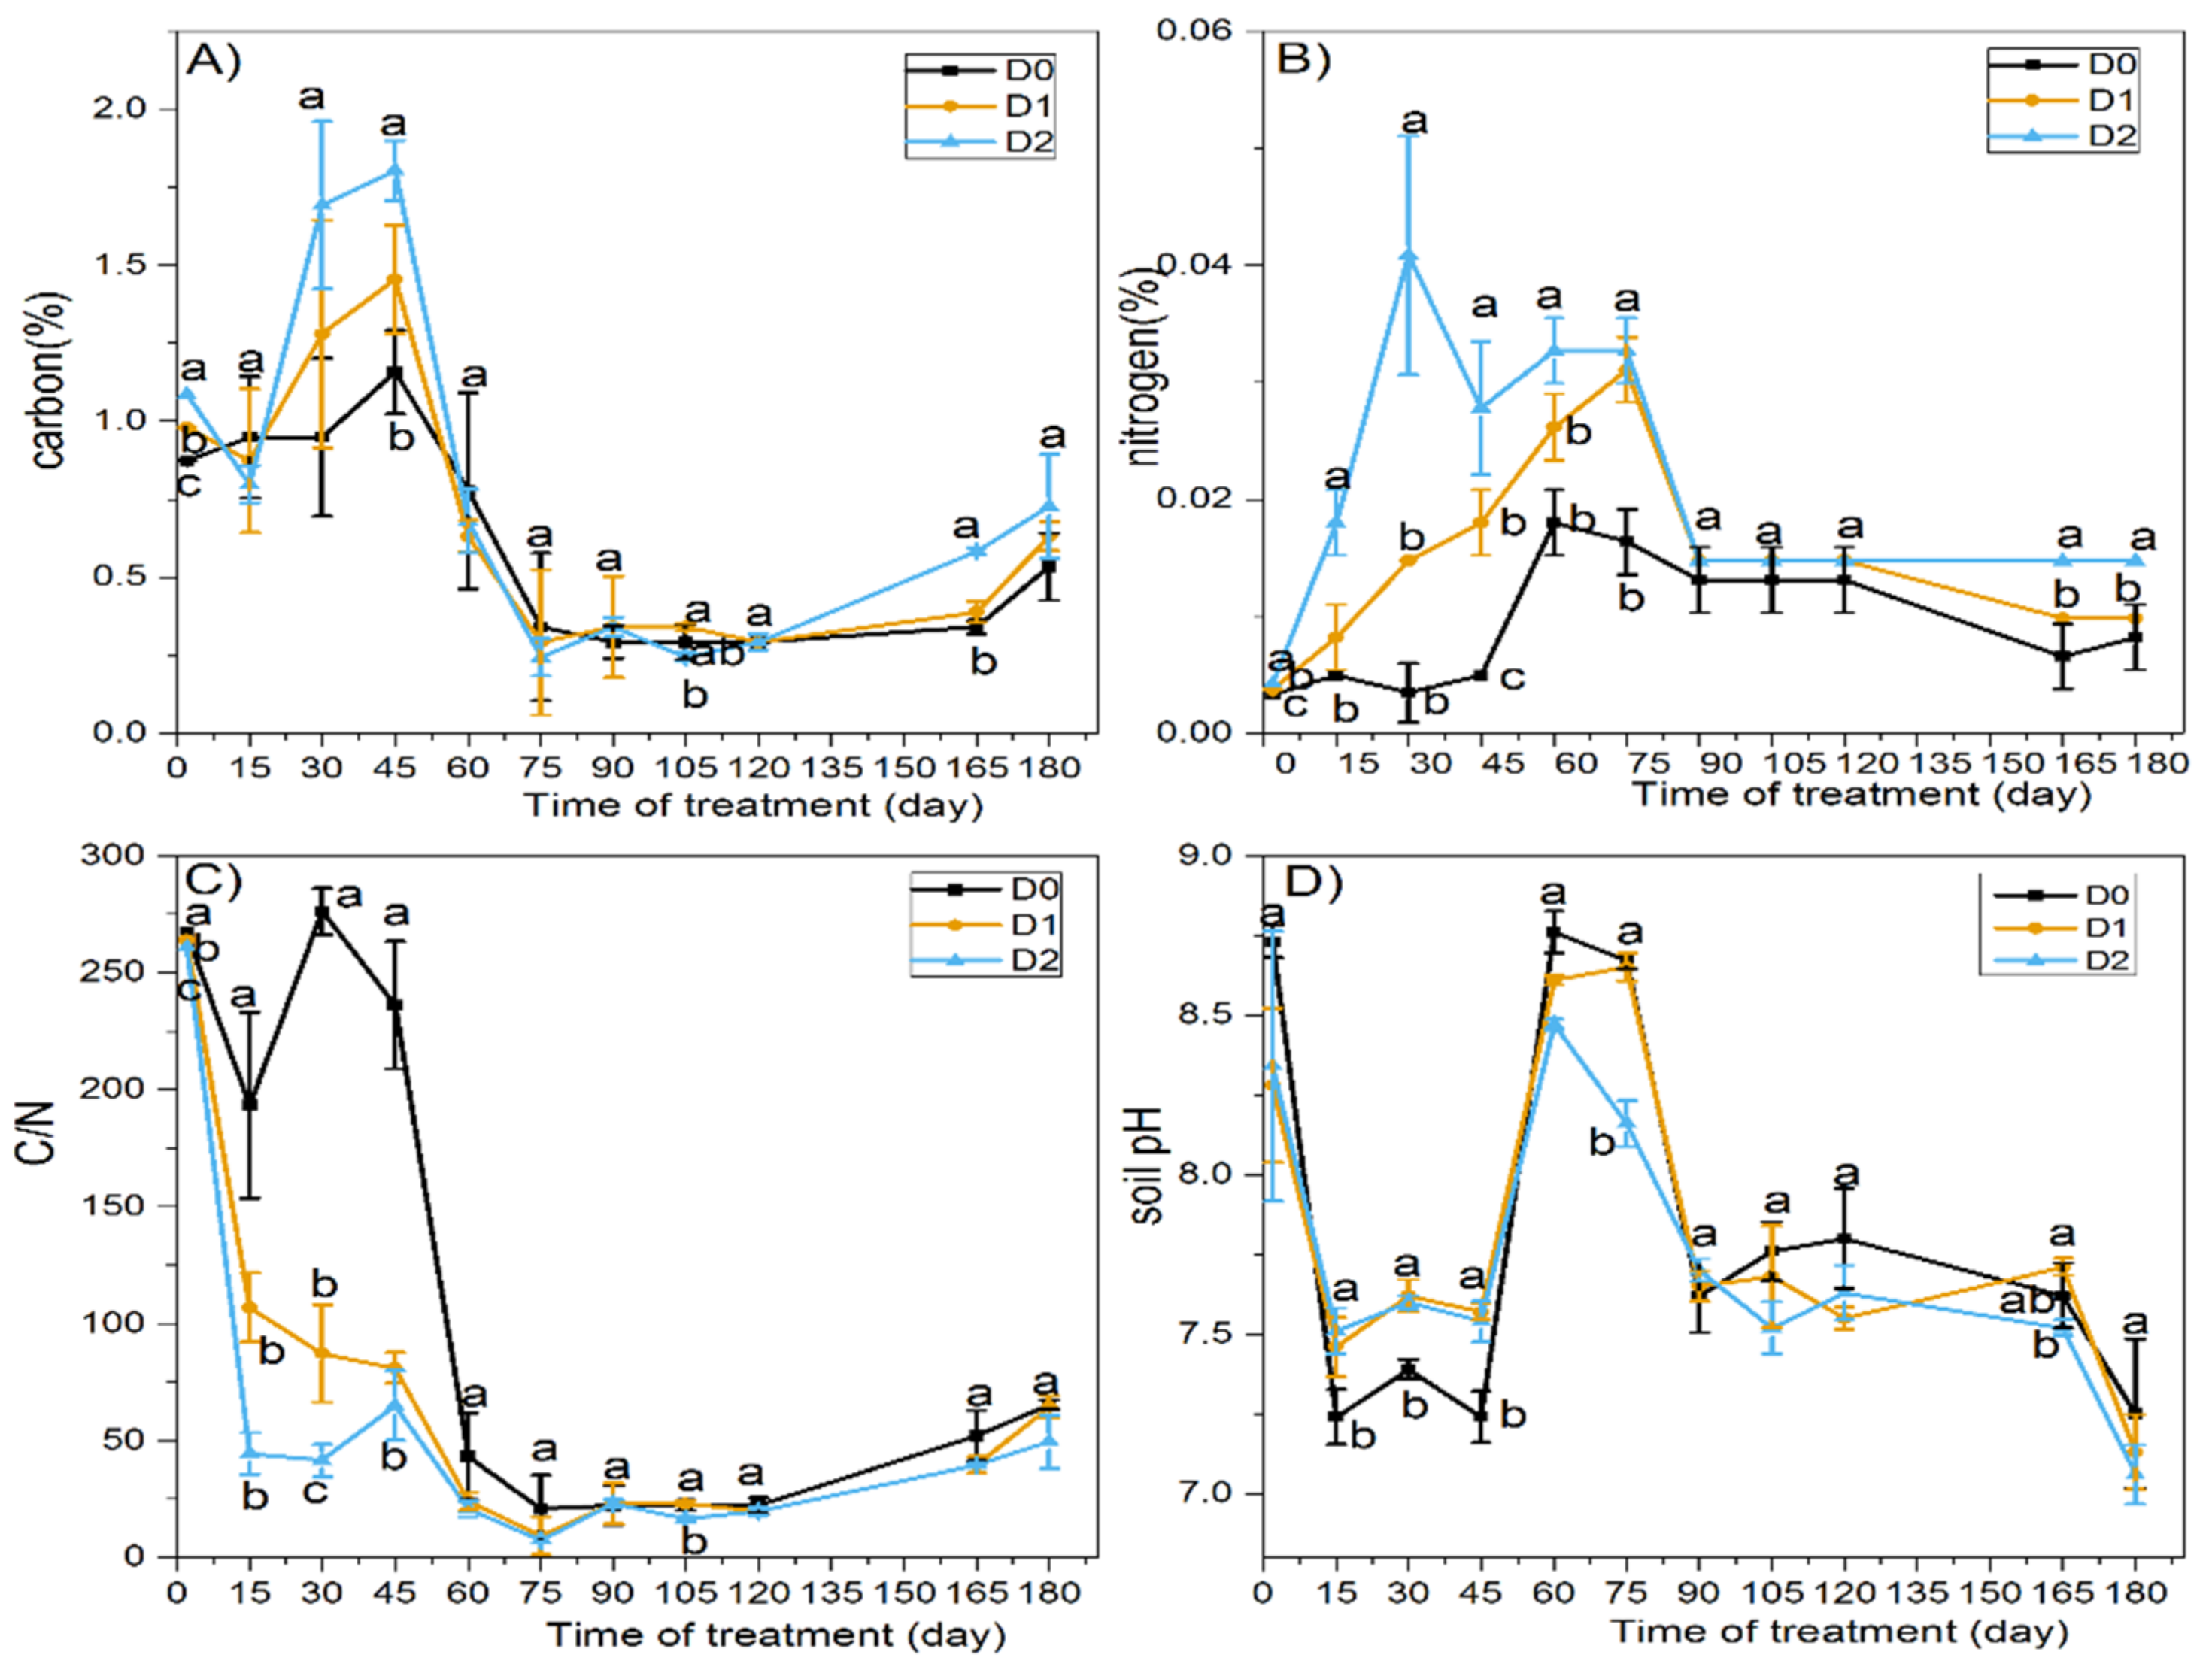
3.2. Chemical Factors

3.2.1. Soil Carbon

During the 180 days of the test, we observe in Figure 3A two decreases in the soil carbon concentration: the first is observed during 0–15 days for the two applied treatments D1 and D2, respectively, of 6% and 16%. The second-largest decrease at 45–75 days is still for D1 and D2 with 65% and 87%, respectively. The phase of 45–75 days is followed by the stabilization of the dynamics up to 120 days. Additionally, during the test, two increases in the soil carbon content are recorded: the first one is at 15–45 days for the three treatments D0, D1, and D2, respectively, with 11%, 33%, and 56%. The second increase was recorded at 120–180 days also for the three treatments D0, D1, and D2 with, respectively, 14%, 19%, and 24%.

3.2.2. Soil Nitrogen

The contribution of the amendment remarkably shows a change in the nitrogen content of the soil throughout the test (Figure 3B). This content remains proportional to the treatment of biolignin applied. Throughout the experiment, the nitrogen concentration varies between 0.0034 and 0.0408% in the soil. Increases are observed at 0–60 days in D0 and between 0 and 75 days in D1 and D2 (Figure 3B). This is followed by a decrease at 60–90 days for D0 and 75–90 days for D1 and D2, and then succeeded by a stabilization–decrease stage in D1 and D0, but for D2 there is a continuous stabilization up to 180 days.

3.2.3. C/N Ratio

Dynamics shows the direct effect of the application of biolignin. The C/N ratio was inversely proportional to the applied treatment (Figure 3C). For the three treatments applied, the C/N values are variable between 266 and 49, observed, respectively, at the start and the end of the test. The witness marks an exception at 30 days, recording a C/N ratio of 276. We observe that the dynamic transitions between two stages involve a time of decrease in the C/N ratio at 0–75 days, between 0 and 15 days it is accentuated, later it slows down to a stabilization until day 45, to resume until day 60, with a relatively larger decrease that continues until 75 days to reach the minimum values of C/N 20, 9, and 7, respectively, for D0, D1, and D2. A slight increase in C/N is observed between 75 and 90 days, followed by stabilization up to 120 days for the three treatments applied. Between 120 and 180 days, a relative increase is observed, at the end of which the C/N ratio evolves to around 55.

3.2.4. Soil pH

The application of biolignin causes a pH change. However, this change varies depending on the treatment and the number of days. Overall, the 180-day pH record is represented in Figure 3D, and the pH of all three treatments varies between basicity and acidity in three stages, namely fall, stabilization, and rise. Three pH decreases are observed: 0–15 days for the three treatments D1, D2, and D0, respectively; another decrease between 75 and 90 days for D1 and D0; and a third one between 165 and 180 days for D1, D2, and D0. An exception is made by D2 between 60 and 105 days with a longer duration of 45 days, after which the pH drops from 8.47 to 7.52. We note that each phase of pH decrease is followed by a stabilization phase and is relatively longer between 15 and 45 days because it lasts 30 days. Except for D2 between 105 and 165 days, another relative stabilization lasts 75 days between 90 and 165 days for D1 and D0. An increase in the pH is observed between 45 and 60 days for the three treatments. During this time, the pH converges towards values of alkalinity similar to those at the start of the experiment.
The pH dynamics (Figure 3D) can also be divided into two stages: the first stage is at 0–60 days, during which the treatment is proportional to the pH; the second stage is at 60–180 days, during which the pH is inversely proportional to the applied treatment.

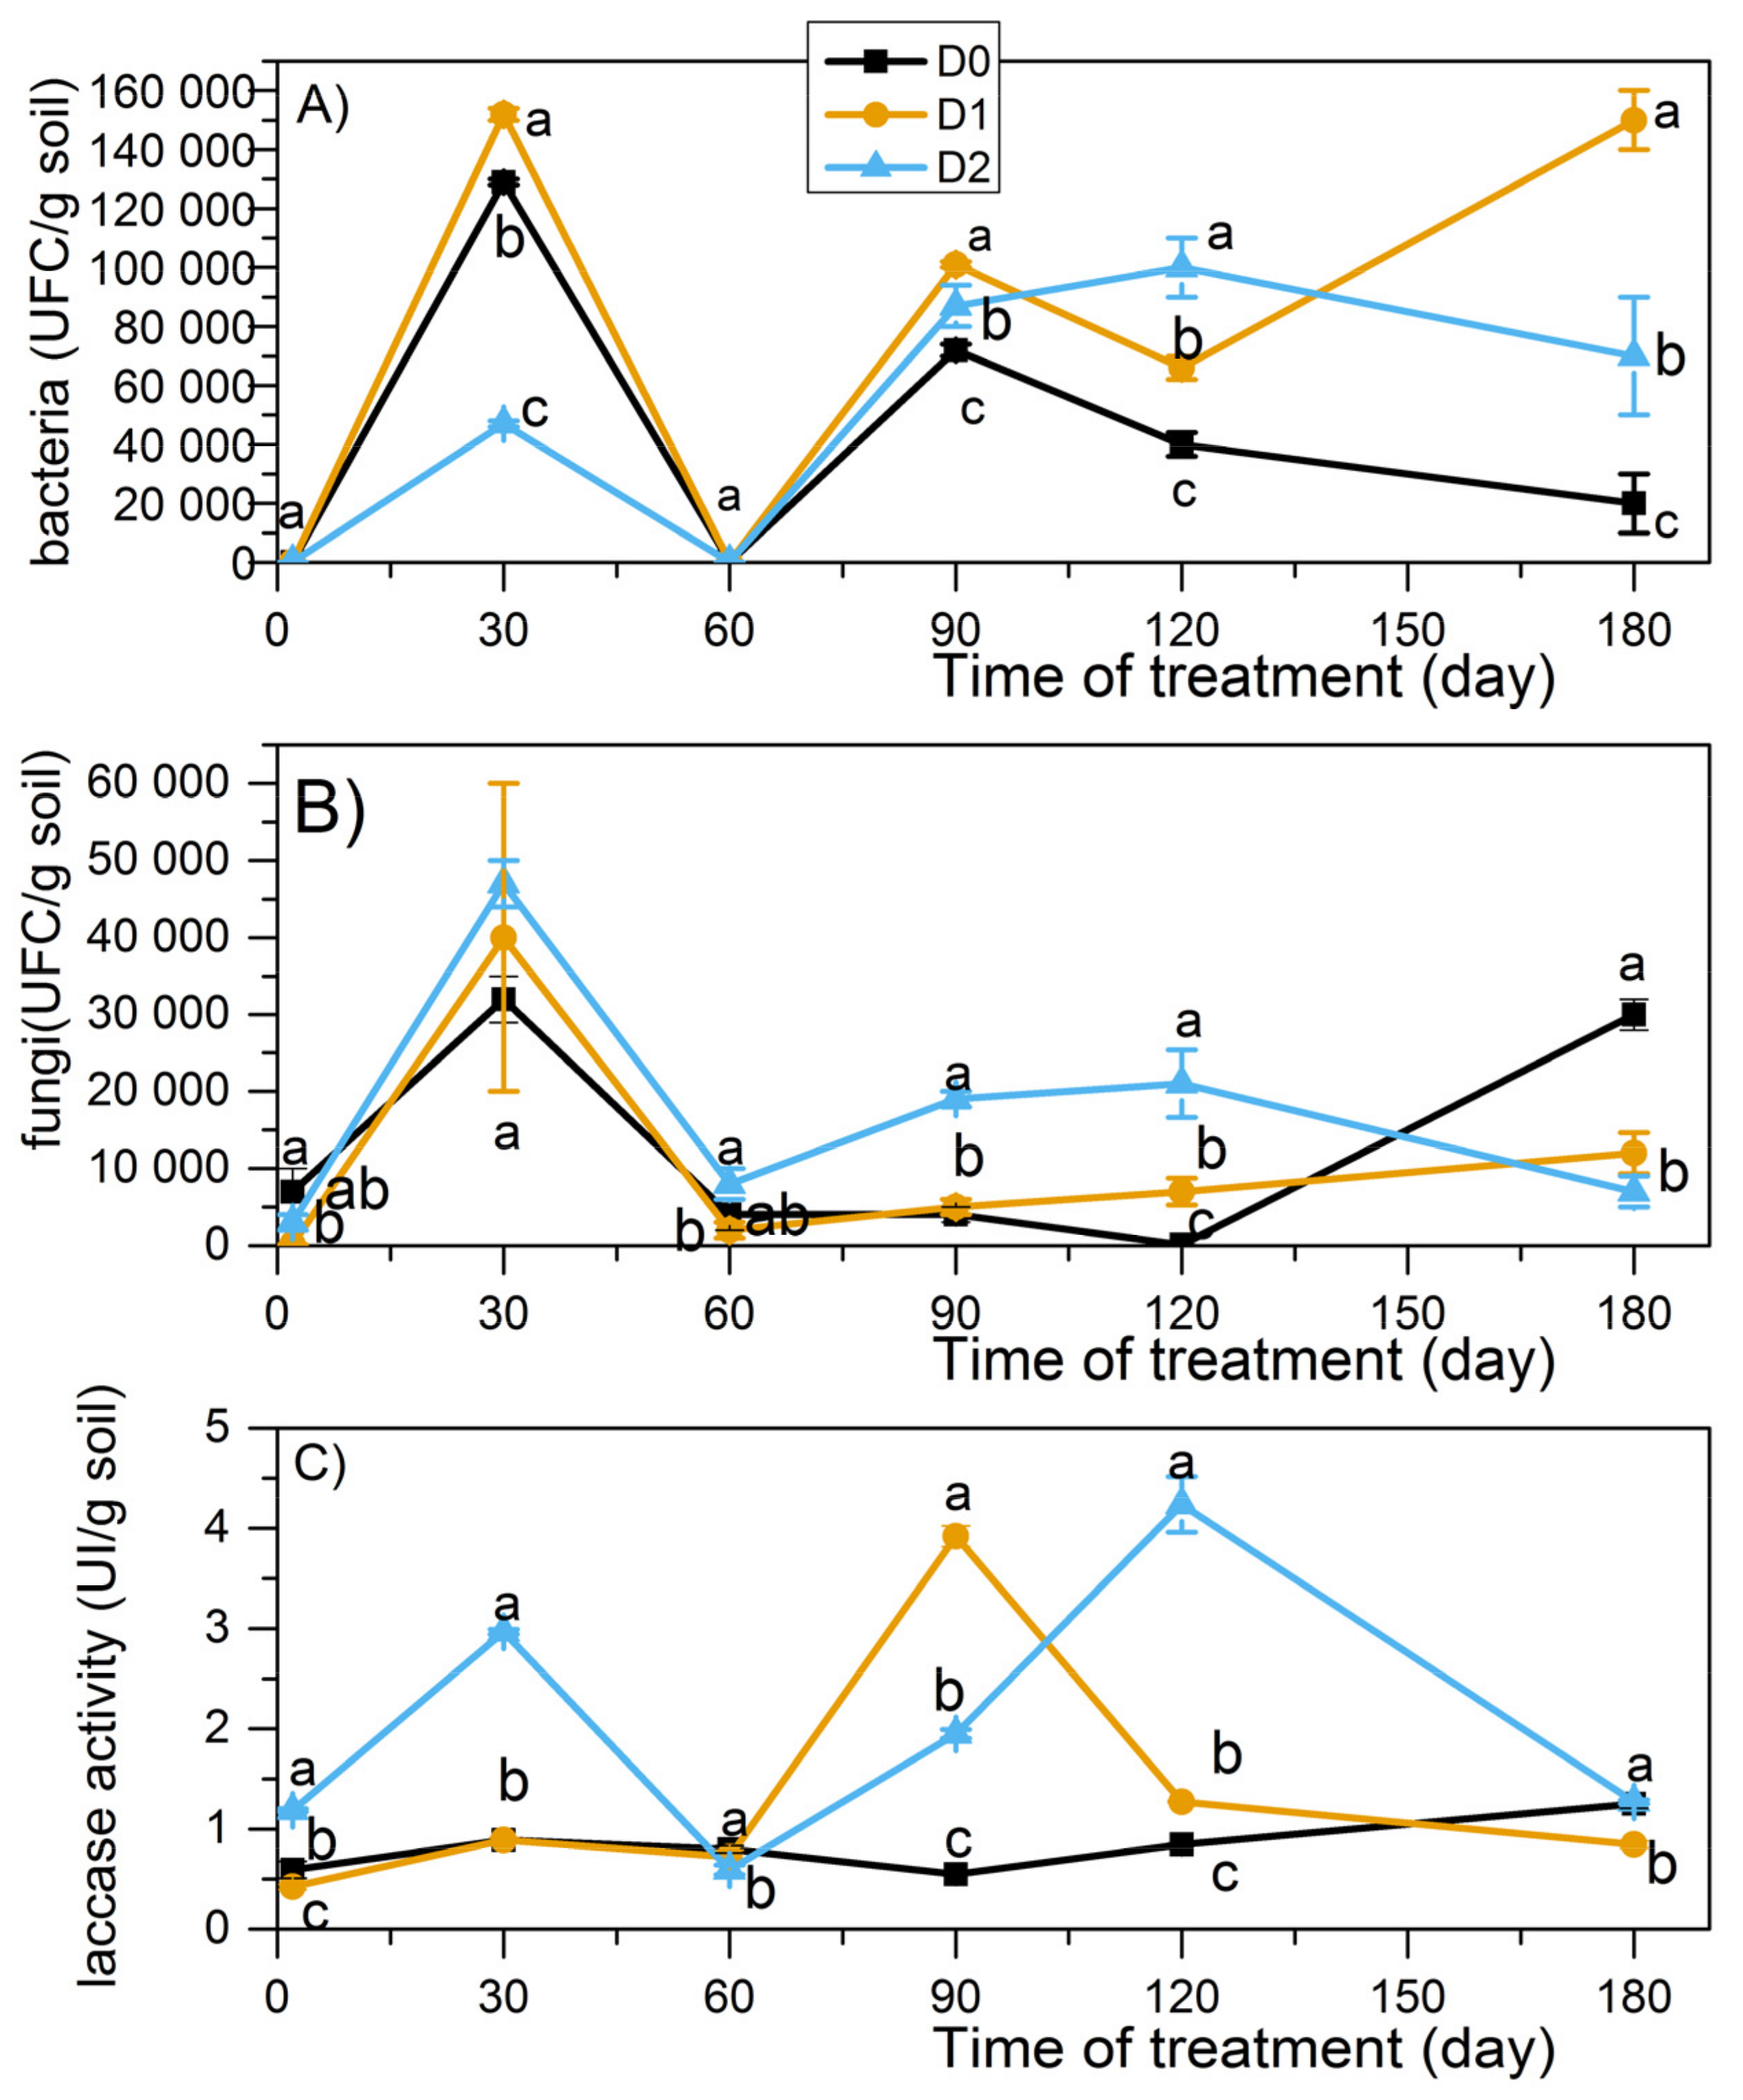
3.3. Biological Factors

3.3.1. Microbial Biomass

The results of the evolution of microbial biomass are presented in Figure 4A,B. During the 180 days, the predominance of the bacterial biomass is recorded. It evolves between a maximum of 152.103 UFC/g of soil observed at 30 days and a minimum of 102 UFC/g of soil at 60 days for D1, with intermediate values during other stages. During the experiment, fungal biomass fluctuated between 47.103 and 2.103 CFU/g of soil.
These microbial biomass values are observed in two phases: increase and decrease, prompting us to divide the test duration into two stages—0–60 days and 60–180 days. A very significant drop in this microbial biomass is observed at 60 days. Between 60 and 180 days, maximum levels of microbial biomass are most often observed for D2. During the trial, we notice that, generally, the bacterial biomass dominates D1. In contrast, the fungal biomass dominates the D2 treatment.
The proportionality of the applied treatment and microbial biomass treatment is noticed. The bacterial biomass is inversely proportional to the treatment of biolignin for the three treatments; this is the most significant between 0 and 60 days. The fungal biomass between 0 and 120 days is proportional to the treatment of biolignin.

3.3.2. Laccase Enzymatic Activity

Reading (Figure 4C) allows the laccase dynamics to be divided into two stages for the three treatments of the test—a first stage at 0–60 days and a second stage at 60–120 days. The highest laccase concentrations for D2 are observed during these two stages, with 2.97 IU/g of soil and 4.24 IU/g of soil, respectively. During these two stages, increase and decrease phases are observed. Between 0 and 60 days, the first laccase increase is observed, reaching 0.89 IU/g of soil (21%) and 2.97 IU/g of soil (60%), respectively, in D1 and D2 between 0 and 30 days. The second increase of 3.92 IU/g (93%) is observed in D1 at 90 days, and it is 4.24 IU/g of soil (100%) in D2 at 120 days. The laccase increase phases are followed by its decrease; for the three treatments, these laccase minimums are marked at 60 days.

3.3.3. Humification Degree of the Soil

The results obtained from the evolution of the E4/E6 ratio are shown in Table 3. During the 180 days, the quantitative relation E4/E6 values evolve between increase and reduce phases, for all samples: D0 (0.534, 1.818), D1 (0.964, 12.600), and D2 (4.167, 12.667). The maximum values are observed in the amended soils: D1 12.60 at 30 days and D2 12.66 at 60 days. It is also discovered that the values of the amended soil are significant, ranging between 5 and 12, when compared to the values of the non-amended soil D0, which are low and less than 2.

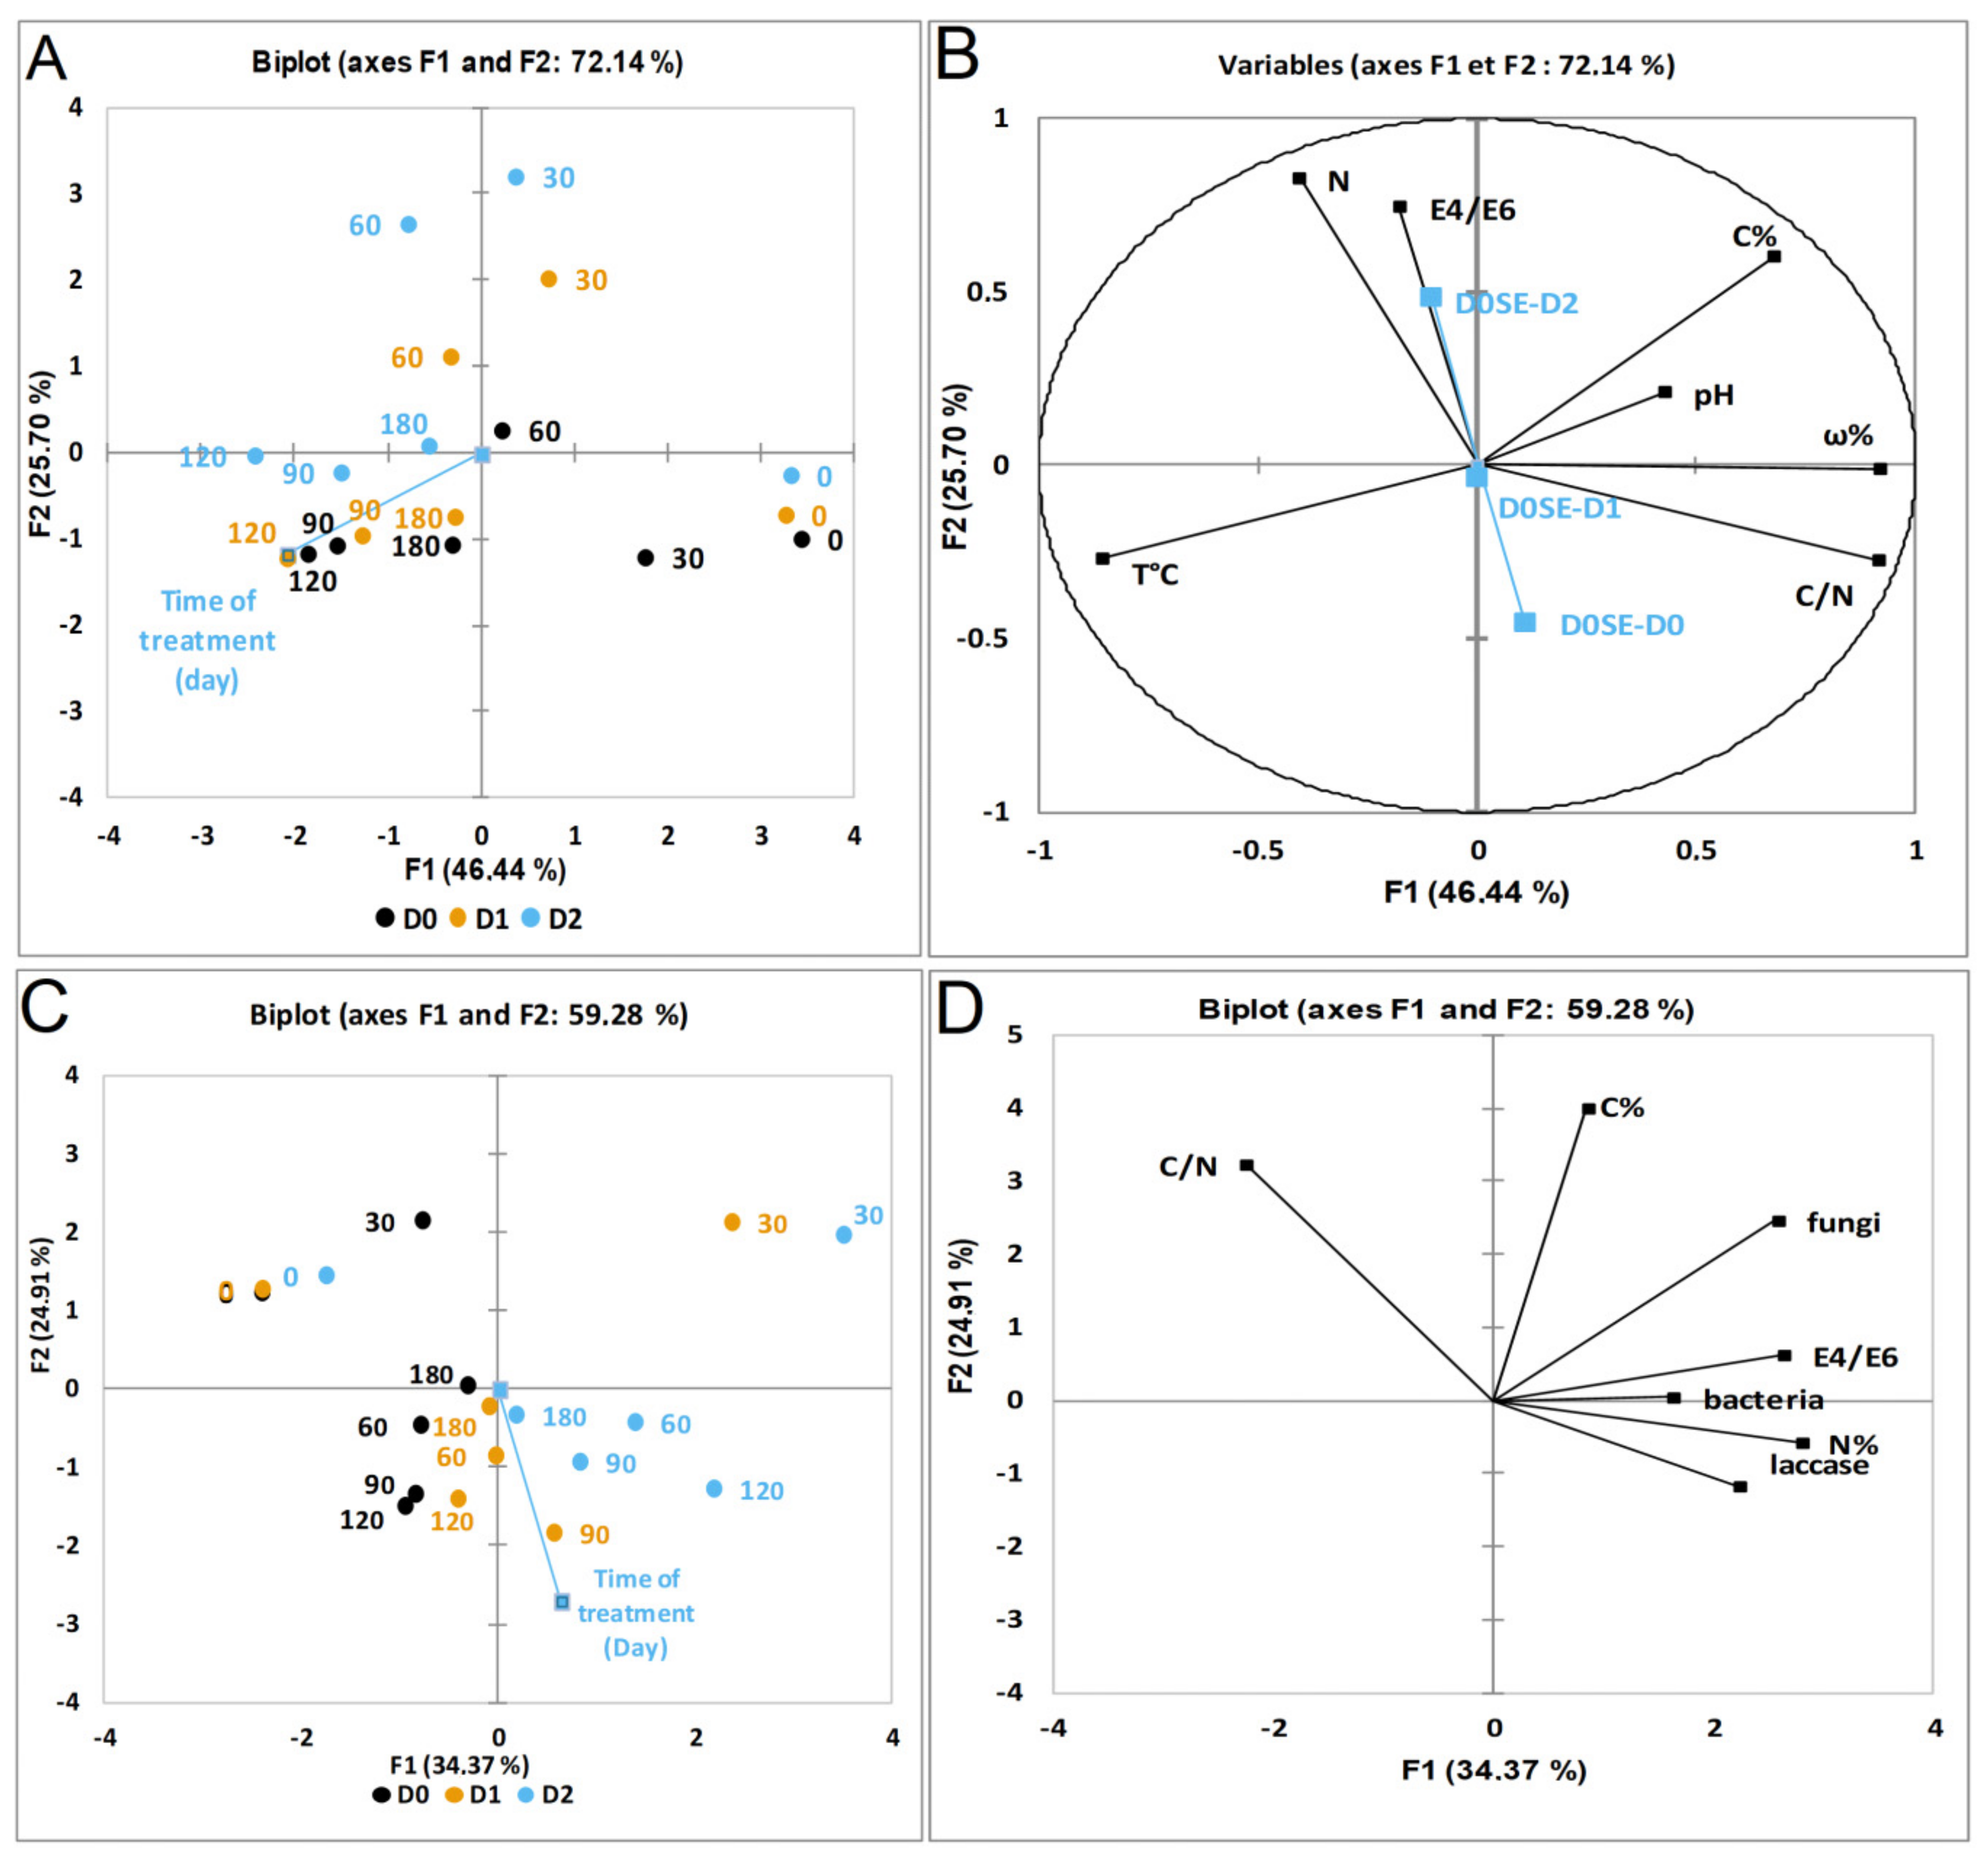
3.4. Relationship between the Parameters of Degraded Soil Amendement

The outcome of this study reveals that biolignin is valued as an organic amendment in degraded arid soil with three treatments, D0, D1, and D2, for 180 days, under the influence of fertilizing factors: physical (T °C, ω%) chemical (C%, N%, C/N, pH) and biological (bacteria, fungi, laccase). Only one factor is controlled, which is soil moisture, by irrigating every two days. According to the results obtained, we find that biolignin has a direct effect on improving the physicochemical and biological qualities of degraded soil. Indeed, in this context a PCA allows us to synthesize and complete the lack of information on the evolution of the amendment by visualizing the best correlations that can be observed between: i/PCA1 (Figure 5A,B): physical (T °C, ω%) and chemical factors of the results of the degradation of organic matter (C%, N%, C/N, pH, and E4/E6) of each soil treatment (D0, D1, D2); ii/PCA2 (Figure 5C,D): biological factors (bacteria, fungi, laccase) and chemical factors of the results of the degradation of organic matter (C%, N%, C/N, and E4/E6) of each soil treatment (D0, D1, D2). Figure 5 of the principal component analysis is represented in two PCAs: PCA1 (Figure 5A,B) and PCA2 (Figure 5C,D), of which A, B, C, and D are added to have a better visualization of the correlations recorded. Overall, we observe that the PCA is determined according to two components (F1 and F2). These two components determine 72.14% of all the information for PCA1 and 59.28% for PCA2. This explains why physicochemical factors have a much greater effect than biological and chemical factors on the degradation of organic matter. We notice on one hand that the greatest correlation of the factors is observed in D2, which is often negatively correlated with D0 in view that the angle between the two vectors of D2 and D0 is high. On the other hand, D1 often remains in the center, sometimes it is located in the zone of D2, and sometimes it is located in the zone of D0. This explains why D1 behaves sometimes like D0 and sometimes like D2.
PCA1: Figure 5A,B present a high rate of variability observed in F1 with an order of 46.44% compared to F2 25.70%.
Figure 5A shows a chronological distribution of the treatments, of which F1 shows a positive correlation with the youngest treatments at 0, 30, and 60 days located on the right and a negative correlation with the older treatments at 60, 90, 120, and 180 days located on the left. PCA1, Figure 5B, shows that the variables pH, ω%, C%, and C/N correlate positively with F1 and are oriented towards the youngest amendments on the right, and the variables T °C, N%, and E4/E6 correlate negatively with F1 and are oriented towards the oldest amendments on the left. We also notice in PCA1 (Figure 5B) that the temperature is negatively correlated with pH and ω%.
PCA2: Figure 5C,D present a high rate of variability, which is observed in F1 with an order of 34.37% compared to F2 24.91%.
PCA2: Figure 5C shows on one hand that F1 correlates positively with the highest amended treatment as D2 is located on the right and correlates negatively with the unamended control D0 located on the left.
On the other hand, F2 correlates positively with the youngest amendment at 0 and 30 days at the top and correlates negatively with the oldest treatment at 60, 90, 120, and 180 days at the bottom, which allows the distinction of two time phases: 0–30 days and others > 60–180 days, explaining why in the first phase the biological factors have a different impact than in the second phase. To know what is the difference between the two phases, PCA2 (Figure 5D) explains that the majority of the variables: fungi, laccase, C%, E4/E6, N%, and D2, correlate positively with F1 and are on the right. On the left, C/N and D0 correlate negatively with F1.

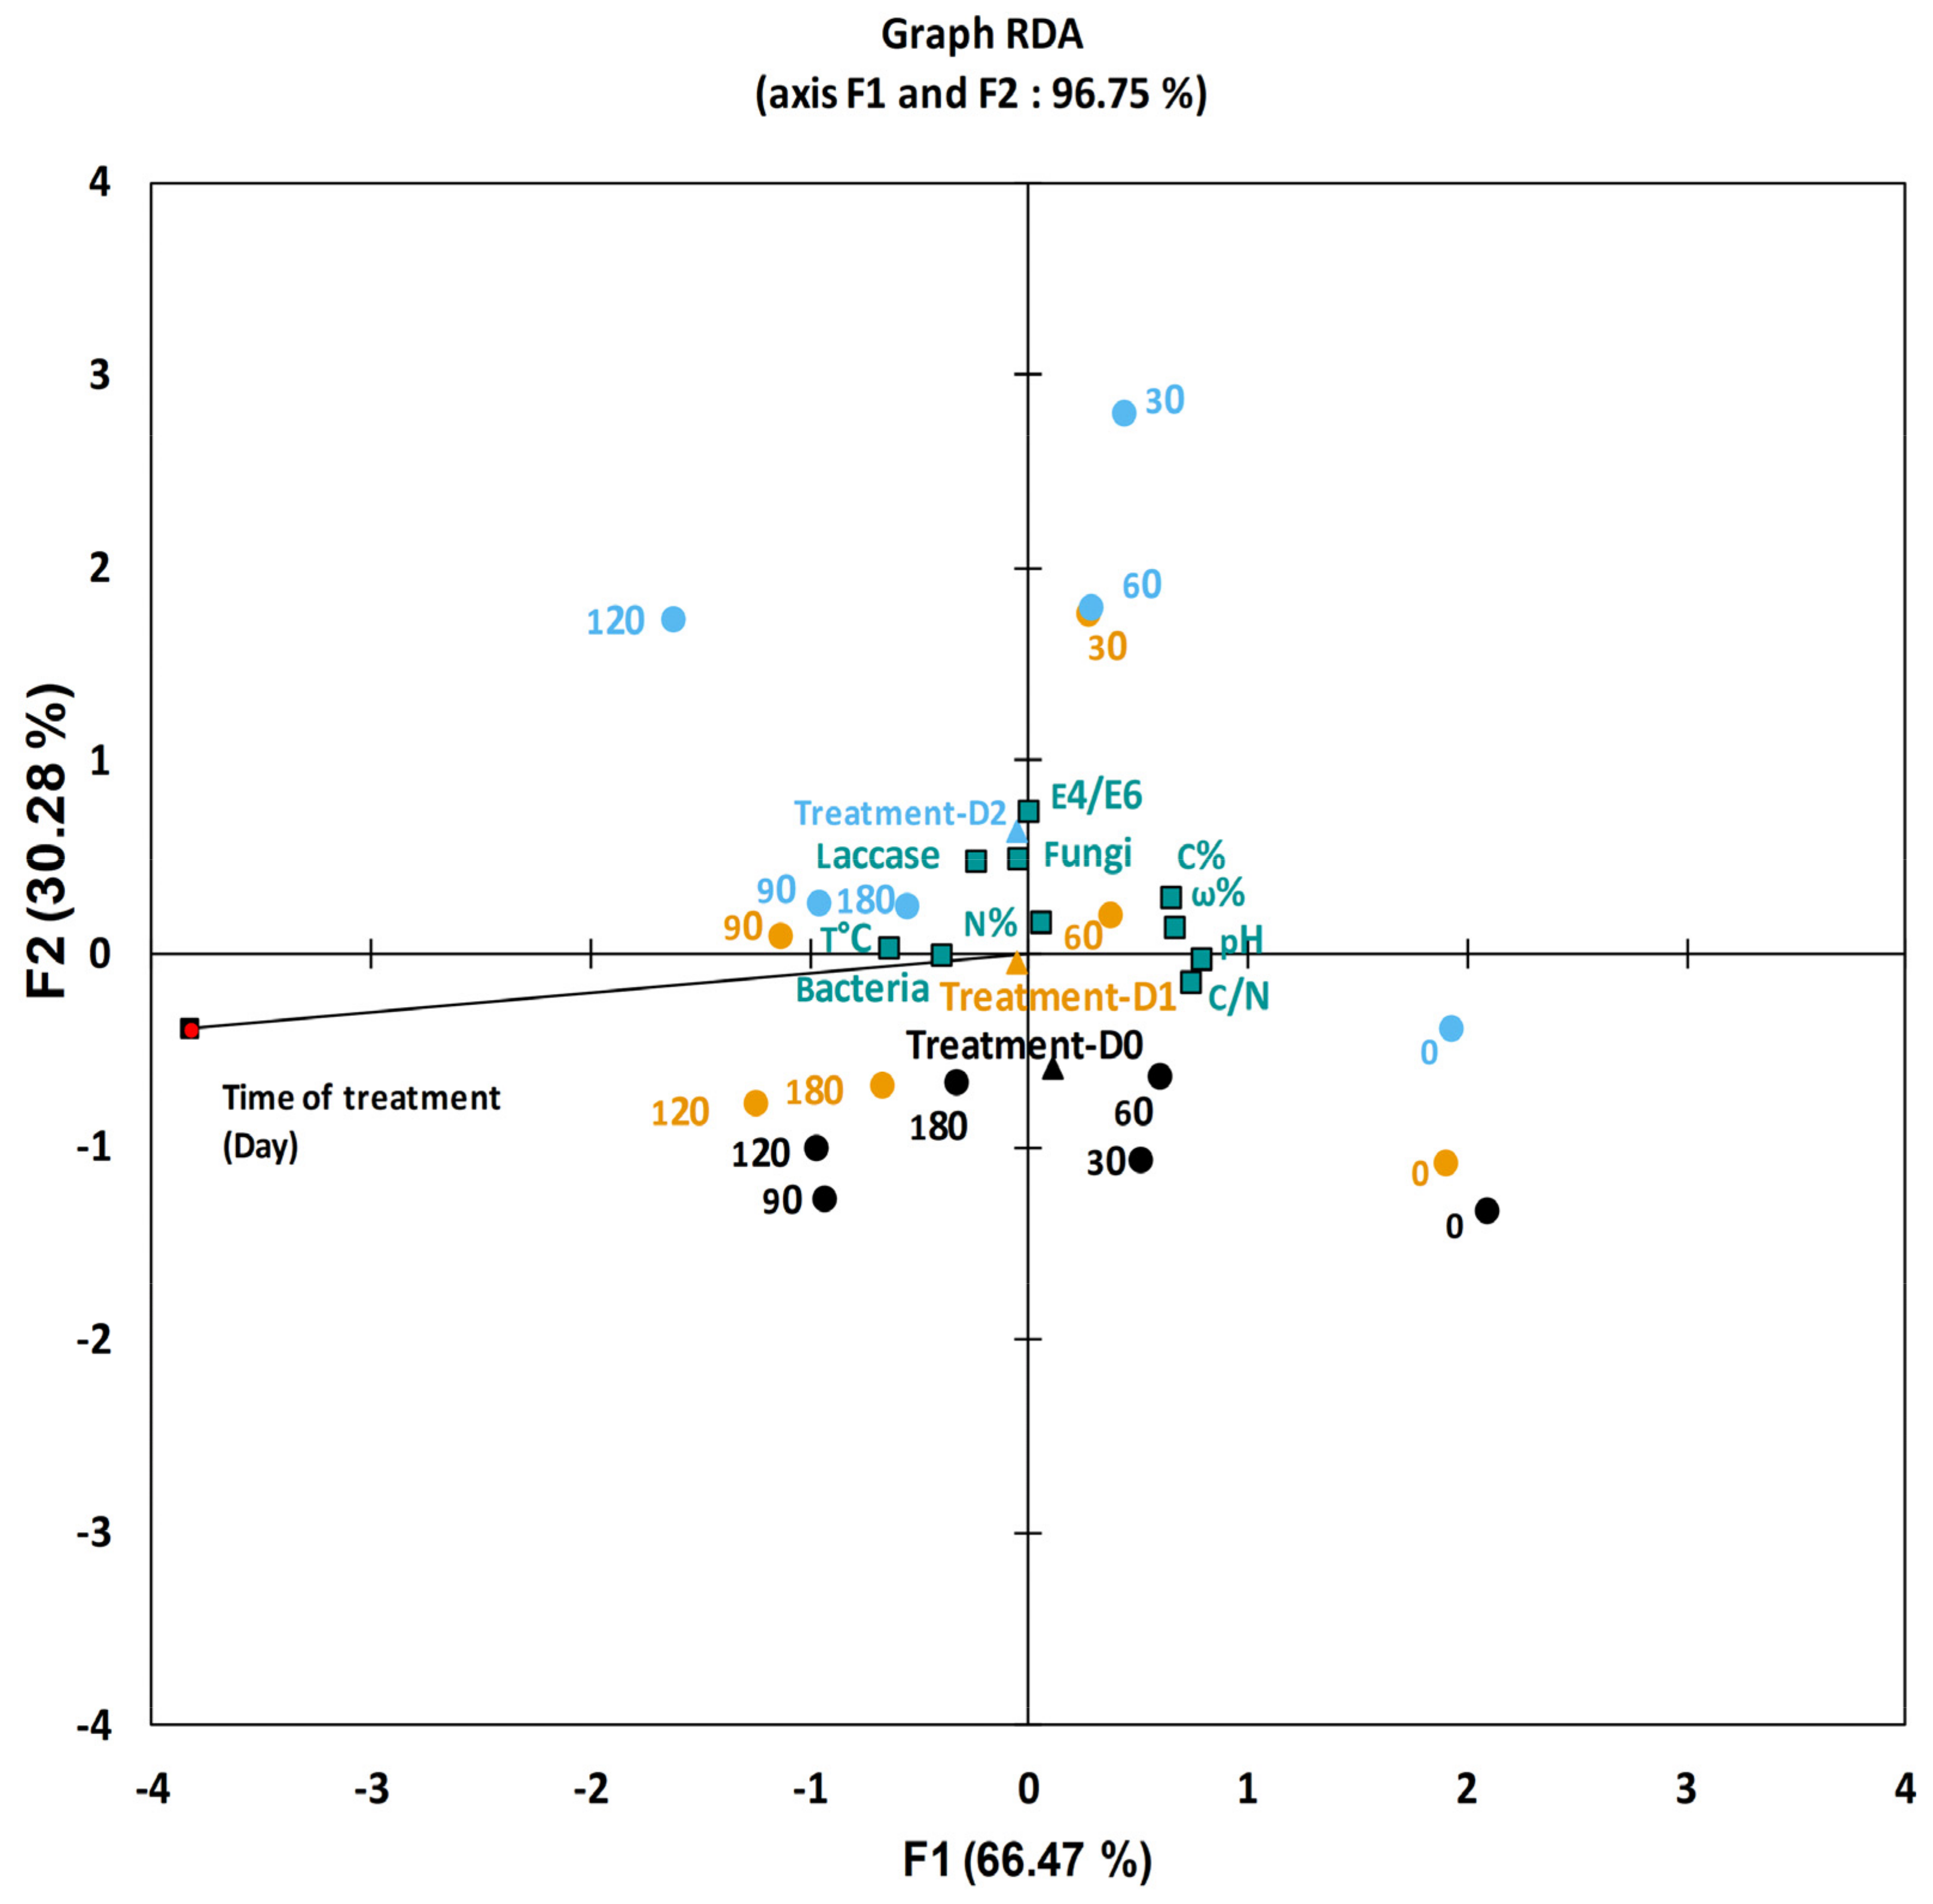
3.5. Relationship between Physical, Chemical, and Biological Factors in Soil Amendement

From Figure 6, it was noted that the results of RDA agree with those of the PCA (Figure 5). The two components F1 and F2 of the RDA reveal 96.75% of all the information: 66.74% for F1 and 30.28% for F2. On one hand, the F2 component shows a positive correlation with the utmost amended treatment D2 at the top and a negative correlation with the weakest amended treatments such as D0 and D1. On the other hand, the most important correlation is observed with F1, which made it possible to distinguish two phases of time. The first phase at 0–60 days is observed following a positive correlation located on the right, formed by the young treatments (0, 30, and 60 days) and by fungi, pH, ω%, C%, and E4/E6. The second phase, a negative correlation on the left, links the aged treatments (90, 120, and 180 days), bacteria, T °C, N%, and laccase.

4. Discussion

Over 180 days, we monitored the physicochemical and biological characteristics of the degraded soils amended by three biolignin treatments (0, 2, and 4 g/kg), D0, D1, and D2, respectively, to evaluate the impact of biolignin as a bio-organic fertilizer on the improvement of degraded soil properties. During the trial, only the soil moisture was controlled, but the rest of the parameters were controlled by the macro and micro environment factor of this soil [16], which contributed to the recording of these results and explains the increases, decreases, and stabilization observed for all the parameters monitored, and characterizes the dynamics of organic matter evolution of the amended soil. The results obtained are significant according to ANOVA and RMANOVA tests; the results indicate that, over time, biolignin from the Esparto grass used as a fertilizer significantly caused changes in the physical, chemical, and biological characteristics of the degraded soil parameters.
The temperature-increasing phase at 0 to 120 days could be due to increases in ambient temperature in the laboratory. Our trial took place between spring and summer from March 15 to September 15; at Laghouat it is often hot during these two seasons, and from the end of June until mid-August, the maximum temperatures sometimes exceed 47 °C [24], which could have influenced the soil temperatures in the containers and may cause an increase in the degradation of the organic matter [14] represented positively by carbon used in microbial biomass production during their metabolic processes confirmed by Tuomela et al. [43]. At the end of the experiment, the temperature-decreasing phase at 120 to 180 days is explained by the maturation of organic matter, resulting in a decrease in microbial metabolism [44].
In the present study, the soil moisture contents during the first 15 days are quite similar to the results reported by Bazrafshan et al. [45]. As the experiment proceeded, the results followed the recorded values of [31].
The drop in the soil moisture contents presented in Figure 2B during 0–15 days is due to the initiated microbial bio-oxidation activity of organic matter, which also resulted in a considerable rise in the temperature (Figure 2A) [31,45]. Stabilization followed by slight increases in soil moisture content after 15 days is explained by the hydroxyl functional groups of lignin, particularly phenolic and alcoholic hydroxyl groups, which may result in increased lignin hydrophilicity [46]. This increase in hydrophilicity has a positive effect on more water retention in the soil, which favors the aggregation of soil particles [2,47]. The same results are observed in the present study with the most favorable treatment D2.
The first decrease in the carbon content of the soil (Figure 3A) can be explained by the chemical structure of the biolignin and the low level of impurities that it contains, such as polysaccharides, free fatty acids, and minerals [19,48], also reported by Scheu [49] during the decomposition of Klason lignin and dioxane lignin. In addition to the microbial biomass oxide, impurities of biolignin, and organic matter initially present in the soil, it results in a loss of carbon in the form of CO2 and another form of carbon used as an energy source by a microbial population; a similar decrease in carbon levels in the soil has been reported by Xiao et al. [2]. The second decrease in carbon in the soil (45–75 days) is more important, probably due to the oxidation of the recalcitrant biolignin, whose degradation is slow [2], favored by the conditions T °C, ω%, and pH confirmed by microbial biomass (Figure 4A,B) and its activity (Figure 4C).
The observed increase in carbon in the soil (15–45 days) is consistent with that reported by Zhang et al. [6]. A direct effect of the biolignin treatment is also noticed: the biolignin, because of its carbon content (Table 1), is responsible for this increase. The carbon of the microbial biomass also explains the increase in carbon in the soil. According to Brookes [50], microbial biomass C soil measurements usually show that it comprises about 1 to 4% of organic C soil. In addition, a polycondensation of degraded products such as polysaccharides between 0 and 15 days polymerizes to produce humic substances accompanied by the modification of the physicochemical properties of the soil, as was explained by Guggenberger [51]. This is followed by stabilization (75–120 days), during which time biological activity is reduced due to the maturation of organic matter (soil/biolignin) in preparation for the formation of humus at 120 days [51].
The observed increases (Figure 3B) are similar to those reported by Zhang et al. [6] by amending soil using lignin from sludge paper. This may be explained by the mineralization of organic matter (biolignin) favored by microbial biomass [43]. Decreases in N% content in the soil over the test period suggest losses due to NO-3-N leaching and ammonia volatilization during mineralization [2]. Between 75 and 90 days, it is assumed that the drop in the nitrogen level in the soil promotes the degradation of biolignin according to Stewart et al. [52]. Additionally, by reducing its use by the microbial population, it prepares for the formation of humus that will follow. Under these conditions, nitrification and denitrification could have occurred [2].
Zhigang et al. [53] discovered that the C/N ratios of organically amended arid soil and woody soil were lower than the control, indicating that organic amendment had a direct effect.
In the current study, the observed C/N drop (0–15 days) can be explained by the degradation of the easily degradable compounds: the polycondensation of polysaccharides and impurities of biolignin takes place between 45 and 60 days to form mature compounds. The decrease in C/N observed between 45 and 75 days was related to the degradation of the resistant compounds (lignin). The decrease in phases in C/N (Figure 3C) is explained by carbon losses due to the mineralization of organic matter by microorganisms [42,54,55]. Stabilization is due to the maturation of organic matter reflected by a slowdown of their mineralization [31].
The sharp C/N drop at 75 days would be related to the maximum use of carbon by microbial biomass. The marked stabilization between 75 and 120 days would be a preparative step for the formation of humic compounds resistant to degradation. The increase in C/N observed between 120 and 180 days is mainly due to the drop in N% in the material observed during this period and the increase in carbon content (Figure 3A), probably due to the appearance of the new molecules (humic substance).
The lowering of the observed pH can be explained by a direct effect of the biolignin acidity on the soil since it is extracted by an acidic process, that is to say, formic acid and acetic acid as confirmed by Kannan and Oblisami [10] and Veeresh et al. [56].
Another explanatory effect is the mineralization of organic matter producing organic acids with the release of CO2 into the environment or degradation products of simple molecules (carbohydrates and lipids) [44,54] and nitrification (NH4 + H) of soil organic matter and biolignin [2]. The increase in pH can be explained by the degradation of the proteins (nitrogenous bases) by the high values of the bases NH4+ [57]. The stabilization of the pH around neutrality is explained by reaching the stage of maturation of the organic matter and increasing amounts of humic substances being generated, giving rise to a buffer effect that could help to limit the variations of pH [31]. This may be due to the complex chemical composition of lignin conferring a certain resistance, causing a slow degradation process [52]. In addition to this, a probable antimicrobial effect of lignin at the origin of its aromatic compounds weakens the activity of the microbes that would be present [58]. Similarly, pH variations are influenced by macro conditions and microenvironments with all their components such as temperatures, microbiological community, and soil moisture [16].
It can be assumed that these observed microbial dynamics are due to variations in abiotic factors throughout the test (Figure 2A,B and Figure 3D) that control the proliferation of bacteria and fungi [43]. This justifies the case observed in this study—the degradation of the complex organic matter in small molecules used to ensure the increase in the microbial biomass (Figure 3A,B) [14]. In parallel, biolignin degrades into small fragments for the construction of humiferous products involved in the modification of soil fertility [59]. This clearly explains that microbial biomass is a fundamental player in the process of the degradation of organic matter whatever its nature, during which environmental factors increase their evolution [16].
From this study, the only controlled parameter is the soil moisture; the dominant bacterial proliferation for this sandy soil that is used is ensured by the environmental conditions: temperature, pH, and soil moisture observed, respectively, at T °C 13–38, pH 7.06–8.73, and ω% 60–20 and which favor humification dynamics.
In our case, dividing the dynamics of fertilization into two stages allows us to assume that 0–60 days is a phase of oxidation and primary mineralization of the organic matter and 60–120 days is a phase of secondary mineralization and maturation of the organic matter, in agreement with the work of [31].
During these two phases, there are variations in the microbial biomass (bacteria and fungi) proliferating as a function of the conditions prevailing in the environment [43]. A probable disappearance–appearance of some microbial species [31] marked at 60 days conditioned by abiotic factors between 45 and 60 days: T °C 19–22 and another pH 8.47–8.76 and a decrease in soil moisture 18–23%, added to the concentration of applied biolignin.
The inverse proportionality of the biolignin/bacterial biomass observed during 0–60 days can be explained by the antibacterial effect of the biolignin, which, through its phenolic chemical structure due to reactive sites of the biolignin, participates in the inhibition of bacterial cells [58]. This explains the biolignin treatment/bacterial biomass proportionality variation observed during 60–120 days, which is probably due to the disappearance of the antibacterial effect of the biolignin and the reduction in the concentration of the biolignin, given that it is a source of carbon for microbial growth [43].
As a result, the chemical structure of biolignin is modified, reflecting its degradation [16]. It can be estimated that it started 60 days ago. At the same time, the biolignin treatment/fungal biomass proportionality between 0 and 120 days can be explained by the absence of antifungal effect of the biolignin and probably also by the low concentration of fungal biomass [58]. During a composting test, Albrecht et al. [31] also observed bacterial dominance.
The dynamics of laccase activity (Figure 4C) a priori is interpreted by the variation in microbial biomasses under environmental conditions—temperature, pH, moisture, aeration concentration of organic matter, lignin and nitrogen content in the soil—that contribute positive (potential activity) or negative (low activity) feedback [60].
According to Sinsabaugh [60], the increase in laccase activity observed during the first stage is marked by the conditions pH: 7.39–7.62, ω%: 20–25, and T °C: 13–14, and in the second stage is marked by pH 7.80–7.62, ω% 9–11, and T °C 35–38. The values < 0.05.10−2 IU/g reported by Fujii et al. [33] for a forest soil (humid environment) are lower than those observed in our trial.
Laccase is usually secreted by a mixed microbial community (bacterial and fungal) (Figure 4A,B) and it catalyzes polymerization–depolymerization reactions [61]. The direct effect of biolignin on laccase activity can also explain the maximum laccase concentrations observed in D2 at 30 days and 120 days because the organic amendment raises enzymatic activity [62]. The reactivity of laccase with biolignin is explained by the chemical structure of the latter, which resists degradation during the first stage at 30 days and degrades during the second stage at 120 days, as confirmed by Albrecht et al. [31]. The biochemistry of laccase has a broad class of phenoloxidase in soils [60]. It is a multicopper, and it can oxidize organic and inorganic compounds besides biolignin, also with compounds that may be present (including mono-, di-, and polyphenols, aminophenols, methoxy phenols, etc.) [63] when degrading with biolignin and contributing to humification [64]. Laccase acts on phenolic substrates by catalyzing the oxidation of their phenolic hydroxyl groups to phenoxy radicals while oxygen (O2) is reduced to water [64]. Other non-enzymatic transformations of the phenoxy radicals may result in the degradation of lignin; radicals can also couple with other radicals [65]. Suspected antibacterial activity between 0 and 60 days may also be the result of biolignin degradation in which laccase catalyzes the oxidation of phenolic compounds to quinones, which are themselves bactericidal and fungicidal [66].
In addition, we assume that laccase activity during our test may have stimulated the process of humification between 30 and 60 days during the first stage for easily degradable compounds and between 90 and 120 days for resistant compounds during the second stage; these are revealed by the lowering and slowing down of microbial biomass and pH neutrality according to Albrecht et al. [31] and Barje et al. [44].

4.1. Humification Degree of the Soil

According to Cunha et al. [67], the ratio E4/E6 presenting a high ratio >5 characterizes the humic acids (fulvic acids).
Our results are in agreement with those of the E4/E6 fulvic acid fraction (FA), observed in many studies: 7–13 of fulvic acid fraction, during composting of mixtures of olive pomace and cattle manure [68]; 8.43 to 12.11 of fulvic acid of soil on robusta coffee (Coffea canephora) plantation [69]; and 11 to 41 of fulvic acid extracted from soils from natural forests (NTF) [38].
Haddad et al. [68] and Eyheraguibel [70] analyzed humic extracts of various materials and found that a high E4/E6 ratio, on the order of 10, confirms the presence of fulvic acids, indicating the preferential formation of small molecules. All other authors suggested this value of ratio E4/E6 indicates that the fraction of fulvic acid has a lower molecular weight and aromatic condensation. Many studies show that the E4/E6 ratio varies inversely with molecular weight (PM), with a lower PM characterizing fulvic acids [37].
In our case, we add that our value may correspond to dominant fulvic acid (FA) concentrations compared to humic acid [37], and this can perhaps be explained by a phenomenon of the degradation of organic matter and degradation of biolignin. The higher the E4/E6 ratio, the more unstable the organic matter, with aliphatic structures and small size with a higher content of functional groups [41]. A high E4/E6 ratio also combines a low carbon content, high oxygen content, high carboxylic group content, and high total acidity (characteristics of fulvic acids) [71], which reveals a low degree of humification [37] and low maturity of the humic fractions. On the other hand, a lower E4/E6 ratio indicates a higher degree of humification; is associated with a high carbon content, low oxygen content, carboxylic groups, and low total acidity; indicated a high molecular weight (MW) (characteristic of humic acids) [71]; and is a ratio <5 [31] (Albrecht et al. 2011). In this study, low E4/E6 ratio values are observed during the decline phases: D1 2.25 (0 day), 4.85 (60 days), and 2.66 (180 days) and D2 4.16 (0 day) and 5.4 (30 days), which are in perfect agreement with the literature and characterize humic acids with a high degree of humification [37,41].
Based on these results, we also assume that D1 is more mature and shows a high degree of humification compared to soil D2, although D2 recorded significant values of 5.8 twice during the 180 days at 90 and 180 days. Compared with other studies, similar values of 5.44 to 5.7 for humic acid (HA) are discovered in studies conducted by Chen et al. and Oktaba et al. [37,72], which contributed to the soil of arable land (E4/E6 ratio of 4.7). Humic acid is more condensed and humic than the humic acid found in allotments with an E4/E6 ratio of 5.7. So, from these studies, we have taken this as a reference, suggesting that D1 is more mature and shows a high degree of humification compared to soil D2. However, the highest concentration of the biolignin amendment is in D2. This confirms that the ratio E4/E6 is independent of concentrations of humic materials [72]. In this respect, we also consider that this may be due to physicochemical and biological (soil environment) factors that contribute to ensuring a certain reversible balance between the degradation and polymerization of biolignin. If this equilibrium is in the direction of polymerization, the degradation products of lignin on one hand constitute one of the sources of aromatic compounds, leading to the formation of humic substances with a low E4/E6 ratio. According to Kunlanit et al. [39], lower values of the E4:E6 ratio of humic acids are indicated by a higher degree of polymerization. On the other hand, if this equilibrium shifts in the direction of degradation, this results in the appearance of humic substances with a high E4/E6 ratio, which characterizes fulvic acids; by lowering the molecular weight of biolignin, most likely through the elimination of aliphatic compounds, an increase in oxygen content is suggested by Chen et al. and Haddad et al. [68,72]. It is for these reasons that we assume that the degradation of biolignin is important in D2 compared to D1. We have already recorded that D2 has a direct effect on the activation of microbial biomass and laccase activity compared to D0 and D1. This explains why the degree of humification of D2 is less important than D1. Therefore, we assume that an extension of amendment time is necessary for soil D2 to stabilize and strongly humiliate (mature).
We note that at day 0 the E4/E6 ratio values of D1 (2.250) and D2 (4.167) are significant compared to D0 (0.50). This finding supports the findings of RMNC13 lignin (lignin extraction and analysis) that lignin is a strong humic substance. According to Cunha et al. [67], there is a relationship between the ratio of E4/E6 and aromaticity and the degree of condensation of the chain of aromatic carbons of the humic acids.
Additionally, we note that the non-amended soil D0 recorded low values of E4/E6 ratio < 2, while significant values of the E4/E6 ratio of soil humic acids generally range from 2 to 5 [73]. However, it is assumed that these low D0 values are significant and reveal a low degree of humification at the time phase 120 days (1.818) to 180 days (1.714). In parallel to this time phase, D0 recorded an increase in carbon and a decrease in pH, revealing soil maturation. Even though this soil is not amended and has light organic matter, it can be said that this is due to the effect of the humidity, which is irrigated every 2 days, and the influence of the parameters (physicochemical and biological).
In summary, the E4/E6 ratio allows the evaluation of humification, which is observed in amended and non-amended soils, especially at the end of 180 days; biolignin makes the difference between these soils by their humification degree. This proves its direct effect on humification.

4.2. Monitoring the Dynamics of Lignin Amendment and the Correlation between Parameters of Degraded Soil Fertilization

4.2.1. The Impact of Physical and Chemical Factors on Soil Amendment

We can say that during the 180 days, the amendment dynamic takes place in two phases of time PCA1 (Figure 5A,B), the first 0–60 days and another >60–180 days, for almost all the treatments, which confirms what has been said previously in the interpretation of amended soil factors (Figure 2, Figure 3 and Figure 4).
The correlations observed during these two phases express the relationship between the physical factor and chemical factor results of the degradation/maturation of organic matter. These relationships explain that during the 180 days of amendment, the physical factors ω% and T °C influence the chemical factors C%, N%, C/N, pH, and E4/E6.
During the first phase of 0–60 days, the transformation of the organic matter is under control of the pH and ω% and has a very important impact on the dynamics of C% and N%. On the other hand, in the second phase (>60–180 days), it is controlled by temperature and correlates positively with the E4/E6 humification index, N% nitrogen, and especially with D2. D2 correlates negatively with D0 unamended soil. This confirms that the biolignin amendment has a direct effect on humification, which is controlled in this second phase by temperature.

4.2.2. The Impact of Biological and Chemical Factors on Soil Amendment

These correlations shown in PCA2 (Figure 5C,D) between biological (bacteria, fungi, laccase) and chemical factor results of degradation (C%, N%, C/N, and E4/E6) reveal that biolignin has a direct effect on all biological variables, including microbial biomass utilizing lignin substrate and catalyzing polymerization/de-polymerization reactions by the laccase enzyme. This phenomenon is observed during the 180 days and in two phases of time. In the first phase (0–30 days), we assume that the oxidation of lignin is partial and controlled by fungi, which allows the appearance of new molecules, which will be polycondensed and become wetted by the increase in carbon at 30 days and the E4/E6 humidification index with the D1 and D2 treatments.
In the second time phase (>60–180 days), we assume that the polymerization/depolymerization phenomenon is controlled by bacteria. However, the oxidation of biolignin is almost total and the reaction goes in the direction of depolymerization much more than polymerization because the laccase activity was important during this phase, with significant carbon reductions. At the end of 180 days of the amendment, the humification index E4/E6 and the increase in carbon reveal a humification of the degraded soil.

4.3. The Correlation between Physical, Chemical, and Biological Factors on Soil Amendment

According to redundancy analysis (RDA), a correlation is illustrated in Figure 6 between physical, chemical, and biological factors. We can say that the pH and ω% have a direct impact on fungi in the young phase (0–60 days), and the temperature has a direct impact on bacteria and laccase in the mature phase (>60–180 days). This can be discussed depending on the results of the D2 treatment (Tables S2 and S3), as over the 180 days of the amendment, D2 scores the highest number of correlations. D2 is the concentration of 4 g of biolignin in 1 kg of soil poor in organic matter (a factor limiting the growth of microbial biomass). We recorded that this concentration of D2 combined with chemical and physical factors (pH, ω%, T °C) is in favor of a better use of lignin as an energy source for the growth of microbial biomass and the formation of humified organic matter [74].
It is presumed that this is described in two phases of time: a first phase (0–60 days) and a second phase (>60–180 days). In the first phase, we notice that the physical and chemical factors (temperature of 13 °C, neutral to slightly alkaline pH 7.6–8.34, and soil moisture between 60 and 22.33%) are the important factors that have affected the growth of fungi, the degradation of easily degradable organic matter, and the degeneration of biolignin. As described by [43], the most important factors affecting fungal growth are temperature (the majority of fungi are mesophile, which grow between 5 °C and 37 °C) and pH (most fungi favor an acidic environment but tolerate a wide range of pH in the presence of a source of carbon and nitrogen). Figure 6 clearly shows that the correlation between fungi, pH, ω%, C%, and E4/E6 explains that, in our case, the pH and ω% are the most favorable factors, which allow us to register an impact on fungi during the first 60 days.
Gul et al. [14] reported that microorganisms that can degrade lignin at a more rapid rate of degradation are fungal communities. Therefore, some authors, to accelerate the degradation of lignocellulosic, use inoculation, e.g., with fungi producing non-specific laccase [75]. It is also assumed that the chemical composition of biolignin influences how it is degraded by microorganisms. Due to lignin’s composition, it is made up of p-hydroxyphenyl (H), Guayaquil (G), and syringyl (S) and bound by C–C and C–O–C bonds [76]. These units (H, S, G) that make up lightning are generally found in annual plants [23] or monocotyledonous plants such as Esparto grass [76], and the ratio of G: S: H units varies from species to species [77]. According to the structural study of Esparto grass conducted in Tunisia by Abdelkafi et al. [11] and the structural study of Algerian Esparto grass obtained by soda lignin [23], lightning produced by Esparto grass is characterized by the presence of H, G, S, and O-4 (arylglycerol-beta-aryl ether) units and other bonds. However, the difference between these studies lies only in the percentage of H, G, S, and the types of bonds.
Gul et al. [14] also reported that there is evidence that the chemical composition of lignin affects its decomposition, where the constituent units of lignin S and H are degraded in preference to G-gaiacyl and form aryl–aryl CC bonds, which are more condensed and stronger than the β-O-4 bonds favorably formed by syringyl lignin. In addition, the fungi seem to preferentially attack the β-O-4 bonds rather than the aryl–aryl bonds, which explains, in our case (Figure 6), the importance of the correlations fungi, PH, ω%, C%, and E4/E6. We also note that, at first, the fungi degraded the β-O-4 bonds of biolignin Esparto grass obtained by CIMV and the molecules resulting from this degradation intervened in the polycondensation and humification, which were observed at 30 days (E4/E6 5.440 and Carbon 1.692) (Tables S2 and S3).
In the phase >60 days–180 days, it was recorded that under physical and chemical conditions including temperature between 22 and 38, pH between 7.25 and 7.7, and soil moisture between 10.05 and 25.72% and with the correlations observed (bacteria, T °C, N%, and laccase activity) in RDA (Figure 6 and Tables S2 and S3), the temperature is the most important factor affecting bacterial growth and biolignin degradation. According to Gul et al. [14], some bacteria degrade lignin but at a much slower rate than fungi, such as those belonging to actinomycetes, α proteobacteria, and γ proteobacteria. In our case, this explains why, as the temperature rose in the second phase compared to the first, the bacteria grew. This is also manifested by laccase catalysis at 38 °C at 120 days and a max value of laccase activity 4.239 IU and at minimal nitrogen values revealed by PCA, followed by a second humification observed at 180 days revealed by E4/E6 5.833 with pH 7.06.
In all these cases, we can state that our results confirm that biolignin treatment of the soil has made a difference compared to control soil not treated with biolignin, improving the physical–chemical and biological properties of degraded barren soil.

5. Conclusions

This study was carried out to valorize a new bio-organic fertilizer, which is biolignin extracted from Esparto grass fibers, as a good source of organic matter for degraded soils.
The composition and structure of this extract product are quite analogous to those of the native polymer in the plant, which results from the green method used in the extraction process called CIMV. This last one is also a method of the paper industry targeting environmental depollution.
However, in six months, remarkable variations in the physico-chemical and biological characteristics of the amended soil have appeared. Indeed, the ratio of 4 g biolignin/1 kg soil (D2 treatment) has shown the most interesting variation regarding, on the one hand, the most important nutrients carbon (C) and nitrogen (N), and on the other hand, the significant degree of humification, which is an important indicator of the stability and maturity of organic matter in soils.
The results of our work indicate that biolignin produced by the green chemistry process CIMV from Stipa tenacissima fibers has strongly improved the biological and physicochemical soil properties, and therefore it could be very useful in the sustainable management of degraded soil fertility. Thus, it would also be possible to use this biolignin on an industrial scale with the prospect of avoiding environmental pollution caused by the paper industry.
However, it would be interesting to monitor the long-term dynamics of the effect of Esparto grass biolignin application as a modification to this degraded soil.
This study’s findings can assist another complementary study to control, optimize, and improve the properties of degraded soils as far as continuing to be environmentally friendly to soils through the extraction process used.
As a recommendation for further research, it would be worthwhile to emphasize the biolignin detoxification of polluted water and soil, monitoring the dynamics of biolignin fertilization of degraded land using non-destructive physical techniques such as RMN solid C13, and finally, the identification of the microbial biomass responsible for degradation, which would be very useful from biolignin and targets how to alter microbial populations to optimize the proper fertilization of degraded land.

Supplementary Materials

The following are available online at https://www.mdpi.com/article/10.3390/su132313462/s1.

Author Contributions

Conceptualization, A.B., Z.H. and A.G.; methodology, A.B., Z.H. and H.G.; formal analysis, A.B. and Z.H.; investigation, A.B.; resources, A.B.; data curation, A.B. and Z.H.; writing—original draft preparation, A.B.; writing—review and editing, A.B., Z.H. and A.G.; supervision, Z.H. and A.G.; project administration, A.B., Z.H. and A.G. All authors have read and agreed to the published version of the manuscript.

Funding

This research was financed by the Algerian Ministry of Higher Education and Scientific Research. CNEPRU Project: Gestion et conservation du patrimoine écologique dans la région de Laghouat (N°: DO 4N0IUN030120110002).

Institutional Review Board Statement

Not applicable.

Informed Consent Statement

Not applicable.

Data Availability Statement

Not applicable.

Acknowledgments

The authors thank Mokhtari Aicha for her advice during carrying out this work.

Conflicts of Interest

The authors declare no conflict of interest.

References

  1. Abdelkefi, F.; Ammar, H.; Mlayeh, B.; Abid, S.; El Gharbi, R. Caracterisation De La Lignine Extraite De L’Alfa. J. Soc. Chim. Tunis. 2011, 13, 7–15. [Google Scholar]
  2. Xiao, C.; Bolton, R.; Pan, W.L. Lignin from Rice Straw Kraft Pulping: Effects on Soil Aggregation and Chemical Properties. Bioresour. Technol. 2007, 98, 1482–1488. [Google Scholar] [CrossRef] [PubMed]
  3. Nadji, H.D.; Rodrigue, A.; Benaboura, Y.; Bedard, T.; Stevanovic, B.R. Value-Added Derivatives of Soda Lignin Alfa Grass (Stipa tenacissima) II Uses as Lubricants in Plastic Processing H. J. Appl. Polym. Sci. 2009, 114, 3003–3007. [Google Scholar] [CrossRef]
  4. Nadji, H.; Diouf, P.N.; Benaboura, A.; Bedard, Y.; Riedl, B.; Stevanovic, T. Comparative Study of Lignins Isolated from Alfa Grass (Stipa tenacissima L. Bioresour. Technol. 2009, 100, 3585–3592. [Google Scholar] [CrossRef] [PubMed]
  5. Ammar, H.; Abdelkafi, F.; Abid, S.; Benjelloum-Mlayah, B.; El Gharbi, R.; Delmas, M. Production, Bleaching, and Characterization of Pulp from Stipa tenacissima. Chem. Nat. Compd. 2012, 48, 99–102. [Google Scholar] [CrossRef]
  6. Zhang, S.; Wang, S.; Shan, X.Q.; Mu, H. Influences of Lignin from Paper Mill Sludge on Soil Properties and Metal Accumulation in Wheat. Biol. Fertil. Soils 2004, 40, 237–242. [Google Scholar] [CrossRef]
  7. O’Brien, T.A.; Herbert, S.J.; Barker, A.V. Growth of corn in varying mixtures of paper mill sludge and soil. Commun. Soil Sci. Plant Anal. 2007, 33, 635–646. [Google Scholar] [CrossRef]
  8. Xiao, C.; Ma, L.Q.; Sarigumba, T. Effects of Soil on Trace Metal Leachability from Papermill Ashes and Sludge. J. Environ. Qual. 1999, 28, 321–333. [Google Scholar] [CrossRef] [Green Version]
  9. Chirenje, T.; Ma, L.Q. Impact of high-volume wood-fired boiler ash amendment on soil properties and nutrients. Commun. Soil Sci. Plant Anal. 2006, 33, 1–17. [Google Scholar] [CrossRef]
  10. Kannan, K.; Oblisami, G. Effect of pulp and paper mill effluent irrigation on carbon dioxide evolution in soils. J. Agron. Crop Sci. 1990, 164, 116–119. [Google Scholar] [CrossRef]
  11. Kannan, K.; Oblisami, G. Influence of paper mill effluent irrigation on soil enzyme activities. Biol. Des Sols Biochim. 1990, 22, 923–926. [Google Scholar] [CrossRef]
  12. Xiao, C.; Fauci, M.; Bezdicek, D.F.; Pan, W.L. Soil microbial responses to potassium-based black liquor. Soil Sci. Soc. Am. 2006, 70, 72–77. [Google Scholar] [CrossRef] [Green Version]
  13. Delmas, G.H.; Benjelloun-Mlayah, B.; Le, B.Y.; Delmas, M. Functionality of Wheat Straw Lignin Extracted in Organic Acid Media. J. Appl. Polym. Sci. 2011, 121, 491–501. [Google Scholar] [CrossRef]
  14. Gul, S.; Yanni, S.F.; Whalen, J.K. Lignin Controls on Soil Ecosystem Services: Implications for Biotechnological Advances in Biofuel Crops. In Lignin: Structural Analysis, Applications in Biomaterials and Ecological Significance; Lu, F., Ed.; Nova Science Publishers, Inc.: Hauppauge, NY, USA, 2014; pp. 375–416. [Google Scholar]
  15. Benlboukht, F.; El Fels, L.; Bouamri, R.; Amir, S.; Hafidi, M. Assessment of Fulvic Acid-like Fractions during Tannery Waste Composting. Compos. Sci. Util. 2016, 24, 208–218. [Google Scholar] [CrossRef]
  16. Thevenot, M.; Dignac, M.F.; Rumpel, C. Fate of Lignins in Soils: A Review. Soil Biol. Biochem. 2010, 42, 1200–1211. [Google Scholar] [CrossRef]
  17. Francou, C. Stabilisation de la Matière Organique au Cours du Compostage de Déchets Urbains: Influence de la Nature des Déchets et du Procédé de Compostage—Recherche D’indicateurs Pertinents. Ph.D. Thesis, Université de AgroParisTech, Paris, France, 2003. [Google Scholar]
  18. Albrecht, R. Co-Compostage de Boues de Station D’épuration et de Déchets Verts: Nouvelle Méthodologie du Suivi des Transformations de la Matière Organique. Ph.D. Thesis, Université Paul Cezanne Aix-Marseille III, Marseille, France, 2007. [Google Scholar]
  19. Abdelkafi, F.; Ammar, H.; Rousseau, B.; Tessier, M.; El Gharbi, R.; Fradet, A. Structural Analysis of Alfa Grass (Stipa tenacissima L.) Lignin Obtained by Acetic Acid/Formic Acid Delignification. Biomacromolecules 2011, 12, 3895–3902. [Google Scholar] [CrossRef]
  20. AFNOR. Qualité des Sols, Méthodes de Prélèvement D’échantillon de Terre; Norme Française Homologuée, NF U44-051, Booklet; AFNOR: Paris, France, 2006; 12p. [Google Scholar]
  21. Chabalier, P.; Van de Kerchove, V.; Saint Macary, H. Guide de la Fertilisation Organique à la Réunion; Chambre D’Agriculture de la Réunion, CIRAD: Paris, France, 2006; pp. 106–115. [Google Scholar]
  22. Bouiri, B.; Amrani, M. Production of Dissolving Grade Pulp from Alfa. BioResources 2010, 5, 291–302. [Google Scholar] [CrossRef]
  23. Hattalli, S.; Benaboura, A.; Ham-Pichavant, F.; Nourmamode, A.; Castellan, A. Adding Value to Alfa Grass (Stipa tenacissima L.) Soda Lignin as Phenolic Resins 1 Lignin Characterization. Polym. Degrad. Stab. 2002, 76, 259–264. [Google Scholar] [CrossRef]
  24. Houyou, Z.; Bielders, C.L.; Benhorma, H.A.; Dellal, A.; Boutemdjet, A. Evidence of Strong Land Degradation by Wind Erosion as a Result of Rainfed Cropping in the Algerian Steppe: A Case Study at Laghouat. Land Degrad. Dev. 2014, 27, 1788–1796. [Google Scholar] [CrossRef]
  25. Fernández-Bayo, J.D.; Achmon, Y.; Harrold, D.R.; McCurry, D.G.; Hernandez, K.; Dahlquist-Willard, R.M.; Stapleton, J.J.; VanderGheynst, J.S.; Simmons, C.W. Assessment of Two Solid Anaerobic Digestate Soil Amendments for Effects on Soil Quality and Biosolarization Efficacy. J. Agric. Food Chem. 2017, 65, 3434–3442. [Google Scholar] [CrossRef]
  26. Soil Survey Staff, S.S. Keys to Soil Taxonomy, 12th ed.; USDA-Natural Resources Conservation Service: Washington, DC, USA, 2014.
  27. Mathieu, C.; Pieltain, F. Analyse Physique des Sols Méthodes Choisies; TEC & DOC Lavoisier: Paris, France, 1998; 274p. [Google Scholar]
  28. Mathieu, C.; Pieltain, F. Analyse Chimique des Sols Méthodes Choisies; TEC & DOC Lavoisier: Paris, France, 2003; 388p. [Google Scholar]
  29. Bremner, J.M.; Mulvaney, C.S. Nitrogen—Total. Methods Soil Anal. Part 2. Chem. Microbiol. Prop. Am Soc Agron 1982, 9, 595–624. [Google Scholar]
  30. Klement, Z.; Rudolph, K.; Sands, D.C. Methods in Phytobacteriology Akademiai; Kiado: Budapest, Hungary, 1990. [Google Scholar]
  31. Albrecht, R.; Périssol, C.; Ruaudel, F.; Le, P.J.; Terrom, G. Functional Changes in Culturable Microbial Communities during a Co-Composting Process: Carbon Source Utilization and Co-Metabolism. Waste Manag. 2010, 30, 764–770. [Google Scholar] [CrossRef] [PubMed]
  32. Joffin, J.; Leyaral, G. Microbiologie Technique—Tome 1; Centre Régional de Documentation Pédagogique d’Aquitaine: Bordeaux, France, 2006. [Google Scholar]
  33. Fujii, K.; Uemura, M.; Hayakawa, C.; Funakawa, S.; Kosaki, T. Environmental Control of Lignin Peroxidase, Manganese Peroxidase, and Laccase Activities in Forest Floor Layers in Humid Asia. Soil Biol. Biochem. 2013, 57, 109–115. [Google Scholar] [CrossRef]
  34. Eichlerová, I.; Šnajdr, J.; Baldrian, P. Laccase Activity in Soils: Considerations for the Measurement of Enzyme Activity. Chemosphere 2012, 88, 1154–1160. [Google Scholar] [CrossRef]
  35. Gouzi, H.; Flurkey, W.H.; Abdelhafid, B. Partial Purification and Characterization of Polyphenol Oxidase Extracted from Agaricus Bisporus. Int. J. Chem. React. Eng. 2007, 5, 1–13. [Google Scholar] [CrossRef]
  36. Zbytniewski, R.; Buszewski, B. Characterization of Natural Organic Matter (NOM) Derived from Sewage Sludge Compost. Part 1: Chemical and Spectroscopic Properties. Bioresour. Technol. 2005, 96, 471–478. [Google Scholar] [CrossRef]
  37. Oktaba, L.; Odrobińska, D.; Uzarowicz, Ł. The Impact of Different Land Uses in Urban Area on Humus Quality. J. Soils Sediments 2018, 18, 2823–2832. [Google Scholar] [CrossRef] [Green Version]
  38. Reddy, S.; Nagaraja, M.S.; Raj, T.P.; Patil, A.P.; Dumgond, P. Elemental Analysis, E4/E6 Ratio and Total Acidity of Soil Humic and Fulvic Acids from Different Land Use Systems. Ann. Plant Soil Res. 2014, 16, 89–92. [Google Scholar]
  39. Kunlanit, B.; Butnan, S.; Vityakon, P. Land-Use Changes Influencing C Sequestration and Quality in Topsoil and Subsoil. Agronomy 2019, 9, 520. [Google Scholar] [CrossRef] [Green Version]
  40. Morán Vieyra, F.E.; Palazzi, V.I.; Sanchez de Pinto, M.I.; Borsarelli, C.D. Combined UV-Vis absorbance and fluorescence properties of extracted humic substances-like for characterization of composting evolution of domestic solid wastes. Geoderma 2009, 151, 61–67. [Google Scholar] [CrossRef]
  41. Fieberg, J.R.; Vitense, K.; Johnson, D.H. Resampling-Based Methods for Biologists. PeerJ 2020, 8, e9089. [Google Scholar] [CrossRef]
  42. Albrecht, R.; Joffre, R.; Gros, R.; Le Petit, J.; Terrom, G.; Périssol, C. Efficiency of Near-Infrared Reflectance Spectroscopy to Assess and Predict the Stage of Transformation of Organic Matter in the Composting Process. Bioresour. Technol. 2008, 99, 448–455. [Google Scholar] [CrossRef]
  43. Tuomela, M.; Vikman, M.; Hatakka, A.; Itävaara, M. Biodegradation of Lignin in a Compost Environment: A Review. Bioresour. Technol. 2000, 72, 169–183. [Google Scholar] [CrossRef]
  44. Barje, F.; El Fels, L.; El Hajjouji, H.; Winterton, P.; Hafidi, M. Biodegradation of Organic Compounds during Co-Composting of Olive Oil Mill Waste and Municipal Solid Waste with Added Rock Phosphate. Environ. Technol. 2013, 34, 2965–2975. [Google Scholar] [CrossRef]
  45. Bazrafshan, E.; Zarei, A.; Kord Mostafapour, F.; Poormollae, N.; Mahmoodi, S.; Zazouli, M.A. Maturity and Stability Evaluation of Composted Municipal Solid Wastes. Health Scope 2016, 5, e33202. [Google Scholar] [CrossRef] [Green Version]
  46. Jamshid, B.; Nader, S. Utilization of Waste Lignin to Prepare Controlled-Slow Release Urea. Int. J. Recycl. Org Waste Agric. 2016, 5, 289–299. [Google Scholar] [CrossRef]
  47. Meng, Q.F.; Luo, X.G.; Lin, X.Y.; Zhang, S.Z.; Li, K. Effect of Lignin and RLDPE Soil Amendments on Water Holding Capacities of Desert. Mater. Sci. Forum 2015, 804, 55–58. [Google Scholar] [CrossRef]
  48. Delmas, G.H.; Benjelloun-Mlayah, B.; Le, B.Y.; Delmas, M. Biolignin TM Based Epoxy Resins. J. Appl. Polym. Sci. 2013, 127, 1863–1872. [Google Scholar] [CrossRef]
  49. Scheu, S. Decomposition of Lignin in Soil Microcompartments: A Methodical Study with Three Different C-14-Labelled Lignin Substrates. Biol. Fertil. Soils 1992, 13, 160–164. [Google Scholar] [CrossRef]
  50. Brookes, P. The Soil Microbial Biomass: Concept, Measurement and Applications in Soil Ecosystem Research. Microbes Environ. 2001, 16, 131–140. [Google Scholar] [CrossRef] [Green Version]
  51. Guggenberger, G. Humification and Mineralization in Soils. In Microorganisms in Soils: Roles in Genesis and Functions. Soil Biology; Varma, A., Buscot, F., Eds.; Springer: Berlin/Heidelberg, Germany, 2005. [Google Scholar] [CrossRef]
  52. Stewart, C.E.; Moturi, P.; Follett, R.F.; Halvorson, A.D. Lignin Biochemistry and Soil N Determine Crop Residue Decomposition and Soil Priming. Biogeochemistry 2015, 124, 335–351. [Google Scholar] [CrossRef] [Green Version]
  53. Zhigang, L.; Schneiderc, R.L.; Morreale, S.J.; Yingzhong, X.; Changxiao, L.; Jian, L. Woody Organic Amendments for Retaining Soil Water, Improving Soil Properties and Enhancing Plant Growth in Desertified Soils of Ningxia, China. Geoderma 2018, 310, 143–152. [Google Scholar] [CrossRef]
  54. Mustin, M. Le Compost, Gestion de la Matière Organique; Ed.François Dubusc: Paris, France, 1987. [Google Scholar]
  55. Lıvia, B.F.P.; Idowu, A.A.; Oluwatoyin, A.O.; Aurélio, V.B.; Maria Olímpia, O.R. Chemical Study of Vermicomposted Agroindustrial Wastes. Int. J. Recycl. Org Waste Agric. 2016, 5, 55–63. [Google Scholar] [CrossRef] [Green Version]
  56. Veeresh, H.; Tripathy, S.; Chaudhuri, D.; Ghosh, B.; Hart, B.; Powell, M. Changes in Physical and Chemical Properties of Three Soil Types in India as a Result of Amendment with Fly Ash and Sewage Sludge. Envionmental Geolgy 2002, 43, 513–520. [Google Scholar] [CrossRef]
  57. Vergnoux, A.; Guiliano, M.; Le Dréau, Y.; Kister, J.; Dupuy, N.; Doumenq, P. Monitoring of the Evolution of an Industrial Compost and Prediction of Some Compost Properties by NIR Spectroscopy. Sci. Total Environ. 2009, 407, 2390–2403. [Google Scholar] [CrossRef]
  58. Coral Medina, J.D.; Woiciechowski, A.L.; Zandona Filho, A.; Bissoqui, L.; Noseda, M.D.; De Souza Vandenberghe, L.P.; Zawadzki, S.F.; Soccol, C.R. Biological activities and thermal behavior of lignin from oil palm empty fruit bunches as potential source of chemicals of added value. Ind. Crops Prod. 2016, 94, 630–637. [Google Scholar] [CrossRef]
  59. Bahri, H.; Rasse, D.P.; Rumpel, C.; Dignac, M.F.; Bardoux, G.; Mariotti, A. Lignin Degradation during a Laboratory Incubation Followed by 13C Isotope Analysis. Soil Biol. Biochem. 2008, 40, 1916–1922. [Google Scholar] [CrossRef]
  60. Luo, Q.; Wang, Z.; Feng, M.; Chiang, D.; Woodward, D.; Liang, S.; Lu, J.; Huang, Q. Factors Controlling the Rate of Perfluorooctanoic Acid Degradation in Laccase-Mediator Systems: The Impact of Metal Ions. Environ. Pollut. 2017, 224, 649–657. [Google Scholar] [CrossRef] [Green Version]
  61. Sinsabaugh, R.L. Phenol Oxidase, Peroxidase and Organic Matter Dynamics of Soil. Soil Biol. Biochem. 2010, 42, 391–404. [Google Scholar] [CrossRef]
  62. Gonzalo, G.; Colpa, D.I.; Habib, M.H.M.; Fraaije, M.W. Bacterial Enzymes Involved in Lignin Degradation. J. Biotechnol. 2016, 236, 110–119. [Google Scholar] [CrossRef] [Green Version]
  63. Pascual, J.; Hernandez, A.T.; Garcia, C.; Ayuso, M. Enzymatic Activities in an Arid Soil. Bioresour. Technol. 1998, 64, 131–138. [Google Scholar] [CrossRef]
  64. Ademakinwa, A.N.; Agboola, F.K. Biochemical Characterization and Kinetic Studies on a Purified Yellow Laccase from Newly Isolated Aureobasidium Pullulans NAC8 Obtained from Soil Containing Decayed Plant Matter. J. Genet. Eng. Biotechnol. 2016, 14, 143–151. [Google Scholar] [CrossRef]
  65. Widsten, P.; Kandelbauer, A. Laccase Applications in the Forest Products Industry: A Review. Enzym. Microb. Technol. 2008, 42, 293–307. [Google Scholar] [CrossRef]
  66. Zinkernagel, V. Unterchungen zur Anfälligkeit und resistenz von Kopfsalat (Lactuca sativa) gegen falschen Mehltan Bremia lactucae III Peroxidase, peroxidatische Katalase und polyphenoloxydase Aktivitäten. J. Phytopathol. 1986, 115, 257–266. [Google Scholar] [CrossRef]
  67. Cunha, T.J.F.; Novotny, E.H.; Madari, B.E.; Martin-Neto, L.; Rezende, M.O.; Canelas, L.P.; de M. Benites, V. Spectroscopy Characterization of Humic Acids Isolated from Amazonian Dark Earth Soils (Terra Preta de Índio.). In Amazonian Dark Earths: Wim Sombroek’s Vision; Springer: Dordrecht, The Netherlands, 2009; pp. 363–372. [Google Scholar] [CrossRef] [Green Version]
  68. Haddad, G.; El-ali, F.; Mouneimne, A.H. Humic Matter of Compost: Determination of Humic Spectroscopic Ratio (E4/E6). Curr. Sci. Int. 2015, 4, 56–72. [Google Scholar]
  69. Putra, M.J.N.F.I.A.; Soemarno, S.; Suntari, R. Humification degree and its relationship with some soil physical characteristics on robusta coffee (Coffea canephora) plantation. J. Degrad. Min. Lands Manag. 2016, 3, 649–658. [Google Scholar] [CrossRef]
  70. Eyheraguibel, B. Caractérisation des Substances Humiques Biomimétiques—Effets sur les Végétaux. Ph.D. Thesis, Ecole doctorale: Sciences des Procédés, Sciences des Agroressources. Institut National Polytechnique de Toulouse, Toulouse, France, 2004; p. 230. [Google Scholar]
  71. Tahiri, A.; Destain, J.; Druart, P.; Thonart, P. Propriétés physico-chimiques et biologiques des substances humiques en relation avec le développement végétal (synthèse bibliographique. Biotechnol. Agron. Soc. Environ. 2014, 18, 436–445. [Google Scholar]
  72. Chen, Y.; Senesi, N.; Schnitzer, M. Information Provided on Humic Substances by E4-E6 Ratios. Soil Sci. Soc. Am. J. 1977, 41, 352–358. [Google Scholar] [CrossRef]
  73. Thurman, E.M. Organic Geochemistry of Natural Waters; Martinus Nijhoff, Dr. W. Junk Publishers: Dordrecht, The Netherlands, 1986. [Google Scholar]
  74. Huang, P. Soil Physical-Chemical-Biological Interfacial Interactions: An Overview; Springer: Berlin/Heidelberg, 2008; pp. 3–37. [Google Scholar] [CrossRef]
  75. Kulikowska, D.; Bernat, K. WasteWillow- Bark from Salicylate Extraction Successfully Reused as an Amendment for Sewage Sludge Composting. Sustainability 2021, 13, 6771. [Google Scholar] [CrossRef]
  76. Delmas, G.H. La Biolignine Structure et Application à L’élaboration de Résine. Ph.D. Thesis, Université de Toulouse, Toulouse, France, 2011. [Google Scholar]
  77. Bugg, T.D.H.; Ahmad, M.; Hardiman, E.M.; Rahmanpour, R. Pathways for degradation of lignin in bacteria and fungi. Nat. Prod. Rep. 2011, 28, 1883–1896. Available online: https://www.rsc.org/journals-books-databases/about-journals/npr/ (accessed on 10 November 2021). [CrossRef]
Figure 1. Solid-state 13 C NMR spectrum of biolignin CIMV of Esparto grass.
Sustainability 13 13462 g001
Figure 2. Effect of applied biolignin treatment on physical soil properties: (A) soil temperature, (B) soil moisture.
Sustainability 13 13462 g002
Figure 3. Effect of applied biolignin treatment on chemical soil properties: (A) soil carbon, (B) soil nitrogen, (C) C/N ratio, and (D) soil pH.
Sustainability 13 13462 g003
Figure 4. Effect of applied biolignin treatment on biological soil properties: (A) bacterial biomass, (B) fungal biomass, and (C) laccase activity.
Sustainability 13 13462 g004
Figure 5. PCA (principal component analysis): Correlation of physicochemical and biological soil properties over 180 days. (A,B) Correlation between physical and chemical factors; (C,D) correlation between biological and chemical factors.
Sustainability 13 13462 g005
Figure 6. RDA (redundancy analysis): Physicochemical and biological soil properties and biolignin treatment relationships during the test.
Sustainability 13 13462 g006
Table 1. Characteristics of the biolignin extracted by CIMV process from Esparto grass fibers and characteristics of the degraded soil, expressed as: means values ± standard deviation (n = 3).
ParameterSoilBiolignin
MO (%)1.5 ± 0.03592 ± 0.577
Ctotal (%)0.870 ± 0.03153 ± 0.557
Ntotal (mg/kg)0.003 ± 0.0010.225 ± 0.004
pH8.61 ± 0.3273.17 ± 0.036
Na (mg/kg)4.82 ± 0.05022.0 ± 0.011
P (mg/Kg)1.53 ± 0.0316.66 ± 0.000
K (mg/Kg)7.84 ± 0.00524.83 ± 0.000
CaCO3 (%)1.96 ± 0.471/
EC (ms/cm)0.50 ± 0.0613.93 ± 0.32
Table 2. p level in repeated measures analysis of variance (RMANOVA).
ParameterTreatmentRepetition (Time)Time * Treatment
Soil moisture*********
Soil temperature*****/
pH********
Soil carbon content/******
Soil nitrogen content*********
Ratio C/N*********
Bacteria*********
Fungi********
Laccase activity*********
E4/E6*********
*** p < 0.001; ** p < 0.05 significant difference; /: no significant difference.
Table 3. Humification degree (E4/E6) under different treatments.
D0D1D2
0 d0.534 ± 0.109 c2.25 ± 0.22 b4.166 ± 0.890 a
30 d1.136 ± 0.341 c12.6 ± 1.900 a5.44 ± 0.953 b
60 d1.181 ± 0.282 c4.857 ± 0.206 b12.666 ± 0.794 a
90 d1.111 ± 0.096 b0.964 ± 0.155 b5.8 ± 0.507 a
120 d1.818 ± 0.078 b1.411 ± 0.295 b9.666 ± 0.369 a
180 d1.714 ± 0.237 b2.666 ± 0.785 b5.833 ± 0.780 a
The significant differences in each parameter among different treatments were determined by one-way ANOVA. Different letters indicate significant difference at p ≤ 0.05.
Publisher’s Note: MDPI stays neutral with regard to jurisdictional claims in published maps and institutional affiliations.

