Article

The Influence of Passengers’ Perceived Social Responsibility Efforts on Their Satisfaction in Public-Private-Partnership Urban Rail Transit Projects

1
Architectural Engineering College, North China Institute of Science and Technology, Langfang 065201, China
2
School of Civil Engineering and Architecture, Zhejiang Sci-Tech University, Hangzhou 310018, China
3
School of Built Environment, Queensland University of Technology (QUT), Brisbane 4001, Australia
4
Faculty of Society and Design, Bond University, Gold Coast 4226, Australia
*
Authors to whom correspondence should be addressed.
Sustainability 2021, 13(23), 13108; https://doi.org/10.3390/su132313108
Submission received: 21 September 2021 / Revised: 13 November 2021 / Accepted: 23 November 2021 / Published: 26 November 2021

Abstract

:
With the rapid development of public-private-partnership (PPP) urban rail transit (URT) projects in China, their social responsibility (SR) is considered to provide a useful way of guaranteeing passengers’ rights and to help urban sustainable development. However, what remains largely unknown is how passengers’ perceptions of the SR effort of such projects’ influences their satisfaction. To bridge this knowledge gap, the current study first proposes a conceptual model based on social responsibility and satisfaction theories. Hypotheses are then tested through bootstrapping analysis based on data drawn from a questionnaire survey of 436 residents from three typical PPP URT projects. The results show that the relationship between the passengers’ perceived SR effort and their satisfaction with PPP URT projects is sequentially and doubly mediated by perceived quality and perceived value. The findings contribute to the current body of knowledge in social responsibility and user satisfaction by introducing passenger-perceived SR effort as an antecedent factor, and offer valuable practical and managerial implications for the projects’ operation management to help promote urban sustainability.

1. Introduction

With China’s continuous economic development and urban expansion, the number of urban rail transit (URT) construction projects has grown rapidly in the past decade. By the end of 2019, 40 cities in mainland China were operating URT systems, with a total length of 6730.27 km [1]. This rapid development has created major fiscal and management challenges for local governments, such as large sunk investments, long-term debt, and operational uncertainty [2,3]. To address such challenges and maintain the sustainability of infrastructure projects, public–private partnership (PPP) procurement arrangements have been widely used, taking advantage of the innovation, flexibility, and financing potential of the private sector. As of 2019, 22 URT projects with a total investment of USD 45.8 billion are planned or have been constructed through PPP [4].
PPP-delivered URT projects have now become an integral part of public transport, playing a significant role in citizens’ daily mobility. In Beijing, for example, more than one million people daily use Metro Line 4, a typical PPP delivered URT project. Given the large scale of passenger flow, enhancing the user satisfaction is an important task that has been attracting an increasing amount of research interest [5,6]. To identify the driving factors involved, most previous studies have explored the relationship between antecedents, satisfaction, and consequences [7], and take passengers’ service perceptions as an antecedent to determine the relationship between perceived causes and user satisfaction [8]. Consequently, the passengers’ perceived quality and values are recognized as main measures of satisfaction [9,10]. The interrelationship between passengers’ perceptions and their satisfaction needs to be examined to provide evidence helpful for the sustainability of projects.
To guarantee such passengers’ rights as equality and justice over quality and value (which usually lead to user satisfaction), projects need to make more social responsibility (SR) efforts [11]. From a project perspective, PPP URT project SR is considered an important and strategic way to engender improvements [12,13,14]. SR incorporates social and environmental considerations in decision making [15] and involves the policies and practices of all stakeholders (including user) through the whole project life-cycle [16]. Thus, fulfilling the social responsibility of projects not only has a profound impact on a project’s financial objectives, but also on user satisfaction in the operation phase [14]. Prior research suggests that SR influences user satisfaction with PPP infrastructure projects only when the users perceive that an SR effort has been made [14,17]. Specific to URT projects, the passengers’ perception of SR effort influences their satisfaction based on the influence of individual perception on attitude [17,18].
However, the mechanism underlying the influence of passenger perception of the SR effort made by PPP URT projects on user satisfaction remains largely unknown. To date, limited research that considers perceived SR effort as an antecedent factor or that develops theoretical models that explain its influence on user satisfaction with PPP URT projects [12] has been conducted. Furthermore, although the impact of perceived causes on user satisfaction is known, no empirical studies have yet systematically explored the relationships between perceived SR effort, perceived causes, and user satisfaction with PPP URT projects [19]. Therefore, this research aims to bridge this knowledge gap by introducing passenger-perceived SR effort as an antecedent factor, and by establishing and validating a theoretical framework that reveals how perceptions influence user satisfaction through perceived causes.

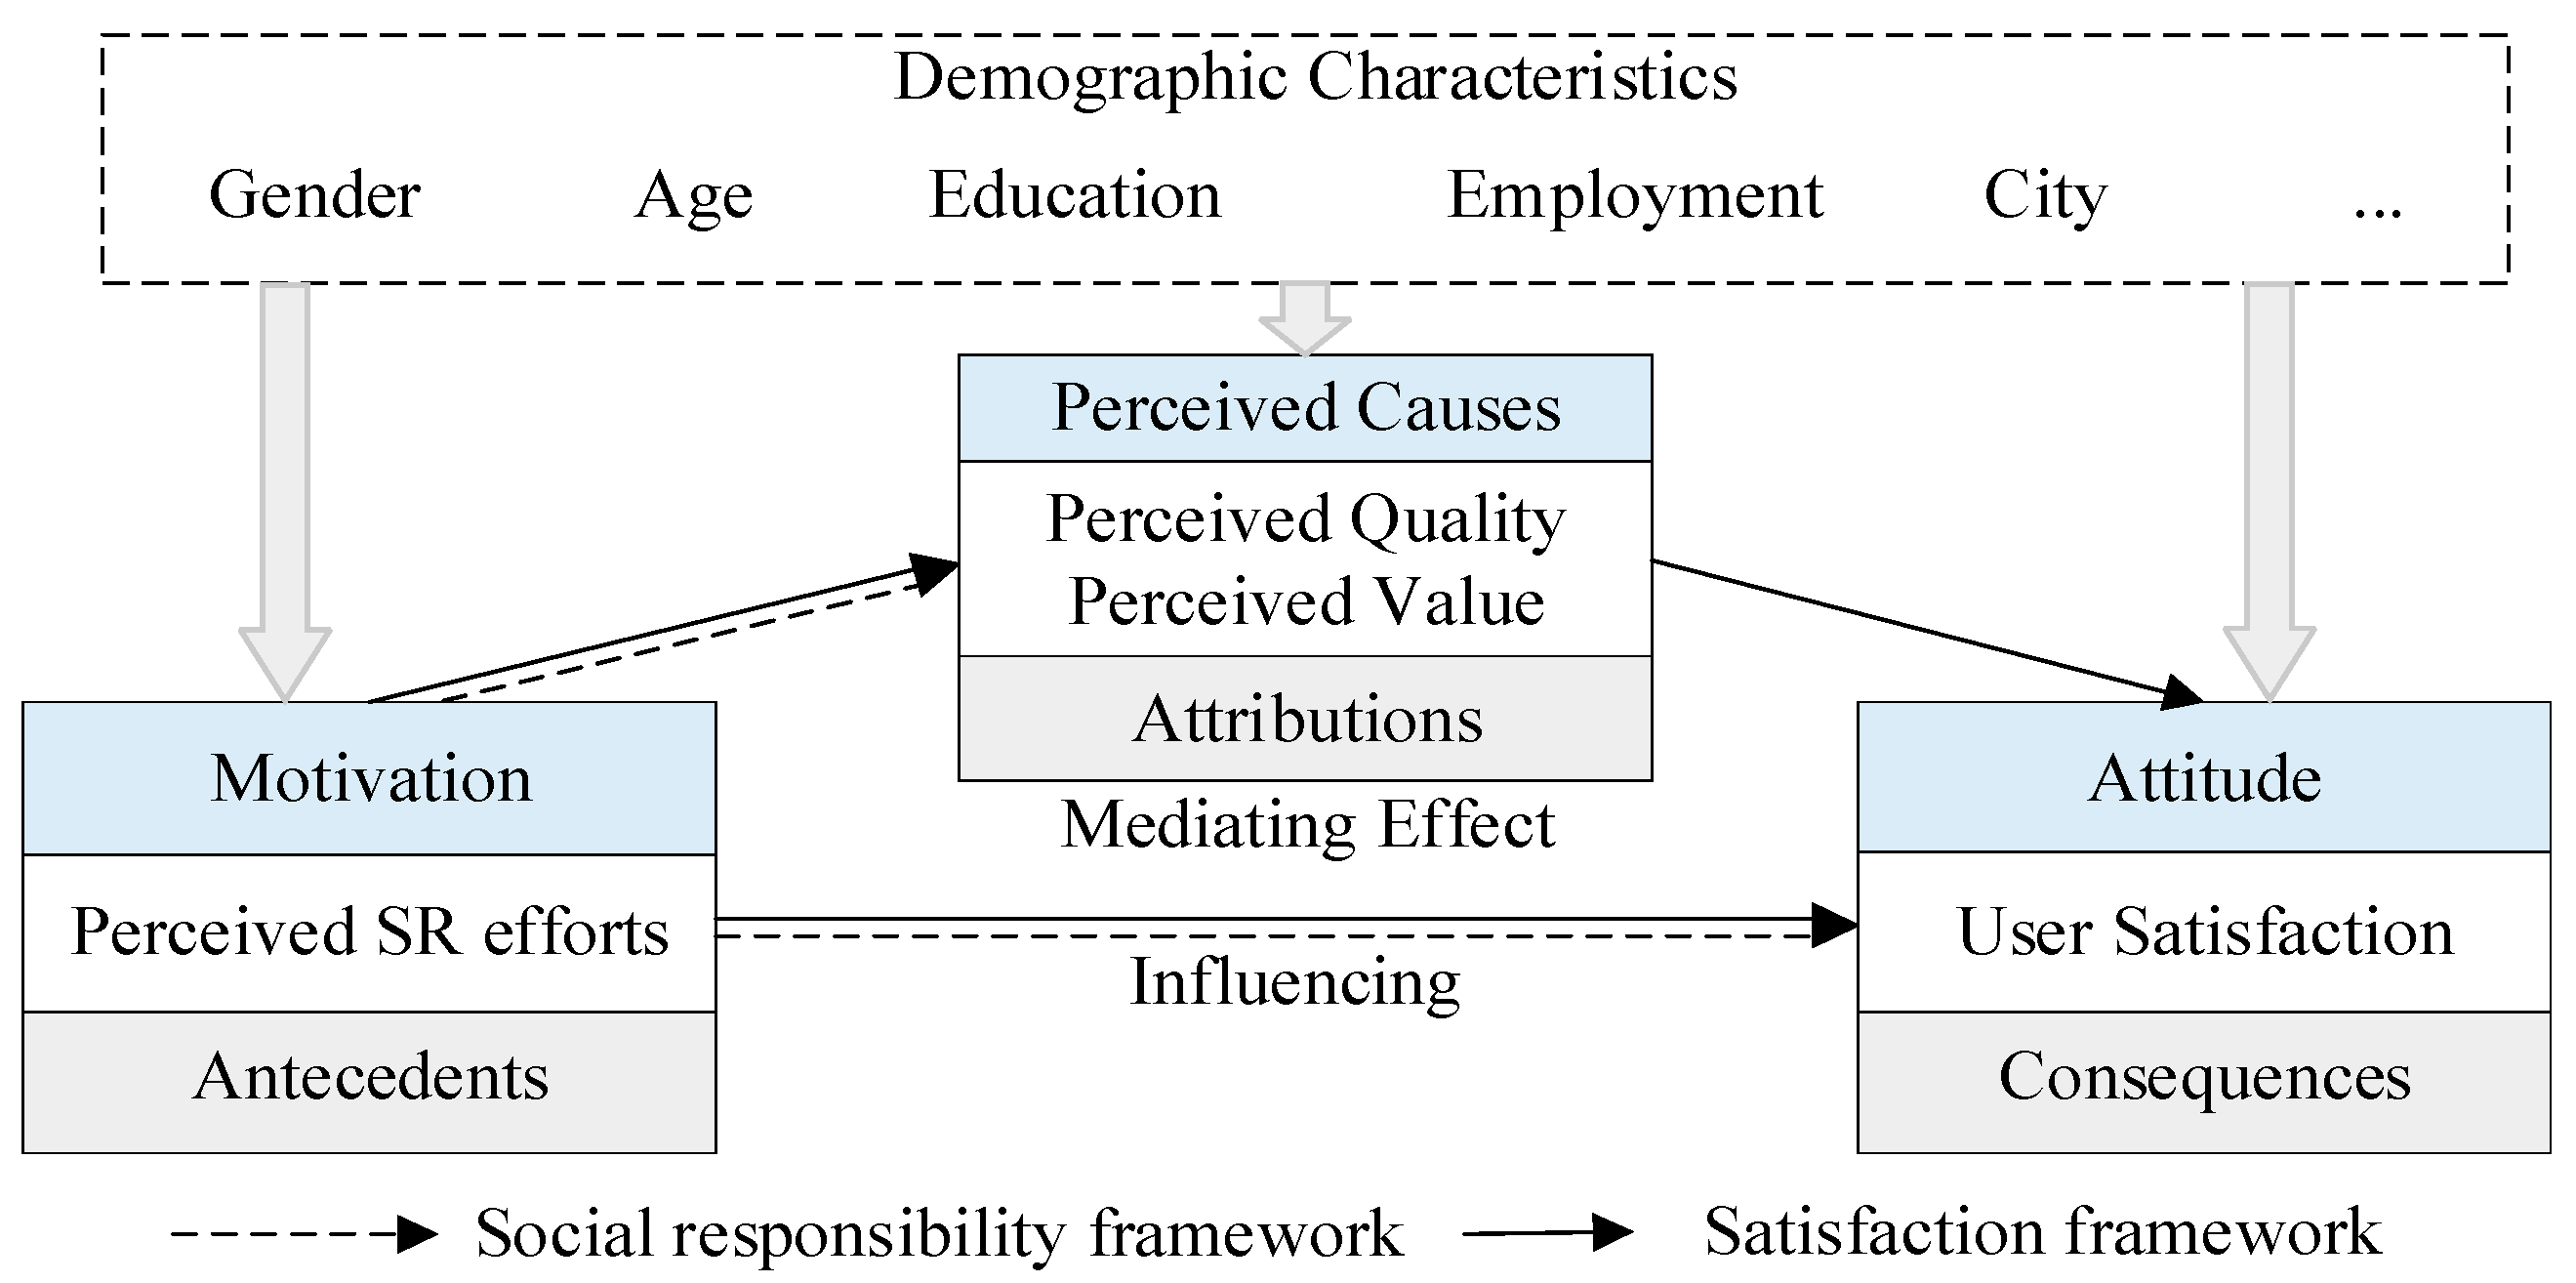
2. Theoretical Framework and Hypotheses

2.1. Theoretical Framework

The systematic and plentiful academic studies of social responsibility and satisfaction provide theoretical foundations in the current study.
Social responsibility is addressed by Carroll’s [20] SR pyramid and by moral management types toward customers; this includes bottom-up economic, legal, ethical, and philanthropic responsibilities. As the basement level, the economic level establishes the monetary motivation to encourage organizations to provide the goods and services consumers need and want in order to enhance perceived value. As the upper part of the pyramid, legal and ethical components define SR as a responsibility to provide quality goods and services that at least meet legal requirements, and to improve perceived quality as morally or ethically expected. Carroll [20] also identified three moral types and orientations toward different stakeholder groups to show the importance of moral management, because social responsibility can only become reality when more managers act morally; the moral management type focuses on giving the customer fair value, full information, quality guarantee, and satisfaction.
Carroll’s SR pyramid has been confirmed by many empirical studies. Customers can obtain benefits and advantages from high-quality and valuable products or services through an organization’s SR effort, while organizations earn financial benefits by paying more attention to consumers and emphasizing customer interests, i.e., attracting extra payments from customers [21,22]. The customers’ perceptions of the quality and value of a specific product or service are invariably affected and motivated by organizational SR effort in this virtuous circle [23]. Moreover, Salazar et al. [24] suggest that the SR activities for project-based organizations need to be manifested through projects, and project SR effort can be used as a way of summing society’s broader expectations of infrastructure projects to achieve economic, social, and environmental goals [16]. Therefore, the user’s satisfaction of infrastructure projects could be enhanced by project SR effort as perceived by users (antecedents) [11].
Satisfaction in each situation reflects a person’s attitudes toward a variety of factors affecting that situation [25]. User satisfaction depends on factors such as individual perception, which should help in creating a suitable environment and situation for forming satisfactory attitudes [18]. The empirical evidence also shows that user satisfaction, which is recognized as an object-based attitude and which serves as a consequence variable, is influenced by antecedent factors, such as product characteristics, project SR, and corporate image [8,24,26]. Based on Kelley and Michela’s [27] general attribution model, which provides a coupling link from antecedents to consequences through the attributions of perceived causes, antecedent factors are motivations from perceived causes and user satisfaction attitudes, while the perceived causes of specific products or services mediate the relationship between antecedent factors and the user’s attitude [28,29]. For the transportation and construction management industry, a project’s SR (that could significantly benefit public transport) motivates user perceptions of the public transport system [30,31], while overall user satisfaction relies on user perceptions of the quality and value of a service attribute [8,10].
In the field of sociology, there are clear indications that the demographics characteristics, such as gender, age, education and employment are important factors in public perceptions and attitude [32]. Age and gender effects have been explained by differences in motivation to maintain prevailing social structures [33]. Towards the educational level, it is often implicitly accepting that education is a better understanding of the scientific underpinnings of social governance structure, public transportation systems and infrastructure project management [33]. Employment status may have diverging effects depending on people’s travel style, suggesting that perception or attitude may be due to usage and travel experiences [8]. Besides that, strong associations of public’s perceptions and attitude have been found with a range of socio-political variables, such as the public governance mechanism, infrastructure policy, society and the economic background of a specific city, since infrastructure is considered a public good [34].
Considering that the passengers’ perception of SR effort plays an important role in user satisfaction and social development based on the social responsibility pyramid and moral management types, this study adopts this as the antecedent factor that motivates perceived causes and user attitudes—the former including perceived value and perceived quality—to form the attributions in applying academic achievements of customer satisfaction. Figure 1 provides the theoretical framework of the current study, showing the relationships between motivation, perceived causes, and the consequence of the users’ affective attitude on satisfaction with the influences of demographic characteristics.

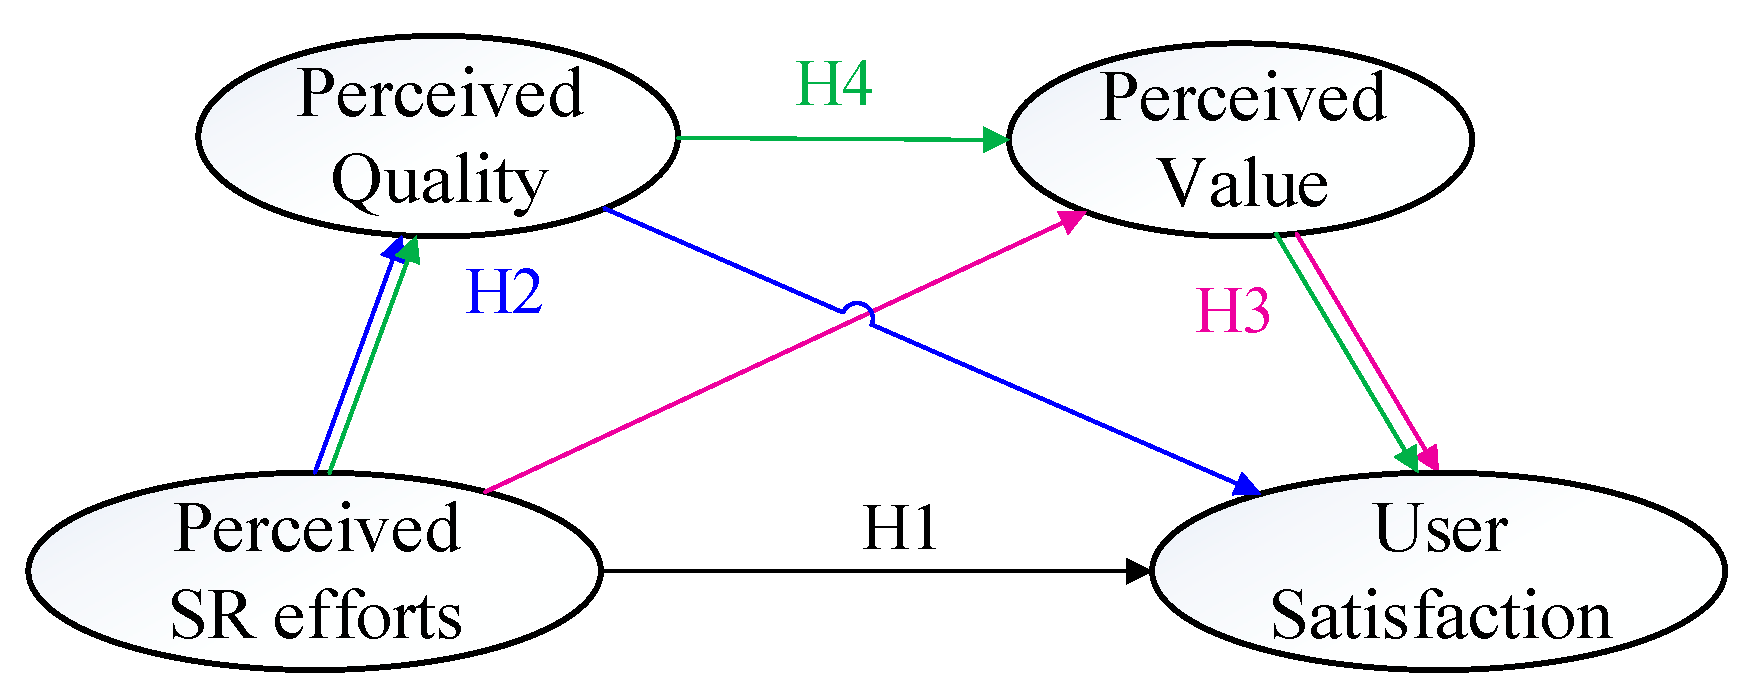
2.2. Research Hypotheses

2.2.1. Perceived SR Effort and User Satisfaction

Prior research suggests that a positive perception of SR effort initiative influences the level of customer satisfaction with a specific product or service [17,35,36]. Several empirical studies present user perceived SR effort as a key determinant of satisfaction in such industries as the airline industry [37], banking services [38], and the automobile industry [39]. Chung et al. [40] present the role of perceived SR effort in customer satisfaction as a corporate image, while Gardberg and Fombrun [41] suggest the positive effects of perceived SR effort on customer behaviors emerge because organizations with SR encourage customers to act as advocates. Other studies attribute the equivocal link between user perceived SR effort and market performance in considering customer satisfaction as an evaluative consequence of SR effort [35,42]. Similarly, perceived SR effort engagements enable organizations to understand customers better and to improve customer-specific knowledge, which leads to user satisfaction [43].
In PPP URT systems, commuting allows people to be involved in daily work and social activities that are essential for subjective satisfaction [44]. Yuen et al. [45] provide convincing evidence of the positive commuting behavior effects of SR−offering functional, emotional, and social values, leading to passenger satisfaction. The passengers’ affective assessments of travel satisfaction are potentially influenced by service interactions with, and customers’ evaluation of behavior towards, SR [46,47]. The perceived SR effort of PPP rail transit systems can affect customer satisfaction by capturing the performance of social and operational groups [2]. Accordingly, the following hypothesis is proposed:
Hypothesis 1 (H1).
Perceived SR effort positively influences user satisfaction with PPP URT projects.

2.2.2. Mediating Role of Perceived Quality

Based on the theoretical framework, except for the direct influence of perceived SR effort, perceived quality is likely to influence user satisfaction with PPP URT projects. User satisfaction is an overall affective response to a perceived discrepancy between prior expectations and actual perceived performance after consumption [7]. As a critical aspect of perceived performance, perceived overall quality includes functional service quality, comfort and cleanliness, service planning, and reliability, which positively enhances customer satisfaction [48]. In PPP URT, studies also indicate that perceived service quality plays an important role affecting passenger satisfaction [49], and higher levels of perceived quality improve customer satisfaction by enhancing the image of URT projects [50]. Moreover, passenger perception of the quality of PPP URT projects is affected by perceived SR effort [22,51], prompting:
Hypothesis 2 (H2).
Perceived quality mediates the relationship between perceived SR effort and user satisfaction with PPP URT projects.

2.2.3. Mediating Role of Perceived Value

Perceived SR effort per se, if not associated with the perceived value of passengers, does not necessarily result in the passengers’ particularistic affective attitude of satisfaction [39]. Previous studies find that perceived value, which is treated as one of the most important marketing strategies for maintaining corporate competitiveness, has a positive effect on customer satisfaction [50]. Customers perceive that they gain more valuable services through being better understood and respected by companies with a strong SR record [42]. Specifically, the passenger’s perceived value of PPP URT projects involves initial factors that affect passenger satisfaction stemming from the contrast between the passenger costs and received service [8,52]. Passenger perception of project SR effort is assumed to be the antecedent cause of the perceived value of PPP URT projects, and user satisfaction is a consequence of perceived value [7,23]. It is valid, therefore, to consider that passenger-perceived value influences user satisfaction while affected by project SRs, and hence:
Hypothesis 3 (H3).
Perceived value mediates the relationship between perceived SR effort and user satisfaction with PPP URT projects.

2.2.4. Serial- and Double-Mediation Effect

Because passenger satisfaction assesses the quality and cost-effectiveness of the transit service, these are important drivers of perceived value, the influence of perceived quality on customer satisfaction being mediated by perceived value [7,53]. Shen et al. [7] propose that perceived quality positively affects perceived value, while perceived value is positively related to satisfaction. Meanwhile, some studies indicate that perceived SR effort is an important driver of perceived quality and perceived value (e.g., [42]). Passengers can also obtain high-quality and valuable services from PPP URT projects that make an SR effort, which appears to be a natural chain between perceived SR effort, perceived quality, perceived value, and user satisfaction [39,54]. Moreover, the indirect effect of perceived SR effort on user satisfaction mediated by perceived quality and perceived value is proposed in previous studies [49,55]. Accordingly, the possible serial- and double-mediation role of perceived quality and perceived value between perceived SR effort and satisfaction appears to be accepted in the formation process of user’s affective satisfaction, prompting:
Hypothesis 4 (H4).
The relationship between perceived SR effort and user satisfaction with PPP URT projects is sequentially and doubly mediated by perceived quality and perceived value.
Figure 2 provides a serial multiple-mediation model to integrate the hypothesized links between perceived SR effort, perceived quality, perceived value, and user satisfaction based on the four hypotheses above.

3. Methodology

The research process includes hypotheses, questionnaire design, data collection, preliminary analysis, descriptive statistics, and hypotheses testing, which leads to an empirical examination of the relationships between perceived SR effort, perceived quality, perceived value, and user satisfaction.

3.1. Questionnaire Design

Based on the literature review summarized above, a two-part self-administered questionnaire comprising 22 questions was designed. The first part solicits the respondents’ demographic characteristics, such as age, gender, education level, and employment status, without disclosing personal privacy information. The second part comprises four constructs relating to the PPP URT project, namely: (1) assessment of its perceived SR effort; (2) its perceived quality; (3) its perceived value; and (4) satisfaction with the project. These are scored on a 5-point Likert scale in which participants are required to rate their degree of agreement with statements from 1 (extremely disagree) to 5 (extremely agree).
A pilot study was conducted with preliminary items for each latent variable obtained from the literature.
(1)
Perceived SR effort. Perceived SR effort was assessed with five items originally developed by Servera-Francés and Piqueras-Tomás [56]. To be consistent with perception assessment, some expressions are revised based on Zhu et al. [11], Pérez and Bosque [38], and Yuen et al. [57].
(2)
Perceived quality. Similar to Zhang et al. [8], we operationalized perceived quality by asking the respondents about their individual assessment of comfort, convenience, operational schedule, and service standards. Howat and Assaker [58] also provided support for comfort and the operational schedule.
(3)
Perceived value. Three items adopted from Sweeney and Soutar [59] (i.e., reasonably priced, good service quality to the fare, and value for money) together with one item (rating of the URT fare is related to its service quality) from Zhang et al. [8] were used to assess this variable. These items were also supported by Servera-Francés and Piqueras-Tomás [56] and Howat and Assaker [58].
(4)
Satisfaction. Satisfaction was assessed with four items, in which two (overall satisfaction, and disparity between reality and ideal) were originally developed by Zhang et al. [8]. To measure the passengers’ assessment of reward feeling and comparative satisfaction, we added these two items based on Servera-Francés and Piqueras-Tomás [56] and Yuen et al. [57].
Five experts from academia and practice, with over five years of related experience and graduate level educational in PPP URT projects in China, were then invited to adjust and optimize the items to fit the URT industry and Chinese context. The final items of variables for each construct in the model are shown in Table 1.
Reliability and validity analysis were employed with pilot pre-surveys in Beijing. Based on the 199 valid responses obtained, a reliability analysis using Cronbach’s alpha was conducted, as well as a validity test using exploratory factor analysis (EFA). All Cronbach’s α for each construct were more than 0.8, while the KMO was more than 0.9 (Table 2), indicating the questionnaire had good reliability and a well-qualified structural validity.

3.2. Samples and Data Collection

The National Development and Reform Commission (NDRC) provides 62 typical PPP cases, including 6 URT projects, 5 of which are operational. When selecting the projects, we fully considered the operation period, economic development, stock or increment, design and construction method (aboveground or underground) from the NDRC’s library of typical projects to ensure their representativeness. As a result, Beijing No. 4 metro line (operated since 2009, underground, increment), Dalian No. 3 rail transit line (operated since 2003, aboveground, stock), and first-stage project of the Huhehot No. 1 Rail Transit Line (operated since 2019, underground/aboveground, increment) were selected as sample projects. The survey respondents are passengers of these three projects.
The survey was conducted from 10 March to 20 May 2020 using an online survey of randomly chosen citizens. A total of 660 questionnaires were received, comprising 224 from Beijing, 224 from Dalian, and 212 from Huhehot. Two criteria are used to identify valid questionnaires: (1) respondents with an answer time of more than 40 s and (2) respondents who have ridden as a passenger at specific projects. In addition, all incomplete questionnaires are eliminated. This left a total of 436 valid responses, with 199, 161, and 76 from the Beijing, Dalian, and Huhehot projects, respectively. The number of responses from the Huhehot projects is significantly lower because there have been fewer passengers due to the short-term operation period of the Huhehot No.1 Rail Transit Line.

3.3. Data Analysis Process

The data analysis process is divided into four steps. SPSS 24.0 was used to analyse data in the first two steps, while AMOS 24.0 was used in the third and fourth steps. First, preliminary analyses including reliability and validity tests, common method bias, confirmatory factor analysis, and bivariate correlation analysis are conducted to ensure the applicability of the proposed model and collected data. Second, descriptive statistics of the sample characteristics are analyzed. Once this is done, the indirect, direct, and total effects of perceived SR effort on user satisfaction via the perceived quality and perceived value are tested with single mediation models. Finally, the hypotheses are tested using a serial multiple-mediation model [60]. More details and results for each analysis process are provided in the descriptive statistics and hypothesis testing section.

4. Results and Discussion

4.1. Descriptive Statistics and Hypothesis Testing

Table 3 provides details of the respondents’ demographic characteristics, indicating that the sample distribution conforms to the overall URT passengers’ characteristics [61,62]. Only 1.8% of respondents were 60-years-old or above, because elder citizens prefer to choose other forms of public transport (e.g., bus or community shuttle) in their daily lives due to the availability of cheaper tickets and more seats [63]. Most respondents were company employees (34.9%) and students (45.2%), with the remaining 19.9% comprising civil servants, self-employers, retirees, and others. The largest proportion of respondents by education level were graduate diploma and above in Beijing (47.2%), undergraduate in Dalian (55.9%), and junior college in Huhehot (88.2%), which matches the economic, social, and talent development level of these cities. In addition, 59.7% of the respondents were passengers at least once a week.
The composite reliability (CR) values of all the constructs and standardized factor loadings of all of the variables were greater than the benchmark value of 0.70 (p < 0.001) (Table 4), confirming internal consistency reliability [64]. Meanwhile, the average variance extracted (AVE) of all constructs ranged from 0.65 to 0.80, exceeding the 0.50 AVE threshold value, and thus the convergent validity was acceptable [64]. Common method bias (CMB) analysis, which is tested before the univariate normality process to overcome measurement threat caused by CMB, show the results for the single-factor model to be Δχ2 = 947.53 (Δd.f. = 5, p < 0.001), which accounts for only 33.3% of the total variance and repudiates the influence of CMB.
A confirmatory factor analysis was adopted to test and confirm the goodness-of-fit of the established model, the results (Table 5) showing that the fit indices of mediation models are highly satisfactory through the maximum likelihood estimation, except the χ2/d.f. in the single mediation model (perceived value). Because the χ2 significance usually increases with sample size, although very sensitive with large samples [65], the χ2/d.f. value less than 5.0 is acceptable; other indices (RMR = 0.041, RESEA = 0071, GFI = 0.935, AGFI = 0.906, CFI = 0.976, NFI = 0.966, TLI = 0.970) reveal a good fit when the observed sample size is large [64,66].
In addition, checking univariate normality of the data by the skewness and kurtosis values (see Table 6) suggests that all of the variables conform to multivariate normality, and thus meet the requirements for mediation analysis [67]. Table 6 also shows the intercorrelations between the variables. The correlational analyses show user satisfaction to be positively correlated with perceived value (r = 0.743, p < 0.01) and perceived quality (r = 0.770, p < 0.01), which in turn is positively correlated with PSR (r = 0.850, p < 0.01). Perceived quality and perceived value are also positively correlated (r = 0.622, p < 0.01). Except for the correlation between PSR and SA, the correlation coefficients imply a medium correlational effect among the variables [68]. Furthermore, discriminant validity was further confirmed. The estimated intercorrelations among all constructs were less than the square roots of the AVE in each construct, which provides preliminary support for discriminant validity [64].

4.1.1. Descriptive Statistics

The descriptive statistics of variables surveyed is conducted before hypotheses testing. The means of four items used to reflect the user satisfaction of PPP URT projects range from 4.16 to 4.26, indicating a relatively high satisfaction received by the selected projects. The mean ranges of perceived quality and perceived value are 4.23~4.38 and 4.03~4.36, which are relatively high, while the perceived SR effort means range from 4.28 to 4.37, indicating that PPP URT projects’ services meet the public’s expectations in terms of SR, service quality, service cost, etc.
The demographic differences that exist in the degree of perceived SR effort, perceived quality, perceived value, and satisfaction towards the PPP URT projects are analyzed by the nonparametric Mann–Whitney U Test, as shown in Table 7. Except for the location of the PPP URT projects, all other demographic characteristics (i.e., gender, age, education level, employment status, and frequency) have no significant influence on perceived SR effort, perceived quality, or satisfaction. The younger respondents (≤25 years old) and students have a greater value perception than elder respondents and company employees, showing that perceived value is influenced by age and employment status: younger people are more easily satisfied than older company employees. Moreover, statistical analysis reveals that respondents from non-first-tier cities perceive a higher quality and value together with more perceived SR effort and satisfaction than participators from first-tier cities. For the non-first-tier cities, the perceived quality of respondents from Huhehot (mean = 4.57) is also significantly (p < 0.01) higher than respondents from Dalian (mean = 4.32), which suggests that the new PPP URT project provides higher quality facilities and services than before.

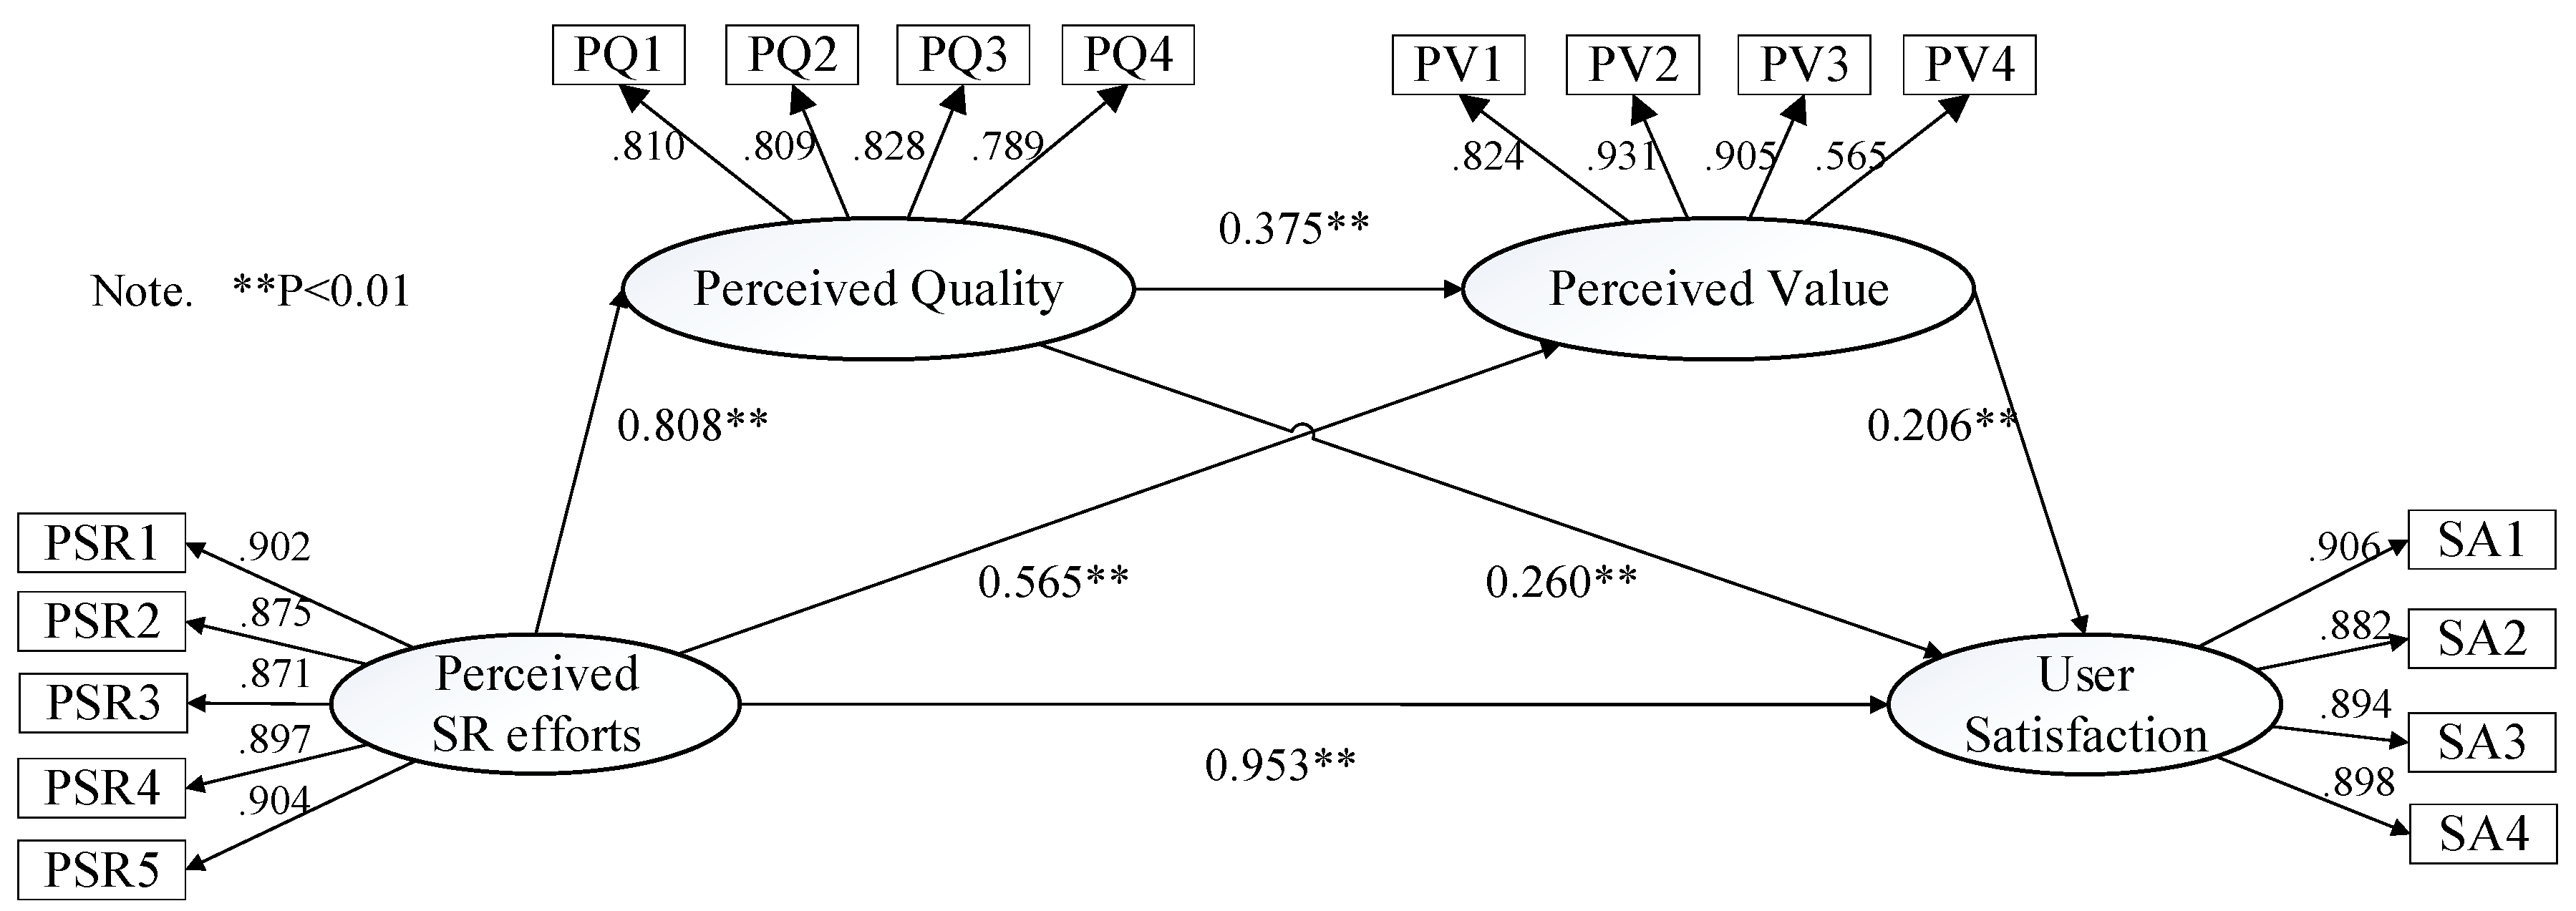
4.1.2. Hypotheses Testing

Two single mediation analyses are performed to examine how various factors influence the level of user satisfaction. For both perceived quality and perceived value single mediator models, the results of the bootstrap test confirm the existence of a positive and significant mediating effect on perceived quality (indirect effect = 0.272, Z > 1.96, p < 0.01) and perceived value (indirect effect = 0.179, Z > 1.96, p < 0.01) between perceived SR effort and user satisfaction.
The bootstrapping results of the proposed serial multiple mediation model are shown in Figure 3 and Table 8. The total effect of perceived SR effort on user satisfaction receives strong support (c = 0.953, p < 0.001), while the direct effect is estimated as 0.565 (p < 0.001) and all the indirect effects are significant. Thus, H1 is supported, in that perceived SR effort positively influences user satisfaction with PPP URT projects. The indirect effect of perceived SR effort on user satisfaction, first through perceived quality and then through perceived value, estimated to be 0.062 with a 95% bootstrap at the 0.01 level (Table 8), is the smallest indirect effect. The indirect effect through the mediator of perceived quality is estimated as 0.210 (p = 0.001), which is the largest indirect effect, while the indirect effect through the mediator of perceived value is estimated to be 0.116. According to Hayes’ standard, an indirect effect is statistically significant when the 95% bias-corrected bootstrap interval confidence interval is entirely above or entirely below zero [60]. As the bootstrap confidence intervals are entirely above zero, H2, H3, and H4 stand unrefuted. Therefore, the relationship between perceived SR effort and user satisfaction with PPP URT projects is taken to be sequentially and doubly mediated by perceived quality and perceived value.

4.2. Perception Differences

As shown in Table 7, the results of the Mann–Whitney U test indicate that there is no significant difference in perceived SR effort, perceived quality, perceived value, and satisfaction between respondents of different gender, educational level, and frequency. However, perceptions between respondents of separate locations, age, and employment status are significantly different.
Respondents from first-tier cities have a lower perception of perceived SR effort, perceived quality, perceived value, and satisfaction towards PPP URT projects. This finding corresponds with such previous studies as Grisé and El-Geneidy [69] and Diana [70], the primary reason being that individuals residing in smaller, low population density areas expressed higher levels of satisfaction and quality perception than those in larger and more densely populated cities with a more extensive transit system [62]. Passengers in first-tier cities tend to have a lower assessment of perceived SR effort, perceived quality, perceived value, and satisfaction because they have a high expectation of URT services being more frequent and convenient with better comfort and cheaper tickets [51,70]. In contrast, the perceptions of passengers in non-first-tier cities are higher because the PPP URT projects are likely to be less crowded and less hindered by congestion [69].
Moreover, younger students (≤25 years old) perceive the services of PPP URT projects to be more valuable than the elder company employees (>25 years old), which confirms the findings highlighted by Lee and Phau [71] and lends further support for the notion that younger passengers combine functional and emotional values to form an entire assessment of perceived value, rather than merely basing their perceived value on individual affective dimensions [7].
In addition, that perceived value assessment is influenced by employment status and income confirms Barajas’ [72] conclusion that students with low or no income are more influenced by the contrast between overall high-quality service and low payment in their value perceptions. That is, age and income have significantly different effects on perceived value [73], and student passengers who have a lower income level have the higher level of the perceived value of the PPP URT projects.

4.3. Verified Effect

In PPP projects, the high perceived SR effort scores confirm that projects with strong SR beliefs involve a more positive attitude towards the customer’s orientation [74], and place greater emphasis on evaluating service quality based on their involvement in SR [47,75]. Moreover, SR is helpful for achieving sustainable development through meeting public needs and improving service levels [76]. The supported hypotheses in the present study responded to the call in the literature to have more insights into perceived SR effort in the construction and operation phase of PPP projects, which affects customers’ satisfaction [2,14]. The significant direct and indirect effects of perceived SR effort on satisfaction suggest that, when PPP projects pay more attention to being involved in public responsibility and user achievement, passengers more easily form an affective satisfaction and attitude towards PPP URT projects [34]. This is consistent with prior research findings, in that users are expected to perceive greater utility and derive greater satisfaction of transit systems attributed to suppliers’ strong SR beliefs [47]. As a supplement to previous research findings [44,46], the results tell us that user satisfaction is not only affected by perceived SR effort directly, but is also impacted indirectly through other factors. Directly, PPP projects with SR beliefs and innovation ability have the potential to create greater social welfare and improve user satisfaction [77,78]. Indirectly, user satisfaction with a multidimensional and emotional nature are subsequently influenced by perceived value and perceived quality, which could be affected and motivated by social responsibilities [14,22,77].
The present study’s results support the research hypotheses about the mediating role of perceived quality and perceived value, as well as confirm the positive and significant serial- and double-mediating influences of perceived quality and perceived value on the relationship between perceived SR effort and user satisfaction. This finding confirms the view that, as an antecedent of satisfaction, perceived SR effort plays a positive role in enhancing perceived quality and perceived value [23], while perceived quality positively affects perceived value [7,50]. The current study proposes three types of mediating effects. Firstly, the result that perceived quality mediates the relationship between perceived SR effort and user satisfaction is in line with Walsh and Bartikowski’s [42] finding that projects with strong SR beliefs could enhance satisfaction through improving the users’ perceived quality. Secondly, the mediation effect of perceived value supports previous research findings, in that perceived value is the connecting and transmitting factor with a mediating effect between perceived SR effort and user satisfaction [8,50]. Finally, the results also further confirm the research findings in the PPP infrastructure project area that, for example, improvements in project quality and reduction of overall cost based on SR beliefs are crucial factors influencing user satisfaction, particularly during the operation phase [76,78].
In summary, the hypothesized model of serial- and double-mediating effects between perceived SR effort and user satisfaction raised by the theoretical framework and literature review are all accepted by the collected data in the present study, confirming the logical and conceptual basis of the model.

5. Conclusions

To describe how passenger perception of project SR effort influences user satisfaction with PPP URT projects quantitatively, the study proposed four research hypotheses based on theoretical analysis and literature review. From the large sample in-depth longitudinal questionnaire survey of Chinese passengers’ perceptions and satisfaction, the principal findings are that (1) user satisfaction is significantly and positively related to user-perceived project SR, quality and value with PPP URT projects; (2) respondents from first-tier cities have a lower level of perceived SR effort, perceived quality, perceived value, and user satisfaction than respondents from other cities, while younger respondents (≤25 years old) and students have a higher level of perceived value than other age and employment status groups; and (3) the relationship between perceived SR effort and user satisfaction with PPP URT projects is sequentially and doubly mediated by perceived quality and perceived value.
This study provides several theoretical insights into the operation of PPP projects in the urban transit industry. It examines the serial- and double-mediating effect of perceived quality and perceived value between perceived SR effort and user satisfaction with PPP URT projects, while previous studies fail to describe the relationship between perceived SR effort and user satisfaction quantitatively and systematically. Meanwhile, the study also contributes to the body of knowledge about SR and user satisfaction by introducing perceived quality and perceived value as mediating factors and developing a theoretical framework to explore the complex relationships between motivation factors, perceived causes, and user attitude. Moreover, although empirical evidence is from urban transit projects, the theoretical framework derived from the current study may be used for similar studies in other PPP infrastructure projects.
The results offer some valuable practical and managerial implications for the management of PPP URT projects, especially in the operation phase. Firstly, the overall importance of SR for PPP urban transit passenger satisfaction suggests that PPP projects should regard SR as a vital performance criterion and report their SR practices in consumer communication to improve consumer awareness of SR. Secondly, the analysis of the mediating role of perceived quality and perceived value provides special purpose vehicles with another avenue to bring high-quality, valuable, sustainable, and resilient services through demonstrating true concern for the customer. Finally, based on the descriptive statistics, managers should take steps to enhance user satisfaction levels by providing more preferential measures to older passengers (>25) and company employees, as well as improving service quality to first-tier cities passengers.
Despite the large sample survey in the current study, one limitation is that, as with many empirical studies based on the questionnaire survey method, the results are impacted by the limited sample capacity. Moreover, we had no alternative but to use an online survey to collect data, due to the COVID-19 pandemic; more face-to-face questionnaire surveys are expected in future research in order to provide further confirmation of the findings of the current study. In addition to this, research exploring other project-related antecedents and their influencing relationships, as well as the social responsibility antecedent factors for more effective future management of PPP URT and similar projects, needs be conducted.

Author Contributions

Conceptualization, B.X.; Data curation, G.H.; Funding acquisition, C.C. and Y.L.; Investigation, M.L.; Methodology, Y.L.; Project administration, C.C. and B.X.; Software, G.H.; Supervision, M.S.; Writing–original draft, C.C.; Writing–review and editing, M.S. All authors have read and agreed to the published version of the manuscript.

Funding

This research was funded by the National Natural Science Foundation of China (NSFC) (Grant No 72001079, 72072165), the International Science and Technology Cooperation Center in Hebei province (Grant No 20594501D), and the Humanities and Social Science Program of Hebei Province (Grant No. SQ192025).

Institutional Review Board Statement

The study was conducted according to the research guidelines approved by the Research Committees of Authors Institutions.

Informed Consent Statement

Informed consent was obtained from all subjects involved in the study.

Data Availability Statement

The data presented in this study are available on request from the corresponding author.

Conflicts of Interest

The authors declare that they have no conflicts of interest.

References

  1. CHlvxing. Statistical Analysis Report of Urban Rail Transit. 2019. Available online: https://zhuanlan.zhihu.com/p/102164566 (accessed on 3 June 2020).
  2. Mohammadi, A.; Amador-Jimenez, L.; Nasiri, F. Review of asset management for metro systems: Challenges and opportunities. Transp. Rev. 2019, 39, 309–326. [Google Scholar] [CrossRef]
  3. Chang, Z. Public–private partnerships in China: A case of the Beijing No.4 Metro line. Transp. Policy 2013, 30, 153–160. [Google Scholar] [CrossRef]
  4. Project Library. PPP Service Platform. 2020. Available online: https://www.chinappp.cn/projectcenter/ (accessed on 3 June 2020).
  5. Wang, Y.; Zhang, Z.; Sun, H. Assessing Customer Satisfaction of Urban Rail Transit Network in Tianjin Based on Intuitionistic Fuzzy Group Decision Model. Discret. Dyn. Nat. Soc. 2018, 2018, 1–11. [Google Scholar] [CrossRef]
  6. Li, X.; Yamamoto, T.; Yan, T.; Lu, L.; Ye, X. First Train Timetabling for Urban Rail Transit Networks with Maximum Passenger Transfer Satisfaction. Sustainability 2020, 12, 4166. [Google Scholar] [CrossRef]
  7. Shen, W.; Xiao, W.; Wang, X. Passenger satisfaction evaluation model for Urban rail transit: A structural equation modeling based on partial least squares. Transp. Policy 2016, 46, 20–31. [Google Scholar] [CrossRef]
  8. Zhang, C.; Liu, Y.; Lu, W.; Xiao, G. Evaluating passenger satisfaction index based on PLS-SEM model: Evidence from Chinese public transport service. Transp. Res. Part A Policy Pract. 2019, 120, 149–164. [Google Scholar] [CrossRef]
  9. Kim, S.H.; Chung, J.-H.; Park, S.; Choi, K. Analysis of user satisfaction to promote public transportation: A pattern-recognition approach focusing on out-of-vehicle time. Int. J. Sustain. Transp. 2017, 11, 582–592. [Google Scholar] [CrossRef]
  10. Fiorio, C.V.; Florio, M.; Perucca, G. User satisfaction and the organization of local public transport: Evidence from European cities. Transp. Policy 2013, 29, 209–218. [Google Scholar] [CrossRef]
  11. Zhu, Q.; Yin, H.; Liu, J.; Lai, K. How is employee perception of organizational efforts in corporate social responsibility related to their satisfaction and loyalty towards developing harmonious society in Chinese enterprises? Corp. Soc. Responsib. Environ. Manag. 2014, 21, 28–40. [Google Scholar] [CrossRef]
  12. Lin, H.; Zeng, S.; Ma, H.; Zeng, R.; Tam, V.W. An indicator system for evaluating megaproject social responsibility. Int. J. Proj. Manag. 2017, 35, 1415–1426. [Google Scholar] [CrossRef]
  13. Lin, X.; Ho CShen, G. For the balance of stakeholders’ power and responsibility: A collaborative framework for implementing social responsibility issues in construction projects. Manag. Decis. 2018, 56, 550–569. [Google Scholar] [CrossRef]
  14. Yu, Y.; Kyei, R.O.; Chan, A.P.C.; Chen, C.; Martek, I. Review of social responsibility factors for sustainable development in public-private partnerships. Sustain. Dev. 2018, 26, 515–524. [Google Scholar] [CrossRef]
  15. ISO. ISO 26000: Guidance on Social Responsibility; The International Organization for Standardization: Geneva, Switzerland, 2006. [Google Scholar]
  16. Zeng, S.; Ma, H.; Lin, H.; Zeng, R.; Tam, V.W. Social responsibility of major infrastructure projects in China. Int. J. Proj. Manag. 2015, 33, 537–548. [Google Scholar] [CrossRef]
  17. Chu, S.-C.; Chen, H.-T. Impact of consumers’ corporate social responsibility-related activities in social media on brand attitude, electronic word-of-mouth intention, and purchase intention: A study of Chinese consumer behavior. J. Consum. Behav. 2019, 18, 453–462. [Google Scholar] [CrossRef]
  18. Lawrence, M.; Low, G. Exploring Individual User Satisfaction within User-Led Development. MIS Q. 1993, 17, 195. [Google Scholar] [CrossRef]
  19. Zhou, Z.; Mi, C. Social responsibility research within the context of megaproject management: Trends, gaps and opportunities. Int. J. Proj. Manag. 2017, 35, 1378–1390. [Google Scholar] [CrossRef]
  20. Carroll, A.B. The pyramid of corporate social responsibility: Toward the moral management of organizational stakeholders. Bus. Horiz. 1991, 34, 39–48. [Google Scholar] [CrossRef]
  21. McWilliams, A.; Siegel, D. Corporate social responsibility: A theory of the firm perspective. Acad. Manag. Rev. 2001, 26, 117–127. [Google Scholar] [CrossRef]
  22. Windsor, D. Corporate Social Responsibility: Three Key Approaches. J. Manag. Stud. 2006, 43, 93–114. [Google Scholar] [CrossRef]
  23. Oginni, O.S.; Omojowo, A.D. Sustainable Development and Corporate Social Responsibility in Sub-Saharan Africa: Evidence from Industries in Cameroon. Economies 2016, 4, 10. [Google Scholar] [CrossRef] [Green Version]
  24. Salazar, J.; Husted, B.W.; Biehl, M. Thoughts on the Evaluation of Corporate Social Performance Through Projects. J. Bus. Ethics. 2011, 105, 175–186. [Google Scholar] [CrossRef]
  25. Wixom, B.H.; Todd, P.A. A Theoretical Integration of User Satisfaction and Technology Acceptance. Inf. Syst. Res. 2005, 16, 85–102. [Google Scholar] [CrossRef]
  26. Jamali, D. A Stakeholder Approach to Corporate Social Responsibility: A Fresh Perspective into Theory and Practice. J. Bus. Ethics. 2007, 82, 213–231. [Google Scholar] [CrossRef]
  27. Kelley, H.H.; Michela, J.L. Attribution Theory and Research. Annu. Rev. Psychol. 1980, 31, 457–501. [Google Scholar] [CrossRef] [Green Version]
  28. Tait, P.; Vessey, I. The Effect of User Involvement on System Success: A Contingency Approach. MIS Q. 1988, 12, 91. [Google Scholar] [CrossRef]
  29. Eagly, A.H.; Chaiken, S. The Psychology of Attitudes; Harcourt Brace Jovanovich College Publishers: New York, NY, USA, 1993. [Google Scholar]
  30. Guo, Z.; Wilson, N.H. Assessing the cost of transfer inconvenience in public transport systems: A case study of the London Underground. Transp. Res. Part A Policy Pract. 2011, 45, 91–104. [Google Scholar] [CrossRef]
  31. Hernandez, S.; Monzon, A.; de Oña, R. Urban transport interchanges: A methodology for evaluating perceived quality. Transp. Res. Part A Policy Pract. 2016, 84, 31–43. [Google Scholar] [CrossRef]
  32. Gonzalez, V.M.; Coromina, L.; Galí, N. Overtourism: Residents’ perceptions of tourism impact as an indicator of resident social carrying capacity—Case study of a Spanish heritage town. Tour. Rev. 2018, 73, 277–296. [Google Scholar] [CrossRef]
  33. Poortinga, W.; Whitmarsh, L.; Steg, L.; Böhm, G.; Fisher, S. Climate change perceptions and their individual-level determinants: A cross-European analysis. Glob. Environ. Chang. 2019, 55, 25–35. [Google Scholar] [CrossRef]
  34. Cui, C.; Liu, Y.; Hope, A.; Wang, J. Review of studies on the public–private partnerships (PPP) for infrastructure projects. Int. J. Proj. Manag. 2018, 36, 773–794. [Google Scholar] [CrossRef]
  35. Luo, X.; Bhattacharya, C. Corporate social responsibility, customer satisfaction, and market value. J. Mark. 2006, 70, 1–18. [Google Scholar] [CrossRef]
  36. Park, E.; Kim, K.J.; Kwon, S.J. Corporate social responsibility as a determinant of consumer loyalty: An examination of ethical standard, satisfaction, and trust. J. Bus. Res. 2017, 76, 8–13. [Google Scholar] [CrossRef]
  37. Park, E. Corporate social responsibility as a determinant of corporate reputation in the airline industry. J. Retail. Consum. Serv. 2019, 47, 215–221. [Google Scholar] [CrossRef]
  38. Pérez, A.; Del Bosque, I.R. An Integrative Framework to Understand How CSR Affects Customer Loyalty through Identification, Emotions and Satisfaction. J. Bus. Ethics. 2015, 129, 571–584. [Google Scholar] [CrossRef] [Green Version]
  39. Loureiro, S.M.C.; Sardinha, I.M.D.; Reijnders, L. The effect of corporate social responsibility on consumer satisfaction and perceived value: The case of the automobile industry sector in Portugal. J. Clean. Prod. 2012, 37, 172–178. [Google Scholar] [CrossRef]
  40. Chung, K.-H.; Yu, J.-E.; Choi, M.-G.; Shin, J.-I. The Effects of CSR on Customer Satisfaction and Loyalty in China: The Moderating Role of Corporate Image. J. Econ. Bus. Manag. 2015, 3, 542–547. [Google Scholar] [CrossRef] [Green Version]
  41. Gardberg, N.A.; Fombrun, C.J. Corporate citizenship: Creating intangible assets across institutional environments. Acad. Manag. Rev. 2006, 31, 329–346. [Google Scholar]
  42. Walsh, G.; Bartikowski, B. Exploring corporate ability and social responsibility associations as antecedents of customer satisfaction cross-culturally. J. Bus. Res. 2013, 66, 989–995. [Google Scholar] [CrossRef]
  43. Sen, S.; Bhattacharya, C. Does Doing Good Always Lead to Doing Better? Consumer Reactions to Corporate Social Responsibility. J. Mark. Res. 2001, 38, 225–243. [Google Scholar] [CrossRef]
  44. Wu, W.; Wang, M.; Zhang, F. Commuting behavior and congestion satisfaction: Evidence from Beijing, China. Transp. Res. Part D Transp. Environ. 2019, 67, 553–564. [Google Scholar] [CrossRef]
  45. Yuen, K.F.; Thai, V.; Wong, Y.D. Are customers willing to pay for corporate social responsibility? A study of individual-specific mediators. Total. Qual. Manag. Bus. Excel. 2016, 27, 1–15. [Google Scholar] [CrossRef]
  46. Seo, K.; Moon, J.; Lee, S. Synergy of corporate social responsibility and service quality for airlines: The moderating role of carrier type. J. Air Transp. Manag. 2015, 47, 126–134. [Google Scholar] [CrossRef]
  47. Yuen, K.F.; Thai, V.V.; Wong, Y.D. An investigation of shippers’ satisfaction and behaviour towards corporate social responsibility in maritime transport. Transp. Res. Part A Policy Pract. 2018, 116, 275–289. [Google Scholar] [CrossRef]
  48. Wang, Y.; Zhang, Z.; Zhu, M.; Wang, H. The Impact of Service Quality and Customer Satisfaction on Reuse Intention in Urban Rail Transit in Tianjin, China. SAGE Open 2020, 10, 2158244019898803. [Google Scholar] [CrossRef]
  49. Zhen, F.; Cao, X.; Tang, J. The role of access and egress in passenger overall satisfaction with high speed rail. Transportation 2019, 46, 2137–2150. [Google Scholar] [CrossRef]
  50. Wu, J.; Lin, Y.; Hsu, F. An empirical analysis of synthesizing the effects of service quality, perceived value, corporate image and customer satisfaction on behavioral intentions in the transport industry: A case of Taiwan high-speed rail. Innov. Mark. 2011, 7, 83–100. [Google Scholar]
  51. Zhao, P.; Li, P. Travel satisfaction inequality and the role of the urban metro system. Transp. Policy 2019, 79, 66–81. [Google Scholar] [CrossRef]
  52. Yuan, J.; Ji, W.; Guo, J.; Skibniewski, M.J. Simulation-based dynamic adjustments of prices and subsidies for transportation PPP projects based on stakeholders’ satisfaction. Transportation 2019, 46, 2309–2345. [Google Scholar] [CrossRef]
  53. Wu, X.; Cao, X.; Ding, C. Exploring rider satisfaction with arterial BRT: An application of impact asymmetry analysis. Travel Behav. Soc. 2020, 19, 82–89. [Google Scholar] [CrossRef]
  54. Gallarza, M.; Saura, I. Value dimensions, perceived value, satisfaction and loyalty: An investigation of university students’ travel behavior. Tour. Manag. 2006, 27, 437–452. [Google Scholar] [CrossRef]
  55. Bezerra, G.C.; Gomes, C.F. Antecedents and consequences of passenger satisfaction with the airport. J. Air Transp. Manag. 2020, 83, 101766. [Google Scholar] [CrossRef]
  56. Servera-Francés, D.; Piqueras-Tomás, L. The effects of corporate social responsibility on consumer loyalty through consumer perceived value. Econ. Res.-Ekonomska Istraživanja 2019, 32, 66–84. [Google Scholar] [CrossRef] [Green Version]
  57. Yuen, K.F.; Thai, V.; Wong, Y.D. Corporate social responsibility and classical competitive strategies of maritime transport firms: A contingency-fit perspective. Transp. Res. Part A Policy Pract. 2017, 98, 1–13. [Google Scholar] [CrossRef]
  58. Howat, G.; Assaker, G. The hierarchical effects of perceived quality on perceived value, satisfaction, and loyalty: Empirical results from public, outdoor aquatic centres in Australia. Sport Manag. Rev. 2013, 16, 268–284. [Google Scholar] [CrossRef]
  59. Sweeney, J.C.; Soutar, G. Consumer perceived value: The development of a multiple item scale. J. Retail. 2001, 77, 203–220. [Google Scholar] [CrossRef]
  60. Hayes, A.F. Introduction to Mediation, Moderation, and Conditional Process Analysis: A Regression-Based Approach; Guilford Publications: New York, NY, USA, 2017; pp. 120–141. [Google Scholar]
  61. AOM. Beijing Metro Development and Change Report. 2018. Available online: https://www.sohu.com/a/259098621_754926 (accessed on 3 June 2020).
  62. Aydin, N.; Celik, E.; Gumus, A.T. A hierarchical customer satisfaction framework for evaluating rail transit systems of Istanbul. Transp. Res. Part A Policy Pract. 2015, 77, 61–81. [Google Scholar] [CrossRef]
  63. Zhang, X.; Chen, X. Analysis of Walking Characteristics in urban public transport interchange. Urban Mass Transit. 2012, 15, 74–83. (In Chinese) [Google Scholar]
  64. Wang, C.-J.; Tsai, H.-T.; Tsai, M.-T. Linking transformational leadership and employee creativity in the hospitality industry: The influences of creative role identity, creative self-efficacy, and job complexity. Tour. Manag. 2014, 40, 79–89. [Google Scholar] [CrossRef]
  65. Kline, R.B. Principles and Practice of Structural Equation Modeling, 4th ed.; Guilford Press: New York, NY, USA, 2016; 534p. [Google Scholar]
  66. Xiong, B.; Skitmore, M.; Xia, B. A critical review of structural equation modeling applications in construction research. Autom. Constr. 2015, 49, 59–70. [Google Scholar] [CrossRef] [Green Version]
  67. Hu, L.T.; Bentler, P.M. Cutoff criteria for fit indexes in covariance structure analysis: Conventional criteria versus new alternatives. Struct. Equ. Model. Multidiscip. J. 1999, 6, 1–55. [Google Scholar] [CrossRef]
  68. Field, A. Discovering Statistics Using IBM SPSS Statistics; Sage: London, UK, 2013. [Google Scholar]
  69. Grisé, E.; El-Geneidy, A. Where is the happy transit rider? Evaluating satisfaction with regional rail service using a spatial segmentation approach. Transp. Res. Part A Policy Pract. 2018, 114, 84–96. [Google Scholar] [CrossRef]
  70. Diana, M. Measuring the satisfaction of multimodal travelers for local transit services in different urban contexts. Transp. Res. Part A Policy Pract. 2012, 46, 1–11. [Google Scholar] [CrossRef] [Green Version]
  71. Lee, S.; Phau, I. Young tourists’ perceptions of authenticity, perceived value and satisfaction: The case of Little India, Singapore. Young Consum. 2018, 19, 70–86. [Google Scholar] [CrossRef]
  72. Barajas, J.M.; Chatman, D.G.; Weinstein, A.A. Immigration, income, and public transit perceptions: Findings from an intercept survey. J. Public Transp. 2018, 21, 1–18. [Google Scholar] [CrossRef]
  73. Yarimoglu, E.K. Demographic differences on service quality and perceived value in private online shopping clubs. J. Strat. Mark. 2017, 25, 240–257. [Google Scholar] [CrossRef]
  74. Parsa, H.; Lord, K.R.; Putrevu, S.; Kreeger, J. Corporate social and environmental responsibility in services: Will consumers pay for it? J. Retail. Consum. Serv. 2015, 22, 250–260. [Google Scholar] [CrossRef]
  75. Lirn, T.-C.; Lin, H.-W.; Shang, K.-C. Green shipping management capability and firm performance in the container shipping industry. Marit. Policy Manag. 2013, 41, 159–175. [Google Scholar] [CrossRef]
  76. Osei-Kyei, R.; Chan, A.P.C.; Yu, Y.; Chen, C.; Ke, Y.; Tijani, B. Social Responsibility Initiatives for Public-Private Partnership Projects: A Comparative Study between China and Ghana. Sustainability 2019, 11, 1338. [Google Scholar] [CrossRef] [Green Version]
  77. Verweij, S. Producing satisfactory outcomes in the implementation phase of PPP infrastructure projects: A fuzzy set qualitative comparative analysis of 27 road constructions in the Netherlands. Int. J. Proj. Manag. 2015, 33, 1877–1887. [Google Scholar] [CrossRef] [Green Version]
  78. Hong, S.; Kim, T.K. Public–private partnership meets corporate social responsibility—The case of H-JUMP school. Public Money Manag. 2018, 38, 297–304. [Google Scholar] [CrossRef]
Figure 1. Theoretical framework.
Sustainability 13 13108 g001
Figure 2. Serial Multiple-Mediation Model.
Sustainability 13 13108 g002
Figure 3. Unrefuted serial multiple mediation model of perceived SR effort and user satisfaction.
Sustainability 13 13108 g003
Table 1. Variables for each construct.
Latent VariableItemsReferences
Perceived
SR Effort
(PSR)
PSR1In my opinion, the URT project is constantly striving to know and meet the social, environmental, ethical, etc., consumer needs.[11,56]
PSR2In my opinion, the URT project uses consumer satisfaction as an indicator to improve service.[38,56]
PSR3In my opinion, the URT project offers transparent and complete information about URT services to passengers.[56]
PSR4In my opinion, the URT project has established procedures to respond to all consumer social, environmental, ethical, etc., complaints.[56,57]
PSR5In my opinion, the URT project behaves honestly with passengers.[56]
Perceived Quality
(PQ)
PQ1The stations and carriages are comfortable.[8,58]
PQ2It is convenient to transit.[8]
PQ3The operation schedule is appropriate.[8,58]
PQ4URT service has informationalized service standards.[8]
Perceived Value
(PV)
PV1Rating of the URT fare is related to its service quality.[8]
PV2The URT fare is reasonably priced.[56,59]
PV3The URT provides good service quality for the fare.[8,59]
PV4The URT facility provides value for money.[58,59]
User Satisfaction (SA)SA1Based on my experience, I am very satisfied overall.[8,56]
SA2My riding experiences in this URT line have been always very rewarding.[56]
SA3The service disparity between the current URT service and my ideal URT service is quite small.[8]
SA4I am satisfied with service of this URT line compared with other URT lines.[57]
Note. [56] Servera-Francés and Piqueras-Tomás, 2019; [11] Zhu et al., 2014; [38] Pérez and Bosque, 2015; [57] Yuen et al., 2017; [59] Sweeney and Soutar, 2001; [58] Howat and Assaker, 2013; [8] Zhang et al., 2019.
Table 2. Results of the pilot study reliability and validity tests.
Latent VariableNumber of ItemsCronbach’s αKMOx2d.f.Sig.
Perceived SR effort (PSR)50.9350.9392857.3491360.000
Perceived Quality (PQ)40.877
Perceived Value (PV)40.840
User Satisfaction (SA)40.930
Table 3. Respondents’ demographics.
ProfileCategoryFrequency (%)
BeijingDalianHuhehotAll
GenderMale103 (51.8%)78 (48.4%)36 (47.4%)217 (49.8%)
Female96 (48.2%)83 (51.6%)40 (52.6%)219 (50.2%)
Age≤188 (4.0%)7 (4.3%)1 (1.3%)16 (3.7%)
18–2576 (38.2%)45 (28.0%)46 (60.5%)167 (38.3%)
26–3546 (23.1%)46 28.6%)21 (27.6%)113 (25.9%)
36–4448 (24.1%)41 (25.5%)6 (7.9%)95 (21.8%)
45–6017 (8.5%)18 (11.2%)2 (2.6%)37 (8.5%)
≥604 (2.0%)4 (2.5%)0 (0.0%)8 (1.8%)
Education Level≤Junior High School10 (5.0%)15 (9.3%)0 (0.0%)25 (5.7%)
Senior High School7 (3.5%)9 (5.6%)2 (2.6%)18 (4.1%)
Junior College21 (10.6%)11 (6.8%)67 (88.2%)99 (22.7%)
Undergraduate67 (33.7%)90 (55.9%)5 (6.6%)162 (37.2%)
≥Graduate94 (47.2%)36 (22.4%)2 (2.6%)132 (30.3%)
Employment statusCompany employees82 (41.2%)57 (35.4%)13 (17.1%)152 (34.9%)
Students78 (39.2%)58 (36.0%)61 (80.3%)197 (45.2%)
Others39 (19.6%)46 (28.6%)2 (2.6%)87 (19.9%)
FrequencyEvery day30 (15.1%)20 (12.4%)4 (5.3%)54 (12.4%)
2~3 times a week41 (20.6%)24 (14.9%)9 (11.8%)74 (17.0%)
Once a week59 (29.6%)45 (28.0%)28 (36.8%)132 (30.3%)
Once a month43 (21.6%)27 (16.8%)16 (21.1%)86 (19.7%)
Occasional26 (13.1%)45 (28.0%)19 (25.0)90 (20.6%)
Table 4. Standard regression weights.
PathsEstimatePathsEstimatePathsEstimatePathsEstimate
PSR1←PSR0.902 ***PQ1←PQ0.810 ***PV1←PV0.824 ***SA1←SA0.906 ***
PSR2←PSR0.875 ***PQ2←PQ0.809 ***PV2←PV0.931 ***SA2←SA0.882 ***
PSR3←PSR0.871 ***PQ3←PQ0.828 ***PV3←PV0.905 ***SA3←SA0.894 ***
PSR4←PSR0.897 ***PQ4←PQ0.789 ***PV4←PV0.565 ***SA4←SA0.898 ***
PSR5←PSR0.904 ***AVE = 0.65, CR = 0.88AVE = 0.67, CR = 0.89AVE = 0.80, CR = 0.94
AVE = 0.79, CR = 0.95
Note: *** p < 0.001.
Table 5. Confirmatory factor analysis results of mediation model (N = 436).
StatisticRecommended ValueSingle Mediation Model (PQ)Single Mediation Model (PV) Serial Multiple Mediation Model
Chi-square/d.f.<3.02.7503.2052.669
RMR<0.080.0130.0410.029
RMSEA<0.080.0630.0710.062
GFI>0.900.9430.9350.926
AGFI>0.900.9170.9060.901
CFI>0.900.9810.9760.974
NFI>0.900.9710.9660.959
TLI>0.900.9760.9700.969
Table 6. Descriptive statistics and Pearson correlation coefficients.
Construct MeanS.D.KurtosisSkewness1234
PSRPSR14.340.714−0.130−0.7541
PSR24.320.7400.921−0.923
PSR34.280.7840.461−0.905
PSR44.290.757−0.273−0.728
PSR54.370.690−0.311−0.714
PQPQ14.360.7490.966−1.0160.764 **1
PQ24.240.8201.223−1.039
PQ34.230.8380.986−1.046
PQ44.380.7251.557−1.159
PVPV14.030.9810.168−0.8180.666 **0.622 **1
PV24.170.8940.593−0.942
PV34.120.8960.311−0.843
PV44.360.8021.403−1.240
SASA14.260.730−0.126−0.6580.850 **0.770 **0.743 **1
SA24.160.8441.083−0.997
SA34.230.7540.168−0.697
SA44.260.7370.155−0.699
Notes: N = 436, ** p < 0.01.
Table 7. Demographic differences in the perceived SR effort, perceived quality, perceived value, and user satisfaction.
ProfileCategoryPerceived SR EffortPerceived QualityPerceived ValueUser Satisfaction
MeanpMeanpMeanpMeanp
CityFirst-tier cities4.170.000 ***4.180.000 ***3.980.000 ***4.060.000 ***
Other4.444.404.324.37
GenderMale4.330.8104.300.8854.240.0784.250.549
Female4.314.304.104.21
Age≤254.310.8464.300.8144.290.008 **4.240.509
≥264.324.304.094.22
Educational Level≤Senior high school4.310.7684.240.5174.040.1874.220.845
≥Junior college4.324.314.184.23
Employment StatusCompany employees4.290.5804.240.2123.990.000 ***4.130.102
Students4.314.334.294.26
Frequency≥1 time weekly4.300.5054.280.2254.180.8134.200.221
<1 time weekly4.354.344.164.27
Notes: N = 436, ** p < 0.01, *** p < 0.001.
Table 8. Bootstrapping-based analyses of the indirect effect of perceived SR effort on user satisfaction.
Point EstimateProduct of CoefficientsBootstrappingTwo-Tailed Significance
Percentile (95%)BC Percentile (95%)
SEZLowerUpperLowerUpper
PSR-PQ-PV-SA0.0620.0242.580.0210.1140.0220.1170.001 (**)
PSR-PQ-SA0.2100.0752.800.0820.3760.0760.3660.001 (**)
PSR-PV-SA0.1160.0274.300.0620.1660.0680.1740.000 (***)
Note. BC: Bias-corrected, 5000 bootstrap samples. ** p < 0.01, *** p < 0.001.
Publisher’s Note: MDPI stays neutral with regard to jurisdictional claims in published maps and institutional affiliations.

