Article

Financialization, Government Subsidies, and Manufacturing R&D Investment: Evidence from Listed Companies in China

1
School of Economics and Management, Beijing Forestry University, Beijing 100083, China
2
Business School, Hunan Institute of Technology, Hengyang 421000, China
*
Author to whom correspondence should be addressed.
Sustainability 2021, 13(22), 12633; https://doi.org/10.3390/su132212633
Submission received: 3 October 2021 / Revised: 30 October 2021 / Accepted: 6 November 2021 / Published: 16 November 2021
(This article belongs to the Collection New Trends in Corporate Finance for Sustainability)

Abstract

:
Increasing research and development (R&D) investment is the key to the sustainable development of the manufacturing industry. With the development of financialization, manufacturing enterprises allocate greater funds to the financial field, which may significantly affect their level of R&D investment. However, few studies have explored the relationship between the two. Using the data of manufacturing listed companies in China from 2007 to 2018, this paper investigates the impact of financialization on manufacturing R&D investment and further analyzes the moderating effect of government subsidies on the relationship between the two, mainly using Heckman’s two-step approach. The results show that, on the whole, financialization has a significant restraining effect on China’s manufacturing R&D investment, and that government subsidies exacerbate this negative effect. However, there are some differences in the statistical significance and in the level of influence of financialization on R&D investment, which are based on enterprise type, industry, region, and financing constraints. Additionally, the moderating effects of government subsidies under heterogeneous samples differ in sign, statistical significance, and impact magnitude. This paper not only conducts a comprehensive study on the impact of financialization on manufacturing R&D investment but also introduces government subsidies as the moderating variable into the analysis, which is conducive to a better understanding of the relationship between corporate financialization and manufacturing R&D investment in China.

1. Introduction

The manufacturing industry is one of the most important elements of the economy and is crucial to creating sustainable economic growth [1,2]. In recent years, especially since the 2008 global financial crisis, both developed and developing countries have attached great importance to the development of the manufacturing industry. The manufacturing industry in emerging markets has been facing more challenges, such as sustainability, due to changes in the landscape of global manufacturing [3]. As the world’s largest manufacturing country, China’s manufacturing industry has experienced rapid development since the reform and opening up in 1978. However, the rapid growth of China’s manufacturing industry relies on factor inputs. In order to achieve the sustainable development of the manufacturing industry, China must accelerate its transition from an extensive factor-driven model to an innovation-driven model [4,5]. Research and development (R&D) investment facilitates technological innovation and is widely regarded as a key factor for manufacturing enterprises to obtain a competitive advantage [3,6]. In this sense, it is important to identify the essential driving forces of manufacturing R&D investment in China.
The financialization of manufacturing enterprises has become a non-negligible factor in explaining firms’ R&D investment. Given the acceleration of economic financialization all over the world as well as the widening gap in profitability between the finance sector and the non-finance sector [7,8,9,10,11], manufacturing enterprises are progressively inclined to the process or trend of financial investment, and their business activities are more and more controlled by financial investment. This phenomenon is defined as manufacturing financialization [12]. Theoretically, financialization brings both a reservoir effect and a crowding-out effect to the R&D investment of enterprises. On the one hand, the financialization of industrial capital is essentially a mode of short-term investment behavior, and the increase of short-term investment returns will enhance the financing efficiency and ability of enterprises [13,14]. Therefore, some scholars have suggested that the rational use of financial tools and the effective allocation of financial capital to promote corporate technological innovation are key to achieving innovation-driven development [15], resulting in a reservoir effect. On the other hand, as some macro studies have shown, excessive financialization will have a negative effect on economic and social development [16]. Similarly, excessive financial investments will crowd out operational business investments and reduce the available production capital of the manufacturing industry, negatively impacting corporate R&D investment.
To date, a great deal of the literature has focused on the economic consequences of corporate financialization from perspectives such as industrial investment, profitability, and productivity [5,17,18,19,20,21,22,23,24,25,26,27,28]. However, there are few studies on the impacts of financialization on manufacturing’s R&D input (Considering literature on the effect of corporate financialization on R&D investment is rare, and our work is related to the literature that studies the impact of financialization on a firm’s physical investment in general, we also review the relevant literature). Furthermore a consensus has not been reached regarding the relationship between corporate financialization and R&D investment or physical investment. Most empirical studies show that financialization has constituted the main physical investment of non-financial corporations [17,18,23,24,25,26], and Seo et al. [6], Su and Liu [29], Xu and Xuan [28] confirm a negative relationship between corporate financialization and R&D investment. A fraction of studies contend that corporate financialization does not have a negative influence on the fixed investment of non-financial corporations (NFCs) [20,21], and it even imparts a significant promotion impact [22]. In addition, some scholars believe that there is a threshold effect in the impact of financialization on corporate R&D investment. Pan and Wang find that there exists a reasonable fluctuation range in financialization levels, and the crowding-out effect of financialization has the least significant impact on innovation investment [30]. The research of Li et al. [31] shows that within different ranges, financialization has different effects on the R&D innovation of non-financial enterprises measured by the proportion of net intangible assets in total assets.
In order to develop our understanding of the relationship between corporate financialization and R&D investment, this paper argues that further analysis can be conducted regarding the following aspects. Firstly, in terms of econometric techniques, several studies such as Seo et al. [6] employ methods such as ordinary least squares (OLS) and the GMM technique to investigate the impact of financialization on R&D investment, by excluding the enterprises that provided no data on R&D investment. However, since the value of the R&D investment of these firms are not randomly missed, a sample selection issue will present itself, leading to inconsistent estimations [32]. It is necessary to employ Heckman’s procedure to resolve the potential sample selection bias inherent in data [33]. Second, in the research on the determinants of corporate R&D investment, especially for countries such as China that are transforming from a planned economy to a market economy, government subsidies are an important factor that has attracted academic interest. A government subsidy is a form of financial support provided by the government to encourage the development of an industry or enterprise. Its intention is to reduce the costs and risks of R&D investment and to motivate enterprises to increase innovation investment. However, with the increasing financialization of manufacturing enterprises, government subsidies may also aggravate the crowding-out effect of financialization on corporate R&D investment. Therefore, government subsidies should also play an essential moderating role in the relationship between financialization and R&D investment, although the literature concerning this remains scarce. Finally, due to the heterogeneity of financing constraints and the development environments the enterprises face, the crowding-out effect or the reservoir effect may vary. Therefore, the relationship between financialization and corporate R&D investment under heterogeneous samples and the moderating role of government subsidies deserves further attention.
Based on the data of A-share listed manufacturing companies in China from 2007 to 2018, this paper seeks to examine the effects of corporate financialization on R&D investment as well as the role of government subsidies in moderating the financialization–R&D investment relationship and conducts a heterogeneity analysis for different samples. The main contributions of this paper are as follows, (1) By investigating the moderating role of government subsidies in the impact of financialization on the R&D investment of manufacturing enterprises, this paper brings financialization, R&D investment, and government subsidies into a unified framework for research, which can help to further understand the relationship between corporate financialization and R&D investment from a new perspective. (2) Heckman’s two-step approach is employed in this paper to correct the possible sample selection bias, which can measure the impact of corporate financialization on R&D investment more effectively. Simultaneously, it provides the results of both the impact of financialization on the propensity and intensity of R&D investment of manufacturing enterprises in detail. (3) This paper verifies whether the impacts between corporate financialization on R&D investment and the moderating effect of government subsidies have varying relationships for ownership type, industry, region, and financing constraints differences. After doing so, the relationship between financialization and the R&D investment of China’s manufacturing enterprises can be fully identified.
The results of this paper show that in general, financialization has a significant negative impact on the R&D investment of China’s manufacturing enterprises. Additionally, government subsidies play a significant and negative moderating role in the relationship between financialization and corporate R&D investment; that is, government subsidies amplify the negative impacts of corporate financialization on R&D investment. Finally, no matter the impact of financialization on the R&D investment of China’s manufacturing enterprises or the moderating effect of government subsidies, they all show some heterogeneity in different sub-samples.
The remainder of this paper is structured as follows. The second section puts forward research hypotheses. The third section presents the research design of this paper, including an introduction of the model specification, relevant data, variable measurements, etc. The fourth section elaborates on an empirical analysis regarding the impact of corporate financialization on manufacturing R&D investment. The fifth section analyzes the role of government subsidies in moderating the financialization–R&D investment relationship. The sixth section provides the conclusion.

2. Research Hypothesis

2.1. Financialization and the R&D Investment of Manufacturing Enterprises

Corporate financialization is a double-edged sword. The effect of financialization on R&D investment can be generally classified as either types of reservoir effects or crowding-out effects.
Innovation has the characteristics of large capital demand, long investment cycle, and high investment risk [34,35], and these characteristics cause the phenomenon of “financing difficulty” in the process of corporate innovation activities. Since financial assets have the features of strong liquidity, low adjustment cost, and high return on investment, enterprises will invest their capital in the financial field for precautionary savings and to maintain a capital reserve. When enterprises are faced with insufficient funds, they can improve their situations via returns from investments in financial assets. The allocation of financial assets by real enterprises plays a vital replenishment role in managing cash flow risks and relieving the pressure of external financing constraints [36,37], thus alleviating the problem of insufficient R&D investment caused by financing constraints [13,14], that is, by which point the reservoir effect becomes evident.
However, with the development of financialization, financial capital is no longer attached to industrial capital, and the financial industry has formed a relatively independent process of “money begetting money”. Meanwhile, the major profits accrued by businesses through enterprises gradually declines, stimulating their preference for financial investment. Because financial assets can achieve excess returns, and the capital of enterprises is limited, for arbitrage motivation, enterprises increase financial investment in pursuit of short-term profits, using the capital originally allotted for R&D investment. Besides, excessive financialization will cause asset bubbles, and the short-sighted behavior of enterprises means that they ignore the long-term development momentum afforded through innovation. When the arbitrage motivation is greater than that of preventive savings, even if enterprises obtain returns from the investment in financial assets, which provide them enough funds to invest in the R&D, they will still overlook long-term innovation projects and opt for the reinvestment of financial assets, thus forming a cycle of “financial speculation-obtaining returns-reinvestment in financial assets”. These facts have caused the crowding-out effect on the R&D investment. Some scholars have proved the crowding-out effect of financialization on corporate R&D investment or fixed assets investment. Utilizing the data of Korean NFCs from 1994 to 2009, Seo et al. [6] found that corporate financialization will lead to the crowd out effect in the R&D investment of NFCs.
In recent years, China’s economy has increasingly shown a development trend from the real to the virtual [38,39], and the rate of financialization of non-financial listed companies has increased significantly [25]. At the same time, the manufacturing industry is facing problems such as overcapacity, a low proportion of high-tech manufacturing industry, and has remained at the middle and low-end of the global value chain division for a long period. There is a structural imbalance between the real and virtual economy [40]. The arbitrage motive of non-financial enterprises is apparent. In this context, we believe the crowding-out effect, as a result of financialization, will have a greater impact than the reservoir effect, and that financialization has an overall negative impact on the R&D investment of manufacturing enterprises. Based on the above analysis, this paper proposes the following hypothesis:
H1: 
Financialization has a negative impact on the R&D investment of manufacturing enterprises.
The above hypothesis is discussed by considering the overall impact of financialization on the R&D input of manufacturing enterprises, without discussing the impact under sample differences. Considering the actual conditions, by which different types of enterprises have specific differences in financing conditions, their development environment, and in their motivation to invest in financial assets, there may be certain differences in the impact of corporate financialization on R&D investment. Specifically, from the perspective of different types of enterprise ownership, although private enterprises are an important engine of China’s economic growth, they are often discriminated against when seeking external funds [41]. Compared with private enterprises, state-owned enterprises (SOEs) are provided more subsidies and tax relief from the government [33]. Because SOEs face relatively less capital pressure in production and operation, and display principal-agent behavior, enterprise operators tend to have “short-sighted” behavior, focusing on short-term operating performance, and therefore have stronger financial arbitrage motivation [5]. This paper expects that the negative impact of financialization on the R&D investment of SOEs is more prominent. Compared with enterprises in non-high-tech industries, high-tech enterprises can often obtain more financial support from the government and the favor of investors. At the same time, because high-tech products and processes often have higher innovation returns, their innovation performance is more significant [42]. Therefore, although financial investment can bring a relatively high return for high-tech enterprises, their R&D activities in the high-tech field can also be expected to achieve high innovation returns. In this context, companies in high-tech industries have relatively weaker incentives to perform financial arbitrage activities, and the crowding-out effect of financialization on their R&D investment will be less evident. From a regional perspective, compared with the central and western regions, the eastern region has a relatively high level of financial market development and rich financial investment channels [5]. As a result, enterprises in eastern China are more willing to make financial investments, and the degree of financialization is higher, thus the negative impact of financialization on the R&D investment will be more prominent. There are apparent differences in external financing conditions faced by both producers and operators of enterprises with different financing constraints. For enterprises with a high degree of financing constraints, the difficulties in production and operation are more prominent. In order to consider cash flow, enterprises are more likely to consider short-term financial investments so as to obtain high returns. In the case of limited corporate capital, the crowding-out effect will be more pronounced for the financialization of corporate R&D investment. To summarise, financialization is expected to confer heterogeneous impacts of R&D investment for different types of enterprises based on ownership, industry, location, and the levels of financing constraints. Therefore, the second hypothesis of this paper is proposed in view of enterprise heterogeneity.
H2: 
Under the difference of enterprise types, financialization has a heterogeneous effect on the R&D investment of manufacturing enterprises.

2.2. The Moderating Role of Government Subsidies in the Relationship between Financialization and Corporate R&D Investment

Theoretically, government subsidies can perform both a positive and negative moderating effect in the financialization–R&D investment relationship. When enterprises face strong financing constraints, government subsidies assist enterprises in alleviating the pressure of financing constraints and to solve the problem of insufficient funds. In addition, the information asymmetry between entrepreneurs and investors may cause adverse selection, which is the main source of financing constraints. This is generally attributed to the fact that the credit value of an enterprise is always difficult to evaluate, and investors are highly unlikely to invest without such guarantees. In contrast, the government always subsidizes projects with high investment values, which provides a positive indication for other investors and weakens the information asymmetry to a certain extent [43]. This is conducive to the alleviation of financing difficulties for enterprises. Therefore, government subsidies will allow enterprises to obtain additional capital to invest in financial assets, imparting a reservoir effect to R&D investment. However, according to the study of Mansfield et al. [44], around 60% of patents will be imitated within four years. Meanwhile, China’s intellectual property protection system is not complete, which will makes it difficult for enterprises to obtain high returns brought by R&D activities. Additionally, the ex-post fund supervision mechanism requires improvement once enterprises have received government subsidies as there is a huge gap between the profitability of China’s manufacturing sector and that of the financial sector. Against this background, many short-sighted enterprises will be inclined to invest a majority of their government subsidies in financial assets rather than in long-cycle innovation projects, so as to obtain returns in the short term due to arbitrage motivation [45]. Therefore, we expect that government subsidies will further enforce the crowding-out effect of financialization on corporate R&D investment. Based on the above analysis, the following hypothesis is put forward.
H3: 
Government subsidies will deepen the inhibitory effect of financialization on the R&D investment of manufacturing enterprises.
Similarly, considering that different types of enterprises have different characteristics and face different economic environments, we expect that, under the differences of enterprise ownership type, industry, location, and financing constraints, the moderating role of government subsidies in the relationship between financialization and the R&D investment of manufacturing enterprises is also different. Based on this, the following hypothesis is proposed.
H4: 
There are differences in the moderating effect of government subsidies on the relationship between financialization and the R&D investment of manufacturing enterprises under different types of enterprises.

3. Research Design

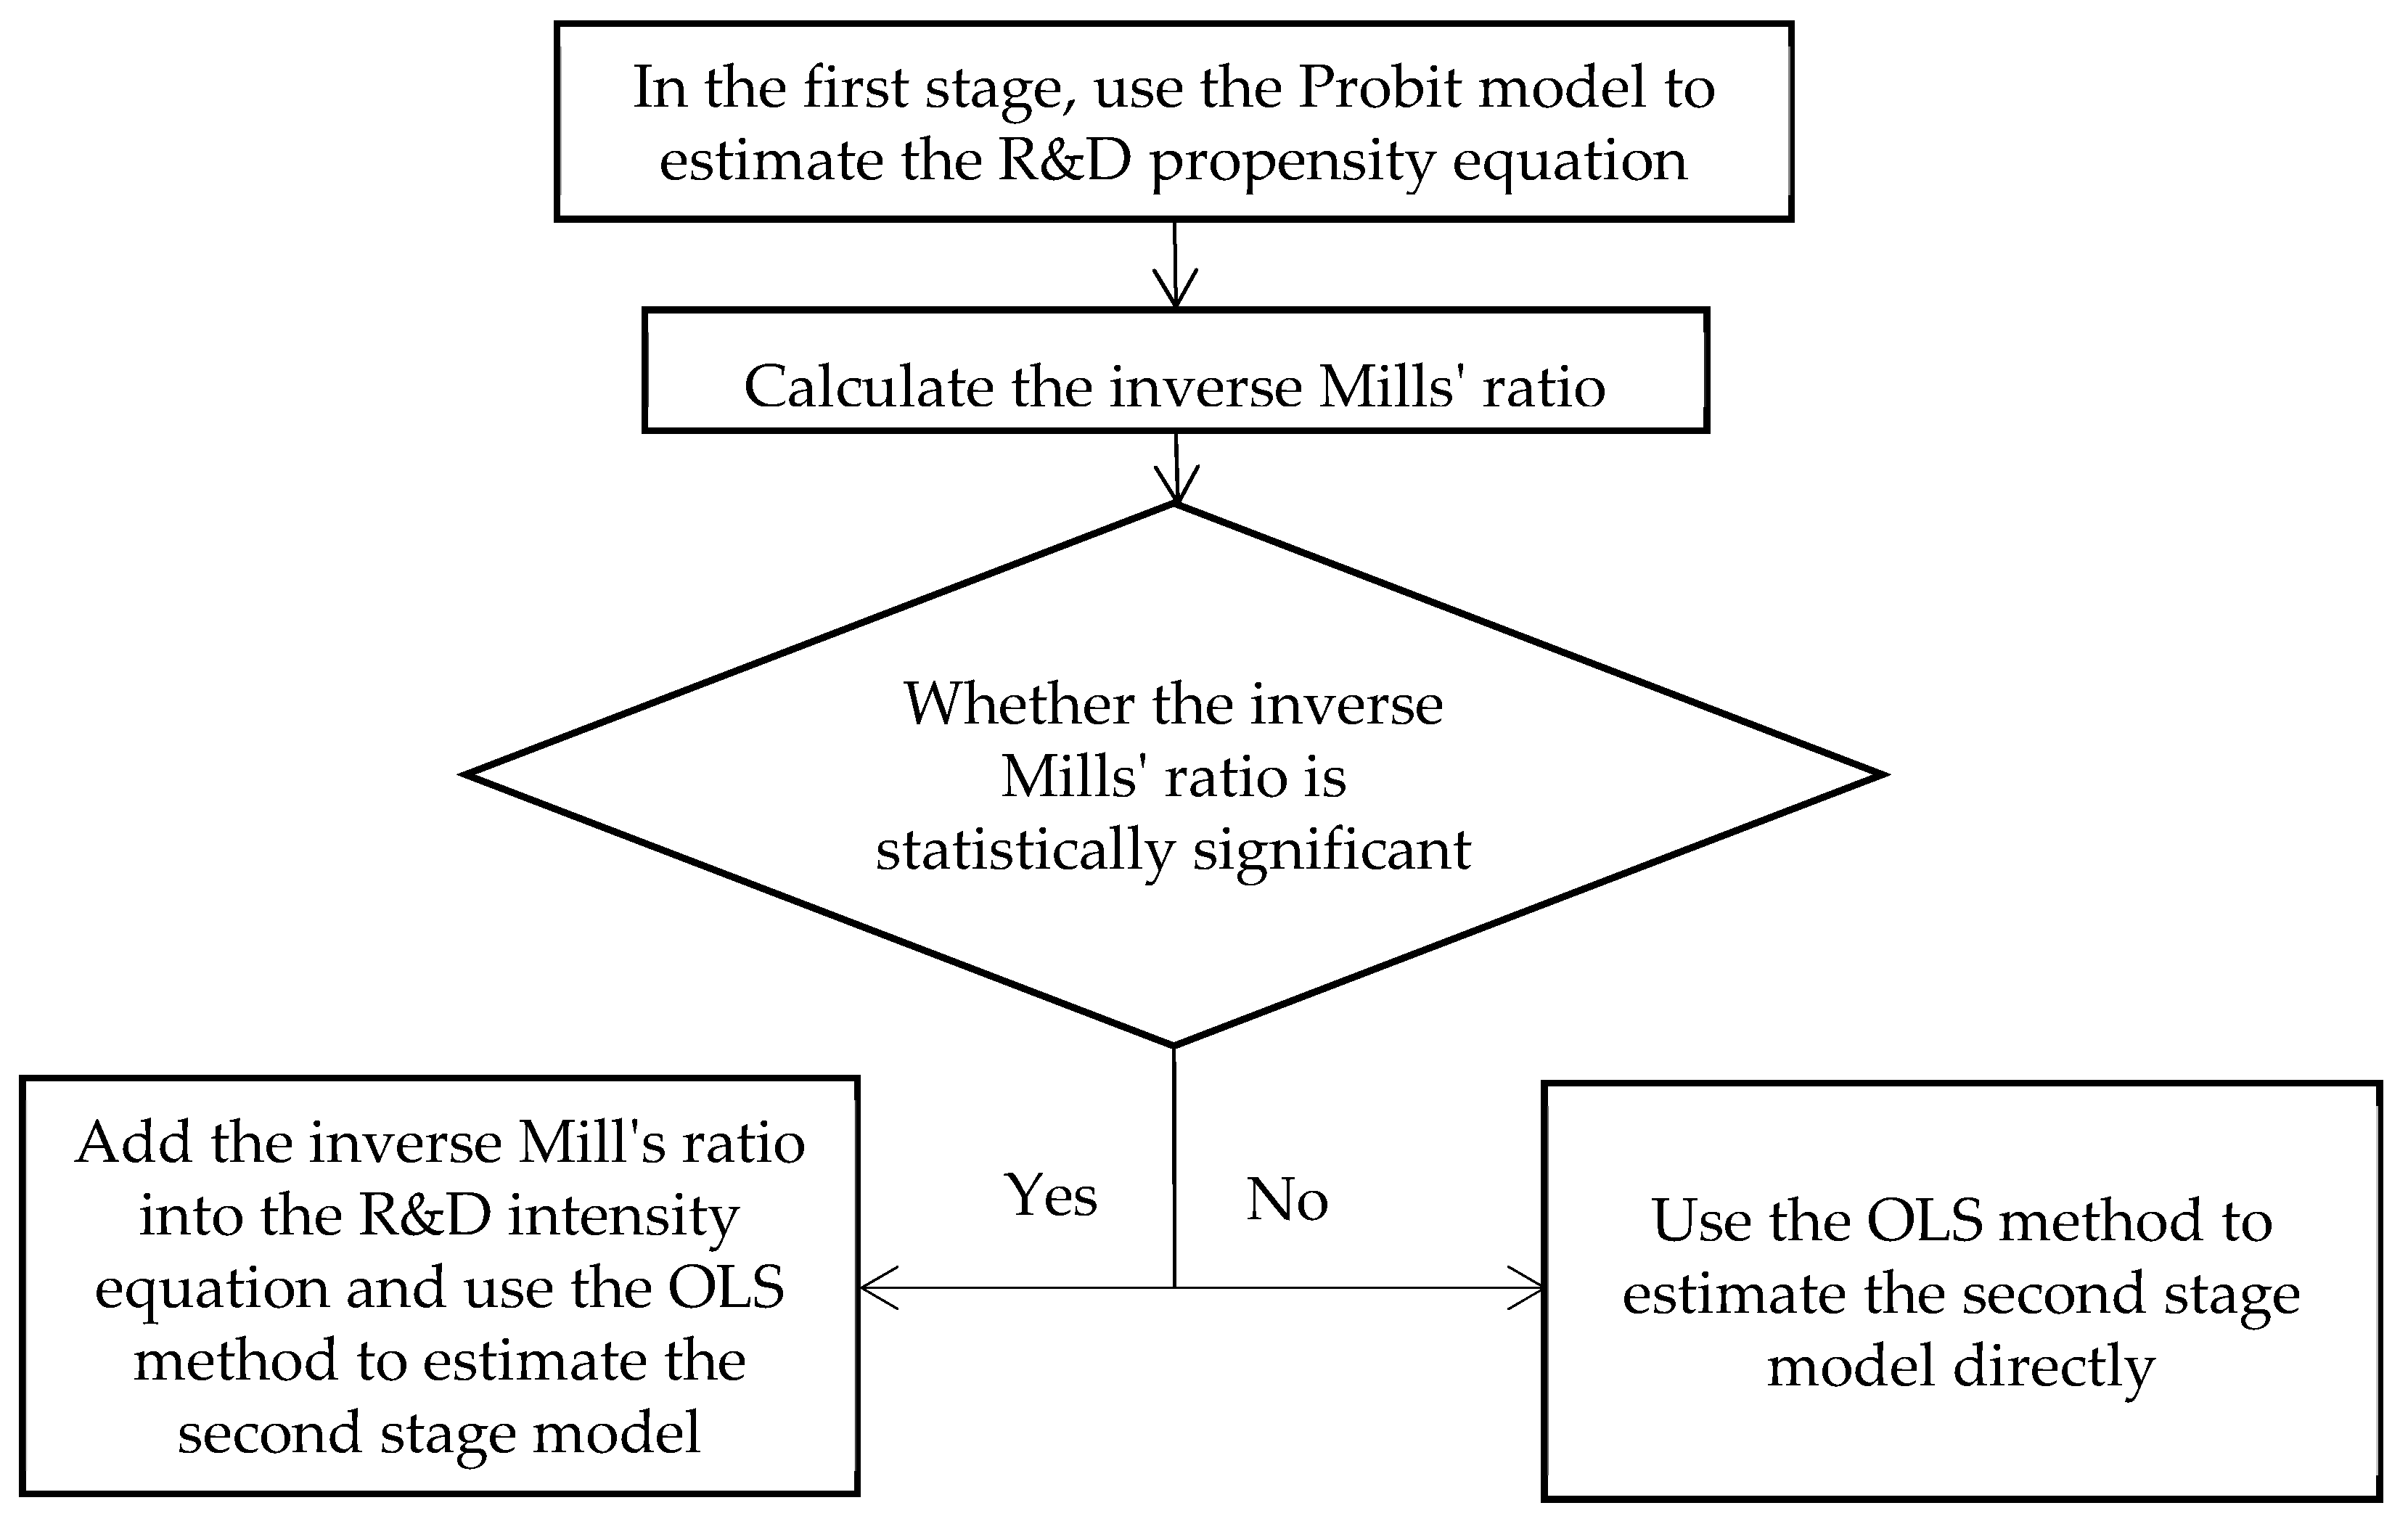
3.1. Model Specification

As discussed above, in the case of the sample selection issues, using the OLS method to capture the impact of financialization on the R&D investment of manufacturing enterprises will lead to inconsistent results, and the Heckman’s two-step approach will be used to help correct the sample selection bias. Additionally, since not all enterprises have R&D investments, the Heckman model can also be used to investigate the impact of financialization on both the propensity towards R&D and the R&D investment intensity of manufacturing enterprises to obtain more detailed results. In this regard, this paper uses the Heckman’s two-step approach to investigate the impact of financialization on the R&D investment of manufacturing enterprises. The overall flow chart of the scheme of methods used and the orders in which the steps were performed are shown in Figure 1.
The steps of Heckman’s two-step approach, as used in this paper, are as follows:
Firstly, based the overall observations, this paper uses the Probit model shown in Equation (1) to investigate the impact of financialization on the propensity to invest in R&D of manufacturing enterprises:
P ( r d i t = 1 ) = α 0 + α 1 F i n i , t - 1 + α 2 G o v i , t - 1 + α 3 C r e d i t i t + α 4 S i z e i t + α 5 A g e i t + α 6 P r o i t + α 7 S t r i t + α 8 C a p i t + α 9 C a s h i t + α 10 Y e a r i t + α 11 I n d u s t r y i t + α 12 T y p e i t + α 13 T e c h n i q u e i t + α 14 D i s t r i c t i t + v i t
where rdit is a dummy variable indicating whether firm i has invested in R&D in year t; the core explanatory variable Fin represents the level of corporate financialization, and the moderating variable Gov represents the level of government subsidies. Considering that financialization and government subsidies may have a time-lagged effect on the propensity for corporate R&D investment, in order to rectify the potential endogenous problem, the 1-year-lagged values of Fin and Gov are introduced into the model. This paper also considers the following control variables: dummy variable representing financing constraint (Credit), enterprise size (Size), enterprise age (Age), profitability (Pro), capital structure (Str), capital intensity (Cap), cash flow (Cash), dummy variable representing the year (Year), dummy variable representing the industry of the enterprise (Industry), dummy variable representing state-owned enterprise (Type), dummy variable representing high-tech enterprise (Technique), and regional dummy variable representing the eastern region (District); vit is a random error term that corresponds with a normal distribution with a mean of 0.
Secondly, by estimating Equation (1), the probability of an enterprise engaging in R&D investment can be predicted, and the inverse Mills’ ratio λ can be calculated using the following formula:
λ i t = φ ( X i t α ^ / σ ) ϕ ( X i t α ^ / σ )
where Xi1 is the set of all explanatory variables in the first stage model, and α ^ is the estimation coefficient vector of Xi1 for the Probit model in Equation (1); σ is the standard deviation of the error term v ^ i t ; φ ( X i t α ^ / σ ) and ϕ ( X i t α ^ / σ ) represent the density function of standard normal distribution and the probability distribution function of standard normal distribution, respectively.
Next, this paper takes the R&D investment intensity as the dependent variable and adds the inverse Mills’ ratio λ estimated in the first stage of the model as the independent variable. Based on the sample enterprises for which R&D expenditures are larger than 0, the second stage of the Heckman model shown in Equation (3) is estimated to investigate the impact of financialization on the R&D investment level of the listed manufacturing companies:
R & D it = β 0 + β 1 F i n i , t 1 + β 2 G o v i , t 1 + β 3 S A i t + β 4 S i z e i t + β 5 A g e i t + β 6 P r o i t + β 7 S t r i t + β 8 C a p i t + β 9 C a s h i t + β 10 Y e a r i t + β 11 I n d u s t r y i t + β 12 T y p e i t + β 13 T e c h n i q u e i t + β 14 D i s t r i c t i t + η λ i t + μ i t
In Equation (3), the explained variable of R&D represents the R&D investment intensity. In terms of control variables, it should be noted that the control variables we set in Equations (1) and (3) are different. Specifically, in Equation (1), the financing constraint Credit is a dummy variable, while in Equation (3), it is reflected in the form of a continuous variable of the SA index. This is because if the sets of explanatory variables used in the two equations are identical, λ may be highly related to the explanatory variable set Xi2 in the second-stage equation, resulting in the problem of multi-collinearity.
In addition, it is also worth mentioning that if λ in Equation (3) is significantly different from 0, it indicates a sample selection bias in the model, and a consistent estimation can be obtained using the Heckman selection model. However, if it is not significantly different from 0, it indicates the absence of a sample selection bias meaning the use of the OLS estimator is reasonable. At this time, the OLS method can be used to investigate the impact of financialization on the R&D investment intensity of enterprises by estimating Equation (3). According to the above discussion, financialization brings both a reservoir effect and crowding-out effect respectively to the R&D investment of enterprises. Some scholars believe that a moderate level of financialization is more conducive to improving corporate R&D investment. In this study, Fin2 (i.e., the quadratic term of Fin) is introduced in both stages of the Heckman model to investigate the potential non-linear impact of finalization on the R&D investment of manufacturing enterprises. The specific models are set as follows:
P ( r d i t = 1 ) = α 0 + α 1 F i n i , t 1 + α 2 F i n 2 i , t 1 + α 3 G o v i , t - 1 + α 4 C r e d i t i t + α 5 S i z e i t + α 6 A g e i t + α 7 P r o i t + α 8 S t r i t + α 9 C a p i t + α 10 C a s h i t + α 11 Y e a r i t + α 12 I n d u s t r y i t + α 13 T y p e i t + α 14 T e c h n i q u e i t + α 15 D i s t r i c t i t + v i t
R & D it = β 0 + β 1 F i n i , t 1 + β 2 F i n 2 i , t 1 + β 3 G o v i , t 1 + β 4 S A i t + β 5 S i z e i t + β 6 A g e i t + β 7 P r o i t + β 8 S t r i t + β 9 C a p i t + β 10 C a s h i t + β 11 Y e a r i t + β 12 I n d u s t r y i t + β 13 T y p e i t + β 14 T e c h n i q u e i t + β 15 D i s t r i c t i t + η λ i t + μ i t
In order to verify the moderating effect of government subsidies on the relationship between financialization and the R&D investment of manufacturing enterprises, this paper further introduces Fin × Gov, the interaction term of financialization and government subsidies into the econometric models, and the following empirical models are constructed:
P ( r d i t = 1 ) = α 0 + α 1 F i n i , t 1 + α 2 G o v i , t - 1 + α 3 F i n i , t 1 × G o v i , t 1 + α 4 C r e d i t i t + α 5 Size it + α 6 A g e i t + α 7 P r o i t + α 8 S t r i t + α 9 C a p i t + α 10 C a s h i t + α 11 Y e a r i t + α 12 I n d u s t r y i t + α 13 T y p e i t + α 14 T e c h n i q u e i t + α 15 D i s t r i c t i t + v i t
R & D it = β 0 + β 1 F i n i , t 1 + β 2 G o v i , t 1 + β 3 F in i , t 1 × G o v i , t 1 + β 4 S A i t + β 5 Size it + β 6 A g e i t + β 7 P r o i t + β 8 S t r i t + β 9 C a p i t + β 10 C a s h i t + β 11 Y e a r i t + β 12 I n d u s t r y i t + β 13 T y p e i t + β 14 T e c h n i q u e i t + β 15 D i s t r i c t i t + η λ i t + μ i t

3.2. Data

Due to the introduction of new accounting standards in 2007, China Securities Regulatory Commission began to require listed companies to publicly disclose R&D data and to use the fair value method to measure their financial assets. Therefore, this paper selects China’s Shanghai-Shenzhen A-share manufacturing listed companies from 2007 to 2018 for research purposes. In order to ensure the reliability of the empirical analysis results, this paper refers to Orhangazi [17], Demir [18], Tori and Onaran [23] to screen the sample as follows. (1) Samples with missing data, obvious errors, and singular values are eliminated. (2) For the accuracy of financial data, ST and PT companies are excluded. (3) Abnormal samples such as negative owners’ equity or an asset-liability ratio greater than 1 are excluded. In order to reduce the interference of extreme values on the regression results, we winsorize the continuous variables, besides the enterprise age, at 1% and 99%. After screening and manual sorting, 11,416 sample observations are obtained. The data of financial assets and detailed items are obtained from the CSMAR database; data of long-term equity investment, investment income, financial expenses, and other current assets are acquired from the notes of the listed companies, and some missing data are obtained via manually collecting and sorting the annual financial reports that are publicly disclosed by the listed companies disclosure; government subsidy data has been found from the Wind database, and the R&D investment data are from the Flush database.

3.3. Variable Definition

  • Explained variable
The explained variable in this paper is the corporate R&D investment level (R&D). Referring to Hall [46], Piga and Atzeni [47], and Czarnitzki et al. [48], the R&D investment intensity is measured by the ratio of the R&D expenditure to the main business income of the enterprise.
2.
Core explanatory variable and moderating variable
The core explanatory variable is the corporate financialization level (Fin). Following Orhangazi [17] and Demir [18], this paper measures the financialization level of an enterprise based on the proportion of its non-monetary financial assets to its total assets, which can more intuitively reflect its financialization operation. The financial assets in the balance sheet of listed companies mainly include net loans and advances, net trading financial assets, net short-term investment, net financial assets available for sale, net derivative financial investment, net held-to-maturity investment, net long-term equity investment, and net investment real estate. It is worth noting that the monetary funds and receivables held by enterprises also belong to financial assets, but their main purpose is to maintain the production and operation activities of the enterprise, and it is not easy for them to bring capital appreciation to enterprises. Through the principle of conservatism, this paper attributes monetary funds and receivables to the factor of business purposes, and they are therefore not included in the measurement range of the financial assets. In addition, according to Krippner [7] and Demir [18], the real estate industry and the traditional financial industry are classified within the pan-financial sector. From the perspective of China’s reality, with the prosperity of the real estate market, the price of real estate is affected by money supply, stock price, and interest rates. Investments in real estate have gradually become a specific financial asset and should be defined as such. Therefore, the specific calculation formula of financial assets is: total financial assets = net loans and advances + net trading financial assets + net financial assets available for sale + net derivative financial assets + net held-to-maturity investment + net long-term equity investment + net investment real estate
The moderating variable is the government subsidy intensity (Gov). According to the research of Link [49], Lach [50], and Czarnitzki et al. [48], it is generally measured by indicators such as government subsidy and tax incentives. Considering the availability of data, this paper follows the research of Wang [51] and uses the subject of “government subsidy” in the notes of the financial statements of the listed enterprises to characterize the scale of government subsidies. Accordingly, the intensity of a government subsidy is expressed as the ratio of government subsidy to the primary business income of enterprises.
3.
Control variables
In accordance with the literature review, the selection of main control variables in this study and their measurement will be introduced as follows.
Financing constraints. It is generally believed that R&D investment is more susceptible to financing constraints due to the large capital demand and uncertain returns. In this paper, enterprise financial indicators that are related to financing constraints are selected to measure the financing constraint index, after which the relative financing constraint degrees of enterprises are qualitatively divided. The idea of quantitative measuring financing constraints originates from the research of Kaplan and Zingales [52], who qualitatively classify the financing constraint levels of enterprises according to the financial status of limited samples and uses the rating results as the dependent variable of, regression with related enterprise characteristic variables to construct the financing constraint index. The financing constraint index is applied to the large sample to approximate the relative financing constraint degree of enterprises. Representative measures that reflect the relative financing constraint degree of enterprises include the KZ Index [53], the WW Index [54], and the SA Index [55]). However, considering that the KZ index and the WW index are mutually determined by variables such as cash flow and capital structure, the above indexes may have endogenous problems. Yasuda [56] believes that the size and the age of enterprises are important variables affecting enterprise financing constraints, and the exogenous variables constituting the SA index, such as size and age of enterprises, do not vary much over time. Therefore, the SA index is selected in this paper to quantitatively describe the degree of financing constraints.
S A = 0.737 × S i z e + 0.043 × S i z e 2 0.04 × A g e
Additionally, the dummy variable of Credit in the first stage equation is constructed by the median of the SA index. Specifically, if the SA index of an enterprise is greater than the median value, this indicates low financing constraints, and the value of Credit is 1; otherwise, it is 0.
Enterprise size. Enterprise size is an important factor influencing corporate R&D investment. Existing studies have two primary viewpoints on the relationship between them. One view is that enterprise size has a positive impact on R&D investment. This is because the level of investment in the early stage of R&D has an effect of scale economies. Relatively large enterprises have resource advantages and a basis for innovation, making them more inclined to invest in R&D, whereas small enterprises face financing constraints and limited risk-taking ability, so they do not have an inclination towards R&D investment [57,58]. Meanwhile, studies such as those of Ciftci and Cready [59], Villard [60], Braga and Willmore [61], and Cohen and Klepper [57] also reveal that the larger an enterprise is, the more likely it is to innovate. The other view is that small enterprises have greater flexibility in their internal operation mechanisms and a greater enthusiasm for R&D investment, so a negative correlation between enterprise size and R&D investment exists. In this paper, we use “total assets” as a proxy variable for the enterprise size.
Enterprise age. At present, there is no consensus on the influence of enterprise age on R&D investment. On the one hand, studies such as those of Rosenbloom and Christensen [62], Sorensen and Stuart [63] believe that enterprises with a longer operation time possess a more developed production process, and are able to monitor the latest technological achievements in real time, so they conduct more R&D activities and are more likely to invest in R&D. On the other hand, researchers such as Ranger [64] and Yasuda [56] hold that there is a negative correlation between enterprise age and R&D investment. The enterprises that have been operating for a longer period have insufficient vitality to adapt to innovation activities due to their outdated strategies, single business model, and reluctance to adapt to innovations. New enterprises that open the market are more willing to adopt advanced machine equipment as well as innovative and efficiently implement the management organization model, so their willingness to innovate is stronger. The enterprise age is assigned by the difference between the observation year and the year the enterprise was established.
Profitability. An enterprise’s profitability is an important capital guarantee for R&D activities [46]. The higher the profit level of an enterprise, the more funds available to purchase advanced equipment and introduce new technologies to engage in innovation activities. At the same time, enterprises with stronger profitability are more competitive in the market, which is more conducive to the development of corporate R&D activities. This paper uses the operating rate of return, which is the net profit divided by total operating income, to measure the profitability of enterprises.
Capital structure. The capital structure of an enterprise reflects its financial resource strength and operating status. The more debt an enterprise accrues, the higher the default risk is, the higher the financing constraint is, and the more limited its R&D investment is [65]. This paper adopts the asset-liability ratio of enterprises, that is, the ratio of total liabilities to total assets to measure the capital structure.
Capital intensity. Capital-intensive enterprises tend to adopt advanced technology and equipment and attract more highly skilled workers, so they are more likely to carry out R&D activities. This paper uses the ratio of net fixed assets to total assets to measure capital intensity.
Cash flow. Corporate R&D activities require abundant cash flow as the basis of investment. Cash flow is used to identify the internal financing channels of enterprise innovation. This paper uses the ratio of net cash flow from business activities to total assets to measure cash flow.
The specific variable definitions and explanations are shown in the Table 1 below.

3.4. Descriptive Statistics and Correlation Analysis

According to the descriptive statistics in Table 2, the average R&D investment intensity of China’s manufacturing listed enterprises is 3.32%, slightly higher than the median value (2.86%). It can be seen that a small number of enterprises have relatively high R&D investments. The mean value of government subsidies is 1.05%, which is around 3 times the median value, and the maximum value is 3.49%, indicating that large government subsidies are provided to some enterprises. The mean value of corporate financialization is 2.80%, and the median value is 0.58%. It can be seen that the financialization distribution is skewed to the right, and the financialization degree of sample enterprises is not overly prominent on the whole. However, there are great differences in the degree of financialization among different types of enterprises, and the maximum value of 74% indicates that a small number of non-financial listed companies in China have a relatively high degree of financialization.
As can be seen from the correlation coefficient matrix in Table 3, the coefficients of other variables are all below 0.6, except for the correlation coefficient between the SA index and enterprise size, indicating that a serious multi-collinearity problem does not exist. In addition, the correlation coefficient between financialization and the R&D investment of manufacturing enterprises is −0.0180, which is statistically significant at the significance level of 5%. Therefore, there is a significantly negative correlation between financialization and the R&D investment of manufacturing enterprises, which preliminarily confirms the inhibitory effect of financialization on R&D investment in Hypothesis 1. Further rigorous verification will be performed through the econometric analysis below.

4. Results and Analysis of the Impact of Financialization on Corporate R&D Investment

In this section, we will use the Heckman two-step approach to empirically examine the impact of financialization on the R&D investment of Chinese manufacturing companies and then further analyze its heterogeneous effect under different samples.

4.1. Results and Analysis of the Full Sample

Based on the full sample data of China’s A-share manufacturing listed companies, this paper uses the Heckman’s two-step approach to investigate the impact of corporate financialization on manufacturing R&D investment. This paper also presents the results with the OLS for comparison. As shown in Columns 2 and 3 of Table 4, at a significance level of 10%, financialization has a significantly negative impact on the R&D investment of manufacturing enterprises, whether for the full sample or only considering the samples for which the R&D investment is greater than 0. However, according to the results of Heckman’s two-stage procedure shown in Columns 4 and 5, the coefficient of the inverse Mills’ ratio (lambda) is 0.0495, which is statistically significant at the 1% level. This demonstrates the existence of a selectivity bias and reinforces the necessity of using the Heckman’s two-step approach.
According to the results of the first-stage Probit regression reported in Column 4 of Table 4, the coefficient of Fin is significantly negative at the significance level of 1%, indicating that financialization will reduce the probability of China’s manufacturing enterprises engaging in R&D investment. The results of the second-stage equation indicate that the effect of financialization on the R&D investment intensity of manufacturing enterprises is also significantly negative, further confirming that the extension of corporate financialization will inhibit China’s manufacturing R&D input. In addition, it is worth noting that the estimated coefficient of Fin is −0.057, for which the absolute value is significantly greater than that of the OLS estimator, reflecting that the OLS estimates may underestimate the inhibiting impact of financialization on the R&D investment intensity of manufacturing enterprises.
In order to investigate the possible non-linear effect of financialization on the R&D investment of manufacturing enterprises, Fin2, the square term of financialization, is incorporated in the econometric model. Since the estimated coefficient of an inverse Mills’ ratio is significantly negative at the 1% significance level, it is necessary to use Heckman’s two-step procedure to correct the sample selection bias. From the estimated results in Columns 6 and 7 of Table 4, it can be seen that the coefficients of Fin2 are not significant, no matter in the first-stage equation or the second-stage equation. This shows that a U-shaped or inverted U-shaped relationship between corporate financialization and the R&D investment does not exist. Therefore, financialization exerts a negatively linear impact on China’s manufacturing R&D investment. As a result, Hypothesis 1 is confirmed.
Regarding the control variables, as shown in Columns 4 and 5 of Table 4, the coefficient of Size is significantly positive in the first-stage equation, but insignificant in the second-stage equation. This shows that the larger the enterprise size, the higher the propensity to invest in R&D, but enterprise size exerts no significant difference in the R&D investment intensity. The coefficients of Age are significantly negative in both the first-stage and second-stage equations, reflecting that newly established enterprises have more innovation vitality. An enterprise’s profitability has no significant impact on R&D propensity, but it does have a significantly negative impact on the corporate R&D investment intensity, which does not align with what we would expect based on economic theory. This may be attributed to the fact that many enterprises with high-profit levels belong to industries such as the energy industry, for which the market monopoly is apparent, while they lack the motivation for technological innovation. The asset-liability ratio has a significantly negative effect on both the R&D propensity and the R&D investment intensity of manufacturing enterprises. This is because the higher the asset-liability ratio of an enterprise is, the greater the operating risk presented for the enterprise, thereby lowering the ability of the enterprise to conduct high-risk and long-term R&D activities. The coefficient of Cap is not significant in the first-stage equation, but significantly negative in the second-stage equation. This may be explained by the fact that enterprises with high capital intensity generally belong to monopolistic industries and have less of an incentive to engage in R&D activities due to their monopoly profits [5]. The impact of cash flow on R&D propensity is insignificant, but it has a significantly positive impact on R&D investment intensity, reflecting the important role of sufficient cash flow in corporate innovation activities. With respect to financing constraint, we find that both the coefficients of Credit and SA are insignificant in the first-stage and second-stage equations respectively, indicating that financing constraint do not significantly effect corporate R&D input.

4.2. Results and Analysis under Sample Differences

In order to investigate whether differences, in the impact effects of financialization on the R&D investment of different types of enterprises, exist, this paper further conducts an empirical analysis based on the heterogeneous samples in terms of enterprise ownership type, industry, region, and financing constraints. Specifically, we first consider whether the coefficient of an inverse Mills’ ratio is statistically significant based on Heckman’s two-step approach. If it is statistically significant, the Heckman selection model is used to estimate Equations (1) and (3); if it is not significant, the OLS estimator is employed to estimate Equation (3). The results regarding the linear effect of corporate financialization on R&D investment under sample differences are shown in Table 5.
As can be seen from the results in Columns 2 and 3 in Table 5, for state-owned enterprises, the inverse Mills’ ratio in the Heckman selection model is significant at the significance level of 1%, indicating that the Heckman two-stage method should be used to correct the sample-selection bias. However, it is insignificant in non-state-owned enterprises (non-SOEs). We thus estimate the impact of financialization on R&D investment intensity of non-SOEs using the OLS estimator. It is clear thar, the estimation coefficients of Fin are less than 0 for both the SOEs and non-SOEs, and they are statistically significant at the 1% significance level, indicating that financialization has a restraining effect on the R&D investments of both SOEs and non-SOEs in China’s manufacturing industry. However, the absolute value of the estimated coefficient of Fin in SOEs is 0.0664, which is larger than that in non-SOEs, reflects that the inhibition effect of financialization is more prominent in SOEs. As analyzed above, compared with non-SOEs, SOEs experience less capital pressure in production and operation, and their business operators often demonstrate “short-sighted” behaviors of focusing on short-term operating performance. They have greater motivation for financial arbitrage, and the negative impact of financialization on the R&D investment of SOEs is greater. Given the above, Hypothesis 2 is confirmed.
Next, according to the “Catalog for High-technology Industries Statistics Classification” released by the National Bureau of Statistics of China, this paper classifies the sample enterprises into high-tech enterprises or non-high-tech enterprises. As can be seen from the statistical significance test results of the inverse Mills’ ratio in Columns 4 and 5 of Table 5, for non-high-tech enterprises, it is necessary to employ the Heckman selection model to correct the sample selection bias, while for high-tech enterprises, the OLS method can be used directly. The results show that financialization inhibits the R&D investment of enterprises in both high-tech and non-high-tech industries, and the coefficients of Fin are −0.0461 and −0.0467 in high-tech enterprises and non-high-tech enterprises, respectively. The inhibition effect of financialization on the R&D investment of enterprises in the high-tech industry is slightly less than that of enterprises in the non-high-tech industry. This is primarily because, compared with enterprises in non-high-tech industries, enterprises engaged in high-tech innovation activities can obtain innovation returns, so their motivation to engage in financial arbitrage is relatively weak; thus, the R&D inhibition effect of financialization is also less significant. The empirical results of this paper also support the validate the relevance of Hypothesis 2.
Due to the major differences in the level of economic and social development among different regions in China, this paper further investigates whether there are differences in the impact of financialization on the R&D investment of manufacturing enterprises for different locations. According to the province where the enterprise is registered, the sample enterprises are classified as the eastern coastal region and the central and western inland region according to the classification standard of the National Bureau of Statistics. Because the inverse Mills’ ratios are statistically significant for different regions, we use Heckman’s two-step approach to correct the sample selection bias. The results shown in Columns 6–9 of Table 5 indicate that in both the first-stage and second-stage equations, the coefficients of Fin are significantly negative in both the eastern and central and western regions, reflecting that financialization has a significant inhibitory effect on R&D investments for the manufacturing enterprises of different regions. In terms of the estimated coefficient, in the first-stage equation, the coefficient of Fin in the central and western region is −3.052, which is 1.38 times of that in the eastern region (−2.025), indicating that financialization has a more prominent negative impact on corporate R&D propensity in the central and western regions. This may be because the enterprises in the eastern region possess stronger innovation consciousness and attach greater importance to the role of innovation in improving enterprise competitiveness; thus, the negative impact of financialization on corporate R&D propensity in the eastern region is relatively less than that of the western and central regions. However, in the second-stage equation, the coefficient of Fin in the eastern region (−0.108) is around twice that of the central and western regions (−0.0554), making the inhibition effect of financialization on the R&D investment intensity of enterprises in the eastern region particularly evident. This is mainly due to the better operating conditions and profitability of enterprises in the eastern region, and the more developed financial market in the eastern region, the stronger willingness of enterprises to make a financial investment, as a result of which financialization has a more significant crowding-out effect on the level of R&D investment. These findings also largely support Hypothesis 2.
In order to investigate whether there differences exist between the impact of financialization on the R&D investment among enterprises with different degrees of financing constraints, this paper divides the samples into high financing constraint enterprises and low financing constraint enterprises according to the dummy variable, Credit. According to the statistical significance test results of the inverse Mills’ ratio in Columns 10 and 11 of Table 5, the Heckman selection model and the OLS method are used to estimate the effect of financialization on the R&D investment intensity of enterprises with low financing constraints and high financing constraints, respectively. It is found that financialization has a significantly negative impact on the R&D investment of enterprises with high financing constraints, but it is not statistically significant in enterprises with low financing constraints. Enterprises with low financing constraints can obtain more funds at a lower cost, and the free cash flow is relatively sufficient, so they both maintain the long-term progress of innovation activities and allocate more financial assets. The crowding-out effect of R&D investment by financialization is not significant. However, the ability of enterprises with high financing constraints to obtain external funds is limited, and the internal funds cannot ensure the long-term development of innovation activities, so they tend to make short-term financial investments to obtain high returns; thus, the financial arbitrage depletes the R&D funds. Considering these factors, the inhibitory effect of financialization on the R&D investment of enterprises with high financing constraints is quite evident. Therefore, the relevant discussion in Hypothesis 2 has been confirmed.
In order to further investigate whether a non-linear relationship between corporate financialization and R&D investment exists, this paper incorporates the square term of financialization into the econometric model under sub-samples, and the estimated results are presented in Table 6. As can be seen from Table 6, the estimated coefficient of Fin2 is not statistically significant in all cases, which further indicates that a non-linear impact of financialization on the R&D investment of China’s manufacturing enterprises does not exist.

5. Results and Analysis of the Moderating Effect of Government Subsidies on the Relationship between Corporate Financialization and the R&D Investment

This section will focus on investigating the role of government subsidies in moderating the financialization–R&D investment relationship by estimating Equations (6) and (7). According to the estimated results in Table 7, the inverse Mills’ ratio is statistically significant at the 1% significance level, so the Heckman selection model is used to correct sample selection bias. The coefficient of Fin × Gov (i.e., the interaction term between financialization and government subsidies) is insignificant in the first-stage equation, but significantly negative in the second-stage equation, indicating that government subsidies deepen the crowding-out effect of financialization on the R&D investment intensity of manufacturing enterprises. In other words, for enterprises with greater government subsidies, the inhibition effect of financialization on their R&D investment is more evident. As discussed above, obtaining government subsidies can alleviate the capital constraint of corporate R&D investment to a great extent, thus forming a reservoir effect for the R&D. However, due to the imperfect intellectual property protection system in China, it is difficult to ensure that enterprises can effectively obtain high profits from innovation. At the same time, the ex-post capital supervision mechanism following the granting of government subsidies is not perfect. Many enterprises will invest a large amount of government subsidies in financial assets so as to obtain profits in a short period, thereby neglecting innovation projects with a long cycle for the purpose of arbitrage. In this context, government subsidies will expand the crowding-out effect of corporate financialization on manufacturing R&D investment. Therefore, Hypothesis 3 is verified.
In the sub-sample studies, the statistical significance of the inverse Mills’ ratio is initially tested, and then an appropriate approach is selected to conduct a comparative analysis of the moderating effect of government subsidies on the relationship between financialization and R&D investment. As can be seen from Columns 2 and 3 in Table 8, the estimated coefficient of Fin × Gov is less than 0 for both the SOEs and non-SOEs, although it is only statistically significant in non-SOEs. Compared to non-SOEs, government subsidies for SOEs are supervised and controlled by the government to a greater extent, so SOEs are less likely to use government subsidies for financial arbitrage. This also explains, to a large extent, why the negative moderating effect of government subsidies on the relationship between financialization and R&D investment is significant only in non-SOEs.
Columns 4 and 5 in Table 8 show the estimated results of high-tech and non-high-tech enterprises. It can be found that under different sub-samples, government subsidies impart a negative moderating effect to the relationship between financialization and R&D investment, but the effect is only statistically significant in non-high-tech enterprises. As discussed above, compared with non-high-tech enterprises, high-tech enterprises can obtain high innovation returns by engaging in the innovation activities of new products and processes requiring a high technical level. Therefore, they are more likely to use government subsidies for R&D activities and have less motivation to use subsidies for financial arbitrage. Therefore, the negative moderating effect of government subsidies is not significant in non-high-tech enterprises.
According to the results in Columns 6–9 in Table 8, whether from the first-stage equation or the second-stage equation of the Heckman selection model, the coefficients of Fin × Gov are not statistically significant in the eastern region. In the central and western regions, the coefficient of Fin × Gov is insignificant in the first-stage equation, but significantly negative in the second-stage equation. This shows that government subsidies play a significant and negative moderating role in the impact of corporate financialization on the R&D investment in the central and western regions. In comparison, enterprises in the eastern region have a relatively better institutional environment, higher government quality, and stricter government supervision regarding the purpose of obtaining subsidies; thus, they have weaker motivation to allocate government subsidies as financial assets to pursue profits. This may explain why the negative moderating effect of government subsidies is not significant to enterprises in the eastern region.
Columns 10–11 in Table 8 show the results for samples subject to different financing constraints. At the significance level of 1%, the coefficients of Fin × Gov are statistically significant under different financing constraints. However, the values are −2.996 and 3.725 for enterprises with low and high financing constraints, respectively. This indicates that the moderating effect of government subsidies is entirely different for these two sub-samples. As noted already, under the condition of high financing constraints, enterprises often rely on financial speculation to maintain their operations, which is likely to reduce their investment in R&D. However, government subsidies can effectively alleviate the capital gap of enterprises and reduce their dependence on financial speculation channels. In this context, government subsidies also reduce the restraining effect of financialization on the R&D investment of enterprises with high financing constraints. However, for enterprises with low financing constraints, government subsidies may further increase the funds provided for allocating financial assets due to their low financing costs and abundant liquidity, thus exacerbating the crowding-out effect of financialization on their R&D investment.
Based on the above analysis, Hypothesis 4 has also been confirmed.

6. Conclusions

Based on the data of China’s A-share manufacturing listed companies from 2007 to 2018, this paper mainly utilizes Heckman’s two-step approach to investigate the impact of corporate financialization on R&D investment, as well as to analyze the role of government subsidies in moderating the relationship between financialization-R&D investment. In addition, a heterogeneity analysis is also conducted for different ownership types, industries, regions, and financing constraints. The main conclusions are summarized as follows:
First, financialization has a significant inhibitory effect on the R&D investment of manufacturing enterprises, and government subsidies further exacerbate the negative impact of financialization. More specifically, this paper demonstrates that whether from the first-stage equation or the second-stage equation of the Heckman selection model, corporate financialization indicates a crowding-out effect on both corporate R&D propensity and R&D investment intensity in the manufacturing industry. At the same time, the interaction effects between government subsidies and financialization are significantly negative in the second-stage equation, reflecting that government subsidies further strengthen the inhibitory effect of financialization on corporate R&D investment intensity.
Second, there are differences in the statistical significance and influence sizes of the impact of financialization on the R&D investment under different types of enterprise ownership, industry, region, and degree of financing constraints. More specifically, except for the sub-samples of low financing constraint enterprises, corporate financialization has a significantly negative effect on the R&D investment in other heterogeneous samples. However, the impact intensities are different. Compared with non-SOEs, the negative effect of financialization on the R&D investment of SOEs is more obvious; compared with high-tech enterprises, the crowding-out effect of financialization is slightly higher in non-high-tech enterprises; compared with the enterprises in the central and western regions, the negative effect of financialization is more prominent in the eastern-region enterprises.
Third, the moderating effect of government subsidies on the relationship between financialization and R&D investment varies in the sign, statistical significance, and impact magnitude of the heterogeneous samples. Specifically, the negative moderating effect of government subsidies is statistically significant in non-SOEs, non-high-tech enterprises, and enterprises in the central and western regions, but it is insignificant in SOEs, high-tech enterprises, and enterprises in the eastern region. For enterprises with high financing constraints, government subsidies can significantly reduce the crowding-out effect of financialization on their R&D investments. Conversely, it intensifies the negative effect of financialization in enterprises with low financing constraints.
As mentioned above, the literature rarely focuses on the relationship between financialization and the R&D investment of manufacturing enterprises, and the research conclusions are inconsistent. Using Heckman’s two-step approach, which resolves the potential sample selection bias, this paper found a linear negative relationship between financialization and the R&D investment of manufacturing enterprises, which is consistent with the research conclusions of Xu and Xuan [28], Seo et al. [6], and Su and Liu [29], but different from those of Pan and Wang [30] and Li et al. [31]. On this basis, through the innovative introduction of government subsidies in the analysis, this paper provides new insights, in that government subsidies have a negative moderating effect for the relationship between financialization and the R&D investment of manufacturing enterprises. Finally, this paper also shows that under the sample difference, the effect of financialization on the R&D investment of manufacturing enterprises and the moderating effect of government subsidies in the relationship between the two are heterogeneous. These significant research conclusions are conducive to a more developed understanding of the relationship between financialization and the R&D investment of manufacturing enterprises.
The research findings of this paper have clear policy implications. On the one hand, the government should guide manufacturing enterprises to correctly deal with the relationship between financial investment and main business development purposes and to reduce short-term financial speculation, avoiding an excess of financial investment in R&D investment, which will affect the sustainable development of enterprises. On the other hand, in the context of the rising financialization of China’s manufacturing industry, the government should strength the ex-post fund supervision after enterprises have received government subsidies, so as to avoid magnifying the crowding-out effect of financialization on corporate R&D investment. Additionally, the government should implement differentiated subsidy strategies according to enterprise attributes. It is highly necessary to increase the subsidies afforded to enterprises with high financing constraints.
As part of future research, given the current situation that China’s manufacturing industry is facing with increasing resource and environmental constraints, increasing the level of green investment and green funds for enterprises is highly important for the sustainable development of China’s manufacturing industry. The determinants of green investment of enterprises have also attracted great interest in academic circles [66,67,68]. As the financialization trend of Chinese manufacturing enterprises is becoming more and more apparent, the topic should be afforded further study so as to investigate the impact of financialization on green investment in the manufacturing industry.

Author Contributions

Conceptualization, P.H.; methodology, P.H.; software, M.Z.; validation, J.X.; formal analysis, M.Z. and J.X.; investigation, J.X.; resources, P.H.; data curation, M.Z.; writing—original draft preparation, M.Z.; writing—review and editing, Y.L.; visualization, M.Z.; supervision, P.H.; project administration, P.H.; funding acquisition, P.H. All authors have read and agreed to the published version of the manuscript.

Funding

This research was funded by the Fundamental Research Funds for the Central Universities, grant number 2021SRY07, and National Social Science Fund of China, grant number 21BTJ053.

Institutional Review Board Statement

Not applicable.

Informed Consent Statement

Not applicable.

Data Availability Statement

Data supporting reported results are available using the links below: Financial assets and detailed items: CSMAR database. Data of long-term equity investment, investment income, financial expenses, and other current assets: the notes of the listed companies. Government subsidies data: the Wind database. R&D investment data: the Flush database. Some missing data: manually collectingon and sorting of the annual financial reports that are publicly disclosed by the listed companies disclosure.

Acknowledgments

The authors are very grateful to the reviewers for their insightful comments and careful review.

Conflicts of Interest

The authors declare no conflict of interest.

References

  1. Altunkaynak, B. A statistical study of occupational accidents in the manufacturing industry in Turkey. Int. J. Ind. Ergon. 2018, 66, 101–109. [Google Scholar] [CrossRef]
  2. Behun, M.; Gavurova, B.; Tkacova, A.; Kotaskova, A. The impact of the manufacturing industry on the economic cycle of european union countries. J. Compet. 2018, 10, 23–39. [Google Scholar] [CrossRef] [Green Version]
  3. Xu, J.; Sim, J. Characteristics of Corporate R&D Investment in Emerging Markets: Evidence from Manufacturing Industry in China and South Korea. Sustainability 2018, 10, 3002. [Google Scholar]
  4. Tian, Y.; Wang, Y.; Xie, X.; Jiao, J.; Jiao, H. The impact of business-government relations on firms’ innovation: Evidence from the Chinese manufacturing industry. Technol. Forecast. Soc. Chang. 2019, 143, 1–8. [Google Scholar] [CrossRef]
  5. Liu, S.; Shen, X.; Jiang, T.; Failler, P. Impacts of the financialization of manufacturing enterprises on total factor productivity: Empirical examination from China’s listed companies. Green Financ. 2021, 3, 59–89. [Google Scholar] [CrossRef]
  6. Seo, H.J.; Kim, H.S.; Kim, Y.C. Financialization and the Slowdown in Korean Firms’ R&D Investment. Asian Econ. Pap. 2012, 11, 35–49. [Google Scholar]
  7. Krippner, G.R. The financialization of the American economy. Socio-Econ. Rev. 2005, 3, 173–208. [Google Scholar] [CrossRef]
  8. Assa, J. Financialization and its consequences: The OECD experience. Financ. Res. 2012, 1, 35–39. [Google Scholar]
  9. Cibils, A.; Allami, C. Financialisation vs. development finance: The case of the post-crisis Argentine banking system. Rev. Régul. Capital. Inst. Pouvoirs. 2013, 13. Available online: https://EconPapers.repec.org/RePEc:rvr:journl:2013:10136 (accessed on 1 October 2021). [CrossRef] [Green Version]
  10. Sukharev, O.; Voronchikhina, E. Financial and non-financial investments: Comparative econometric analysis of the impact on economic dynamics. Quant. Financ. Econ. 2020, 4, 382–411. [Google Scholar] [CrossRef]
  11. Li, T.; Ma, J.; Mo, B. Does the Land Market Have an Impact on Green Total Factor Productivity? A Case Study on China. Land 2021, 10, 595. [Google Scholar] [CrossRef]
  12. Krippner, G.R. Capitalizing on Crisis; Harvard University Press: Cambridge, MA, USA, 2011. [Google Scholar]
  13. Bonfiglioli, A. Financial integration, productivity and capital accumulation. J. Int. Econ. 2008, 76, 337–355. [Google Scholar] [CrossRef] [Green Version]
  14. Gehringer, A. Growth, productivity and capital accumulation: The effects of financial liberalization in the case of European integration. Int. Rev. Econ. Financ. 2013, 25, 291–309. [Google Scholar] [CrossRef]
  15. Tadesse, S. Financial architecture and economic performance: International evidence. J. Financ. Intermediat. 2002, 11, 429–454. [Google Scholar] [CrossRef] [Green Version]
  16. Matei, I. Is financial development good for economic growth? Empirical insights from emerging European countries. Quant. Financ. Econ. 2020, 4, 653–678. [Google Scholar] [CrossRef]
  17. Orhangazi, Ö. Financialisation and capital accumulation in the non-financial corporate sector: A theoretical and empirical investigation on the US economy: 1973–2003. Camb. J. Econ. 2008, 32, 863–886. [Google Scholar] [CrossRef] [Green Version]
  18. Demir, F. Financial liberalization, private investment and portfolio choice: Financialization of real sectors in emerging markets. J. Dev. Econ. 2009, 88, 314–324. [Google Scholar] [CrossRef] [Green Version]
  19. Demir, F. Financialization and Manufacturing Firm Profitability under Uncertainty and Macroeconomic Volatility: Evidence from an Emerging Market. Rev. Dev. Econ. 2009, 13, 592–609. [Google Scholar] [CrossRef]
  20. Kliman, A.; Williams, S.D. Why ‘financialisation’ hasn’t depressed US productive investment. Camb. J. Econ. 2015, 39, 67–92. [Google Scholar] [CrossRef]
  21. Seo, H.J.; Kim, H.S.; Kim, J. Does Shareholder Value Orientation or Financial Market Liberalization Slow Down Korean Real Investment? Rev. Radic. Political Econ. 2016, 48, 633–660. [Google Scholar] [CrossRef]
  22. Davis, L.E. Financialization and the non-financial corporation: An investigation of firm-level investment behavior in the United States. Metroeconomica 2018, 69, 270–307. [Google Scholar] [CrossRef] [Green Version]
  23. Tori, D.; Onaran, O. The effects of financialization on investment: Evidence from firm-level data for the UK. Camb. J. Econ. 2018, 42, 1393–1416. [Google Scholar] [CrossRef]
  24. Cupertino, S.; Consolandi, C.; Vercelli, A. Corporate social performance, financialization, and real investment in US manufacturing firms. Sustainability 2019, 11, 1836. [Google Scholar] [CrossRef] [Green Version]
  25. Zheng, Z.L.; Gao, X.; Ruan, X.L. Does economic financialization lead to the alienation of enterprise investment behavior? Evidence from China. Phys. A Stat. Mech. Appl. 2019, 536, 120858. [Google Scholar] [CrossRef]
  26. Shu, J.; Zhang, C.; Zheng, N. Financialization and sluggish fixed investment in Chinese real sector firms. Int. Rev. Econ. Financ. 2020, 69, 1106–1116. [Google Scholar] [CrossRef]
  27. Wang, H.; Wang, Q.; Sheng, X. Does Corporate Financialization Have a Non-Linear Impact on Sustainable Total Factor Productivity? Perspectives of Cash Holdings and Technical Innovation. Sustainability 2021, 13, 2533. [Google Scholar] [CrossRef]
  28. Xu, X.; Xuan, C. A study on the motivation of financialization in emerging markets: The case of Chinese nonfinancial corporations. Int. Rev. Econ. Financ. 2021, 72, 606–623. [Google Scholar] [CrossRef]
  29. Su, K.; Liu, H. Financialization of manufacturing companies and corporate innovation: Lessons from an emerging economy. Manag. Decis. Econ. 2021, 42, 863–875. [Google Scholar] [CrossRef]
  30. Pan, H.Y.; Wang, C.F. Does the financialization of entity Enterprises inhibit enterprise innovation?--From the dual perspective of enterprise innovation in the context of high-quality development. J. Nanjing Audit. Univ. 2020, 17, 49–58. [Google Scholar]
  31. Li, T.; Li, X.; Albitar, K. Threshold effects of financialization on enterprise R&D innovation: A comparison research on heterogeneity. Quant. Financ. Econ. 2021, 5, 496–515. [Google Scholar]
  32. Heckman, J.J. Sample selection bias as a specification error. Econom. J. Econom. Soc. 1979, 47, 153–161. [Google Scholar] [CrossRef]
  33. Guan, J.C.; Pang, L. Industry specific effects on innovation performance in China. China Econ. Rev. 2017, 44, 125–137. [Google Scholar] [CrossRef]
  34. Holmstrom, B. Agency costs and innovation. J. Econ. Behav. Organ. 1989, 12, 305–327. [Google Scholar] [CrossRef] [Green Version]
  35. Sardo, F.; Serrasqueiro, Z. Intellectual capital and high-tech firms’ financing choices in the European context: A panel data analysis. Quant. Financ. Econ. 2020, 5, 1–18. [Google Scholar] [CrossRef]
  36. Almeida, H.; Campello, M.; Weisbach, M.S. The Cash Flow Sensitivity of Cash. J. Financ. 2004, 59, 1777–1804. [Google Scholar] [CrossRef]
  37. Zhong, J.; Li, T. Impact of financial development and its spatial spillover effect on green total factor productivity: Evidence from 30 Provinces in China. Math. Probl. Eng. 2020, 2020, 5741387. [Google Scholar] [CrossRef] [Green Version]
  38. Yang, Y. Will Financialization Cause Underinvestment? World Sci. Res. J. 2021, 7, 384–398. [Google Scholar]
  39. Qi, Y.; Yang, Y.; Yang, S.; Lyu, S. Does government funding promote or inhibit the financialization of manufacturing enterprises? Evidence from listed Chinese enterprises. N. Am. J. Econ. Financ. 2021, 58, 101463. [Google Scholar] [CrossRef]
  40. Huang, Q.H. On the development of China’s real economy in the New Period. China Ind. Econ. 2017, 09, 5–24. [Google Scholar]
  41. Guariglia, A.; Poncet, S. Could financial distortions be no impediment to economic growth after all? Evidence from China. J. Comp. Econ. 2008, 36, 633–657. [Google Scholar] [CrossRef] [Green Version]
  42. Law, K.M.; Lau, A.K.; Ip, A.W. The Impacts of Knowledge Management Practices on Innovation Activities in High-and Low-Tech Firms. J. Glob. Inf. Manag. 2021, 29, 1–25. [Google Scholar] [CrossRef]
  43. Takalo, T.; Tanayama, T. Adverse selection and financing of innovation: Is there a need for R&D subsidies? J. Technol. Transf. 2010, 35, 16–41. [Google Scholar]
  44. Mansfield, E.; Schwartz, M.; Wagner, S. Imitation costs and patents: An empirical study. Econ. J. 1981, 91, 907–918. [Google Scholar] [CrossRef]
  45. Wu, X.Y.; Chen, Y.; Yang, W.H. Government subsidies and enterprise R&D investment in strategic emerging industries. Sci. Res. Manag. 2016, 37, 19–23. [Google Scholar]
  46. Hall, B.; Van Reenen, J. How effective are fiscal incentives for R&D? A review of the evidence. Res. Policy 2000, 29, 449–469. [Google Scholar]
  47. Piga, C.A.; Atzeni, G. R&D investment, credit rationing and sample selection. Bull. Econ. Res. 2007, 59, 149–178. [Google Scholar]
  48. Czarnitzki, D.; Ebersberger, B.; Fier, A. The relationship between R&D collaboration, subsidies and R&D performance: Empirical evidence from Finland and Germany. J. Appl. Econom. 2007, 22, 1347–1366. [Google Scholar]
  49. Link, A.N. An analysis of the composition of R&D spending. South. Econ. J. 1982, 49, 342–349. [Google Scholar]
  50. Lach, S. Do R&D subsidies stimulate or displace private R&D? Evidence from Israel. J. Ind. Econ. 2002, 50, 369–390. [Google Scholar]
  51. Wang, J. Empirical research on the impact of R&D subsidies on firms’ R&D input and innovation output. Stud. Sci. Sci. 2010, 28, 1368–1374. [Google Scholar]
  52. Kaplan, S.N.; Zingales, L. Do investment-cash flow sensitivities provide useful measures of financing constraints? Q. J. Econ. 1997, 112, 169–215. [Google Scholar] [CrossRef] [Green Version]
  53. Lamont, O.; Polk, C.; Saaá-Requejo, J. Financial constraints and stock returns. Rev. Financ. Stud. 2001, 14, 529–554. [Google Scholar] [CrossRef]
  54. Whited, T.M.; Wu, G. Financial constraints risk. Rev. Financ. Stud. 2006, 19, 531–559. [Google Scholar] [CrossRef]
  55. Hadlock, C.J.; Pierce, J.R. New evidence on measuring financial constraints: Moving beyond the KZ index. Rev. Financ. Stud. 2010, 23, 1909–1940. [Google Scholar] [CrossRef]
  56. Yasuda, T. Firm growth, size, age and behavior in Japanese manufacturing. Small Bus. Econ. 2005, 24, 1–15. [Google Scholar] [CrossRef]
  57. Cohen, W.M.; Klepper, S. A reprise of size and R&D. Econ. J. 1996, 106, 925–951. [Google Scholar]
  58. Cockburn, I.M.; Henderson, R.M. Scale and scope in drug development: Unpacking the advantages of size in pharmaceutical research. J. Health Econ. 2001, 20, 1033–1057. [Google Scholar] [CrossRef]
  59. Ciftci, M.; Cready, W.M. Scale effects of R&D as reflected in earnings and returns. J. Account. Econ. 2011, 52, 62–80. [Google Scholar]
  60. Villard, H.H. Competition, oligopoly, and research. J. Political Econ. 1958, 66, 483–497. [Google Scholar] [CrossRef]
  61. Braga, H.; Willmore, L. Technological imports and technological effort: An analysis of their determinants in Brazilian firms. J. Ind. Econ. 1991, 39, 421–432. [Google Scholar] [CrossRef]
  62. Rosenbloom, R.S.; Christensen, C.M. Technological discontinuties, organizational capabilities, and strategic commitments. Ind. Corp. Chang. 1994, 3, 655–685. [Google Scholar] [CrossRef]
  63. Sørensen, J.B.; Stuart, T.E. Aging, obsolescence, and organizational innovation. Adm. Sci. Q. 2000, 45, 81–112. [Google Scholar] [CrossRef] [Green Version]
  64. Ranger-Moore, J. Bigger may be better, but is older wiser? Organizational age and size in the New York life insurance industry. Am. Sociol. Rev. 1997, 62, 903–920. [Google Scholar] [CrossRef]
  65. Brauman, R.; Kopcke, R. The performance of traditional macroeconomic models of businesses’ investment spending. N. Engl. Econ. Rev. 2001, 2, 3–39. [Google Scholar]
  66. Cheng, B.; Qiu, B.; Chan, K.C.; Zhang, H. Does a green tax impact a heavy-polluting firm’s green investments? Appl. Econ. 2021, 1–17. [Google Scholar] [CrossRef]
  67. Chițimiea, A.; Minciu, M.; Manta, A.M.; Ciocoiu, C.N.; Veith, C. The Drivers of Green Investment: A Bibliometric and Systematic Review. Sustainability 2021, 13, 3507. [Google Scholar] [CrossRef]
  68. Zhang, K.; Wang, Y.; Huang, Z. Do the Green Credit Guidelines Affect Renewable Energy Investment? Empirical Research from China. Sustainability 2021, 13, 9331. [Google Scholar] [CrossRef]
Figure 1. The scheme of methods and steps of the Heckman’s two-step approach.
Sustainability 13 12633 g001
Table 1. Variable definition and calculation.
Variable TypeVariable NameVariable SymbolVariable Definition and Calculation
Explained variableR&D investment intensityR&DR&D expenses/total operating income
Explanatory variableThe level of financializationFinFinancial assets/total assets
Moderating variableGovernment subsidy intensityGovGovernment subsidies/total operating income
Control variableFinancing constraintsCreditDummy variable. With the median of SA index as the boundary, greater than the median means low financing constraints, and Credit is 1; otherwise, 0
Financing constraint indexSA S A = 0.737 × S i z e + 0.043 × S i z e 2 0.04 × A g e
Enterprise sizeSizeNatural logarithm of total assets
Enterprise ageAgeSample year minus the establishment year of the enterprise
Enterprise profitabilityProNet profit/total operating income
Capital structureStrTotal liabilities/total assets
Capital intensityCapNet fixed assets/total assets
Cash flowCashNet cash flow from operating activities/total assets
YearYearDummy variable. The value is 1 if the enterprise belongs to the year; otherwise 0
IndustryIndustryDummy variable with two digits of the industry code. It is set to 1 if it belongs to the industry; otherwise, it is set to 0
Ownership typeTypeDummy variable. The value of state-owned enterprises is 1 and that of non-state-owned enterprises is 0
Technical typeTechniqueDummy variable. The value is 1 for high-tech enterprises and 0 for non-high-tech enterprises
RegionDistrictDummy variable. The value is 1 for the eastern region enterprises and 0 for those in the central and western regions
Table 2. Descriptive statistics of major variables.
VariableObsMeanStandard ErrorMinimumMedianMaximum
R&D11,4160.03320.069700.02865.7290
Fin11,4160.02800.060500.00580.7400
Gov11,4160.01050.051700.00373.4920
SA11,416−2.6750.5740−4.656−2.67200.752
Size11,4163.60901.2170−1.71703.47488.9650
Age11,41615.97005.497021639
Pro11,4160.03362.5500−262.600.061434.2700
Str11,4160.45901.21700.00710.425896.9600
Cap11,4160.24000.14300.00020.21110.8620
Cash11,4160.04550.0730−1.08000.04310.8920
Table 3. Correlation coefficient matrix of the main variables.
R&DFinGovSASizeAgeProStrCapCash
R&D1
Fin−0.0180 **1
Gov0.0700 ***−0.0170 *1
SA0.0610 ***−0.0160 *0.0450 ***1
Size−0.0590 ***−0.0450 ***−0.053 ***−0.9120 ***1
Age−0.0290 ***0.1410 ***0.0070−0.5490 ***0.2000 ***1
Pro−0.0190 **0.00500.0120−0.0450 ***−0.00700.0380 ***1
Str−0.0270 ***−0.01300.00200.0430 ***0.0290 ***−0.0180 *−0.3730 ***1
Cap−0.1090 ***−0.1770 ***−0.0020−0.0920 ***0.1040 ***0.0200 **0.00100.0360 ***1
Cash−0.0320 ***−0.0440 ***−0.0250 ***−0.0730 ***0.0780 ***0.00600.0090−0.0480 ***0.1750 ***1
Note: *, **, and *** indicate statistically significant at the significance level of 10%, 5%, and 1%, respectively.
Table 4. Results of the impact of financialization on corporate R&D investment.
VariablesOLS
(The Full Sample)
OLS
(R&D > 0)
Heckman
(Linear Effect)
Heckman
(Linear Effect)
Heckman
(Non-Linear Effect)
Heckman
(Non-Linear Effect)
Equation (3)Equation (3)Equation (1)Equation (3)Equation (4)Equation (5)
Fini,t−1−0.0328 ***−0.0364 **−2.0220 ***−0.0570 ***−2.7360 ***−0.0756 **
(0.0124)(0.0147)(0.3280)(0.0154)(0.7860)(0.0304)
Fin2i,t−1 2.01900.0587
(2.0520)(0.0797)
Govi,t−10.1270 ***0.6520 ***−0.7320 **0.6270 ***−0.7390 **0.6280 ***
(0.0131)(0.0300)(0.3270)(0.0296)(0.3280)(0.0296)
Credit −0.0102 −0.0080
(0.0746) (0.0746)
SA0.0134 *0.0086 0.0062 0.0065
(0.0078)(0.0089) (0.0089) (0.0089)
Size0.00060.00020.0677 **0.00010.0675 **0.0002
(0.0031)(0.0035)(0.0299)(0.0035)(0.0299)(0.0035)
Age−0.0007 *−0.0006−0.0712 ***−0.0012 ***−0.0707 ***−0.0012 ***
(0.0003)(0.0004)(0.0055)(0.0004)(0.0055)(0.0004)
Pro−0.0008 ***−0.0678 ***−0.0123−0.0679 ***−0.0124−0.0679 ***
(0.0003)(0.0027)(0.0369)(0.0027)(0.0369)(0.0027)
Str−0.0014 **−0.0147 ***−0.6740 ***−0.0229 ***−0.6700 ***−0.0227 ***
(0.0007)(0.0049)(0.1110)(0.0052)(0.1110)(0.0052)
Cap−0.0063−0.0285 ***−0.1900−0.0306 ***−0.1990−0.0309 ***
(0.0061)(0.0070)(0.1760)(0.0071)(0.1760)(0.0072)
Cash−0.00170.0462 ***0.14200.0475 ***0.14200.0476 ***
(0.0105)(0.0124)(0.3140)(0.0126)(0.3140)(0.0126)
Year dummyYESYESYESYESYESYES
Industry dummyYESYESYESYESYESYES
TypeYESYESYESYESYESYES
TechniqueYESYESYESYESYESYES
DistrictYESYESYESYESYESYES
Constant0.0435 ***0.0551 ***3.3090 ***0.0693 ***3.3110 ***0.0696 ***
(0.0086)(0.0101)(0.2610)(0.0101)(0.2610)(0.0101)
lambda 0.0495 ***0.0486 ***
(0.0096)(0.0096)
N9635825496359635
Note: Values in brackets are standard errors; *, **, and *** mean significant at the significance level of 10%, 5%, and 1%, respectively.
Table 5. Results of the linear effect of financialization on corporate R&D investment under sample differences.
VariablesHeckmanOLSOLSHeckmanHeckmanHeckmanHeckmanHeckmanHeckmanOLS
(SOEs)(Non-SOEs)(High-Tech)(Non-High-Tech)(Eastern Region)(Eastern Region)(Central & Western Regions)(Central & Western Regions)(Low Financing Constraint)(High Financing Constraint)
Equation (3)Equation (3)Equation (3)Equation (3)Equation (1)Equation (3)Equation (1)Equation (3)Equation (3)Equation (3)
Fini,t−1−0.0664 ***−0.0449 ***−0.0461 ***−0.0467 **−2.0250 ***−0.1080 ***−3.0520 ***−0.0554 **−0.0282−0.0306 ***
(0.0223)(0.0173)(0.0152)(0.0220)(0.3990)(0.0403)(0.6690)(0.0250)(0.0337)(0.0089)
Control VariablesYESYESYESYESYESYESYESYESYESYES
Constant0.0680 ***0.01760.0533 ***0.0635 ***3.6860 ***0.0895 ***3.1560 ***0.0640 ***0.0789 ***0.0247 **
(0.0121)(0.0131)(0.0113)(0.0128)(0.3980)(0.0302)(0.4200)(0.0126)(0.0298)(0.0108)
lambda0.0535 ***0.00060.00770.0309 ***0.1710 ***0.0379 ***−0.0765 ***0.0003
(0.0091)(0.0143)(0.0152)(0.0119)(0.0258)(0.0099)(0.0169)(0.0068)
N35776058288567506496313943465289
Note: Values in brackets are standard errors; ** and *** mean significant at the significance level of 5% and 1% respectively.
Table 6. Results of the non-linear effect of financialization on corporate R&D investment under sample differences.
VariablesHeckmanOLSOLSHeckmanHeckmanHeckmanHeckmanHeckmanHeckmanOLS
(SOEs)(Non-SOEs)(High-Tech)(Non-High-Tech)(Eastern Region)(Eastern Region)(Central & Western Region)(Central & Western Region)(Low Financing Constraint)(High
Financing Constraint)
Equation (5)Equation (5)Equation (5)Equation (5)Equation (4)Equation (5)Equation (4)Equation (5)Equation (5)Equation (5)
Fini,t−1−0.0996 **−0.0634 *−0.0564 *−0.0529−3.2610 ***−0.1460 *−4.5060 ***−0.0951 *−0.1040−0.0194
(0.0441)(0.0365)(0.0311)(0.0450)(0.9460)(0.0765)(1.6930)(0.0510)(0.0759)(0.0177)
Fin2i,t−10.12800.05210.02670.02193.16700.11904.56800.14900.2640−0.0317
(0.1440)(0.0907)(0.0703)(0.1440)(2.4110)(0.1920)(4.9000)(0.1640)(0.2390)(0.0434)
Control VariablesYESYESYESYESYESYESYESYESYESYES
Constant0.0628 ***0.01770.0534 ***0.0638 ***3.7600 ***0.0908 ***3.1580 ***0.0644 ***0.0844 ***0.0202 ***
(0.0106)(0.0131)(0.0113)(0.0129)(0.3930)(0.0288)(0.4200)(0.0126)(0.0200)(0.0067)
lambda0.0524 ***0.00120.00330.0317 ***0.1630 ***0.0370 ***−0.0772 ***0.0005
(0.0089)(0.0143)(0.0147)(0.0119)(0.0244)(0.0099)(0.0169)(0.0068)
N35776058288567506496313943465289
Note: Values in brackets are standard errors; *, **, and *** mean significant at the significance level of 10%, 5%, and 1%, respectively.
Table 7. Results of the moderating effect of government subsidies.
VariablesEquation (6)Equation (7)
Fini,t−1−2.0600 ***−0.0408 **
(0.3390)(0.0161)
Govi,t−1−0.7580 **0.6700 ***
(0.3390)(0.0318)
Fini,t−1 × Govi,t−13.6480−1.3360 ***
(8.6030)(0.3900)
Control VariablesYESYES
Constant3.3110 ***0.0686 ***
(0.2610)(0.0101)
lambda0.0482 ***
(0.0096)
N9635
Note: Values in brackets are standard errors; ** and *** mean significant at the significance level of 5% and 1% respectively.
Table 8. Results of the moderating effect of government subsidies under sample heterogeneity.
VariablesHeckmanOLSOLSHeckmanHeckmanHeckmanHeckmanHeckmanHeckmanOLS
(SOEs)(Non-SOEs)(High-Tech)(Non-High-Tech)(Eastern Region)(Eastern Region)(Central & Western Regions)Central & Western Regions(Low Financing Constraint)(High
Financing Constraint)
Equation (7)Equation (7)Equation (7)Equation (7)Equation (6)Equation (7)Equation (6)Equation (7)Equation (7)Equation (7)
Fini,t−1−0.0614 **−0.0288−0.0383 **−0.0186−2.0900 ***−0.1010 **−2.7350 ***−0.02380.0281−0.0561 ***
(0.0261)(0.0179)(0.0159)(0.0231)(0.4470)(0.0416)(0.7190)(0.0293)(0.0356)(0.0098)
Govi,t−10.6650 ***0.6250 ***0.5480 ***0.7880 ***4.8510 *0.5530 ***−0.8130 *0.8260 ***0.9960 ***0.0930 ***
(0.0277)(0.0576)(0.0319)(0.0545)(2.5480)(0.1260)(0.4320)(0.0289)(0.0586)(0.0101)
Fini,t−1 × Govi,t−1−0.0045−1.6790 ***−0.8750−2.0050 ***11.1200−0.5470−23.2700−2.4190 **−2.9660 ***3.7250 ***
(0.8600)(0.4760)(0.5560)(0.4820)(35.6300)(1.0190)(19.8500)(1.2270)(0.5820)(0.5840)
Control VariablesYESYESYESYESYESYESYESYESYESYES
Constant0.0675 ***0.01670.0537 ***0.0603 ***3.6310 ***0.0891 ***3.1360 ***0.0625 ***0.0696 **0.0196 *
(0.0120)(0.0131)(0.0113)(0.0128)(0.4020)(0.0300)(0.4210)(0.0126)(0.0298)(0.0109)
lambda0.0530 ***−0.00120.00580.0279 **0.1700 ***0.0368 ***−0.0819 ***0.0011
(0.0089)(0.0142)(0.0149)(0.0119)(0.0256)(0.0099)(0.0168)(0.0068)
N35776058288567506496313943465289
Note: Values in brackets are standard errors; *, **, and *** mean significant at the significance level of 10%, 5%, and 1%, respectively.
Publisher’s Note: MDPI stays neutral with regard to jurisdictional claims in published maps and institutional affiliations.

