Article

The Relationship between CFO Compensation and Corporate Sustainability: An Empirical Examination of German Listed Firms

by
Mirko Profitlich
1,
Yassin Denis Bouzzine
1,* and
Rainer Lueg
1,2
1
Institute of Management, Accounting and Finance, Leuphana University Lüneburg, Universitätsallee 1, 21335 Lüneburg, Germany
2
Department of Business and Economics, University of Southern Denmark, Universitetsparken 1, 6000 Kolding, Denmark
*
Author to whom correspondence should be addressed.
Sustainability 2021, 13(21), 12299; https://doi.org/10.3390/su132112299
Submission received: 15 October 2021 / Revised: 3 November 2021 / Accepted: 4 November 2021 / Published: 8 November 2021
(This article belongs to the Special Issue Sustainable Corporate Governance, Strategy, and Risk Management)

Abstract

:
In this paper, we analyze the relationship between Chief Financial Officer (CFO) compensation and Corporate Sustainability (CS) by relying on stakeholder-agent theory and institutional theory. Taking a closer look at the German DAX30 and MDAX firms for the business years 2014–2018 (313 firm-year observations), we perform regression and correlation analyses to determine if the different CFO compensation components are related to CS. Our analyses use the environmental, social, governance (ESG) performance as a proxy for CS, determined by the Asset Four database of Thomson Reuters and the CFO compensation data from the Beck et al. (2020) database, and reveal a positive relationship between CS and CFO compensation for pension and stock compensation. Based on our knowledge, this study is the first empirical study that takes a closer look at the relationship between the different CFO compensation components and CS for the German DAX30 and MDAX firms. This result comes with important implications concerning the design of CFO compensation and for future research.

1. Introduction

In the last few years, sustainability has become more important for our society. Nowadays, politics and the firms’ stakeholders require a sustainable development of firms, also called Corporate Sustainability (CS). This growing pressure of politics and the internal and external stakeholders on firms to be good corporate citizens influences the way firms act. In Germany, since 2010, every listed firm has had to implement a management compensation system in connection with its sustainable development. Thus, a firm must not only consider maximizing profits but also environmental aspects such as sociality and sustainability [1]. Moreover, several ratings have been introduced to determine a firm’s sustainable behavior by measuring its’ environmental, social, and governance (ESG) performance.
Several studies propose a relationship between executive compensation and ESG performance [2,3]. For example, the empirical study by Claassen and Ricci (2015) examined the relationship between CEO compensation and ESG performance empirically and found that the design of CEO compensation contracts correlates with ESG performance [4]. Nevertheless, to the best of our knowledge, until now, prior research only focused on the relationship between board executive compensation in general, or especially CEO compensation, and ESG performance and no other board executives [2,3,4,5]. Furthermore, previous studies excluded pension compensation as a long-term compensation component and primarily relied on stock option compensation as a proxy for long-term compensation [2,3,6].
We want to close these research gaps in this study and empirically investigate if the different CFO compensation components are related to CS for listed DAX30 and MDAX firms in Germany. We focus on CFO compensation since the CFO of a firm holds a unique leadership position. CFOs are mainly responsible for managing the firm’s finances, including financial planning, management of financial risks, and policy decisions related to the firm’s financial performance [7]. Consequently, when it comes to decisions about investing in CS, CFOs have an important impact on the direction a firm takes. Several studies even argue that CFOs’ incentives are more important than those of CEOs and other executive board members in explaining the firms’ accruals decisions [8,9]. Also, Burkert and Lueg (2013) found that CFOs play a substantial role in the firm’s decision-making process regarding finance and accounting topics. In contrast, CEOs generally do not influence this decision-making process [10]. Accordingly, it is undeniable that the CFO greatly influences a firm’s decisions and development [11,12].
To address our research question, we employed mixed-effects regression analyses based on CFO compensation and ESG data. We used the CFO compensation data from the Beck et al. (2020) database [13]. The database’s data was handpicked from annual reports of listed DAX30 and MDAX firms in Germany for the business years 2014–2018. We selected DAX30 and MDAX firms as they include the largest firms in Germany and, therefore, should be representative of the majority of the German economy. Thereby, we differentiate short-term and long-term CFO compensation and classify long-term compensation into four different compensation types, namely pension, multi-year bonus, stock, and stock option compensation, as we expect different relationships with CS for each type of compensation component based on our theoretical framework. As for CS, we used the ESG Score provided by the Asset4 ESG framework of the Thomson Reuters Datastream database for the business years 2015–2019 to allow for a possible lagged impact of CFO compensation on CS.
In our sample, consisting of 313 firm-year observations, based on an institutional and stakeholder agency theoretical lens, we find a relationship between the different CFO compensation components and the CS performance. In particular, we find that the variable long-term compensation components pension compensation and stock compensation are positively related to CS performance. Our results suggest that for German DAX30 and MDAX firms, pension compensation and stock compensation play a vital role in their CS performance. In contrast, we do not find a statistically significant relationship between CFO fixed compensation CS performance. Overall, our results suggest that CFO long-term compensation components are positively related to the firm’s CS performance.
By that, our study provides new perspectives on the role of executive compensation and enhances initial research by considering the missing link from CFO compensation to CS. Therewith, our analyses provide new insights by investigating the connection between the different CFO compensation components and CS in German firms and illustrate that, in line with initial research on CEO compensation [2,3], variable long-term compensation indeed fosters CFO sustainability orientation. Based on these findings, we plead for a long-term variable compensation of CFOs to enhance CS.
The remainder of this paper is structured as follows. The second section provides the theoretical framework and the hypotheses development. In the third section, we present the research design. Afterward, we discuss descriptive statistics and regression results in the fourth section, followed by the conclusion in the fifth section.

2. Theoretical Framework and Hypotheses Development

2.1. Corporate Sustainability and CFO Compensation

Over the last years, a variety of different CS definitions have emerged. Some of these definitions understand CS as a mainly ecological concern [14] or as the firm’s social responsibility [15]. Others classify CS as the organizational concern about the natural and social environment, including corporate economic activities [16,17]. As there is no universal definition of CS, we rely on the definition by Berger et al. (2007). They describe CS as “the integration of social, environmental, and economic concerns into an organization’s culture, decision-making strategy, and operations” [18] (p. 133). Thereby, it is vital to CS that its activities go beyond legal requirements.
As CS is generally non-financial, it is hard to measure the outcomes of its activities, which in turn hinders its successful implementation. Also, investments into CS take time to show effect, which further increases the uncertainty of the outcome. Due to this time lag, investments into CS are considered riskier than other possible investment options [6,19,20]. Still, two different theoretical perspectives are explaining why CFOs engage in CS.
The first theory is the stakeholder-agent theory by Hill and Jones (1992) [21]. It gives two possible reasons for CFOs to invest in CS. First of all, executives (in our case, the CFO) and the shareholders may have differing interests. Due to executives having an information advantage compared to the shareholders, also called information asymmetries, the shareholders cannot ensure that executives act in their best interest. Executives could have contrary interests and put these above the shareholders’ interests, eventually leading to moral hazard. Moreover, the stakeholder-agent theory describes executives as agents of other stakeholder groups, including non-shareholders or non-controlling stakeholders. Thereby, executives are the only group of stakeholders that has direct control over the firm’s decision-making process. Therefore, as executives enter a contractual relationship with all stakeholders, they must make strategic decisions and allocate resources in the best interest of all stakeholders [21]. The stakeholders’ interests can relate to the economic, environmental, and social aspects of the firm’s performance [22,23]. To ensure that these interests are included in the context of strategic decision-making and resource allocation, the executives’ interests need to be aligned with the stakeholders’ interests [21,24]. This alignment of interests can be achieved by using an incentive-compatible management compensation system that includes sustainability aspects by the stakeholders [25]. Consequently, by linking the CFO compensation with the company’s performance, CFOs might be more encouraged to invest in CS to maximize their wealth and the firm’s performance simultaneously [26].
The second theory relevant in the examination of CFO compensation and CS refers to the institutional theory as proposed by Scott (2005) [27]. According to this theoretical lens, corporate legitimacy gives several economic and non-economic advantages like a lower risk of incurring legal or social sanctions and better access to resources [4]. To seize these advantages, firms need to protect or enhance their legitimacy, which is possible by meeting the expectations of institutions and stakeholders [27]. These economic and non-economic advantages might then improve the firms’ long-term financial performance [28]. However, legitimacy requires a long time to develop since building relationships with stakeholders and society takes time. Furthermore, additional time is needed to identify their expectations and to respond to those stakeholder needs and the norms of society [29]. Therefore, conditioning CFO compensation on the firm’s future financial performance might encourage the CFO to take actions that improve the relationships with stakeholders and society, including CS activities.

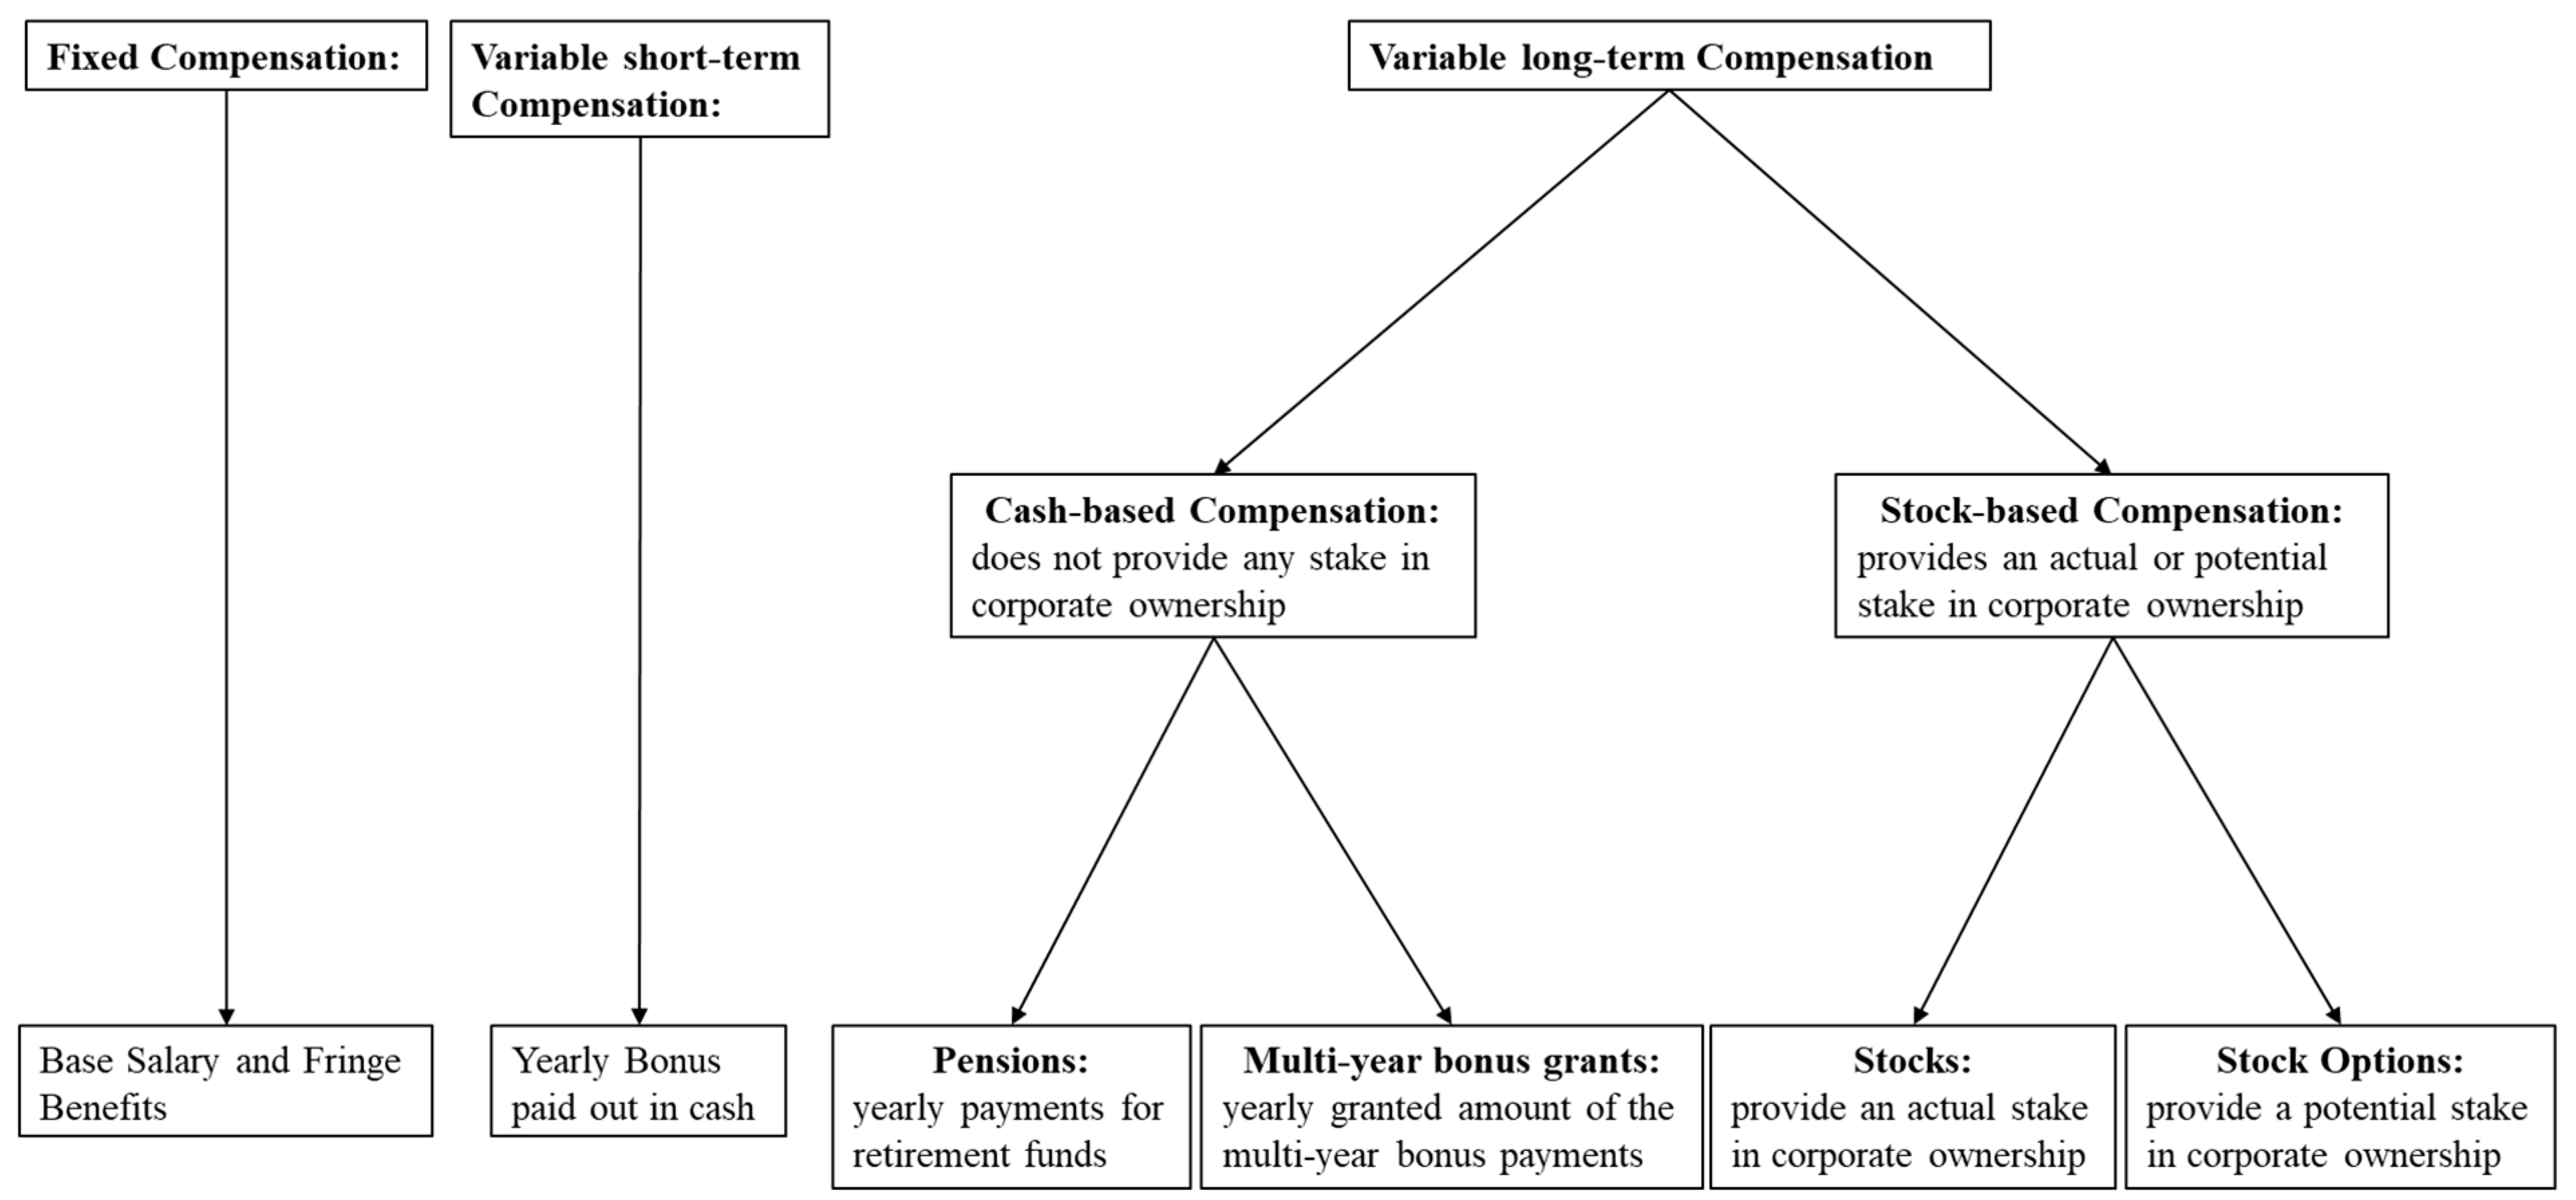
2.2. Classification of CFO Compensation Components and Hypotheses Development

CFO compensation at German firms can be split into three main compensation components: fixed, variable short-term, and long-term compensation. In Germany, firms pay the largest portion of executive compensation as fixed compensation [4]. Fixed compensation usually includes the annual base salary of the CFO and fringe benefits. Several studies are examining whether there is a positive [30] or a negative [31] relationship between CEO fixed compensation and CS. For CFO compensation, empirical evidence in connection with CS is still missing. After Gray and Cannella (1997), with fixed compensation, executives should be able to avoid damage from uncontrollable factors like market or industry shocks [30]. Furthermore, according to Hossain and Monroe (2015), fixed compensation is not significantly affected by short- or long-term performances [32]. Also, there are no prior studies to draw on further considerations. Therefore, we predict that CFO fixed compensation is not related to the firm’s CS performance.
Hypothesis 1.
CFO fixed compensation is not related to the firm’s CS performance.
Variable compensation can be divided into short-term and long-term compensation. Short-term compensation usually rewards executives once a year according to the degree to which the CFO has achieved specific predetermined targets successfully. Short-term compensation is focused on short-term benefits, which are generally in accordance with the firm’s growth. This bonus is often paid out in cash or stock and is based on individual, group, or corporate performance [33]. As variable short-term compensation focuses on short-term financial objectives, the CFO could divert resources from CS [3]. Also, CS strategies require an engagement of several years to take effect and only return benefits after a rather long time period [6]. Therefore, investing in CS projects might harm the short-term performance of a firm because the resources of a firm could be invested in different areas [34]. For this reason, we expect to find a negative connection between CFO variable short-term compensation and the firm’s CS performance.
Hypothesis 2.
CFO variable short-term compensation is negatively related to the firm’s CS performance.
Most firms reward their executives with compensation packages that include one or more long-term components. These components are calculated on long-term performance for periods between 2 and 5 years [33]. Two main reasons for firms to provide long-term compensation to their executives exist. First, by increasing the cost of leaving, firms want to bind executives to them [35]. Second, long-term compensation should help to accumulate resources and invest in activities that are more likely to get a future competitive advantage [30]. Therefore, firms use long-term incentives such as stock options, long-term cash bonuses, phantom stocks, and restricted stocks. To distinguish those different long-term compensation instruments, we use our classification inspired by the given data of Beck et al. (2020) [13] and the classification by Claassen and Ricci (2015) [4]. This subdivision of long-term compensation allows us to determine four different long-term compensation types: pension compensation, multi-year bonus compensation, stock compensation, and stock option compensation. Together with fixed compensation and short-term compensation, we distinguish between six different compensation components (Figure 1).
In our study, the variable long-term compensation is divided into two types of compensation: cash-based compensation and stock-based compensation. Cash-based compensation does not include any stake in corporate ownership, while stock-based compensation provides an actual or potential stake in corporate ownership [4]. Following Beck et al. (2020), compensation can also be defined as stock-based compensation if its performance measures are only based on the firm’s stock [13]. Furthermore, in contrast to variable short-term compensation incentives, long-term compensation, independent of the compensation component, should focus the CFO’s attention on long-term strategies with long-term objectives and, therefore, also on CS. Also, Hart (1995) states that firms committing themselves to CS activities have a higher chance of experiencing worse short-term but better long-term performance than their competition [34].
The cash-based compensation is split into annual payments toward the retirement funds and multi-year bonus payments. The yearly payments toward the retirement funds are usually called pension payments. The firm usually provides these payments following a defined contribution plan. According to this plan, a specific contribution, amounting to a given percentage of the CFO’s fixed salary, is granted annually to the CFO’s pension account. When retiring or if the CFO is unable to continue with their duties for other reasons such as illness, the cumulated amount is paid to the CFO over a certain time frame [13]. Thus, pension compensation is primarily dependent on fixed compensation and the CFO’s contribution. As we suspect that fixed compensation should not be related to the firm’s CS performance, accordingly, we expect that pension compensation should also not be related to the firm’s CS performance.
Hypothesis 3.
CFO pension compensation is not related to the firm’s CS performance.
The multi-year bonus payments depend on the performance over 2 or more years. In the beginning, a certain number of weighted performance criteria oriented toward the firm’s sustainable growth is defined. Also, the corresponding amount granted to the executive in the case of achieving one of the defined targets will be specified initially. At the end of the period, the cumulated amount is paid to the executive. As we are not interested in the payment at the end of the period but the yearly payments for achieving one or more of the defined sustainable long-term performance criteria, we use the granted amount of the multi-year bonus payments collected by Beck et al. (2020) instead [13]. Using the granted amount per year, we measure the granted amount over a single year and not over 2 or more years. As the criteria for these payments are sustainability-oriented, the CFO should be encouraged to invest in long-term initiatives, like CS investments, and not act short-sightedly [4]. As a result, we expect a positive relationship between multi-year bonus compensation and the firm’s CS performance.
Hypothesis 4.
CFO multi-year bonus compensation is positively related to the firm’s CS performance.
Stock-based compensation can be further divided into stock and stock options. Both stock-based compensations are also multi-year compensations. Almost every year, a firm grants a specified quantity of stocks or stock options to its executives for a certain time frame. The time frame differs from 3 to 5 years, depending on the firm, and the amount of the granted stocks or stock options depends on one or more specified performance objectives. The value of these stocks or stock options is contingent on the firm’s end-of-year stock price [2,36]. Stock compensation provides an actual stake in corporate ownership in the form of stocks [4]. Also, stock-based compensation usually includes a vesting period of several years where the executives can only sell the stock or stock options when they meet specific performance criteria [13]. The use of stocks containing the transfer of ownership to the CFO as a compensation measure (stock compensation) might encourage the CFO to be more risk-averse [4]. Therefore, the CFO may be less likely to invest in CS projects as these tend to be associated with substantial cash outflows (e.g., for pollution control), eventually making them economically unattractive and thus risky [37]. On the other hand, however, the CFO’s reputation may be tied to the firm if the CFO has a significant stake in corporate ownership. Consequently, the CFO may be motivated to engage in more sustainable, responsible behavior and invest more in CS activities [4]. As these contrasting predictions exist, we expect a relationship between stock compensation and the firm’s CS performance, but cannot make a directional hypothesis.
Hypothesis 5.
CFO stock compensation is related to the firm’s CS performance.
In contrast, stock option compensation provides only a potential stake in corporate ownership in the form of granted stock options. They are not real stocks but give the executive the right to purchase the specified, granted amount of firm stocks at a specified price for a limited time [36]. As the use of stock options as a means of compensation may reduce the CFO’s risk aversion, the CFO should be more likely to invest in risky projects that would be rejected otherwise [4]. For example, Sanders and Hambrick (2007) support the claim that stock option compensation has a positive relationship with higher levels of investments that require a commitment of several years [38]. As CS investments fall under this category, we predict a positive relationship between the CFO’s stock option compensation and the firm’s CS performance.
Hypothesis 6.
CFO stock option compensation is positively related to the firm’s CS performance.

3. Materials and Methods

3.1. Data and Sample Selection

To test our hypotheses, we use the given CFO compensation components data from the database of Beck et al. (2020), which is handpicked from annual reports of German DAX30 and MDAX firms for the business years 2014–2018 [13]. Furthermore, we handpicked CFO tenure data from annual reports of the same German DAX30 and MDAX firms for the same time frame. CS data is acquired from the Thomson Reuters Datastream Asset4 database for the business years 2015–2019 to allow for a possible lagged impact of CFO compensation on the firm’s CS performance. In our analyses, we use Datastream ESG data obtained in early October 2020. Financial data is acquired from the Thomson Reuters Worldscope database for the business years 2014–2018.
As shown in Table 1, our initial sample consists of 100 firms and 500 firm-year observations. Missing ESG data reduces the number of firm-year observations to 459. Moreover, we exclude firm-year observations where a CFO change occurred because the values for those years differ too much from the regular year. By omitting these observations, we shorten our firm-year observations to 419. Furthermore, by subtracting missing firm, compensation, and pension data, our sample is reduced to 316 firm-year observations. After excluding firm-year observations where the pension compensation is negative, our final sample size consists of 313 firm-year observations.

3.1.1. Main Variables

As the dependent variable, we measure CS using the ESG Score provided by the Asset4 ESG framework of the Thomson Reuters Datastream database. It defines the ESG Score as “an overall company performance score based on the self-reported information in the environmental, social, and corporate governance pillars” [39]. The total ESG Score is an aggregated value of corporate performance in several environmental, social, and governmental categories. To capture the relationship between CFO compensation and CS, we use the 1-year lagged ESG Score, which means we regress CFO compensation data of the current year on CS data of the subsequent year.
As described in Section 2, we classify the CFO compensation as the main independent variable and its components into fixed compensation, variable short-term compensation, pension compensation, multi-year-bonus compensation, stock compensation, and stock option compensation. The data used for all compensation components are extracted from the Beck et al. (2020) database [13]. To test our first hypothesis, we need the level of fixed compensation, which is calculated by adding the salary and the corresponding fringe benefits together in absolute terms (fixed compensation). Regarding our second hypothesis, which proposes variable short-term compensation to be related to the firm’s CS, we include the absolute value of the CFO variable short-term compensation (ST compensation). Based on the theoretical framework we developed in Section 2, we examine the relationship between the CFO pension compensation and CS (Hypothesis 3). Beck et al. (2020) measured pension compensation by using the yearly contributions to CFO’s pension accounts [13]. We utilize the absolute values of the CFO pension contributions for this analysis (Pensions). To test our fourth hypothesis, we need the multi-year bonus compensation, which Beck et al. (2020) defined as the yearly granted amount from a multi-year bonus [13]. Our analysis includes a variable that measures the CFO’s absolute value for multi-year bonus grants compensation in the regression model (Bonus grants). To investigate the relationship between the CFO stock-based compensation and CS (Hypothesis 5), we use the absolute value of collected CFO stock-based compensation by Beck et al. (2020), which is based on the value on the grant date (Stocks) [13]. In Section 2, we also hypothesized about the relationship between the CFO stock option-based compensation and CS (Hypothesis 6). To test this hypothesis, we use the absolute value of the CFO stock option compensation (Stock options). For the valuation of stock options, Beck et al. (2020) also relied on the value of stock options on the grant date [13].

3.1.2. Controls

In line with the extant literature [2,6], we use variables to control for financial, performance, and corporate governance aspects that are potential drivers of CFO compensation.
Generally, it is expectable that better-performing firms can provide better CS. Therefore, we use the firm’s performance as a control variable. The firm’s performance in our study is proxied by the accounting-based measure ROA. Following other studies, ROA is the ratio of net income to total assets [40,41].
According to Mehran (1995), another way to measure the firm’s performance is to include a market-based performance measure [42]. Hence, following other literature [40,41,43], we include Tobin’s Q as another performance variable to control for market-based performance. Tobin’s Q is measured in the finance and accounting literature by comparing the market value of the firm’s assets and its replacement value, thus, comparing the market value of the firm’s equity and liabilities with its corresponding book values [43].
Since the ESG score has not been primarily focused on in past research, we also decided to use relevant corporate governance control variables analogous to similar studies focusing on CS. In previous studies, mixed results have been found for the relationship between CEO compensation and CEO tenure. While Hill and Phan (1991) found that increasing CEO tenure lowers compensation [44], Thomas and Simerly (1994) reported a positive relationship between CEO tenure and CEO compensation [5]. Therefore, CFO tenure may also correlate with CFO compensation. Thus, as a third control variable, we use CFO tenure. CFO tenure is defined as the time in years a person has worked for the examined firm in this specific management position (Tenure).
As a fourth control variable, we use the firm’s leverage. Mishra and Modi (2013) found that financial leverage is significantly negatively correlated to CS, making it also relevant to our study [45]. Here, we define the firm’s leverage as the ratio of total debt to common equity (Debt).
Stanwick and Stanwick (2001) detected that the firm’s size has a positive effect on CS [31]. Therefore, we control for it by including the revenue of a firm as our fifth control variable (Size). We measure it as the number of total sales of a firm. Also, we use the natural logarithm of total sales following other studies to smooth large outliers [2,6,40].
Since prior research has suggested that the firm’s performance may vary according to the industry, we also control for industry-fixed effects [1,2,5]. Therefore, we include specified dummy variables based on first-level Standard Industrial Classification (SIC) divisional classifications. According to this classification, industries include mining, construction, manufacturing, transportation and related services, wholesale trade, retail trade, finance and related industries, services, and public administration divisions [6]. We exclude the sectors mining and public administration for our study because none of our firms are categorized as such. The remaining categories are combined into three different grouped classification categories, namely construction and manufacturing, transportation and related services (also including other services), and finance and related industries (including wholesale and retail trade), due to the small number of firms for each category in our sample.

3.2. Research Methodology

We use six different mixed-effects panel data regression models for testing our six hypotheses, respectively. Based on a mixed-effects approach, we conduct the analyses with random effects but still include dummy variables for industry fixed effects following prior research [1,2,5]. We also include year indicator variables in our regression models to control for possible time trends. Accordingly, we estimate the following six linear mixed-effects models:
ESG   Score it + 1 = β 0 + β 1 Fixed   compensation it + β 2 ROA it + β 3 Tobin s   Q it + β 4 Tenure it + β 5 Debt it + β 6 Size it + β 7 Ind 1 it + β 8 Ind 2 it + μ t + a i + ε it
ESG   Score it + 1 = β 0 + β 1 ST   compensation it + β 2 ROA it + β 3 Tobin s   Q it + β 4 Tenure it + β 5 Debt it + β 6 Size it + β 7 Ind 1 it + β 8 Ind 2 it + μ t + a i + ε it
ESG   Score it + 1 = β 0 + β 1 Pensions it + β 2 ROA it + β 3 Tobin s   Q it + β 4 Tenure it + β 5 Debt it + β 6 Size it + β 7 Ind 1 it + β 8 Ind 2 it + μ t + a i + ε it
ESG   Score it + 1 = β 0 + β 1 Bonus   grants it + β 2 ROA it + β 3 Tobin s   Q it + β 4 Tenure it + β 5 Debt it + β 6 Size it + β 7 Ind 1 it + β 8 Ind 2 it + μ t + a i + ε it
ESG   Score it + 1 = β 0 + β 1 Stocks it + β 2 ROA it + β 3 Tobin s   Q it + β 4 Tenure it + β 5 Debt it + β 6 Size it + β 7 Ind 1 it + β 8 Ind 2 it + μ t + a i + ε it
ESG   Score it + 1 = β 0 + β 1 Stock   options it + β 2 ROA it + β 3 Tobin s   Q it + β 4 Tenure it + β 5 Debt it + β 6 Size it + β 7 Ind 1 it + β 8 Ind 2 it + μ t + a i + ε it

4. Results

4.1. Descriptive Statistics

In Table 2, the descriptive statistics for the dependent, independent, and control variables used in the models are shown. The variable ESG Score, which measures CS, can take values ranging from 0 to 100. In our dataset, this variable’s mean (median) value is 63.31 (68.49), while the variable’s minimum is a score of 16.16, and the variable’s maximum score is 94.8. This result shows that even though the ESG score may vary depending on the firm, the examined firms generally invest in social, economic, and governmental concerns and potentially achieve a higher ESG performance.
All of our independent variables are reported as absolute values. The median value of every CFO compensation component (694,518 €; 583,542 €; 281,668 €; 273,826 €; 421,872 €; 84,871 €) is below the respective mean value (672,000 €; 440,000 €; 250,000 €; 96,000 €; 200,000 €; 0 €). Also, fixed compensation has a minimum value of 57,000 € while every other compensation component has a minimum value of 0 €. In contrast, the maximum values for the compensation components are 2.524 million € for fixed compensation, 3.469 million € for short-term compensation, 1.918 million € for pension compensation, 2.338 million € for multi-year bonus compensation, 2.476 million € for stock compensation, and 3.830 million € for stock option compensation. This variation between the lowest and the highest value for every compensation component biases the mean value of the respective compensation component upwards. Additionally, we included the compensation components’ variables as a percentage of the total compensation into our descriptive statistics to derive some information about how CFO compensation is structured for our sample of firms. As seen in Table 2, fixed compensation represents on average 34% of the CFO total compensation, which is the largest part of CFO compensation. It is followed by variable short-term compensation with a mean of 25%. In contrast, stock compensation, multi-year bonus compensation, pension compensation, and stock option compensation represent, respectively, on average 15%, 12%, 11%, and 3%of total compensation. There is a large variety in the CFO compensation structure. Some CFOs receive up to 82%of their total compensation as fixed compensation, while others receive 74% of their total compensation as short-term variable compensation. This result of both compensation types representing the largest part of total compensation for German DAX and MDAX firms, is consistent with other studies focusing on executive compensation structure in Germany [3,4,13]. However, in our sample of German DAX30 and MDAX firms, some CFOs also receive at least 60% of their total compensation as long-term variable compensation. For example, the CFO of Zalando SE received, in 2018, 95% of his total compensation as long-term variable compensation in the form of stock option compensation.
Table 3 shows the correlation test results between all variables of our models, meaning the ESG Score, the different compensation components, and our control variables. According to Kennedy (2003), two variables may cause multicollinearity problems if they are correlated at x > 0.8 [46]. As Table 3 shows, all positive and negative correlations are smaller than 0.8. The highest positive significant correlations are found with the natural logarithm of the firm’s total sales in connection with the ESG Score (0.612) and fixed compensation (0.491). Furthermore, significant relationships between the ESG Score and fixed compensation (0.415), short-term compensation (0.265), pension compensation (0.489), and stock compensation (0.385) exist. Given some of our variables’ correlation results, we calculated the Variance Inflation Factors (VIFs) to further check for multicollinearity. According to Kennedy (2003), severe multicollinearity problems may occur if the VIF is higher than 10 [46]. However, as no VIF in our data is higher than 1.78, multicollinearity should not affect our results.
To ensure that the found relationships between CFO compensation components and CS performance from the regression analyses are detected correctly, we determined the statistical power of the analyses by testing the goodness of fit indicators (R2) of respective models with an F-test and computing the power of the test statistics. Therefore, based on the sample size, it is determined how much of the variance is explained by respective variables and, accordingly, how these contribute to answering the research question. Low statistical power of the R2 indicates that the examined variable does not add much value to the analysis and should be omitted. According to the literature, the used test’s statistical power must be above 80% to ensure the correct detection of the examined relations [47]. We estimated our regression analyses’ power and found different results (Table 4). For fixed compensation, pension compensation, and stock compensation, our analyses had a power of 0.88, 0.99, and 0.98, respectively, which means they have enough power to detect the relations examined. Hence, our results for these variables have a high degree of certainty to be correct. In contrast, our analyses did not have enough power to detect the relations examined for short-term compensation (0.16) and stock option compensation (0.19). As a result, we excluded these two analyses from our study. Furthermore, the power of our analysis, which investigates the relationship between multi-year bonus compensation and CS performance, could not be measured, as the difference between the R2 for the full model and the reduced model was negative. This means that the model consisting of only control variables (reduced model) can explain more variance of CS performance than the model composed of multi-year bonus compensation and control variables (full model). A possible reason for this phenomenon is that the variable multi-year bonus compensation might act as a suppressor variable for our sample. Therefore, we also excluded the analysis, investigating the relationship between CS performance and multi-year bonus compensation from our study.

4.2. Mixed-Effects Regression Results

In this part, we evaluate the relationship between the three remaining CFO compensation components and the lagged ESG Scores through mixed-effects regression analyses.
When using normal Ordinary Least Squares (OLS) regressions, we detected a heteroscedasticity problem (p < 0.05) for all of our models by using the Breusch-Pagan post estimation test. To fix this heteroscedasticity problem we used OLS regressions with robust standard errors ((1) F = 29.95; (2) F = 35.09; (3) F = 33.35, p < 0.01 for all models). To check for omitted variables, we conducted a Ramsey Reset test, which indicated no omitted variables (p > 0.05) for all models. As already outlined, using the VIF and getting no value higher than 1.78 with the cut-off value of 10 [46], we ensured that the models probably do not suffer from multicollinearity.
Since our given data are panel data, we also carried out panel regression analyses for our three remaining models. By using the Hausman test to check which model (with fixed- or random-effects) fits better to our data, we found that the model with random-effects fits better (p > 0.05). Furthermore, we conducted the Breusch-Pagan Lagrange multiplier test to decide if we should base our analyses on the OLS regressions or the random effects regressions for our data. Thereafter, random-effects regression analyses are more appropriate for our different models (p < 0.05). Therefore, we based our analysis on a random-effects estimation.
Table 5 shows the results of our three mixed-effects models analyzing the relationships between the different CFO compensation components and the firm’s CS performance (Hypotheses 1, 3, and 5). Our first hypothesis assumed that CFO fixed compensation would not be related to the firm’s CS performance. As Table 5 shows, CFO fixed compensation does not have a significant relationship with the firm’s CS performance, which is in line with our initial hypothesis. Our insignificant finding indicates that we cannot associate fixed compensation with higher or lower CS activities. In our third hypothesis, we suspected that CFO pension compensation would not be related to the firm’s CS performance. Table 5 shows that our data does not support this hypothesis and that the CFO pension compensation is positively related to the firm’s CS performance. The highly significant, positive coefficient for CFO pension compensation supports the assumption that a higher pension compensation is related to a firm’s higher CS performance. Finally, our fifth hypothesis investigated the relationship between CFO stock compensation and the firm’s CS performance. As seen in Table 5, there is a significant positive relationship between the stock compensation and the firm’s CS performance. This result suggests that CFOs who receive more stock compensation might tie their reputation to the firm through the increasing stakes in corporate ownership, thus motivating them to invest more in CS activities to improve the firm’s reputation.

5. Discussion

5.1. Contributions to Research and Practice

The purpose of this empirical analysis was to examine the relationship between CFO compensation and CS performance for the German DAX30 and MDAX firms. Concerning compensation, CS research is mainly focused on executive compensation in general or on CEO compensation. As there is not much research on the relationship between CFO compensation and CS performance, we investigated the extent to which previous findings of similar executive and CEO compensation studies can be applied to CFO compensation. Stakeholder-agent theory suggests that stakeholders should rely on compensation incentives that align with the stakeholders’ economic, environmental, and social interests to reduce agency conflicts and, consequently, minimize the stakeholders’ utility loss [44,48]. As decisions about engaging in CS are usually associated with uncertainty, compensation incentives might have a crucial impact on the decision-making [6]. According to institutional theory, recognizing and satisfyingly responding to the expectations of stakeholders and society while maintaining or gaining social legitimacy can positively influence the firm’s long-term financial performance [28,29]. As a result, conditioning the CFO compensation on the future financial performance might give the CFO a motivation to invest in CS actions to boost legitimacy. Relying on stakeholder-agent theory and institutional theory, we hypothesized a relationship between CFO compensation structure and CS performance.
To test this relationship and identify the relevant CFO compensation components, we used the CFO compensation and CS data of German DAX30 and MDAX firms to carry out random-effects panel data regression analyses, including industry fixed effects. Even though we had to exclude our regression results for CFO short-term compensation, multi-year bonus compensation, and stock option compensation, our remaining regression results support the hypothesis that CFO compensation components relate to a firm’s CS performance.
As seen in our regression results, different CFO compensation components are differently related to the firm’s CS performance. We found no significant relationship between the firm’s CS performance and CFO fixed compensation. The estimated statistical power of this insignificant relation between CFO fixed compensation and the firm’s CS performance that we discovered was 88%. The high statistical power indicates that this analysis has a high chance to detect the relation examined correctly. Our result supports the assumption that CFO fixed compensation is not significantly related to the firm’s CS performance. This result might be explainable due to two conflicting considerations. On the one hand, a high level of fixed compensation might support managerial hubris. By that, the chance that CFOs act following the interests of stakeholders decreases, which means that they are less willing to invest in CS [4]. On the other hand, a high level of fixed compensation may tie executives to the firm. This way, CFOs may try to act more socially responsible to improve the firm’s reputation [30]. Therefore, as long as CFO fixed compensation is not dependent on long-term performances, it might not give the CFO enough incentives to invest in CS activities. Additionally, our regression results showed a significant positive relationship between CFO pension compensation and the firm’s CS performance. This unexpected result contradicts our initial hypothesis and has a statistical power of 99%, making it very likely that we detected the relation examined correctly. Most other studies investigating executive compensation in connection with CS excluded pension compensation due to the lack of data [49]. Nevertheless, a possible explanation for our result might be that when receiving pension compensation, the CFO is promised to receive a certain pension amount when retiring [46]. Pension compensation is primarily dependent on fixed compensation and the CFO’s contribution to the firm [6]. As fixed compensation is not dependent on short- or long-term performances, CFOs can only raise their future pension amount by increasing their contributions. These contributions might be related to long-term objectives that require investments in long-term activities, like CS activities. Consequently, CFOs might be motivated to invest more in CS activities to improve the firm’s CS performance and increase their pension amount at the same time.
Previous studies investigated the relationship between the firm’s CS performance and executive stock compensation and stock option compensation mostly together as long-term compensation and not separately as we did [7,28,50]. We found a significant positive relationship between CFO stock compensation and the firm’s CS performance. This result has a statistical power of 98%, which makes it very likely that we detected the relation examined correctly. Also, it supports our assumption that giving stocks with a vesting period of several years to the CFO as a compensation measure might tie the CFO to the firm through the increasing stakes in corporate ownership [5,46]. Consequently, the CFO might be motivated to invest more in CS activities to improve the firm’s reputation.
These findings enrich the ongoing academic discussion on how to compensate executives properly to foster CS [3,42]. Targeting CFOs as salient executives with responsibility for budgets and investments, we provide evidence that their compensation is indeed relevant in the determination of CS and that long-term compensation components suit better to align CFO activities with the CS interests of the stakeholders.
In practical terms, our results suggest that of all the different compensation components, pension compensation and stock compensation provide the CFOs of German DAX30 and MDAX firms with the most incentives to invest in CS performance. Thus, firms might achieve higher scores in CS performance by rewarding their CFOs with higher levels of pension and stock compensation.

5.2. Limitations and Research Recommendations

Despite having derived findings with high statistical power, we first scrutinize the direction of the relationship between CFO compensation components and CS performance. We conjecture that the statistical relationship can go both ways and not only the one way described in our study. Thus, the results need to be interpreted with caution regarding causal inferences.
Second, our sample size is rather small and limited to German-listed firms, granting our findings limited generalizability. In that sense, our results might not be used to conclude other types of firms, such as smaller non-listed firms. Therefore, we suggest future research to conduct longitudinal studies of a cross-country dataset while controlling for country fixed-effects to enhance the generalizability of our findings.
Third, we critically acknowledge that investments into CS might need more than a year to take effect. Thus, by using 1-year lagged ESG data, only some of the relations between CFO compensation and CS performance might be captured and, eventually, a longer time frame might be needed to capture long-term CS initiatives, including a time lag of multiple years.
Fourth, we posit that we had to exclude our results for short-term compensation, multi-year bonus compensation, and stock option compensation from the analysis as the statistical power value of those three analyses was relatively low or even not measurable. Hence, future research should examine more extensive data sets, which cover a larger number of firms over an extended period, to gain insights into these three compensation components and test the robustness of our results for fixed compensation, pension compensation, and stock compensation.

Author Contributions

Conceptualization, M.P., Y.D.B. and R.L.; methodology, M.P., Y.D.B. and R.L.; analysis, M.P., Y.D.B. and R.L.; investigation, M.P., Y.D.B. and R.L.; writing—original draft preparation, M.P.; writing—review and editing, M.P., Y.D.B. and R.L. All authors have read and agreed to the published version of the manuscript.

Funding

This research received no external funding.

Institutional Review Board Statement

Not applicable.

Informed Consent Statement

Not applicable.

Data Availability Statement

The data presented in this study are available on request from the corresponding author.

Conflicts of Interest

The authors declare no conflict of interest.

References

  1. Ho, F.N.; Wang, H.-M.D.; Vitell, S.J. A global analysis of corporate social performance: The effects of cultural and geographic environments. J. Bus. Ethics 2012, 107, 423–433. [Google Scholar] [CrossRef]
  2. Mahoney, L.S.; Thorn, L. An examination of the structure of executive compensation and corporate social responsibility: A Canadian investigation. J. Bus. Ethics 2006, 69, 149–162. [Google Scholar] [CrossRef]
  3. McGuire, J.; Dow, S.; Argheyd, K. CEO incentives and corporate social performance. J. Bus. Ethics 2003, 45, 341–359. [Google Scholar] [CrossRef]
  4. Claasen, D.; Ricci, C. CEO compensation structure and corporate social performance: Empirical evidence from Germany: CEO-Vergütungsstrukturen und Corporate Social Performance. Eine empirische Untersuchung deutscher Unternehmen. Die Betr. 2015, 75, 327–343. [Google Scholar]
  5. Thomas, A.S.; Simerly, R.L. The Chief Executive Officer and corporate social performance: An interdisciplinary examination. J. Bus. Ethics 1994, 13, 959–968. [Google Scholar] [CrossRef]
  6. Deckop, J.R.; Merriman, K.K.; Gupta, S. The effects of CEO pay structure on corporate social performance. J. Manag. 2006, 32, 329–342. [Google Scholar] [CrossRef]
  7. Indjejikian, R.; Matejka, M. CFO fiduciary responsibilities and annual bonus incentives. J. Account. Res. 2009, 47, 1061–1093. [Google Scholar] [CrossRef]
  8. Chava, S.; Purnanandam, A. CEOs versus CFOs: Incentives and corporate policies. J. Financ. Econ. 2010, 97, 263–278. [Google Scholar] [CrossRef]
  9. Jiang, J.; Petroni, K.R.; Yanyan Wang, I. CFOs and CEOs: Who have the most influence on earnings management? J. Financ. Econ. 2010, 96, 513–526. [Google Scholar] [CrossRef]
  10. Burkert, M.; Lueg, R. Differences in the sophistication of value-based Management—The role of top executives. Manag. Account. Res. 2013, 24, 3–22. [Google Scholar] [CrossRef]
  11. Kutzschbach, J.; Tanikulova, P.; Lueg, R. The role of top managers in implementing corporate sustainability—A systematic literature review on small and medium-sized enterprises. Adm. Sci. 2021, 11, 44. [Google Scholar] [CrossRef]
  12. Caglio, A.; Dossi, A.; van der Stede, W.A. CFO role and CFO compensation: An empirical analysis of their implications. J. Account. Public Policy 2018, 37, 265–281. [Google Scholar] [CrossRef]
  13. Beck, D.; Friedl, G.; Schäfer, P. Executive compensation in Germany. J. Bus. Econ. 2020, 90, 787–824. [Google Scholar] [CrossRef] [Green Version]
  14. Shrivastava, P.; Hart, S. Creating sustainable corporations. Bus. Strat. Env. 1995, 4, 154–165. [Google Scholar] [CrossRef]
  15. Carroll, A.B. Corporate social responsibility. Bus. Soc. 1999, 38, 268–295. [Google Scholar] [CrossRef]
  16. Dyllick, T.; Hockerts, K. Beyond the business case for corporate sustainability. Bus. Strat. Environ. 2002, 11, 130–141. [Google Scholar] [CrossRef]
  17. van Marrewijk, M. Concepts and definitions of CSR and corporate sustainability: Between agency and communion. J. Bus. Ethics 2003, 44, 95–105. [Google Scholar] [CrossRef]
  18. Berger, I.E.; Cunningham, P.H.; Drumwright, M.E. Mainstreaming corporate social responsibility: Developing markets for virtue. Calif. Manag. Rev. 2007, 49, 132–157. [Google Scholar] [CrossRef]
  19. Lueg, R.; Pesheva, R. Corporate sustainability in the Nordic countries—The curvilinear effects on shareholder returns. J. Clean. Prod. 2021, 315, 127962. [Google Scholar] [CrossRef]
  20. Lueg, K.; Krastev, B.; Lueg, R. Bidirectional effects between organizational sustainability disclosure and risk. J. Clean. Prod. 2019, 229, 268–277. [Google Scholar] [CrossRef]
  21. Hill, C.W.L.; Jones, T.M. Stakeholder-Agency theory. J. Manag. Stud. 1992, 29, 131–154. [Google Scholar] [CrossRef]
  22. Elkington, J. Cannibals with Forks: The Triple Bottom Line of 21st Century Business; Reprint; Capstone: Oxford, UK, 2002; ISBN 1841120847. [Google Scholar]
  23. Lozano, R. Envisioning sustainability three-dimensionally. J. Clean. Prod. 2008, 16, 1838–1846. [Google Scholar] [CrossRef]
  24. Kock, C.J.; Santaló, J.; Diestre, L. Corporate governance and the environment: What type of governance creates greener companies? J. Manag. Stud. 2012, 49, 492–514. [Google Scholar] [CrossRef]
  25. Lueg, R.; Radlach, R. Managing sustainable development with management control systems: A literature review. Eur. Manag. J. 2016, 34, 158–171. [Google Scholar] [CrossRef]
  26. Coombs, J.E.; Gilley, K.M. Stakeholder management as a predictor of CEO compensation: Main effects and interactions with financial performance. Strat. Mgmt. J. 2005, 26, 827–840. [Google Scholar] [CrossRef]
  27. Scott, W.R. Contributing to a Theoretical Research Program. In Great Minds in Management: The Process of Theory Development; Reprinted; Smith, K.G., Hitt, M.A., Eds.; Oxford Univ. Press: Oxford, UK, 2005; pp. 460–484. ISBN 9780199276820. [Google Scholar]
  28. Berrone, P.; Gomez-Mejia, L.R. Environmental performance and executive compensation: An integrated agency-institutional perspective. AMJ 2009, 52, 103–126. [Google Scholar] [CrossRef]
  29. Donaldson, T.; Preston, L.E. The stakeholder theory of the corporation: Concepts, evidence, and implications. AMR 1995, 20, 65–91. [Google Scholar] [CrossRef] [Green Version]
  30. Gray, S.R.; Cannella, A.A., Jr. The role of risk in executive compensation. J. Manag. 1997, 23, 517–540. [Google Scholar] [CrossRef]
  31. Stanwick, P.A.; Stanwick, S.D. CEO compensation: Does it pay to be green? Bus. Strat. Env. 2001, 10, 176–182. [Google Scholar] [CrossRef]
  32. Hossain, S.; Monroe, G.S. Chief financial officers’ short- and long-term incentive-based compensation and earnings management. Aust. Account. Rev. 2015, 25, 279–291. [Google Scholar] [CrossRef]
  33. Balsam, S. An Introduction to Executive Compensation; Academic Press: San Diego, CA, USA, 2002; ISBN 9780080490427. [Google Scholar]
  34. Hart, S.L. A natural-resource-based view of the firm. AMR 1995, 20, 986. [Google Scholar] [CrossRef] [Green Version]
  35. Kole, S.R. The complexity of compensation contracts. J. Financ. Econ. 1997, 43, 79–104. [Google Scholar] [CrossRef]
  36. Jensen, M.C.; Murphy, K.J. Performance pay and top-management incentives. J. Political Econ. 1990, 98, 225–264. [Google Scholar] [CrossRef]
  37. Rees, W.; Rodionova, T. The influence of family ownership on corporate social responsibility: An International analysis of publicly listed companies. Corp. Gov. Int. Rev. 2015, 23, 184–202. [Google Scholar] [CrossRef]
  38. Sanders, W.G.; Hambrick, D.C. Swinging for the fences: The effects of ceo stock options on company risk taking and performance. AMJ 2007, 50, 1055–1078. [Google Scholar] [CrossRef]
  39. Thomson Reuters. Asset4 ESG Data Glossary. Available online: http://extranet.datastream.com/data/ASSET4%20ESG/Index.htm (accessed on 27 February 2020).
  40. Callan, S.J.; Thomas, J.M. Executive compensation, corporate social responsibility, and corporate financial performance: A multi-equation framework. Corp. Soc. Responsib. Environ. Manag. 2011, 18, 332–351. [Google Scholar] [CrossRef]
  41. Karim, K.; Lee, E.; Suh, S. Corporate social responsibility and CEO compensation structure. Adv. Account. 2018, 40, 27–41. [Google Scholar] [CrossRef]
  42. Mehran, H. Executive compensation structure, ownership, and firm performance. J. Financ. Econ. 1995, 38, 163–184. [Google Scholar] [CrossRef]
  43. Choi, J.; Wang, H. Stakeholder relations and the persistence of corporate financial performance. Strat. Manag. J. 2009, 30, 895–907. [Google Scholar] [CrossRef]
  44. Hill, C.W.L.; Phan, P. CEO tenure as a determinant of CEO pay. AMJ 1991, 34, 707–717. [Google Scholar] [CrossRef]
  45. Mishra, S.; Modi, S.B. Positive and negative corporate social responsibility, financial leverage, and idiosyncratic risk. J. Bus. Ethics 2013, 117, 431–448. [Google Scholar] [CrossRef]
  46. Kennedy, P. A Guide to Econometrics, 5th ed.; MIT Press: Cambridge, MA, USA, 2003; ISBN 0262112809. [Google Scholar]
  47. Cohen, J. Statistical Power Analysis for the Behavioral Sciences, 2nd ed.; Erlbaum: Hillsdale, NJ, USA, 1988; ISBN 9781134742707. [Google Scholar]
  48. Eisenhardt, K.M. Agency Theory: An assessment and review. AMR 1989, 14, 57. [Google Scholar] [CrossRef]
  49. Cadman, B.; Vincent, L. The role of defined benefit pension plans in executive compensation. Eur. Account. Rev. 2015, 24, 779–800. [Google Scholar] [CrossRef]
  50. Al-Shaer, H.; Zaman, M. CEO compensation and sustainability reporting assurance: Evidence from the UK. J. Bus. Ethics 2019, 158, 233–252. [Google Scholar] [CrossRef] [Green Version]
Figure 1. Classification of the different compensation components. Figure 1 classifies the CFO compensation components and outlines which components are long-term or short-term, fixed or variable, and cash-based or stock-based.
Sustainability 13 12299 g001
Table 1. Sample description.
Number of FirmsNumber of Observations
Firms listed in the DAX30 and MDAX between 2014 and 2018100500
No ESG data241
CFO change040
No firm, compensation, or pension data3103
Negative pension data03
Final data sample95313
Table 2. Descriptive Statistics.
VariablesMeanMedianStd. Dev.MinMax
ESG Score63.3168.4919.8316.1694.8
Fixed compensation (thousand €)694.52672312.22572524.75
ST compensation (thousand €)583.54440514.7003469.21
Pensions (thousand €)281.67255245.9901918.06
Bonus grants (thousand €)273.8696390.4402338.00
Stocks (thousand €)421.87200493.3802476.60
Stock options (thousand €)84.870330.8603830.20
% Fixed compensation0.340.310.130.0490.82
% ST compensation0.250.260.1400.74
% Pensions0.110.110.0900.65
% Bonus grants0.120.070.1400.73
% Stocks0.150.120.1500.57
% Stock options0.030.000.1100.95
ROA5.645.165.59−17.653.58
Tobin’s Q1.701.351.020.777
CFO Tenure5.7244.05119
Debt100.4764.29145.7801492.09
Size15.8415.771.6411.1119.28
Ind10.5210.501
Ind20.2200.4101
Table 3. Pearson correlation matrix. * p < 0.05.
Variables1234567891011121314
1. ESG Score1
2. Fixed compensation0.415 *1
3. ST compensation0.265 *0.235 *1
4. Pensions0.489 *0.481 *0.185 *1
5. Bonus grants0.0820.176 *−0.0760.13 *1
6. Stocks0.385 *0.362 *0.373 *0.407 *−0.166 *1
7. Stock options−0.037−0.05−0.069−0.046−0.005−0.0951
8. ROA−0.123 *−0.181 *−0.044−0.145 *0.055−0.163 *0.208 *1
9. Tobin’s Q−0.262 *−0.174 *−0.078−0.267 *−0.018−0.157 *0.0280.407 *1
10. CFO Tenure−0.070.102−0.060.093 *0.0740.0360.0010.0240.121 *1
11. Debt0.114 *0.252 *−0.0680.208 *0.020.076−0.067−0.245 *−0.255 *−0.011
12. Size0.612 *0.491 *0.376 *0.441 *0.115 *0.373 *0.042−0.205 *0.386 *−0.158 *0.0711
13. Ind10.208 *0.080.217 *0.27 *0.037−0.041−0.0890.075−0.106−0.11−0.172 *0.237 *1
14. Ind2−0.152 *0.038−0.183 *−0.0980.0440.018−0.122 *−0.123−0.0630.148 *0.268 *−0.251 *−0.551 *1
Table 4. Power Analysis of the six different mixed-effects regression models. For all power estimations of the models, a significance level of α = 0.05 and a sample size of 313 is used. Every model consists of the same seven control variables (ROA and Tobin’s Q, CFO Tenure, Debt, Size, and Ind1 & Ind2) and a different compensation variable. The reduced model only consists of control variables and has an R2 value of 0.373. The regression models for fixed compensation, pension compensation, and stock compensation have a sufficient estimated statistical power (>0.8), while the regression models for short-term compensation and stock option compensation show insufficient estimated power. The power of the regression model for multi-year bonus compensation cannot be estimated as the R2 value of the full model is lower than the reduced model. Therefore, short-term compensation, multi-year bonus compensation, and stock option compensation are excluded from the rest of the study.
Regression Models R 2 (Full Model) R 2 (Reduced Model) R 2 Difference Statistical Power
Fixed compensation0.3920.3730.0190.88
ST compensation0.3750.3730.0020.16
Pensions0.4310.3730.0580.99
Bonus grants0.3700.373−0.003-
Stocks0.4040.3730.0310.98
Stock options0.3750.3730.0020.19
Table 5. Mixed-effects regression models analyzing the relationship between CFO compensation and the firm’s CS performance (Hypotheses 1, 3, and 5). * p < 0.05, *** p < 0.001. All models are estimated using robust standard errors. ESG Score is the dependent variable measuring the ESG performance by the Asset Four database by Thomson Reuters. Fixed compensation, Pensions, and Stocks are the independent variables of the different models measured in 10,000 € steps. Fixed compensation captures the sum of salary and fringe benefits. Pensions capture the yearly payments for retirement funds (pension compensation). Stocks capture the compensation paid in stocks. The control variables are ROA and Tobin’s Q, CFO Tenure, Debt, Size, and Ind1 & Ind2.
Variables/ModelsModel1Model3Model5
Predicted Outcome +/-
Fixed compensation0.07
(0.068)
Pensions 0.16 ***
(0.000)
Stocks 0.037 *
(0.010)
ROA0.156
(0.231)
0.137
(0.256)
0.157
(0.226)
Tobin’s Q−0.299
(0.849)
−0.045
(0.977)
−0.416
(0.790)
CFO Tenure0.020
(0.935)
−0.442
(0.854)
0.117
(0.628)
Debt0.000
(0.966)
0.001
(0.887)
0.002
(0.578)
Size5.210 ***
(0.000)
5.046 ***
(0.000)
5.401 ***
(0.000)
Ind15.097
(0.182)
2.967
(0.418)
5.823
(0.121)
Ind23.184
(0.525)
2.727
(0.563)
3.737
(0.434)
Constant−28.628
(0.146)
−24.544
(0.182)
−29.481
(0.125)
Publisher’s Note: MDPI stays neutral with regard to jurisdictional claims in published maps and institutional affiliations.

