Article

Multi-Level Toolset for Steering Urban Green Infrastructure to Support the Development of Climate-Proofed Cities

1
Department of Landscape, Spatial and Infrastructure Sciences, Institute of Landscape Planning, University of Natural Resources and Life Sciences, 1180 Vienna, Austria
2
Wien 3420 Aspern Development AG, 1220 Vienna, Austria
3
Zentralanstalt für Meteorologie und Geodynamik, 1190 Vienna, Austria
4
Green4Cities GmbH, 1180 Vienna, Austria
5
AIT Austrian Institute of Technology GmbH, 1210 Vienna, Austria
*
Author to whom correspondence should be addressed.
Sustainability 2021, 13(21), 12111; https://doi.org/10.3390/su132112111
Submission received: 30 August 2021 / Revised: 28 October 2021 / Accepted: 28 October 2021 / Published: 2 November 2021
(This article belongs to the Collection Urban Green Infrastructure for Climate-Proof and Healthy Cities)

Abstract

:
Adapting spatial development to the challenges of climate change is a major task facing cities. In particular, urban heat islands caused by increasing average temperatures and urban growth are a challenge for cities. The use of climate simulations to assess current and future urban heat stress is a helpful approach for supporting this transition. In particular, green and blue infrastructure helps to reduce the urban heat island effect. These cooling effects can be analysed using simulations. However, a central challenge is that urban adaptation to heat needs to be implemented consistently at different planning levels. A second major challenge in adaption is identifying the amount of urban green infrastructure required in order to achieve a specific cooling benefit and establishing this by means of planning instruments. This article presents two case studies in the city of Vienna to demonstrate how climate simulation tools can be used across different planning levels if they are standardized. When combined with a green and open space factor as a steering instrument, the necessary amount of greening for subsequent planning processes can be secured. The result is a multi-scale toolset consisting of three climate simulation models and a green and open space factor, coordinated, and standardised for use at different levels of planning.

1. Introduction

Cities face new and multiple challenges at various levels. Currently more than half of the world’s population lives in cities and this proportion is expected to continue to rise [1]. Due to building (high-density living space) and the associated infrastructure, the proportion of sealed areas is increasing at the expense of green and open spaces [2]. Moreover, the interplay between the “urban heat island” (UHI) effect and the higher temperatures caused by climate change is steadily exacerbating heat stress [3]. Construction and development of urban areas and the associated sealing of natural surfaces in combination with anthropogenic heat emissions, such as heating or transport are the main factors for the formation of urban heat islands [4,5]. The city of Vienna is itself affected by these challenges, which will increase in future according to various scientific studies [6,7].
The recognition of the relevance and scope of these growing challenges was the starting point for the “Green Resilient City” research project. The results and findings form the basis for this paper. In order to address the challenges described and to meet the requirements of planning at various levels, a multi-scale toolset was developed combining climate simulation models with evaluation, planning, and steering instruments. This paper describes this hitherto unique holistic approach; a toolset operating across several levels to steer, optimise, and evaluate green and climate-sensitive city planning and architecture consisting of (1) a green and open space factor (GOF) as an urban benchmark and instrument for green infrastructure steering and planning, (2) GREENPASS as an assessment, evaluation, planning, and optimisation tool with space and time differentiation for climate resilience and microclimate impact of green infrastructure at plot, city quarter, and district level, (3) MUKLIMO_3 urban climate model for mesoclimate and urban impact at city level and (4) COSMO-CLM a regional climate simulation model. The climate simulation tools and instruments used to assess urban climate are already well developed, individually validated, and tested but not yet against the needs of landscape and urban planning, i.e., coordinated and tailored to joint use at different planning levels.
The central research questions are: (1) How is urban green infrastructure (UGI) steering in the interests of climate-resilient urban development supported by climate analysis? (2) What planning levels are relevant for the toolset to steer green infrastructure taking the city of Vienna as an example? and (3) What instruments are suitable for individual planning levels and how should they be standardised?
This article takes two case studies in two Viennese municipal districts to explain how the implementation of climate-sensitive urban development can be supported by a toolset consisting of simulation, evaluation, planning, and steering instruments.

1.1. Loss of Urban Green Infrastructure and Its Effects on the Ecosystem

The use of urban green infrastructure (UGI) can help combat the negative effects of urban heat islands on citizens. Intensified use of space and sealing is leading not only to a loss of green spaces, but also endangers biodiversity [8] with an associated loss of ecosystem services [9]. Sustainable approaches are needed which manage resources efficiently and maintain and improve the quality of life in the city [10]. The city, and in particular planning departments, are confronted by a complexity and interdependency of climatic, ecological, and social aspects. In view of the challenges of climate change, the maintenance and expansion of UGI is gaining importance.
UGI [11,12] with its accompanying diverse ecosystem services—together with climatic, ecological, and economic benefits—contributes to a better quality of life in cities [2,13,14]. Urban green infrastructure provides an area with multiple services which aid in transcending the current challenges of urban planning [15,16].
The term “ecosystem services” covers all benefits provided to humanity by ecosystems [17,18]. According to the Millennium Ecosystem Assessment [19] ecosystem services are divided into the following categories: (1) provisioning services, (2) regulating services, (3) cultural services, and (4) supporting services. Of primary importance for the urban sector are, among other things, regulatory services (e.g., climate regulation, air filtration, noise reduction, rainwater drainage, and water supply), cultural services (e.g., recreation, aesthetics, social functions, cultural identity), and biodiversity which, although not an ecosystem service in the narrow sense of the term, can still be considered as a supporting service for the other services as it provides habitats. Regulating ecosystem services of UGI that are particularly relevant to cities for climate change adaption are temperature regulation [20] and rainwater management [21]. UGI also contributes to climate change mitigation by carbon storage [20,22,23].

1.2. Benefits of Climate Modelling and Urban Green Infrastructure for Adaptation to Climate Change and Climate-Sensitive Urban Development

In the course of developing climate change adaptation strategies, many cities are using simulation-models and -tools to record the current climate situation and the determination of future susceptibility. Numerous studies have investigated the impact of different climate adaptation methods in urban districts with the use of various models and tools. The analysis of the impact of greening on urban heat stress is a common approach [24,25,26,27]. However, a challenge in adapting urban development to climate change is that spatial development occurs at many different scales and therefore simulations with different spatial resolutions are required.
The mentioned climate adaptation strategies consider UGI and the associated available ecosystem services as an implicit measure to mitigate the negative effects of climate change [14] and make a significant contribution to the quality of urban life [28,29,30,31]. Maintaining this UGI, and therefore ensuring climate-sensitive and socially sustainable urban development, demands thorough consideration of green infrastructure steering [10,32,33]. In order to benefit from the impact on the various climate levels (microclimate, urban, regional climate) these must be combined with the planning scale levels (building plot, neighbourhood, district, city level as well as regional level).
Analysing the complex effects of UGI on the urban environment relies on having climate simulation models and performance evaluation tools that deliver spatial and temporal data and evaluations at the appropriate resolution for the planning level. At the higher level, for example, the impact on urban renewal or urban development projects should be assessed using meso-scale and regional models. Micro-scale models are primarily used to assess the effect of construction on urban quarters to single building plots. This requires a strategic approach and a consistent toolset for coordinating the various levels.

1.3. Adapation of Spatial Development to Climate Change and Steering of Urban Green Infrastructure

Strategies and instruments to adapt to the challenges of climate change have been developed by many cities internationally (c.f. among others Warsaw [34] and Singapore [35,36]). In particular, effective UGI implementation and steering in order to benefit from its cooling effect for adaptation to climate change are an important approach in such strategies (c.f. among others Berlin, Malmö, Seattle [36,37,38,39]).
In this context, the city of Vienna has developed its own strategies such as the “Urban Heat Island—Strategy Plan Vienna“ [32] and adapted existing planning concepts to incorporate challenges caused by climate change (c.f. Urban Development Plan—STEP 2025 [40] and the Thematic Concept for Green and Open Spaces [41]). However—with the exception of land use planning laws and nature protection instruments as well as non-legally-binding specialist concepts or strategies—there is a lack of specific steering instruments for UGI (especially on building plot level) in Vienna.
Benchmarks are one approach to steering urban green infrastructure indirectly through urban planning indicators such as floor-space index, degree of development [42], or through benchmarks for provision of open space in the form of square metres per inhabitant or dwelling unit [29,42,43,44,45,46]. There are some limitations regarding these benchmarks, such as their inability to influence the unequal distribution of green space across the city. Green and open space factors are another instrument used in cities to safeguard green and open spaces at plot level [37] (see also Section 2.2). In summary the benchmarks mostly used by cities are green space ratio, green space coverage or green space area per capita [47].
The city of Vienna itself relies on the benchmarks for provision of public open space in the form of square metres per inhabitant. In the Thematic Concept for Green and Open Spaces [41], differentiated requirements (guide values) are identified for the provision of open spaces. These exclusively refer to public green and open spaces to be provided. In the planning law of the City of Vienna, there is only an indirect option to control the greening by regulating the structural use of a private plot and via assigning a so-called “horticultural design”. However, the law does not define what this includes—neither qualitatively nor quantitatively (BO für Wien § 5 Abs. 4 lit. p) [42].
In summary, many cities—including Vienna—face the challenges to (1) analyse current and future vulnerability due to urban heat, (2) develop and implement effective measures for adaptation at different planning levels, and (3) improve the provision of urban green infrastructure as central, nature-based adaptation measures [31,47,48,49].

2. Materials and Methods

The paper is based on the results of two case studies in Vienna, one in Innerfavoriten and one in Aspern Seestadt (see Section 2.1). These case studies were used for the proof of concept for the standardisation of three different existing climate simulation models applicable at different scales as well as for the combination of a climate simulation tool with a green and open space factor.
Wolfram et al. [50] emphasise that, in order to address the challenges of sustainable urban development, research must register the spatial institutional complexity of urban transformation processes and transition to multi-systemic approaches. In an interdisciplinary and transdisciplinary collaborative approach with members of the city administration, the research team developed a new kind of toolset demonstrating its feasibility in a proof of concept.
The objective was to discover whether different climate simulation models and instruments could be combined into a multi-scale toolset in order to support future planning as an integrated instrument. Assessment will be made as to whether the combination of individual simulation models work with a green and open space factor (GOF) as proposed in the toolset and can provide useful results to support green and climate-sensitive landscape and urban planning.
The major methodical proof of concept stages were: (1) Standardisation of input/output parameters, land-use parameterisation based on GREENPASS urban standard typologies and a joint determination of the reference periods, (2) comparison of the results of various simulation models using the Favoriten case study, (3) common use of GREENPASS and the GOF in the Aspern case study, and (4) the opportunities for the discussion of possible applications for the toolset with an advisory board of members of the planning departments of the City of Vienna municipal authorities.

2.1. Proof of Concept by Case Studies and Coordination with City Authorities

The research project took a field test approach, enabling new technologies to be tested in real locations with spatial and time limitations without these having to be established within a legal framework [51]. The trial was combined with a regulatory learning process to support the transfer of the lessons learned into routine planning [50,51]. The results and findings were regularly reflected in an advisory board with representatives of the relevant planning departments of the city and implementation possibilities into planning levels and instruments discussed.
Two different case studies were selected for the proof of concept of the toolset. In the Vienna Innerfavoriten case study, the focus was placed on the comparability of the simulation results provided by the three tools COSMO-CLM, MUKLIMO_3, and GREENPASS. The part of the district of Favoriten that was selected for the simulations covers an area of around 25 hectares and is characterized by a grid structure from the period of promoterism that was built during several decades. The spectrum of building shapes ranges from perimeter block development, through row buildings and single-family houses to post-modern building forms. In this study area with different building and land use typologies, the results of the three tools were compared based on certain key parameters available in all three models.
The second case study was in Aspern Seestadt (Aspern urban lakeside), one of the largest urban development districts in Europe. Measuring approximately 240 hectares, new living and working space is being created for more than 40,000 people in the middle of the 22nd Viennese municipal district. The urban lakeside development is in stages: since autumn 2012, public spaces and buildings for approximately 8000 residents have been created in the southernmost part so far, together with 2000 jobs. For one of the new planned city quarters in the north, known as the “Seeterrassen“, an urban planning competition was organised. In the course of the planning process, the targeted use of GREENPASS and the GOF was studied.

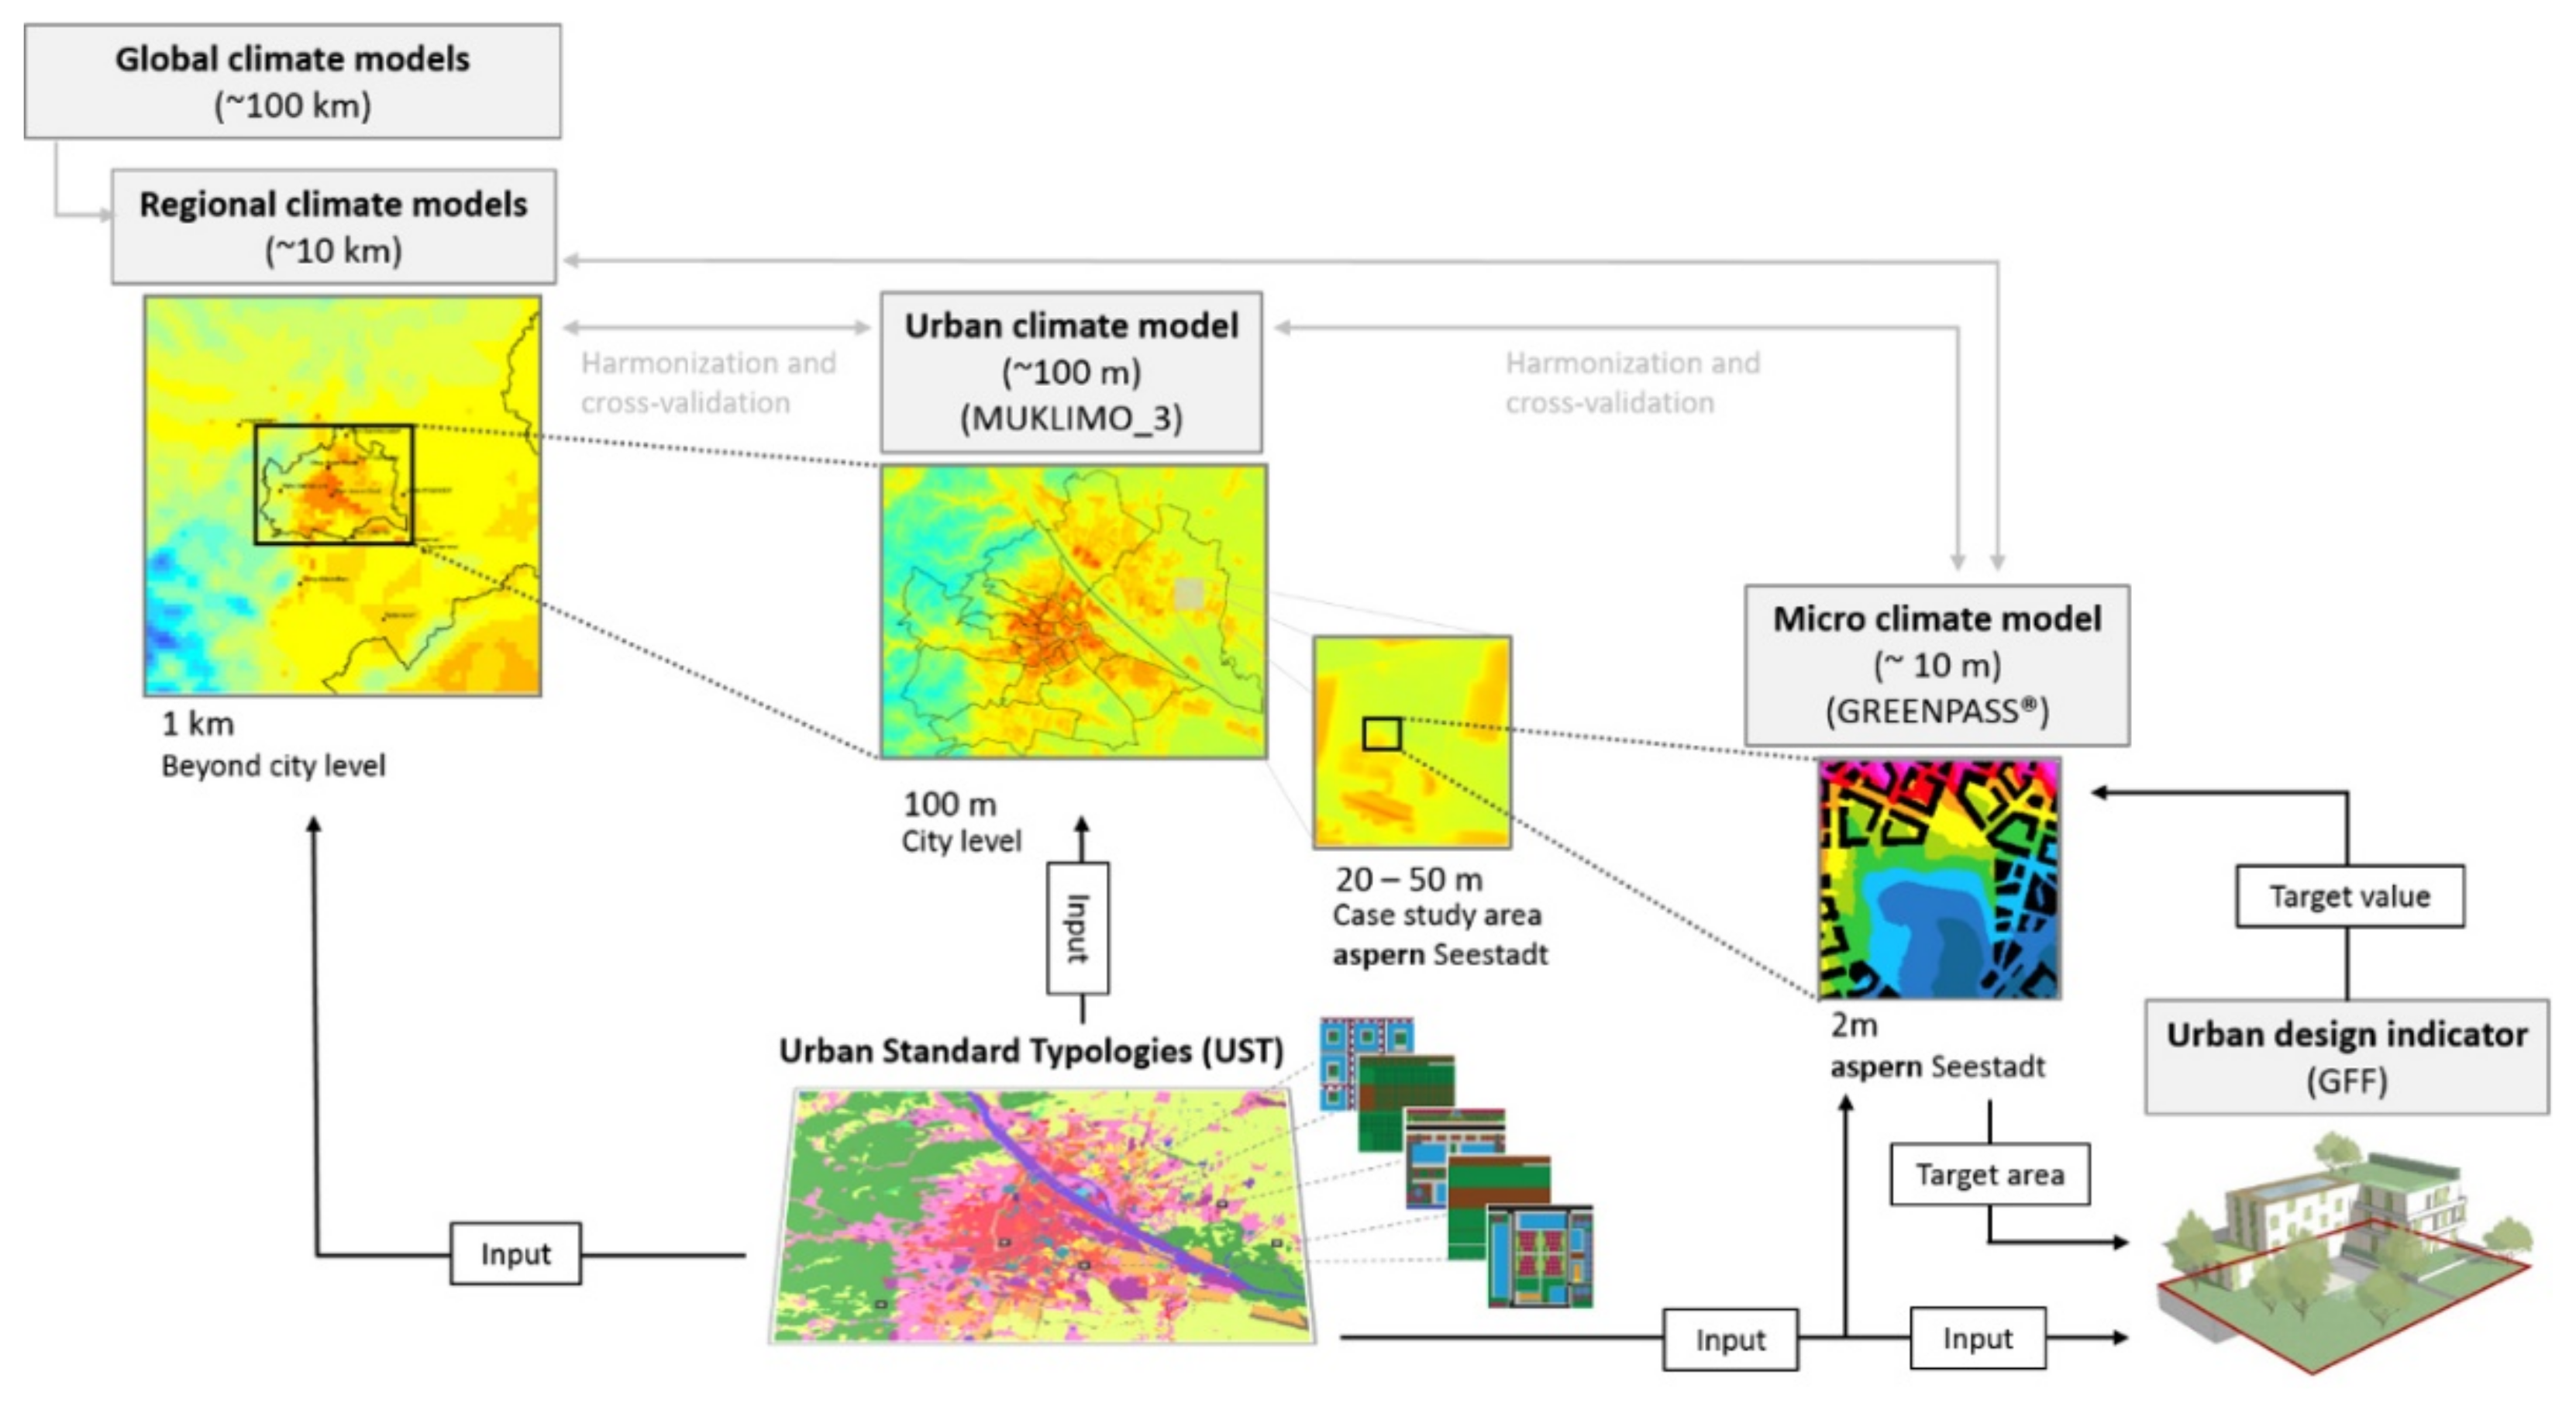
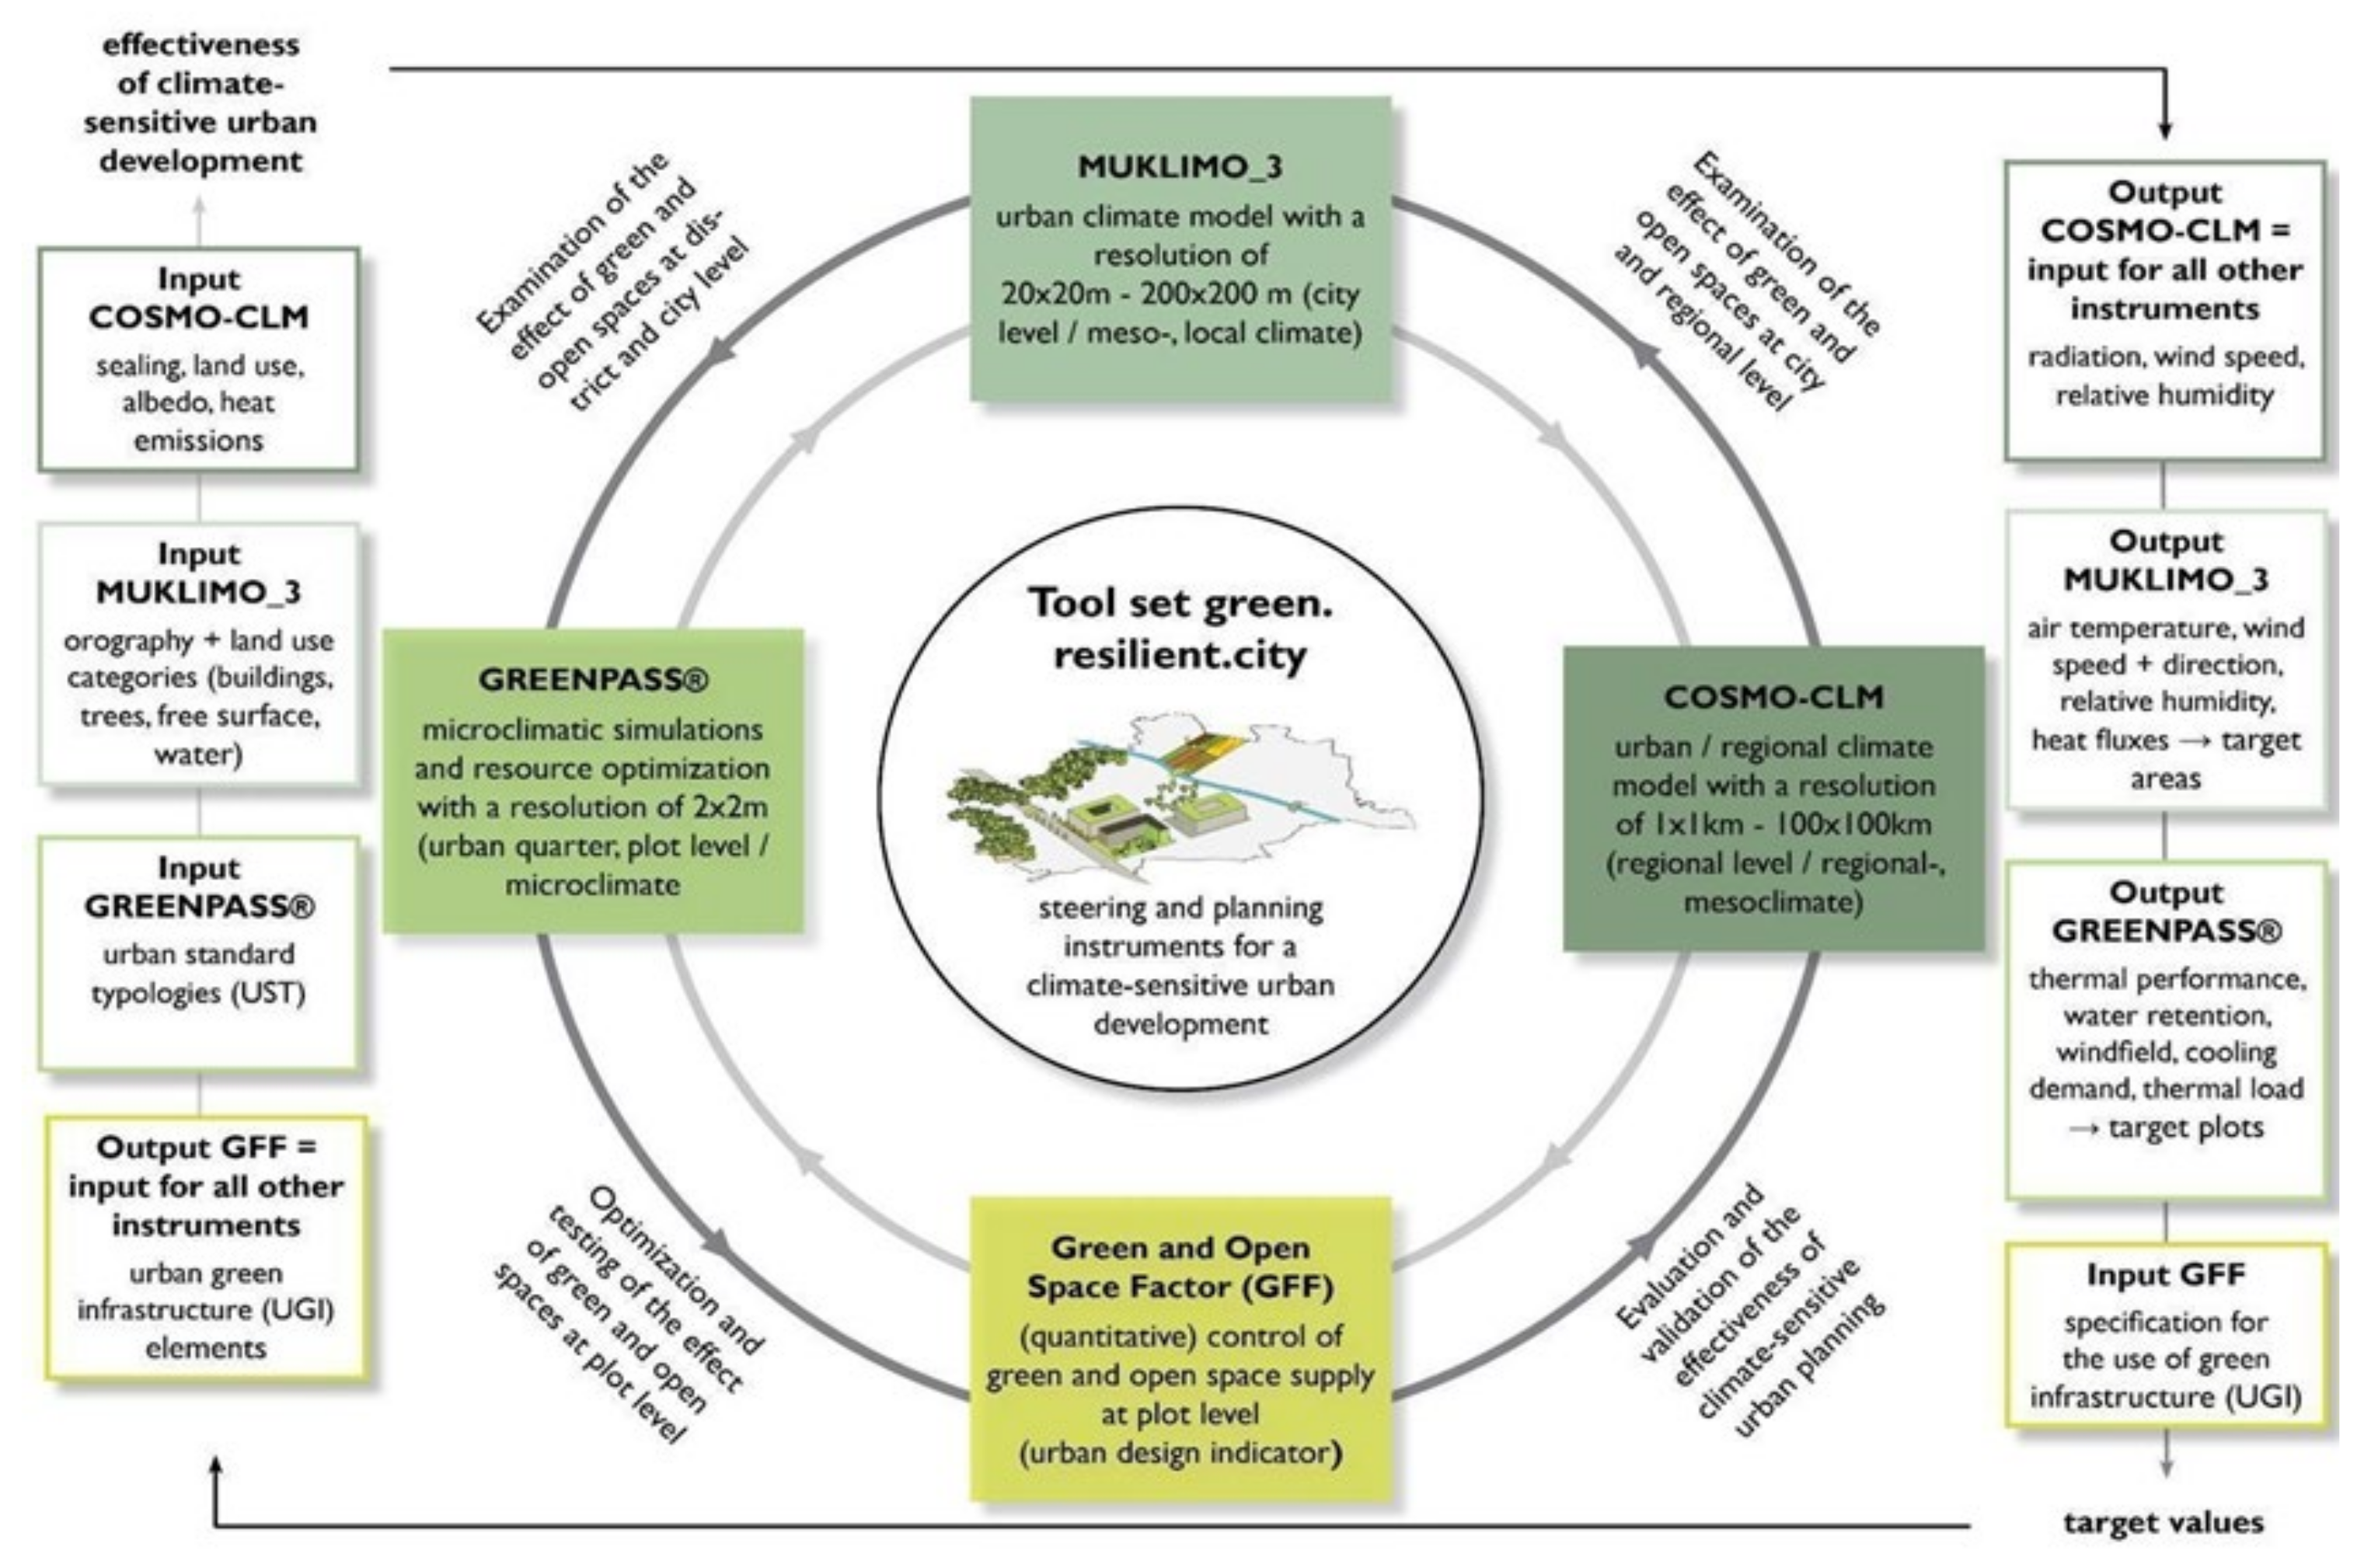
2.2. Climate Simulation Tools for the Toolset

For standardisation, three climate simulation models were selected based on different scale levels. These are a regional climate model COSMO-CLM (COSMO model in CLimate model), an urban climate model MUKLIMO_3 (micro-scale urban climate model) and the microclimate model ENVI-Met, which contributes to the GREENPASS assessment, evaluation, planning and optimization methodology.
In order to combine the different climate simulation instruments in one toolset they had to deliver similar outputs for different input parameters, which is why the various input parameters of the individual instruments were continously compared, adjusted and coordinated. A primary focus was on coordinating various scale models by analysing data interfaces, standardising input parameters, and setting the same reference periods.

2.2.1. Regional Climate Model COSMO CLM

With the German regional climate model COSMO-CLM [52] and the special urban extension TERRA-URB [53], urban climate simulations could be carried out at a resolution of 1 × 1 km2. By integrating anthropogenic heat emissions and horizontal resolutions in the 1-km range, the urban heat island effect could be mapped for the first time using regional climate models in context with large-area climate developments on a relatively fine scale. As a first step, simulations for the years 1960 to 2018 based on ERA40/ERA Interim data were calculated and compared for initial validation with data from 12 measuring stations in and around Vienna. Although high-resolution regional climate simulations are extremely processor-intensive and hitherto have only been achieved at best in seasonal tranches, it has been possible in a second step to carry out for the first time a model run for the period 1960 to 2100, thereby generating hourly data for the moderated SRES climate scenario A1B.

2.2.2. MUKLIMO_3 Urban Climate Model

At a horizontal resolution of 20–200 m, the urban climate model MUKLIMO_3 [54,55] developed by the German meteorological service was used to study urban heat stress and to analyse the impact of climate adaptation measures at city and regional level. Taking into account high-resolution land-use and topography data as well as initial meteorological conditions, the parameters for temperature, relative humidity, wind and solar radiation were simulated in the daily cycle with potential heat stress. Combining the MUKLIMO_3 results with long-term climate data series gained from observational data or regional climate simulations enables the calculation of high-resolution climate indexes such as the mean annual number of summer days (Tmax ≥ 25 °C) or hot days (Tmax ≥ 30 °C). This cuboid method developed by Früh et al. [56] can be used in this way to analyse urban heat stress for past and future periods, taking into account various regional climate scenarios. By changing the land-use parameters upon which the model is based, the effects of different climate adaptation scenarios (e.g., increased vegetation level, roof greening, de-sealing measures, increase of the reflectivity of building surfaces) can be evaluated.

2.2.3. GREENPASS Model

GREENPASS is an all-in-one software-as-a-service (SaaS) planning, optimisation and certification tool for climate-resilient urban planning and architecture. GREENPASS analyses, optimises, and certifies the effects of buildings, materials, and plants with respect to six urban issues: climate, water, air, biodiversity, energy, and costs. GREENPASS technology has been developed over the past ten years with leading universities and planning experts in the context of different national and international research projects. The GREENPASS Toolbox provides a customised solution for the appropriate planning phase and allows the urban environmental impact assessment of real estate, open and green space, as well as urban districts and entire cities. GREENPASS Software combines scientific expert simulation systems such as ENVI-met (microclimate) and/or Rheologic CFD (wind) with planning practice and enables the standardised assessment and optimisation of projects based on a set of key indicators as published by the European Commission [57] to control and to optimize the performance to understand the climate resilience of different urban designs and architecture [57,58,59,60,61,62].

2.3. Green and Open Space Factor as an Urban Planning Benchmark and Steering Instrument

Green and open space factors to secure urban greening are being used internationally (including for example Berlin, Malmö, Seattle [37,38,39], or Helsinki [62]). All the previously developed green and open space factors calculate the ratio of an area having an impact on the ecosystem to the total area of a plot. The green infrastructure elements arising on the plot and the buildings are assessed differently with the aid of a catalogue and the attributable area determined on the basis of its contribution to biodiversity in most cases. This is divided by the basic area of the plots and the result is a numeric value—the respective green space factor [37,62,63,64,65]. In the course of the Green.Resilient.City project, a GOF was developed which also takes the building masses into account. A further extension to the developed GOF was, in addition to the consideration of ecological services, also to consider social and especially climatic services in the assessment of the different performance of urban green infrastructure, see in detail [66]. A coordination of the UGI elements used by the GREENPASS was also conducted to ensure a joint application.

3. Results

Before the joint application of the individual simulation tools in the case studies, these are harmonised with one another, cross-validated and standardised so that the input and output parameters could be used reciprocally.

3.1. Instrument Standardisation

Initially, the development of a joint database represented an essential step towards the standardisation of instruments. Originally all three simulation models worked with different land-use and input data. The following aspects have been standardised and harmonised: (1) applied land use parameterisation based on GREENPASS urban standard typologies, (2) interfaces between simulation tools, (3) study period, and (4) interfaces between GREENPASS and the green and open space factor.
Figure 1 gives a summary of the simulation tools used. “Urban standard typologies“ served to standardise land use parameterisation, climate signal data from COSMO-CLM (A1B scenario) was used for the setting of a common reference date and the interfaces between the individual simulation tools coordinated with the green and open space factor.

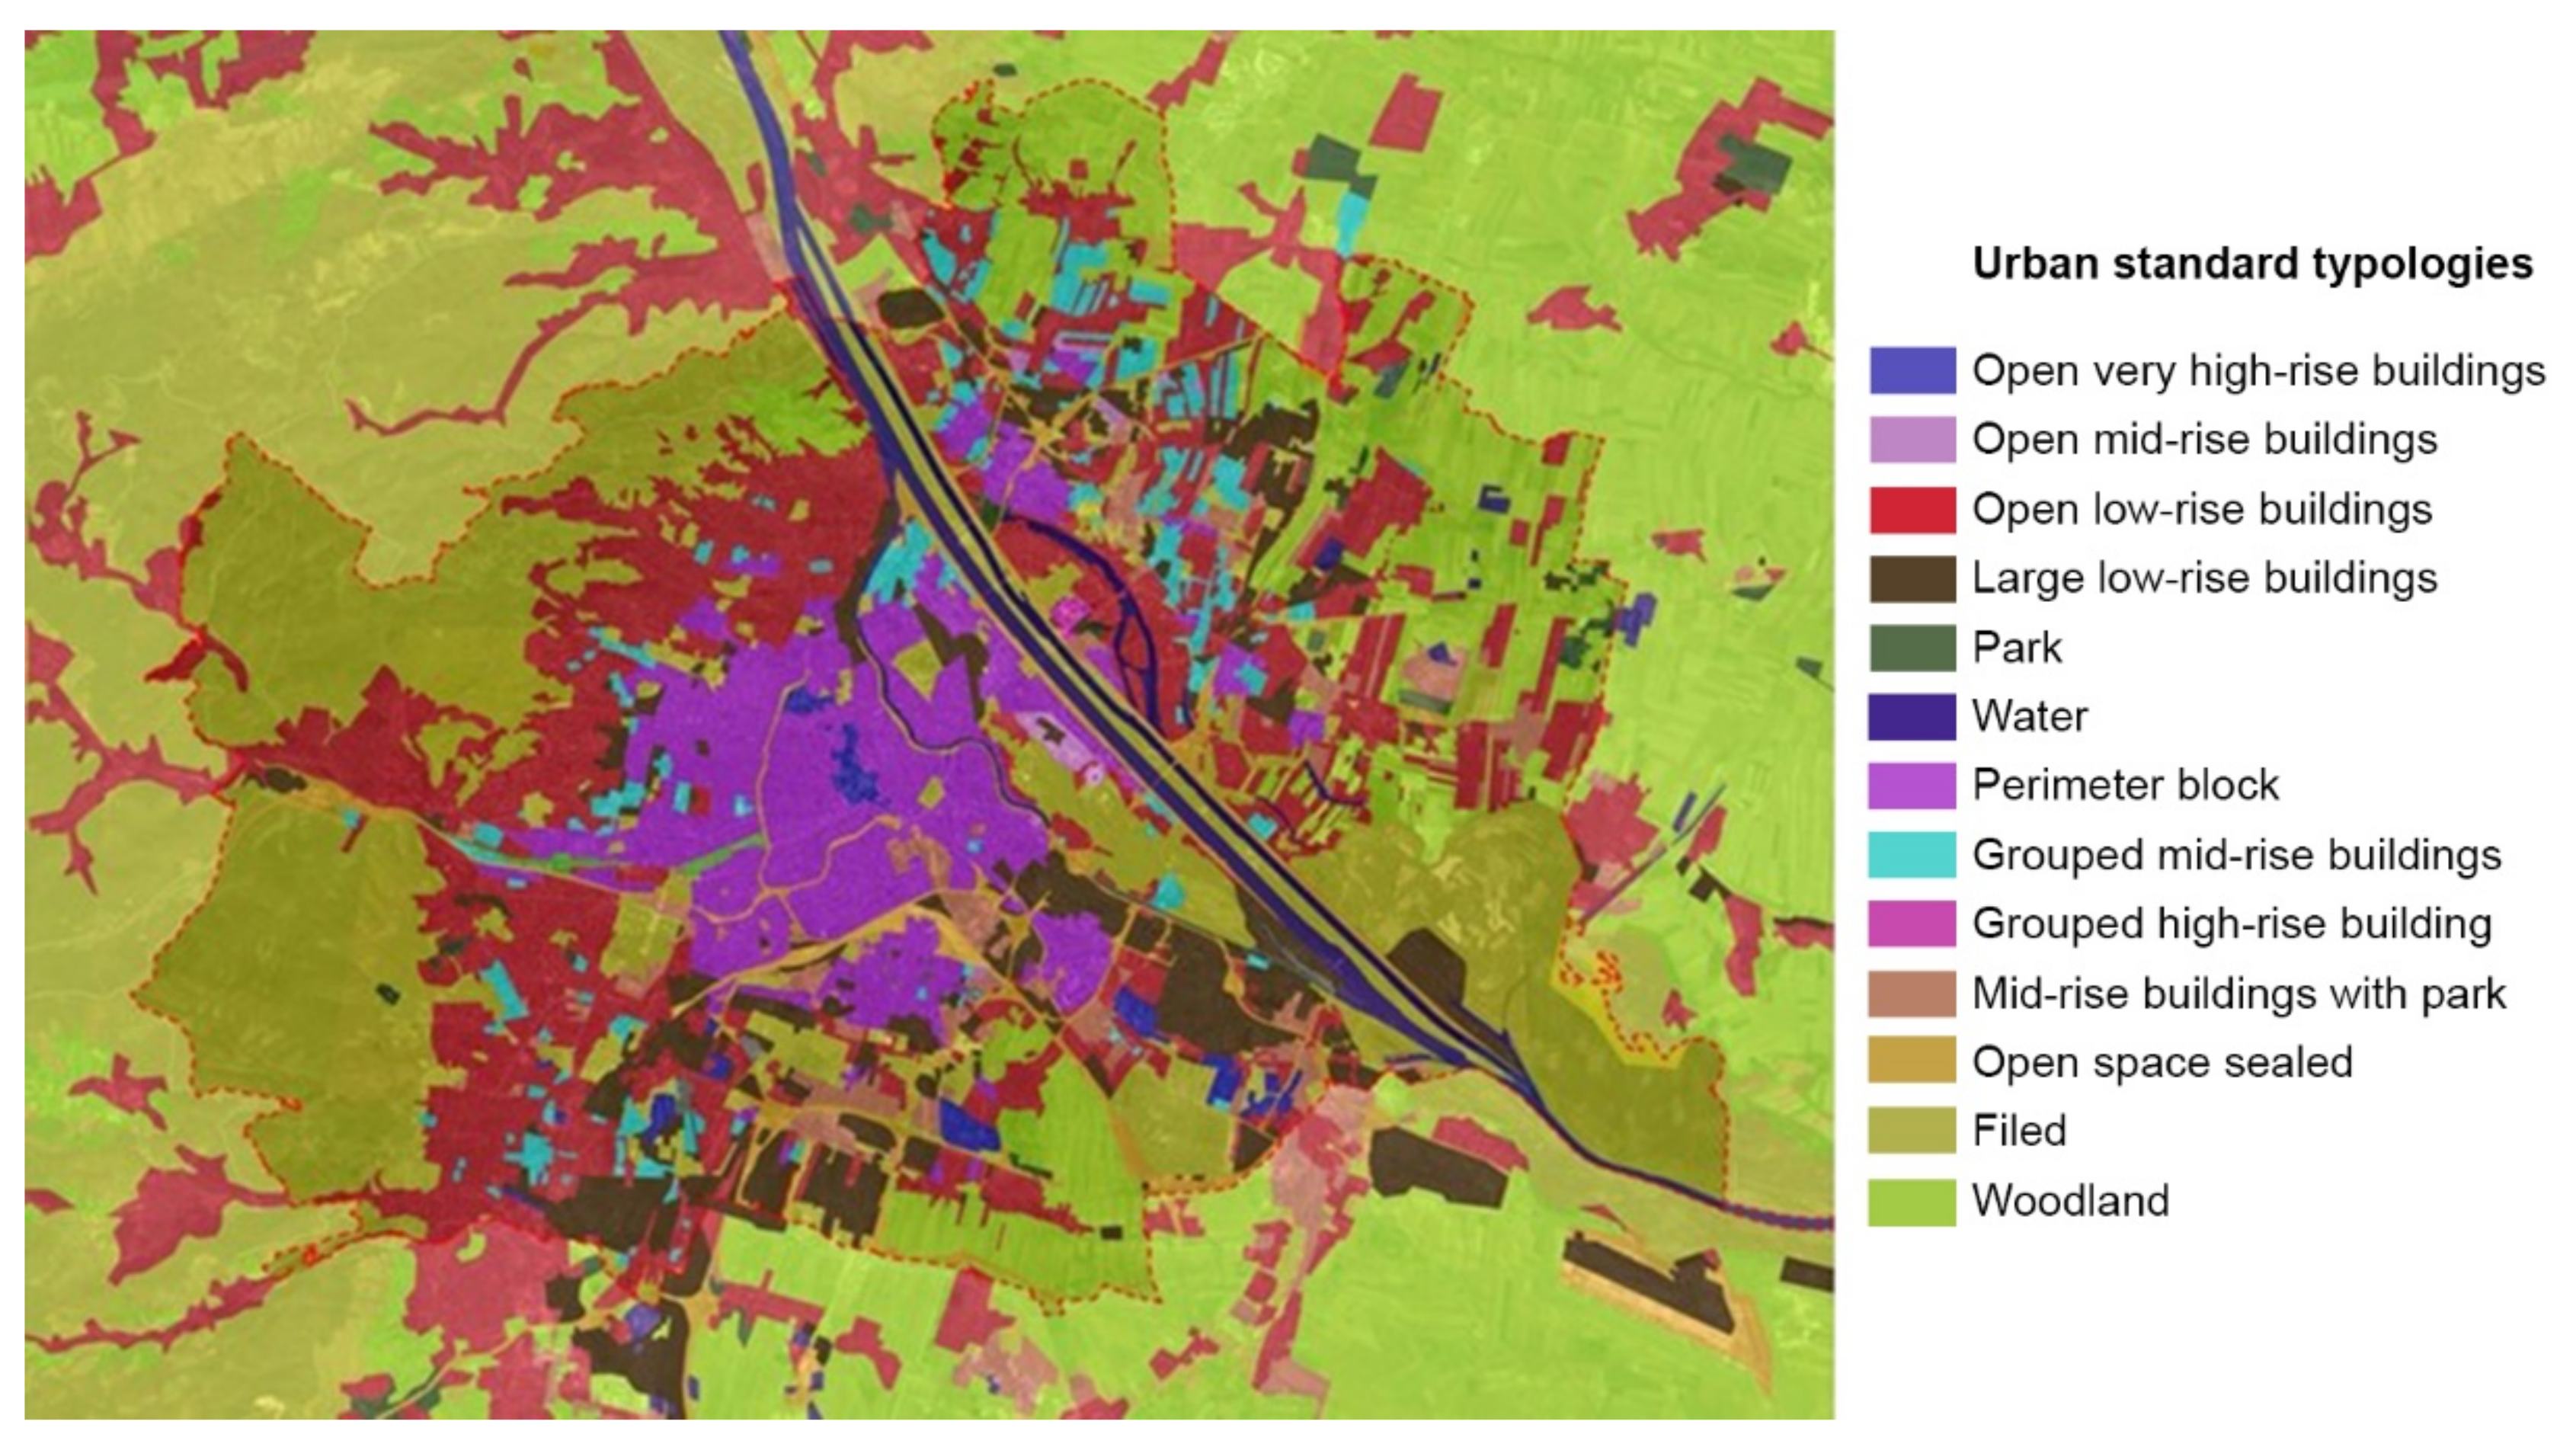
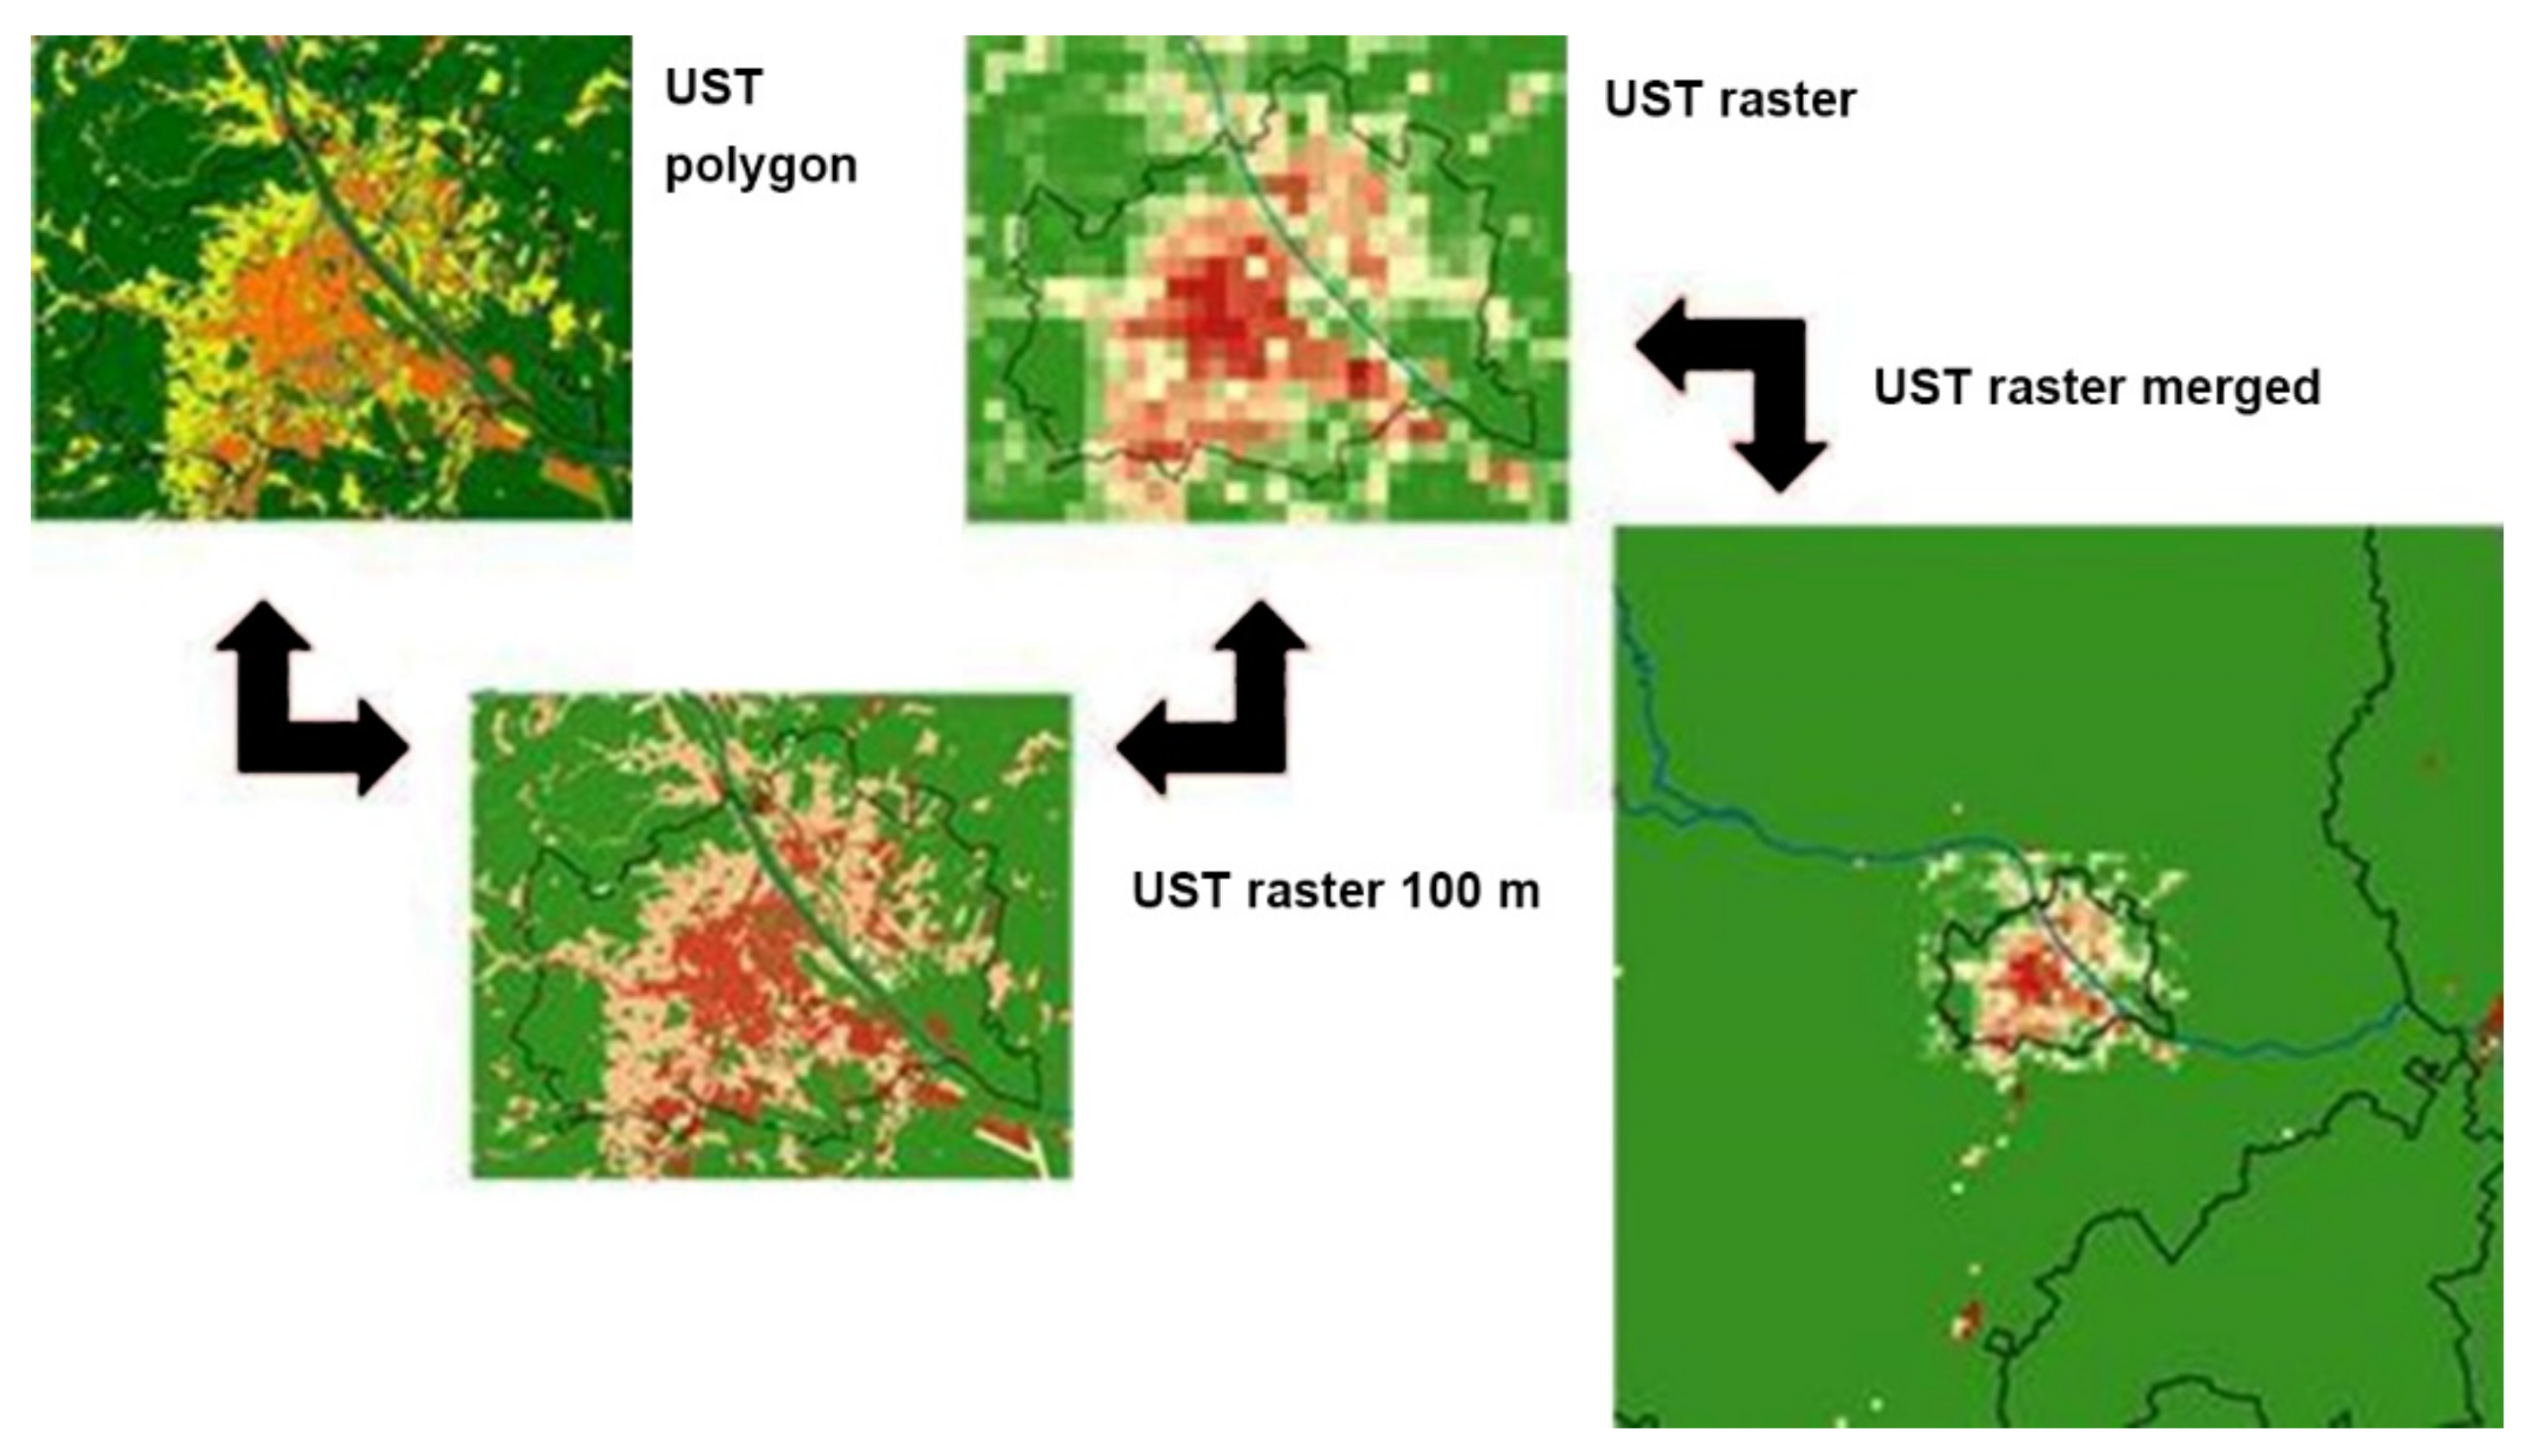
3.1.1. Standardisation of Land Use Parameterisation

To standardise the input data for land use, “urban standard typologies” (UST) have been applied, which demarcate districts according to characteristic development structures and by types (see Figure 2). The GREENPASS standard urban typologies are typical, appearing as abstracted urban morphologies developed in the EASME research project “Green4Cities”. The USTs for Vienna were drawn up and evaluated by the project team, developed further jointly and assigned according to land use in Vienna. The USTs have a standard size of 200 × 200 m2 and have been abstracted and clustered on the basis of area analyses of land use shares (building, open space, green space etc.) and other urban planning parameters (e.g., building height). For each UST there are detailed area statistics with the proportion of different land-use typologies and UGI elements as well as urban planning parameters. These served in all climate simulation tools and input data for land use parameterisation.

3.1.2. Standardised Interfaces

For the regional climate model COSMO-CLM, sealing layer, plant coverage, leaf area index (LAI) and average building height were derived from the USTs. In a first step, the UST polygon data were transferred into the rotated system of coordinates used in CLM and converted into a 100-m grid. After this, the aggregate values for the degree of sealing, plant coverage, and tree coverage could be assigned to the appropriate categories. These were converted using the geographic information system (GIS) ArcGIS into grid data at a resolution of 0.01° (1 km) and entered as NetCDF into the COSMO-CLM initialisation files. LAI was determined from satellite data and was the subject of analogue processing (see Figure 3). For the MUKLIMO_3 model, information on land coverage was also extracted from the USTs. These have been adapted as appropriate (e.g., conversion into grid format, transformation into a coordinate reference system generally used for European geodata using QGIS) and integrated into MUKLIMO_3.
For both models, many of the parameters available in the USTs (e.g., degree of sealing, building proportion, building height, vegetation proportion) could be transferred directly into the model and simulated whereas there were model-specific restrictions for a few other parameters (see Section 3.2) which is due to the fact that the models are operating on levels that require parameterization of certain city-specific structures.

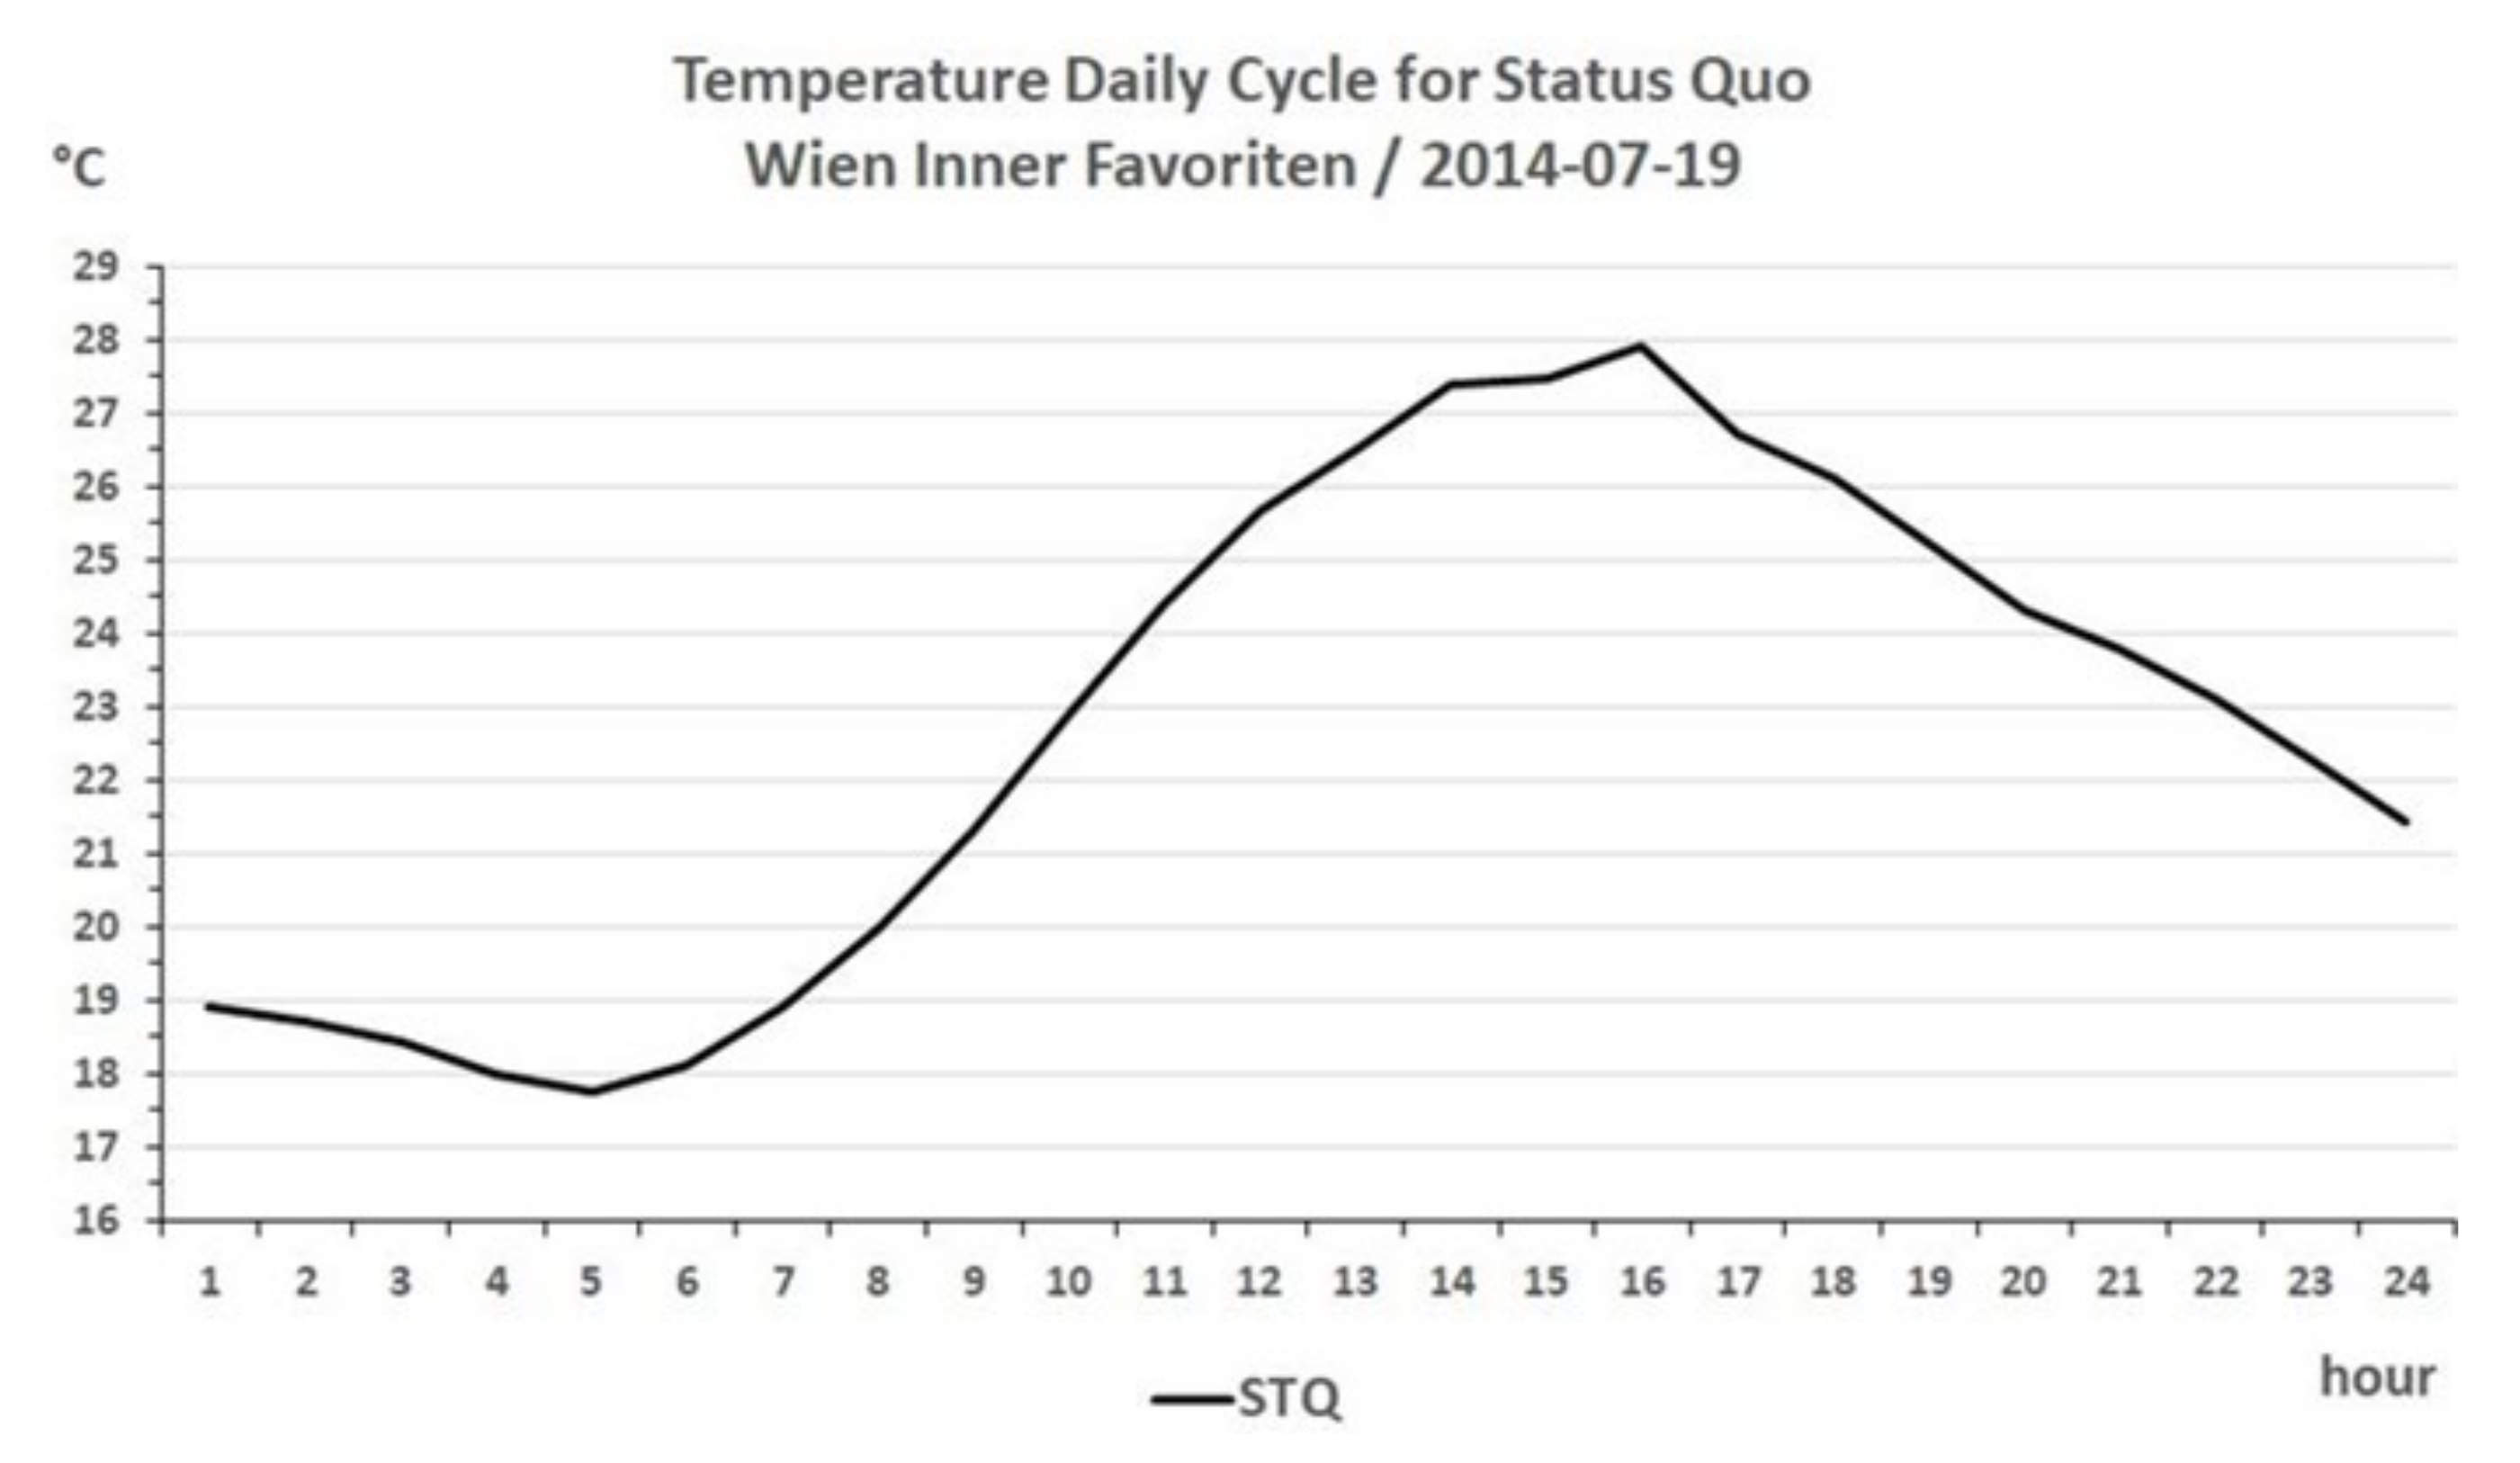
3.1.3. Standardisation of the Study Period—Daily Cycle of the Idealised Day

Further steps involved reconciliation between study period and study day and adaptation scenarios (greening scenarios). The reference period 11 July–31 July was used, for a 10-year period (2009 to 2018) and selected from hourly data measured by the Inner City Vienna station the maximum temperature of which corresponds to the 80th percentile (32.56 °C). Initially all days on which precipitation was measured were ruled out of the calculation. Based on this calculation method, consequently 19 July 2014 was used in all three models as idealised day (see Figure 4 for the idealised day as represented in COSMO-CLM).
Data was exchanged between the larger-scale models on an urban or regional scale and the GREENPASS micro-climate model for ENVI-met. Information such as temperature, atmospheric humidity, solar radiation, wind direction, and wind speed could be used from MUKLIMO_3 and COSMO-CLM after appropriate processing as input data for ENVI-met simulations as basis for GREENPASS evaluations.

3.1.4. Standardisation between GREENPASS and GOF

To achieve standardisation between GREENPASS and GOF, as a first step the UGI elements had to be reconciled and their level of detail coordinated. This enables the use of input and output of both instruments in both directions. In the sphere of building greening, in particular facade greening, the UGI elements of the GOF were extended in order to take into account orientation [62]. The orientation and surrounding urban structure as well as ambient climatic framework conditions (solar radiation, wind field, air humidity) have a significant influence on the effectiveness of UGI and especially façade greening. The three dimensional simulation software ENVI-met fully accounts for the framework conditions and is therefore the profound basis for micro-climate analysis of GREENPASS.

3.2. Joint Application of Simulation Models in the Favoriten Case Study

After standardisation of the models on the appropriate scale levels, in a second step the microclimate simulation ENVI-met and GREENPASS evaluation system have been applied in a specific area of study, a typical existing area in Vienna in the Favoriten district (see Figure 5).
The current situation and three different land use scenarios for the same area were evaluated and the results compared (see Section 4 Discussion).
The scenarios can also be used to determine the extent of necessary adaptation measures in the sphere of urban green infrastructure in order to achieve planning objectives—e.g., the prevention of an increase in UHI effect by greening measures or the temperature reduction to be achieved in a city district.
Standardised greening models based on the urban standard typologies formed the basis for simulation of the different land use scenarios. For each of these USTs, in addition to the status quo (SQ), three greening scenarios with different degrees of greening were developed. These are: (1) “worst case” (WC), (2) “moderate case” (MOD), and (3) “maximum case” (MAX) (see Figure 6). For each UST and its greening scenarios, detailed area statistics have been developed with the proportion of the different land-use typologies and UGI elements as well as urban planning parameters, and used as a basis for the simulation.
For the status quo, moderate and maximum greening scenarios were calculated and the resultant climate effects for Vienna—in respect of summer average temperature and climate indexes such as summer days, tropical nights—simulated and compared between the models.

3.2.1. Input Data for GREENPASS analyses and ENVI-met Simulations

For the Vienna Innerfavoriten case study, the GREENPASS software was used to derive and define, in addition to the status quo, also three greening scenarios and to generate ENVI-met simulation models for the “worst case“, “moderate case”, and “maximum case“ (see Figure 7).

3.2.2. Input Data for MUKLIMO_3 Simulations

For simulations using MUKLIMO_3, the meteorological baseline conditions (temperature, relative humidity, wind speed and direction, cloud cover) were selected in such a way that they corresponded as far as possible with the pre-defined idealised summer‘s day. The land use data have been processed both for the status quo and for the three greening scenarios “moderate case”, “maximum case“, and “worst case“ as appropriate and integrated into the model. The extracted soil sealing input layer based on the UST Status quo is shown in Figure 8.
As it is not possible in MUKLIMO_3 to simulate buildings and trees within one grid cell, the tree proportion has been assigned to low vegetation, an approach that has been used in previous studies (e.g., [67]). In the simulation of the UST greening scenarios, there is one further restriction in relation to facade greening that cannot be simulated by the model. In this way the effects of moderate and maximum greening in MUKLIMO_3 can be studied as a combination of de-sealing, increasing the vegetation proportion and roof greening in the context of sensitivity tests. The impact of the worst case scenario represented by additional sealing at the expense of all existing green spaces, could be simulated by the model by corresponding preparation or modification of the land-use data. The MUKLIMO_3 simulations of the idealised summer’s day for the “status quo” as well as for the three greening scenarios were performed at a horizontal resolution of 100 × 100 m2.

3.2.3. Input Data for COSMO-CLM Simulations

For studies of the possible impact on climate of the four scenarios “status quo“, “moderate case“, “maximum case“, and “worst case“, the corresponding data were extracted for sealing, plant coverage, and tree coverage from the UST maps and generalised in accordance with the possibilities of a regional climate model (see Figure 9). This means that all green infrastructure is combined into the plant coverage parameter. This refers exclusively to horizontal green areas as, at a horizontal resolution of 1 km, no buildings are recorded and therefore facade greening cannot be taken into account. With this data, the input of the climate model is modified accordingly. These simulations include a 100 × 100 km2 area around Vienna with a horizontal resolution of ~1 km.

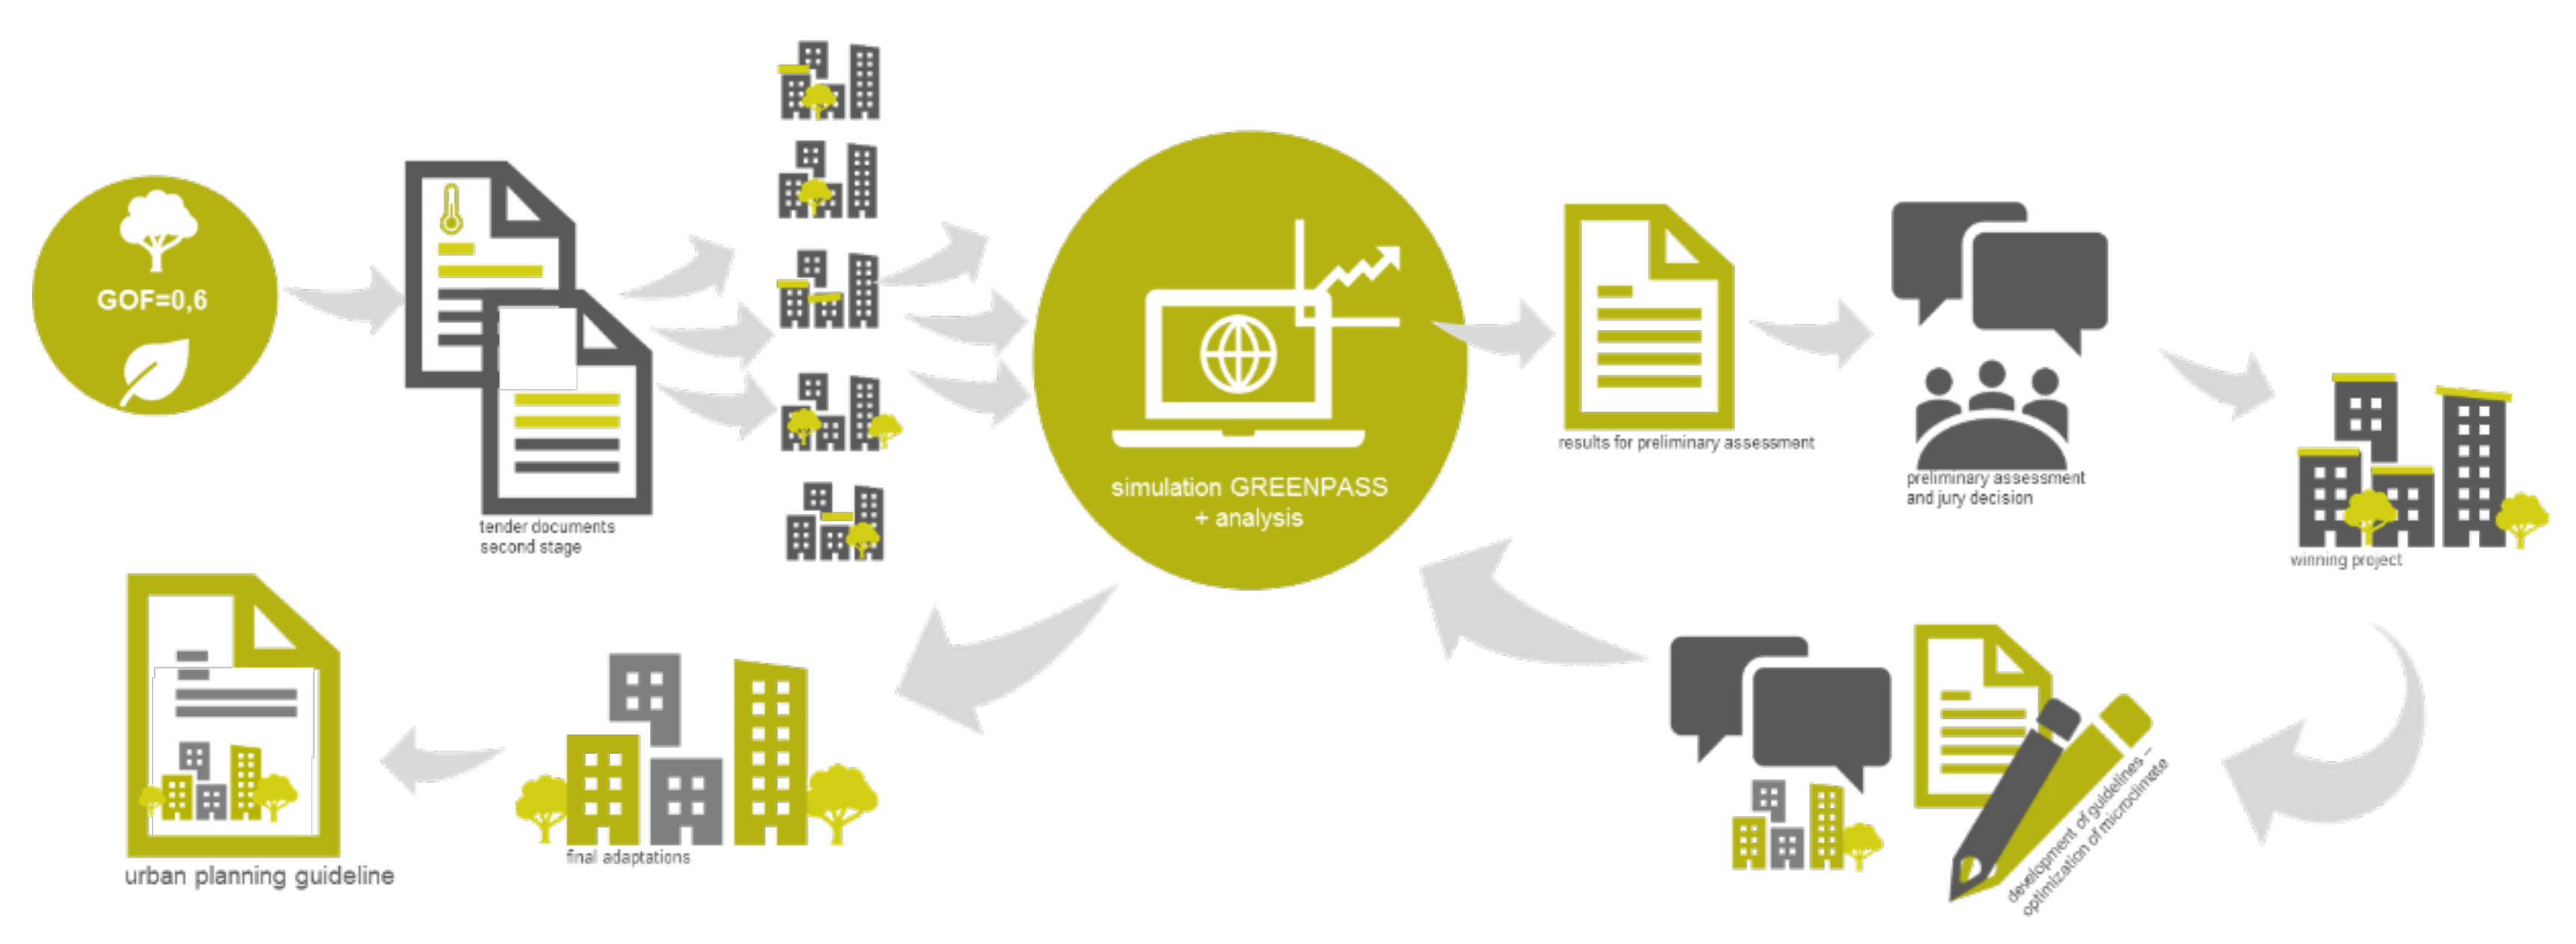
3.3. Joint Use of GREENPASS and GOF in the Aspern Case Study

In the course of an urban planning competition to develop the “Seeterrassen“ quarter (see Figure 10), both GREENPASS and the GOF were used.
The starting point of the case study was a GREENPASS analysis of the development proposal according to the masterplan for the entire Aspern Seestadt as “actual“ condition. Two variants were simulated: 100% sealing and maximum greening. This indicated climate shortcomings (hotspots) due to existing built structures and recommendations derived from them were set down for the competition entrants as climate resilience handbook in the tender documentation.
On the basis of an analysis of existing Aspern Seestadt development and the results of the GREENPASS analysis, a guide value was derived for the GOF to be achieved by the competition entries and also established in the tender documentation (see Figure 11).
Finally, various designs for the masterplan were drawn up by six teams and these were evaluated after submission using GREENPASS and the achieved greening analysed using the GOF. The records were made available to the panel of judges as a joint evaluation report regarding climate resilience performance and green space provision of the six different competition entries including rankings.
After selection of the winning project, it was subjected to a further GREENPASS optimisation process and an improved urban planning model was developed [68]. For this, “hotspots“ in the winning design were analysed, changes in relation to ventilation (e.g., opening of blocks to secure [night-time] ventilation) and the location or quantity of green infrastructure (e.g., facade greening proposed on south-facing facades in the blocks or tree plantations and tree species in the road area to “moderate“ the wind), integrated into the urban planning design and simulated and evaluated again. On the basis of this change in land use or greening, based on the greening proportions of the model used for GREENPASS, target values for the GOF were then determined for individual construction sites. These target values must be achieved by future development projects.

4. Results and Discussion

Below the results of the simulations carried out or the model results are compared using the Favoriten case study. Finally, the results of the joint use of GREENPASS and GOF in the Aspern Case Study and the applicability of the toolset are discussed.

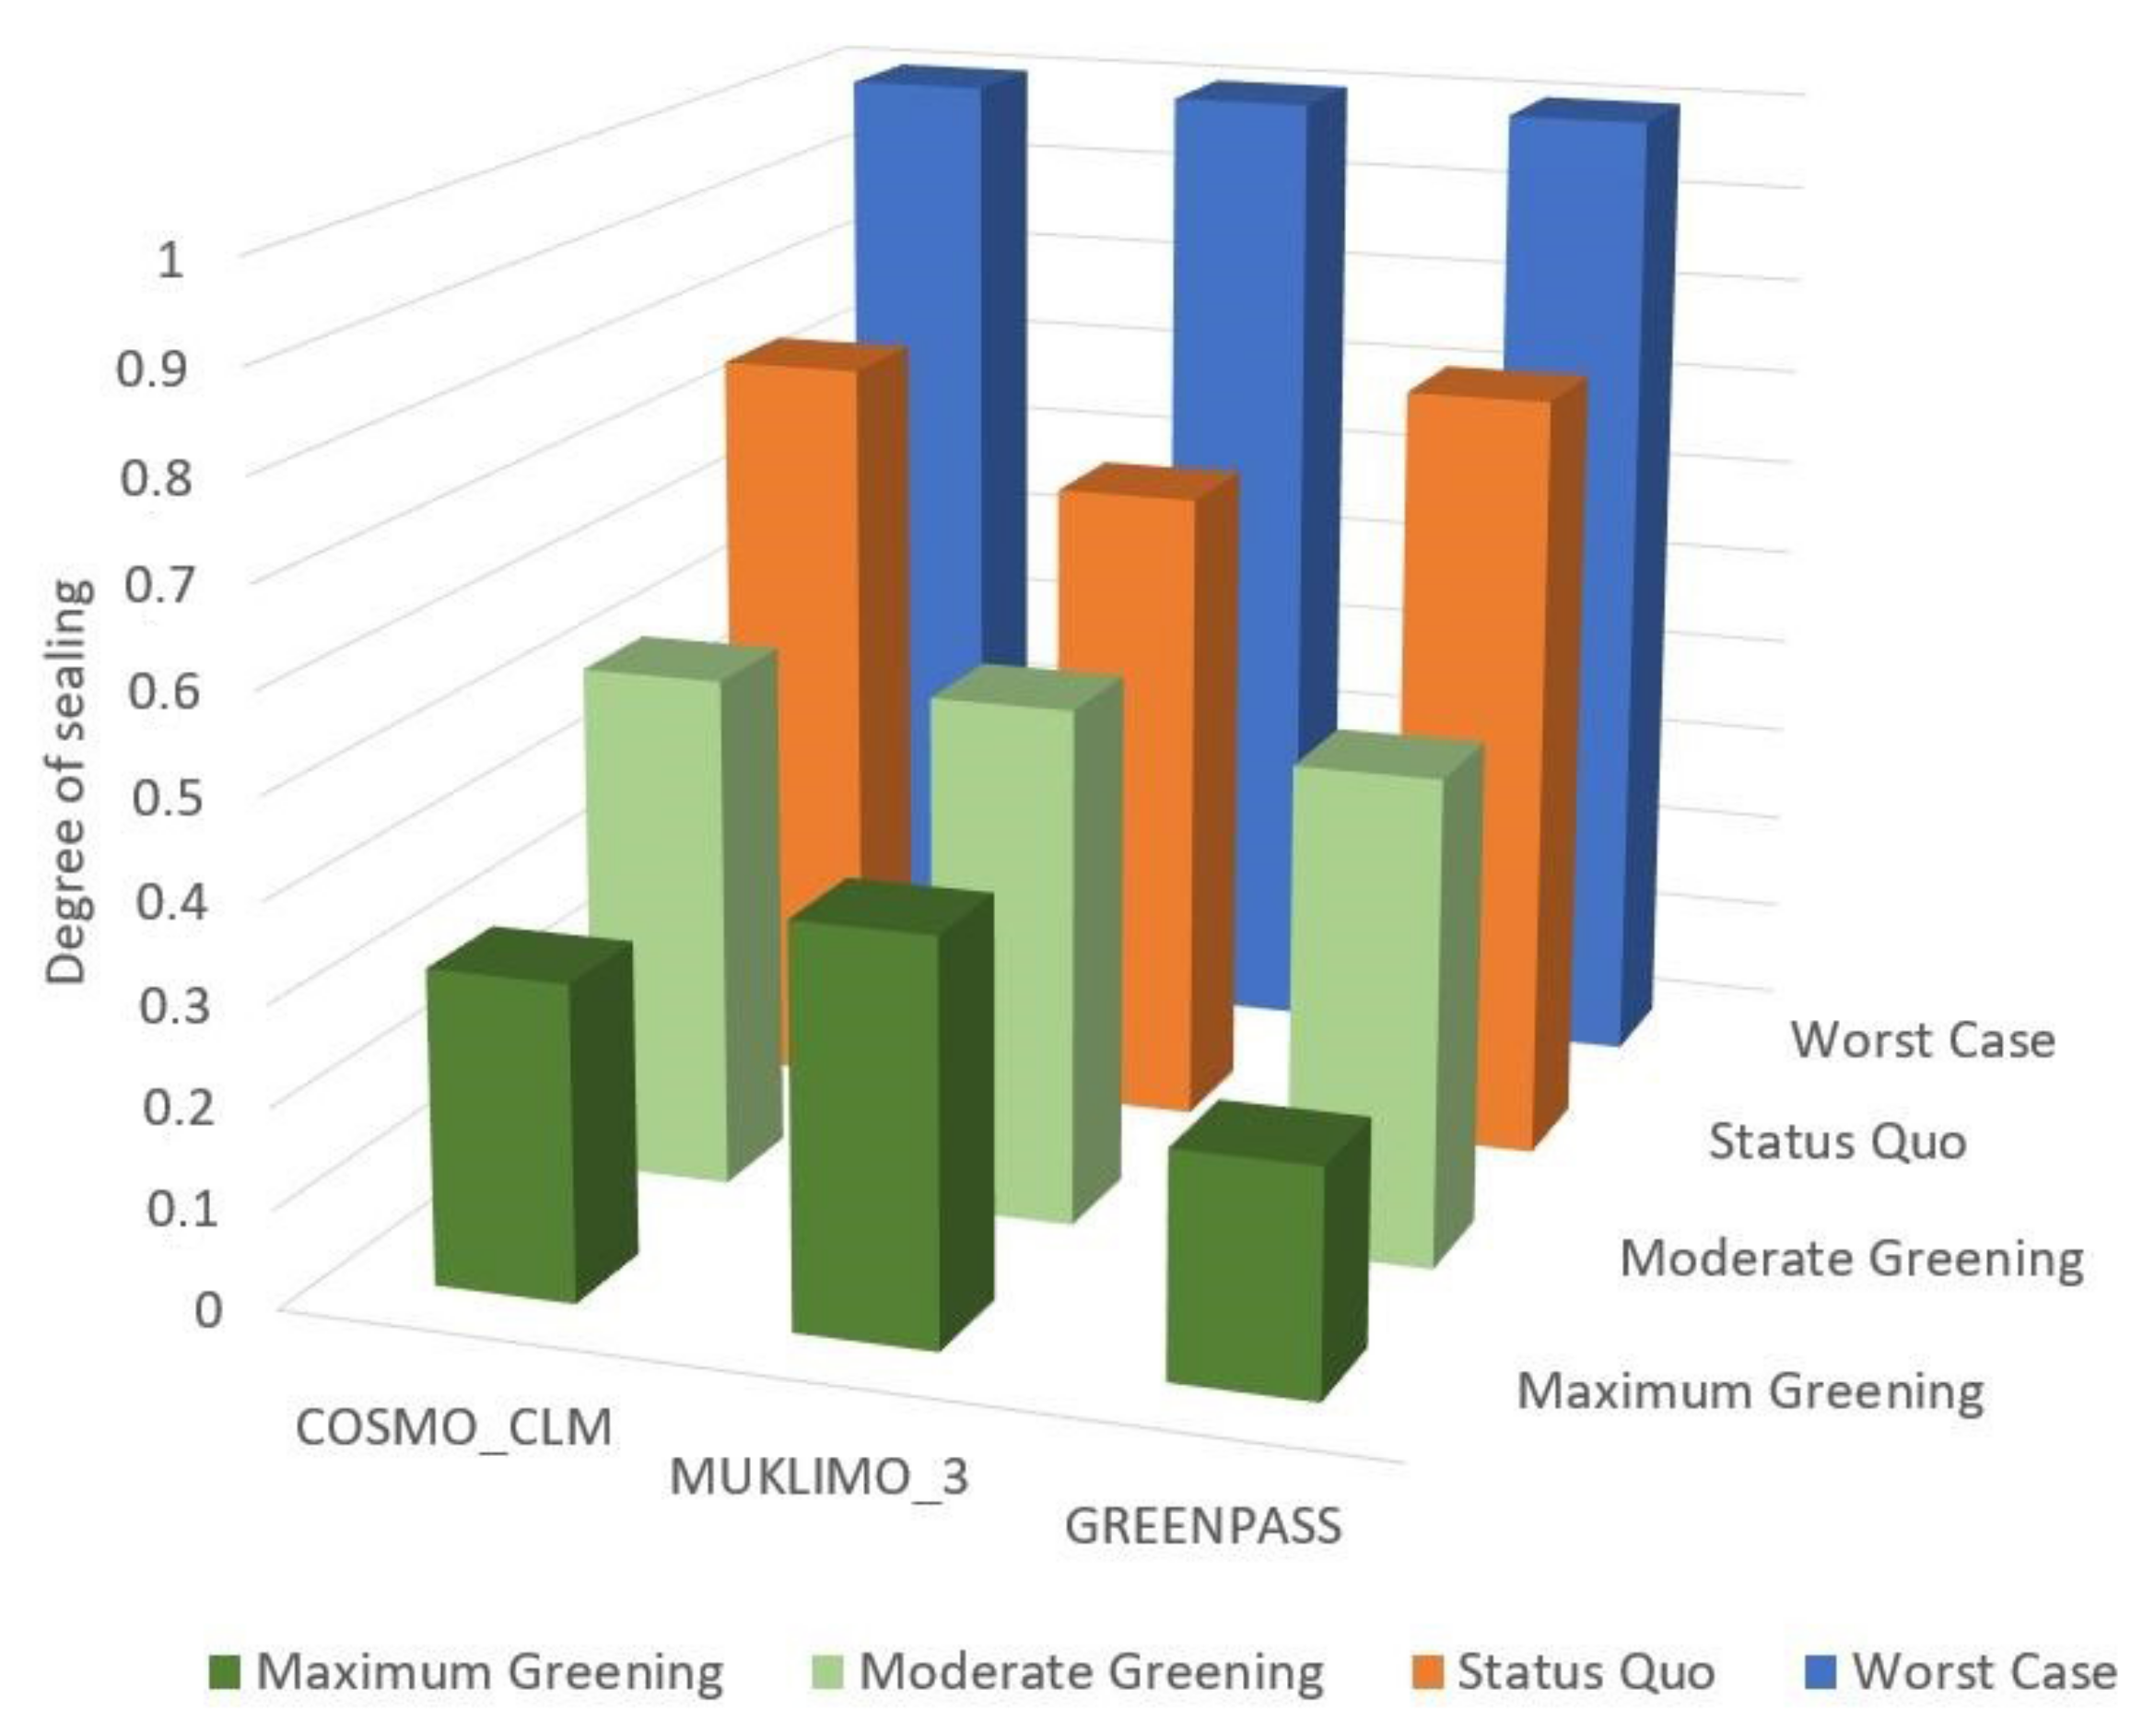
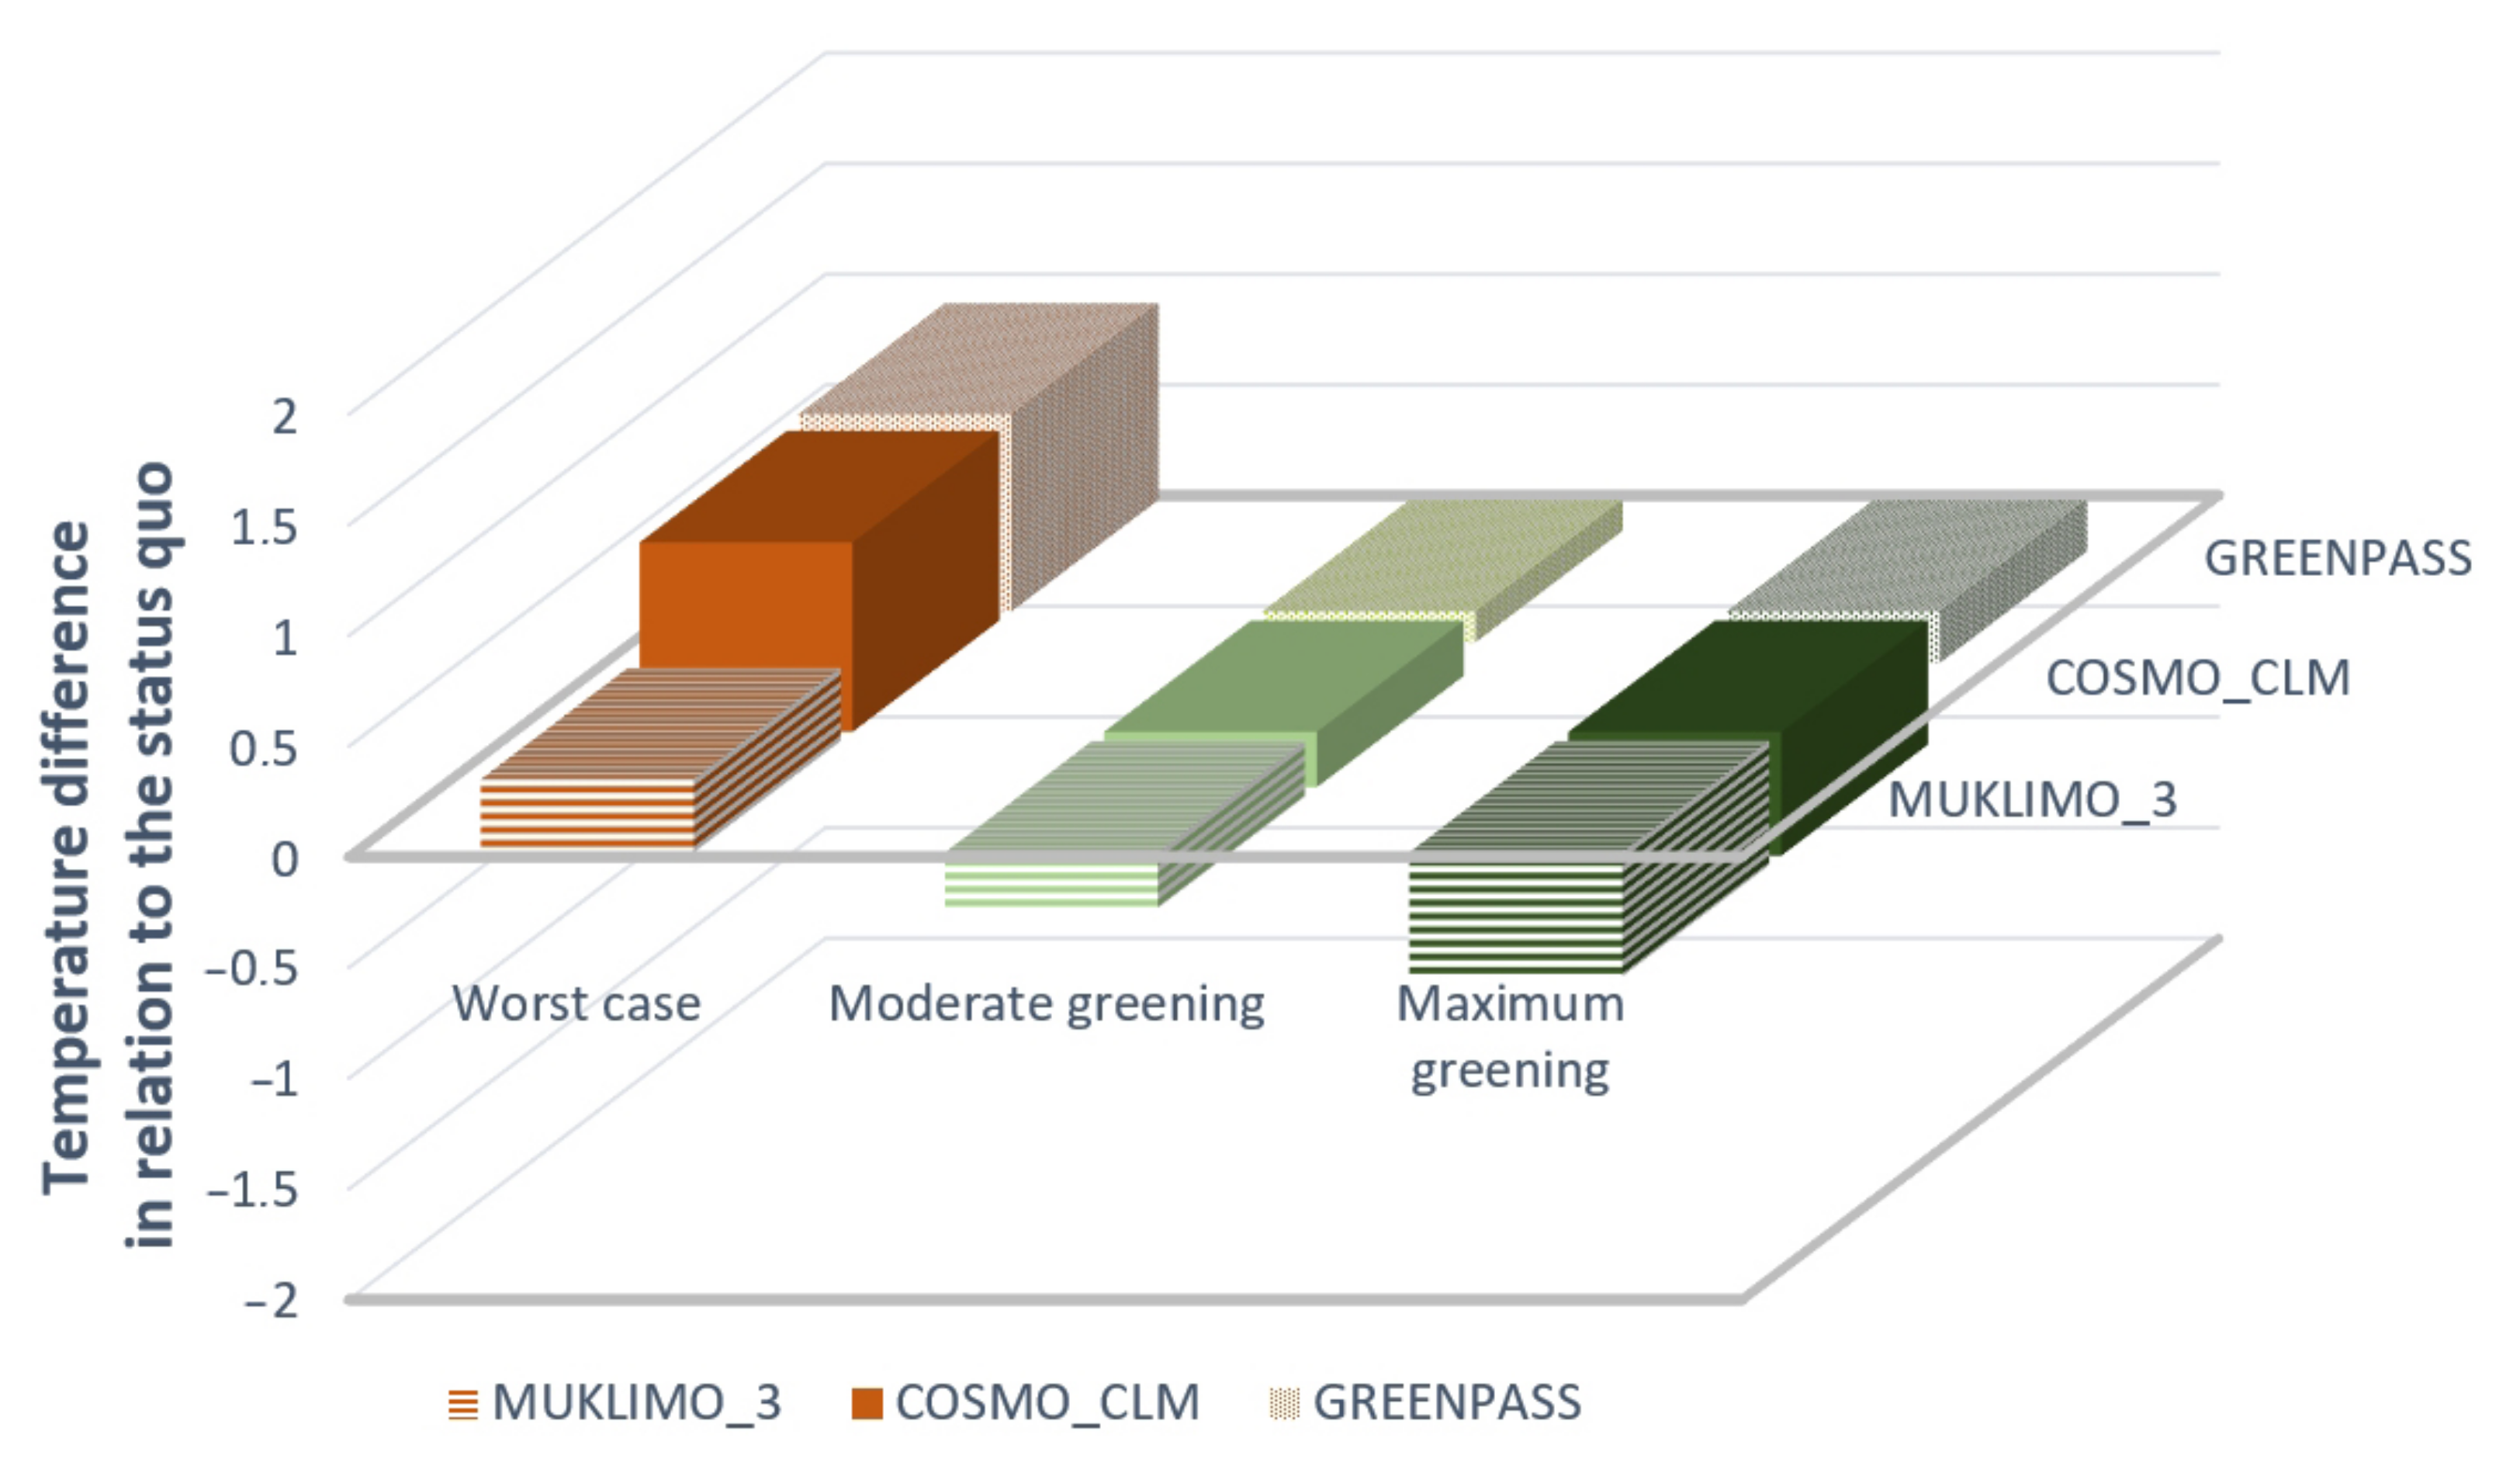
4.1. Comparison of Results of the Different Simulation Models Based on the Favoriten Case Study

The following values in the appropriate grid cells concerning the case study area from the models and the greening scenarios have been compared and contrasted with one another: degree of sealing; proportion of greening; mean temperature over 24 h, daily average (10:00–18:00 h), daily mean value (22:00–6:00 h), maximum temperature in 24 h, minimum temperature in 24 h.
Even in a comparison between the degree of sealing it is apparent that all three models show similar values, but differences are also discernible (see Figure 12). The differences between status quo and maximum greening are the greatest in GREENPASS and COSMO_CLM. Although the degree of sealing is also significantly reduced in the MUKLIMO_3 model by comparison with the status quo for the maximum greening variant, the margin of variation is narrower. As the degree of sealing is complementary to the greening proportion and has significant influence on climate simulations, the findings from this parameter are also found in the temperature values.
In principle, all three models—from regional and urban through to city quarter level—deliver the same conclusions: sealing leads to a rise in temperature and greening to a reduction in temperature. Even if, for example, COSMO-CLM has in principle a lower temperature curve, sealing and greening measures have the same effect in the simulation scenarios. This finding is a significant result as the climate models are completely different in their configuration and modelling and up to now no comparative analysis has been carried out with coordinated input data and time periods.
In detail there are of course differences in the model results which were to be expected due to the completely different scale levels.
Figure 13 below shows the worst-case variant deviation (total sealed area in orange), the moderate greening variant (light green), and the maximum greening variant (dark green) from the status quo (zero line) in all three models. The chart shows the daytime deviations (10:00–18:00 h).
During the daytime in particular sealing in the worst-case scenario in COSMO CLM and GREENPASS indicates a similarly severe effect and leads to a significantly higher mean daytime temperature. In MUKLIMO_3 maximum greening has a more intensive impact in the form of a reduction in daytime temperature. During the night, the greatest impact of sealing and greening is revealed in COSMO-CLM. Here, due to maximum greening, more than 1 °C air temperature reduction and, due to sealing, more than 2 °C air temperature rise are simulated. In MUKLIMO_3 and GREENPASS sealing has a negative impact particularly at night.
Starting from the Vienna Innerfavoriten case study, in the COSMO-CLM and MUKLIMO_3 models, the impact of greening and sealing on other districts of Vienna was observed and compared. In summary, the following conclusions were drawn from the simulations:
In COSMO-CLM the effects of sealing and greening were clearly visible in particular during the night time. In densely constructed districts such as Innerfavoriten, air temperature reductions exceeding 2 °C are possible. During the daytime, greening in COSMO-CLM has only relatively minor effects and the maximum temperatures are only reduced by a negligible amount. By contrast with the only slightly discernible positive effect of greening during the day, sealing has a negative impact even during the day due to increased daytime temperatures. Here again, however, the greatest impact can be seen during the night time. In fringe districts, increases of more than 4 °C are possible.
COSMO-CLM demonstrates one further interesting effect: a reduction in night-time temperatures due to greening becomes increasingly effective as daytime temperatures increase, i.e., if temperatures increase due to climate change, greening has even greater potential than currently to reduce night-time temperatures only. This is apparent in particular in densely built-up areas. Here the impact of greening is significant, whereas it is somewhat lower in the urban fringe districts, although the negative impact of increased sealing is enormous in fringe areas.
In MUKLIMO_3 it was possible to demonstrate that, with moderate and maximum greening measures, a significant reduction in air temperature can be achieved in particular throughout the day. At night, once again, the negative impact of additional sealing became clear. Furthermore, in connection with the greening scenarios, in the context of sensitivity tests, an additional interesting effect was observed concerning in particular ground de-sealing: if the ground moisture is too low, and the ground therefore is extremely dry, the measures demonstrate little or no impact. This is an important point in particular with respect to guaranteeing water supply especially during long hot drought periods.

4.2. Combined Use of GREENPASS and GOF in the Aspern Case Study and Comparison between the Results

Involvement in an urban planning competition in Aspern and the combined use of GOF and GREENPASS were an initial attempt to integrate part of the toolset into specific planning processes.
In Table 1 below the individual competition entries from the different planning teams were compared by thermal comfort and the GOF achieved. The Thermal Comfort Score (TCS) [57,69] is a key performance score within the GREENPASS system and shows the frequency distribution of areas with thermo-physiological stress and expresses the thermal comfort performance in one final number. The TCS results for the different case study drafts served as base for the evaluation frame for the fact-based jury support. The draft with the highest TCS has set the maximum framescore (100%) while the draft with the lowest TCS set the minimum framescore (0%) allowing a ranking of the design drafts regarding climate resilience.
The green and open space factor was calculated on the basis of the values included by the competition entrants or in the designs for the extent of greening which simultaneously also formed the basis for the GREENPASS model.
Evaluation of the competition entries showed some consistency between the tools which were used together for the first time. The competition entry with the highest degree of greening also demonstrated the best results for the thermal comfort score. While the GOF for entries ranking 2, 3, 4, and 5 range from 0.7 to 0.68, the results for the thermal comfort score vary from 0% to 68% of the maximum score. The difference between GREENPASS and GOF can be explained by the different spatial structures of the urban design. These effects could not be taken into account by a GOF.
One further positive finding from the competition was the operability of the use of GOF and GREENPASS. Due to the clear communication of the awarding authority and the importance of the issue of climate resilience, the use of the instruments were positively received. To depict the “hot-spots” within the proposed urban design in maps facilitates the understanding also for those who do not have to deal with climate simulations regularly. Therefore, it was easy for the jury to evaluate the different designs. The use of key performance indicators is also beneficial, as this enables a simple comparison. The same applies to the GOV which makes a quantitative comparison easy with one simple indicator. Moreover, all planning teams were able to apply the documentation and working aids made available and were able to submit the necessary records and plans on time in accordance with the requirements of the research team.

4.3. Implementation of the Toolset in Urban Planning

On an ongoing basis, (interim) results were presented to an advisory board of the city of Vienna in which all planning departments are represented and the opportunities to implement the toolset were examined.
Spatial resolution and level of detail of the climate simulation must be precisely coordinated with the planning level and the level of detail in the planning (see Table 2). Below, taking the city of Vienna as an example it is shown how evaluation and control of adaptation to urban heat can be carried out with the toolset at different scales.
The effects of climate change, but also the impact of adaptation measures do not respect administrative borders [48,68]. The regional development concept is therefore a crucial planning level. Analysis and evaluation of the impact of measures by different regional authorities—i.e., across administrative borders—is the objective here [70]. Analyses can be carried out at this regional level using the COSMO-CLM.
The use of climate models to analyse the current and future development of signals of climate change at whole city level is an approach chosen by many cities (e.g., [71]). With the resolution of the models and the scale level, the effectiveness of planning concepts and city development plans can be verified and scenarios can be simulated for adaptation measures with MUKLIMO_3 (with restrictions also COSMO CLM or GREENPASS/ENVI-met—dependent on the size of the city).
At district or neighbourhood level, it can be useful to link the toolset to the planning instruments of urban development competitions or masterplans as well as zoning and development planning. Simulations with MUKLIMO_3 and GREENPASS/ENVI-met support this planning level, both in existing developments as well as in new builds, as has been shown in the case studies. These planning instruments are also seen as an important level for the use of a GOF in combination with GREENPASS or MUKLIMO_3.
At building plot level, urban planning or architectural qualification processes can be supported by the GREENPASS and the GOF. Individual projects too can be verified and optimised in the course of the building permission (and a target value established for the GOF e.g., through urban development contracts).

5. Conclusions

The combined modelling chain across all three simulation levels and the incorporation of the GOF enables four essential findings to be made from the project: i.e., that: (1) the linking of different simulation models through USTs is possible and useful, (2) despite entirely different tools and scale levels, the applied models tend to deliver similar results and tendencies, (3) the effects of urban greening and unsealing measures on plots, district, city, and regional level can be mapped and evaluated, and (4) the necessary greening amount to ensure the climatic effects can be defined by a target value for and evaluated with the GOF.

5.1. Linking of Different Simulation Models across USTs

Using urban block typologies with different microclimates in climate simulation is a common approach [72,73,74,75]. To use the same USTs as a common basis for the land use information in simulation tools on different scales was a new approach that proves to be useful and effective. This allows to use simulation tools at different climate levels in conjunction with the planning levels. Interfaces between the simulation models could be identified and output data from one model could be used as input data for the simulations at the next spatial level. The approach of using a common idealised day as an input parameter for all simulation tools helps to harmonize the models output as well.

5.2. Models Tend to Deliver Similar Results and Tendencies

To validate models through measurements or to compare the results of different models is necessary and has already been carried out in numerous projects [76,77]. However, the direct comparison of the results of three different models at different levels is new. It has been demonstrated that all three simulation models—from regional (COSMO CLM) down to urban (MUKLIMO_3) and district level (GREENPASS)—correspond to one another in their fundamental results: all three models have been able to prove the positive impact of greening measures on urban climate. This enables direct comparison of climate change adaptation measures by green infrastructures and their effectiveness at different scale levels. At the same time, valuable findings have been made concerning the strengths and weaknesses of the individual models such as resolution, pixel size, mapping of parameters in the models, and simulation accuracy. This has increased the interpretation quality of their results.

5.3. Mapping and Evaluating the Impact of Measures at Plot, District, City and Regional Level

Adaptation to the urban heat island effect must take place at different levels of planning and refer to the appropriate level of detail of the planning instruments. The analysis of the positive effects of different measures, such as unsealing or increasing the greenery to reduce the urban heat island effect, has been proven in numerous research projects on different scales [7,78]. End-to-end analysis and display on different levels is now possible for the first time with the harmonized tools. The combined use of the various simulation tools enables to indicate climate effects at plot, district, city, and regional level. The toolset can also quantify the effect of measures and conversely analyse the greening effects to achieve certain goals, such as reduction of the urban heat island effect on different levels.

5.4. Ensuring the Amount of UGI Necessary Using a GOF

While the use of GOFs to steer UGI is being used in more and more cities [79,80], its combination with microclimatic simulation tools is a novel approach. The amount of the UGI that is necessary to ensure the desired cooling effects can be determined with the simulations using GREENPASS. This amount of greening can be secured by specifying a target value to be achieved for the GOF for the downstream planning processes such as architecture competitions. However, what also became clear is that, for example, the spatial structure or the orientation of facade greening or specific placement is difficult to take into account using a GOF, as only quantitative statements are possible. In the course of further development of the GOF, these aspects may, for instance, be included in consideration of the orientation of facade greening by different evaluations and multiplication factors [65].

5.5. Benefits of Use by Comparison with Other Steering Instruments

Figure 14 below gives an overview of the entire toolset—on the one hand through inputs and outputs of the appropriate climate simulation and steering instruments in support of climate-sensitive urban development, and on the other hand it shows the necessary combination of the steering, evaluation, and optimisation instruments at different climatic scales and planning levels in the form of a multi-scale toolset. Before joint application of the individual simulation tools, in the case studies these have been coordinated with one another, cross-validated, and standardised, so that the input and output parameters could be used on both sides.
The developed multi-scale toolset, in use, contributes several advantages over existing single instruments. Adaptation to climate change is a cross-cutting issue and demands implementation across all planning levels [32]. In order to be able to effectively steer green infrastructure, one of the most important criteria is “multi-scale“, i.e., coordinated planning throughout the various planning levels [81]. With the cross-level toolset, all planning and scale levels as well as planning instruments could be supported. The combination with the GOV enables “spatial adaptive capacity“ to be quantified and statements made and established on the question as to how much green is necessary in a city for effective adaptation to climate change.

6. Outlook

The opportunity in principle to implement a toolset operating across the planning levels has been demonstrated in the course of the proof of concept. In discussions with the advisory board of the city of Vienna, three major challenges were identified in specific implementation and could be of interest for future research projects:
  • the comparatively high technical expense;
  • the necessary resources in municipal administration;
  • a more dynamic approach in the models and model chain to interactively verify more quickly the different effects of measures—in particular different planning variants—at different planning levels (which is also confirmed by current research results [82,83]).

Author Contributions

Conceptualization, F.R. and A.G.; methodology, F.R., C.B., A.G., P.H., A.K., F.K., Z.R., B.S., T.T. and D.D.; software, A.K., F.K. and T.T.; writing—original draft preparation, F.R., A.G., A.K. and T.T.; writing—review and editing, F.R., C.B., A.G., P.H., A.K., F.K., Z.R., B.S., T.T. and D.D.; visualization, F.R., A.G., P.H., A.K., F.K., Z.R. and T.T.; project administration, F.R., C.B., P.H., A.K., F.K., B.S., T.T. and D.D. All authors have read and agreed to the published version of the manuscript.

Funding

The Green.Resilient.City research project was funded by Federal Ministry for Climate Action, Environment, Energy, Mobility, Innovation and Technology (BMK) and carried out as part of the City of the Future (Stadt der Zukunft) research program by FFG., grant number 861673” and “The APC was funded by BOKU Vienna Open Access Publishing Fund”.

Institutional Review Board Statement

Not applicable.

Informed Consent Statement

Not applicable.

Data Availability Statement

Not applicable.

Acknowledgments

We thank Johann Züger (AIT) Brigitta Hollosi, Maja Žuvela-Aloise (ZAMG), for the modelling, Ursula Liebl, Philipp Reisinger (ILAP), Jürgen Preiss (MA 22), Carina Huber and Jakob Kastner (3420) for the project support and their contribution to the project.

Conflicts of Interest

The authors declare no conflict of interest. The funders had no role in the design of the study; in the collection, analyses, or interpretation of data; in the writing of the manuscript, or in the decision to publish the results.

References

  1. United Nations. 2018 Revision of World Urbanization Prospects. Department of Economic and Social Affairs. Available online: https://www.un.org/development/desa/publications/2018-revision-of-world-urbanization-prospects.html (accessed on 19 February 2020).
  2. Yu, S.; Yu, B.; Song, W.; Wu, B.; Zhou, J.; Huang, Y.; Wu, J.; Zhao, F.; Mao, W. View-based greenery: A three-dimensional assessment of city buildings’ green visibility using Floor Green View Index. Landsc. Urban Plan. 2016, 152, 13–26. [Google Scholar] [CrossRef]
  3. Kromp-Kolb, H.; Nakicenovic, N.; Steininger, K.; Gobiet, A.; Formayer, H.; Köppl, A.; Prettenthaler, F.; Stötter, J.; Schneider, J. Österreichischer Sachstandsbericht Klimawandel 2014; Verlag der Österreichischen Akademie der Wissenschaften: Vienna, Austria, 2014; 1096p. [Google Scholar]
  4. Kuttler, W. Klimawandel im Urbanen Bereich. Teil 2, Maßnahmen. 2011. Available online: https://enveurope.springeropen.com/track/pdf/10.1186/2190-4715-23-21?site=enveurope.springeropen.com (accessed on 23 March 2018).
  5. Pauleit, S.; Breuste, J.H. Land-Use and Surface-cover as Urban Ecological Indicators. In Urban Ecology: Patterns, Processes, and Applications; Niemelä, J., Breuste, J.H., Elmqvist, T., Guntenspergen, G., James, P., McIntyre, N., Eds.; Oxford University Press: Oxford, NY, USA, 2011; pp. 19–30. [Google Scholar]
  6. See, L. Urban Climate Change Adaptation for Austrian Cities: Urban Heat Islands; Vienna, Austria. 2020. Available online: https://eocs.blob.core.windows.net/adapt/VorlagePublizierbarerEndberichtStudienForschungADAPT-UHI.pdf (accessed on 20 May 2021).
  7. Žuvela-Aloise, M.; Andre, K.; Schwaiger, H.; Bird, D.N.; Gallaun, H. Modelling reduction of urban heat load in Vienna by modifying surface properties of roofs. Theor. Appl. Climatol. 2018, 131, 1005–1018. [Google Scholar] [CrossRef]
  8. BMLFUW—Bundesministerium für Land- und Forstwirtschaft, Umwelt und Wasserwirtschaft (Ed.) Biodiversitäts-Strategie Österreich 2020+. Vielfalt Erhalten—Lebensqualität und Wohlstand für uns und Zukünftige Generationen Sichern! Bundesministerium für Land- und Forstwirtschaft, Umwelt und Wasserwirtschaft: Vienna, Austria, 2014. [Google Scholar]
  9. Grunewald, K.; Bastian, O. (Eds.) Ökosystemdienstleistungen. Konzept, Methoden und Fallbeispiele; Springer: Berlin/Heidelberg, Germany, 2013. [Google Scholar]
  10. Haaland, C.; van den Bosch, C. Challenges and strategies for urban green-space planning in cities undergoing densification: A review. Urban For. Urban Green. 2015, 14, 760–771. [Google Scholar] [CrossRef]
  11. European Commission. Commission Staff Working Document. Guidance on a Strategic Framework for Further Supporting the Deployment of EU-Level Green and Blue Infrastructure; Brussels, Belgium. 2019. Available online: https://ec.europa.eu/environment/nature/ecosystems/pdf/SWD_2019_193_F1_STAFF_WORKING_PAPER_EN_V4_P1_1024680.PDF (accessed on 3 April 2021).
  12. Derkzen, M.; Teeffelen, A.; Verburg, P. Green infrastructure for urban climate adaptation: How do residents’ views on climate impacts and green infrastructure shape adaptation preferences? Landsc. Urban Plan. 2017, 157, 106–130. [Google Scholar] [CrossRef]
  13. Artmann, M.; Inostroza, L.; Fan, P. Urban sprawl, compact urban development and green cities. How much do we know, how much do we agree? Ecol. Indic. 2019, 96, 3–9. [Google Scholar] [CrossRef]
  14. Sturiale, L.; Scuderi, A. The Role of Green Infrastructure in Urban Planning for Climate Change Adaptation. Climate 2019, 7, 119. [Google Scholar] [CrossRef] [Green Version]
  15. Hansen, R.; Olafsson, A.S.; van der Jagt, A.P.N.; Rall, E.; Pauleit, S. Planning multifunctional green infrastructure for compact cities: What is the state of practice? Ecol. Indic. 2019, 96, 99–110. [Google Scholar] [CrossRef]
  16. Hansen, R.; Pauleit, S. From multifunctionality to multiple ecosystem services? A conceptual framework for multifunctionality in green infrastructure planning for urban areas. Ambio 2014, 43, 516–529. [Google Scholar] [CrossRef] [Green Version]
  17. European Commission. Communication from the Commission to the European Parliament, the Council, the European Economic and Social Committee and the Committee of the Regions: Green Infrastructure (GI)—Enhancing Europe’s Natural Capital. 2013. Available online: https://eur-lex.europa.eu/legal-content/EN/TXT/?uri=CELEX:52013DC0249 (accessed on 3 April 2021).
  18. Naumann, S.; McKenna, D.; Kaphengst, T.; Pieterse, M.; Rayment, M. Design, Implementation and Cost Elements of Green Infrastructure Projects; Final report to the European Commission; DG Environment, Contract no. 070307/2010/577182/ETU/F.1; Ecologic Institute and GHK Consulting: Brussels, Belgium, 2011. [Google Scholar]
  19. Millennium Ecosystem Assessment. Ecosystems and Human Well-Being: Synthesis; Island Press: Washington, DC, USA, 2005; 137p. [Google Scholar]
  20. Pfoser, N.; Jenner, N.; Henrich, J.; Heusinger, J.; Weber, S.; Schreiner, J.; Unten Kanashiro, C. Gebäude Begrünung Energie—Potenziale und Wechselwirkungen; Technische Universität Darmstadt: Darmstadt, Germany, 2013. [Google Scholar]
  21. BBSR—Bundesinstitut für Bau-, Stadt- und Raumforschung (Ed.) Überflutungs- und Hitzevorsorge durch die Stadtentwicklung. Strategien und Maßnahmen zum Regenwassermanagement gegen Urbane Sturzfluten und überhitzte Städte; Bundesinstitut für Bau-, Stadt- und Raumforschung (BBSR) im Bundesamt für Bauwesen und Raumordnung (BBR): Bonn, Germany, 2015. [Google Scholar]
  22. TEEB DE—Naturkapital Deutschland. Ökosystemleistungen in der Stadt—Gesundheit Schützen und Lebensqualität Erhöhen; Kowarik, I., Brenck, M., Eds.; Technische Universität Berlin: Berlin, Germany; Helmholtz-Zentrum für Umweltforschung—UFZ: Leipzig, Germany, 2016. [Google Scholar]
  23. Hop, M.E.C.M.; Hiemstra, J.A. Contribution of Green Roofs and Green Walls to Ecosystem Services of Urban Green. In Proceedings II International Symposium on Woody Ornamentals of the Temperate Zone; Van Huylenbroeck, J., van Labeke, M.C., Laere, K.V., Eds.; ISHS Acta Horticulturae 990: White River, South Africa, 2013; pp. 475–480. [Google Scholar]
  24. Qiu, G.Y.; LI, H.Y.; Zhang, Q.T.; Wan, C.H.E.N.; Liang, X.J.; Li, X.Z. Effects of evapotranspiration on mitigation of urban temperature by vegetation and urban agriculture. J. Integr. Agric. 2013, 12, 1307–1315. [Google Scholar] [CrossRef]
  25. Scholte, S.S.K.; van Teeffelen, A.J.A.; Verburg, P.H. Integrating socio-cultural perspectives into ecosystem service valuation: A review of concepts and methods. Ecol. Econ. 2015, 114, 67–78. [Google Scholar] [CrossRef]
  26. Žuvela-Aloise, M.; Koch, R.; Buchholz, S.; Früh, B. Modelling the potential of green and blue infrastructure to reduce urban heat load in the city of Vienna. Clim. Chang. 2016, 135, 425–438. [Google Scholar] [CrossRef] [Green Version]
  27. Oswald, S.M.; Hollosi, B.; Žuvela-Aloise, M.; See, L.; Guggenberger, S.; Hafner, W.; Prokop, G.; Storch, A.; Schieder, W. Using urban climate modelling and improved land use classifications to support climate change adaptation in urban environments: A case study for the city of Klagenfurt, Austria. Urban Clim. 2020, 31, 100582. [Google Scholar] [CrossRef]
  28. Berardi, U.; Jandaghian, Z.; Graham, J. Effects of greenery enhancements for the resilience to heat waves: A comparison of analysis performed through mesoscale (WRF) and microscale (Envi-met) modeling. Sci. Total. Environ. 2020, 747, 141300. [Google Scholar] [CrossRef]
  29. Gupta, K.; Kumar, P.; Pathan, S.K.; Sharma, K.P. Urban Neighborhood Green Index—A measure of green spaces in urban areas. Landsc. Urban Plan. 2012, 105, 325–335. [Google Scholar] [CrossRef]
  30. Kabisch, N.; Haase, D. Green justice or just green? Provision of urban green spaces in Berlin, Germany. Landsc. Urban Plan. 2014, 122, 129–139. [Google Scholar] [CrossRef]
  31. Vierikko, K.; Elands, B.; Niemelä, J.; Andersson, E.; Buijs, A.; Fischer, L.K.; Haase, D.; Kabisch, N.; Kowarik, I.; Luz, A.C.; et al. Considering the ways biocultural diversity helps enforce the urban green infrastructure in times of urban transformation. Curr. Opin. Environ. Sustain. 2016, 22, 7–12. [Google Scholar] [CrossRef]
  32. Wiener Umweltschutzabteilung (MA 22). Urban Heat Island Strategy—City of Vienna; Municipality of Vienna, Vienna Environmental Protection Department – Municipal Department 22: Vienna, Austria, 2015.
  33. Demuzere, M.; Orru, K.; Heidrich, O.; Olazabal, E.; Geneletti, D.; Orru, H.; Bhave, A.G.; Mittal, N.; Feliu, E.; Faehnle, M. Mitigating and adapting to climate change: Multi-functional and multi-scale assessment of green urban infrastructure. J. Environ. Manag. 2014, 146, 107–115. [Google Scholar] [CrossRef]
  34. Szulczewska, B.; Giedych, R.; Borowski, J.; Kuchcik, M.; Sikorski, P.; Mazurkiewicz, A.; Stańczyk, T. How much green is needed for a vital neighbourhood? In search for empirical evidence. Land Use Policy 2014, 38, 330–345. [Google Scholar] [CrossRef]
  35. Newman, P. Biophilic urbanism: A case study on Singapore, Australian. Planner 2014, 51, 47–65. [Google Scholar] [CrossRef]
  36. Kleerekoper, L.; van Esch, M.; Salcedo, T.B. How to make a city climate-proof, addressing the urban heat island effect. Resour. Conserv. Recycl. 2012, 64, 30–38. [Google Scholar] [CrossRef]
  37. Jakob, A. Der Biotopflächenfaktor als städtebauliche Kennzahl: Vergleich der Anwendung in Berlin, Malmö und Seattle Sowie Erläuterungen Einer Möglichen Anwendung in Wien. Ph.D. Thesis, Technische Universität Wien, Vienna, Austria, 2010. [Google Scholar]
  38. Vartholomaios, A.; Kalogirou, N.; Athanassiou, E.; Papadopoulou, M. The green space factor as a tool for regulating the urban microclimate in vegetation-deprived Greek cities. In Proceedings of the 1st International Conference on “Changing Cities: Spatial, Morphological, Formal & Socio-Economic Dimensions”, Skiathos Island, Greece, 18–21 June 2013. [Google Scholar] [CrossRef]
  39. Hirst, J. Functional Landscapes: Assessing Elements of Seattle Green Factor. Internship Report, Seattle. 2008. Available online: http://www.seattle.gov/dpd/cs/groups/pan/@pan/documents/web_informational/dpds021359.pdf (accessed on 9 July 2020).
  40. Stadtentwicklung und Stadtplanung (MA 18). STEP 2025—Urban Development Plan Vienna; Vienna City Administration, Municipal Department 18 (MA 18)—Urban Development and Planning: Vienna, Austria, 2014.
  41. Stadtentwicklung und Stadtplanung (MA 18). STEP 2025—Urban Development Plan Vienna. Thematic Concept: “Green and Open Spaces“ Sharing the Outdoors; Vienna City Administration, Municipal Department 18 (MA 18)—Urban Development and Planning: Vienna, Austria, 2015.
  42. Vienna Building Code (BO). In Wiener Stadtentwicklungs-, Stadtplanungs- und Baugesetzbuch (Bauordnung für Wien); 2018. Available online: https://www.ris.bka.gv.at/GeltendeFassung.wxe?Abfrage=LrW&Gesetzesnummer=20000006 (accessed on 1 August 2021).
  43. Maruani, T.; Amit-Cohen, I. Open space planning models: A review of approaches and methods. Landsc. Urban Plan. 2007, 81, 1–13. [Google Scholar] [CrossRef]
  44. Jafrin, M.; Beza, B.B. Developing an Open Space Standard in a Densely Populated City: A Case Study of Chittagong City. Infrastructures 2018, 3, 40. [Google Scholar] [CrossRef] [Green Version]
  45. Wang, X.J. Analysis of problems in urban green space system planning in China. J. For. Res. 2009, 20, 79–82. [Google Scholar] [CrossRef]
  46. Ruland, G. Grün- und Freiraumplanung für Wohn- und Stadtquartiere. Beispiele für Planungsprozesse aus Österreich und Europa; Werkstattbericht 105; Vienna City Administration, Municipal Department 18 (MA 18)—Urban Development and Planning: Vienna, Austria, 2010.
  47. Haq, S.M.A. Urban Green Spaces and an Integrative Approach to Sustainable Environment. J. Environ. Prot. 2011, 2, 601–608. [Google Scholar] [CrossRef] [Green Version]
  48. EEA—European Environment Agency. Fast Track Service Precursor on Land Monitoring: Degree of Soil Sealing. 2009. Available online: https://www.eea.europa.eu/data-and-maps/data/eea-fast-track-service-precursor-on-land-monitoring-degree-of-soil-sealing-100m (accessed on 7 September 2020).
  49. Zardo, L.; Geneletti, D.; Pérez-Soba, M.; Van Eupen, M. Estimating the cooling capacity of green infrastructures to support urban planning. Ecosyst. Serv. 2017, 26, 225–235. [Google Scholar] [CrossRef]
  50. Wolfram, M.; Frantzeskaki, N.; Maschmeyer, S. Cities, systems and sustainability: Status and perspectives of research on urban transformations. Curr. Opin. Environ. Sustain. 2016, 22, 18–25. [Google Scholar] [CrossRef]
  51. BMWi—Bundesministerium für Wirtschaft und Energie. Freiräume für Innovationen. Das Handbuch für Reallabore. Frankfurt. 2019. Available online: https://www.bmwi.de/Redaktion/DE/Publikationen/Digitale-Welt/handbuch-fuer-reallabore.pdf?__blob=publicationFile (accessed on 1 September 2020).
  52. Rockel, B.; Will, A.; Hense, A. The regional climate model COSMO-CLM (CCLM). Meteorol. Z. 2018, 17, 347–348. [Google Scholar] [CrossRef]
  53. Wouters, H.; Varentsov, M.; Blahak, U.; Schulz, J.P.; Schättler, U.; Bucchignani, E.; Demuzere, M. User Guide for TERRA_URB v2.2: The Urban-Canopy Land-Surface Scheme of the COSMO Model. 2017. Available online: http://www.cosmo-model.org/content/tasks/workGroups/wg3b/docs/terra_urb_user.pdf (accessed on 20 May 2021).
  54. Sievers, U. Dreidimensionale Simulationen in Stadtgebieten; Umweltmeteorologie, Schriftenreihe Band 15; Kommission Reinhaltung der Luft im VDI und DIN: Düsseldorf, Germany, 1990; pp. 92–105. [Google Scholar]
  55. Sievers, U. Verallgemeinerung der Stromfunktionsmethode auf drei Dimensionen (Generalization of the streamfunction vorticity method to three dimensions). Meteorol. Z. 1995, 4, 3–15. [Google Scholar] [CrossRef]
  56. Früh, B.; Becker, P.; Deutschländer, T.; Hessel, J.-D.; Kossmann, M.; Mieskes, I.; Namyslo, J.; Roos, M.; Sievers, U.; Steigerwald, T.; et al. Estimation of climate-change impacts on the urban heat load using an urban climate model and regional climate projections. J. Appl. Meteorol. Climatol. 2011, 50, 167–184. [Google Scholar] [CrossRef]
  57. European Commission—Directorate-General for Research and Innovation Directorate C—Healthy Planet Unit C3. Climate and Planetary Boundaries. In Evaluating the Impact of Nature-Based Solutions: A Handbook for Practitioners, 1st ed.; Publications Office of the European Union: Luxembourg; Brussels, Belgium, 2021; ISBN 978-92-76-22961-2. [Google Scholar] [CrossRef]
  58. Kraus, F.; Scharf, B. IT-gesteuerte Natur in der dichten Stadt. In Neue Landschaft; Patzer Verlag: Hannover, Germany, 2020. [Google Scholar]
  59. Kraus, F.; Scharf, B. Management of Urban Climate Adaptation with NBS and GREENPASS®; EGU General Assembly: Vienna, Austria, 2019; Volume 21. [Google Scholar]
  60. Scharf, B. Coole Städte planen–Mit der "Greenpass-Methode". In Neue Landschaft; Patzer Verlag: Hannover, Germany, 2018; ISSN 0548-2836. [Google Scholar]
  61. Scharf, B.; Kraus, F.; Vali, N. Ein vertikaler Park für Wien. In Neue Landschaft; Patzer Verlag: Hannover, Germany, 2020; ISSN 0548-2836. [Google Scholar]
  62. Scharf, B.; Kraus, F. Green Roofs and Greenpass. Buildings 2019, 9, 205. [Google Scholar] [CrossRef] [Green Version]
  63. Järvelä, E. Developing a Green Factor Tool for the City of Helsinki. Ed. City of Helsinki Environment Centre. Helsinki. 2008. Available online: https://ilmastotyokalut.fi/files/2014/11/Developing_Helsinki_Green_Factor_Summary_13032014.pdf (accessed on 5 October 2020).
  64. Juhola, S. Planning for a green city: The Green Factor tool. Urban For. Urban Green. 2018, 34, 254–258. [Google Scholar] [CrossRef]
  65. Landschaft Planen & Bauen; Becker, G.; Mohren, R. Der Biotopflächenfaktor als ökologischer Kennwert: Grundlagen zur Ermittlung und Zielgrößenbestimmung. Auszug, Berlin. 1990. Available online: https://www.berlin.de/sen/uvk/natur-und-gruen/landschaftsplanung/bff-biotopflaechenfaktor/ (accessed on 9 April 2020).
  66. Ring, Z.; Damyanovic, D.; Reinwald, F. Green and open space factor Vienna: A steering and evaluation tool for urban green infrastructure. Urban For. Urban Green. 2021, 62, 127131. [Google Scholar] [CrossRef]
  67. Žuvela-Aloise, M.; Koch, R.; Neureiter, A.; Böhm, R.; Buchholz, S. Reconstructing urban climate of Vienna based on historical maps dating to the early instrumental period. Urban Clim. 2014, 10, 490–508. [Google Scholar] [CrossRef]
  68. Wien 3420 Aspern Development AG (2020) Workflow—Moderne Arbeitswelten in Der Seestadt. 4. Ausgabe. Available online: https://www.aspern-seestadt.at/infocenter/downloads/downloads_detail?downloads_id=1582220985956 (accessed on 20 May 2021).
  69. European Commission–DC Research & Innovation. Evaluating the Impact of Nature-Based Solutions—Appendix of Methods; European Union: Brussels, Belgium, 2021; ISBN 978-92-76-22960-5. [Google Scholar]
  70. Van Eerd, M.; Wiering, M.A.; Dieperink, C. Exploring the Prospects for Cross-Border Climate Change Adaptation between North Rhine-Westphalia and the Netherlands. Utrecht Law Rev. 2014, 10, 91. [Google Scholar] [CrossRef]
  71. SUM Konferenz 2019. “Klimawandelanpassung in der Stadtregion“. Available online: https://www.stadt-umland.at/dialog/sum-konferenz/sum-konferenz-2019.html (accessed on 20 May 2021).
  72. Stiles, R.; Gasienica-Wawrytko, B.; Hagen, K.; Trimmel, H.; Loibl, W.; Köstl, M.; Tützer, T.; Pauleit, S.; Schirmann, A.; Feilmayr, W. Urban Fabric Types and Microclimate Response—Assessment and Design Improvement; Final Report; TU Wien: Vienna, Austria, 2014. [Google Scholar]
  73. Hamdi, R.; Kusaka, H.; Doan, Q.V.; Cai, P.; He, H.; Luo, G.; Kuang, W.; Caluwaerts, S.; Duchêne, F.; van Schaeybroek, B.; et al. The State-of-the-Art of Urban Climate Change Modeling and Observations. Earth Syst. Environ. 2020, 4, 631–646. [Google Scholar] [CrossRef]
  74. Hagen, K.; Gasienica-Wawrytko, B.; Loibl, W.; Pauleit, S.; Stiles, R.; Tötzer, T.; Trimmel, H.; Köstl, M.; Feilmayr, W. Smart Environment for Smart Cities: Assessing Urban Fabric Types and Microclimate Responses for Improved Urban Living Conditions. CORP 2014. Available online: http://corp.at/archive/CORP2014_33.pdf (accessed on 20 May 2021).
  75. Stiles, R.; Gasienica-Wawrytko, B.; Hagen, K.; Trimmel, H.; Loibl, H.; Tötzer, T.; Köstl, M.; Pauleit, P.; Schirmann, A.; Feilmayr, W. Understanding the whole city as landscape. A multivariate approach to urban landscape morphology. SPOOL 2014, 1, 401–418. [Google Scholar] [CrossRef]
  76. Flato, G.; Marotzke, B.; Abiodun, P.; Braconnot, S.C.; Chou, W.; Collins, P.; Cox, F.; Driouech, S.; Emori, V.; Eyring, C.; et al. Evaluation of Climate Models. In The Physical Science Basis. Contribution of Working Group I to the Fifth Assessment Report of the Intergovernmental Pane on Climate Change; Stocker, T.F., Qin, D., Plattner, G.-K., Tignor, M., Allen, S.K., Boschung, J., Nauels, A., Xia, Y., Bex, V., Midgley, P.M., Eds.; Cambridge University Press: Cambridge, UK; New York, NY, USA, 2018; pp. 741–866. [Google Scholar]
  77. Vaittinada, A.; Vrac, M.; Mailhot, A. Ensemble bias correction of climate simulations: Preserving internal variability. Sci. Rep. 2021, 11, 3098. [Google Scholar] [CrossRef]
  78. Musco, F. (Ed.) Counteracting Urban Heat Island Effects in a Global Climate Change Scenario; Springer: Basel, Switzerland, 2016; ISBN 978-3-319-10425-6. [Google Scholar] [CrossRef]
  79. Bush, J.; Ashley, G.; Foster, B.; Hall, G. Integrating Green Infrastructure into Urban Planning: Developing Melbourne’s Green Factor Tool. Urban Plan. Green Infrastruct. 2021, 6, 20–31. [Google Scholar] [CrossRef]
  80. Massini, P.; Smith, H. Planning for Green Infrastructure—The Green Space Factor and Learning from Europe; PERFECT Expert Paper 6; Town and Country Planning Association: London, UK, 2018. [Google Scholar]
  81. Lindberg, F.; Grimmond, C.; Gabey, A.; Huang, B.; Kent, C.; Sun, T.; Theeuwes, N.; Järvi, L.; Ward, H.; Capel-Timms, I.; et al. Urban Multi-scale Environmental Predictor (UMEP): An integrated tool for city-based climate services. Environ. Model. Softw. 2018, 99, 70–87. [Google Scholar] [CrossRef]
  82. Monteiro, R.; Ferreira, J.C. Green Infrastructure Planning as a Climate Change and Risk Adaptation Tool in Coastal Urban Areas. J. Coast. Res. 2020, 95, 889–893. [Google Scholar] [CrossRef]
  83. AIT 2021. CIL opening Parametric Model. Available online: https://cities.ait.ac.at/site/index.php/2019/10/31/cil-opening-parametric-model/ (accessed on 20 May 2021).
Figure 1. GOF and climate simulation instruments at various scale levels—downscaling from regional to site level (Reinwald et al., 2019).
Sustainability 13 12111 g001
Figure 2. As a joint basis for the land use information used in the different simulation tools the urban standard typologies were assigned to the various urban structures of the City of Vienna (Green4Cities/GREENPASS, 2018).
Sustainability 13 12111 g002
Figure 3. Processing of UST data for integration into COSMO-CLM (AIT).
Sustainability 13 12111 g003
Figure 4. 2-m daily temperature cycle for the idealised summer day (19 July 2014) in COSMO-CLM used as input parameter for the two other climate simulation tools (AIT).
Sustainability 13 12111 g004
Figure 5. Screenshot of Favoriten case study area in GREENPASS Software (Green4Cities/GREENPASS, 2018).
Sustainability 13 12111 g005
Figure 6. Example of greening scenarios of an urban standard typology (SQ = status quo of greening; WC = worst case (no greening); MOD = moderate case; Max = maximum case) (Green4Cities/GREENPASS, 2018).
Sustainability 13 12111 g006
Figure 7. GREENPASS scenarios and simulation models ground plan: status quo (1), worst case (2), moderate case (3), and maximum case (4) (Green4Cities/GREENPASS, 2018).
Sustainability 13 12111 g007
Figure 8. Overall sealing in MUKLIMO_3 based on UST status quo (SQ) (ZAMG, 2020).
Sustainability 13 12111 g008
Figure 9. Sealing layer in the variants “status quo” (SQ), “moderate greening” (MOD), and “maximum greening“ (MAX) as input data for regional climate simulation. The grid cells in the Innerfavoriten case study are highlighted in red (AIT).
Sustainability 13 12111 g009
Figure 10. Overview of the Aspern case study area (Wien 3420 Aspern Development AG, 2018).
Sustainability 13 12111 g010
Figure 11. The process of competition preparation to urban planning guideline and the use of GREENPASS and GOF (Wien 3420 Aspern Development AG).
Sustainability 13 12111 g011
Figure 12. Degree of sealing in the different simulation models by scenario (AIT/ZAMG/Green4Cities).
Sustainability 13 12111 g012
Figure 13. Range (sealing/worst case [orange], moderate greening [light green] and maximum greening [dark green]) of temperature difference (in °C) relative to the status quo in the three simulation models for day time (AIT/ZAMG/Green4Cities).
Sustainability 13 12111 g013
Figure 14. The multi-scale Green.Resilient.City toolset as steering, evaluation and optimisation investment at various climate and planning levels (ILAP/GRC project consortium).
Sustainability 13 12111 g014
Table 1. Comparison of thermal comfort with the GOF achieved in the evaluation of the competition entries.
Competition EntryThermal ComfortRank—Thermal ComfortGOF AchievedRank—GOF Achieved
A10010.771
B6220.702
C4830.703
D4440.694
E4150.606
F060.685
Table 2. Coordination of climate simulation, planning scale levels, as well as planning levels and instruments (ILAP).
Climate Simulation Tools and
Green and Open Space Factor
Scale Levels and Spatial Resolution of Simulation ToolsPlanning Levels and Planning Instruments
COSMO-CLMRegional-/meso-climate
(1–10 km)
Beyond the city borders/
metropolitan area/regional
Regional development concepts and strategies
(COSMO-CLM)
MUKLIMO_3
(GREENPASS/ENVI-met)
Meso-/local-climate
(100 m–1 km)
City
Urban development concept
MUKLIMO_3
GREENPASS/ENVI-met
GOF
Local-/micro-climate
(20–100 m)
District
Zoning and development plan;
urban development competitions;
masterplans
GREENPASS/ENVI-met
GOF
Micro-climate
(0.5–20 m)
Urban quarter/plot
Architectural competition;
Urban development contract;
Building permission
Publisher’s Note: MDPI stays neutral with regard to jurisdictional claims in published maps and institutional affiliations.

