Article

The Economic Resilience Cycle Evolution and Spatial-Temporal Difference of Tourism Industry in Guangdong-Hong Kong-Macao Greater Bay Area from 2000 to 2019

1
College of Geosciences and Tourism, Hanshan Normal University, Chaozhou 521000, China
2
China Center for Special Economic Zone Research Shenzhen University, Shenzhen 518000, China
3
College of Tourism and Service Management, Nankai University, Tianjin 300350, China
4
Faculty of International Tourism and Management, City University of Macau, Macau 999078, China
*
Author to whom correspondence should be addressed.
Sustainability 2021, 13(21), 12092; https://doi.org/10.3390/su132112092
Submission received: 3 October 2021 / Revised: 23 October 2021 / Accepted: 27 October 2021 / Published: 2 November 2021
(This article belongs to the Special Issue Big Data and Sustainability in the Tourism Industry)

Abstract

:
Based on the tourism industry economic panel data, this research divides and measures the tourism industry’s economic resilience cycle in the Guangdong-Hong Kong-Macao Greater Bay Area (GBA) by constructing a counterfactual function and exploring the evolution of its Spatial-Temporal difference characteristics in the past 20 years. Estimation results show that three out of the four Recession–Recovery cycles of GBA have been characterized as “creative destruction”. Moreover, the economic resilience values and fluctuation trends of the individual tourism industries in the GBA are quite different. Additionally, the economic resilience of the urban tourism industry has changed from centralized to discrete, and the trend of economic resilience of the tourism industry has changed from low toughness to concentrated. This study expands the practice of resilience theory in the tourism industry economy, and it reveals the difference of tourism industry resilience in the metropolitan area system of GBA urban agglomeration from the perspective of industrial economic resistance and resilience.

1. Introduction

Reverse globalization has challenged the sustainable development of the regional tourism economy in a new way. The trade war between China and the United States has led to increasingly severe reverse globalization and even “temporary deglobalization”. The world economy has been dramatically affected. China is accelerating the establishment of a “dual circulation” economic development pattern in which the domestic economic cycle plays a leading role while the international economic cycle remains its extension and supplement. As a new geographical unit for a country to participate in global competition and international division of labor, urban agglomeration inevitably takes place when China’s new industrialization and new urbanization develop to a higher level [1]. It has become a core area with the highest vitality and potential in the current and future pattern of economic development [2].
Regional economic resilience plays a vital role in the industrial economy. Higher regional economic resilience helps regional economies develop tourism without being locked in the path [3]. Resilience is the ability of a region to sustain long-term development while recovering from a shock after undergoing changes, adaptations, and transformations [4,5,6]. The tourism economy also needs to focus on domestic demand and improve its resilience. Unlike destination vulnerability and crisis management studies that emphasize regional changes, resilience studies have a systemic mindset [7] and are consistent with the development pattern of “dual circulation”. Resilience studies are a key supplement to regional crisis studies [7] because they build on crisis management, have intuitive representations of system stability and response [7], and assert the system’s ability to adapt, respond, and evolve [3,7].
In 2019, the Guangdong-Hong Kong-Macao Greater Bay Area (GBA) had a population of 72.67 million, a regional GDP of more than 11 trillion yuan, and a total tourism revenue of 1225.12 billion yuan, creating about 14% of the country’s total economic output with a land area of 0.6%, and its tourism revenue accounted for 18.52% of China. As one of the regions with the highest level of openness and strongest economic vitality, the urban agglomeration of the GBA enjoys an important strategic position in China’s macroeconomic pattern. Residents’ diversified consumption patterns in the GBA have contributed to expanded consumption scale, upgraded consumption structure, and an ever-increased share of developmental and enjoyment goods such as expenditure on education, culture, and entertainment [8]. Many studies have been carried out on the GBA’s tourism economy and tourism industry regarding the scale difference of inbound tourism [9], the competitiveness of urban tourism [10], the spatial structure and collaborative mode of tourism economic connections [11], etc., as part of the research on the top-level design of policies.
However, the tourism economic resilience of GBA has not been systematically studied. Especially, there is no accurate analysis of differences in the tourism economic resilience of cities within the urban agglomeration. Since the GBA is one of the most economically developed regions in China, an in-depth study of its tourism economy facilitates a thorough understanding of the development rules of urban agglomerations and provides a decision-making aid for the economic security system of GBA. Based on the framework of resilience, the key objectives of the study are to analyze and measure the tourism economic resilience of the current situation in GBA, provide theoretical support to comprehensively measure the sustainable development levels of tourism economic resilience in GBA, and give suggestions for the future development of tourism economic resilience in GBA.
With the cyclical nature of macroeconomic conditions, an analysis of the performance and causes of resilience differences of units in urban agglomeration under the same shocks will provide valuable theoretical basis for the sustainability development strategies of GBA and policy recommendations for the diversified regional conditions in the development of GBA. In this paper, a GBA panel database from 2000 to 2019 was explored to measure the tourism economic resilience of GBA based on a counterfactual function, which is followed by a systematically analysis of different “recession–recovery” cycles. Three research questions are explored: (1) What are the differences in the GBA’s overall and urban resilience, and what are the spatiotemporal heterogeneity characteristics of GBA? (2) What is the tourism economic resilience of cities of GBA during different “recession–recovery” cycles? (3) What are the resistance and recoverability of the core cities in the GBA?
The next section presents and reviews previous studies on resilience theory and tourism economic resilience. Section 3 presents methodology and data. Estimation results and findings from the proposed models are analyzed in Section 4. Section 5 reveals the research conclusions and discussion, and finally, Section 6 presents the policy implications.

2. Research on Resilience Theory and Tourism Economic Resilience

The resilience concept originated in engineering and ecological sciences [12]. In economics studies, resilience refers to the ability of an economic system to return to its balanced state following a shock [6,13]. It comprises four dimensions: resistance (the ability of an economy to respond to a shock), absorption (the ability of an economy to absorb a shock), recovery (the ability of an economy to return to its initial state), and reorganization (the ability of an economy to structurally change and restore balance above its initial state) [4]. Recently, economic geographers considered “resilience” to be similar to the economic geography evolutionary concept [14]. They introduced resilience to regional economic development by proposing the “regional resilience” concept [15]. Regional resilience refers to the ability of a regional economy to resist or recover from the market, competitive, and environmental shocks and to transit to a new sustainable development path [6,16] in response to various economic, political, and environmental shocks [17]. Simmie and Martin defined regional economic resilience as the “adaptive capacity” of an economic system, which means the ability of a region or local firms to adapt to changes and shocks under competitive market, technological, and policy conditions [18]. The Chinese resilience studies are focused on the coal sector [19], industries [6], old industrial bases [20], the electronic information sector [21], etc.
Prior studies indicated that tourism development can reduce regional income inequality [22] and cause economic development [23,24,25]. Tourism is an important key sector in regional and national economies, which appears to have often a favorable recovery potential after a shock, leading to the notion of resilience capacity of regions [26]. Since the mid-1990s, scholars have conducted resilience research regarding tourism. Farrell and Twining-Ward described tourism as an evolving complex system that includes local people’s aspirations and values as well as local geographic features [27]. They considered it an integrated industry with a high degree of industrial relevancy and a more complex state of regional resilience. Scholars have conducted ongoing in-depth studies on the tourism resilience in regions such as Wenchuan in China [28], EU regions [26], U.S. [22,29], Kaikoura [30], Italy [31], Las Vegas [32], British Columbia, Canada [33], India [34], and a community in KwaZulu-Natal, South Africa [35]. However, industrial resilience studies at a national dimension obscure intra-regional difference [20]. Few research studies have concentrated on the evolutionary mechanisms of regional economic resilience that urban agglomeration has to respond to shocks.
Currently, research findings on regional resilience provide new ideas to explore the evolutionary process of “recession–recovery” that the regional tourism economy undergoes when suffering from external shocks. Martin believed that regional economic resilience involves vulnerability, resistance, adaptation, and recoverability [36]. More vulnerable regions are less able to resist disturbances and shocks and take longer to recover from shocks, while the opposite is true for less vulnerable regions. Martin et al. developed a counterfactual function-based model for measuring regional economic resilience based on indicators such as GDP growth change [20,37], and employment rate [38]. They further elaborated on the evolutionary process of regional resilience of industries.

3. Research Methods and Data Sources

3.1. Measurement of the GBA’s Tourism Economic Resilience

This study explores the differences in the tourism economic resilience in the regional economic systems of GBA cities when responding to common shocks and disturbances. Concerning indicator selection, Irwin et al. considered it inappropriate to measure resilience using a single variable [39]. Therefore, given the research purpose and demand, this study performed iterative experiments and then chose the tourism GDP growth change and the gross tourism output value as indicators to measure the economic resilience of urban tourism, by referring to the findings of Martin et al. who chose GDP [19,40] and employment rate [41] changes as indicators.
A counterfactual function that reveals a city’s expected economic output has a pioneering role in the study of regional resilience [38]. It can be constructed to measure the economic resistance and recoverability of cities and sub-industries at different stages, thus shedding light on the evolutionary characteristics of regional economic resilience [20]. Using the same method, this study explored a counterfactual function to measure the regional resilience of the tourism economy in the GBA. The change in a city’s expected economic output is calculated as follows.
( Δ R i t + k ) expect = j n R i j t G t + k
In Equation (1), ( Δ R i t + k ) expect   is the change in the expected economic output of the tourism industry in city i during a period of (t + k); R i j t is the economic output of tourism industry j in city i in the starting year t ; n is the number of industries and is 1 here; G t + k is the rate of change in the economic output of the tourism industry in the GBA during a period of (t + k).
The resistance is calculated as follows:
R e s i s t a n c e = ( Δ R i C o n t r a c t i o n ) ( Δ R i C o n t r a c t i o n ) expect | ( Δ R i C o n t r a c t i o n ) expect | .
In Equation (2), ( Δ R i C o n t r a c t i o n ) is the change in the real economic output of the industry in city i during the recession cycle; ( Δ R i C o n t r a c t i o n ) expect is the change in the expected economic output of the industry in city i during the recession cycle.
The recoverability is calculated as follows:
R e c o v e r a b i l i t y = ( Δ R i R e c o v e r y ) ( Δ R i R e c o v e r y ) expect | ( Δ R i R e c o v e r y ) expect | .
In Equation (3), ( Δ R i R e c o v e r y ) is the change in the real economic output of the industry in city i during the recovery cycle; ( Δ R i R e c o v e r y ) expect is the change in the expected economic output of the industry in city i during the recovery cycle.

3.2. Data Sources

The GBA studied comprises the two Special Administrative Region (SAR) cities—Hong Kong and Macao, and the nine PRD cities—Guangzhou, Shenzhen, Zhuhai, Foshan, Huizhou, Dongguan, Zhongshan, Jiangmen, and Zhaoqing in Guangdong Province. The cities and scope of the study area were selected per the GBA scope as specified in the Outline of the Development Plan of the GBA issued by the State Council of the Central Committee of the Communist Party of China. The data sources mainly include the total domestic tourism expenditure, foreign exchange earnings from international tourism, total tourism revenue by city, and foreign exchange earnings from tourism by city published by the Chinese National Bureau of Statistics, the statistical yearbooks of mainland cities in the GBA, the official websites of the Administrations of Culture and Tourism, the Census and Statistics Department of the Hong Kong SAR, the Hong Kong SAR Tourism Board Partner Net, and the Statistics and Census Service of the Macao SAR from 2000 to 2019. The Census and Statistics Department of the Hong Kong Government and the Statistics and Census Service of the Macao SAR have different statistical calibers from the yearbook-related data issued by the statistical bureaus of nine GBA cities in mainland China. Therefore, for data obtained with different meanings, we reviewed the indicator explanations and requested complete data materials from the Census and Statistics Department of the Hong Kong SAR and the Statistics and Census Service of the Macao SAR. We also conducted a multi-source comparison and unit conversion of the data obtained.

4. Differences in the GBA’s Tourism Economic Resilience

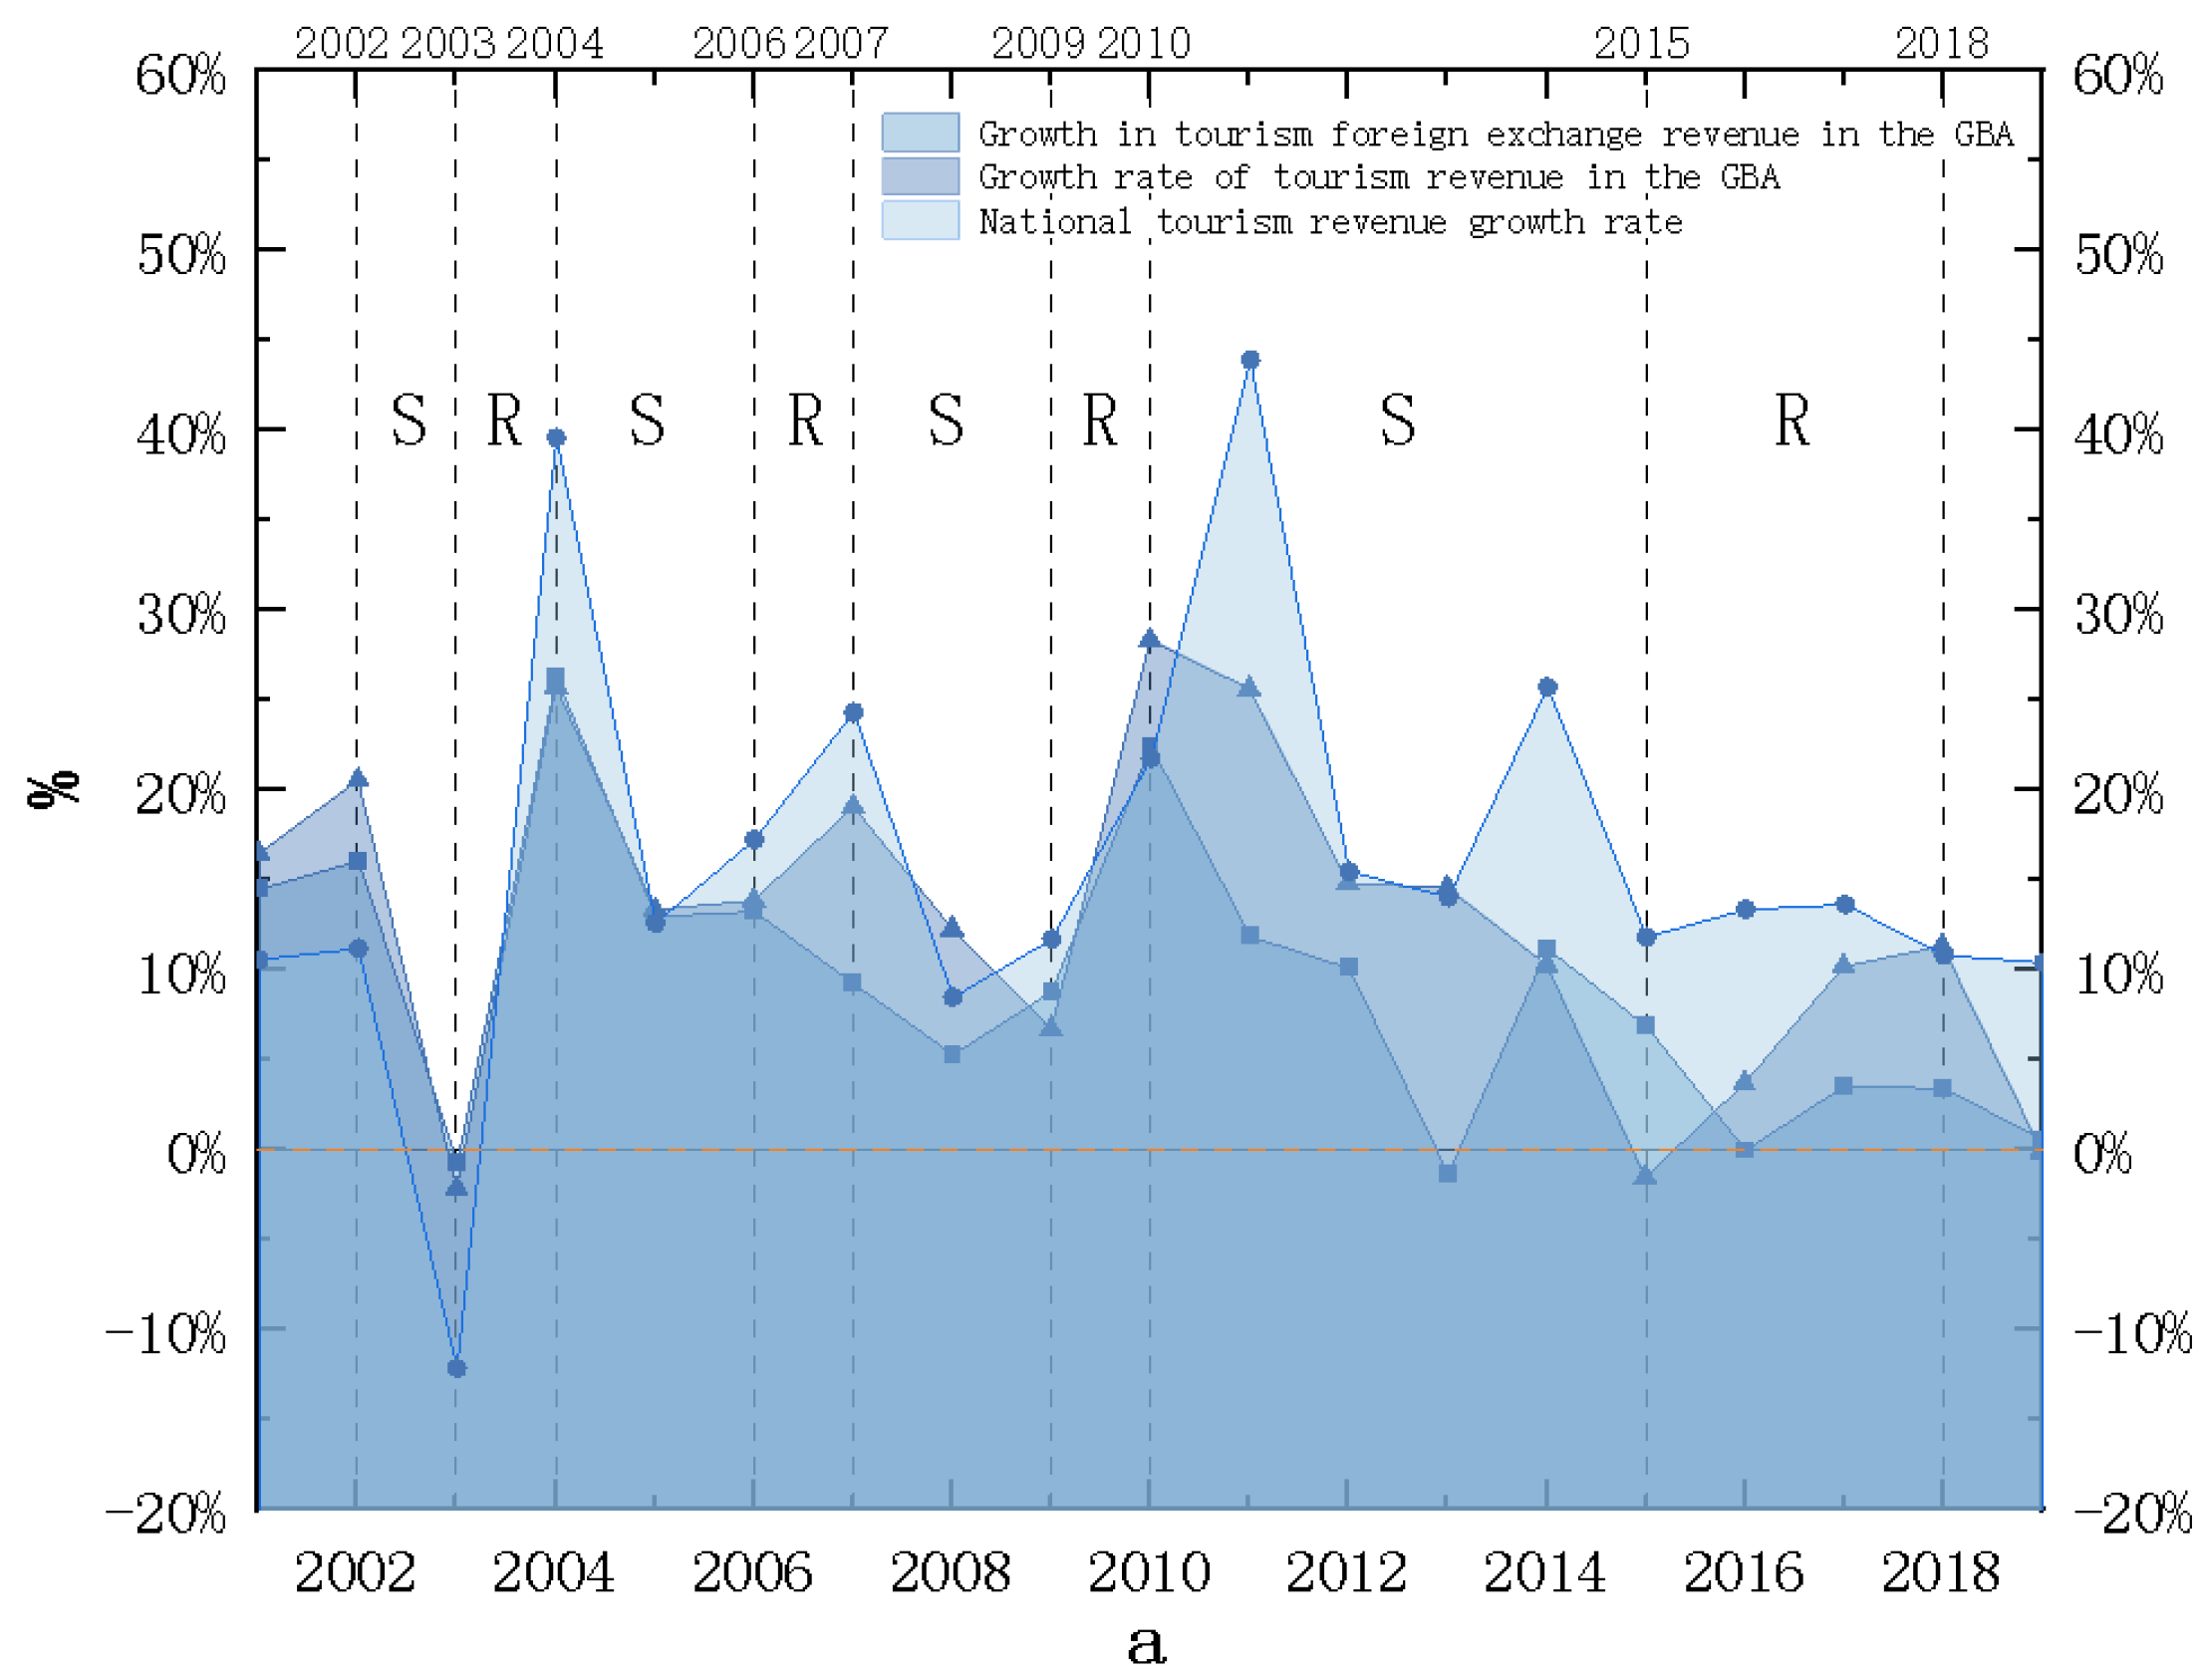
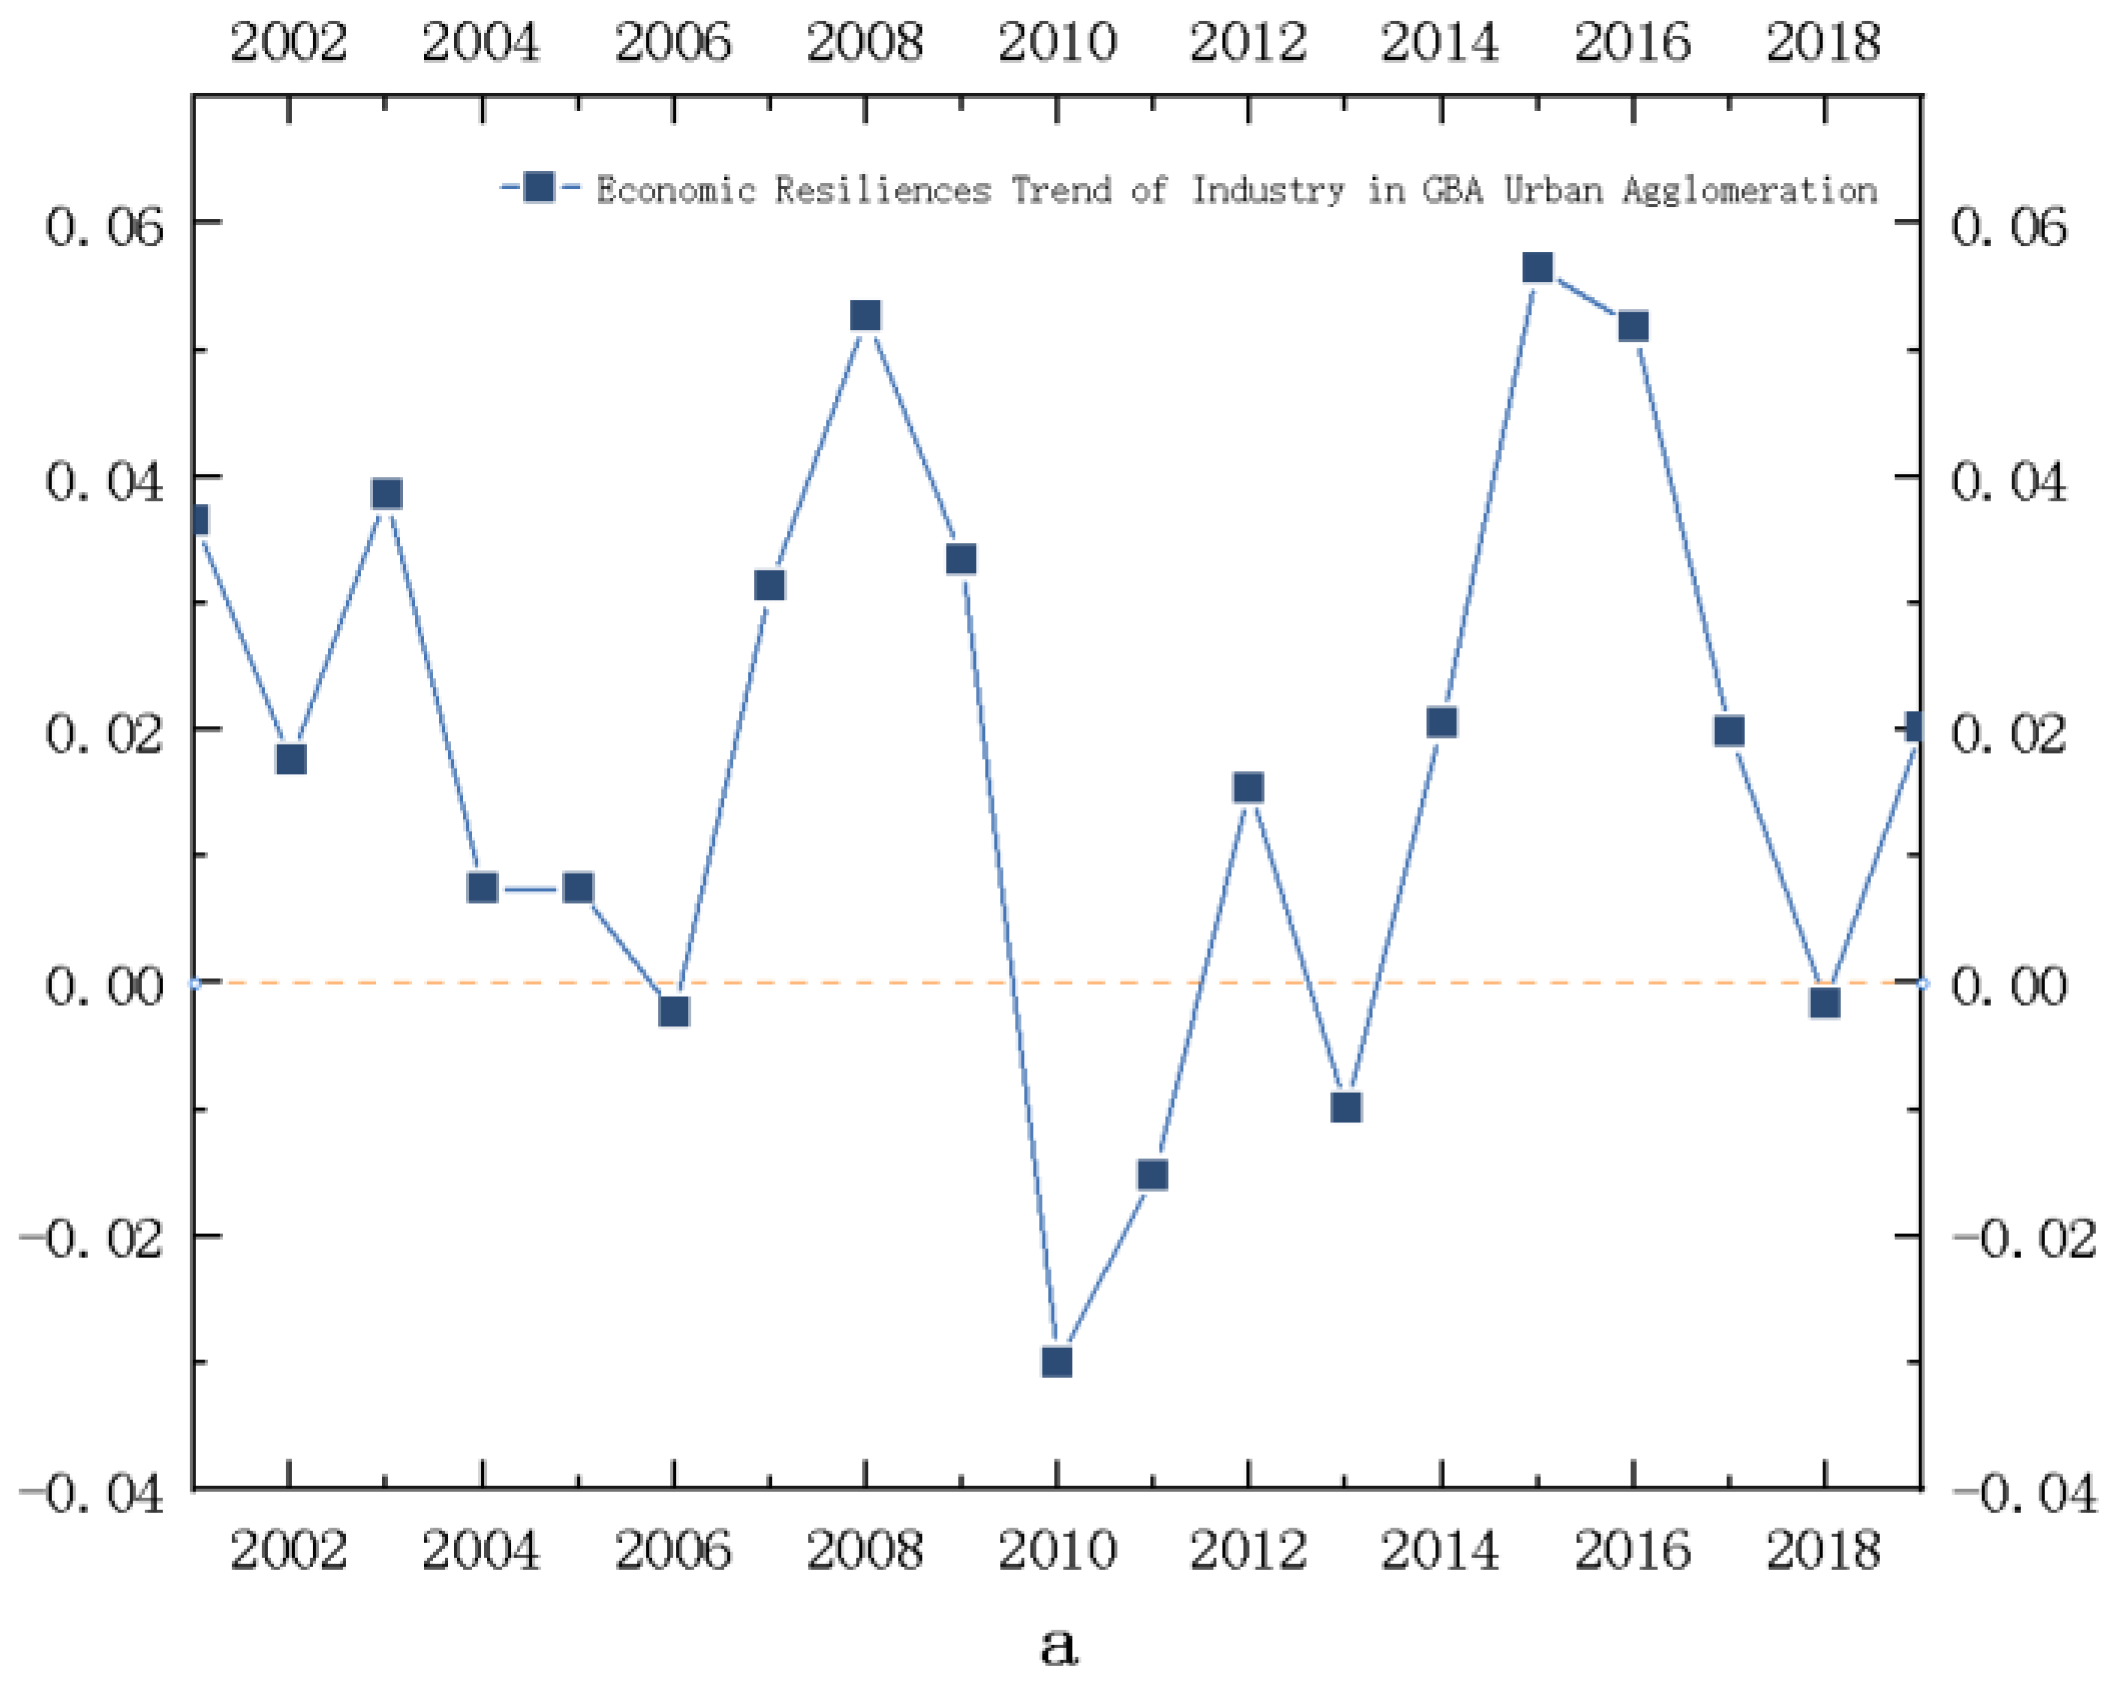
4.1. Cycle Division for the GBA’s Tourism Economic Resilience

To identify the economic cycles of the tourism industry in the GBA, we analyzed the growth of tourism revenue (%) in the GBA and the growth of national tourism revenue (%) from 2000 to 2019. The results showed that the GBA’s tourism economy had consistent recession and recovery cycles with China’s national tourism economy. The recovery and recession cycles of the GBA’s tourism economy were divided, as shown in Figure 1.
This study divided the period from 2000a to 2019a into four “recession–recovery” economic cycles by the GBA’s tourism revenue growth rates. The first recession–recovery cycle comprised (1) a recession from 2002 to 2003, during which growth of the GBA’s tourism economic system declined because of Severe Acute Respiratory Syndrome (SARS) hitting Guangdong’s tourism industry and (2) a recovery from 2003 to 2004, during which the system recovered. The second recession–recovery cycle comprised a recession from 2004 to 2006, during which the worldwide H5N1 avian influenza caused the tourism economic recession, and a recovery from 2006 to 2007. The third recession–recovery cycle comprised a recession from 2007 to 2009, during which the system’s growth declined because of the worldwide financial crisis, and a recovery from 2009 to 2010. The fourth recession–recovery cycle comprised a recession from 2010 to 2015 and a recovery from 2015 to 2018. Evidently—in the last 20 years—the GBA’s tourism economy was subjected to more frequent external shocks that resulted in longer recessions (see Figure 1). In the context of reverse globalization, the resilience to shocks and the faster recovery of positive system growth from shocks are the focus of this study.
The study calculated the resistance and recoverability of the GBA’s tourism economy with Equations (1)–(3) and measured its resilience (Figure 2). The results show that in the past 20 years, the GBA’s overall tourism economic resilience evolved similarly to the GBA’s tourism GDP (Figure 1), undergoing four cyclically rotated recession–recovery cycles. As shown in Figure 2, the GBA’s overall tourism economic resilience was high; however, because of the global financial crisis in 2008, it drastically declined from 2008 to 2010, and the shock hit GBA’s economic system severely. The system did not recover until 2015, when the GBA had the highest economic resilience during the study period, with the strongest resilience to risk and recoverability.

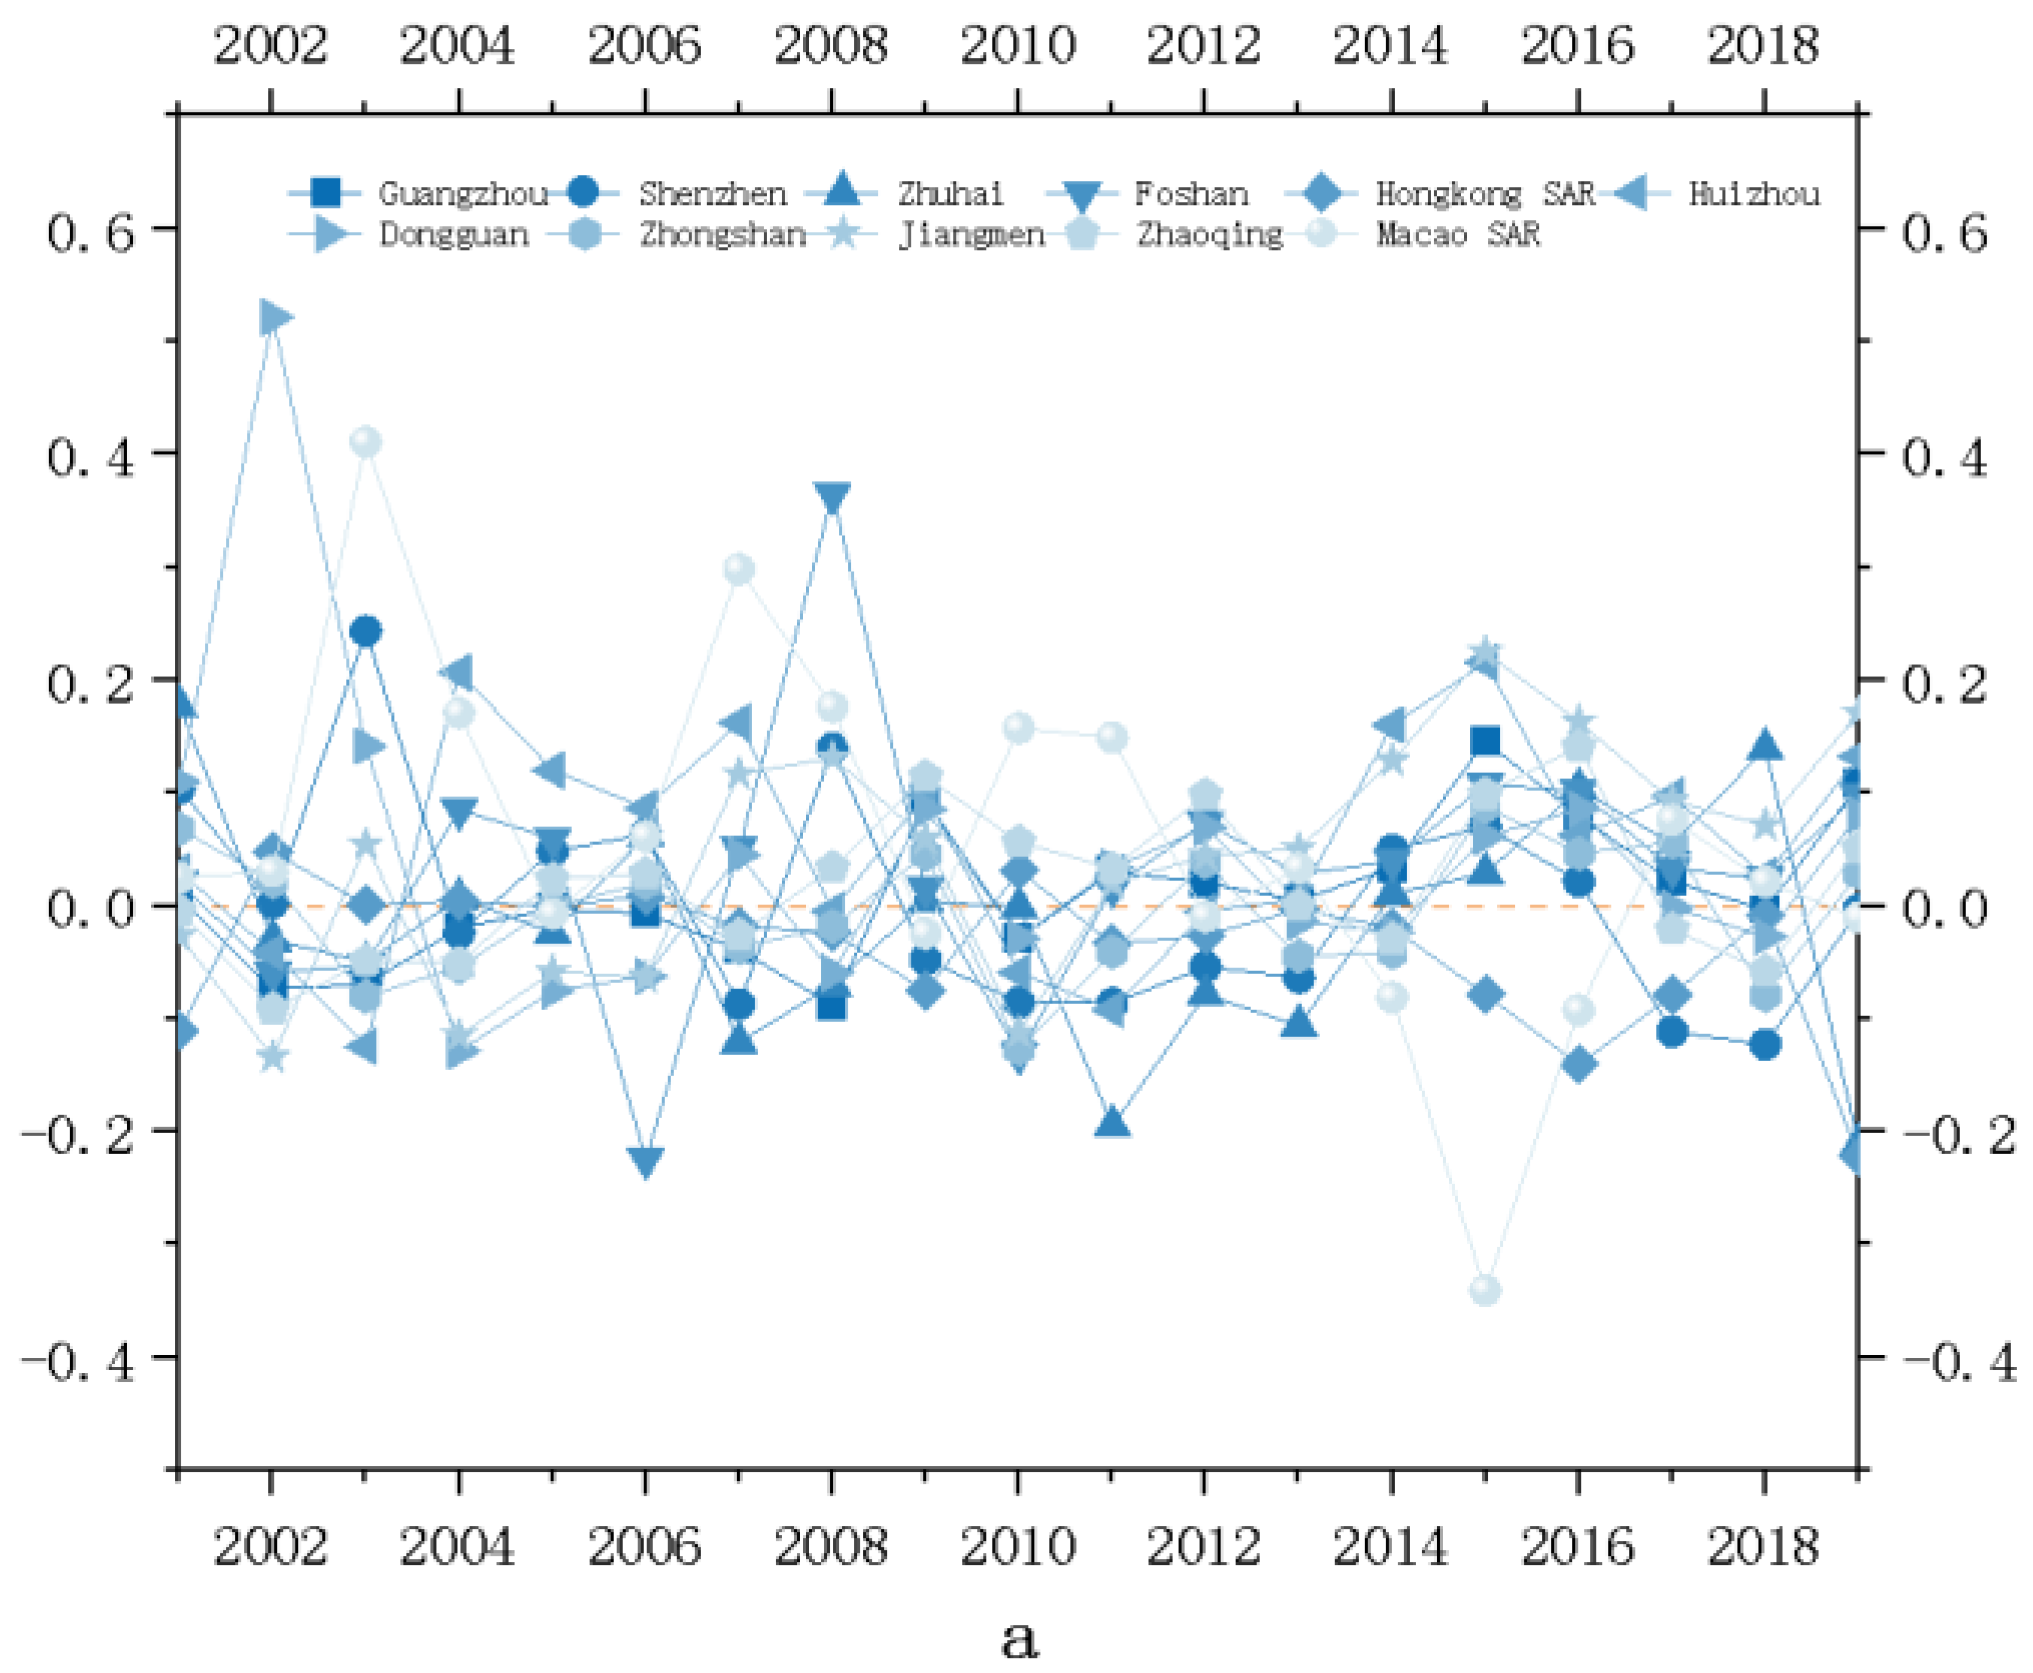
4.2. Spatiotemporal Heterogeneity Characteristics of the Economic Resilience Cycle of the Tourism Industry across the GBA Cities

ArcGIS was adopted to draw the spatiotemporal heterogeneity diagrams of tourism resistance and recoverability during the economic recession–recovery cycles from 2002 to 2018. From an evolutionary point of view, the cumulative process of regional resilience affects the final resilience in the last cycle. Therefore, this study focused on the resilience results of the fourth cycle (2010–2018). Concerning spatial distribution, the tourism economic resistance was low in the core PRD cities and high in the peripheral cities. During the tourism economic recession cycle from 2010 to 2015, the resistance was low in Macao SAR, Hong Kong SAR, Shenzhen, Zhongshan, and Zhuhai ( 0.1 R e s i s t a n c e < 0 ), but it was high in other cities in the GBA ( 0 R e s i s t a n c e < 0.1 ).
According to the spatial distribution of recoverability during the tourism economic recovery cycles in the GBA from 2015 to 2018 (Figure 3h), the GBA’s tourism economic recoverability differed more greatly than its resistance, with low recoverability in the core PRD cities, medium recoverability in the central cities, and high recoverability in the eastern and western wings. Especially, the recoverability was the lowest in Macao SAR, Hong Kong SAR, and Shenzhen ( 0.1 R e c o v e r a b i l i t y < 0 ), which was probably because the three cities had a larger size of a tourism economy that suffered greater economic shocks during the recession cycle and grew slowly during the recovery cycle.
Moreover, the recoverability was medium in Zhaoqing, Foshan, Guangzhou, Dongguan, Zhongshan, and Zhuhai ( 0 R e c o v e r a b i l i t y < 0.1 ), while it was the highest in Jiangmen and Huizhou ( 0.1 R e c o v e r a b i l i t y < 0.3 ). A center–periphery pattern of distribution spatially characterized the GBA’s tourism economic resistance from 2010 to 2015. The economic resistance was low in the core PRD cities and high in the peripheral cities. During the recovery cycle from 2015 to 2018, the economic recoverability remained low in the core PRD cities.
In the aftermath of the 2008 global financial crisis, PRD cities suffered more external economic disturbances, and their resistance to crisis events declined markedly from 2000 to 2015. This conclusion is contradictory to the economic resilience of the resilient PRD cities studied based on a broad concept of economic resilience [37]. In a study of the economic resilience of the resilient PRD cities, Zhiwei et al. asserted that the 2008 financial crisis posed a severe and asymmetric impact on the PRD, as over 15% of the PRD cities faced recessions [37]. A center–periphery pattern of distribution spatially characterized the tourism economic resilience. The resilience was high in the core PRD cities and low in the peripheral cities. However, this study of the tourism economic resilience concluded contrary findings. When studying the economic resistance and recoverability of the tourism industry, we found that the GBA’s core cities were less economically resilient than the GBA’s other cities. This may be related to the unique research perspective of tourism economics. The core PRD cities were more resilient after the financial crisis. However, given the large size of their tourism economy, their economic resilience was hit harder and took longer to recover due to the decreased inbound tourists and the declined domestic demand for tourism caused by the financial crisis.
The tourism economic resilience to shocks was calculated for each of the GBA cities according to Equations (1)–(3). Clearly, the tourism economy fluctuated in a considerably different manner in the GBA (Figure 4).
Table 1 lists the GBA cities’ tourism economic resistance and recoverability during five tourism economic cycles from 2000 to 2019. These measurements show that the resistance and recoverability differed among the peripheral cities of the PRD urban agglomeration.
The four recession–recovery cycles during the study period were plotted with Origin software (Figure 5). According to the definition of economic resilience and Equations (1)–(3), a resistance greater than 0 indicates that cities were more resistant to shocks than at the GBA level and were less affected by shocks, while a resistance less than 0 indicates that cities were more affected by shocks. Recoverability greater than 0 indicates that cities recovered better than the average GBA level aftershocks, while recoverability less than 0 indicates that cities recovered weakly from shocks. Cities with high resistance and high recoverability (quadrant 1) had the highest economic resilience, while cities with low resistance and low recoverability (quadrant 3) had the lowest economic resilience.
As shown in the four recession–recovery cycles (Figure 5a–d), the economic resilience varied greatly in the GBA’s tourism industries in the last two decades. The tourism economic resilience changed from a concentrated pattern to a discrete pattern and shifted from low resilience concentration to high resilience concentration. These findings indicate that within the last 20 years, the GBA’s tourism economic resilience improved in stages, and the resistance to shocks from external crises and lack of domestic demand enhanced together with the ability to recover from the post-shock cycle into the growth cycle.
Within the first recession–recovery cycles (R = 0.77), i.e., the 2002–2004 interval, three cities (Dongguan, Macao SAR, and Shenzhen) were strictly in quadrant 1 (high resistance and high recoverability), while five cities were in quadrant 3 (low resistance and low recoverability). Within the second recession–recovery cycle (R = 0.55), i.e., the 2004–2007 interval, two cities (Huizhou and Macao SAR) were in quadrant 1 (high resistance and high recoverability), while two cities were in quadrant 3 (low resistance and low recoverability). Within the third recession–recovery cycle (R = 0.18), i.e., the 2007–2010 interval, four cities (Macao SAR, Huizhou, Dongguan, and Zhaoqing) were in quadrant 1 (high resistance and high recoverability), while one city was in quadrant 3 (low resistance and low recoverability). Within the fourth recession–recovery cycle (R = 0.28), i.e., the 2010–2018 interval, six cities (Jiangmen, Zhaoqing, Huizhou, Guangzhou, Foshan, and Dongguan) were in quadrant 1 (high resistance and high recoverability), while three cities were in quadrant 3 (low resistance and low recoverability).
According to the measurement of the 11 GBA cities’ tourism economic resilience in the four cycles, these cities’ tourism economic resistance changed constantly and varied at different stages, which was not helpful to a presentation of the cities’ overall tourism resistance. Therefore, Origin software was used to provide the 11 cities’ overall tourism resilience, as shown in Figure 6.
Macao SAR, Dongguan, Huizhou, Shenzhen, and Jiangmen had the best tourism economic resilience and were in quadrant 1 (high resistance and high recoverability). They were the least susceptible to shocks and disturbances and had the strongest resistance to shocks and the highest recoverability. In contrast, Hong Kong SAR and Zhongshan had the weakest tourism economic resilience and were in quadrant 3 (low resistance and low recoverability). They were more susceptible to shocks and disturbances and had the weakest resistance to shocks and the lowest recoverability.
The findings of this study corroborate previous studies that Shenzhen is a highly resilient city in China’s regional economy [42]. Shenzhen has experienced rapid development relying on its leading industry of export processing. It has enabled a diversified industrial structure, a vibrant entrepreneurial environment, and a service-oriented government. Macao SAR, Dongguan, Huizhou, and Jiangmen all had high tourism economic resilience and were less interfered with by external shocks.
There was a significant positive correlation between the GBA’s tourism economic resistance and recoverability during the time intervals in 2002–2004 (p < 10%), 2004–2007 (p < 5%), and 2010–2018 (p < 10%). It shows that cities with higher resistance to shocks in the cycles recovered better in the subsequent recovery cycles. The process of “creative destruction” in the GBA was more evident in these three cycles. Although the urban agglomerations entered a recession cycle following an external shock, the emergence of new growth paths during the cycle represented the high recoverability of the cities’ tourism economic systems.

5. Conclusions and Discussions

During the last two decades, although shocks and recessions are more frequent and longer, GBA maintained its trend from low resilience concentration to high resilience concentration. This paper divides the resilience cycles and analyzes the regional resilience characteristics in GBA by developing a counterfactual function. In addition, the resilience performance of cities in the GBA urban agglomeration is also changing periodically. This study explains in detail the cyclical characteristics of tourism economic resilience in GBA, and it also provides supportive evidence for tourism economics development, with more detailed supporting data for the future construction of the integration of GBA.
Our empirical results reveal that, firstly, the GBA’s tourism economy underwent four recession–recovery cycles, where the recession cycles were 2002–2003, 2004–2006, 2007–2009, and 2010–2015, which indicated that the GBA’s tourism economy was subject to more frequent external shocks that resulted in longer recessions. Especially, the COVID-19 pandemic of 2020 would have a massive impact upon travel, tourism, and hospitality globally [43]. The epidemic with long cycle and wide impact will rearrange the industrial structure of world tourism cities and tourists’ travel preferences. In the suspension of the tourism economy and tourism industry, reflection on the resilience of the regional tourism economy will explore a better path for future industrial development.
Secondly, the tourism economy fluctuated considerably differently in the GBA in the last two decades. The tourism economic resilience changed from a concentrated pattern to a discrete pattern and shifted from low resilience concentration to high resilience concentration. The GBA cities became more economically resilient despite increased external shocks. More specifically, Shenzhen, Macao SAR, Jiangmen, Huizhou, and Dongguan had the best tourism economic resilience (high resistance and high recoverability) in the last two decades. This high tourism economic resilience may be related to the area, population, industrial characteristics, and tourist preference of these regions. It can be seen that the influencing factors and causes of tourism economic resilience are complex and need to be comprehensively improved by multiple departments.
Thirdly, the correlation analysis of tourism resistance and recoverability in the economic cycles reveals that there was a significant positive correlation between the GBA’s tourism economic resistance and recoverability during the time intervals 2002–2004, 2004–2007, and 2010–2018. It also shows that the urban agglomeration with higher resistance in the above cycles recovered better in the subsequent recovery cycles. In the developing economy, tourism is the most visible and steadiest growing facade. Tourism is considered one of the rapidly increasing elements for economic development from the last two decades [23], which have a significant share in the economic growth of China [25]. The tourism economic system composed of economic departments has significant self-organization characteristics. Under the influence of external shocks, the innovative transformation within and between industries has high adaptability to deal with new tourist groups and economic characteristics. In the context of a tourism-led growth mechanism [26], the tourism economy of the GBA had an evident process of “creative destruction”. The emergence of new growth paths during the recession cycles enhanced the recoverability of the cities’ tourism economic systems. In the future, the development of tourism and a tourism-led economic model in the GBA deserves attention and expectation.
Fourth, the GBA is quite different from the annual variation of resilience in individual cities: the GBA was generally more resilient in the tourism economy (high resistance and high recoverability) and highly resistant to external shocks against the tourism economy from 2000 to 2019. In the future, the GBA should speed up its development into a unified economy that complements each other’s advantages and shares risks to increase the individual cities’ ability to resist risks.

6. Policy Recommendations

The proposed study results are significant for the policy maker about tourism economics in the GBA. The research based on the resilience during the natural disaster period pointed out that most counties with a tourism-based economic model have higher average growth rate than those without [28]. It is an important policy direction to vigorously promote the development of tourism in GBA. However, Watson and Deller pointed out that the current COVID-19 pandemic has exposed the sensitivity of tourism and hospitality-dependent regional economies to external shocks. They find that, overall, greater dependency reduces rates of resiliency [29]. In the future, GBA should strengthen infrastructure construction and increase industry-related and non-related diversity while developing tourism, which will become the direction of policy guidance in the future. Prior studies indicated that operation automation technologies could ensure a return to a situation in which tourism can take place in ways that ensure the bio-security of travelers and ensure that the industry’s operations return to be able to work in profitable ways [43]. Improving the safety perception of the GBA with automation technologies will become a key factor to resist the impact of the COVID-19 pandemic on the tourism industry. Moreover, the innovation and diversification are important for increasing the recovery speed following a disruption [26]. We propose introducing automation technology to ensure the tourism safety of the GBA, adopt innovative technology and a diversified industrial foundation to improve the tourism economy of the GBA, and promote the resilience of the overall economy of the GBA.
As in many other studies, this study has limitations. Firstly, the comparative multi-index and multi-model study will increase the persuasion of this study. Secondly, an in-depth discussion on the causes of resilience will become the core of future research.

Author Contributions

W.C.: Conceptualization, Investigation, Methodology, Writing—original draft; J.C.: Funding acquisition, Project administration, Supervision; T.X.: Data curation, Software, Writing—review & editing, Visualization; H.S.: Resources, Validation. All authors have read and agreed to the published version of the manuscript.

Funding

This research was funded by the Guangdong Planning Office of Philosophy and Social Science (GD20CGL09), Guangdong Basic and Applied Basic Research Foundation (2019A1515110928) and Hanshan Normal University, China (XN202031).

Institutional Review Board Statement

The study was conducted according to the guidelines of the Declaration of Helsinki, and approved by the Institutional Review Board (protocol code 16/93 and date of approval in November 2012).

Informed Consent Statement

Informed consent was obtained from all subjects involved in the study.

Data Availability Statement

The raw data supporting the conclusions of this article will be made available by the authors, without undue reservation.

Acknowledgments

We appreciate the journal reviewers’ feedbacks.

Conflicts of Interest

The authors declare no conflict of interest.

References

  1. Fang, C.; Mao, Q.; Ni, P. Argument and exploration on scientific selection and hierarchical development of urban agglomeration in China. Acta Geogr. Sin. 2015, 70, 515–527. [Google Scholar]
  2. Fang, C. Important progress and future direction of studies on China’s urban agglomerations. J. Geogr. Sci. 2014, 69, 1130–1144. [Google Scholar] [CrossRef] [Green Version]
  3. Alan, A.L. Scale, change and resilience in community tourism planning. Tour. Geogr. 2014, 16, 14–22. [Google Scholar]
  4. Martin, R. Regional economic resilience, hysteresis and recessionary shocks. J. Econ. Geogr. 2012, 12, 1–32. [Google Scholar] [CrossRef]
  5. Boschma, R. Towards an evolutionary perspective on regional resilience. Reg. Stud. 2015, 49, 733–751. [Google Scholar] [CrossRef] [Green Version]
  6. Li, L.; Zhang, P.; Li, X. Regional economic resilience of the old industrial bases in China—A case study of Liaoning province. Sustainability 2019, 11, 723. [Google Scholar] [CrossRef] [Green Version]
  7. Prayag, G. Symbiotic relationship or not? Understanding resilience and crisis management in tourism. Tour. Manag. Perspect. 2018, 25, 133–135. [Google Scholar] [CrossRef]
  8. Guo, S.; Rong, Y. Study on the trend of consumption structure change in Guangdong-Hong Kong-Macao Greater Bay Area. Consum. Econ. 2018, 34, 12–19. [Google Scholar]
  9. Wu, K.; Li, X.; Xie, H.; Liu, M.; Wu, P.; Ou, W. Study on urban tourism competitiveness of Guangdong-Hong Kong-Macao Greater Bay Area. Urban Insight 2020, 1, 52–62. [Google Scholar]
  10. Liu, C.; Chen, Z. An empirical study on urban tourism competitiveness of Guangdong-Hong Kong-Macao Greater Bay Area. Inq. Econ. Issues 2019, 439, 88–94. [Google Scholar]
  11. Wu, Z.; Zhang, L.; Huang, S. Spatial structure and cooperation model of tourism economic connection in the Guangdong-Hong Kong-Macao Greater Bay Area. Geogr. Res. 2020, 39, 1370–1385. [Google Scholar]
  12. Holling, C.S. Resilience and stability of ecological systems. Annu. Rev. Ecol. Syst. 1973, 4, 1–23. [Google Scholar] [CrossRef] [Green Version]
  13. Christopherson, S.; Michie, J.; Tyler, P. Regional resilience: Theoretical and empirical perspectives. Camb. J. Reg. Econ. Soc. 2010, 3, 3–10. [Google Scholar] [CrossRef]
  14. Frenken, B.K. Why is economic geography not an evolutionary science? Towards an evolutionary economic geography. Pap. Evol. Econ. Geogr. 2006, 6, 273–302. [Google Scholar]
  15. Xu, Y.; Wang, C. Influencing factors of regional economic resilience under financial crisis: A case study of Zhejiang and Jiangsu provinces. Prog. Geogr. 2017, 36, 986–994. [Google Scholar]
  16. Mayor, M.; Ramos, R. Regions and economic resilience: New perspectives. Sustainability 2020, 12, 4693. [Google Scholar] [CrossRef]
  17. Briguglio, L.; Cordina, G.; Farrugia, N.; Vella, S. Economic vulnerability and resilience: Concepts and measurements. Wider Work. Pap. 2009, 37, 229–247. [Google Scholar] [CrossRef]
  18. Simmie, J.; Martin, R. The economic resilience of regions: Towards an evolutionary approach. Camb. J. Reg. Econ. Soc. 2010, 3, 27–43. [Google Scholar] [CrossRef] [Green Version]
  19. Tan, J.; Lo, K.; Qiu, F.; Liu, W.; Li, J.; Zhang, P. Regional economic resilience: Resistance and recoverability of resource-based cities during economic crises in northeast China. Sustainability 2017, 9, 2136. [Google Scholar] [CrossRef] [Green Version]
  20. Li, L.; Zhang, P.; Tan, J.; Guan, H. Analysis on the process of economic revitalization of Liaoning old industrial base from the perspective of regional economic elasticity. Sci. Geogr. Sin. 2019, 39, 116–124. [Google Scholar]
  21. Wang, C.; Guo, Y. Influence factors of elasticity of local industry to resist economic crisis—Taking electronic information industry as an example. Geogr. Res. 2018, 37, 1297–1307. [Google Scholar]
  22. Lee, Y.-J.A.; Kim, J.-W.; Jang, S.; Ash, K. Tourism and economic resilience. Ann. Tour. Res. 2021, 87. [Google Scholar] [CrossRef]
  23. Songling, Y.; Ishtiaq, M.; Thanh, B.T. Tourism industry and economic growth nexus in Beijing, China. Economies 2019, 7, 25. [Google Scholar] [CrossRef] [Green Version]
  24. Zhang, J.; Zhang, Y. Tourism, economic growth, energy consumption, and CO2 emissions in China. Tour. Econ. 2020, 27, 1–21. [Google Scholar] [CrossRef]
  25. Shehzad, K.; Liu, X.; Rauf, A.; Arif, M.; Mazhar, S.; Sohail, N.; Amin, W. Revolutionising tourism development in China: An effective role of ICT and Western Silk Road project. Asia Pac. J. Tour. Res. 2019, 24, 965–977. [Google Scholar] [CrossRef]
  26. Pascariu, G.C.; Ibănescu, B.-C.; Nijkamp, P.; Kourtit, K. Tourism and Economic Resilience: Implications for Regional Policies; Springer: Singapore, 2021. [Google Scholar]
  27. Farrell, B.; Twining-Ward, L. Seven steps towards sustainability: Tourism in the context of new knowledge. J. Sustain. Tour. 2005, 13, 109–122. [Google Scholar] [CrossRef]
  28. Cheng, L.; Zhang, J. Is tourism development a catalyst of economic recovery following natural disaster? An analysis of economic resilience and spatial variability. Curr. Issues Tour. 2020, 23, 2602–2623. [Google Scholar] [CrossRef]
  29. Watson, P.; Deller, S.C. Tourism and economic resilience. Tour. Econ. 2021, 1–23. [Google Scholar] [CrossRef]
  30. Fountain, J.; Cradock-Henry, N.A. Recovery, risk and resilience: Post-disaster tourism experiences in Kaikōura, New Zealand. Tour. Manag. Perspect. 2020, 35, 100695. [Google Scholar] [CrossRef]
  31. Faggian, A.; Gemmiti, R.; Jaquet, T.; Santini, I. Regional economic resilience: The experience of the Italian local labor systems. Ann. Reg. Sci. 2018, 60, 393–410. [Google Scholar] [CrossRef]
  32. Lim, J.; Won, D. How Las Vegas’ tourism could survive an economic crisis? Cities 2020, 100, 102643. [Google Scholar] [CrossRef]
  33. Sheppard, V.A.; Williams, P.W. Factors that strengthen tourism resort resilience. J. Hosp. Tour. Manag. 2016, 28, 20–30. [Google Scholar] [CrossRef]
  34. Barbhuiya, M.R.; Chatterjee, D. Vulnerability and resilience of the tourism sector in India: Effects of natural disasters and internal conflict. Tour. Manag. Perspect. 2020, 33, 100616. [Google Scholar] [CrossRef]
  35. Musavengane, R.; Kloppers, R. Social capital: An investment towards community resilience in the collaborative natural resources management of community-based tourism schemes. Tour. Manag. Perspect. 2020, 34, 100654. [Google Scholar] [CrossRef]
  36. Martin, R.; Sunley, P. On the notion of regional economic resilience: Conceptualization and explanation. Pap. Evol. Econ. Geogr. 2015, 15, 1–42. [Google Scholar] [CrossRef] [Green Version]
  37. Du, Z.; Zhang, H.; Ye, Y.; Jin, L.; Xu, Q. Urban shrinkage and growth: Measurement and determinants of economic resilience in the Pearl River Delta. J. Geogr. Sci. 2019, 29, 1331–1345. [Google Scholar] [CrossRef] [Green Version]
  38. Martin, R.; Sunley, P.; Gardiner, B.; Tyler, P. How regions react to recessions: Resilience and the role of economic structure. Reg. Stud. 2016, 50, 561–585. [Google Scholar] [CrossRef] [Green Version]
  39. Elena, I.; Joseph, C.; Robyn, W.; Alessandra, F.; Richard, M.; Irwin, N. Human adaptations in food, energy, and water systems. J. Environ. Stud. Sci. 2016, 6, 127–139. [Google Scholar]
  40. Oprea, F.; Onofrei, M.; Lupu, D.; Vintila, G.; Paraschiv, G. The determinants of economic resilience: The case of eastern European regions. Sustainability 2020, 12, 4228. [Google Scholar] [CrossRef]
  41. Oliva, S.; Lazzeretti, L. Measuring the economic resilience of natural disasters: An analysis of major earthquakes in Japan. City Cult. Soc. 2018, 15, 53–59. [Google Scholar] [CrossRef]
  42. Sun, J.; Sun, X. Research progress of regional economic resilience and exploration of its application in China. Econ. Geogr. 2017, 37, 1–9. [Google Scholar]
  43. Ivanov, S.H.; Webster, C.; Stoilova, E.; Slobodskoy, D. Biosecurity, automation technologies and economic resilience of travel, tourism and hospitality companies. Sorarxiv Pap. 2020, 1–34. [Google Scholar] [CrossRef] [Green Version]
Figure 1. Division of recession–recovery cycle in the GBA and national tourism industry from 2000a to 2019a. Note: S means the recession cycle (shock period); R means the recovery cycle.
Sustainability 13 12092 g001
Figure 2. Economic resilience trend of tourism industry in GBA agglomeration in the last 20 years.
Sustainability 13 12092 g002
Figure 3. Spatial distribution of tourism industry economic resilience in GBA in four recession–recovery cycles: (a) Resistance by city, 2002–2003; (b) Recoverability by city, 2003–2004; (c) Resistance by city, 2004–2006; (d) Recoverability by city, 2006–2007; (e) Resistance by city, 2007–2009; (f) Recoverability by city, 2009–2010; (g) Resistance by city, 2010–2015; (h) Recoverability by city, 2015–2018.
Sustainability 13 12092 g003aSustainability 13 12092 g003b
Figure 4. Economic resilience trend of tourism industry in the GBA.
Sustainability 13 12092 g004
Figure 5. 2000–2019 Economic resilience of urban tourism industry in GBA in different stages with recession–recovery cycles: (a) Recession–recovery cycle 2002–2004; (b) Recession–recovery cycle 2004–2007; (c) Recession–recovery cycle 2007–2010; (d) Recession–recovery cycle 2010–2018.
Sustainability 13 12092 g005
Figure 6. 2000–2019a Tourism industry economic total resilience of GBA agglomeration.
Sustainability 13 12092 g006
Table 1. Economic resistance and resilience of tourism industry in cities of GBA.
a2001–20022002–20032003–20042004–20062006–20072007–20092009–20102010–20152015–20182018–2019
StagesRecovery Recession Recovery Recession Recovery Recession Recovery Recession Recovery Recession
Resilience Cycle——Cycle 1Cycle 2Cycle 3Cycle 4——
Guangzhou−0.033−0.072−0.045−0.010−0.023−0.0110.032 0.034 0.061 0.052
Shenzhen0.0530.1230.1090.029−0.0120.002−0.067−0.028−0.036−0.063
Zhuhai0.074−0.040−0.0220.015−0.029−0.0620.002 −0.0570.081 −0.036
Foshan−0.019−0.0560.016−0.027−0.0870.143−0.0580.022 0.067 0.061
Huizhou−0.0310.024 0.003 0.004 −0.005−0.039−0.022−0.022−0.077−0.115
Dongguan−0.005−0.0830.0410.1380.1240.0850.0200.0380.1000.079
Zhongshan0.3160.3310.007−0.089−0.0090.0240.0280.0160.0300.027
Jiangmen0.045−0.029−0.067−0.012−0.008−0.003−0.041−0.0210.028−0.025
Zhaoqing−0.081−0.040−0.030−0.0790.0270.102−0.0260.0590.1380.121
Hong Kong SAR−0.048−0.070−0.0500.0000.0010.0410.0850.0430.040−0.003
Macao SAR0.0280.2210.2910.0750.1800.1500.066−0.015−0.0840.005
Publisher’s Note: MDPI stays neutral with regard to jurisdictional claims in published maps and institutional affiliations.

