Article

The Influence of Cork and Manufacturing Parameters on the Properties of Cork–Rubber Composites for Vibration Isolation Applications

1
MEtRICs Research Center, Campus of Azurém, University of Minho, 4800-058 Guimarães, Portugal
2
Innovation Department, Amorim Cork Composites, Rua Comendador Américo Ferreira Amorim, 260, 4535-186 Mozelos, Portugal
*
Authors to whom correspondence should be addressed.
Sustainability 2021, 13(20), 11240; https://doi.org/10.3390/su132011240
Submission received: 5 September 2021 / Revised: 3 October 2021 / Accepted: 4 October 2021 / Published: 12 October 2021
(This article belongs to the Special Issue Industry 4.0 Technologies for Sustainable Asset Life Cycle Management)

Abstract

:
The addition of cork to a natural rubber compound and the vulcanization parameters were studied in terms of their influence on the properties of cork–rubber materials. The characterization of different compounds was carried out and included in the determination of mechanical properties related to the application of cork–rubber composites as vibration isolation pads, such as static and dynamic behavior under compressive loading. Statistical methods, such as ANOVA and regression analysis, were used in this study. The results showed that the introduction of cork as an additional filler in the studied rubber compound increased its hardness and static stiffness, while maintaining a similar dynamic behavior to the base rubber compound when subjected to compressive loading. In addition, it was found that increasing the amount and granulometry of cork and lower vulcanization temperatures resulted in stiffer vulcanizates. Materials with higher cork granule contents were found to be affected in their final properties by molding pressure. A study involving the use of linear regression models as a tool to predict or optimize properties related to vibration isolation applications was also developed.

1. Introduction

Inspired by the increasing global concern about the environmental impact of the intensive use of polymer products, the incorporation of natural-based materials into polymer composites has been investigated in recent decades. The advantages of using biomaterials as part of composite materials are availability, recyclability, renewability and ease of processing, which allow for a partial or total substitution of petroleum-based products. Common fillers used for the production of natural-based polymer composites include materials from plant, animal and mineral sources [1,2,3].
Cork is a wood material obtained from the harvesting of Quercus suber L. trees, which are most common in the regions around the western Mediterranean Sea. Compared with other wood-based materials, the extraction of cork does not implicate the destruction of a tree. In fact, cork can be extracted from the same tree in a nine-year interval [4,5,6]. Cork behaves similarly to a cellular material presenting low density, high compressibility and recovery characteristics, near zero Poisson’s coefficient, resilience, high energy absorption capacity, good thermal and acoustic behavior [7,8,9,10]. The most recognized application of cork is in the manufacture of stoppers for the wine industry. Surplus from harvest and stoppers production can be introduced in the manufacturing of several composite materials, including agglomerated cork and cork–plastic composites (CPC).
Cork–rubber composites are an example of cork composites materials and consists of a rubber matrix filled with cork granules. These materials can be applied as bearing pads for vibration and acoustic isolation in the construction and industry sectors [11,12]. Similar to other elastomeric products used for vibration isolation, a cork–rubber composite pad must be able to support the weight of the structure to be isolated and prevent or reduce the transmission of vibrations [13].
Several studies have been conducted to investigate the effect of some characteristics of natural fillers on the properties of rubber-based products, such as hardness, stiffness, tensile strength, elongation at break, tear strength, rebound and dynamic properties [14,15,16,17,18,19,20,21,22,23]. In general, the introduction of these natural materials has a similar effect to the introduction of common fillers in rubber compounds. Regarding the manufacturing process, some authors investigated the impact of the mixing process and vulcanization variables, such as pressure or temperature, on some mechanical properties of rubber materials with natural fillers [20,24,25].
In recent years, the properties of cork composites have been a subject of study by several authors. Regarding agglomerated cork, it was found that these composites present lower values concerning Young’s modulus at small strains and plateau stress, as reported by Fernandes et al. [10] and Sergi et al. [26], and higher densities compared with other cellular-like materials such as expanded polystyrene (EPS) and expanded polypropylene (EPP). Agglomerated cork has shown a better recovery capacity and small permanent deformation after successive loading cycles [27]. Regarding multiple loading and impacts tests, agglomerated cork also proved to have better performance than EPS and EPP [10,27,28]. The addition of agglomerated cork as part of sandwich structures has also been studied, including on vibration damping applications [6,29,30]. The influence of the addition of cork on the thermal, mechanical and viscoelastic properties of CPC with thermoplastics matrixes such as polyethylene (PE) [31], polyurethane (TPU) [32] and polylactic acid (PLA) [33,34] have also been investigated.
However, there are few works available in the literature regarding cork–rubber composites. The introduction of cork in a rubber matrix was studied by Policarpo et al. [35] and Gul et al. [36,37]. Policarpo et al. [35] used dynamic mechanical analysis (DMA) to characterize the dynamic properties of cork–rubber composites, while Gul et al. [36,37] studied the influence of cork added to silica-ethylene-propylene-diene monomer (EPDM) composites.
The aim of this study is to investigate the effect of adding cork on the physical and mechanical properties of a natural rubber compound, as well as the influence of the following parameters related to the cork granules included in the formulation: quantity and granulometry. The studied cork rubber composites can be applied as bearing pads for vibration isolation systems. Some of the properties evaluated were related to the static and dynamic behavior of the product as bearing pads subjected to compressive loading. Additionally, the influence of vulcanization temperature on these compound properties was determined. To perform this study, statistical methods were employed in order to define significant variables related to the production of cork–rubber compounds. The application of regression models to determine the static and dynamic behavior of cork–rubber composites was also developed and evaluated.

2. Materials and Methods

2.1. Preparation of Samples

The cork–natural rubber materials were prepared using small scale equipment. After weighing all the components, they were mixed in an internal mixer (Banbury) and then finalized in a two-roll open mill, to obtain slabs of uniform thickness. The slabs were cut into a square shape of about 200 × 200 mm, placed in a mold and inserted in a compression molding press at a constant temperature and sufficient time to allow the complete curing of the mixture. The vulcanization time of each sample was determined based on the optimum curing time (when degree of cure reaches 90%), determined by a Moving Die Rheometer (MDR), and its final thickness. The vulcanization times ranged between 10 to 45 minutes, according to the vulcanization temperature applied (between 140 °C and 180 °C). For most samples, the applied molding pressure was about 15 MPa. Other samples were vulcanized at 5 and 20 MPa. Samples with two different thicknesses (3 and 10 mm) were prepared and tested to determine the mechanical properties. Six different mixtures were prepared, differing only in the amount of cork and/or granulometry (type). The composition of cork–rubber materials C to F is similar to compound B differing only in cork granules’ type and quantity. Compounds C and E present half of the cork quantity applied in composite B, while in materials D and F, it corresponds to double the amount. Cork granules type 1 present higher granulometry than type 2. The characteristics of each compound are described in Table 1.

2.2. Characterization of Samples

Vulcanized specimens with a thickness of 3 mm were used for tensile strength, elongation at break and tear strength tests. Tensile strength and elongation at break tests were carried out according to DIN 53504 [38]. Tear strength test was performed according to ASTM D624 [39]. For the determination of rebound resilience, specimens of 10 mm thickness were used based on ASTM D1054 [40]. Hardness was measured in Shore A according to ASTM D2240 [41]. The determination of compression set at 50% deflection was performed following DIN EN ISO 1856 Method B [42] using samples with 10 mm thickness.
Vulcanized samples with a geometry of 60 × 60 × 10 mm were used for both static and dynamic compression tests. For each compound, five samples at different locations were cut. Then, a sample’s properties were evaluated after a conditioning period of at least 24 h at 23°C and 50% RH. Initially, quasi static compression tests were performed, where load–displacement data were collected from a universal testing machine—with a load cell of 50 kN—until a maximum load value was reached. The tests were performed at a rate of 5 mm/min, and the maximum applied load was about 23 kN. No lubricant or rough surface was applied between specimen and compression metallic plates, only dry surfaces. In the compression test, each sample was successively compressed three times, with only the third test being recorded. To compare the specimens in terms of compression behavior, the stress at 10% strain was evaluated.
The specimens were then subjected to a dynamic compression test to evaluate the performance of a mechanical system consisting of a mass and the material (which acts similarly to a spring-damper system), based on the standard DIN 53513 [43]. The tests were performed with a hydraulic universal testing machine (load cell of 25 kN). The test procedure consisted of obtaining the resultant signals of displacement when the sample was loaded with a sinusoidal load with a 10% load amplitude at 5 Hz. For each sample, the test was performed six times, with compression stress ranging from 0.5 to 3 MPa, after being pre-conditioned at 5 Hz and mean stress of 1.8 MPa with 10% load amplitude. Data obtained from the last twenty cycles were retrieved and analyzed, calculating parameters such as dynamic elastic stiffness ( k d y n in N/m) and natural frequency of the system ( f n in Hz) when subject at a given pre-load Equations (1) and (2).
k d y n = F a d a cos δ
f n = 1 2 π k d y n g F m
where F is load in N, d is displacement in m, δ is the phase shift between load and displacement, a and m are subscripts for the amplitude and mean values of the sinusoidal curves and g is the gravitational acceleration in m/s2.

2.3. Statistical Analysis

After conducting a descriptive statistical analysis of all collected data, four studies regarding the effect of cork and vulcanization parameters on cork–rubber composites were evaluated using statistical methods. R statistical software was used to perform all analyses.
A first case study was conducted to investigate the effect of the introduction of cork granules as an additional filler on a natural rubber compound. The results of hardness, compression stress at 10% strain and natural frequency, when subjected to a mean stress level (1.5 MPa) of compounds A and B, vulcanized at 150 °C, were used to perform the analysis. For each compound, five replicates were tested. Using F-test (function var.test from R package stats), it was determined that the two groups had equal variances for all the three properties analyzed. To compare the means between the two compounds, a pooled t-test was applied (function t.test from R package stats). If the assumption of normality of the groups failed, the non-parametric Wilcoxon Rank Sum test was employed instead (function wilcox.test from R package stats).
The influence of cork granulometry and quantity was analyzed recurring to 22 factorial analysis of variance (ANOVA) (function aov from R package stats). The cork–natural rubber samples analyzed were collected from compounds C, D, E and F. Regarding this study, all mechanical properties described in the previous section were analyzed. When assumptions of the factorial ANOVA failed to be accomplished, the alternative method consisted of using a robust two-way factorial ANOVA based on trimmed means (function t2way from R package WRS2) [44]. A level of trimming of 20% was chosen, as recommended by Wilcox [44].
The effect of vulcanization-related variables was also analyzed employing statistical methods. To evaluate the effect of molding pressure, two different levels were selected to produce the same cork–rubber compound D. The statistical analyses applied were the same used for determining differences between rubber compounds with and without cork.
The effect of vulcanization temperature on the hardness, compression stress at 10% strain and natural frequency at a compression level of 1.5 MPa was also evaluated for compound samples A and B. Besides 150 °C, results related to samples vulcanized at 140 °C, 160 °C and 180 °C were also introduced to perform a one-factor ANOVA (function aov from R package stats). After accessing the assumptions of the ANOVA, multiple comparison tests were conducted if significant differences were detected. After conducting ANOVA, the test applied for this analysis was Tukey HSD (function TukeyHSD from R package stats). In the case of failure of assumptions of the analysis, alternative methods were employed instead. If heterogeneity of variances across groups was detected, using Levene’s test (function leveneTest from R package car), Welch’s F test was applied to determine if there were any significant differences (function oneway.test from R package stats). In case of differences detected, multiple comparisons tests were performed between all groups using function lincon function from robust methods’ R package WRS2 [44]. If deviations from normality were detected in the response variable or residuals data, the non-parametric Kruskal–Wallis test was applied (function kruskal.test from R package stats). In the latter case, multiple comparisons were performed using selective comparisons with the application of function kruskalmc from pgirmess package of R [45].

2.4. Regression Models

Using data obtained from experimental testing of some compounds, regression models were created for predicting the static and dynamic behavior of cork–rubber composites with cork granules type one, according to the quantity of cork incorporated in the formulation. The dependent variable for the static behavior model was the apparent compression modulus. Regarding the dynamic behavior under compressive loads, the chosen dependent variable was the ratio between dynamic compression modulus and apparent compression modulus. For the case of the model regarding dynamic compression behavior, the stress imposed on the samples during experimental testing was also introduced as an independent variable in the regression analysis.
Similar to the described statistical analyses above, if the assumption that the errors are normally and independently distributed with a mean of zero and constant variance was not met, instead of using the ordinary least squares method (function lm from R package stats), other regression methods were employed. In the case of failure of the assumption of residuals normally distributed, robust regression method using Huber M-estimator (function rlm from R package MASS) was applied (more information about robust regression in [46,47]. To evaluate the prediction capacity of each regression model, coefficient of determination (R2) and adjusted coefficient of determination (R2adj) were determined.

3. Results and Discussion

3.1. Effect of Cork Granules

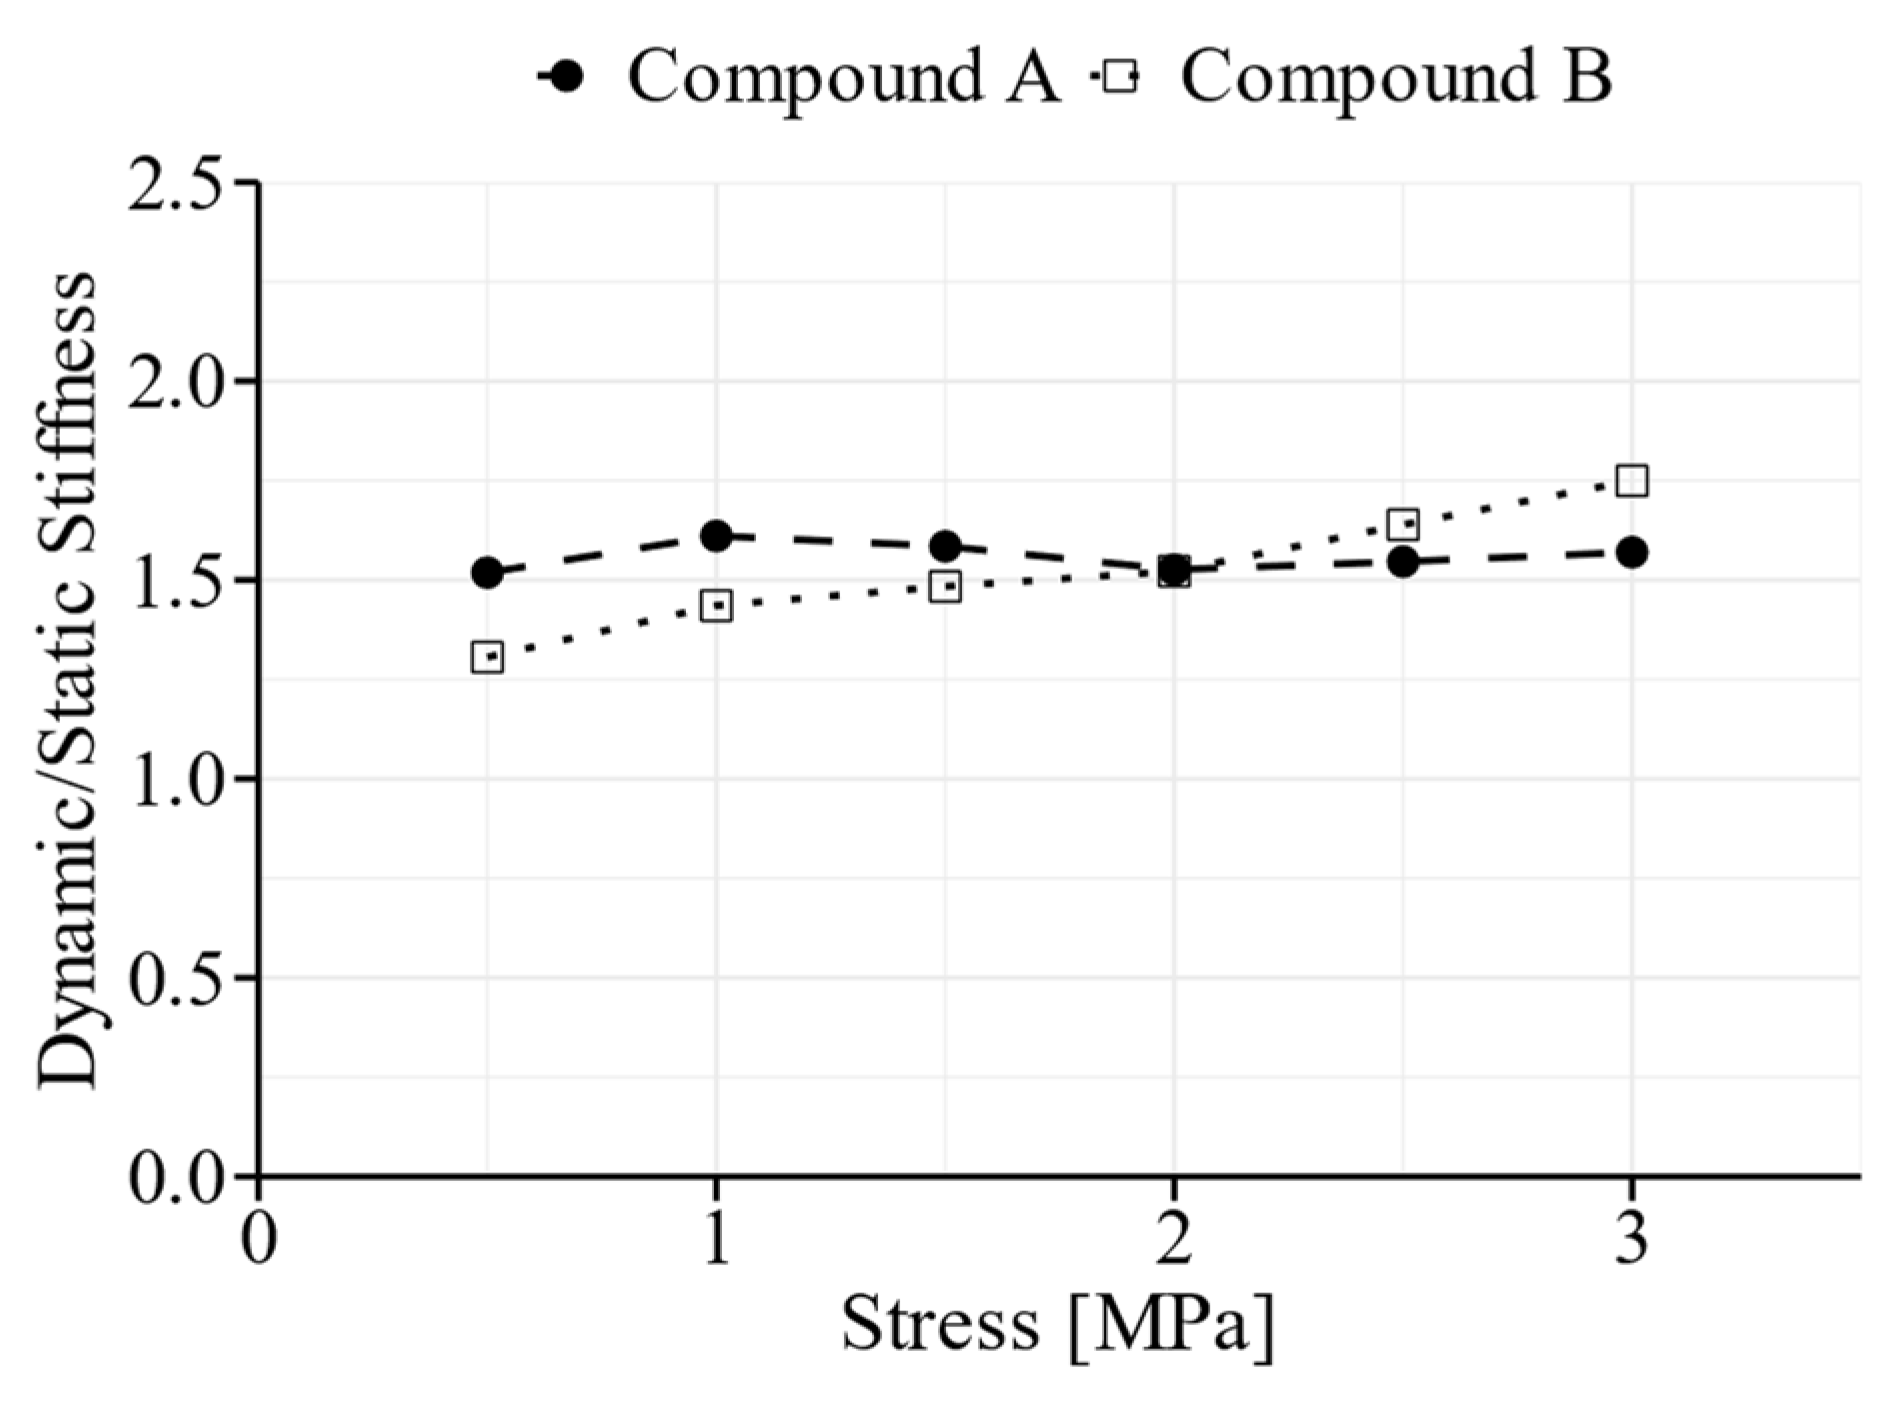
3.1.1. Addition of Cork Granules

A comparison between natural rubber samples produced with the same process parameters with and without the addition of cork granules was evaluated. Results from compounds A and B, vulcanized at 150 °C, were analyzed and the correspondent descriptive statistics are presented in Table 2. The addition of cork to a rubber compound increases the number of fillers present in the rubber compound. The increase in fillers contributes to the reinforcement of the materials, improving properties such as hardness, modulus and stiffness, which is a common observation amongst rubber technologists independently of the origin of the filler [48,49,50]. It is interesting to note that although there is an increase in hardness and static stiffness due to the presence of cork granules, its effect on the magnitude of the dynamic behavior property is not very large, in comparison with compound A. The decrease in dynamic stiffness due to the presence of cork granules is also notable when comparing the ratio between dynamic and static stiffness, presented in Figure 1, especially at low compression stress levels.
Due to the lack of normality of data regarding hardness and natural frequency values, the Wilcoxon Rank Sum test was applied. To evaluate the static stiffness, pooled t-test was conducted.
Considering a significance level of 5%, the results of the statistical analysis showed that, on average, a natural rubber compound without cork granules presents lower hardness values compared with the inclusion of cork granules (W = 0, p-value = 0.005). The same tendency was also observed regarding the results for static stiffness. The values of stress obtained at 10% strain in a quasi-static compression test of material A were lower than compound B. Based on the test statistic t(8) = −6.718, p-value < 0.001, the mean value of stress at a 10% compression strain of a compound without cork is significantly lower than a natural rubber compound with cork granules included. Opposite to the previous properties, the natural frequency obtained for compound A presented significant higher values than compound B (W = 24, p-value = 0.008).

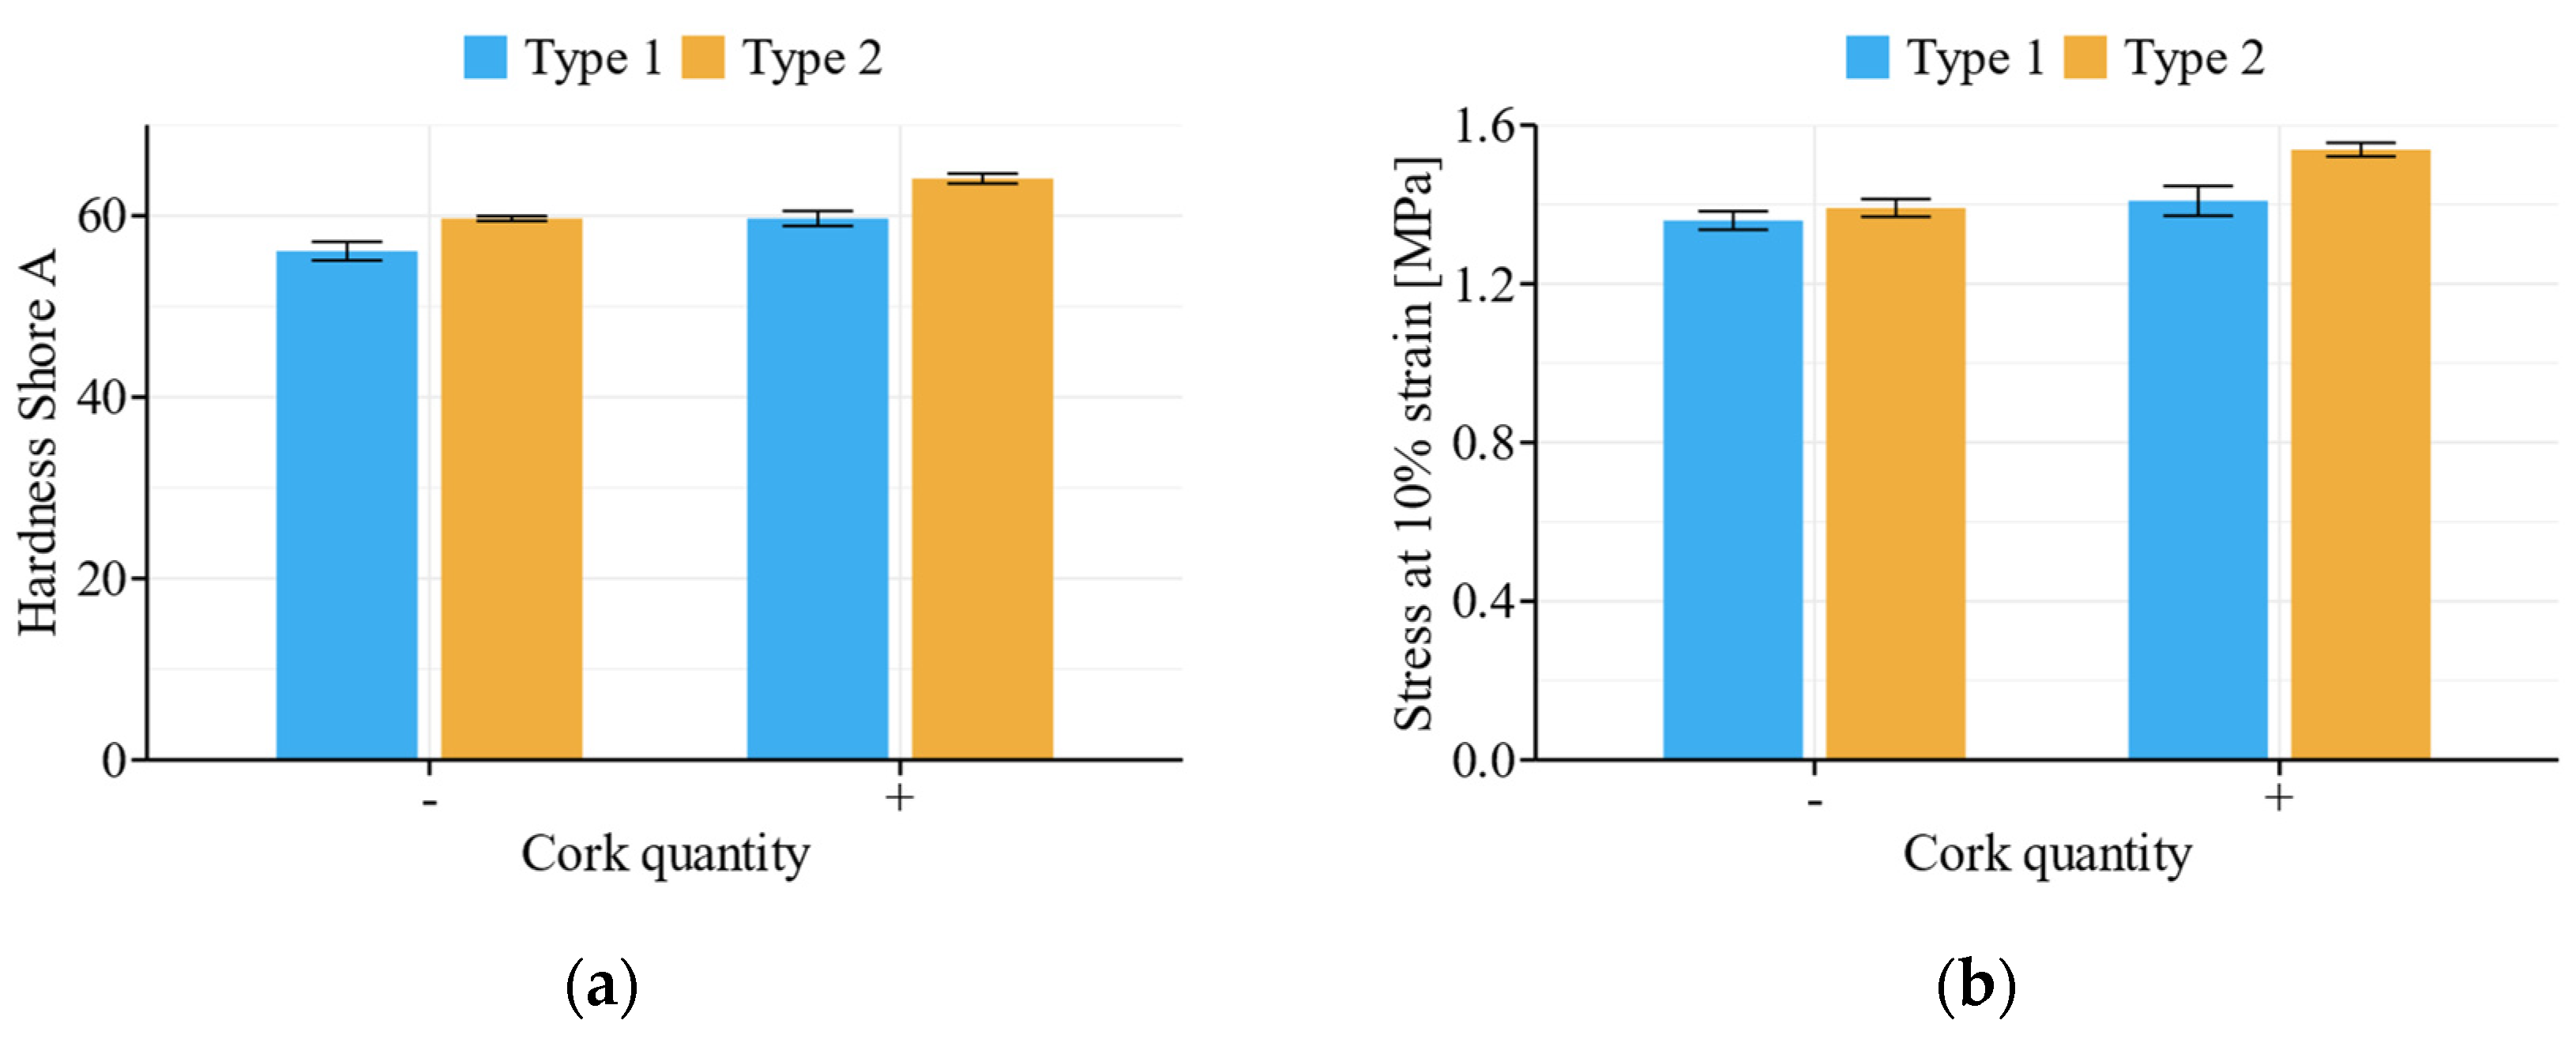
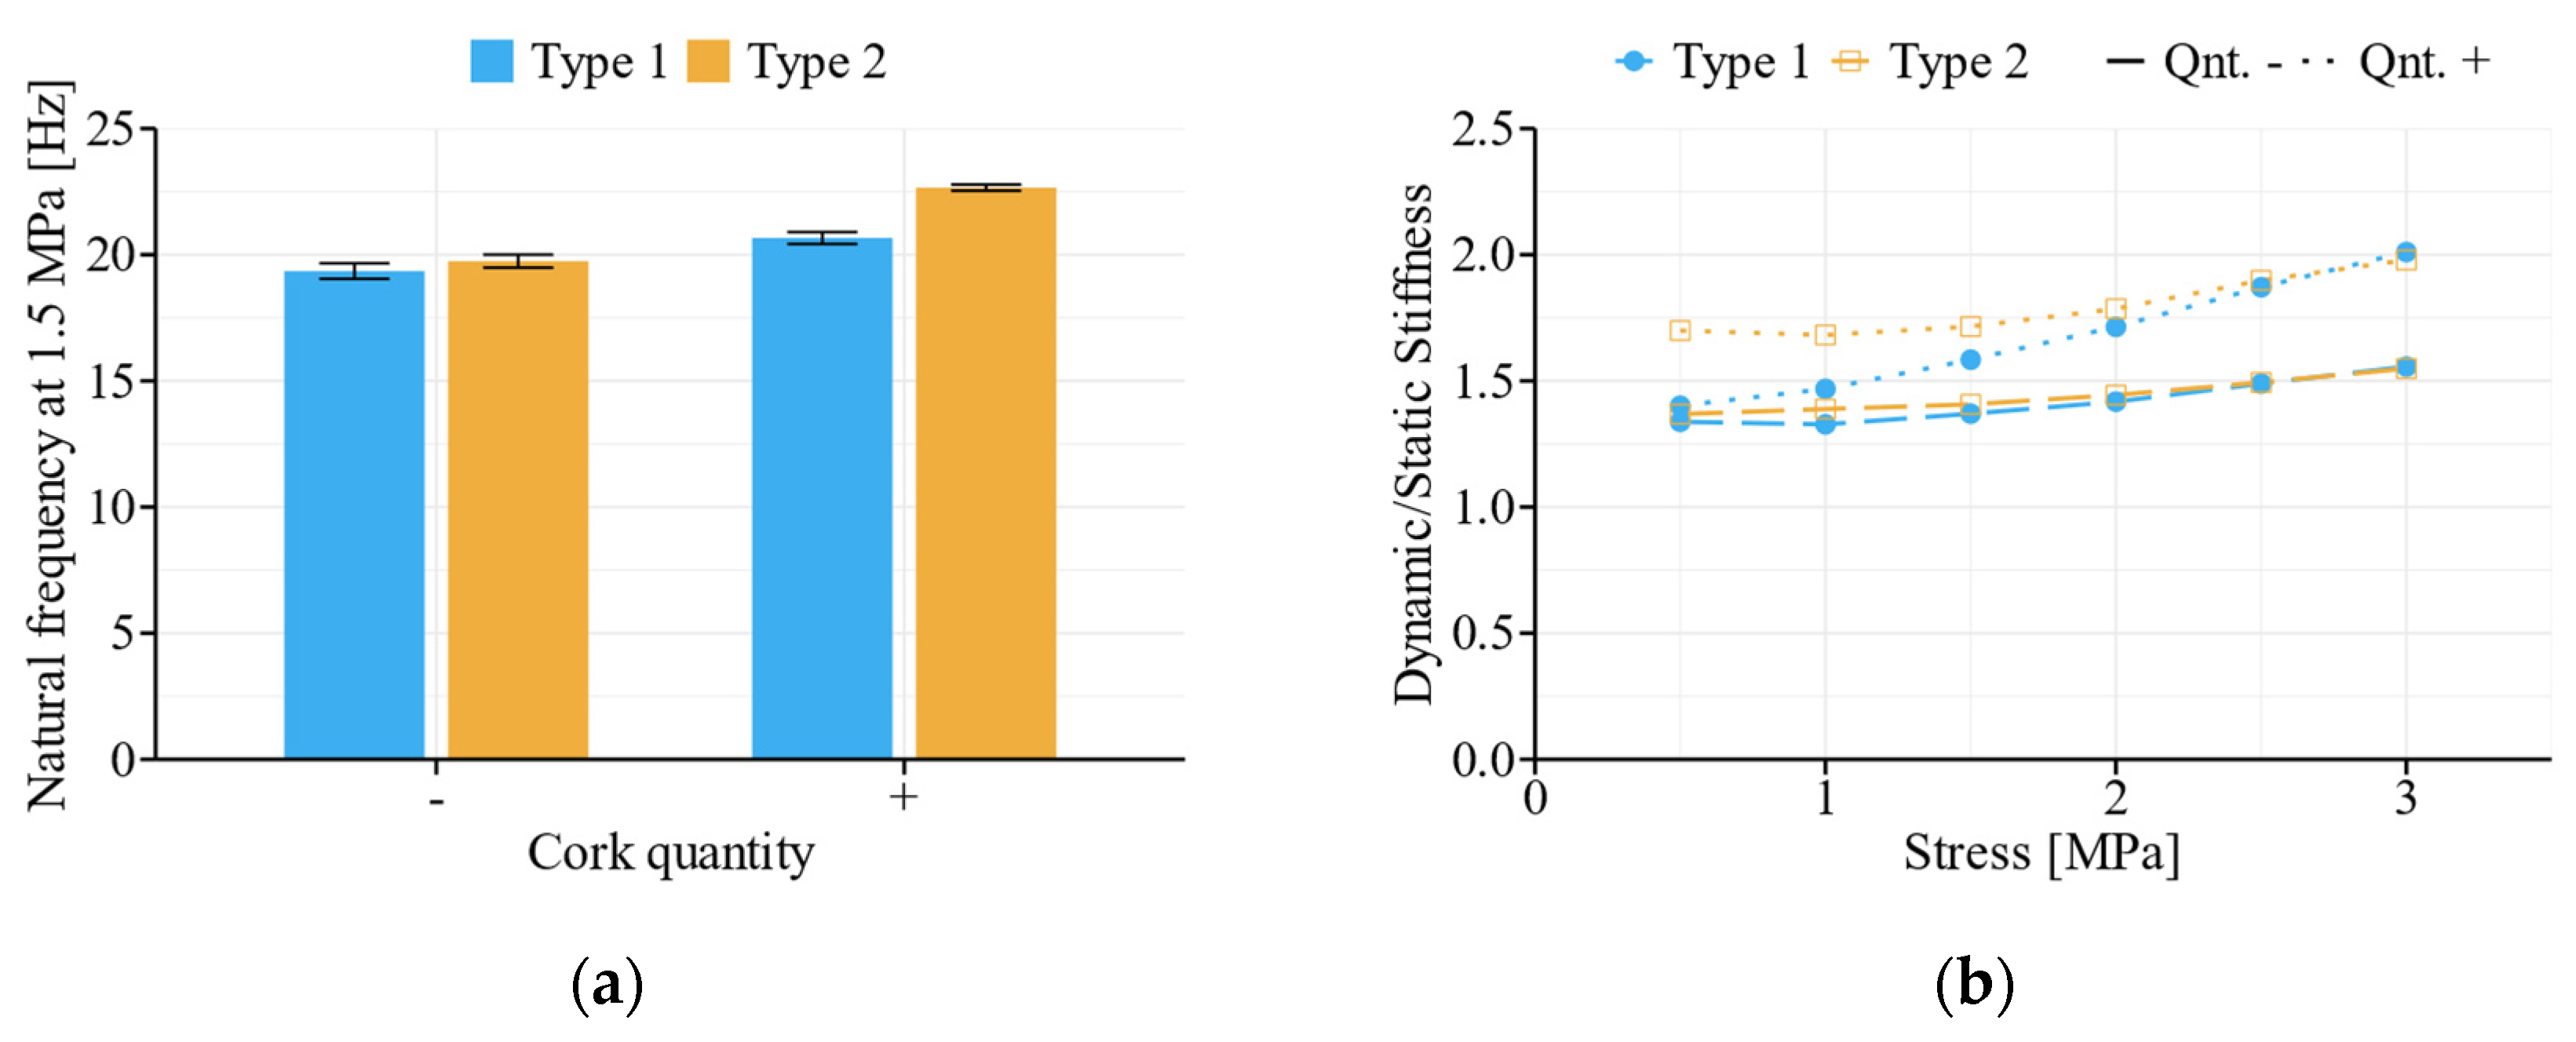
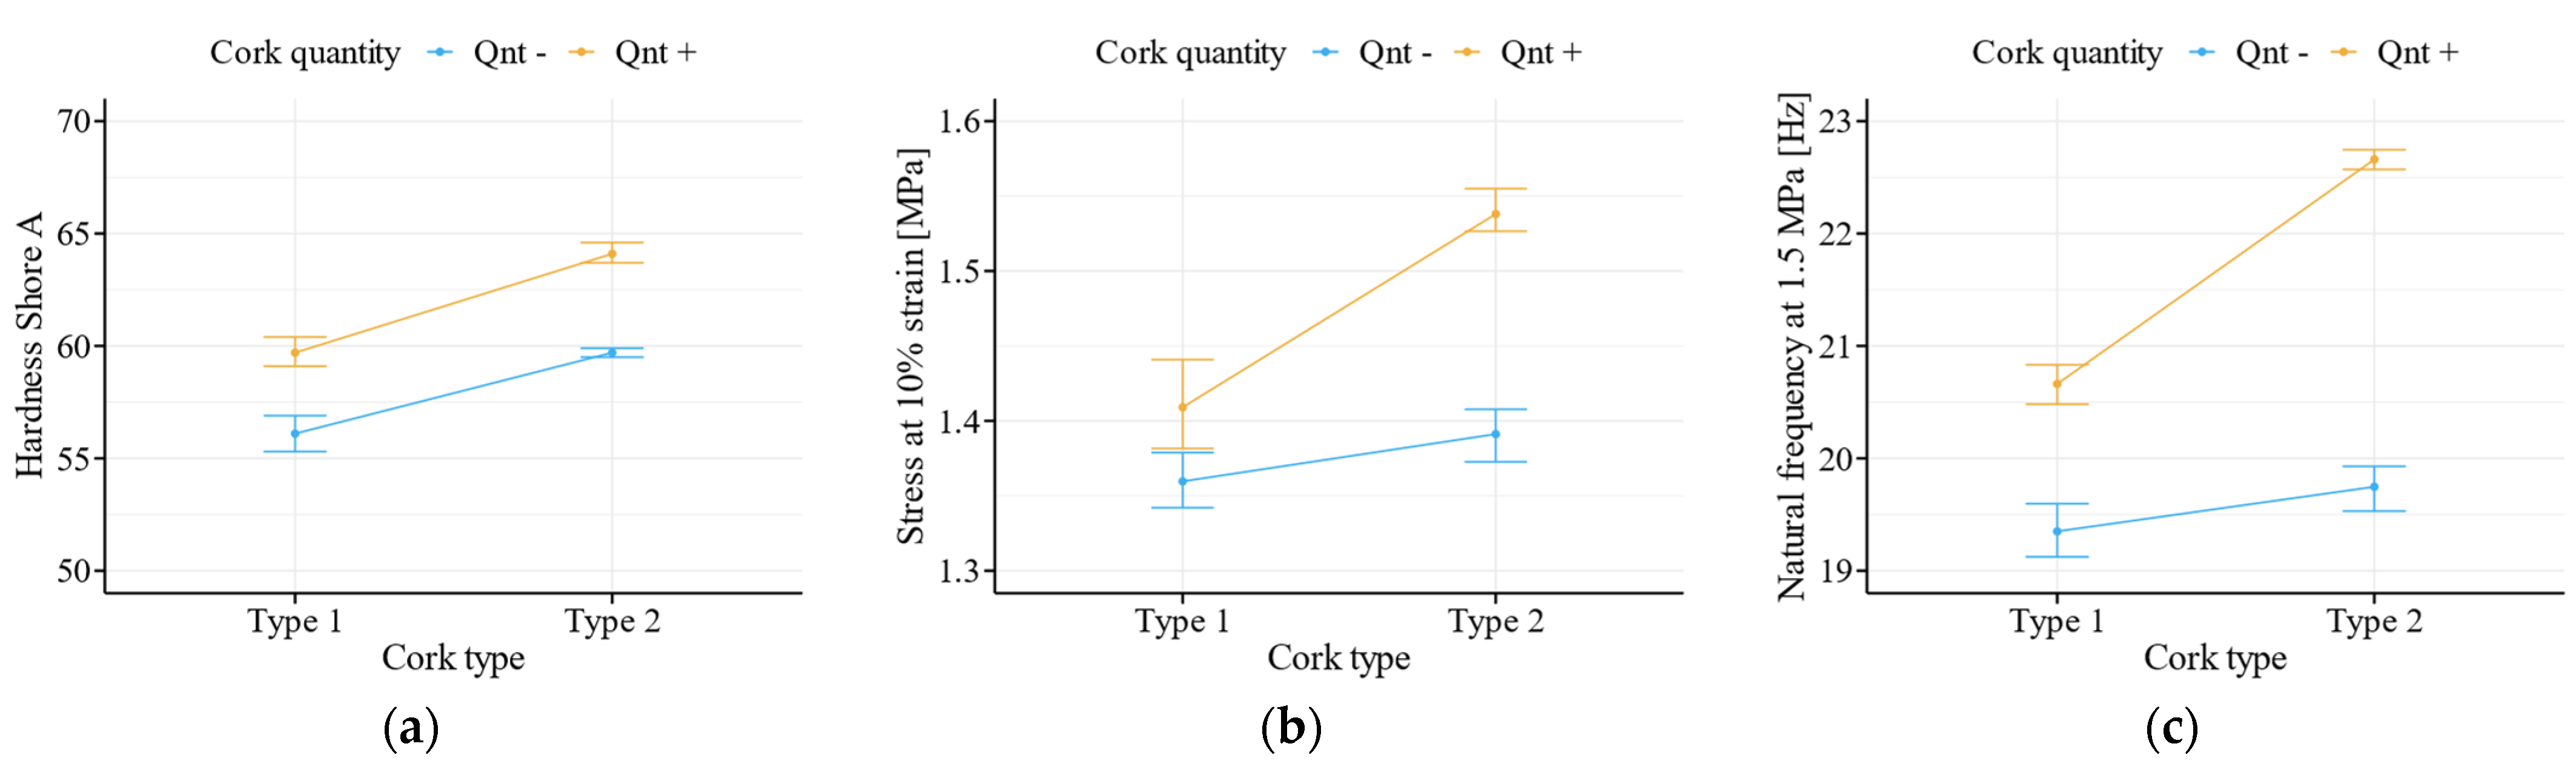
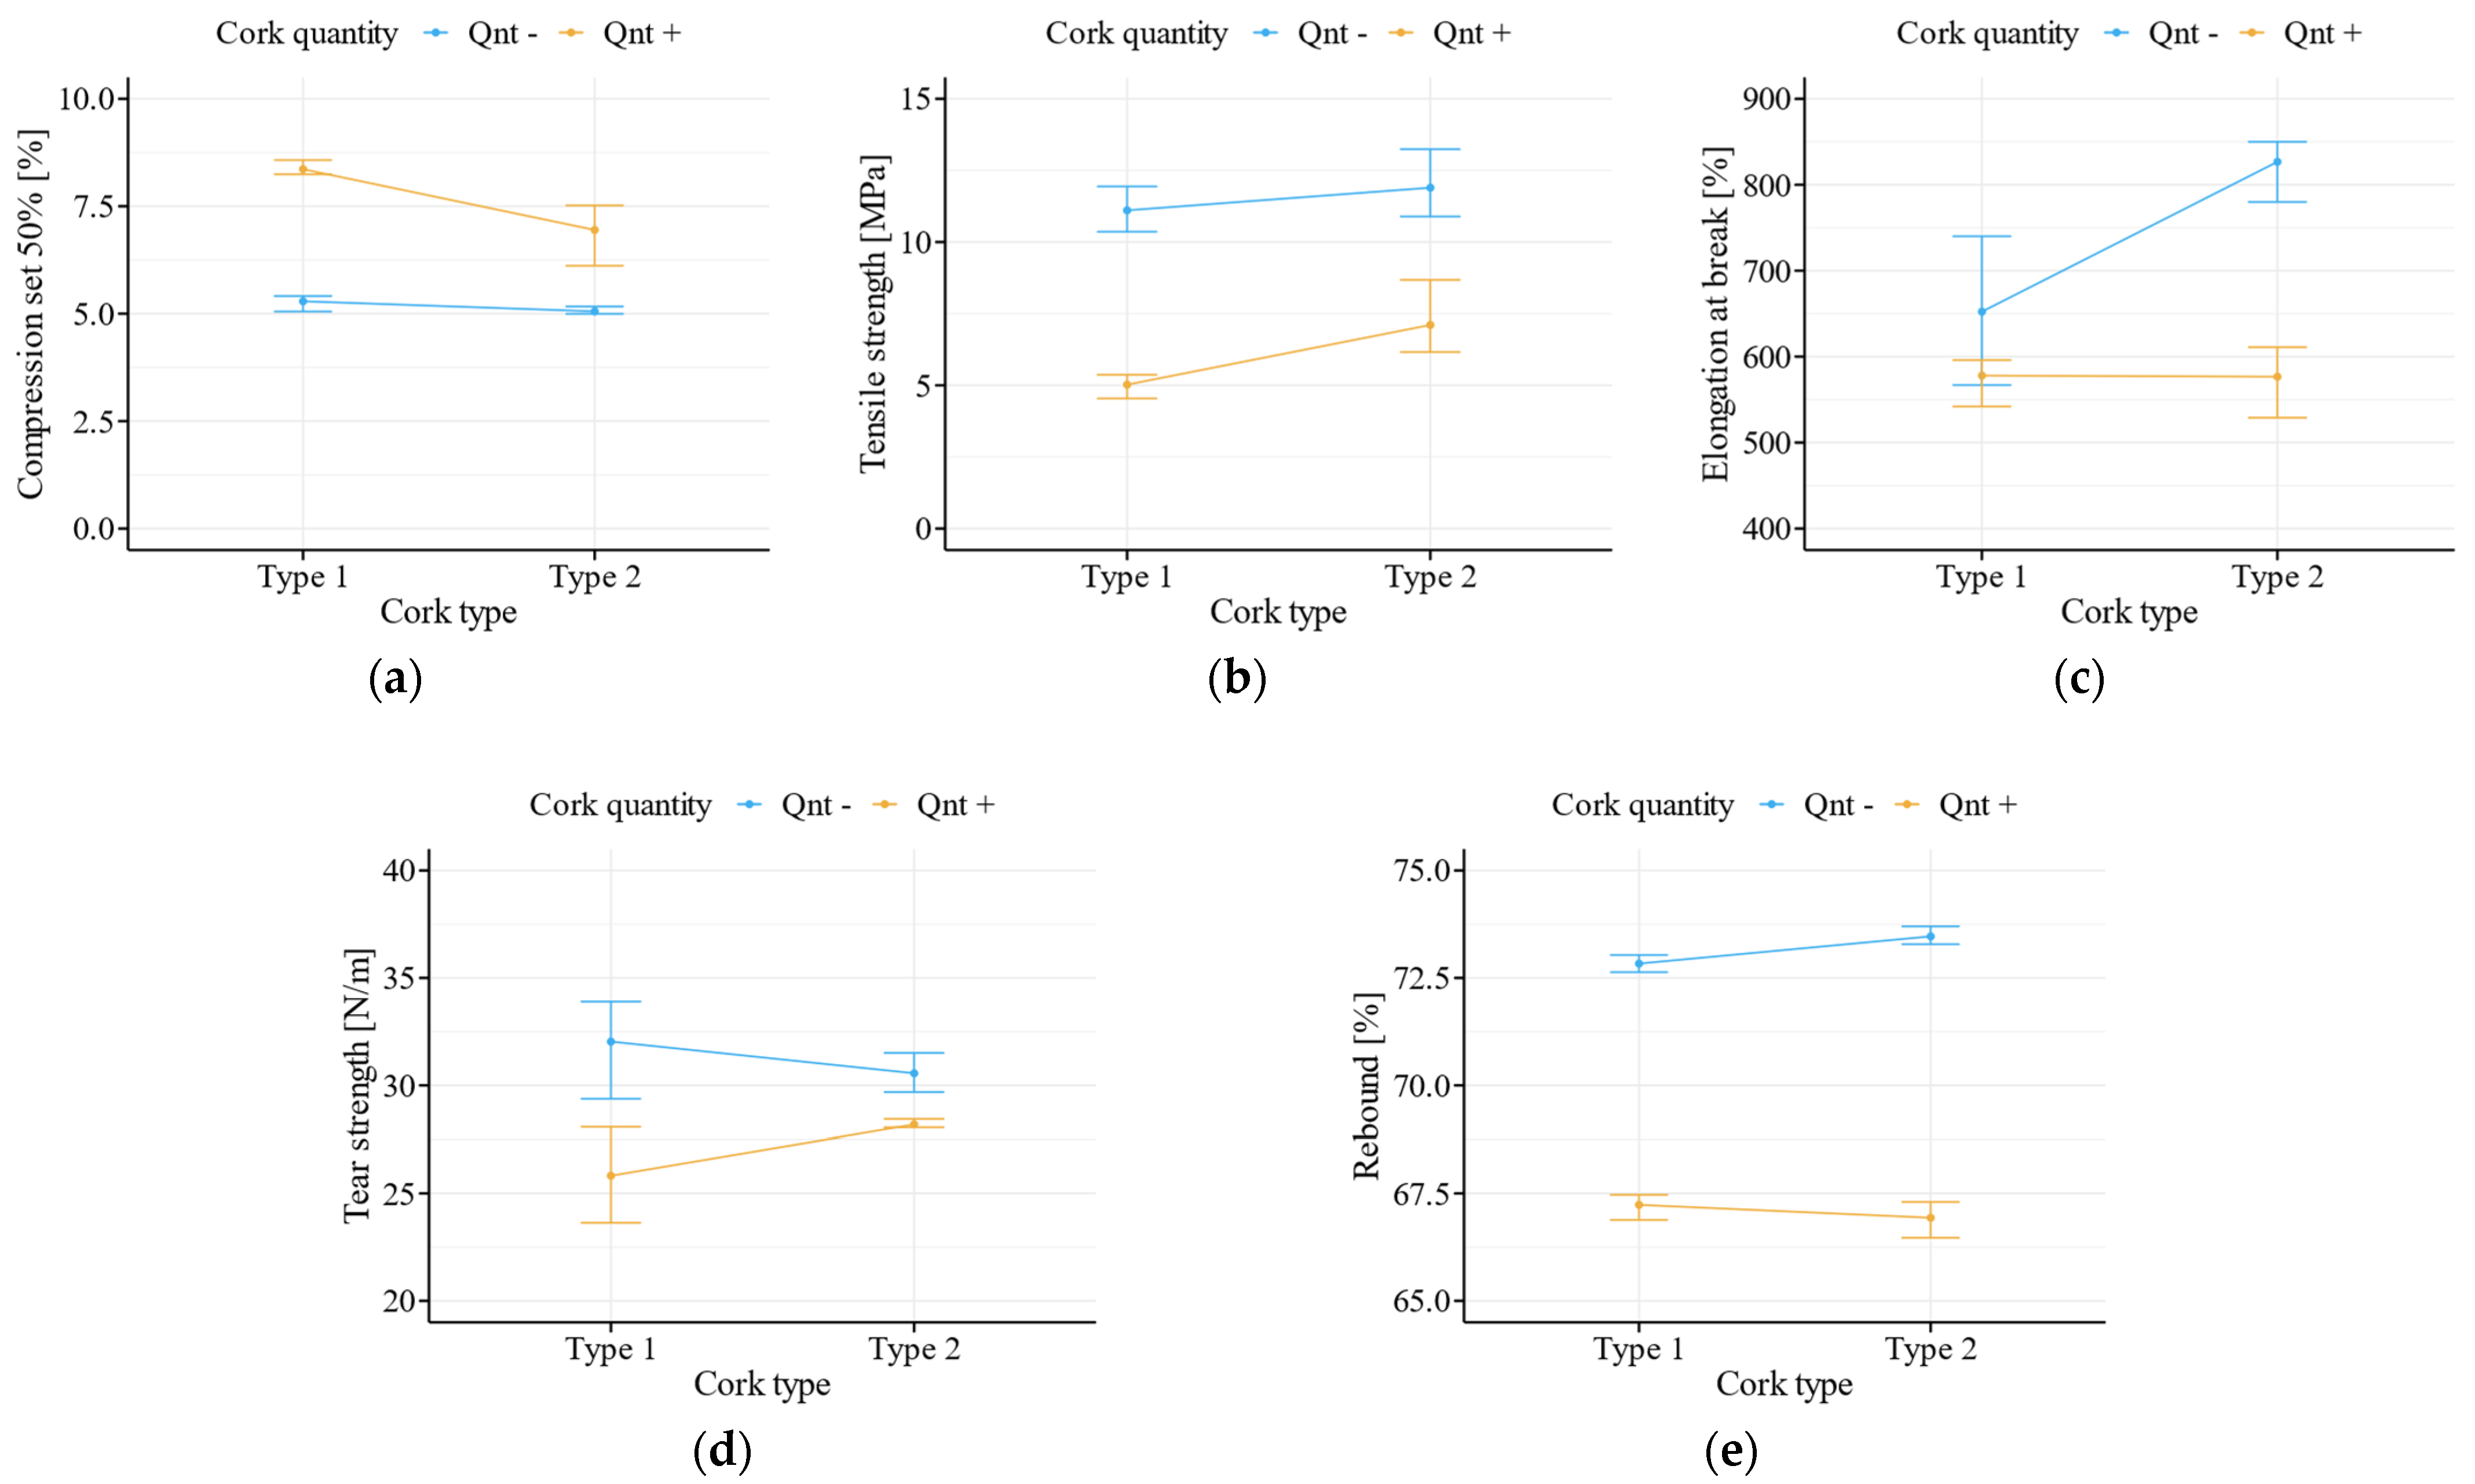
3.1.2. Granulometry and Quantity

The variation of factors related to the incorporation of cork granules in a rubber compound seems to influence the hardness and compression capacity of the composites (Figure 2). It appears that the use of higher size granules (type 1) results in a lower compression capacity and low hardness values when compared to the application of smaller cork granules. This could be related to the creation of more links between cork—here acting as a filler—and the rubber matrix due to an increase in the specific surface area [48]. Additionally, the increase in the cork amount also increased the performance of the material on hardness and static compression capacity. In this case, the effect of the cork in a natural rubber compound is similar to what was observed by Gul and Mirza [37] and other authors regarding natural-based fillers, such as bamboo, sisal, oil palm wood and crop residues, incorporated in an elastomer matrix [15,16,17,20,22,23].
It is possible to see also some differences in the dynamical behavior between the different compounds (Figure 3a). The smaller granules (type two) compounds present higher natural frequencies when compared to the other cork granules’ type, although the differences for smallest quantities of cork are not as significant as the ones for the highest amount of cork incorporated in the compounds. As observed in the uniaxial static compression results, the use of smaller cork particles can significantly increase the natural frequency. In terms of the ratio between dynamic and static stiffness (Figure 3b), it appears that the differences observed between cork quantity levels are higher than those observed between the two types of cork granules tested in this work, especially at higher stresses levels. Additionally, throughout the stress range, it is possible to notice a ratio increase regarding the use of higher quantities of type one compared with the other formulations.
Interaction plots according to the mean values for hardness Shore A, stress at 10% strain and natural frequency at 1.5 MPa for the cork study are depicted in Figure 4.
Data obtained regarding other mechanical properties of cork–rubber materials are presented by the interaction plots of Figure 5. Results of tensile strength, elongation at break, tear strength and rebound presented lower values for composites with higher cork content, similarly to what was reported in other works [14,15,16,20,22,37]. The influence of cork granules’ size and quantity on tensile strength, elongation at break and tear strength has the same tendency reported by Ismail et al. [14,15,16]. The increase in cork quantity also hinders the elastic recovery of cork–rubber composites under prolonged loads, as indicated by the compression set results, following similar trends reported in other rubber related works such as Zanchet et al. [51]. The inclusion of higher quantities of cork demonstrated a decrease in rebound resilience, similar to what was reported regarding other wood–rubber composites by Shao et al. [20].
Regarding the cork system study, a two-factor ANOVA was applied to study the following properties: hardness, stress at 10% strain, natural frequency at 1.5 MPa, compression set, tensile strength, elongation at break, tear strength and rebound. After accessing the assumptions of all the ANOVAs, robust methods (use of trimmed means with a level of trimming of 20%) were applied in the study of all the properties that did not follow the assumptions of normality and/or homogeneity of variance. In Table 3, only the significant effects considering a level of confidence of 95% for each property are reported. All statistical analyses presented at least one factor with a significant effect on each property of the cork–rubber compounds.

3.2. Effect of Vulcanization Parameters

3.2.1. Molding Pressure

A preliminary study about the influence of holding pressure during a compression molding process was conducted with compound B. Two samples of the same compound mixture were produced with the same vulcanization temperature and time, differing only on the level of pressure applied during the heating process. Due to the small amount of material available, two replicates from each sample were analyzed. Significant differences were not observed in terms of compression strength (stress value at 10% strain).
Regarding compound D, that presents the highest amount of cork, the existence of differences between samples produced at two different levels of pressures was investigated. The results obtained for hardness Shore A, compression stress at 10% strain and resultant natural frequency when the sample is subject to a 1.5 MPa load, are presented in Table 4.
To evaluate the static and dynamic properties, pooled t-tests were applied. Due to the lack of normality of data regarding hardness values, the Wilcoxon Rank Sum test was used.
Considering a significance level of 5%, the results of the statistical analysis showed that, on average, the application of lower pressure levels during the vulcanization of compound D resulted in higher hardness values compared with the compression molding at higher pressures (W = 25, p-value = 0.005). The values of stress obtained at 10% strain in a quasi-static compression test of compounds produced at lower pressure were lower than the vulcanizates created with other pressure levels (t(8) = –8.1468, p-value < 0.001). The increase in the pressure level leads to a more compacted material during the vulcanization stage, diminishing the distances between polymeric chains, which can promote the creation of more crosslinks, commonly related to the increase in the strength properties of rubber compounds. However, regarding natural frequency, applying the lowest level of pressure, the resultant vulcanizates presented significant greater values than the ones produced at higher pressure (t (8) = 2.8503, p-value = 0.011). This result opposes the trends reported in previous sections: to an increase in static stiffness, corresponds an increase in dynamic stiffness and a reduction in natural frequency.
Given this, depending on the type of compound and, also, the range of pressures analyzed, the reported effects of pressure on mechanical properties differs. For example, regarding compounds based on synthetic rubber such as ethylene-propylene diene rubber (EPDM), while Deuri et al. [24] observed some significant variations in mechanical properties between some pressure levels, Akbay et al. [52] did not find significant effects due to the application of different pressure levels on properties such as modulus of elasticity, tensile strength and elongation.

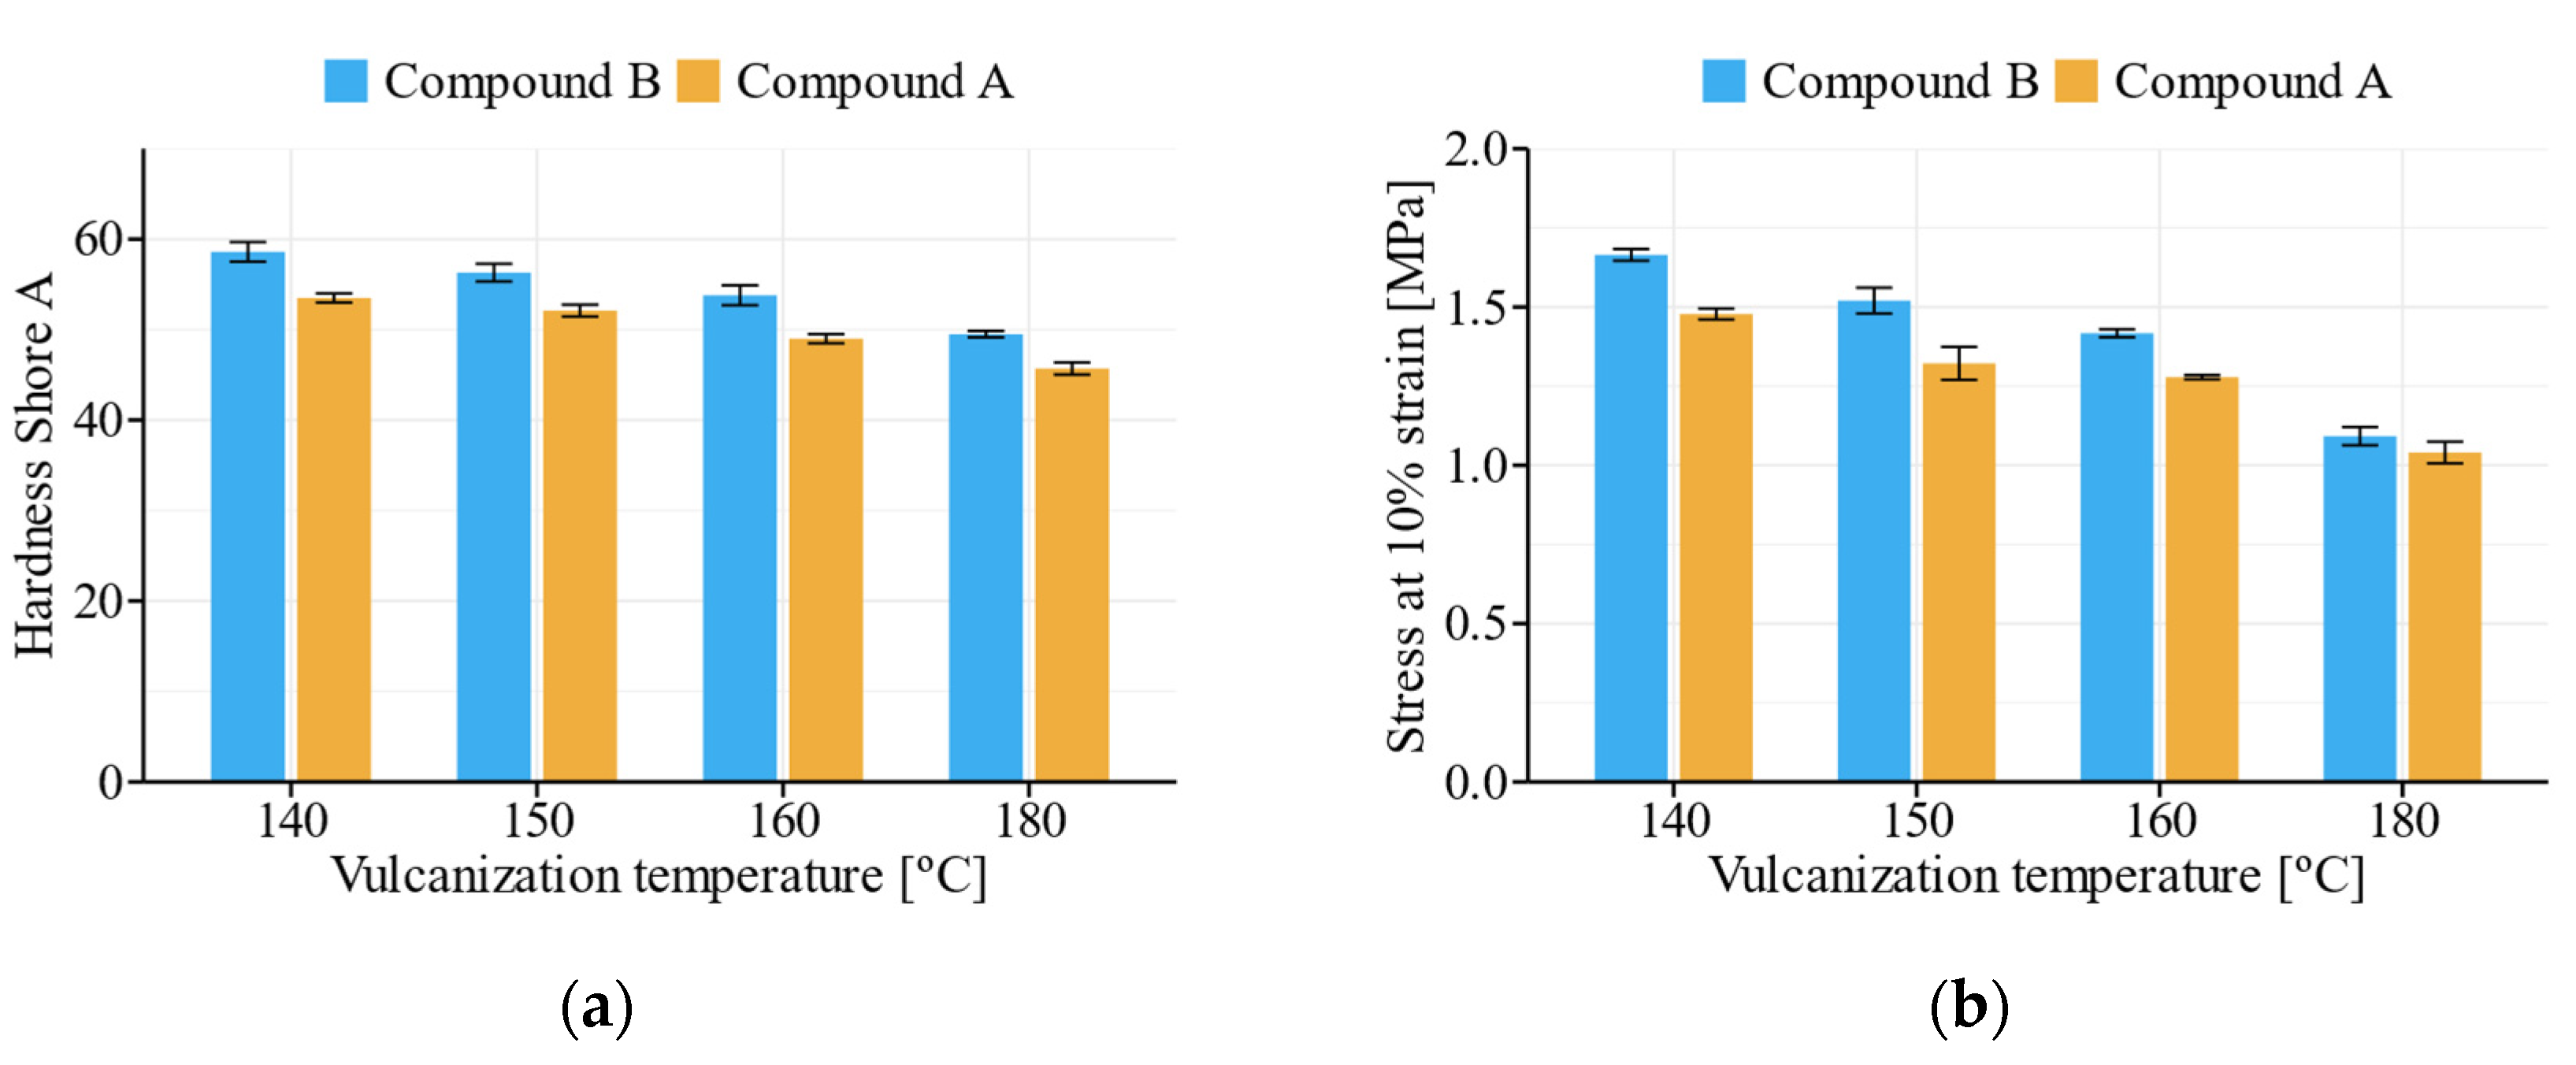
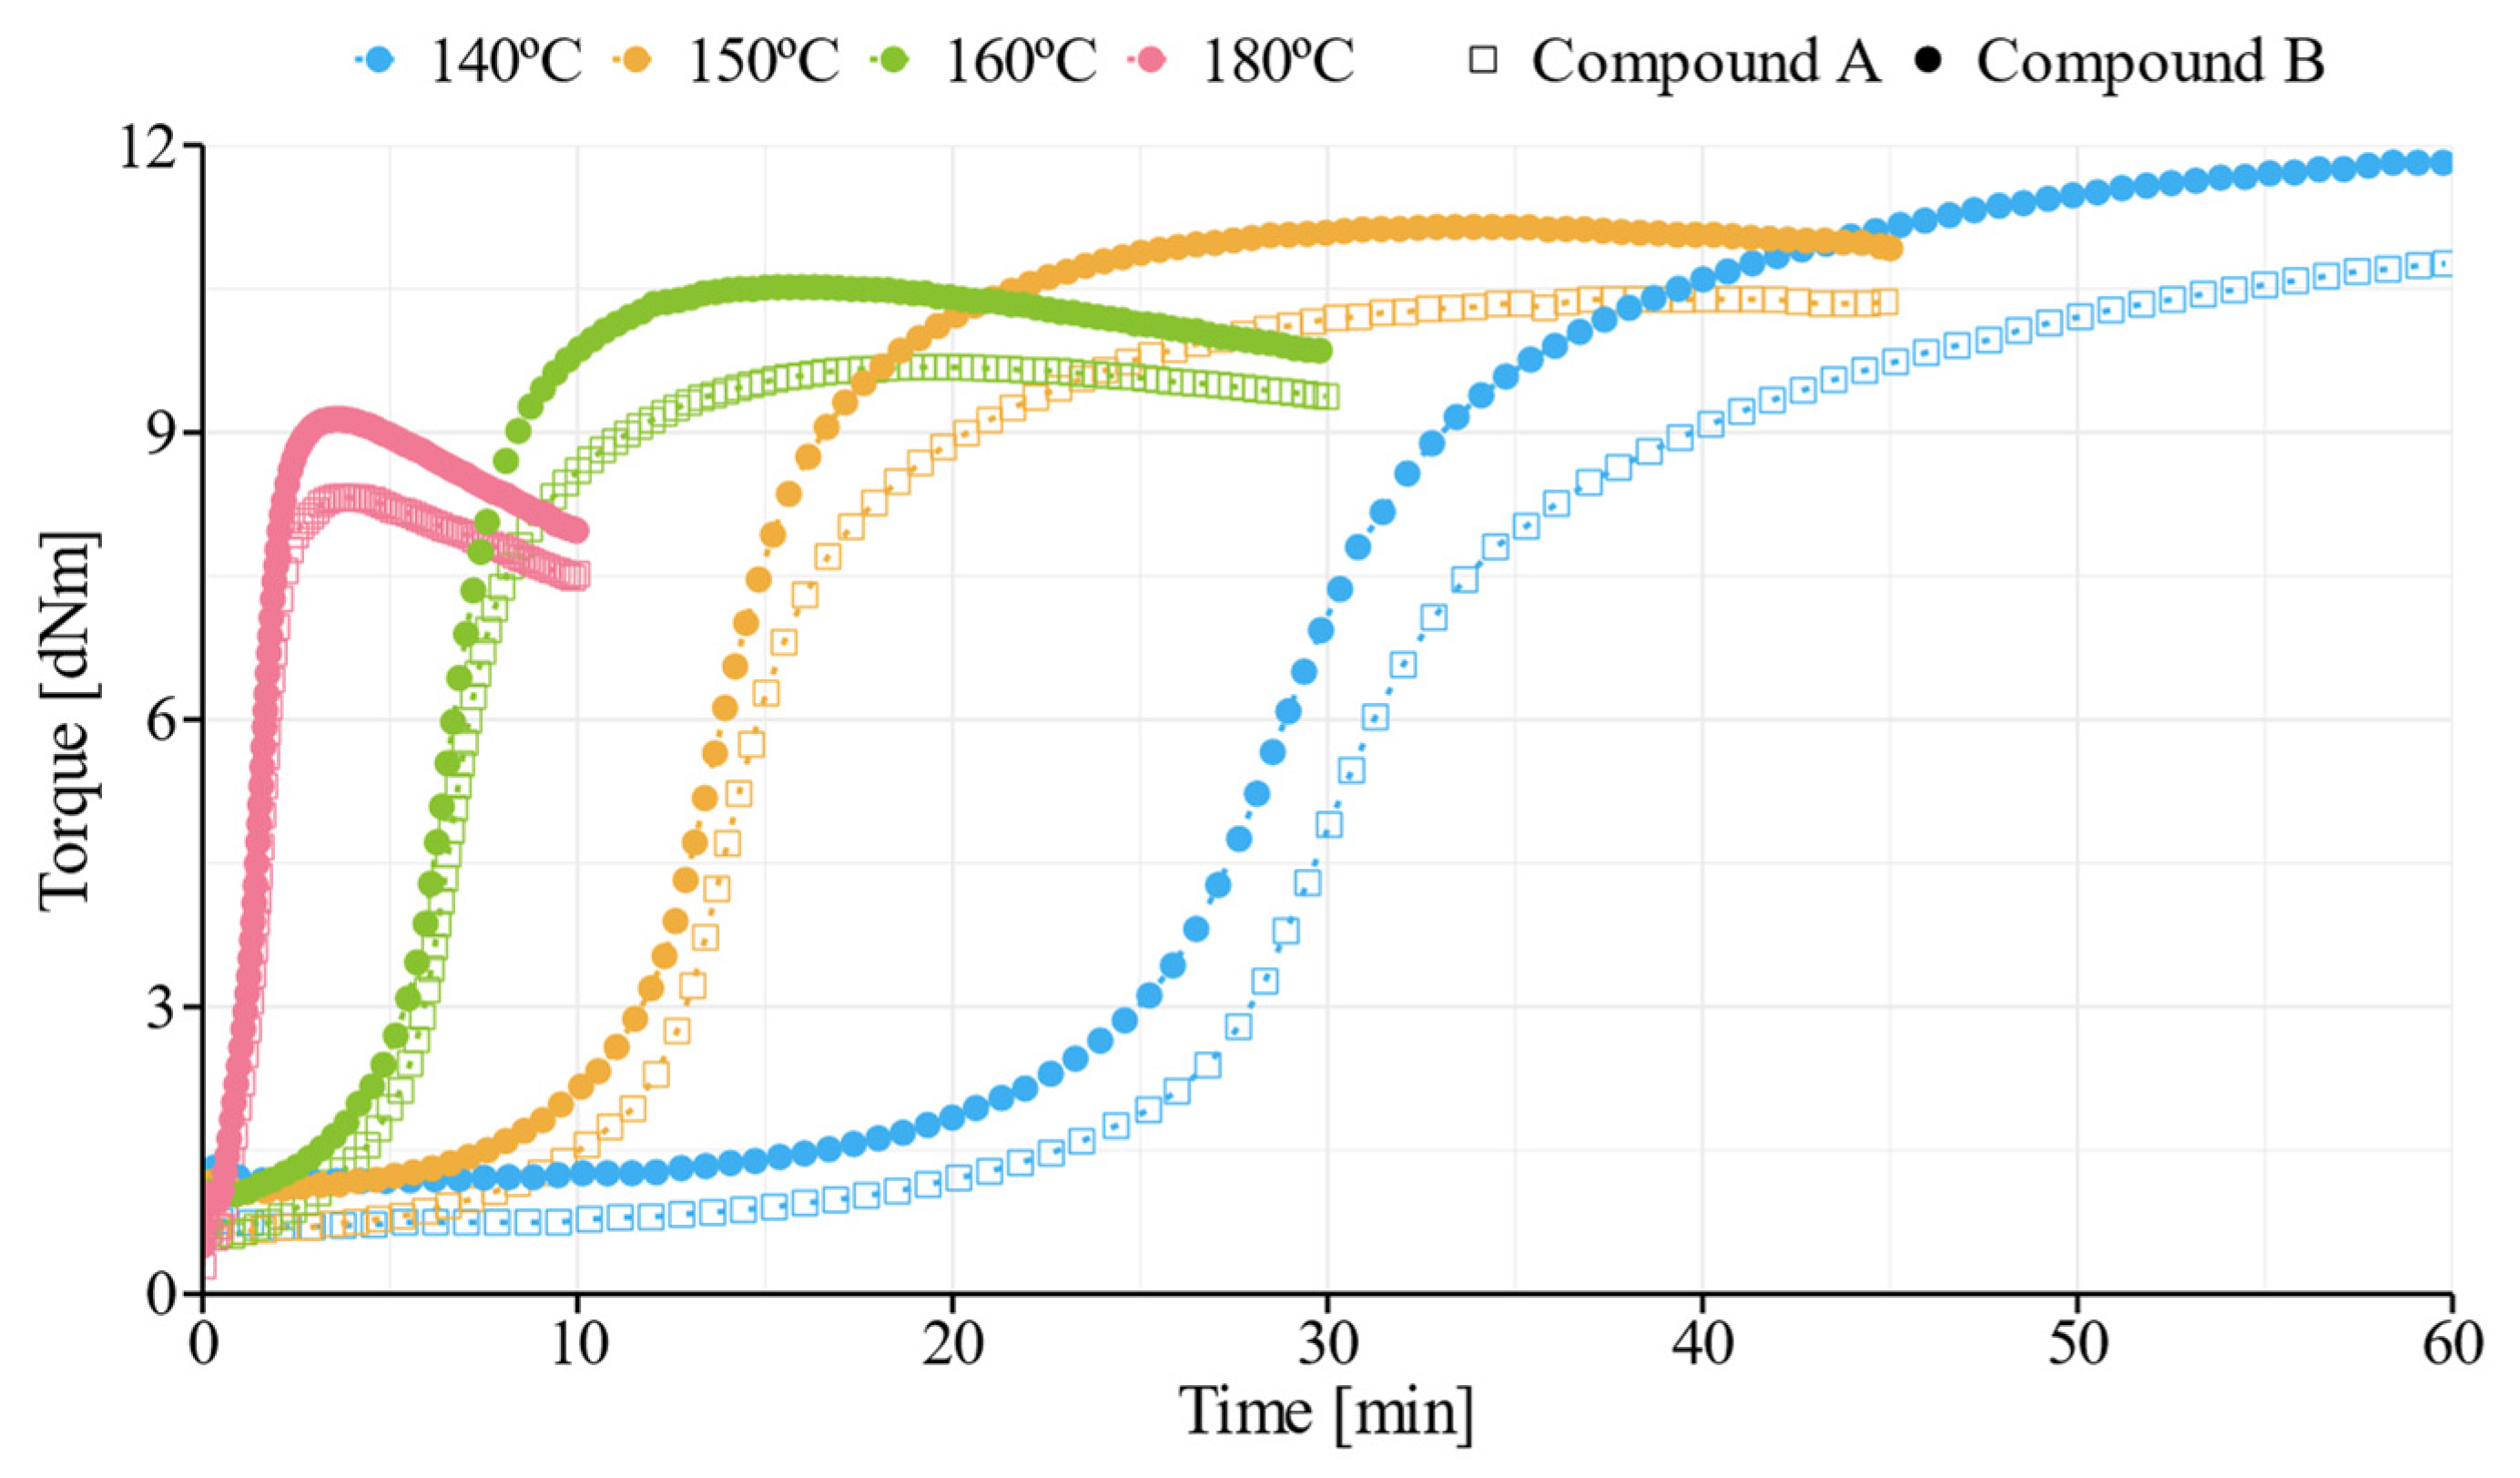
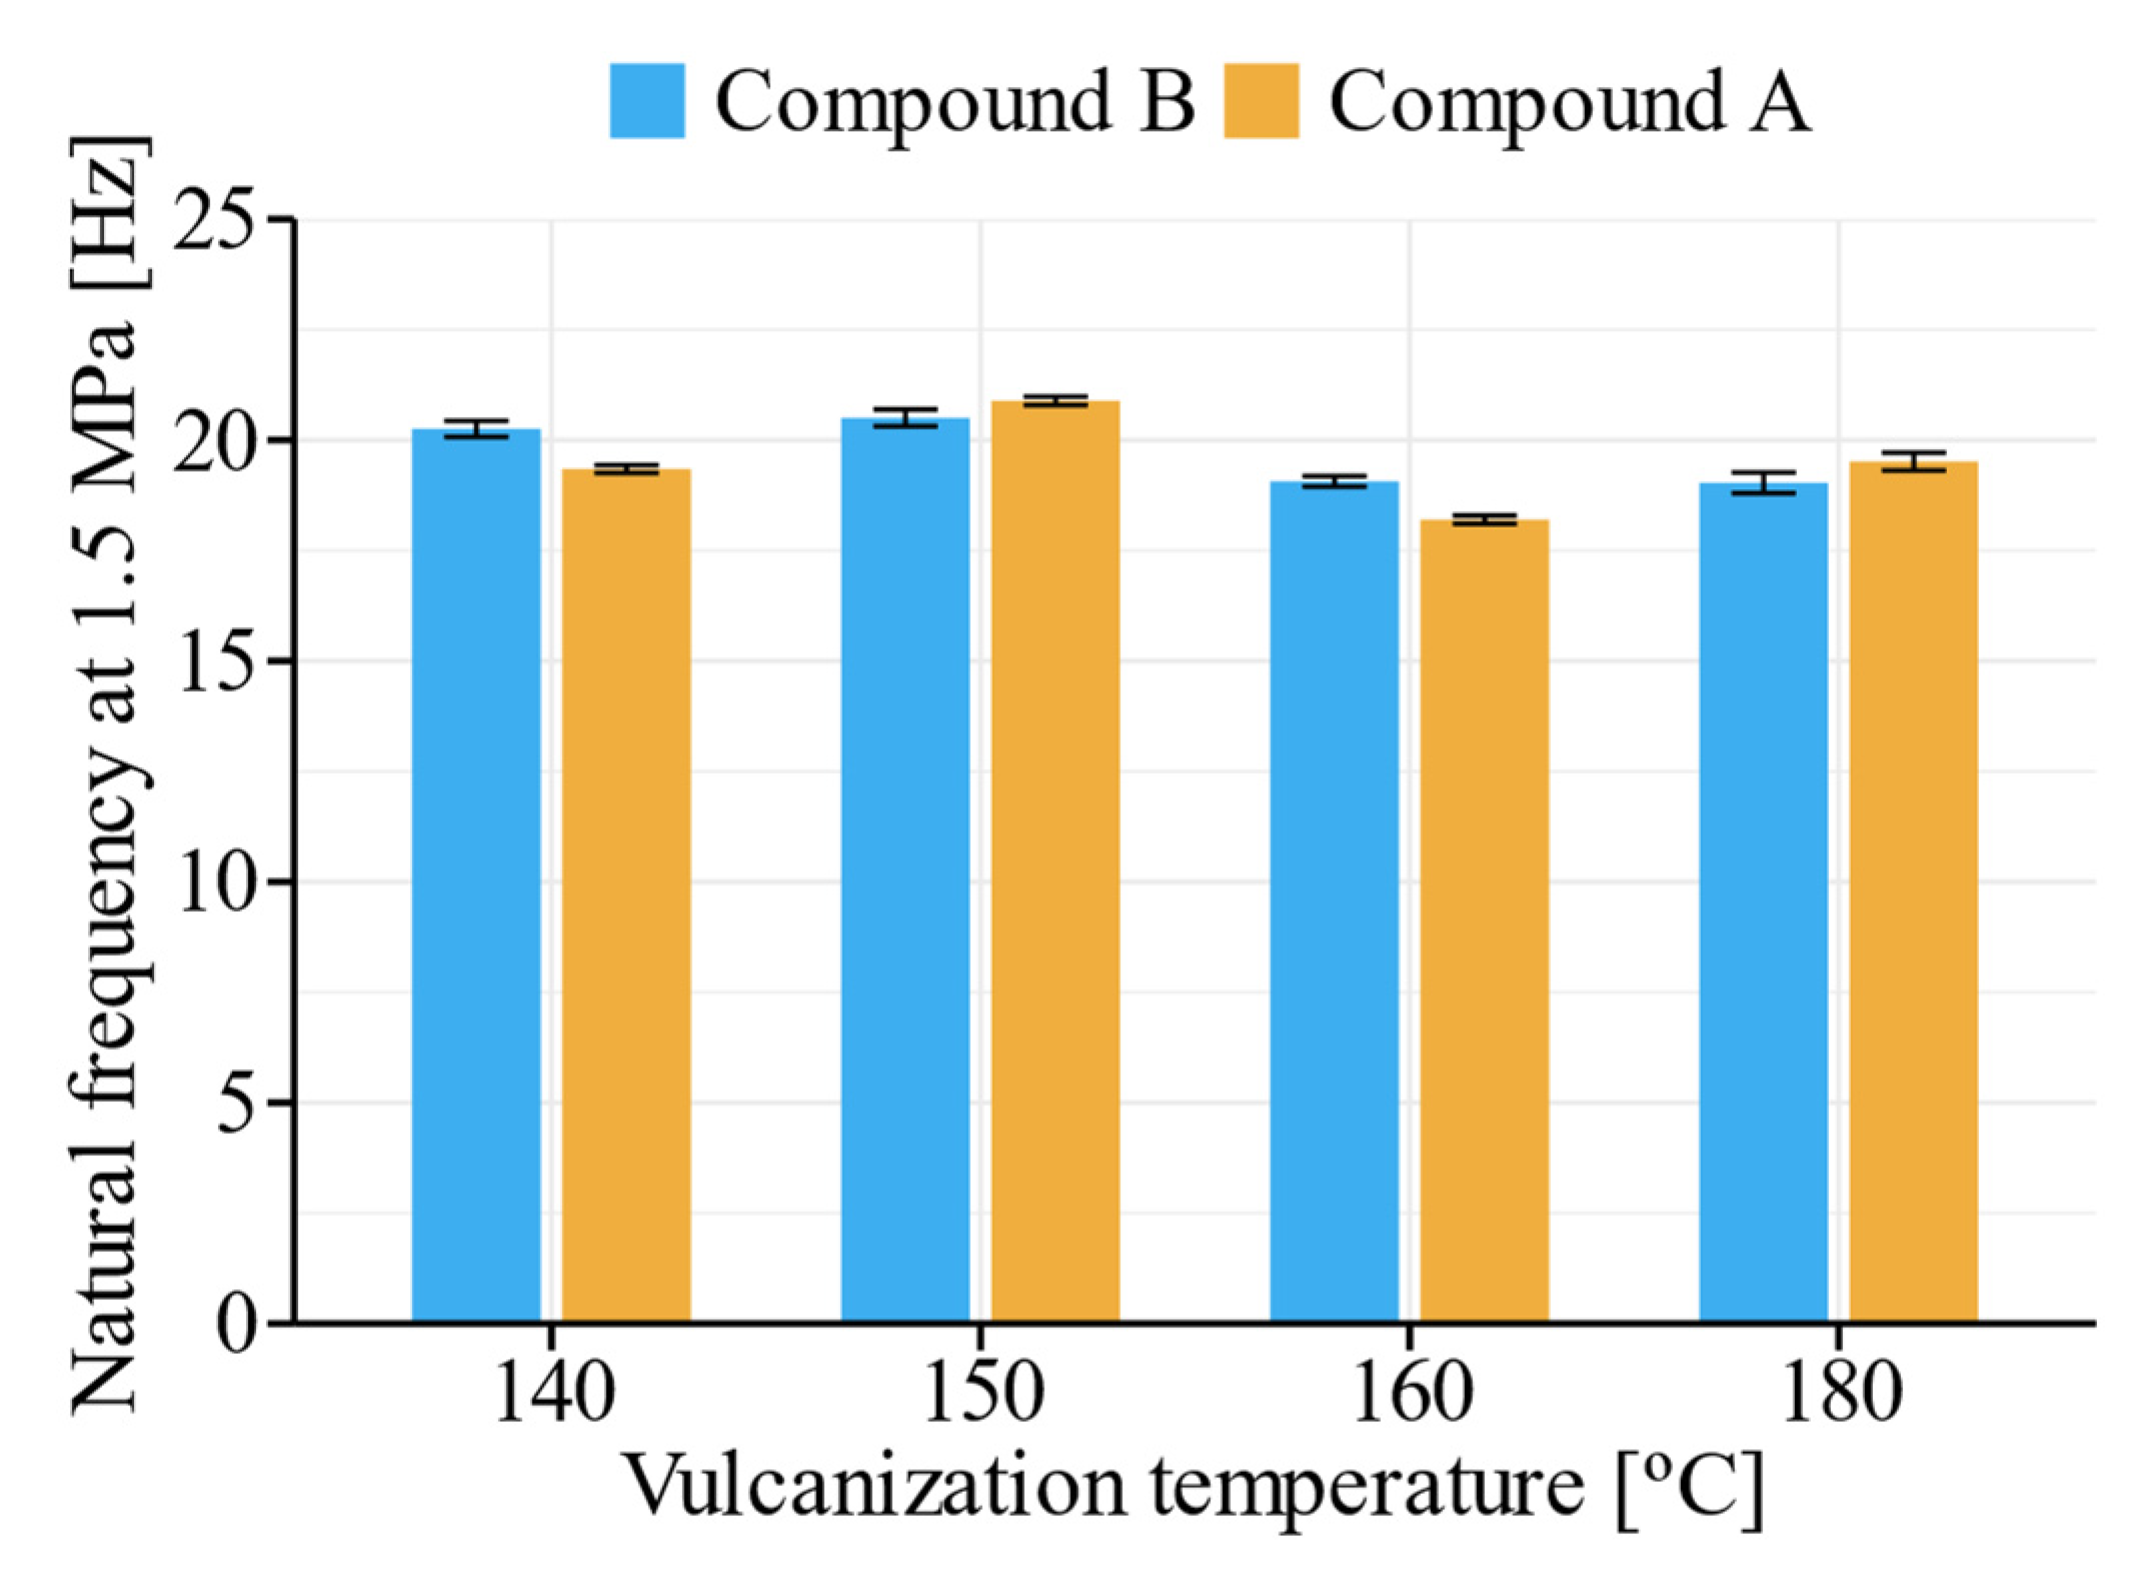
3.2.2. Vulcanization Temperature

The behavior of similar rubber compounds with and without cork granules was compared at different vulcanization temperatures (compounds B and A, respectively). Independently of cork granules being present in the formulation, the results show that the increasing vulcanization temperature diminished the samples’ hardness and compression stiffness (Figure 6), as also observed by many authors regarding natural and synthetic rubbers [25,53,54,55]. These results are in accordance with the obtained rheometer data, where higher values of torque indicate an increased crosslink density of the material, as presented in Figure 7. For higher temperatures, 160 °C and 180 °C, the decrease in torque after the curing stage indicates reversion, common in natural rubber compounds, that is related to the decrease in mechanical properties such as stiffness. Additionally, and according to the results of mechanical properties reported in previous sections and other author’s observations [22,23,55], independently of the vulcanization temperature, the inclusion of higher cork quantities presents the same increasing influence on rheometer data.
Regarding the dynamic behavior, the results of natural frequency do not seem to be significantly affected by the presence of cork granules. In terms of natural frequency when a sample is compressed at 1.5 MPa, there is not a clear tendency regarding the effect of the temperature and of the addition of cork granules, as presented in Figure 8.
The results obtained by the statistical analysis regarding the influence of temperature on the compounds A and B are presented in Table 5. As expected, in this study, the vulcanization temperature proved to have a significant on the properties of compounds A and B.
Regarding compound B, the results obtained using multiple comparison Tukey HSD tests proved the existence of significant differences between all the groups, except for natural frequency, where between higher temperatures (160 °C and 180 °C) and between lower temperatures (140 °C and 150 °C) significant differences between them were not produced.
The Tukey HSD test was also applied to determine significant differences between the groups regarding the natural frequency results obtained for compound A. The results demonstrate significant differences between all the groups except for the combination of 140 °C and 180 °C. Regarding static stress at 10% strain, the multiple comparison results presented significant differences between all the pairs, except for the temperature group 150–160 °C. After testing all the groups using the multiple comparisons test after Kruskal–Wallis related to hardness values, the groups that resulted in a significant difference were the following: 140–160 °C, 140–180 °C and 150–180 °C.

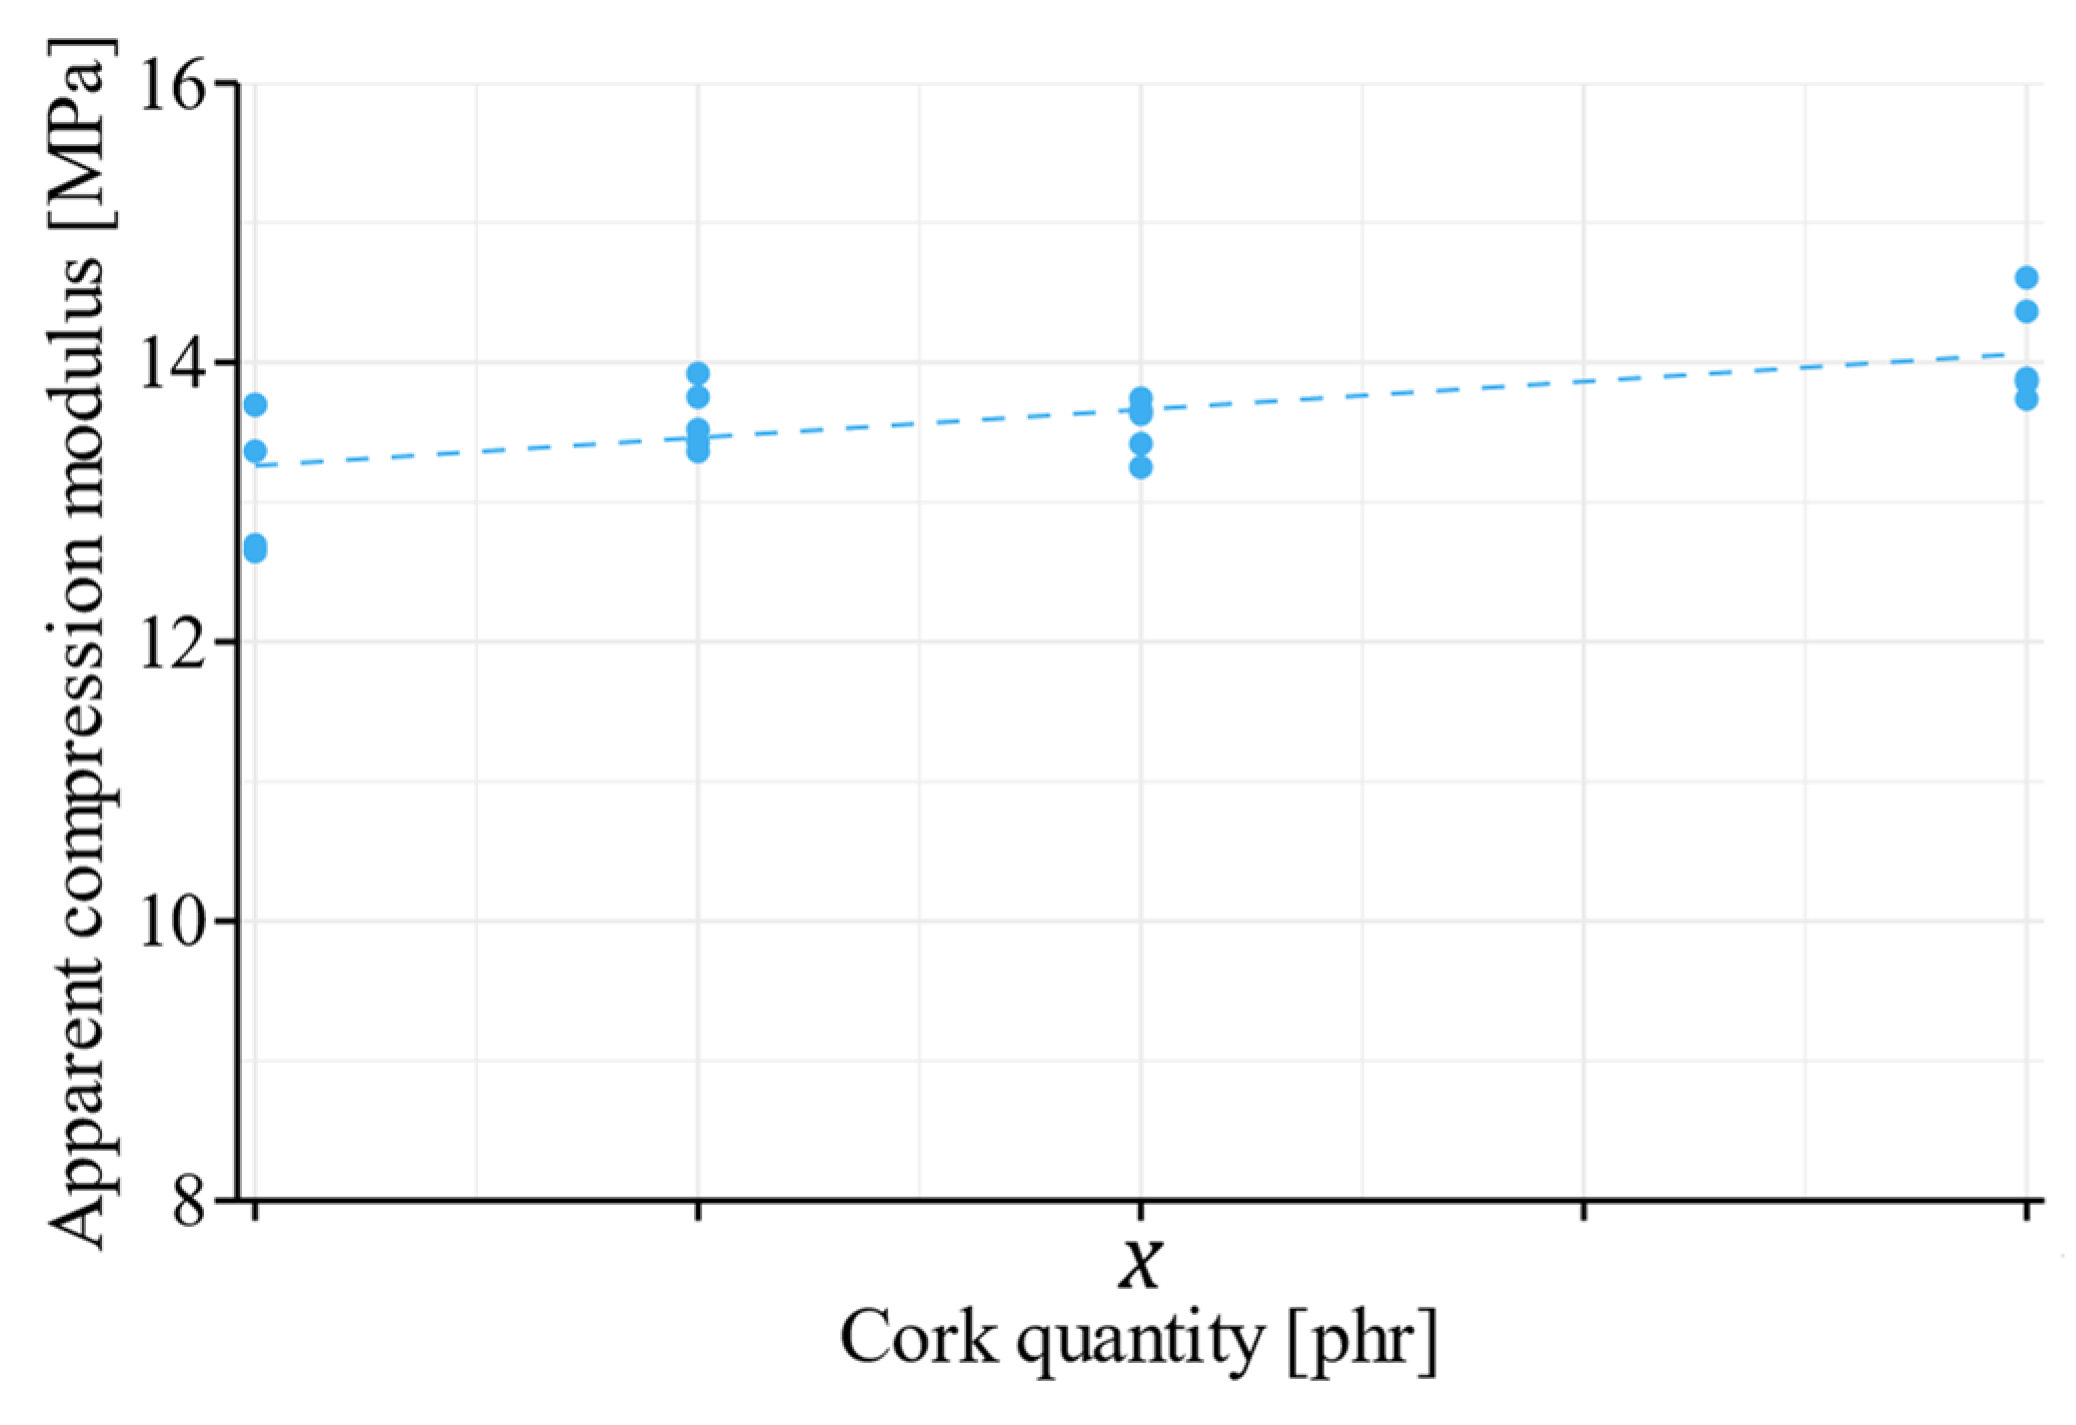
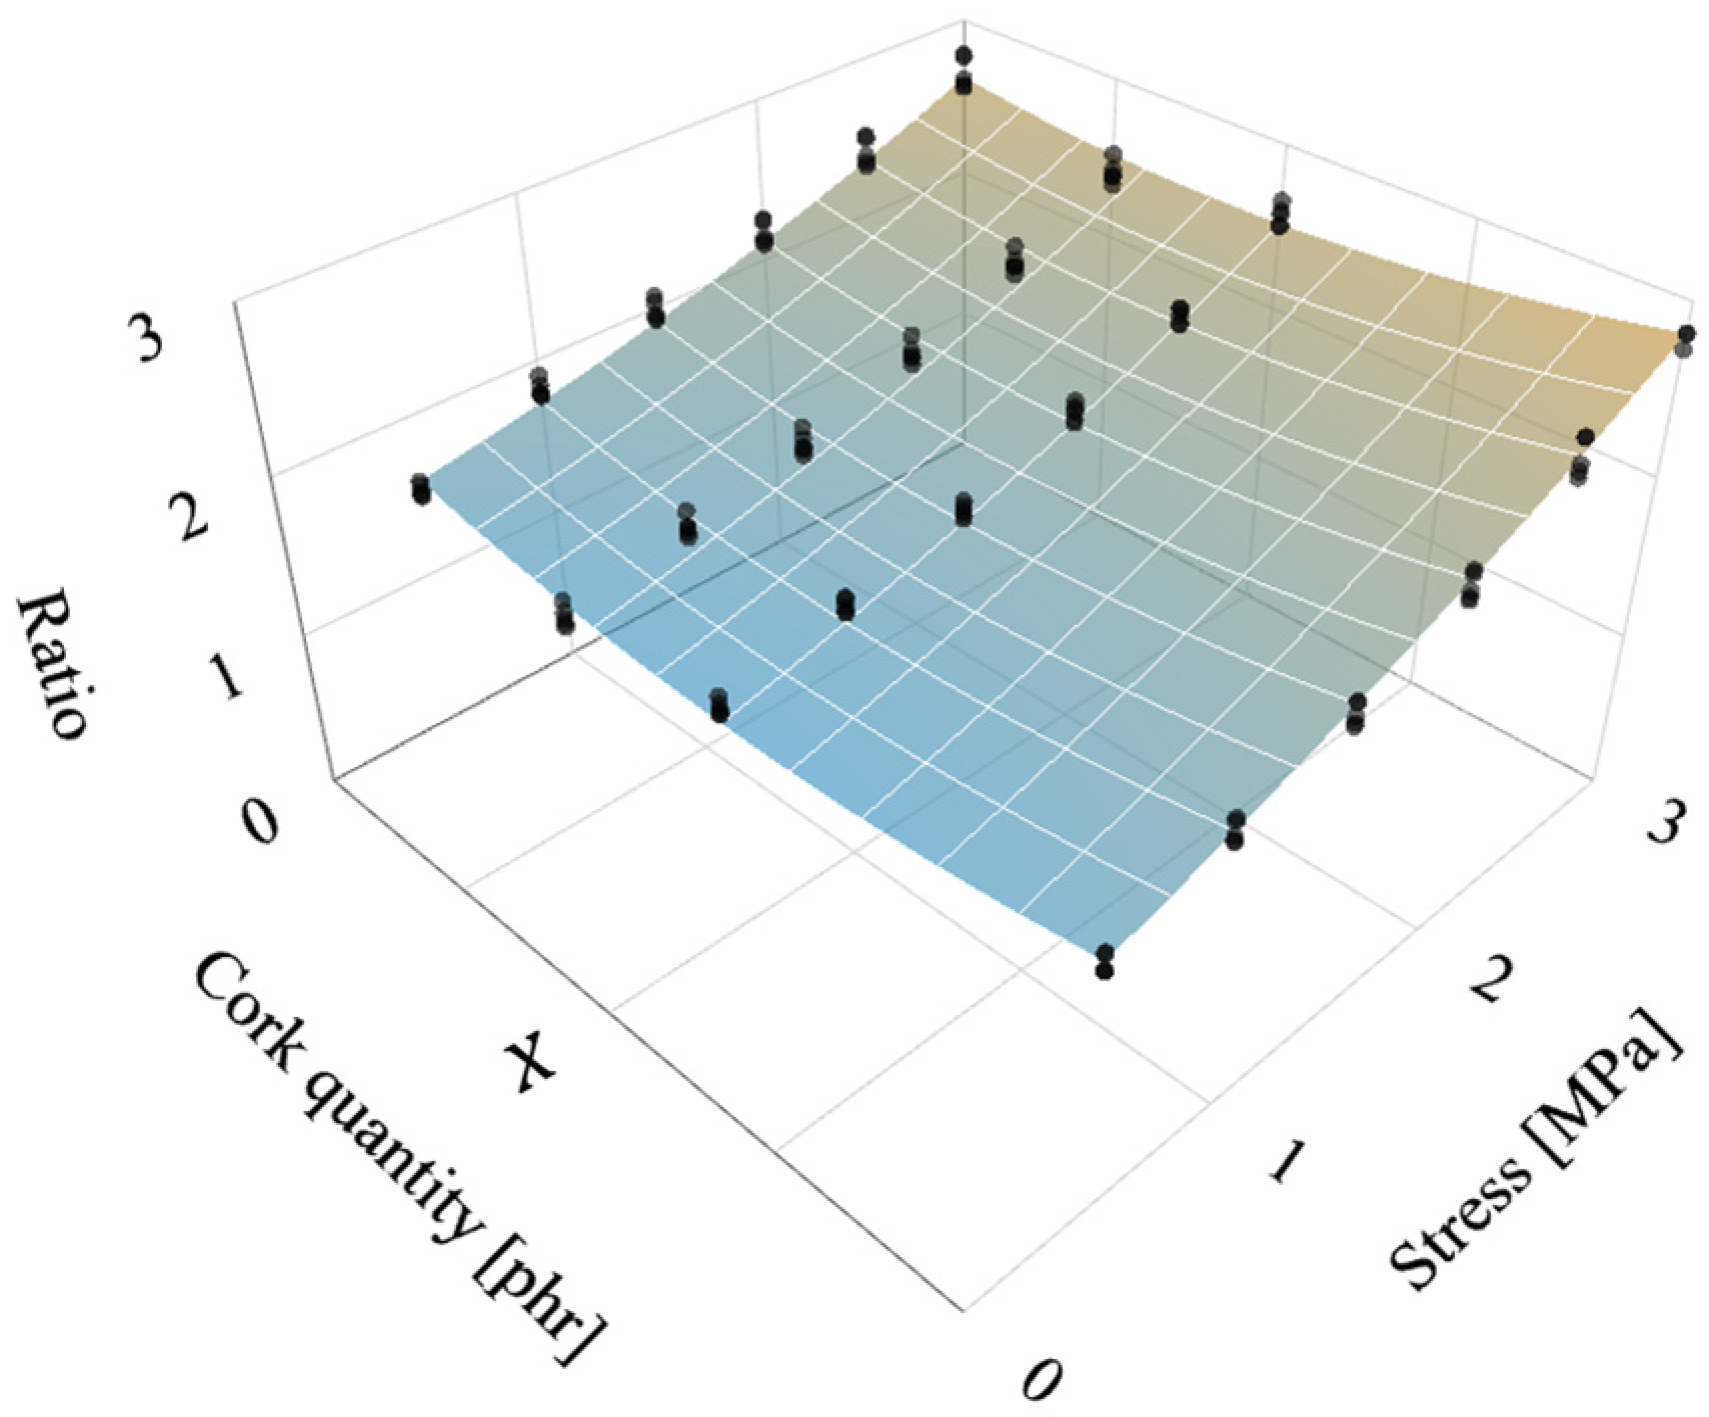
3.3. Application of Regression Models

Based on the experimental data obtained during the development of this study, linear regression was applied in order to determine if reliable predictive models could be developed for further development. A representation of all the experimental data related to the static compression behavior used for the development of the regression model is presented in Figure 9. Using the ordinary least squares method, a simple linear regression model was calculated to predict the apparent compression modulus when a cork–rubber sample is subject to a compressive load at low strains (units in MPa), according to the type one cork granules quantity incorporated in the formulation (units in phr). A significant regression model was found (F(1, 18) = 14.43, p-value = 0.001) with a value of R2 equal to 44.50%. A summary of the regression analysis including the coefficients of the regression model and respective confidence intervals are presented in Table 6. The model obtained is not appropriate to conduct predictions about the value of apparent compression modulus, since the cork quantity only explains 44.50% of the variation of the apparent compression modulus.
Regarding the relation between static and dynamic compression behavior, all the experimental data obtained from this study are represented by points in Figure 10. Several regression models were calculated to predict the ratio between dynamic and apparent compression modulus based on the stress imposed ( σ in MPa) and the quantity of type one cork granules ( c in phr) on the cork–rubber composite. Some of the models developed considered the introduction of interaction and/or polynomial terms. The model with higher R2 and R2adj values was selected with quadratic and interaction terms included. After conducting a multiple linear regression using the ordinary least squares method, the assumption of residuals normally distributed was found not to be accomplished. As an alternative, a robust regression using Huber M-estimator was applied instead, using the same model terms. The coefficients obtained for each regression model (OLS and robust) are shown in Table 7. The robust regression model is presented in Figure 10. The value of the coefficient of determination, R2, obtained for the robust regression model was 94.71%, which makes it a useful model to predict the expected dynamic behavior of cork–rubber composites according to its cork quantity and compression conditions (apparent compression modulus and stress imposed).

4. Conclusions

Based on statistical methods, the effect of some variables related to the manufacturing of cork–rubber composites used for vibration isolation was analyzed. The two main focuses of this study were the introduction of cork granules as an additional filler on a natural rubber matrix and the influence of vulcanization process parameters on its properties.
The results showed that the addition of cork granules increased the mechanical properties of the rubber compounds, such as hardness and static stiffness. The addition of cork to a rubber compound has demonstrated a different dynamic behavior from other rubber compounds with various fillers. Generally, for the latter materials, an increase in dynamic stiffness is observed due to the increase in the filler quantity. For cork–rubber composites, the results obtained demonstrate that the addition of cork was able to reduce or maintain the same values of the ratio between dynamic and static stiffness observed in a compound without cork granules when subjected to low compressive loads.
The effect of cork quantity and granules size on composite properties such as hardness, stiffness, tensile and tear strength, elongation at break and rebound revealed to be analogous to what was reported in other studies involving the introduction of a natural-based filler on an elastomer matrix.
The variation of the vulcanization temperature of some compounds revealed to have a significant effect on the properties of the final product, while the pressure level proved to be a significant variable in the manufacturing of composites with higher contents of cork granules. The tendency regarding vulcanization temperature is similar to other rubber compounds: the application of higher temperatures corresponds to a decrease in properties such as hardness and stress at 10% strain. A linear trend regarding natural frequency was not so clear. Regarding the pressure level, more studies must be conducted to understand its influence on the mechanical properties of cork–rubber compounds, also considering the effect of variables related to cork granules.
The regression models were determined to be able to provide predictions about the behavior of cork–rubber composites under static and dynamic compressive loading, according to the quantity of the higher granulometry cork particles incorporated in the compound. For static behavior, the obtained coefficient of determination (R2) was below 45%, indicating a low prediction capacity. More data must be collected, and the existence of more influential variables should be examined in order to achieve a good prediction model for cork–rubber compounds. However, the developed model to predict the ratio between dynamic and apparent compression modulus according to the stress imposed and cork quantity, resulted in a useful tool for a product’s improvement with an R2 value above 90%.

Author Contributions

Conceptualization, H.L., S.P.S. and J.M.; methodology, H.L., S.P.S. and J.M; validation, S.P.S., J.M. and J.P.C.; investigation, H.L.; data curation, H.L.; writing—original draft preparation, H.L.; writing—review and editing, S.P.S., J.M. and J.P.C.; supervision, S.P.S. and J.M.; project administration, S.P.S. and J.M.; funding acquisition, S.P.S. and J.M. All authors have read and agreed to the published version of the manuscript.

Funding

Helena Lopes is supported by scholarship SFRH/BD/136700/2018 financed by Fundação para a Ciência e Tecnologia (FCT-MCTES) and co-funded by European Social Fund through Norte2020 (Programa Operacional Regional Norte). This work has been supported by the FCT within the RD Units Project Scope: UIDP/04077/2020 and UIDB/04077/2020.

Conflicts of Interest

The authors declare no conflict of interest.

References

  1. Saheb, D.N.; Jog, J.P. Natural fiber polymer composites: A review. Adv. Polym. Technol. 1999, 18, 351–363. [Google Scholar] [CrossRef]
  2. Thakur, V.K.; Thakur, M.K.; Gupta, R. Review: Raw Natural Fiber–Based Polymer Composites. Int. J. Polym. Anal. Charact. 2014, 19, 256–271. [Google Scholar] [CrossRef]
  3. Ku, H.; Wang, H.; Pattarachaiyakoop, N.; Trada, M. A review on the tensile properties of natural fiber reinforced polymer composites. Compos. Part B: Eng. 2011, 42, 856–873. [Google Scholar] [CrossRef] [Green Version]
  4. Gil, L. Cortiça. In Ciência e Engenharia de Materiais de Construção; Gonçalves, M.C., Margarido, F., Eds.; INETI: Lisboa, Portugal, 2012; pp. 663–715. ISBN 978-989-8481-17-7. [Google Scholar]
  5. Mestre, A.; Vogtlander, J. Eco-efficient value creation of cork products: An LCA-based method for design intervention. J. Clean. Prod. 2013, 57, 101–114. [Google Scholar] [CrossRef]
  6. Gürgen, S.; Sofuoğlu, M.A. Smart polymer integrated cork composites for enhanced vibration damping properties. Compos. Struct. 2020, 258, 113200. [Google Scholar] [CrossRef]
  7. da Silva, V.M.C.; Sabino, M.A.; Fernandes, E.; Correlo, V.M.; Boesel, L.F.; Reis, R.L. Cork: Properties, capabilities and applications. Int. Mater. Rev. 2005, 50, 345–365. [Google Scholar] [CrossRef] [Green Version]
  8. Fernandes, E.M.; Pires, R.A.; Reis, R.L. Cork biomass biocomposites. In Lignocellulosic Fibre and Biomass-Based Composite Materials; Jawaid, M., Tahir, P.M., Saba, N., Eds.; Elsevier: Cambridge, UK, 2017; pp. 365–385. ISBN 978-0-08-10095p. [Google Scholar]
  9. Parra, C.; Sánchez, E.M.; Miñano, I.; Benito, F.; Hidalgo, P. Recycled Plastic and Cork Waste for Structural Lightweight Concrete Production. Sustainability 2019, 11, 1876. [Google Scholar] [CrossRef] [Green Version]
  10. Fernandes, F.; Jardin, R.; Pereira, A.; de Sousa, R.A. Comparing the mechanical performance of synthetic and natural cellular materials. Mater. Des. 2015, 82, 335–341. [Google Scholar] [CrossRef]
  11. Gil, L. Cork Composites: A Review. Materials 2009, 2, 776–789. [Google Scholar] [CrossRef] [Green Version]
  12. Knapic, S.; Oliveira, V.; Machado, J.S.; Pereira, H. Cork as a building material: A review. Holz Als Roh- Und Werkst. 2016, 74, 775–791. [Google Scholar] [CrossRef]
  13. Jones, D.I.G. Handbook of Viscoelastic Vibration Damping; John Wiley & Sons: Chichester, West Sussex, UK, 2001; ISBN 978-0-471-49248-1. [Google Scholar]
  14. Ismail, H.; Rozman, H.; Jaffri, R.; Ishak, Z. Oil palm wood flour reinforced epoxidized natural rubber composites: The effect of filler content and size. Eur. Polym. J. 1997, 33, 1627–1632. [Google Scholar] [CrossRef]
  15. Ismail, H.; Jaffri, R. Physico-mechanical properties of oil palm wood flour filled natural rubber composites. Polym. Test. 1999, 18, 381–388. [Google Scholar] [CrossRef]
  16. Ismail, H.; Edyham, M.; Wirjosentono, B. Bamboo fibre filled natural rubber composites: The effects of filler loading and bonding agent. Polym. Test. 2002, 21, 139–144. [Google Scholar] [CrossRef]
  17. Jacob, M.; Thomas, S.; Varughese, K.T. Mechanical properties of sisal/oil palm hybrid fiber reinforced natural rubber composites. Compos. Sci. Technol. 2004, 64, 955–965. [Google Scholar] [CrossRef]
  18. Martins, M.A.; Mattoso, L.H.C. Short sisal fiber-reinforced tire rubber composites: Dynamic and mechanical properties. J. Appl. Polym. Sci. 2003, 91, 670–677. [Google Scholar] [CrossRef]
  19. Geethamma, V.; Kalaprasad, G.; Groeninckx, G.; Thomas, S. Dynamic mechanical behavior of short coir fiber reinforced natural rubber composites. Compos. Part A: Appl. Sci. Manuf. 2005, 36, 1499–1506. [Google Scholar] [CrossRef]
  20. Shao, D.; Xu, M.; Cai, L.; Shi, S.Q. Fabrication of Wood-Rubber Composites Using Rubber Compound as a Bonding Agent Instead of Adhesives. Materials 2016, 9, 469. [Google Scholar] [CrossRef] [PubMed] [Green Version]
  21. Mohamed, W.Z.W.; Baharum, A.; Ahmad, I.; Abdullah, I.; Zakaria, N.E. Effects of Fiber Size and Fiber Content on Mechanical and Physical Properties of Mengkuang Reinforced Thermoplastic Natural Rubber Composites. BioResources 2018, 13, 2945–2959. [Google Scholar] [CrossRef]
  22. Masłowski, M.; Miedzianowska, J.; Strzelec, K. Natural Rubber Composites Filled with Crop Residues as an Alternative to Vulcanizates with Common Fillers. Polymers 2019, 11, 972. [Google Scholar] [CrossRef] [PubMed] [Green Version]
  23. Masłowski, M.; Miedzianowska, J.; Strzelec, K. The potential application of cereal straw as a bio-filler for elastomer composites. Polym. Bull. 2019, 77, 2021–2038. [Google Scholar] [CrossRef] [Green Version]
  24. Deuri, A.S.; Bhownick, A.K.; John, B.; Ram, T.S. Effect of moulding pressure, cooling rate and curing temperature on the properties of rocket insulator compound. J. Mater. Sci. Lett. 1987, 6, 1117–1122. [Google Scholar] [CrossRef]
  25. Shao, D.; Xu, M.; Cai, L.; Shi, S.Q. Fabrication of Wood Fiber-rubber Composites with Reclaimed Rubber. BioResources 2018, 13, 3300–3314. [Google Scholar] [CrossRef] [Green Version]
  26. Sergi, C.; Tirillò, J.; Sarasini, F.; Pozuelo, E.B.; Saez, S.S.; Burgstaller, C. The Potential of Agglomerated Cork for Sandwich Structures: A Systematic Investigation of Physical, Thermal, and Mechanical Properties. Polymers 2019, 11, 2118. [Google Scholar] [CrossRef] [PubMed] [Green Version]
  27. Buil, R.M.; Angulo, D.R.; Ivens, J. Analysis of the capability of cork and cork agglomerates to absorb multiple compressive quasi-static loading cycles. Holz Als Roh- Und Werkst. 2021, 1–14. [Google Scholar] [CrossRef]
  28. Buil, R.M.; Angulo, D.R.; Ivens, J.; Blasco, J.O.A. Experimental study of natural cork and cork agglomerates as a substitute for expanded polystyrene foams under compressive loads. Wood Sci. Technol. 2021, 55, 419–443. [Google Scholar] [CrossRef]
  29. Kumar, S.S.; Milwich, M.; Deopura, B.; Plank, H. Finite element analysis of Carbon composite sandwich material with agglomerated Cork core. Procedia Eng. 2011, 10, 478–483. [Google Scholar] [CrossRef] [Green Version]
  30. Gürgen, S.; Fernandes, F.A.O.; de Sousa, R.J.A.; Kuşhan, M.C. Development of Eco-friendly Shock-absorbing Cork Composites Enhanced by a Non-Newtonian Fluid. Appl. Compos. Mater. 2021, 28, 165–179. [Google Scholar] [CrossRef]
  31. Brites, F.; Malça, C.; Gaspar, F.; Horta, J.; Franco, M.; Biscaia, S.; Mateus, A. Cork Plastic Composite Optimization for 3D Printing Applications. Procedia Manuf. 2017, 12, 156–165. [Google Scholar] [CrossRef]
  32. Gama, N.; Ferreira, A.; Timmons, A.B. 3D printed cork/polyurethane composite foams. Mater. Des. 2019, 179, 107905. [Google Scholar] [CrossRef]
  33. Daver, F.; Lee, K.P.M.; Brandt, M.; Shanks, R. Cork–PLA composite filaments for fused deposition modelling. Compos. Sci. Technol. 2018, 168, 230–237. [Google Scholar] [CrossRef]
  34. da Silva, S.M.; Antunes, T.; Costa, M.E.; Oliveira, J.M. Cork-like filaments for Additive Manufacturing. Addit. Manuf. 2020, 34, 101229. [Google Scholar] [CrossRef]
  35. Policarpo, H.; Neves, M.M.; Diogo, A.C.; Maia, N.M.M. A note on the estimation of cork composite elasto-dynamic properties and their frequency dependence. In Proceedings of the ICEDyn 2013—International Conference on Structural Engineering Dynamics, Sesimbra, Portugal, 17–19 June 2013. [Google Scholar]
  36. Gul, J.; Saleemi, A.R.; Mirza, S.; Feroze, N.; Mansha, M. Thermal and mechanical characteristics of cork filled insulation for aerospace applications. Plast. Rubber Compos. 2010, 39, 28–32. [Google Scholar] [CrossRef]
  37. Gul, J.; Mirza, S. Effect of Cork Loading on Mechanical and Thermal Properties of Silica-Ethylene-Propylene-Diene Monomer Composite. Key Eng. Mater. 2012, 510-511, 277–283. [Google Scholar] [CrossRef]
  38. DIN 53504 Testing of rubber—Determination of Tensile Strength at Break, Tensile Stress at Yield, Elongation at Break and Stress Values in A Tensile Test; Deutsches Institut fur Normung E.V. (DIN): Berlin, Germany, 2017.
  39. ASTM D624-00 Standard Test Method for Tear Strength of Conventional Vulcanized Rubber and Thermoplastic Elastomers; ASTM International: West Conshohocken, PA, USA, 2020.
  40. ASTM D1054-02 Standard Test Method for Rubber Property—Resilience Using a Goodyear-Healey Rebound Pendulum (Withdrawn 2010); ASTM International: West Conshohocken, PA, USA, 2007.
  41. ASTM D2240-00 Standard Test Method for Rubber Property—Durometer Hardness; ASTM International: West Conshohocken, PA, USA, 2002.
  42. ISO 1856 Flexible Cellular Polymeric Materials—Determination of Compression Set; ISO: Geneva, Switzerland, 2018.
  43. DIN 53513 Determination of The Viscoelastic Properties of elastomers on Exposure to Forced Vibration at Non-Resonant Frequencies; Deutsches Institut fur Normung E.V. (DIN): Berlin, Germany, 1990.
  44. Wilcox, R.R. Introduction to Robust Estimation and Hypothesis Testing, 3rd ed.; Elsevier: Burlington, MA, USA, 2012; ISBN 9780123869838. [Google Scholar]
  45. Field, A.; Miles, J.; Field, Z. Discovering Statistics Using R; SAGE Publications: London, UK, 2012; ISBN 9781446200452. [Google Scholar]
  46. Montgomery, D.C.; Peck, E.A.; Vining, G.G. Introduction to Linear Regression Analysis, 5th ed.; John Wiley & Sons, Inc: Hoboken, NJ, USA, 2012; ISBN 978-0-470-54281-1. [Google Scholar]
  47. Fox, J.; Weisberg, S. Robust Regression in R. In An R Companion to Applied Regression; SAGE Publications: Thousand Oaks, CA, USA, 2018; ISBN 9781544336473. [Google Scholar]
  48. Gent, A.N. Engineering with Rubber; Gent, A.N., Ed.; Carl Hanser Verlag: München, Germany, 2012; ISBN 978-3-446-42764-8. [Google Scholar]
  49. Zhou, Y.; Fan, M.; Chen, L.; Zhuang, J. Lignocellulosic fibre mediated rubber composites: An overview. Compos. Part B: Eng. 2015, 76, 180–191. [Google Scholar] [CrossRef]
  50. Salim, Z.A.S.A.; Hassan, A.; Ismail, H. A Review on Hybrid Fillers in Rubber Composites. Polym. Technol. Eng. 2017, 57, 523–539. [Google Scholar] [CrossRef]
  51. Zanchet, A.; Dotta, A.L.B.; De Sousa, F.D.B. Relationship among Vulcanization, Mechanical Properties and Morphology of Blends Containing Recycled EPDM. Recycling 2017, 2, 16. [Google Scholar] [CrossRef] [Green Version]
  52. Akbay, I.K.; Güngör, A.; Özdemir, T. Optimization of the vulcanization parameters for ethylene–propylene–diene termonomer (EPDM)/ground waste tyre composite using response surface methodology. Polym. Bull. 2017, 74, 5095–5109. [Google Scholar] [CrossRef]
  53. Kurian, T.; George, K.E.; Francis, D.J. Effect of vulcanization temperature on the cure characteristics and vulcanizate properties of natural rubber and styrene-butadiene rubber. Die Angew. Makromol. Chem. 1988, 162, 123–134. [Google Scholar] [CrossRef]
  54. Zhang, H.; Li, Y.; Shou, J.-Q.; Zhang, Z.-Y.; Zhao, G.-Z.; Liu, Y.-Q. Effect of curing temperature on properties of semi-efficient vulcanized natural rubber. J. Elastomers Plast. 2015, 48, 331–339. [Google Scholar] [CrossRef]
  55. Ma, S.; Zhu, S.; Liu, M.; Zhong, B.; Chen, Y.; Luo, Y.; Liu, F.; Jia, Z.; Jia, D. A high-performance, thermal and electrical conductive elastomer composite based on Ti3C2 MXene. Compos. Part A: Appl. Sci. Manuf. 2021, 145, 106292. [Google Scholar] [CrossRef]
Figure 1. Effect of the addition of cork granules on the ratio between dynamic and static stiffness across different compression stress levels.
Sustainability 13 11240 g001
Figure 2. Results of cork analysis: (a) Hardness Shore A; (b) Static compression stress at 10% strain.
Sustainability 13 11240 g002
Figure 3. Results of cork analysis: (a) Natural frequency at 1.5 MPa; (b) Ratio between dynamic and static stiffness at different loads.
Sustainability 13 11240 g003
Figure 4. Results of cork analysis: interaction plots of: (a) Hardness Shore A; (b) Stress obtained at 10% compression strain; (c) Natural frequency when loaded at 1.5 MPa.
Sustainability 13 11240 g004
Figure 5. Results from cork analysis: interaction plots of: (a) Compression set; (b) Tensile strength; (c) Elongation at break; (d) Tear strength; (e) Rebound.
Sustainability 13 11240 g005
Figure 6. Results of vulcanization temperature analysis: (a) Hardness Shore A; (b) Static compression stress at 10% strain.
Sustainability 13 11240 g006
Figure 7. Rheometer curves obtained for compounds A and B at different vulcanization temperatures.
Sustainability 13 11240 g007
Figure 8. Results of vulcanization temperature analysis: natural frequency at 1.5 MPa.
Sustainability 13 11240 g008
Figure 9. Experimental data and regression model: static behavior.
Sustainability 13 11240 g009
Figure 10. Experimental results and surface representing the regression model applied to predict the ratio between dynamic and apparent compression moduli.
Sustainability 13 11240 g010
Table 1. Characteristics of the cork–natural rubber compound samples produced.
CompoundABCDEF
Cork granulometryType 1Type 1Type 1Type 2Type 2
Cork quantity (phr 1)0xx/22xx/22x
1 phr—Parts per hundred rubber; x—standard cork granules quantity.
Table 2. Descriptive statistics of samples collected from compounds A and B.
Hardness Shore AStress at 10% Strain (MPa)Nat. freq. at 1.5MPa (Hz)
MedianMeanStd. dev.MedianMeanStd. dev.MedianMeanStd. dev.
Compound A5252.10.6521.3361.3220.05220.8620.890.096
Compound B5756.3
(+8.1%)
0.9751.5361.520
(+15%)
0.04120.4320.50
(−1.8%)
0.191
Table 3. Results of statistical analyses: significant factors for each property.
PropertiesSignificant Factors 1Test StatisticPercentage Contribution 3
HardnessAF(1,16) = 150.59, p-value < 0.00147.25%
BF(1,16) = 150.59, p-value < 0.00147.25%
Stress at 10% strainABF(1,16) = 17.32, p-value < 0.00111.50%
Natural frequency at 1.5 MPaABF(1,16) = 55.79, p-value < 0.0019.54%
Compression set 50% 2AQ = 12.95, p-value = 0.0178.92% 4
BQ = 117.56, p-value < 0.00181.00% 4
Tensile strengthAF(1,8) = 5.95, p-value = 0.0415.93%
BF(1,8) = 85.08, p-value < 0.00184.88%
Elongation at breakABF(1,8) = 7.78, p-value = 0.02415.61%
Tear strength 2BQ = 16.17, p-value = 0.00558.62% 4
ReboundABF(1,20) = 7.40, p-value = 0.0130.58%
1 A—Cork type; B—Cork quantity; AB—Interaction between cork type and quantity; 2 Robust ANOVA using a 20%-level trimmed mean; 3 Percentage contribution as the ratio between factor sum of squares to total sum of squares; 4 Results of percentage contribution obtained from parametric two-factor ANOVA results.
Table 4. Descriptive statistics of samples collected from compound D vulcanized at different pressure levels.
Hardness Shore AStress at 10% Strain (MPa)Nat. freq. at 1.5 MPa (Hz)
MedianMeanStd. dev.MedianMeanStd. dev.MedianMeanStd. dev.
Low
(5 MPa)
5757.30.4470.910.910.02421.021.00.203
High
(20 MPa)
56.556.30.2741.001.000.01220.620.60.209
Table 5. Results of statistical analysis of vulcanization temperature: compounds A and B.
PropertiesCompound ACompound B
HardnessH (3) = 17.72, p-value < 0.001 1F (3,16) = 87.98, p-value < 0.001
Stress (10% strain)F (3,7.4) = 246.72, p-value < 0.001 2F (3,16) = 395.50, p-value < 0.001
Natural frequencyF (3,16) = 367.37, p-value < 0.001F (3,16) = 86.31, p-value < 0.001
1 Kruskal–Wallis test; 2 Welch’s F test.
Table 6. Regression summary of apparent compression modulus model.
TermCoefficients95% CItp-Value
Intercept (β0)13.260[13.005; 13.515]109.430<0.001
Cork quantity (β1)0.040[0.018; 0.062]3.7990.001
Table 7. Regression summary of dynamic behavior models.
TermCoefficientsPercentage Contribution 1
OLSHuber M-Estimator
Intercept (β0)1.4971.489
σ 1)0.1790.18887.73%
c 2)−0.049−0.0480.55%
σ 2 3)0.0670.0650.97%
c 2 4)0.0020.0024.74%
σ c 5)0.0060.0050.73%
1 Percentage contribution of each parameter as the ratio between factor sum of squares to total sum of squares (parametric ANOVA results).
Publisher’s Note: MDPI stays neutral with regard to jurisdictional claims in published maps and institutional affiliations.

