Radiant Floors versus Radiant Walls Using Ceramic Thermal Panels in Mediterranean Dwellings: Annual Energy Demand and Cost-Effective Analysis


Abstract
:1. Introduction
1.1. Radiant Surface Conditioning Systems Based on Capillary Tube Mats
1.2. Description of TCP Ceramic Thermal Panels
1.3. Objectives
2. TCP Panels Used as Underfloor Heating in a Detached House
2.1. Constructive Solutions of the Project at Its First Stage
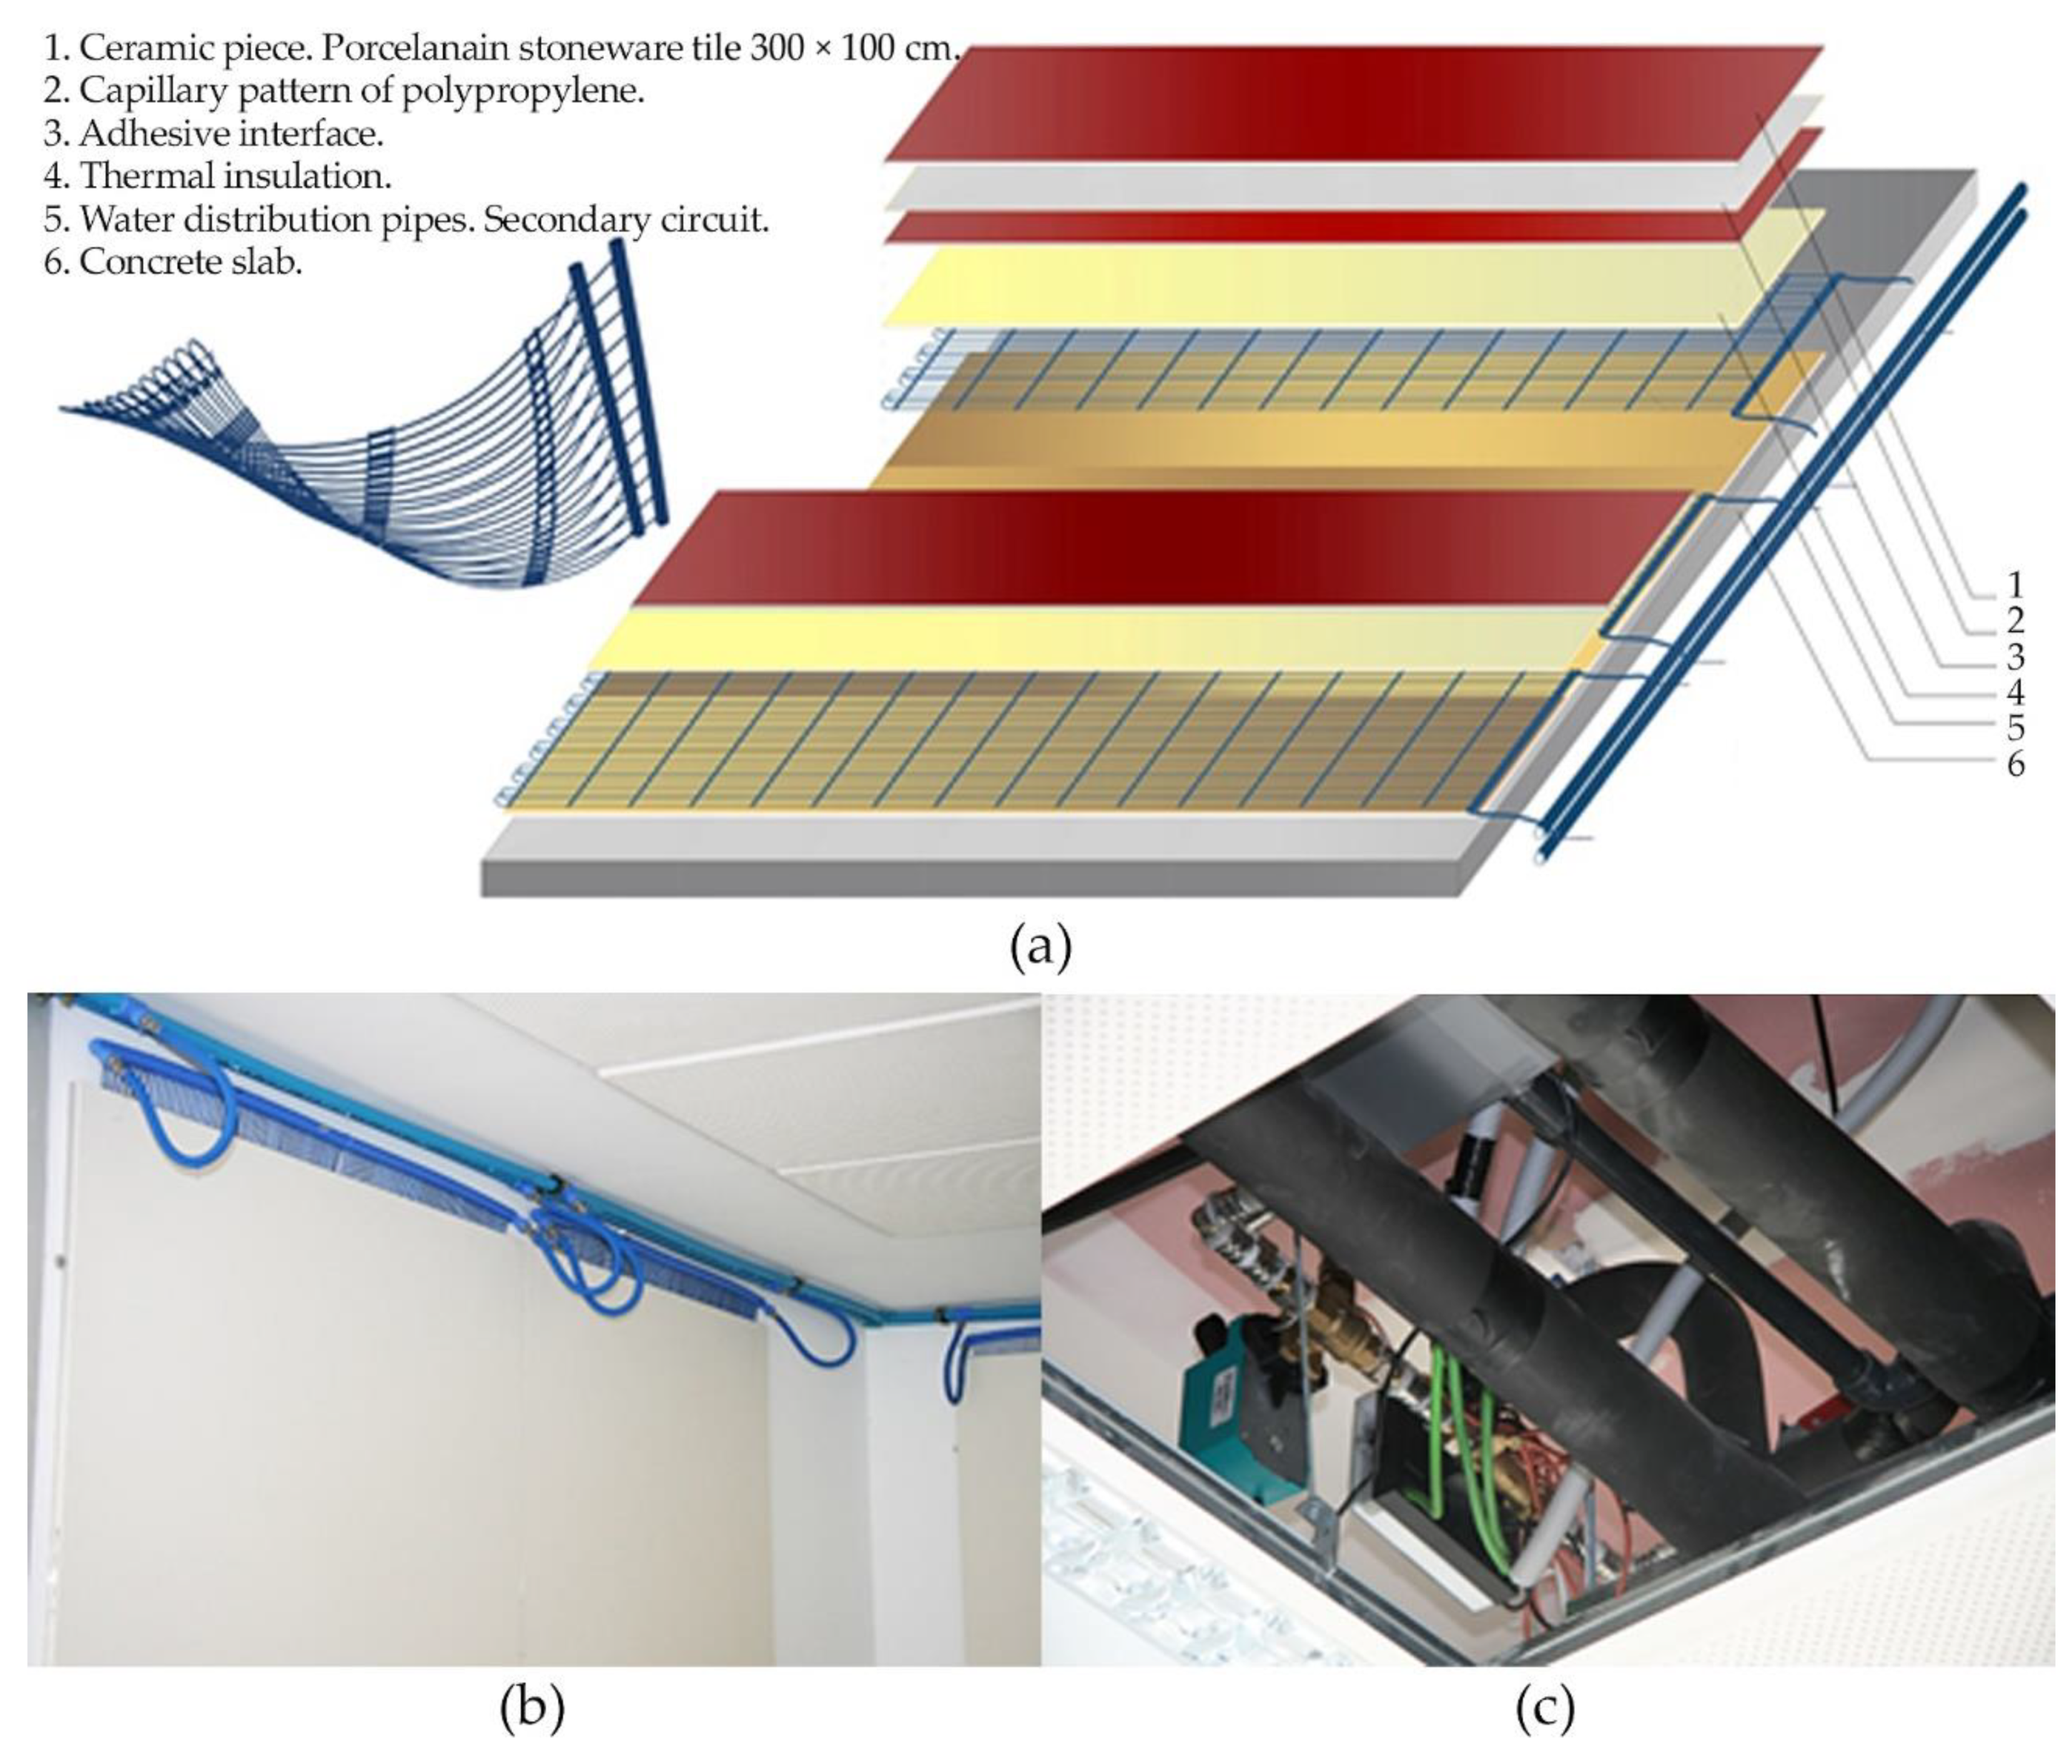
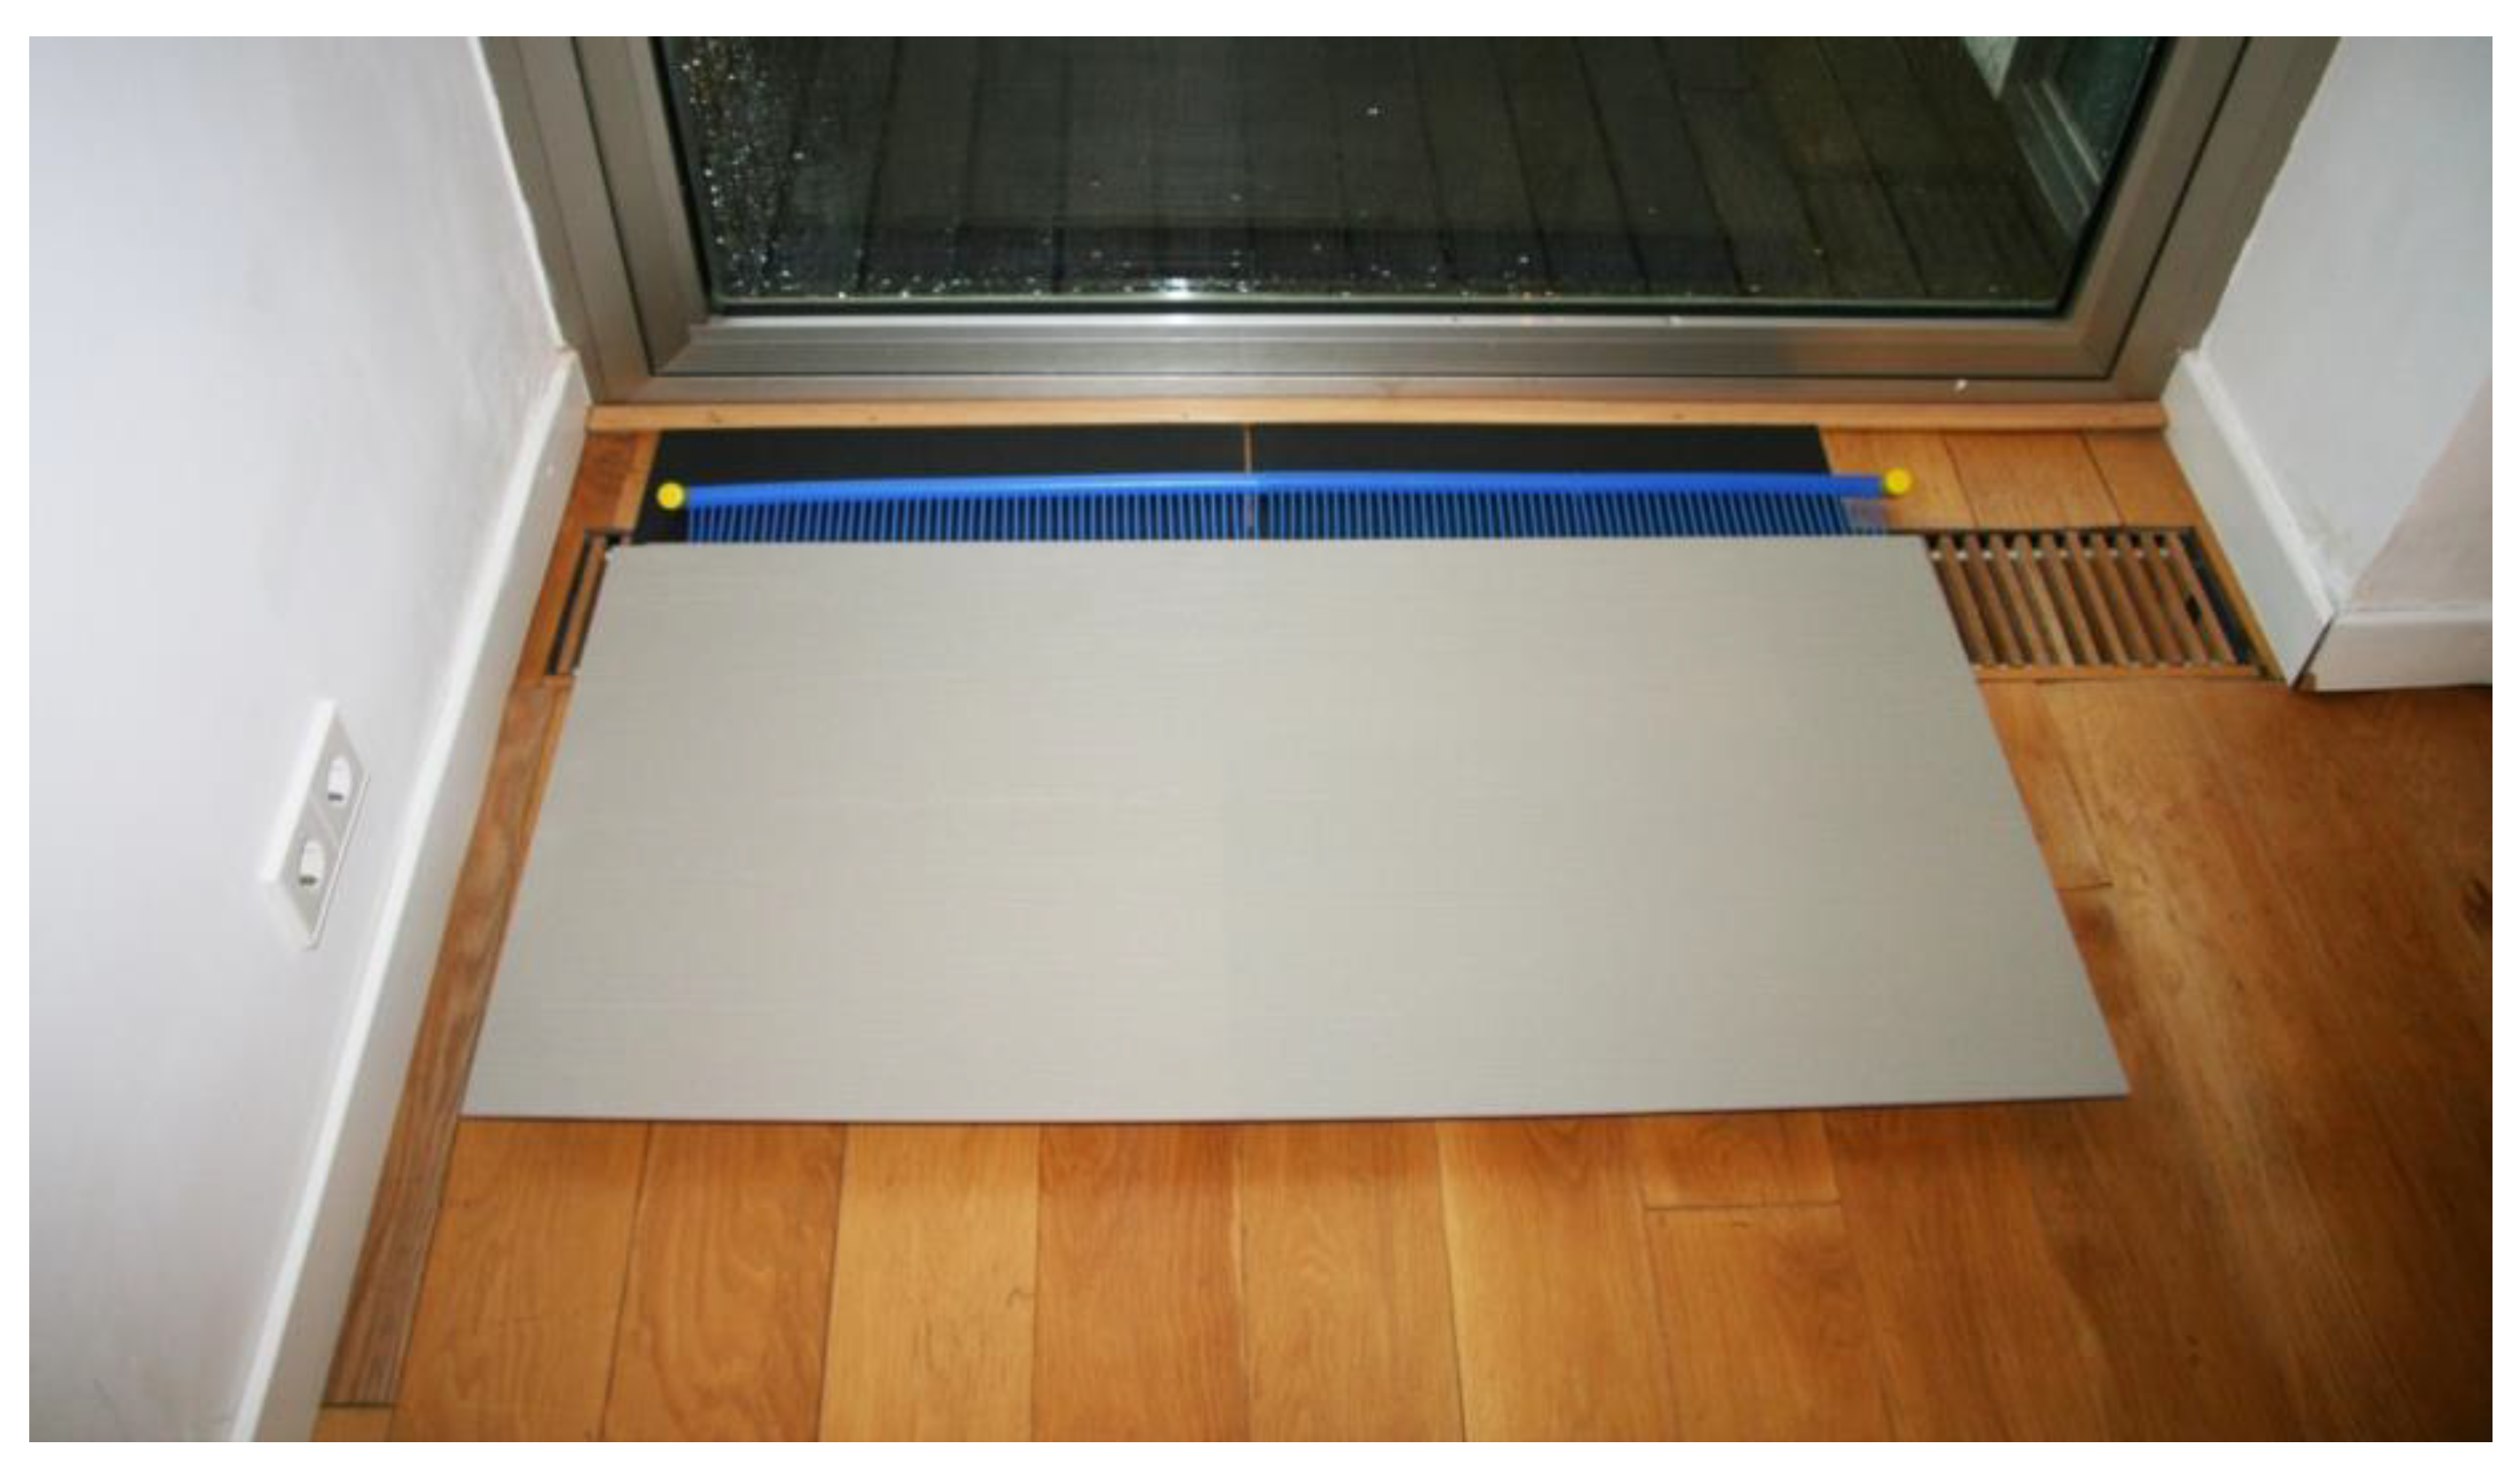
2.2. Installation of TCP Panels as a Conditioning System
- PPR distribution pipes. Diameter: 32 mm.
- Aluminium channels to pass the PPR distribution pipes through.
- Large-format porcelain stoneware piece. 300 × 100 × 2 cm.
- Adhesive layer. Beka Thermal Conductive Paste V. WLP. 1. Thickness: 6 mm.
- PPR capillary mat. Diameter: 3 mm. Separation: 10 mm.
- Polyurethane foam thermal insulator. Thickness: 10 mm.
- Regulatory layer. Self-levelling cement mortar. Average thickness: 10 mm.
- Thermal insulator. Type IV expanded polystyrene. Thickness: 40 mm.
- Waffle slab with reinforced concrete ribs. Thickness: 270 mm.
- “Cupolex” plastic pieces to increase and create a camera on the reinforced concrete slab foundation.
3. Methodology
- Scenario 1 (SC1). Current status. Bioclimatic basement supporting the conditioning of the house. All-air system. Heating-based support system through hot water radiators and a cold air system in summer with a compression system on the roof and an evaporator in the bathroom.
- Scenario 2 (SC2). Bioclimatic basement supporting the conditioning of the house. Application of TCP panels to walls. Dehumidification in summer through three fan coils, one on each floor.
- Scenario 3 (SC3). Bioclimatic basement supporting the conditioning of the house. Application of TCP panels to radiant floor. Dehumidification in summer through three fan coils, one on each floor.
- Scenario 4 (SC4). SC3 conditions but with thermal solar panels on the roof.
3.1. Calculating the Operating Temperatures To
3.2. Thermal Loads
3.2.1. U-Values: Thermal Transmittance of the Enclosures
- RT Total thermal resistance to the passage of heat.
- 1/hi Interior surface thermal resistance.
- 1/he External surface thermal resistance.
- e Thickness of each layer.
- λ Each layer material’s thermal conductivity.
3.2.2. Air Infiltration through the Envelope
- Qinf Annual energy loss (kWh/yr) due to air infiltration for heating Qinf-H and cooling Qinf-C.
- Cp Air’s specific heat capacity, which is 0.34 Wh/m3K.
- Gt Annual degrees-days (kWh/yr), both for heating and cooling.
- Vinf Air leakage rate (m3/h).
- Qs Energy impact value of the sensible heat of the air leak rate Vinf (W).
- Vinf Air leakage rate (m3/h).
- Ce Specific heat of the air under normal conditions 0.349 Wh/kgK.
- ρ Density of air (kg/m3).
- Te Outside air temperature in degrees Kelvin (K).
- Ti Air temperature inside the house (21 °C in winter and 24 °C in summer).
- Ql Energetic impact value of the latent heat of the air leak rate Vinf (W).
- Cv Heat of water vaporization (0.628 W/gvapour).
- We Specific humidity of the external air taken as the annual average value (gvapour/kg).
- Wi Specific humidity of the indoor air (gvapour/kg).
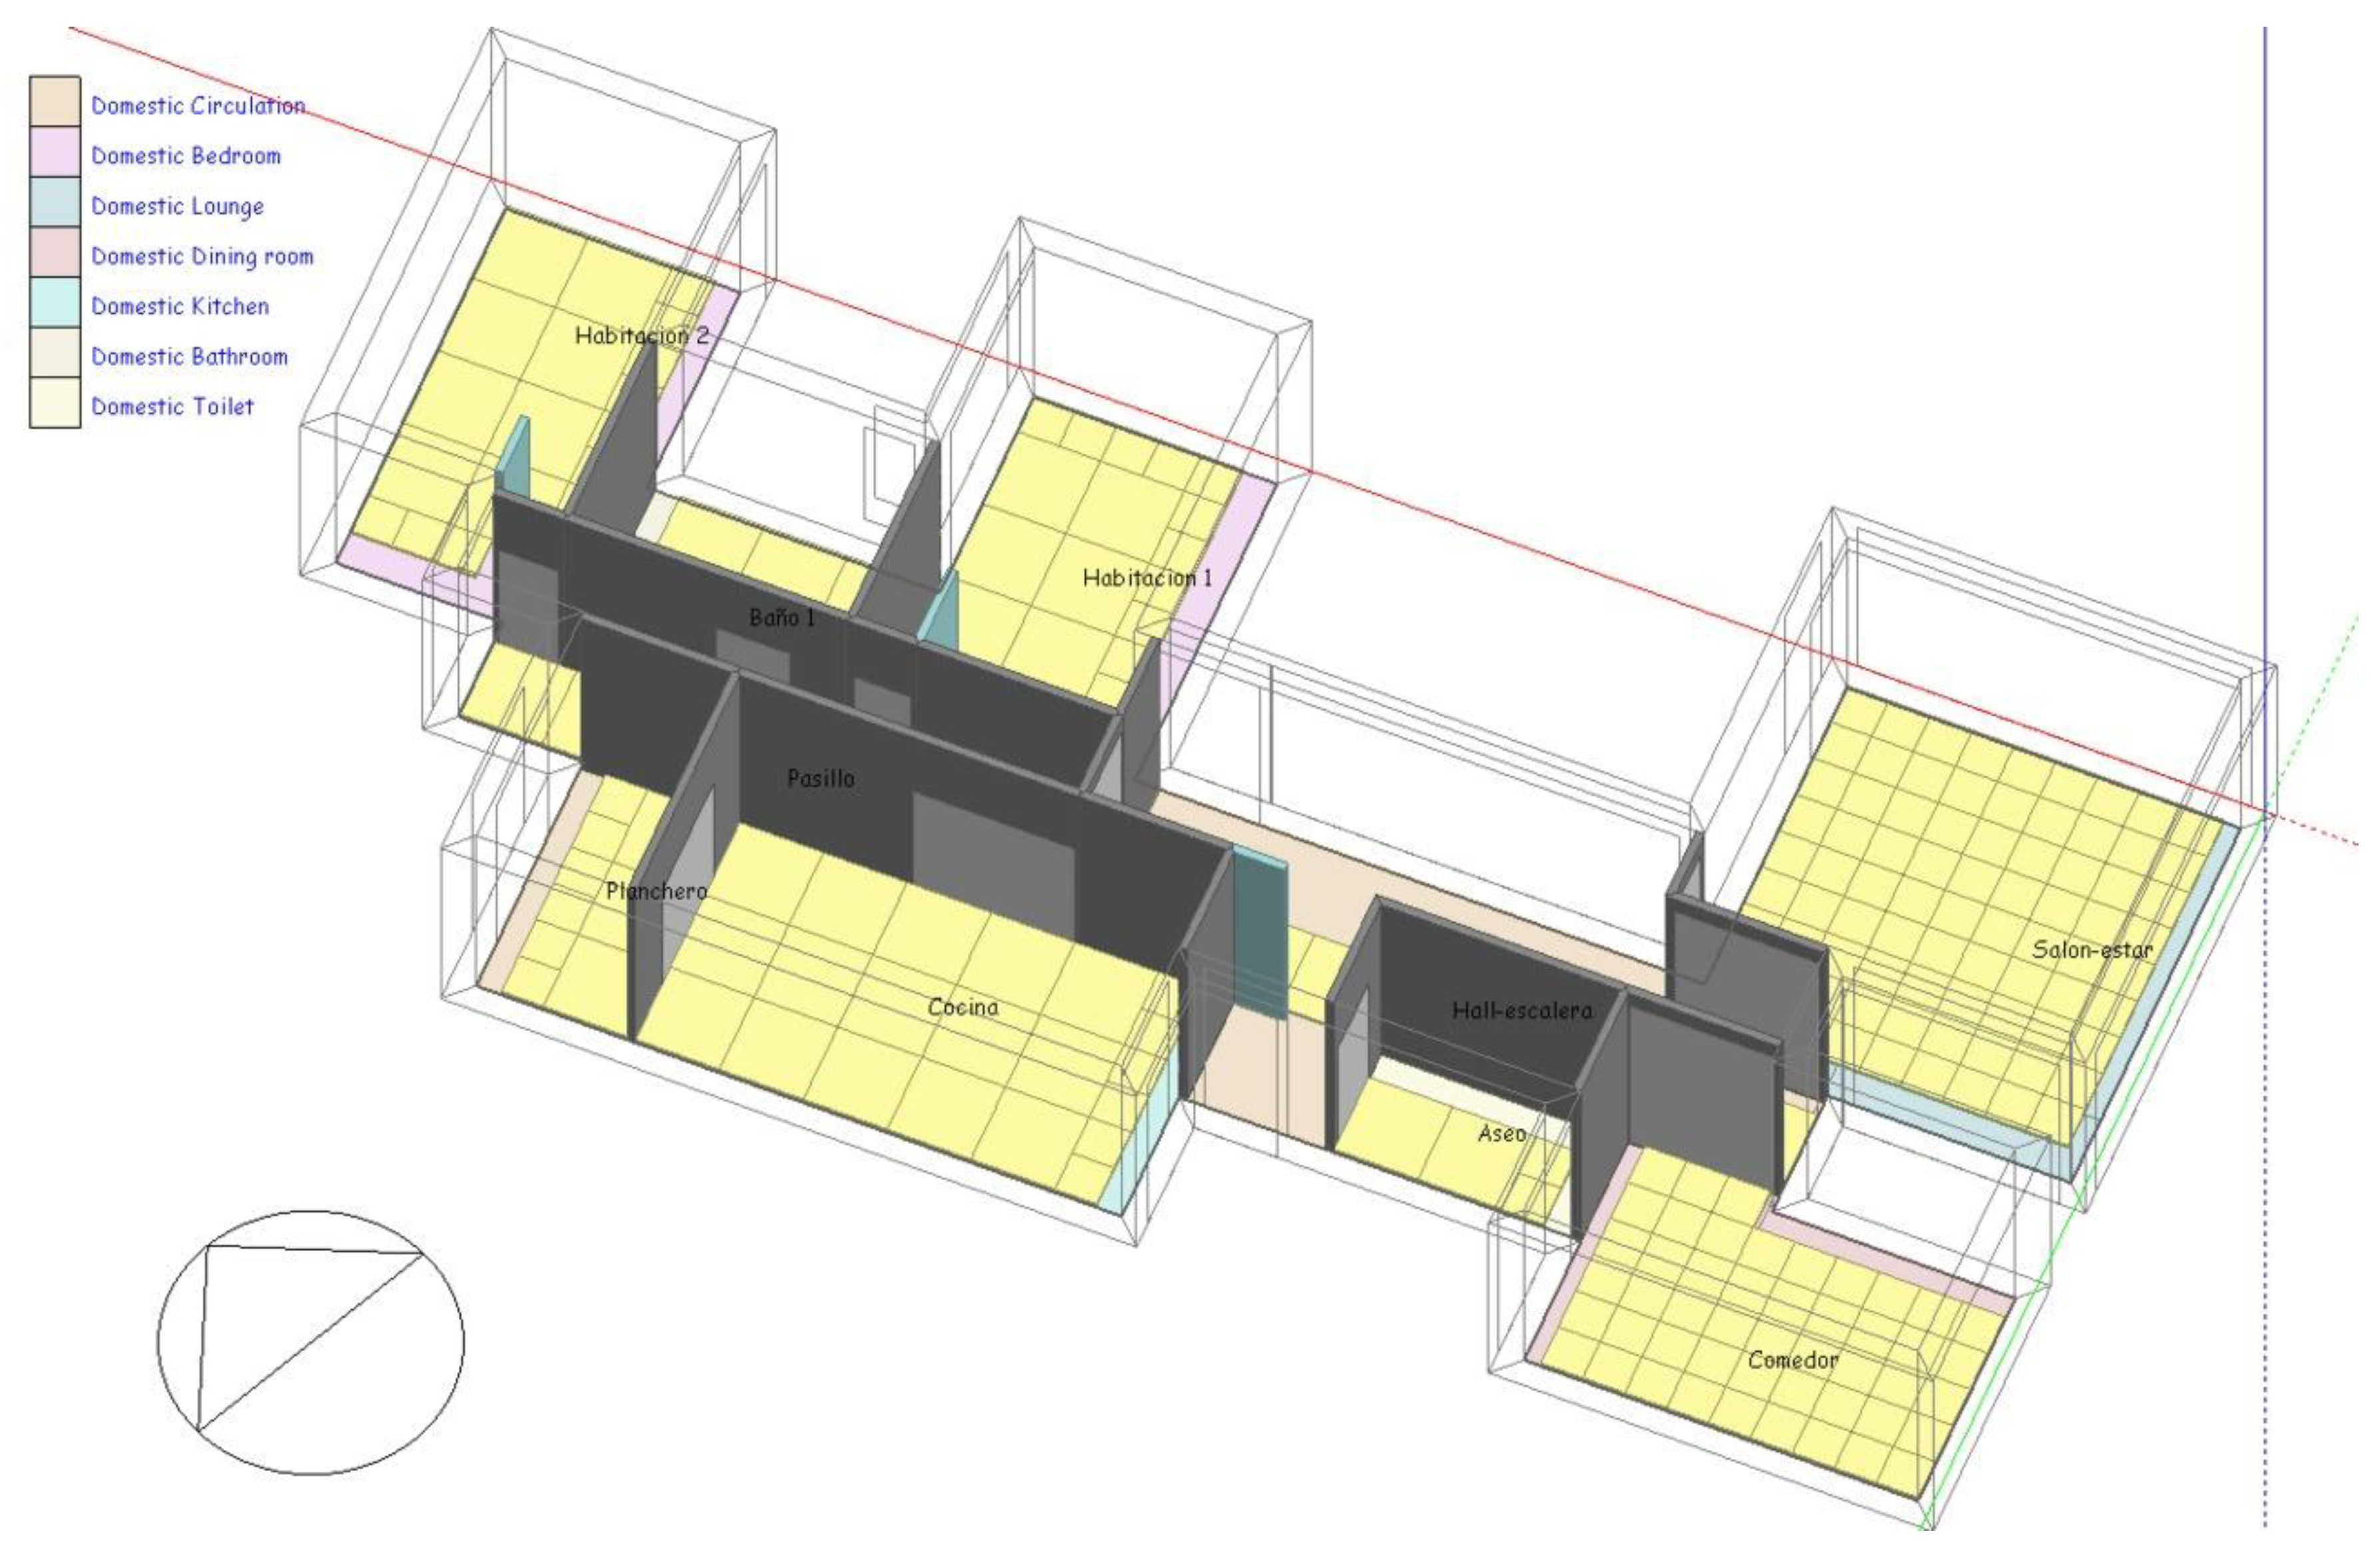
3.3. Simulations of Thermal Behaviour: Annual Energy Demand
- The winter period covers 1 December to 30 April, and the summer period 1 May to 30 November. These are the usual weather conditions in Alicante.
- Indoor air set temperatures were 21 °C in winter and 24 °C in summer. Relative humidity (RH) remained at 50%.
- Occupancy, according to the CTE’s regulatory calculation for air renewal, is six people. Since the interior volume is 302 m3, the requirement for forced air renewal is 0.32 air changes per hour (ACH), equivalent to 12 L per second per person.
- Air infiltration through the enclosure was measured using the Blower Door test. The result was 0.342 ACH, a low value for a detached house [57], far from the Passivhaus standard (<0.6 ACH).
3.4. Energy Contribution of Solar Thermal Panels
3.5. Investment Amortisation Approach
- Cg Global cost.
- Cl Initial investment costs including indirect cost too.
- Ca,i Annual costs including maintenance, energy and replacement costs.
- Rdisc Discount rate. Depends on the real interest rate (RR) and the cost period considered (number of years from the initial year). Calculated according to expression 3
- i years.
- ValF,t Residual value of components at the end of the calculation period, considering depreciation of their initial investment.
- RR Real interest rate. Depends on the market interest rate (R) and the inflation rate (Ri), both may depend on year i, but here they will be considered constant.
- Ri Inflation rate.
- Rint Interest rate.
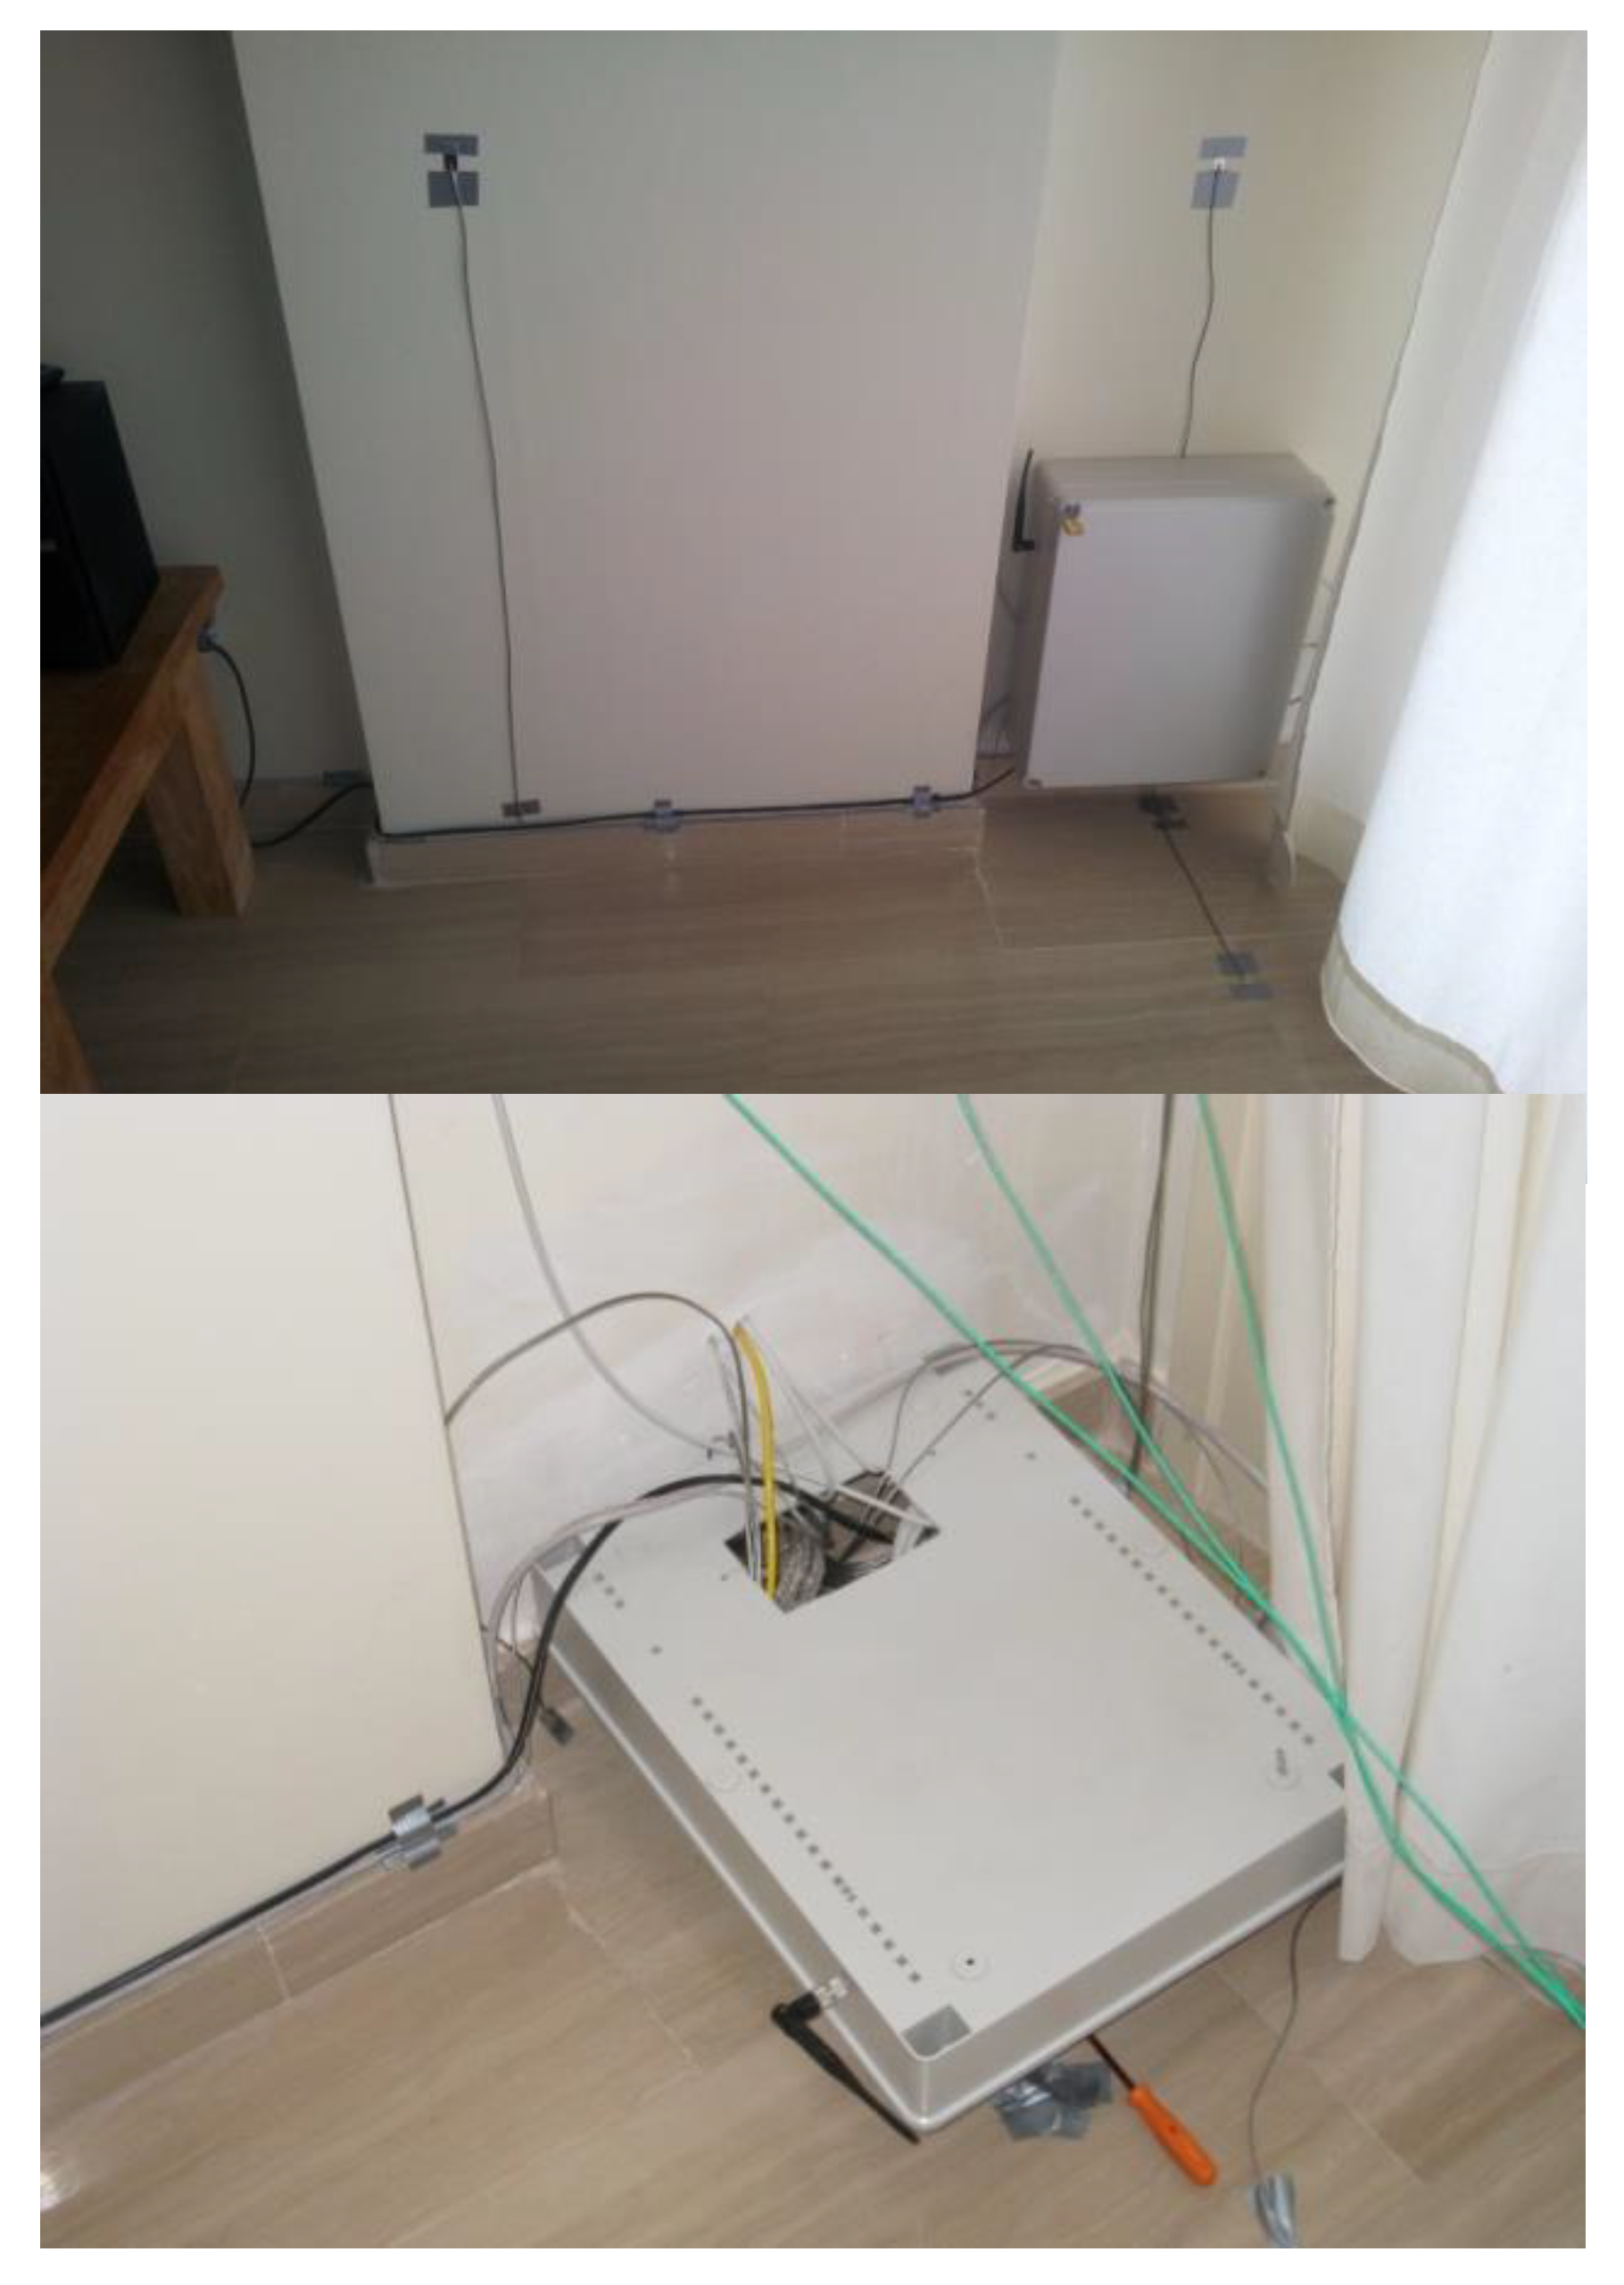
4. House Monitoring
5. Results
5.1. Calculation of Operating Temperatures To
5.2. The Value of Annual Energy Demand
5.3. Incorporation of Solar Thermal Panels
5.4. Breakdown of the Energy Consumption of the Various Installation Components
5.5. Investment Amortisation Approach
6. Conclusions
- TCP underfloor heating (SC3) systems were more energy efficient and more user-friendly than the current all-air system combined with winter hot water radiators (SC1). Annual energy demand was 25.19% lower.
- The radiant underfloor system with TCP panels (SC3), compared to the same panels positioned on the wall (SC2) is 5.15% more energy efficient. By reducing execution costs by EUR 3271 (almost 8%), the SC3 is more cost-effective. Investments would be amortised 3.4 years before the SC2.
- By installing 24 m2 of solar thermal panels on the roof, with water accumulator tanks, an energy saving of 57.46% would be made with respect to the all-air system (SC1) and an energy saving of 43.14% compared to the installation of underfloor TCP panels (SC3). Investments in installation costs could be amortised in just over 14 years, with a reduction of 4502.37 kg of CO2 emissions per year.
- The increase in investment for the installation of the capillary mat system using TCP panels could be amortised within a reasonable period of time compared to a conventional all-air installation (SC1). Regarding the house under study, the additional cost of EUR 10,955 would be amortised over 16 years, with an annual energy demand reduction of 4820 kWh/year and a consequent saving of EUR 684.4, with the current cost value in the electric mix of 0.142 EUR/kWh.
Author Contributions
Funding
Institutional Review Board Statement
Informed Consent Statement
Data Availability Statement
Acknowledgments
Conflicts of Interest
References
- Karmann, C.; Schiavon, S.; Bauman, F. Thermal comfort in buildings using radiant vs. all-air systems: A critical literature review. Build. Environ. 2017, 111, 123–131. [Google Scholar] [CrossRef] [Green Version]
- Cacabelos, C.; Eguía, P.; Míguez, J.L.; Granada, E.; Arce, M.E. Calibrated simulation of a public library HVAC system with aground-source heat pump and a radiant floor using TRNSYS and GenOpt. Energy Build. 2015, 108, 114–126. [Google Scholar] [CrossRef]
- Feng, J.; Schiavon, S.; Bauman, F. Cooling load differences between radiant and air systems. Energy Build. 2013, 65, 310–321. [Google Scholar] [CrossRef] [Green Version]
- Acikgoz, O.; Karakoyun, Y.; Yumurtaci, Z.; Dukhan, N.; Dalkılıç, A.S. Realistic experimental heat transfer characteristics of radiant floor heating using sidewalls as heat sinks. Energy Build. 2019, 183, 515–526. [Google Scholar] [CrossRef]
- Wang, D.; Lu, L.; Cui, P. A new analytical solution for horizontal geothermal heat exchangers with vertical spiral coils. Int. J. Heat Mass Transf. 2016, 100, 111–120. [Google Scholar] [CrossRef]
- Kim, M.J.; Lee, S.-R.; Yoon, S.; Jeon, J.-S. An applicable design method for horizontal spiral-coil-type ground heat exchangers. Geothermics 2018, 72, 338–347. [Google Scholar] [CrossRef]
- Echarri-Iribarren, V. Conditioning using ceramic floor panels with capillary tube mats and solar thermal panels on the Mediterranean coast: Energy savings and investment amortization. Energy Build. 2019, 202, 109334. [Google Scholar] [CrossRef]
- Zhang, C.; Pomianowski, M.; Heiselberg, P.K.; Yu, T. A review of integrated radiant heating/cooling with ventilation systems- Thermal comfort and indoor air quality. Energy Build. 2020, 223, 110094. [Google Scholar] [CrossRef]
- Obrecht, T.P.; Kunič, R.; Jordan, S.; Dovjak, M. Comparison of Health and Well-Being Aspects in Building Certification Schemes. Sustainability 2019, 11, 2616. [Google Scholar] [CrossRef] [Green Version]
- Rhee, K.-N.; Olesen, B.W.; Kim, K.W. Ten questions about radiant heating and cooling systems. Build. Environ. 2017, 112, 367–381. [Google Scholar] [CrossRef] [Green Version]
- Lin, B.; Wang, Z.; Sun, H.; Zhu, Y.; Ouyang, Q. Evaluation and comparison of thermal comfort of convective and radiant heating terminals in office buildings. Build. Environ. 2016, 106, 91–102. [Google Scholar] [CrossRef]
- Mustakallio, P.; Bolashikov, Z.D.; Rezgals, L.; Lipczynska, A.; Melikov, A.K.; Kosonen, R. Thermal environment in a simulated double office room with convective and radiant cooling systems. Build. Environ. 2017, 123, 88–100. [Google Scholar] [CrossRef]
- Krzaczek, M.; Florczuk, J.; Tejchman, J. Improved energy management technique in pipe-embedded wall heating/cooling system in residential buildings. Appl. Energy 2019, 254, 113711. [Google Scholar] [CrossRef]
- Catalina, T.; Virgone, J.; Kuznik, F. Evaluation of thermal comfort using combined CFD and experimentation study in a test room equipped with a cooling ceiling. Build. Environ. 2009, 44, 1740–1750. [Google Scholar] [CrossRef]
- Sun, H.; Wu, Y.; Lin, B.; Duan, M.; Lin, Z.; Li, H. Experimental investigation on the thermal performance of a novel radiant heating and cooling terminal integrated with a flat heat pipe. Energy Build. 2020, 208, 109646. [Google Scholar] [CrossRef]
- Yeom, G.; Jung, D.E.; Do, S.L. Improving a Heating Supply Water Temperature Control for Radiant Floor Heating Systems in Korean High-Rise Residential Buildings. Sustainability 2019, 11, 3926. [Google Scholar] [CrossRef] [Green Version]
- Márquez, A.A.; López, J.M.C.; Hernández, F.F.; Muñoz, F.D.; Andres, A.C. A comparison of heating terminal units: Fan-coil versus radiant floor, and the combination of both. Energy Build. 2017, 138, 621–629. [Google Scholar] [CrossRef]
- Seo, J.-M.; Song, D.; Lee, K.H. Possibility of coupling outdoor air cooling and radiant floor cooling under hot and humid climate conditions. Energy Build. 2014, 81, 219–226. [Google Scholar] [CrossRef]
- Hernández, F.F.; López, J.M.C.; Fernández-Gutiérrez, A.; Muñoz, F.D.; Fernandez, F. A new terminal unit combining a radiant floor with an underfloor air system: Experimentation and numerical model. Energy Build. 2016, 133, 70–78. [Google Scholar] [CrossRef]
- Ansuini, R.; Larghetti, R.; Giretti, A.; Lemma, M. Radiant floors integrated with PCM for indoor temperature control. Energy Build. 2011, 43, 3019–3026. [Google Scholar] [CrossRef]
- Sun, W.; Zhang, Y.; Ling, Z.; Fang, X.; Zhang, Z. Experimental investigation on the thermal performance of double-layer PCM radiant floor system containing two types of inorganic composite PCMs. Energy Build. 2020, 211, 109806. [Google Scholar] [CrossRef]
- Zhou, Y.; Zheng, S.; Zhang, G. A review on cooling performance enhancement for phase change materials integrated systems—flexible design and smart control with machine learning applications. Build. Environ. 2020, 174, 106786. [Google Scholar] [CrossRef]
- Movinord Climatización. Manual de Climatización Tranquila. Available online: http://www.movinord.com/descargas/Climatizacion%202008.pdf (accessed on 11 March 2019).
- Mikeska, T.; Svendsen, S. Dynamic behavior of radiant cooling system based on capillary tubes in walls made of high performance concrete. Energy Build. 2015, 108, 92–100. [Google Scholar] [CrossRef] [Green Version]
- Zhou, G.; He, J. Thermal performance of a radiant floor heating system with different heat storage materials and heating pipes. Appl. Energy 2015, 138, 648–660. [Google Scholar] [CrossRef]
- ISO. ISO-11855: 2012, Building Environment Design—Design, Dimensioning, Installation and Control of Embedded Radiant Heating and Cooling Systems; International Organization for Standardization: Geneva, Switzerland, 2012. [Google Scholar]
- Tang, H.; Zhang, T.; Liu, X.; Li, C. A novel approximate harmonic method for the dynamic cooling capacity prediction of radiant slab floors with time variable solar radiation. Energy Build. 2020, 223, 110117. [Google Scholar] [CrossRef]
- Feng, J.; Schiavon, S.; Bauman, F. New method for the design of radiant floor cooling systems with solar radiation. Energy Build. 2016, 125, 9–18. [Google Scholar] [CrossRef] [Green Version]
- De Dear, R.J.; Akimoto, T.; Arens, E.A.; Brager, G.; Candido, C.; Cheong, K.W.D.; Li, B.; Nishihara, N.; Sekhar, S.C.; Tanabe, S.; et al. Progress in thermal comfort research over the last twenty years. Indoor Air 2013, 23, 442–461. [Google Scholar] [CrossRef]
- Beka. Capillary Tube Systems. Product Data Sheets. Technical Information G0; Beka Heiz-und Külmatten: Berlín, Germany, 2008; Available online: https://www.beka-klima.de/en/heating-cooling/capillary-tube-technology/ (accessed on 5 March 2019).
- Zhao, M.; Gu, Z.; Kang, W.; Liu, X.; Zhang, L.Y.; Jin, L.; Zhang, Q. Experimental investigation and feasibility analysis on a capillary radiant heating system based on solar and air source heat pump dual heat source. Appl. Energy 2017, 185, 2094–2105. [Google Scholar] [CrossRef]
- Climate WellTM 10. Design Guidelines. Available online: http://www.solarcombiplus.eu/docs/SolarCombi_ClimateWell_trainingmaterial5.pdf (accessed on 12 March 2019).
- Patel, J.; Pandya, B.; Mudgal, A. Exergy Based Analysis of LiCl-H2O Absorption Cooling System. Energy Procedia 2017, 109, 261–269. [Google Scholar] [CrossRef]
- Widiatmojo, A.; Gaurav, S.; Ishihara, T.; Yasukawa, K.; Uchida, Y.; Yoshioka, M.; Tomigashi, A. Using a capillary mat as a shallow heat exchanger for a ground source heat pump system. Energy Build. 2020, 209, 109684. [Google Scholar] [CrossRef]
- Zamora, M. Proyecto Geocool: Empleo de Bombas de Calor Acopladas A Intercambiadores Geotérmicos. Available online: http://blog.energesis.es/wp-content/uploads/2008_03_ENERGETICA_XXI_.pdf (accessed on 9 March 2019).
- Yeom, D.; La Roche, P. Investigation on the cooling performance of a green roof with a radiant cooling system. Energy Build. 2017, 149, 26–37. [Google Scholar] [CrossRef]
- Haiwen, S.; Lin, D.; Xiangli, L.; Yingxin, Z. Quasi-dynamic energy-saving judgment of electric-driven seawater source heat pump district heating system over boiler house district heating system. Energy Build. 2010, 42, 2424–2430. [Google Scholar] [CrossRef]
- Li, Z.; Songtao, H. Research on the heat pump system using seawater as heat source or sink. Build. Energy Environ. 2006, 25, 34–38. [Google Scholar]
- Tian, Z.; Yin, X.; Ding, Y.; Zhang, C. Research on the actual cooling performance of ceiling radiant panel. Energy Build. 2012, 47, 636–642. [Google Scholar] [CrossRef]
- Zhao, R.; Tuan, C.Y.; Luo, B.; Xu, A. Radiant heating utilizing conductive concrete tiles. Build. Environ. 2019, 148, 82–95. [Google Scholar] [CrossRef]
- Mikeska, T.; Fan, J.; Svendsen, S. Full scale measurements and CFD investigations of a wall radiant cooling system integrated in thin concrete walls. Energy Build. 2017, 139, 242–253. [Google Scholar] [CrossRef] [Green Version]
- Choi, N.; Yamanaka, T.; Sagara, K.; Momoi, Y.; Suzuki, T. Displacement ventilation with radiant panel for hospital wards: Measurement and prediction of the temperature and contaminant concentration profiles. Build. Environ. 2019, 160, 106197. [Google Scholar] [CrossRef]
- Rucevskis, S.; Akishin, P.; Korjakins, A. Parametric analysis and design optimisation of PCM thermal energy storage system for space cooling of buildings. Energy Build. 2020, 224, 110288. [Google Scholar] [CrossRef]
- Ning, B.; Chen, Y.; Liu, H.; Zhang, S. Cooling capacity improvement for a radiant ceiling panel with uniform surface temperature distribution. Build. Environ. 2016, 102, 64–72. [Google Scholar] [CrossRef]
- Cantavella, V.; Bannier, E.; Silva, G.; Muñoz, S.; Portolés, J.; Algora, E.; Garcia, M.A. Dynamics of termal performance of an electric radiant floor with removable ceramic tiles. In Proceedings of the 2010 11th World Congress on Ceramic Tile Quality, Castellon, Spain, 15–16 February 2010. [Google Scholar]
- Koschenz, M.; Lehmann, B. Development of a thermally activated ceiling panel with PCM for application in lightweight and retrofitted buildings. Energy Build. 2004, 36, 567–578. [Google Scholar] [CrossRef]
- Echarri Iribarren, V.; Galiano Garrigós, A.L.; González Avilés, A.B. Ceramics and healthy heating and cooling systems: Thermal ceramic panels in buildings. Conditions of comfort and energy demand versus convective systems. Inf. Construcción 2016, 68, 19–32. [Google Scholar]
- Echarri, V.; Oviedo, E.; Lázaro, V. Panel de Acondicionamiento Térmico Cerámico. Patent P201001626 28 December 2010. INVENES, OEPM –Oficina Española de Patentes y Marcas. Available online: http://invenes.oepm.es/InvenesWeb/detalle?referencia=P201001626 (accessed on 10 March 2019).
- Echarri-Iribarren, V. Thermal Ceramic Panels and Passive Systems in Mediterranean Housing: Energy Savings and Environmental Impacts. Sustainability 2017, 9, 1613. [Google Scholar] [CrossRef] [Green Version]
- Kottek, M.; Grieser, J.; Beck, C.; Rudolf, B.; Rubel, F. World Map of the Köppen-Geiger climate classification updated. Meteorol. Z. 2006, 15, 259–263. [Google Scholar] [CrossRef]
- Kottek, M.; Grieser, J.; Beck, C.; Rudolf, B.; Rubel, F. World Map of the Köppen-Geiger Climate Classification Updated. High Resolution Map and Data (Version March 2017); KMZ File for Google Earth (high res): Global_1986-2010_KG_5m.kmz; Climate Change & Infectious Diseases: Wien, Austria, 2017; Available online: http://koeppen-geiger.vu-wien.ac.at (accessed on 13 April 2019).
- Orden FOM/1635/2013, de 10 de Septiembre, por la que se Actualiza el Documento Básico DB-HE Ahorro de Energía, del Código Técnico de la Edificación, Aprobado por Real Decreto 314/2006, de 17 de marzo; (Publicado en: <BOE> núm. 219, de 12 de Septiembre de 2013, Páginas 67137–67209); Spanish Ministry of Public Works and Transport: Madrid, Spain, 2013. Available online: https://www.codigotecnico.org/index.php/menu-ahorro-energia.html (accessed on 16 April 2019).
- Bojić, M.; Cvetković, D.; Miletić, M.; Malešević, J.; Boyer, H. Energy, cost, and CO2 emission comparison between radiant wall panel systems and radiator systems. Energy Build. 2012, 54, 496–502. [Google Scholar] [CrossRef] [Green Version]
- International Organization for Standardization. ISO 9972:2015 Thermal Performance of Buildings—Determination of Air Permeability of Buildings—Fan Pressurization Method. (ISO 9972:1996, Modified). 2002. Available online: https://www.iso.org/standard/55718.html (accessed on 9 March 2019).
- 2017 ASHRAE Handbook—Fundamentals; American Society of Heating, Refrigeration and Air Conditioning Engineers: Atlanta, GA, USA, 2017; ISBN 9781939200587. Available online: https://www.ashrae.org/technical-resources/ashrae-handbook/description-2017-ashrae-handbook-fundamentals (accessed on 20 March 2019).
- UNE EN ISO 10456:2012. Materiales y Productos Para la Edificación. Propiedades Higrotérmicas. Valores Tabulados de Diseño y Procedimientos Para la Determinación de los Valores Térmicos Declarados. 2012. Available online: http://www.aenor.es/aenor/normas/normas/fichanorma.asp?tipo=N&codigo=N0049362#.Wgbq4tThCmw (accessed on 9 October 2017).
- Feijó-Muñoz, J.; Pardal, C.; Echarri-Iribarren, V.; Fernández-Agüera, J.; De Larriva, R.A.; Calderín, M.M.; Poza-Casado, I.; Padilla-Marcos, M.Á.; Meiss, A. Energy impact of the air infiltration in residential buildings in the Mediterranean area of Spain and the Canary islands. Energy Build. 2019, 188–189, 226–238. [Google Scholar] [CrossRef]
- Andújar Márquez, J.M.; Martínez Bohórquez, M.Á.; Gómez Melgar, S. A New Metre for Cheap, Quick, Reliable and Simple Thermal Transmittance (U-Value) Measurements in Buildings. Sensors 2017, 17, 2017. [Google Scholar] [CrossRef] [Green Version]
- Nardi, I.; Ambrosini, D.; De Rubeis, T.; Sfarra, S.; Perilli, S.; Pasqualoni, G. A comparison between thermographic and flow-meter methods for the evaluation of thermal transmittance of different wall constructions. J. Phys. Conf. Ser. 2015, 655, 012007. [Google Scholar] [CrossRef] [Green Version]
- Thermal Insulation. Building Elements. In-Situ Measurement of Thermal Resistance and Thermal Transmittance. Part 1: Heat Flow Metre Method; ISO 9869-1:2014; International Organization for Standardization: Geneva, Switzerland, 2014; Available online: https://www.iso.org/standard/59697.html (accessed on 15 March 2019).
- Balghouthi, M.; Chahbani, M.; Guizani, A. Investigation of a solar cooling installation in Tunisia. Appl. Energy 2012, 98, 138–148. [Google Scholar] [CrossRef]
- Sarbu, I.; Sebarchievici, C. Review of solar refrigeration and cooling systems. Energy Build. 2013, 67, 286–297. [Google Scholar] [CrossRef]
- Bataineh, K.; Taamneh, Y. Review and recent improvements of solar sorption cooling systems. Energy Build. 2016, 128, 22–37. [Google Scholar] [CrossRef]
- Sancho Ávila, J.M.; Riesco Martín, J.; Jiménez Alonso, C.; Sánchez de Cos, M.D.; Montero Cadalso, J.; López Bartolomé, M. Atlas de Radiación Solar en España Utilizando Datos del SAF de Clima de Eumetsat; AEMET: Madrid, Spain, 2005; Available online: http://www.aemet.es/documentos/es/serviciosclimaticos/datosclimatologicos/atlas_radiacion_solar/atlas_de_radiacion_24042012.pdf (accessed on 10 March 2019).
- González-Roubaud, E.; Pérez-Osorio, D.; Prieto, C. Review of commercial thermal energy storage in concentrated solar power plants: Steam vs. molten salts. Renew. Sustain. Energy Rev. 2017, 80, 133–148. [Google Scholar] [CrossRef]
- Li, H.; Bi, Y.; Qin, L.; Zang, G. Absorption solar-ground source heat pump: Life cycle environmental profile and comparisons. Geothermics 2020, 87, 101850. [Google Scholar] [CrossRef]
- Energy Performance of Buildings—Economic Evaluation Procedure for Energy Systems in Buildings—Part 1: Calculation Procedures; UNE-EN 15459-1:2017; Module M1-14; European Committee for Standardization (CEN): Brussels, Belgium, 2017; Available online: https://standards.cen.eu/dyn/www/f?p=204:110:0::::FSP_PROJECT,FSP_ORG_ID:40932,6209&cs=110690DD8F9BE238B61D722D035C11CAE (accessed on 11 June 2019).
- Theodosiou, T.G.; Tsikaloudaki, A.G.; Kontoleon, K.J.; Bikas, D.K. Thermal bridging analysis on cladding systems for building facades. Energy Build. 2015, 109, 377–384. [Google Scholar] [CrossRef]
- Bienvenido-Huertas, D.; Moyano, J.; Marin, D.; Fresco-Contreras, R. Review of in situ methods for assessing the thermal transmittance of walls. Renew. Sustain. Energy Rev. 2019, 102, 356–371. [Google Scholar] [CrossRef]
- Herramienta Unificada Lider-Calener (HULC). Orden FOM/1635/2013, de 10 de Septiembre (BOE de 12 de septiembre), por la que se Actualiza el Documento Básico DB HE «Ahorro de Energía», del CTE; Ministerio de Ciencia e Innovación: Madrid, Spain, 2013. Available online: https://www.codigotecnico.org/index.php/menu-recursos/menu-aplicaciones/282-herramientaunificada-lider-calener.html (accessed on 9 March 2019).
- Domínguez-Muñoz, F.; Cejudo-López, J.M.; Carrillo-Andrés, A. Uncertainty in peak cooling load calculations. Energy Build. 2010, 42, 1010–1018. [Google Scholar] [CrossRef]
- Stetiu, C. Energy and peak power savings potential of radiant cooling systems in US commercial buildings. Energy Build. 1999, 30, 127–138. [Google Scholar] [CrossRef] [Green Version]
- European Comission. LCDN—The Life Cycle Data Network. Available online: https://eplca.jrc.ec.europa.eu/LCDN/ (accessed on 9 March 2019).
- Instituto para la Diversificación y Ahorro de Energía (IDAE). Informe de Balance de Consumo de Energía Final. 1990–2018; Instituto para la Diversificación y Ahorro de Energía: Madrid, Spain, 2018; Available online: http://sieeweb.idae.es/consumofinal/ (accessed on 30 October 2020).
- Corona, B.; de la Rúa, C.; San Miguel, G. Socio-economic and environmental effects of concentrated solar power in Spain: A multiregional input output analysis. Sol. Energy Mater. Sol. Cells 2016, 156, 112–121. [Google Scholar] [CrossRef]
- Wang, R.Z.; Xia, Z.Z.; Wang, L.W.; Lu, Z.S.; Li, S.L.; Li, T.X.; Wu, J.Y.; He, S. Heat transfer design in adsorption refrigeration systems for efficient use of low-grade thermal energy. Energy 2011, 36, 5425–5439. [Google Scholar] [CrossRef]
- IDAE. Informe de Precios Energéticos Regulados. 2017. Available online: http://www.idae.es/sites/default/files/estudios_informes_y_estadisticas/tarifas_reguladas_julio_2017.pdf (accessed on 7 March 2019).
- Al Ajmi, A.; Abou-Ziyan, H.; Ghoneim, A. Achieving annual and monthly net-zero energy of existing building in hot climate. Appl. Energy 2016, 165, 511–521. [Google Scholar] [CrossRef]


| U W/m2 °C | Material | Espesor (cm) | ||
|---|---|---|---|---|
| E1 | Enclosure | 0.435 | Single-layer mortar | 1.5 |
| Double hollow brickwork | 12 | |||
| Rock wool insulation | 5 | |||
| Air chamber | 4 | |||
| Single hollow brickwork | 7 | |||
| Double plasterboard on steel substructure | 3 + 3 | |||
| E2 | Enclosure | 0.462 | Single-layer mortar | 1.5 |
| Concrete block | 20 | |||
| Rock wool insulation | 5 | |||
| Double plasterboard on steel substructure | 3 + 3 | |||
| W | Windows | 3.10 | Large double-glazed sliding windows on anodised aluminium frames, with thermal break | 4 |
| F | Floor | 0.482 | Reinforced concrete foundation slab | 60 |
| “Cupolex” plastic pieces to create a camera | 60 | |||
| Waffle slab with reinforced concrete ribs | 15 | |||
| Thermal insulator. Type IV expanded polystyrene | 4 | |||
| Regulatory layer. Self-levelling cement mortar | 10 | |||
| Wooden strips for laying the floor | 4 | |||
| Canadian oak flooring | 2 | |||
| R | Roof | 0.403 | Gravel diameter 20 mm | 5 |
| Protective Geotextile | 0.4 | |||
| Thermal insulation of extruded polystyrene | 6 | |||
| LBM-40 waterproofing bituminous film | 0.3 | |||
| Formation of cellular concrete slopes | 10 | |||
| Reinforced concrete ribbed waffle slab | 27 | |||
| Plasterboard on steel substructure | 1.5 + 3 |
| Units | System Components | Diameter | Power | COP | EER |
|---|---|---|---|---|---|
| 1 | Air-water heat pump with two inverter scroll compressors (refrigerant R410A) | 40 kW | 4.11 | 2.85 | |
| 10 | Flow circuits of PPR tubes with thermostatic valves | 20 mm | |||
| 10 | Return circuits of PPR tubes with balancing valves | 20 mm | |||
| 3 | Fan coil dehumidifiers | 0.5 kW | |||
| 24 m2 | Thermal solar panels for a solar cold system LiCl | 27 kW |
| Scenario | Conditioning System | Use of the Basement | Thermal Solar Panels |
|---|---|---|---|
| SC1 | All-air system in summer with radiators in winter | Bioclimatic basement | |
| SC2 | TCP panels as radiant walls | Bioclimatic basement | |
| SC3 | TCP panels as radiant floor | Bioclimatic basement | |
| SC4 | TCP panels as radiant floor | Bioclimatic basement | Solar cold system LiCl |
| v | hc | Ta | hr | Trm | To | |
|---|---|---|---|---|---|---|
| m/s | W/°C | °C | W/m2 °C | °C | °C | |
| SC1 | 0.160 | 9.088 | 24.07 | 4.70 | 23.98 | 24.035 |
| SC2 | 0.082 | 7.742 | 26.11 | 4.70 | 19.45 | 23.598 |
| SC3–SC4 | 0.085 | 7.759 | 26.24 | 4.70 | 19.28 | 23.617 |
| All-Air SC1 | TCP Radiant Floor SC2 | |||
|---|---|---|---|---|
| Summer | Winter | Summer | Winter | |
| Wh/m2yr | Wh/m2yr | Wh/m2yr | Wh/m2yr | |
| Enclosure | ||||
| Glazing | 7568 | 11,379 | 4192 | 10,399 |
| Walls | 812 | 122 | 392 | 142 |
| Floors—ground | −724 | 3610 | −675 | 2233 |
| Partitions | 0 | 0 | 0 | 0 |
| Rooftops | 2539 | 4034 | 1179 | 2741 |
| Outdoor floors | 149 | 95 | 142 | 78 |
| Infiltration | 7078 | 12,230 | 3075 | 9657 |
| 17,422 | 30,758 | 8305 | 25,250 | |
| Loads | ||||
| Lighting | 1161 | 1606 | 1161 | 1606 |
| Equipment | 1811 | 1507 | 586 | 595 |
| Occupation | 4308 | 3955 | 4308 | 3955 |
| Solar gains | 18,538 | −14,536 | 18,538 | −14,536 |
| 25,818 | −7468 | 24,593 | −8380 | |
| kWh/m2yr | kWh/m2yr | kWh/m2yr | kWh/m2yr | |
| Primary energy | 43.24 | 23.29 | 32.90 | 16.87 |
| SC1 | SC2 TCP Walls | SC3 TCP Floor | SC4 TCP + SOLAR | |
|---|---|---|---|---|
| Energy demand in summer kWh/m2 | 37.15 | 28.63 | 26.95 | 17.09 |
| Energy demand in winter kWh/m2 | 29.38 | 23.84 | 22.82 | 11.21 |
| Annual energy demand kWh/m2yr | 66.53 | 52.47 | 49.77 | 28.30 |
| Annual CO2 emissions in use stage | 7835.10 kg | 6179.28 kg | 5861.13 kg | 3332.73 kg |
| Percentage | 100.00% | 78.87% | 74.81% | 42.54% |
| Summer from 1 May to 30 November Winter from 1 December to 30 April Occupancy 5 People | SC1 All-Air | SC2 TCP Walls | SC3 TCP Floor | SC4 TCP Floor + Solar Panels | ||
|---|---|---|---|---|---|---|
| 1 | Effective area | m2 | 287.22 | 287.22 | 287.22 | 287.22 |
| 2 | TCP ceramic panels Area | m2 | 235 | 260 | 260 | |
| 3 | Maximum thermal load | W/m2 | 80 | 75 | 70 | 70 |
| 4 | Minimum flow of air renewal | m3/m2 h | 1.70 | 1.70 | 1.70 | 1.70 |
| 5 | Thermal leap of water in summer | k | 6 | 3 | 3 | 3 |
| 6 | System’s run time | h/yr | 5620 | 5620 | 5620 | 5620 |
| Cold pump run time | h/yr | 2160 | 2160 | 2160 | 2160 | |
| Total hours cooling is on | h/yr | 744 | 260 | 246 | 246 | |
| Total hours heating is on | h/yr | 372 | 175 | 168 | 168 | |
| Ventilation | ||||||
| 7 | Air supply flow | m3/hm2 | 18.32 | 2.45 | 2.45 | 2.45 |
| 8 | Air supply volume | m3/h | 2261 | 317 | 317 | 317 |
| 9 | Ventilator power | kW | 1.25 | 0.27 | 0.27 | 0.27 |
| 10 | Power consumption | MWh/yr | 4.82 | 1.096 | 1.096 | 1.096 |
| Cold pump | ||||||
| 11 | Water flow | L/m2 h | 10.70 | 21.5 | 20.1 | 20.1 |
| 12 | Water volume | L/h | 3073 | 6175 | 5972 | 5972 |
| 13 | Power | 0.10 | 0.25 | 0.24 | 0.24 | |
| 14 | Power consumption | MWh/año | 0.45 | 0.88 | 0.82 | 0.82 |
| Ventilators and pumps | ||||||
| 15 | Power consumption | MWh/yr | 5.27 | 2.03 | 1.97 | 1.97 |
| 16 | Comparison | % | 100% | 38.5% | 37.4% | 37.4% |
| Fan coil dehumidifiers | ||||||
| 17 | Power | kW | 4.69 | 4.52 | 4.52 | |
| 18 | Power Consumption | MWh/yr | 5.05 | 4.81 | 4.81 | |
| Cooling system | ||||||
| 19 | Emission power | W/m2 | 85 | 72 | 70 | 70 |
| 20 | Power | kW | 18.47 | 14.21 | 13.77 | 13.77 |
| 21 | Summer power consumption | MWh/yr | 7.77 | 5.67 | 5.21 | 5.21 |
| Heating system | ||||||
| 22 | Power | kW | 16.8 | 15.87 | 15.49 | 15.49 |
| 23 | Winter power consumption | MWh/yr | 6.06 | 4.35 | 4.27 | 4.27 |
| 24 | Solar energy supply | −6.67 | ||||
| Circulators of water to the system | ||||||
| 25 | Power | 0.12 | ||||
| 26 | Power consumption | 0.51 | ||||
| 27 | Annual energy consumption | MWh/yr | 19.11 | 15.07 | 14.29 | 8.13 |
| Comparison | % | 100% | 78.87% | 74.81% | 42.54% | |
| SC1 €/m2 | SC2 €/m2 | SC3 €/m2 | SC4 €/m2 | |
|---|---|---|---|---|
| Investment cost | 1320.2 | 1361.1 | 1351.7 | 1390.7 |
| Indirect cost | 53.6 | 61.3 | 64.0 | 71.8 |
| Maintenance cost | 107.1 | 90.4 | 91.5 | 123.8 |
| Replacement cost | 40.2 | 43.5 | 47.6 | 61.0 |
| Energy cost | 283.4 | 223.5 | 212.0 | 120.6 |
| Global cost | 1804.5 | 1779.8 | 1776.8 | 1767.9 |
| SC1 | SC2 | SC3 | SC4 | ||
|---|---|---|---|---|---|
| All-air installation with heat pump | € | 28,315 | |||
| Installation of TCP panels on the floor | € | 42,541 € | 39,270 | 50,159 € | |
| Annual energy demand | kWh/año | 19,110 | 15,078 | 14,290 | 8135 |
| Annual savings | € | 572.54 | 684.4 | 1558.45 | |
| Amortisation Period | años | 24.85 | 16.01 | 14.01 |
Publisher’s Note: MDPI stays neutral with regard to jurisdictional claims in published maps and institutional affiliations. |
© 2021 by the authors. Licensee MDPI, Basel, Switzerland. This article is an open access article distributed under the terms and conditions of the Creative Commons Attribution (CC BY) license (http://creativecommons.org/licenses/by/4.0/).
Share and Cite
Echarri-Iribarren, V.; Wong, N.H.; Sánchez-Ostiz, A. Radiant Floors versus Radiant Walls Using Ceramic Thermal Panels in Mediterranean Dwellings: Annual Energy Demand and Cost-Effective Analysis. Sustainability 2021, 13, 588. https://doi.org/10.3390/su13020588
Echarri-Iribarren V, Wong NH, Sánchez-Ostiz A. Radiant Floors versus Radiant Walls Using Ceramic Thermal Panels in Mediterranean Dwellings: Annual Energy Demand and Cost-Effective Analysis. Sustainability. 2021; 13(2):588. https://doi.org/10.3390/su13020588
Chicago/Turabian StyleEcharri-Iribarren, Víctor, Nyuk Hien Wong, and Ana Sánchez-Ostiz. 2021. "Radiant Floors versus Radiant Walls Using Ceramic Thermal Panels in Mediterranean Dwellings: Annual Energy Demand and Cost-Effective Analysis" Sustainability 13, no. 2: 588. https://doi.org/10.3390/su13020588