Article

Estimation of Iodine Leaching in Soil Amended with Organic and Inorganic Materials Using HYDRUS 1-D Model

1
Department of Environmental Sciences, Abbottabad Campus, COMSATS University Islamabad (CUI), Abbottabad 22650, Pakistan
2
State Key Laboratory of Water Environment Simulation, School of Environment, Beijing Normal University, Beijing 100875, China
3
Faculty of Agriculture and Environmental Sciences, University of Rostock, 18059 Rostock, Germany
4
Department of Civil Engineering, Ghulam Ishaq Khan Institute of Engineering and Technology Topi, Swabi 23460, Pakistan
5
Department of Development Studies, CUI, Abbottabad Campus, Abbottabad 22650, Pakistan
*
Authors to whom correspondence should be addressed.
Sustainability 2021, 13(19), 10967; https://doi.org/10.3390/su131910967
Submission received: 5 September 2021 / Revised: 29 September 2021 / Accepted: 29 September 2021 / Published: 2 October 2021

Abstract

:
This study investigated the ability of a HYDRUS 1D model for predicting the vertical distribution of potassium iodine (200 ppm) in soil columns after amendment with five different common remediation materials (gypsum, lime, fly ash, charcoal, and sawdust) at a rate of 2.5% (w/w), relative to an unamended control soil. Results showed that relative to the unamended soil, iodine leaching was decreased by all amendments but that the magnitude of the decreases varied with the soil amendment applied. Iodine content was highest in the upper layer of the soil columns and decreased progressively with soil depth. The model was evaluated via comparison of the model simulated values with measured values from the soil column studies. The results showed that the HYDRUS 1D model efficiency was near to 1, indicating the stimulated results near to the measured values. Therefore, this study showed that iodine leaching through a soil could be ascertained well using a HYDRUS 1D model. The model over predicted iodine leaching, results in a weak correspondence between the simulated and the measured results for iodine leaching. This suggests that the HYDRUS-1D model does not explain accurately different organic and inorganic amended soil and the preferential flow that occurs in these columns. This may be due to the fact that Freundlich isotherm, which is part of the transport equations, does not sufficiently describe the mechanism of iodine adsorption onto the soil particles. This study would help to select an amendment for an effective management strategy to reduce exogenous iodine losses from agro-ecosystems. This would also improve scientific understanding of iodine transport in soil profile.

Graphical Abstract

1. Introduction

Iodine is an essential micronutrient required for the proper functioning of the human body [1]. Low iodine intake can cause serious health problems in humans, especially in children [2,3]. About 655 million people, 14% of world’s population, are suffering from iodine deficiency [4], where dietary intake from food is dependent upon the iodine content in soil. Thus, dietary intake via foodstuffs is reliant on better iodine phyto-availability to major food crops from the soil. Since, iodine content in soil is very low, however, many of the physicochemical properties of soils (pH, organic content, and redox potential) are responsible for the iodine loss; either by leaching or valorization. In addition, recent climatic changes have also increased surface runoff, soil erosion, and land degradation [5], where iodine is especially prone to being washed from soils via heavy rainfall or soil leaching. Since iodine is not an essential nutrient for the plant growth, therefore, crops grown in iodine-deficient soils are also iodine deficient and thus animals and humans consuming those crops also become iodine deficient. Thus, it is necessary to develop effective management system and improve the process of iodine transport in soils to reduce and mitigate iodine losses from surface soils. Iodine fate and mobility in soils depend on its chemical form and soil characteristics, especially soil pH, the dominant redox processes, and the organic matter content, since the iodine exhibits high affinity for positively charged sorption sites [6,7]. Monitoring iodine concentrations in soil on a continuous basis is expensive and time consuming. This has necessitated alternative methods for predicting iodine movement in the sub zones of soil such as the application of robust mathematical models [8]. The use of simulation models is desirable because they provide a cost and time-effective approach for the assessment of iodine leaching via soil. In particular, mathematical models are proven useful tools for the assessment of water and solute movement in saturated and unsaturated soils. In this research the HYDRUS 1D model, which has previously shown good results for predicting measured water and solute content, soil physical properties [9], was used to simulate iodide movement in the soil.
Mathematical modeling of water and solute movement through soil matrices can be a useful tool for understanding the relationship between measured water or solute concentrations and soil physical properties. The HYDRUS model has been used to characterize relatively complex flow and solute (nutrients and pesticides) transport processes at the experimental and field scale [10,11]. Generally, the HYDRUS model predicts water and chemical transport processes with a reasonable degree of accuracy [12]. However, Phillips [11] investigated the use of the HYDRUS model for simulating the transport of reactive chemicals in soils. Since, iodine retention in soil is minimal due to less amount of minerals contained within the soil and it is mobile due to its negative charge. The enhancement of iodine retention in soils is currently a major challenge, therefore, the practical purpose of the present study was to overcome the problem of iodine leaching from soils. Research reports on the leaching and movement of iodine in soil supplemented with amendment materials using the HYDRUS-1D tool are scanty. The primary objective of this study was to use HYDRUS-1D as a tool to understand the vertical distribution and transport of iodine in unstructured soils collected from agricultural field of District Abbottabad, Pakistan after amendment with different organic and inorganic materials.

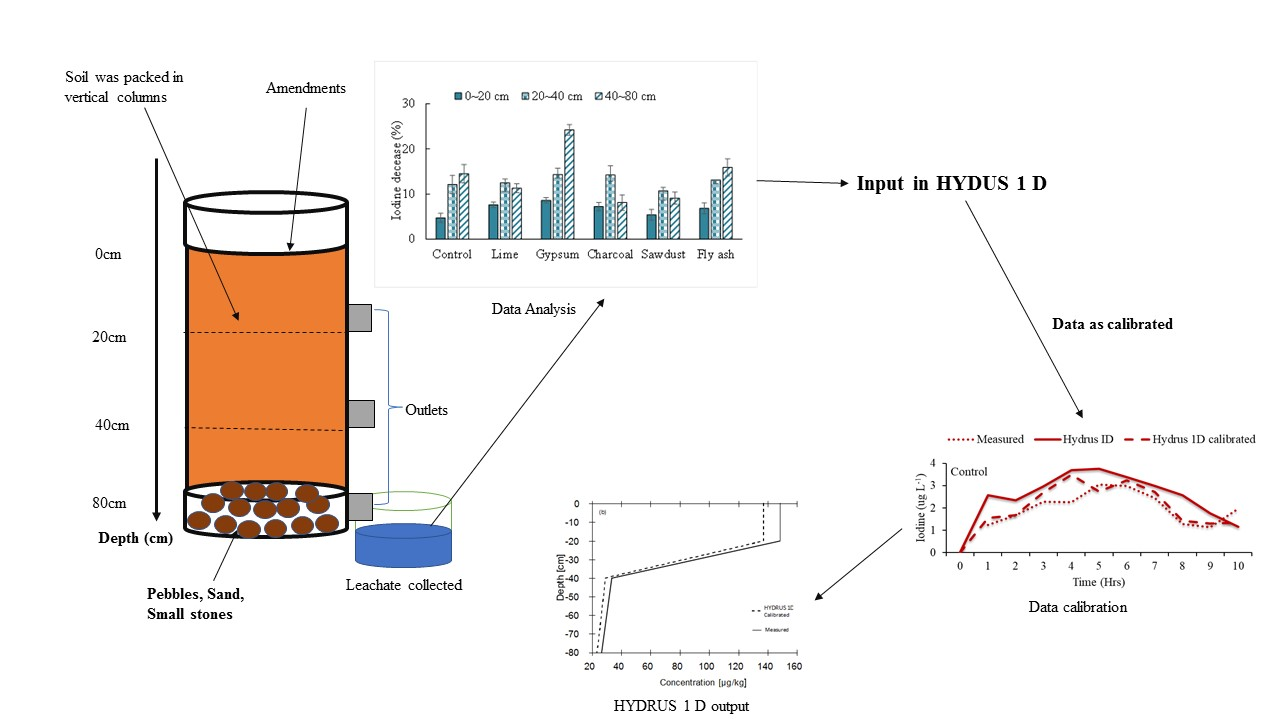
2. Materials and Methods

Composite surface soil samples (0–30 cm) were collected from agricultural fields from District of Abbottabad, Pakistan, situated between 34°92′ N latitude and 73°13′ E longitude at an altitude of 4120 feet (1260 m). The physicochemical properties of the soil including pH, electrical conductivity (EC), soil moisture, texture, organic matter, Ca, Mg, and K were determined (Table 1). The leaching fraction of soil was calculated by dividing the drained water by the applied water. Soil texture was determined using a pipette method [13]. Soil organic matter was determined by dry combustion [14]. The pH of soil suspension at a soil: water ratio of 1:5 was determined using a pH meter (Model: HANNA HI 8520). Electrical conductivity (EC) of the same 1:5 soil suspension was measured using an EC meter (Model: 4320 JENWAY). Calcium, Mg, and K were leached from the soil using 1 M ammonium acetate (NH4OAc) (pH 7) and determined via atomic absorption spectrophotometer (AAS) (Model: Analyst 700, Perkin Elmer).

2.1. Column Study

A set of polyvinyl chloride (PVC) columns was mounted vertically on a pre-made wooden frame (size: height 80 cm and diameter 20 cm). A hole was drilled at the bottom of each column for leachate collection. A piece of filter screen was set at the bottom of each column and then washed sand was packed in the column (depth: 5 cm). Unstructured soil (5 kg) was packed into each column. Five discrete amendments (gypsum, slaked lime, fly ash, charcoal, and saw dust) were applied to the topsoil (0–20 cm) at the rate of 2.5% (w/w). Unamended soil was used as a control treatment. Iodine was applied in the form of potassium iodide (KI) solution at the dose of 200 ppm (mg/kg−1) in solution form. Leaching events were conducted using distilled water at a leaching fraction of 0.3–0.4. Leaching fraction was calculated by dividing the volume of drained water by the volume of applied water. Every hour, leachate samples were collected until water was no longer flowing from the soil column and were filtered, centrifuged, and stored for further analysis. Leaching was continued until the column was completely drained out. Data regarding infiltration time, total leachate collected, and initial water head were recorded. After the collection of leachates, the soil samples from the PVC column were collected at three depths i.e., 0–20, 20–40, and 40–80. The samples were dried, ground, and sieved via a 2-mm sieve. Selected soil parameters such as pH, EC, and iodine concentration were determined in the dried soil samples.

2.2. Iodine Determination

Iodine was determined as described by Kesari et al. [15]. For determination of iodine in leachate samples, leachate (10 mL) was collected and filtered using filter paper Whatman grade 42. A dried soil (0.5 g) was mixed with water (15 mL) and shaken for 30 min and then filtered. Subsequently, soil and leachate filtrates were centrifuged for 10 min and the supernatant was taken and 5% (w/v) EDTA solution (1 mL) was added. Bromine water (0.5 mL) was also added to the supernatant and mixed thoroughly. The method is based on the oxidation of iodide to iodate with bromine water and liberation of free iodine from iodate by the addition of potassium iodide in acidic medium. The excess bromine water was removed after the drop wise addition of formic acid.
To this solution 0.1% of potassium iodide (KI) (1 mL) and leuco crystal violet (1 mL) were added and the pH of the solution was adjusted to between 4.5 and 5.5 with 0.5 M NaOH. The contents were then diluted to 25 mL with water and left over to stand for about 25 min for complete color development. Extractable iodine was determined colorimetrically using a UV spectrophotometer at 591 nm. For the preparation of standards, a 1000 ppm iodine stock solution was initially prepared by dissolving KI (0.130 g) in ethanol (30 mL) in 100 mL of volumetric flask and diluted with deionized water. A 100-ppm working standard solution was prepared by diluting this stock solution (10 mL) with deionized water to make a volume of 100 mL. Standard solutions in the concentration range of 10 to 90 ppm, were prepared by volumetric dilution of appropriate aliquots of the working stock solution. As with column samples, in each case bromine water (0.5 mL) was added to each standard solution and mixed thoroughly. The excess bromine water was removed by the drop wise addition of formic acid and 0.1% KI (1 mL) and leuco crystal violet (1 mL) were added, and the pH of the solution was adjusted between 4.5 and 5.5 with 0.5 M NaOH. The contents were diluted to 25 mL with distilled water and kept for about 25 min for color development. Iodine concentrations were determined colorimetrically using a UV spectrophotometer at 591 nm.

2.2.1. HYDRUS Model Setup

The HYDRUS 1 D model was used to simulate the unidirectional saturated water and solute flow. The HYDRUS model uses the Richard equation to simulate the water and solute flow assuming that thermal gradients and air phase are insignificant variables in the flow process [16]. In the HYDRUS 1 D model, the pressure head was set to zero in order to simulate saturated conditions. This indicates that the moisture content in the model was equal to the field capacity [17]. The moisture contents and initial iodine concentration were specified according to the column experiment. The pressure head on the top of the column was determined from the leaching experiments, and the initial iodine concentration on the top of the node was specified according to the iodine added in solution form (200 mg iodine kg−1/soil) during the experiment. During the column experiments, iodine was added as KI solution on the top of the soil column. Atmospheric condition was set as the upper boundary conditions; whereas the lower boundary condition was set as the free drainage due the action of gravity. Pang et al. [10] suggested for fine textured soils the initial pressure head was set as 1000 cm. It was assumed that during column experiment, evaporation was considerably negligible that was why it was set to zero while calibrating HYDRUS-1D model. There was no need to specify a precipitation rate. These boundary conditions allowed the HYDRUS model to run the simulation at different time intervals.

2.2.2. Simulation and Calibration of the Model

For water and solute transport, the HYDRUS 1 D model was calibrated using water pressure head and saturated hydraulic conductivity parameters (Ksat) determined in control columns and validated by the treated column during the laboratory experiments. During calibration of the HYDRUS model, the water solute movement was considered as unidirectional finite difference grid, composed of 80 nodes for a depth of 80 cm. The nodes were determined according to the length of the leaching column. The time duration used was 10 h. Calibration of the model was carried out using Van Genuchten soil hydraulic parameters. In the HYDRUS-1D, the parameters α and n were estimated using the “Rosetta-Lite” module that uses the ROSETTA pedo-transfer functions [16] considering the observed bulk density dataset.
For the validation and calibration of the HYDRUS models, two separate columns were used. The data generated from one column were used for calibration and second column was used for validation. The HYDRUS-1D model version 4.16.0110 implements a set of hydraulic equations advocated by Simunek, Jacques [18] by modifying the equations of Van Genuchten [19], Mualem [20], Vogel and Cislerova [21], and Kosugi [22] to add flexibility in the description of the hydraulic properties. These equations were used to determine the soil hydraulic parameters. Effective hydraulic and transport parameters were estimated in a two-step process: soil water parameters (from the van Genuchten equation) based on the soil textural percentages (Table 1), and subsequently, the transport parameters (DL, longitudinal dispersivity and bulk density) were estimated. Iodine adsorption was measured to determine the reaction parameters of the HYDRUS model. Adsorbed iodine was calculated by taking the difference between the amount of iodine added and amount of iodine measured in solution. The Freundlich adsorption isotherm was used to describe the iodine adsorption and iodine concentration in solution. The reaction parameters K1 and α were calculated using the following equation.
Y = K1 × LogC1/α
where y is the amount of iodine adsorbed to the soil (mg/kg−1), K1 is a constant, and c is the equilibrium concentration of the solution (mg/L1) and α is a shape-fitting parameter [23]. The coefficient of determination (R2) was used as a fitting criterion. Following several iterations, the K1 parameter was estimated when the best fit was obtained, then the α parameter was determined when a good shape correspondence was obtained. Triplicate soil samples were used and therefore three values of K1 and α were obtained for each column. In HYDRUS 1 D models, the soil column was divided into three separate soil materials to characterize the soil core that was being studied. The total simulation time was 10 hr. In time information, initial time, final time, initial time step minimum and maximum time steps were calibrated in order to reduce the mass balance error. The soils columns were filled with water from top to bottom to achieve the saturation and then left freely to drain. A constant water head, referred to as the pressured head in the HYDRUS 1 D model, was maintained (6–9 cm).

2.2.3. Assessment of the Model Performance

The HYDRUS 1 D model was validated by comparing simulated and measured values of iodine outflow concentrations in control and amended soil columns. The parameters used for the validation were root mean square error, deviation, coefficient of determination (R2), mean error, and Nash–Sutcliffe efficiency (EF). The EF values infer the overall efficiency of the model so that when EF = 1 this is considered the best fit model. Similarly, R2 values indicate model accuracy, RMSE gives the difference between the measured and predicted values, deviation gives the mean dispersion of model from the measured values, and ME defines the maximum dispersion values.
D = 1 n n = 1 n ( P i - O i )
M E = M a x i = 1 i = n ( P i O i )
E F = 1 n = 1 n ( P i O i ) 2 n = 1 n ( P i O ) 2
R M S E = n = 1 n ( P i O i ) 2 n
R 2 = [ i = 1 n ( O i O ) ( P i P ) ] 2 [ i = 1 n ( O i O ) 2 ( P i P ) 2 ]
there Oi is the observed value, Pi is the predicted value, O is the mean of observed value, and P is mean of the predicted values and n is the total number of data points. All values are in the µg/kg1.

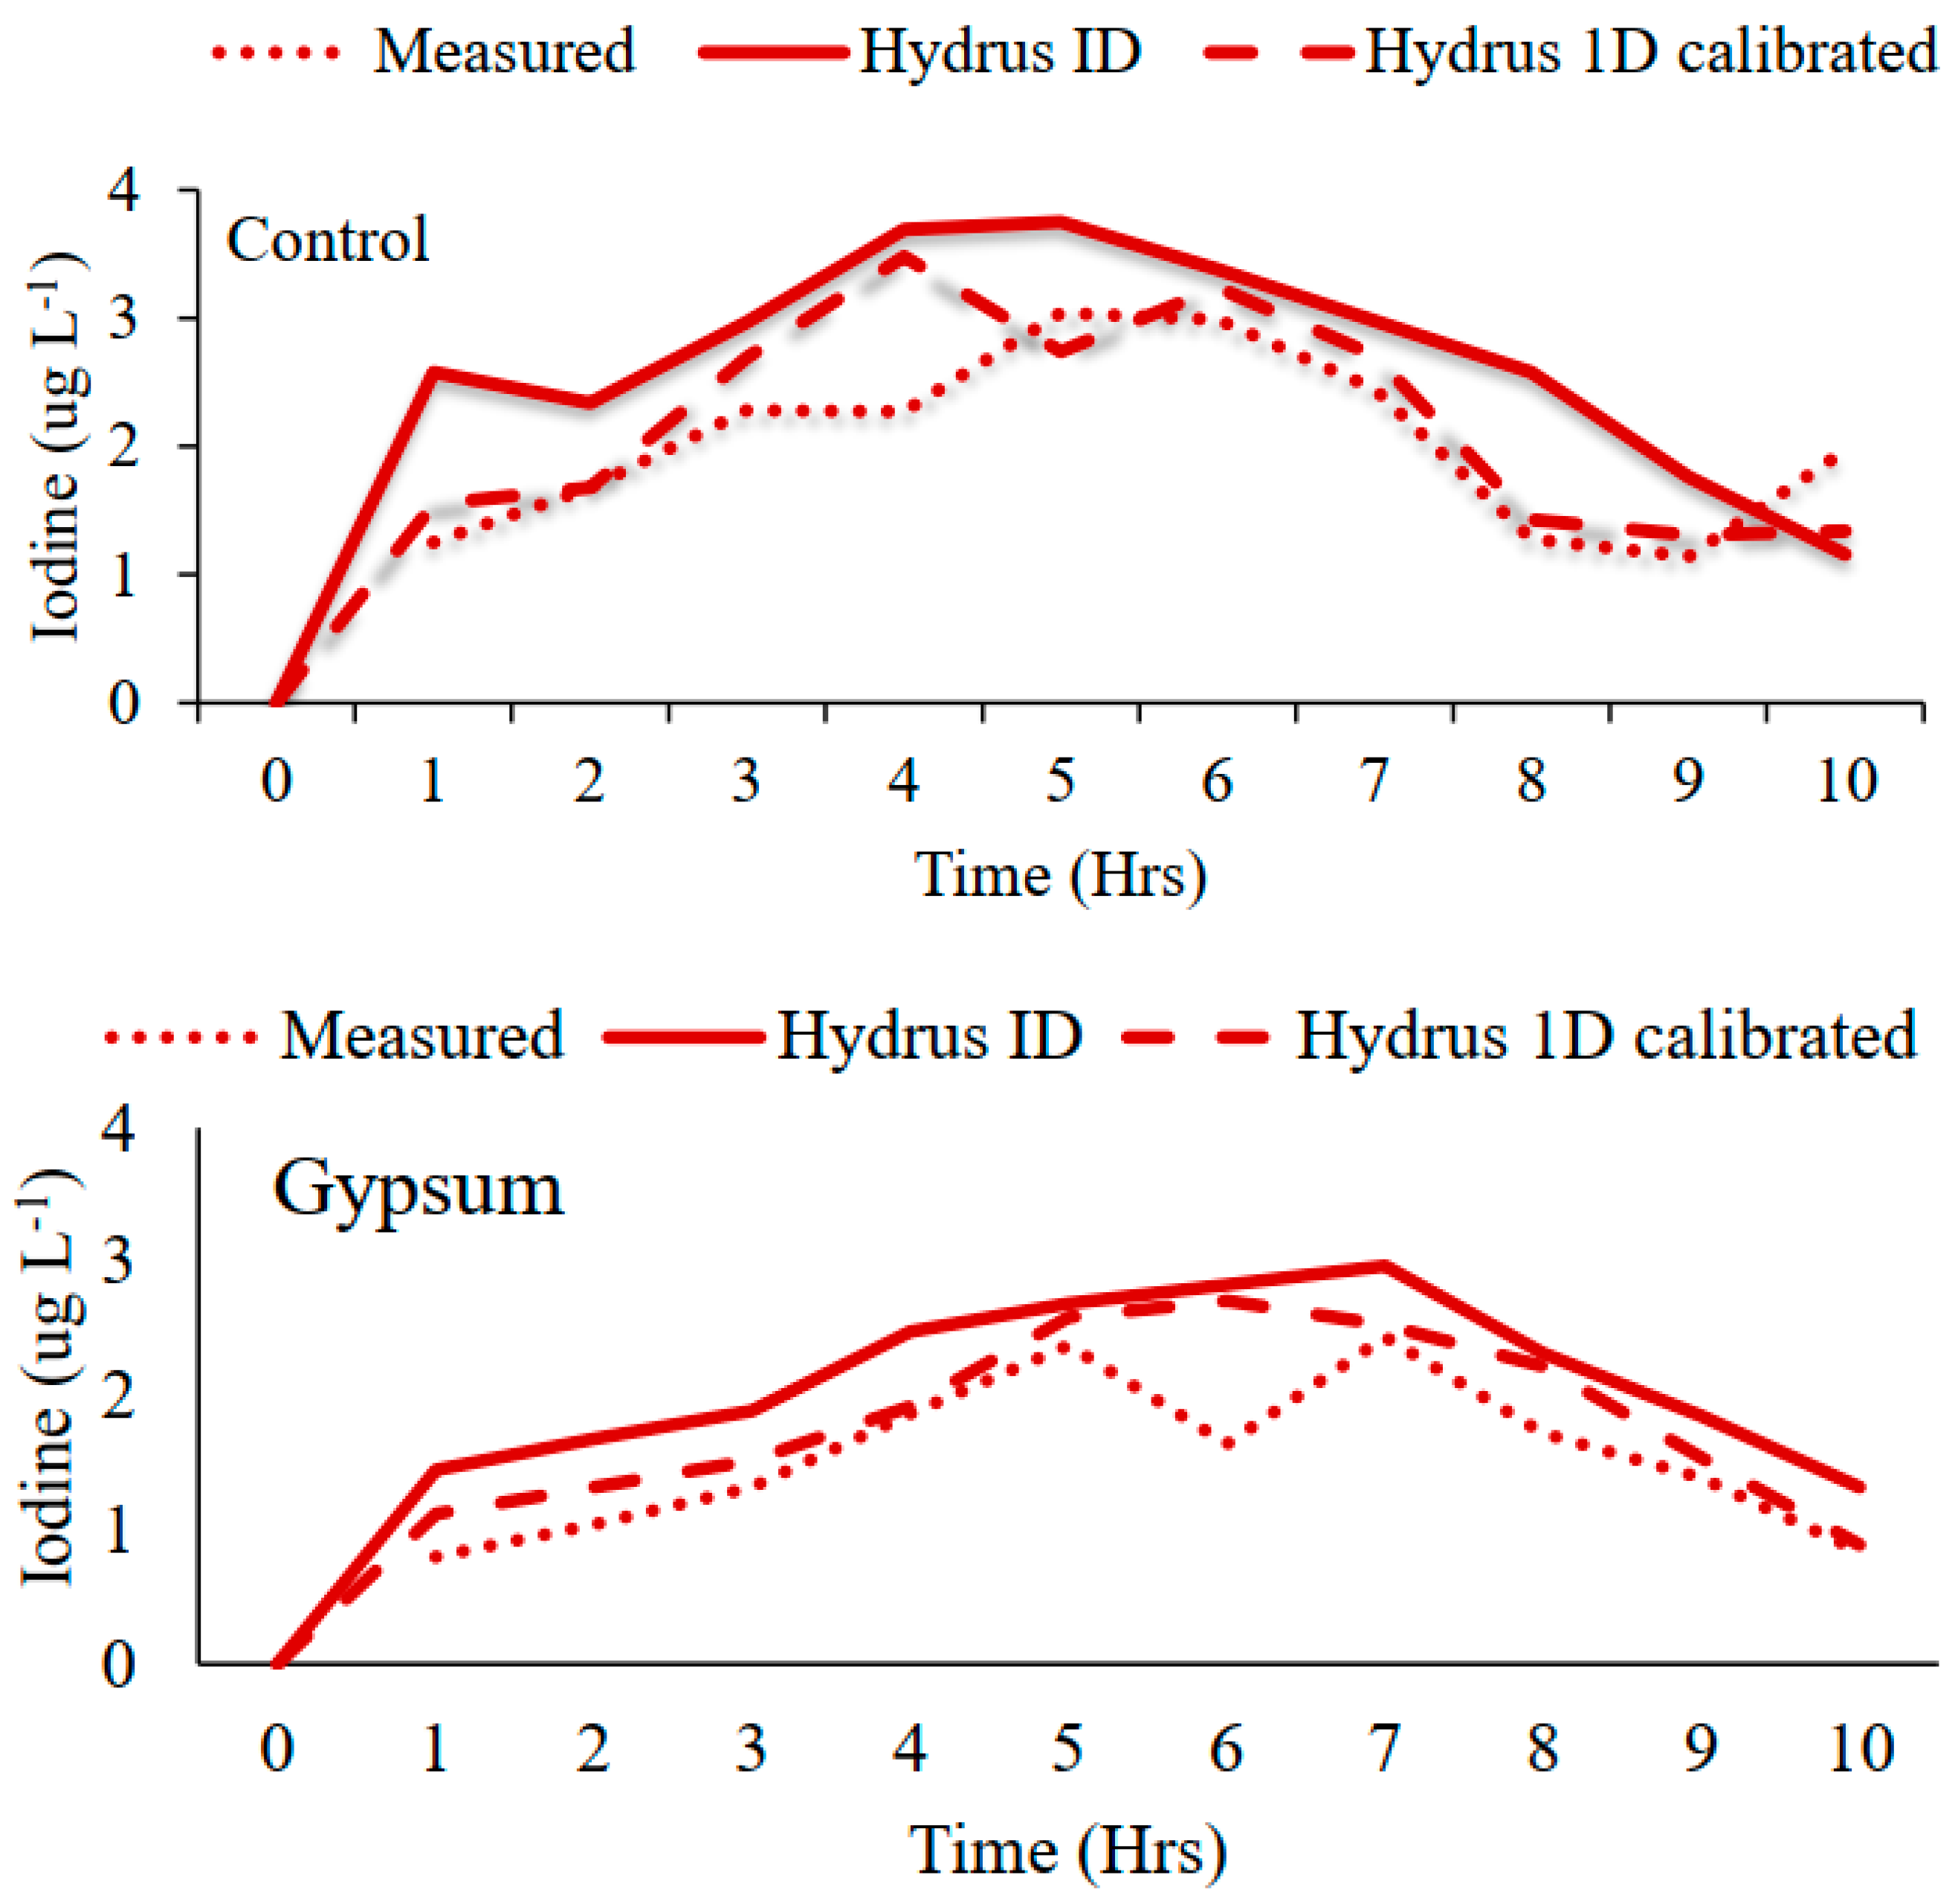
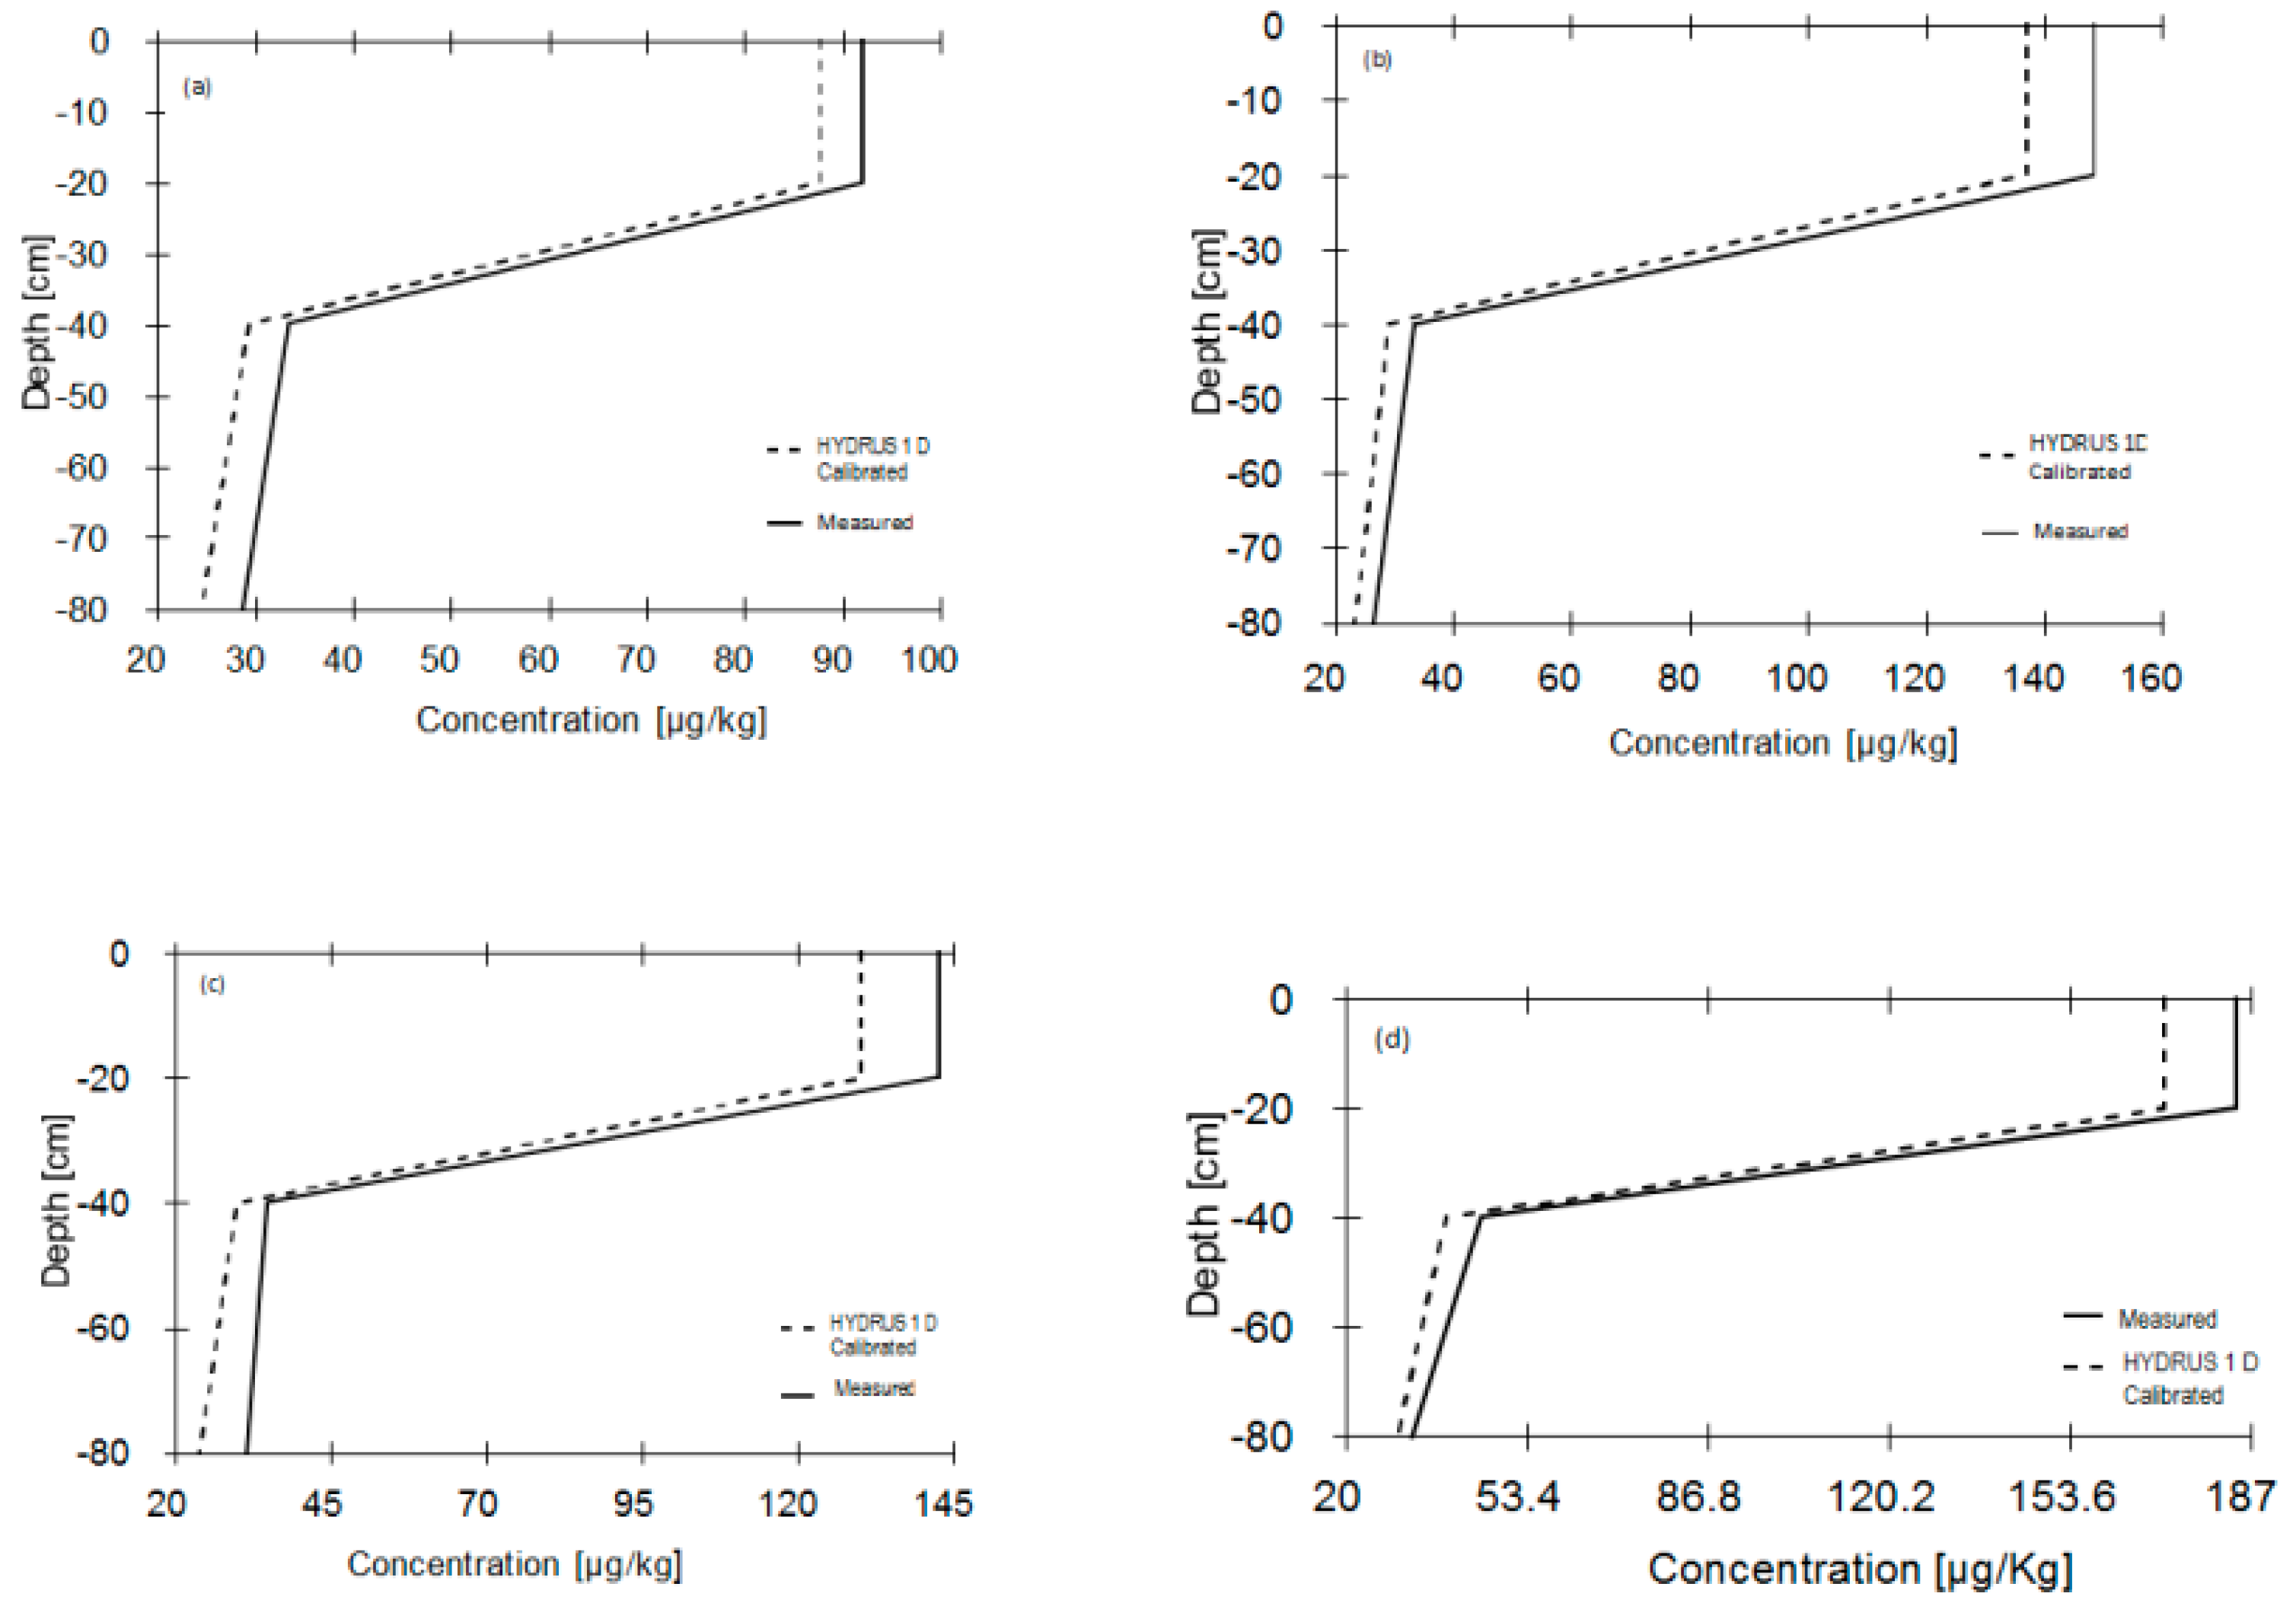
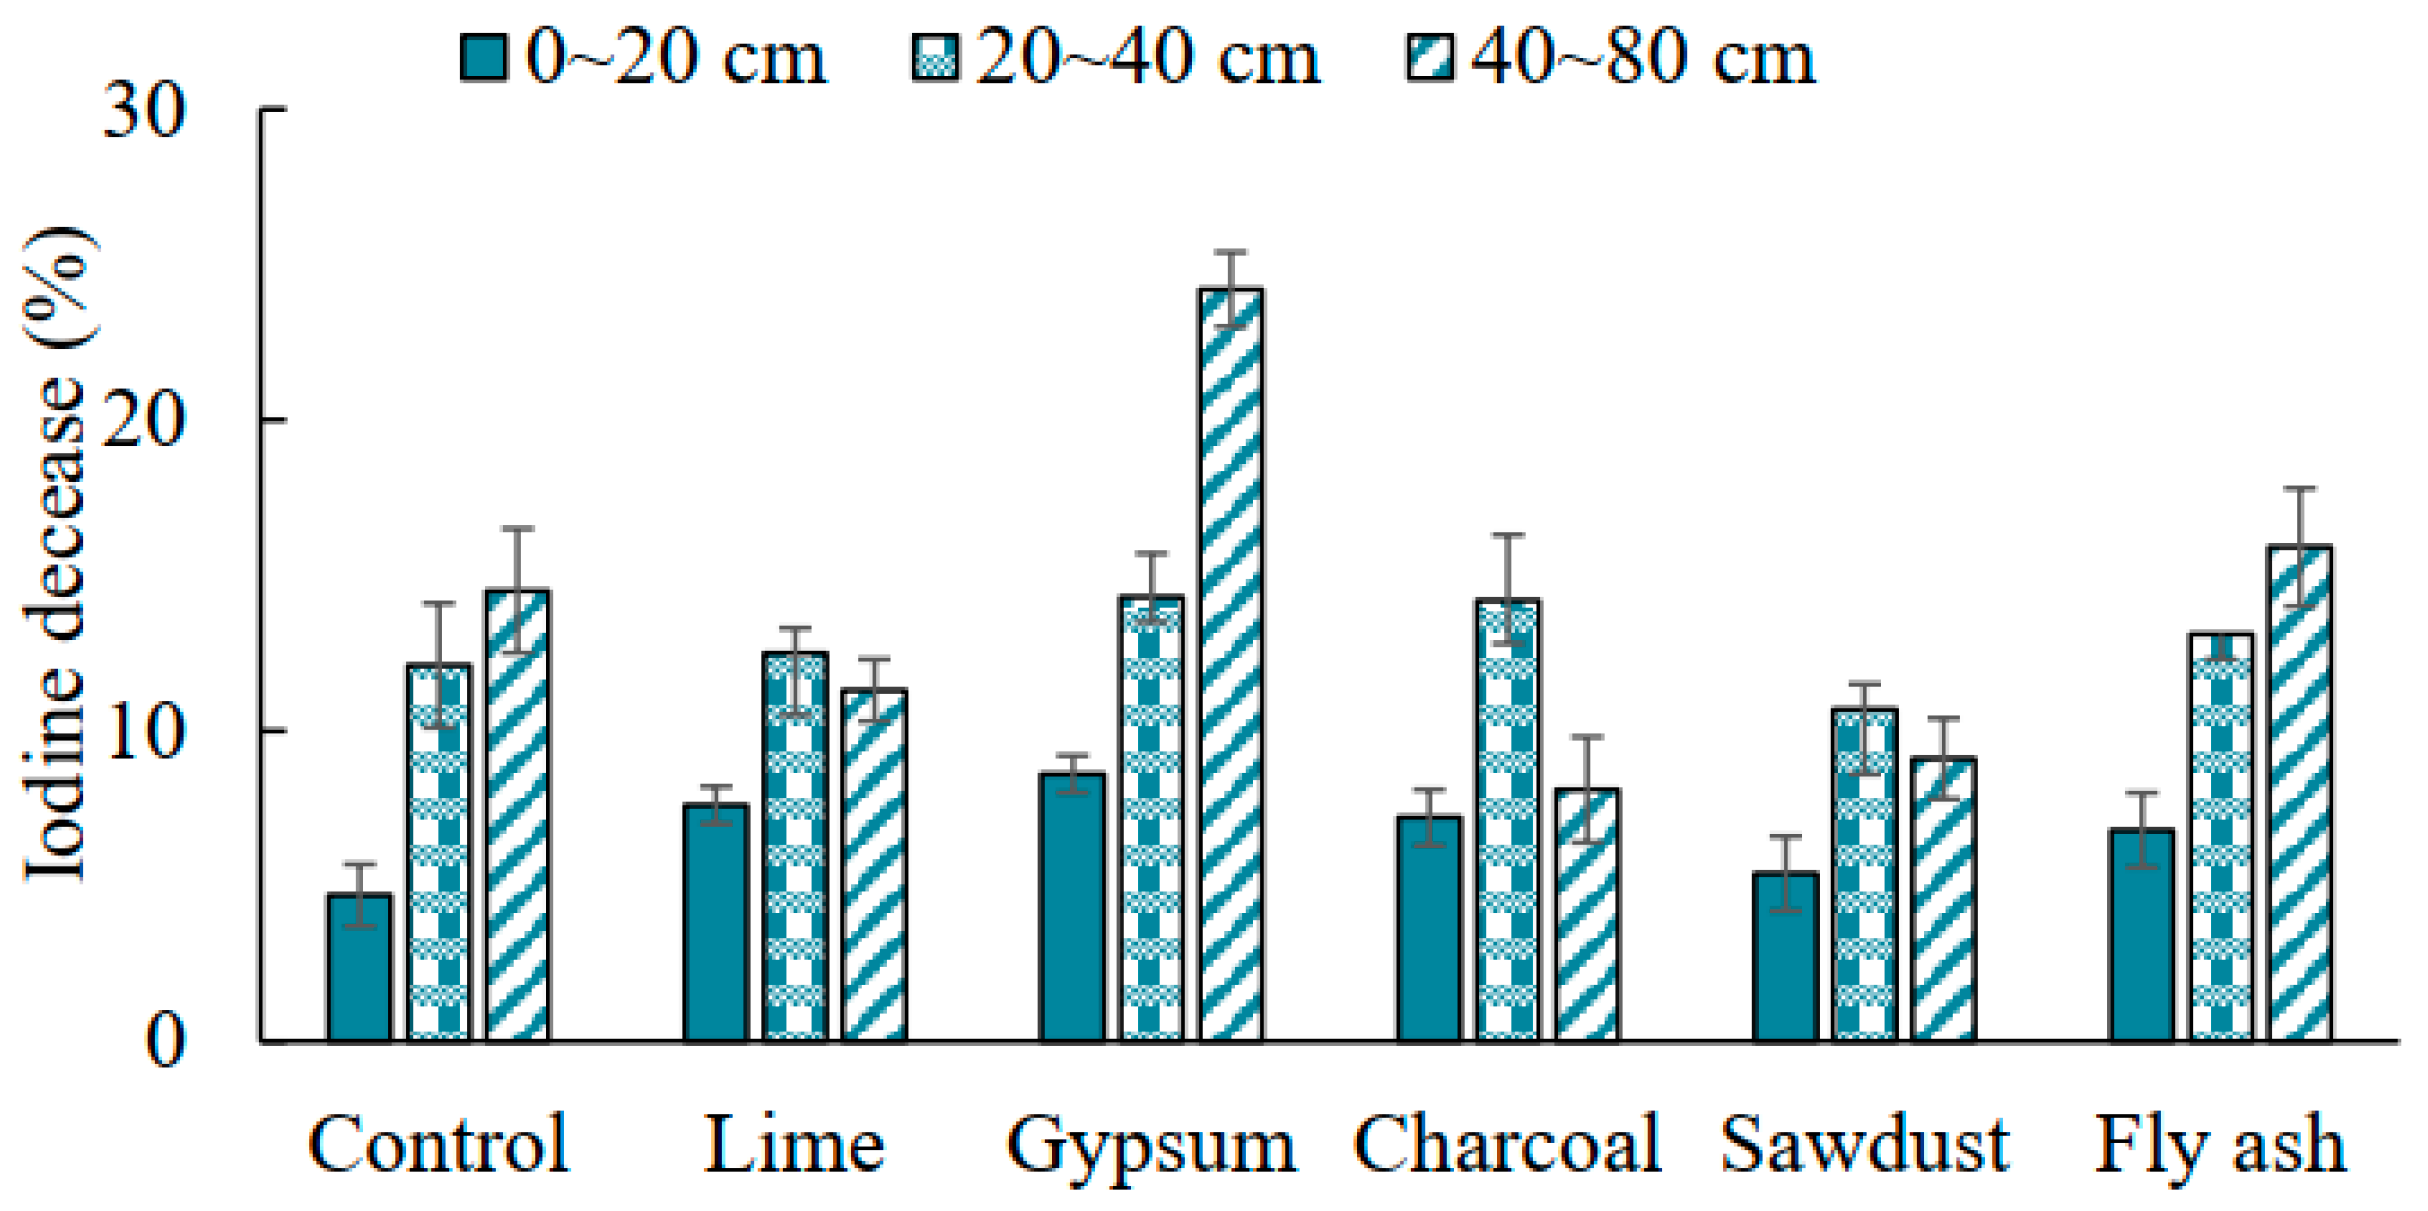
3. Results and Discussion

3.1. Calibration of HYDRUS 1D Model

Mixing of soils with selected amendment can alter the amount of iodine in the adsorbed and solution phase of iodine. Results obtained from the experiment were used to calibrate and validate the HYDRUS-1D model. In the HYDRUS 1D model, calibration was initially performed to obtain results near to the measured values while maintaining the mass balance error below 1%. Calibration was carried out using the saturated hydraulic conductivity and adsorption as these parameters were considered sensitive. These parameters were manually calibrated and resulted in simulated values near to the measured values of the iodine leached during the experiment. The best fitted value for hydraulic conductivity and adsorption was selected for the iodine leaching. Iodine adsorption was determined by using Freundlich isotherm parameters. While the HYDRUS 1D model assumed total column drainage from the top to the bottom in 10 h, the actual experimental data showed that drainage time varied between 8 and 10 h, before columns were totally drained.
The listed soil parameters (Table 1) were used in the HYDRUS 1D model, and the remaining unknown parameters were set to the default values. Reactive parameters of the HYDRUS 1D model were determined via the Freundlich equation for all soil samples (amended and unamended). The R2 values for all soil samples are given in Table 2. Iodine adsorption was effectively described by the Freundlich isotherm for all soil samples. The control soil retained the lowest amount of iodine. In comparison to the control, soil amendments either decreased or increased the residual iodine concentration depending on the specific amendment added. For example, residual iodine concentrations increased when soils were amended with charcoal, fly ash, and sawdust, but decreased when soils were amended with gypsum and lime (Table 3). Furthermore, soils rich in organic matter had higher affinities for iodide. Therefore, soil organic matter plays an important role in controlling iodine availability and iodide is easily retained in soil by the application of organic matter [23].

3.2. Solute Movement

Model performance was evaluated and validated via comparison of measured and simulated values (Figure 1 and Figure 2).
The outflow experimental values were used for the validation of the water flow in the HYDRUS 1D model. In general, the HYDRUS-1D model predicted iodine transport well with good agreement between simulated and observed results. However, there were also some over estimations of gross properties. For example, the HYDRUS 1D model predicted on average 12.9% more iodine in the water outflow than the iodine concentration measured (Table 3). The simulated outflows exceeded the measured values. For the control soil column, the predicted outflow was only 8.9% higher than the observed flow whereas outflow over estimation in amended soil columns was lime (18.9%) > charcoal (16.3%) > gypsum (15.6%) > fly ash (10.3%) > sawdust (7.6%). The differences between simulated and experimental values may result from the assumption of uniform soil physical properties made by the HYDRUS 1D. With the addition of amendments, especially charcoal, fly ash, and sawdust it is likely that the physical conditions of the parent soil are altered. Among all soil columns, the simulated iodine adsorption was 11.2% less than the actual adsorption. This was due to the greater observed outflow of iodine in the leachate. The amended soil columns exhibited a reduced iodine adsorption compared to the measured values.
Figure 2 compares the observed and simulated residual soil concentrations of iodine. Calibration was done manually, and these values were used in the model simulations. As expected, simulated concentrations tended to decrease with depth, while observed values were occasionally higher at a shallower depth than at a deeper depth (Figure 3). For instance, iodine adsorption was lower at a depth of 0–20 cm compared to a depth of 20–40 cm. This was probably due to the variation in the soil profile and by-pass preferential flow, which the model did not simulate. Pang et al. [10] simulated the picloram, atrazine, and simazine leaching through two New Zealand soils and into groundwater using HYDRUS and reported that simulated values in some areas of a soil could be two times lower than observed, whereas in other soils resulted 16 times higher than observed values in the field experiments. Predictions were of the same magnitude as the field observations at shallow soil depths and early in the trial, but at greater depths and later times, there were major differences in simulated concentrations. During the field trials, the highest iodine retention was found in the surface layers of the sawdust and decreased in the order of sawdust > fly ash > charcoal. The iodine retention in soil could be attributed to the physicochemical changes induced by an applied amendment. The HYDRUS 1D model predicted the alike pattern of iodine retention in soil. A similar phenomenon was also observed for the retention of chlorotoluron in the field [24].
Figure 3 and Figure 4 also indicated that there was a higher water flow in the experimental column than predicted value by the model. Higher saturated hydraulic conductivity led to a higher pore water velocity, less dispersion of solutes into the soil matrix, and increased chance of preferential flow occurring [25]. Kodešová et al. [9] reported that clay accumulation controls water and solute transport between the macro- pores and pores of the matrix structure. The highest iodine retention was seen in the column amended with sawdust, charcoal, and fly ash. It means that these amendments reduced the outflow of the iodine when compared to the lime and gypsum as these minerals possess low solubility and neutral charge. This could be attributed to the affected pore fraction of the soil after amendments with sawdust, charcoal, and fly ash.
The Hydrus model underpredicted iodine retention in some of the soil profiles (Table 3). For example, simulated values for the top layer (0–20 cm) of the control column showed a 4.7% decrease in the iodine retention (Figure 3). Simulated values for iodine retention in the amended columns also showed a decreasing trend in the order of gypsum (8.6%) > lime (7.6%) > charcoal (7.2%) > fly ash (6.8%) > saw dust (5.4%). Compared to all soil columns, simulated values for lower soil profiles (20–40 cm) predicted lower retention capability than the experimental values (Figure 3). This implied an influence of heterogeneity and preferential flow in soils of the amended soil than control. This can also be observed from the solute leaching curves (Figure 2 and Figure 3). Non-equilibrium adsorption model might generate better predictions for a system with significant heterogeneity and preferential flow [26].

3.3. Model Efficiency Parameters

Table 4 shows the model efficiency parameters. The HYDRUS model predicted greater outflow than experimental observation. This difference may be due to the model not considering preferential column flow. Preferential flow was thought to have been considerably effective [27] when studying phosphate movement in PVC columns. A similar situation occurred in the current experiment where outflow of iodine along the wall of PVC column may be leached, hence a less adsorption of iodine in the soil was shown by the HYDRUS model. In addition, macropores may develop during vertical distribution of iodine and hence resulted in less adsorption of iodine in the top layers of the column. The EF values of all columns, except the charcoal amended one, showed good model efficiencies despite the simulated adsorption being lower for observed in the upper soil layer (0–20 cm) compared to the lower soil profile. This study confirms that the iodine leaching via soils can be predicted using HYDRUS 1D model.

3.4. Iodine Retention in Soil

Compared to the un-amended control soil; all amendments reduced the iodine loss via leaching column. Iodine leaching varied with the nature of the amendment material. The iodine was mainly distributed over the surface soil and the contents decreased progressively with the soil depth. Iodine retention was highest after amendment with sawdust (57 ug/kg1), followed by the charcoal (42 ug/kg1) and fly ash (41 ug/kg1). Both lime and gypsum showed the poor retention capacity i.e., 31 and 37 ug/kg1, respectively in the top layer of the soil column (Table 3). The leaching of iodine from the lower layers, 20–40 cm and 40–80 cm, was reduced by the application of amendments. Irrespective of the soil layer, iodine retention among the soil amendments decreased in the order sawdust > charcoal > fly ash > gypsum > lime > control.
Iodine retention in the soil could be associated with an induced decrease in the pH of the soil solution. Amendment of the soil with sawdust, charcoal, and fly ash reduced the soil pH and thus increased the retention of soil iodine. The pH of the lower soil profile also decreased due to the addition of sawdust, charcoal, and fly ash (Table 3). However, in contrast, both lime and gypsum increased the soil pH and hence resulted in the poor iodine retention. This reduction in the outflow of iodine was associated with the occurrence of physicochemical changes in the soil via soil amendment. Irshad et al. [28] previously reported that the leaching of nitrate from sandy soils was reduced after application of soil amendments and that nitrate retention in the soil varied with the amendment material in the order of manure > charcoal > wood ash > sawdust. Higher pH generally has a negative effect on the adsorption of iodide in soil, and iodide adsorption in soil increased with the decreasing pH [29,30]. Positive charge can adsorb anions including iodide under acidic condition. It has also been reported that soil properties like cation exchange capacity, organic matter, and clay minerals contents affected I adsorption and bioavailability [31,32]. Globally, land use and landcover changes are affecting soil characteristics and hydrological regimes [33,34], affecting the nutrients dynamics (macro and micronutrients). Thus, the use of appropriate amendments coupled with modelling software can improve the management of nutrients in soil.

4. Conclusions

This research focused on the estimation of iodine retention by soil using different amendments. There is a need for technological tools that may predict iodine movement in the soil–water system for the enhancement of iodine retention in soils. The performance of the HYDRUS-1D model was tested by simulating iodine transport and variably saturated water flow in the fine-textured soils. The results showed that higher iodine was accumulated in the top (0–20 cm) of the columns. Predictions from the HYDRUS-1D model, for simulating iodine transport were in good agreement with the observed values, except toward the end of the experiment where the model under-predicted iodine sorption and over-predicted iodine transport. The reasons causing the discrepancies between the simulated and measured results are unclear. It can be concluded that studying iodine transport via soil columns under controlled environment would predict iodine behavior in the soil adequately. This would help to assess the capability of the HYDRUS-1D model in simulating iodine transport in soil and water.

Author Contributions

M.M., J.A., M.K.L., M.I., M.W. and Z.H. contributed most to the manuscript in terms of experimental setup, methodological development, HYDRUS 1 D model setup, calibration and manuscript writing. M.I., Z.H. and M.K.L. contributed to results verification and proof reading. M.I., M.K.L., J.A. and M.W. did the manuscript final review. All authors have read and agreed to the published version of the manuscript.

Funding

The APC was funded by the Open Access Department, University of Rostock.

Informed Consent Statement

Not applicable.

Acknowledgments

The authors are thankful to the Open Access Department, University of Rostock, for their willingness to pay the article processing charges. The authors also gratefully acknowledge the improvement of this paper by Gary Owens, University of South Australia.

Conflicts of Interest

The authors declare no conflict of interest.

References

  1. Inobeme, A.; Adetunji, C.O.; Akram, M.; Munirat, M.; Laila, U.; Okonkwo, S.; Islam, S.; Inobeme, J. Benefits of Geochemistry and Its Impact on Human Health. Geochem. Concepts Appl. 2021, 23–35. [Google Scholar] [CrossRef]
  2. Zimmermann, M.B.; Jooste, P.L.; Pandav, C.S. Iodine-deficiency disorders. Lancet 2008, 372, 1251–1262. [Google Scholar] [CrossRef]
  3. Andersson, M.; de Benoist, B.; Rogers, L. Epidemiology of iodine deficiency: Salt iodisation and iodine status. Best Pract. Res. Clin. Endocrinol. Metab. 2010, 24, 1–11. [Google Scholar] [CrossRef]
  4. Hetzel, B.S. Towards the global elimination of brain damage due to iodine deficiency-the role of the International Council for Control of Iodine Deficiency Disorders. Int. J. Epidemiol. 2005, 34, 762–764. [Google Scholar] [CrossRef] [PubMed]
  5. Faško, P.; Lapin, M.; Pecho, J. 20-year extraordinary climatic period in Slovakia. Meteorol. Časopis 2008, 11, 99–105. [Google Scholar]
  6. Muramatsu, Y.; Wedepohl, K.H. The distribution of iodine in the earth’s crust. Chem. Geol. 1998, 147, 201–216. [Google Scholar] [CrossRef]
  7. Hou, X.; Hansen, V.; Aldahan, A.; Possnert, G.; Lind, O.C.; Lujaniene, G. A review on speciation of iodine-129 in the environmental and biological samples. Anal. Chim. Acta 2009, 632, 181–196. [Google Scholar] [CrossRef] [PubMed] [Green Version]
  8. Hassanien, M.H.; Hussein, L.A.; Robinson, E.N.; Mercer, L.P. Human iodine requirements determined by the saturation kinetics model. J. Nutr. Biochem. 2003, 14, 280–287. [Google Scholar] [CrossRef]
  9. Kodešová, R.; Vignozzi, N.; Rohošková, M.; Hájková, T.; Kočárek, M.; Pagliai, M.; Kozák, J.; Šimůnek, J. Impact of varying soil structure on transport processes in different diagnostic horizons of three soil types. J. Contam. Hydrol. 2009, 104, 107–125. [Google Scholar] [CrossRef]
  10. Pang, L.; Close, M.E.; Watt, J.P.; Vincent, K.W. Simulation of picloram, atrazine, and simazine leaching through two New Zealand soils and into groundwater using HYDRUS-2D. J. Contam. Hydrol. 2000, 44, 19–46. [Google Scholar] [CrossRef]
  11. Phillips, I. Modelling water and chemical transport in large undisturbed soil cores using HYDRUS-2D. Soil Res. 2006, 44, 27–34. [Google Scholar] [CrossRef]
  12. Ma, Y.; Feng, S.; Su, D.; Gao, G.; Huo, Z. Modeling water infiltration in a large layered soil column with a modified Green–Ampt model and HYDRUS-1D. Comput. Electron. Agric. 2010, 71, S40–S47. [Google Scholar] [CrossRef]
  13. Gee, G.W.; Bauder, J.; Klute, A. Methods of Soil Analysis, part 1, Physical and Mineralogical Methods; American Society of Agronomy: Madison, WI, USA, 1986. [Google Scholar]
  14. Nelson, D.; Sommers, L.E. Total Carbon, Organic Carbon, and Organic Matter. Methods of Soil Analysis: Part 2 Chemical and Microbiological Properties; American Society of Agronomy Inc.: Madison, WI, USA, 1983; pp. 539–579. [Google Scholar] [CrossRef]
  15. Kesari, R.; Rastogi, R.; Gupta, V. A simple and sensitive spectrophotometric method for the determination of iodine in environmental samples. Chem. Anal. 1998, 43, 201–207. [Google Scholar]
  16. Jha, R.K.; Sahoo, B.; Panda, R.K. Modeling the water and nitrogen transports in a soil–paddy–atmosphere system using HYDRUS-1D and lysimeter experiment. Paddy Water Environ. 2017, 15, 831–846. [Google Scholar] [CrossRef]
  17. Simunek, J.; Van Genuchten, M.T.; Sejna, M. The HYDRUS-1D software package for simulating the one-dimensional movement of water, heat, and multiple solutes in variably-saturated media. Univ. Calif. -Riverside Res. Rep. 2005, 3, 1–240. [Google Scholar]
  18. Simunek, J.; Jacques, D.; Bradford, S.A.; van Genuchten, M.T. Numerical modeling of contaminant transport using HYDRUS and its specialized modules. J. Indian Inst. Sci. 2013, 93, 265–284. [Google Scholar]
  19. Van Genuchten, M.T. A closed-form equation for predicting the hydraulic conductivity of unsaturated soils. Soil Sci. Soc. Am. J. 1980, 44, 892–898. [Google Scholar] [CrossRef] [Green Version]
  20. Mualem, Y. A new model for predicting the hydraulic conductivity of unsaturated porous media. Water Resour. Res. 1976, 12, 513–522. [Google Scholar] [CrossRef] [Green Version]
  21. Vogel, T.; Cislerova, M. On the reliability of unsaturated hydraulic conductivity calculated from the moisture retention curve. Transp. Porous Media 1988, 3, 1–15. [Google Scholar] [CrossRef]
  22. Kosugi, K.I. Lognormal distribution model for unsaturated soil hydraulic properties. Water Resour. Res. 1996, 32, 2697–2703. [Google Scholar] [CrossRef]
  23. Dai, J.; Zhang, M.; Hu, Q.; Huang, Y.; Wang, R.; Zhu, Y. Adsorption and desorption of iodine by various Chinese soils: II. Iodide and iodate. Geoderma 2009, 153, 130–135. [Google Scholar] [CrossRef]
  24. Kočárek, M.; Kodešová, R.; Kozák, J.; Drábek, O.; Vacek, O. Chlorotoluron behaviour in five different soil types. Plant Soil Environ. 2005, 51, 304–309. [Google Scholar] [CrossRef] [Green Version]
  25. Singh, P.; Kanwar, R.S. Preferential Solute Transport through Macropores in Large Undisturbed Saturated Soil Columns; Wiley Online Library: Hoboken, NJ, USA, 1991. [Google Scholar] [CrossRef]
  26. Li, Y.; Ghodrati, M. Transport of Nitrate in Soils as Affected by Earthworm Activities; Wiley Online Library: Hoboken, NJ, USA, 1995. [Google Scholar] [CrossRef]
  27. Enfield, C.G.; Phan, T.; Walters, D.M.; Ellis Jr, R. Kinetic model for phosphate transport and transformation in calcareous soils: I. Kinetics of transformation. Soil Sci. Soc. Am. J. 1981, 45, 1059–1064. [Google Scholar] [CrossRef]
  28. Irshad, M.; Waseem, A.; Umar, M.; Sabir, M.A. Leachability of nitrate from sandy soil using waste amendments. Commun. Soil Sci. Plant Anal. 2014, 45, 680–687. [Google Scholar] [CrossRef]
  29. Mohiuddin, M.; Irshad, M.; Farig, M.; Shahzad, M. Extractability of iodine from soils using different methods in relation to soil properties. Arab. J. Geosci. 2021, 14, 1–9. [Google Scholar] [CrossRef]
  30. Mohiuddin, M.; Irshad, M.; Ping, A.; Hussain, Z.; Shahzad, M. Bioavailability of iodine to mint from soil applied with selected amendments. Environ. Pollut. Bioavailab. 2019, 31, 138–144. [Google Scholar] [CrossRef] [Green Version]
  31. Yoshida, S.; Muramatsu, Y.; Uchida, S. Studies on the sorption of I−(iodide) and IO 3−(iodate) onto andosols. Water Air Soil Pollut. 1992, 63, 321–329. [Google Scholar] [CrossRef]
  32. Liu, N.; Wang, M.; Zhou, F.; Zhai, H.; Qi, M.; Liu, Y.; Li, Y.; Zhang, N.; Ma, Y.; Huang, J. Selenium bioavailability in soil-wheat system and its dominant influential factors: A field study in Shaanxi province, China. Sci. Total. Environ. 2021, 770, 144664. [Google Scholar] [CrossRef] [PubMed]
  33. Leta, M.K.; Demissie, T.A.; Tränckner, J. Hydrological Responses of Watershed to Historical and Future Land Use Land Cover Change Dynamics of Nashe Watershed, Ethiopia. Water 2021, 13, 2372. [Google Scholar] [CrossRef]
  34. Leta, M.K.; Demissie, T.A.; Tränckner, J. Modeling and Prediction of Land Use Land Cover Change Dynamics Based on Land Change Modeler (LCM) in Nashe Watershed, Upper Blue Nile Basin, Ethiopia. Sustainability 2021, 13, 3740. [Google Scholar] [CrossRef]
Figure 1. Measured, Hydrus 1D, and calibrated values of iodine in leachate from control, gypsum 27, and lime amended soils.
Sustainability 13 10967 g001aSustainability 13 10967 g001b
Figure 2. Calibrated and measured iodine retention in soil column with depth after amendment with (a) control (unamended), (b) lime, (c) gypsum, (d) charcoal, (e) sawdust, and (f) fly ash.
Sustainability 13 10967 g002aSustainability 13 10967 g002b
Figure 3. Measured, Hydrus 1D, and calibrated values of iodine in leachate from charcoal, and fly ash amended soils.
Sustainability 13 10967 g003
Figure 4. Percentage decrease in iodine retention in soil column using simulated values.
Sustainability 13 10967 g004
Table 1. Selected physicochemical properties of agricultural soil used in this study.
ParameterUnitValues
Sand%75.6
Silt%16.6
Clay%7.8
Texture-Sandy loam
Cg/kg121.6
Moisture%18.2
Iodinemg/kg10.34
Exch. Camg/kg176.3
Exch. Mgmg/kg156.7
Exch. Kmg/kg1156
Exch. Namg/kg135.6
CECmg/kg1324.6
EC (1:5)µS/m1125
pH (1:5)-7.6
Table 2. Average value of Freundlich adsorption isotherm parameters *.
Soil AmendmentK1αR2
Control1.421.710.91
Lime1.511.820.94
Gypsum1.641.980.96
Charcoal1.722.080.923
Sawdust1.822.20.912
Fly ash1.692.040.943
* K1 is the Freundlich constant, α is a shape-fitting parameter, and R2 is the coefficient of determination.
Table 3. Simulated and measured values of iodine concentrations in soil columns.
Soil AmendmentColumn 1 Calibration Column 2 Validation
Depth (cm)Experiment ValueModel ValueAbsolute Difference Experimental ValueModel ValueAbsolute Difference pH
(µg/kg1)
Control0~2094.679.2515.3592.187.74.37.48
20~4031.5247.533.429.347.5
40~8032.41913.428.724.54.17.51
Lime0~20138.211820.2148.5137.111.47.75
20~4031.513.218.233.429.24.17.79
40~8028.411.716.626.523.537.82
Gypsum0~20147.5110.537142.6130.212.37.89
20~4037.423.513.934.829.84.97.91
40~8029.81712.831.523.87.67.92
Charcoal0~20186.5173.513184.517113.47.87
20~4042.533.78.844.838.46.37.89
40~8034.525.29.332.129.52.67.85
Sawdust0~20251.221734.2258.7244.6147.15
20~4057.64413.654.348.45.87.19
40~8048.427.221.1543.539.53.97.2
Fly ash0~20184.2166.717.45180.2167.712.47.15
20~4041.329.511.837.632.64.927.18
40~8032.821.2511.5534.829.25.537.21
Table 4. Model performance measures.
Soil AmendmentParameters of Model CalibrationParameter of Model Validation
RMSEDR2MEEFRMSEDR2MEEF
Control0.570.6840.811.820.920.580.670.871.790.91
Gypsum0.820.2610.952.610.940.840.280.942.560.92
Lime0.920.2920.872.920.90.890.310.862.870.9
Charcoal0.570.1820.951.820.860.620.180.940.170.85
Sawdust0.290.0940.980.940.910.320.080.960.890.9
Fly ash0.440.1410.961.410.940.480.150.941.450.93
RMSE = root mean square error, D = deviation, R2 = coefficient of determination, ME = mean error, EF = Nash–Sutcliffe efficiency.
Publisher’s Note: MDPI stays neutral with regard to jurisdictional claims in published maps and institutional affiliations.

