
Using Phase Change Materials (PCMs) in a Hot and Humid Climate to Reduce Heat Gain and Energy Consumption

 , , ,
, , ,
Abstract
:1. Introduction
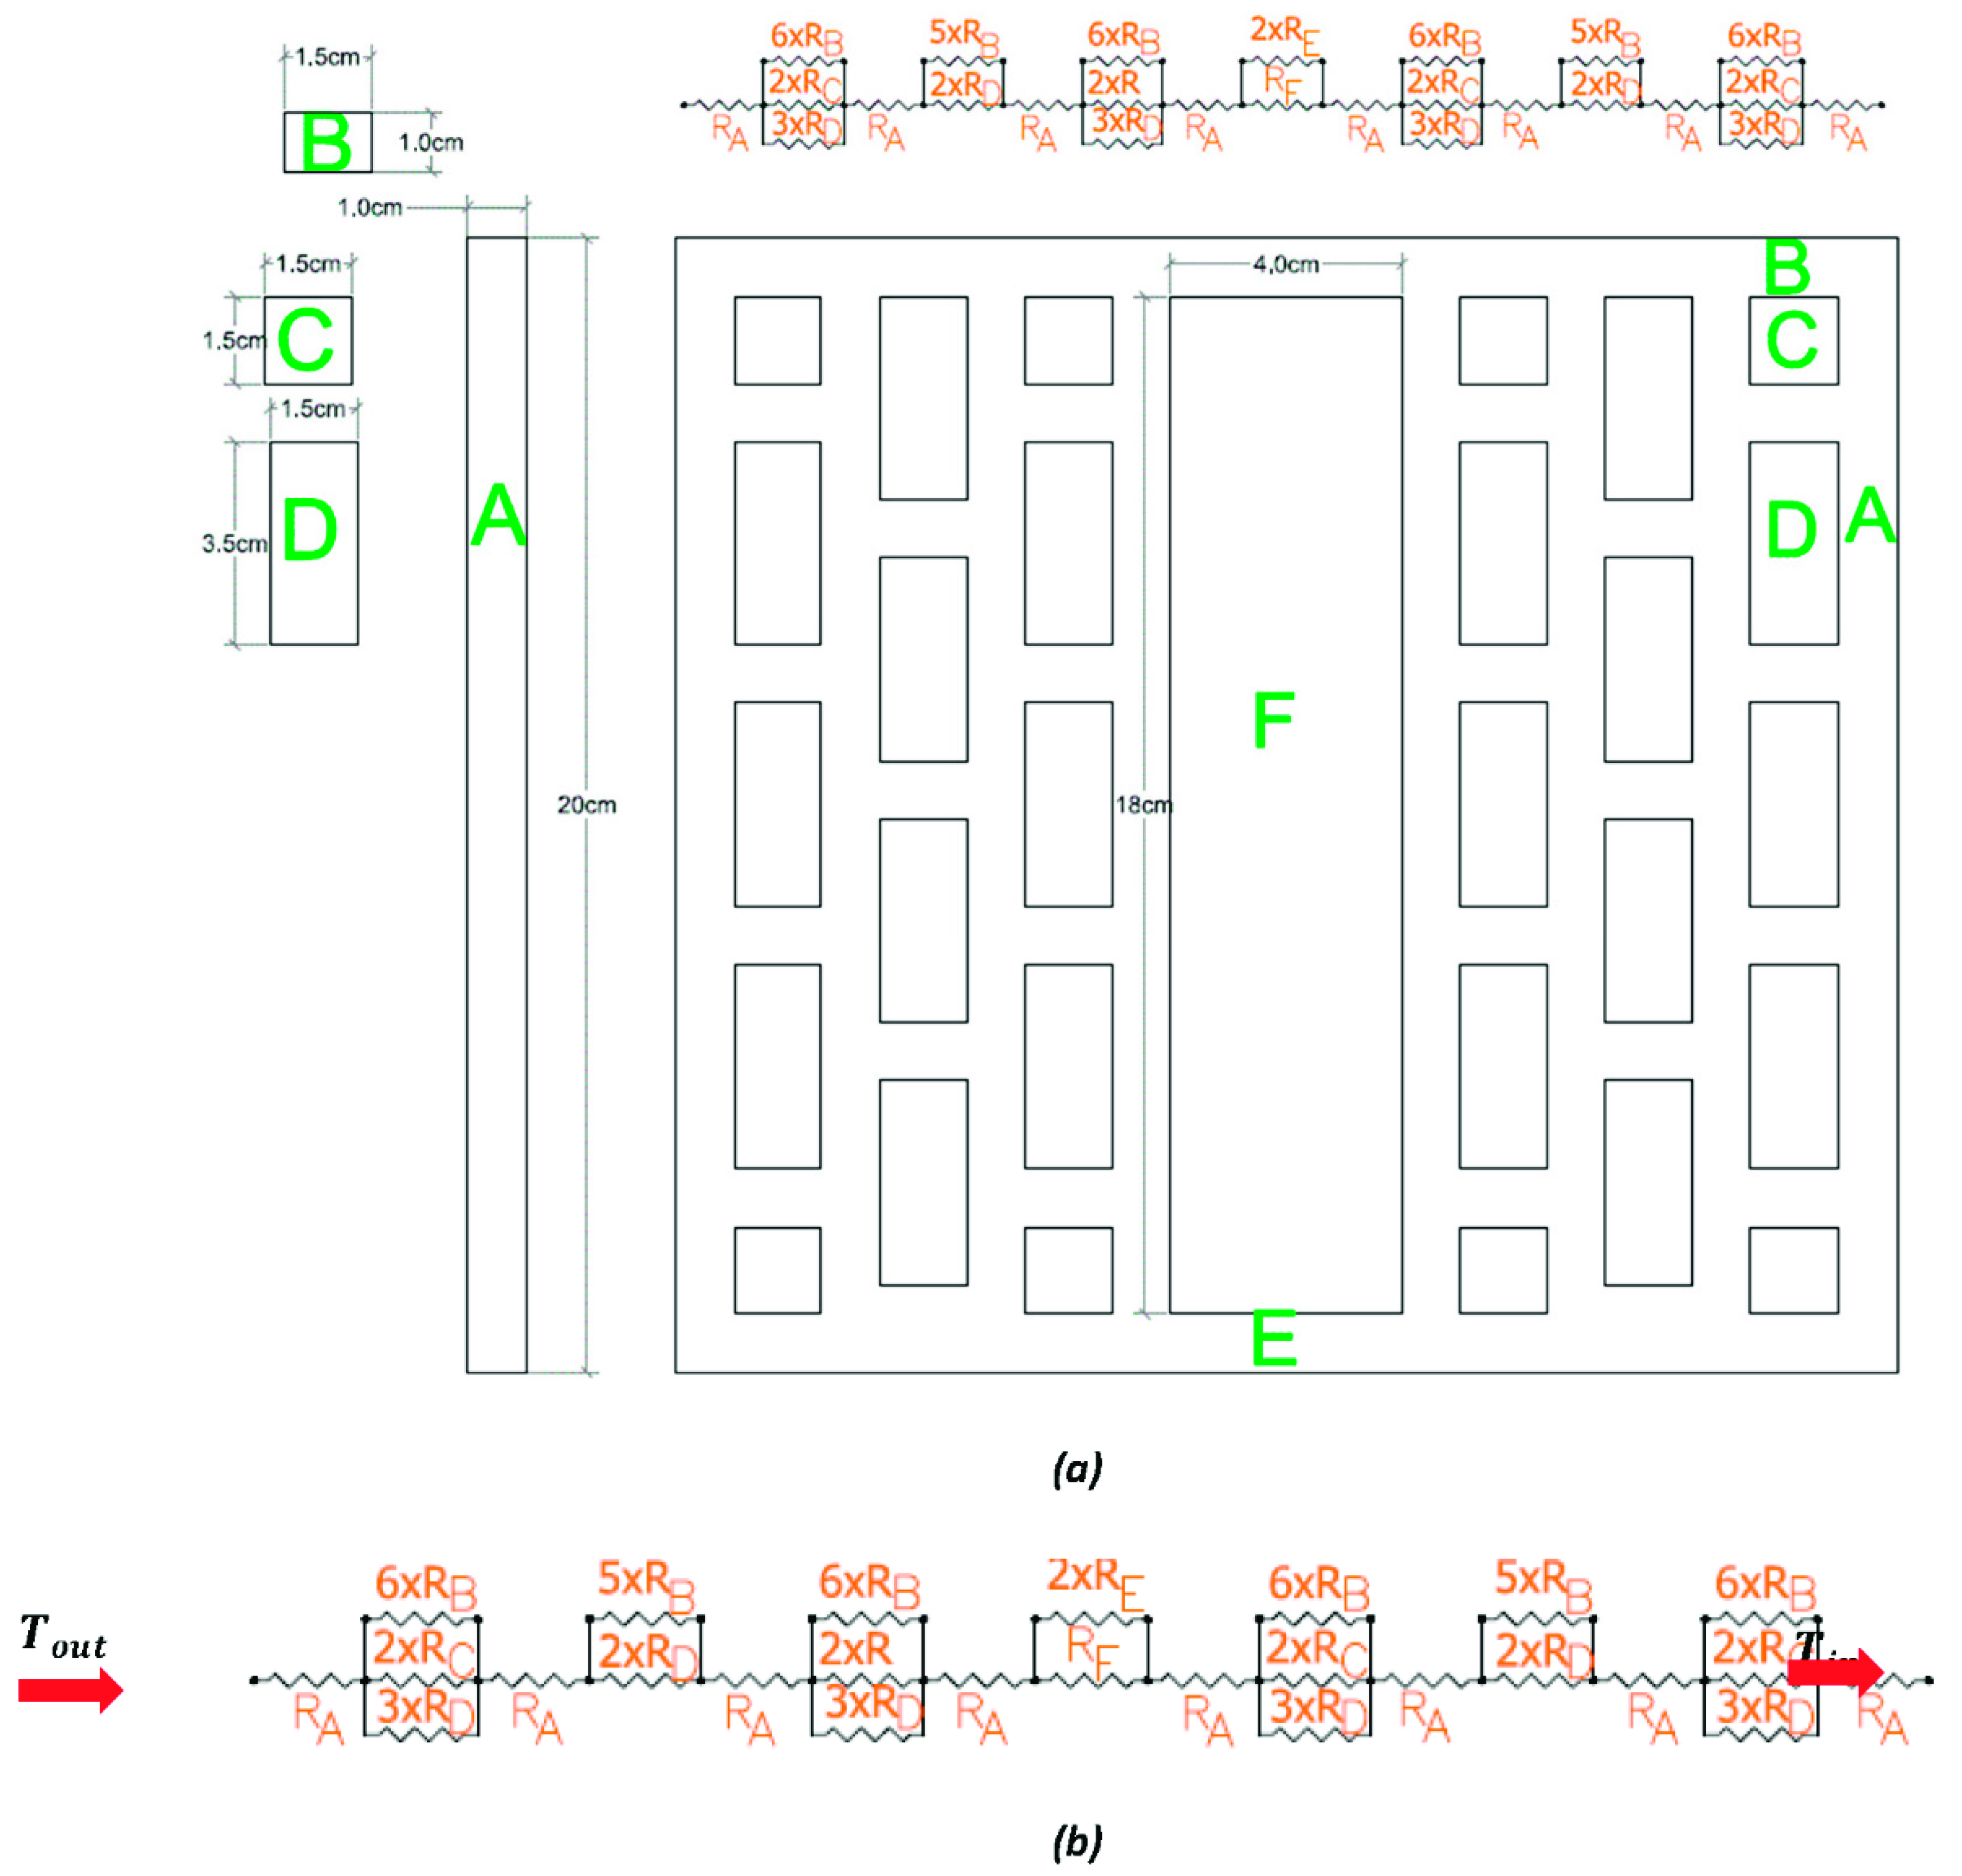
2. Theory
- The heat transfer and the airflow are one-dimensional.
- There is a steady-state heat flow.
- Heat loss from the corners and edges is neglected.
- The used material has constant properties.
- The heat transfer is only by conduction.
3. Materials and Methods
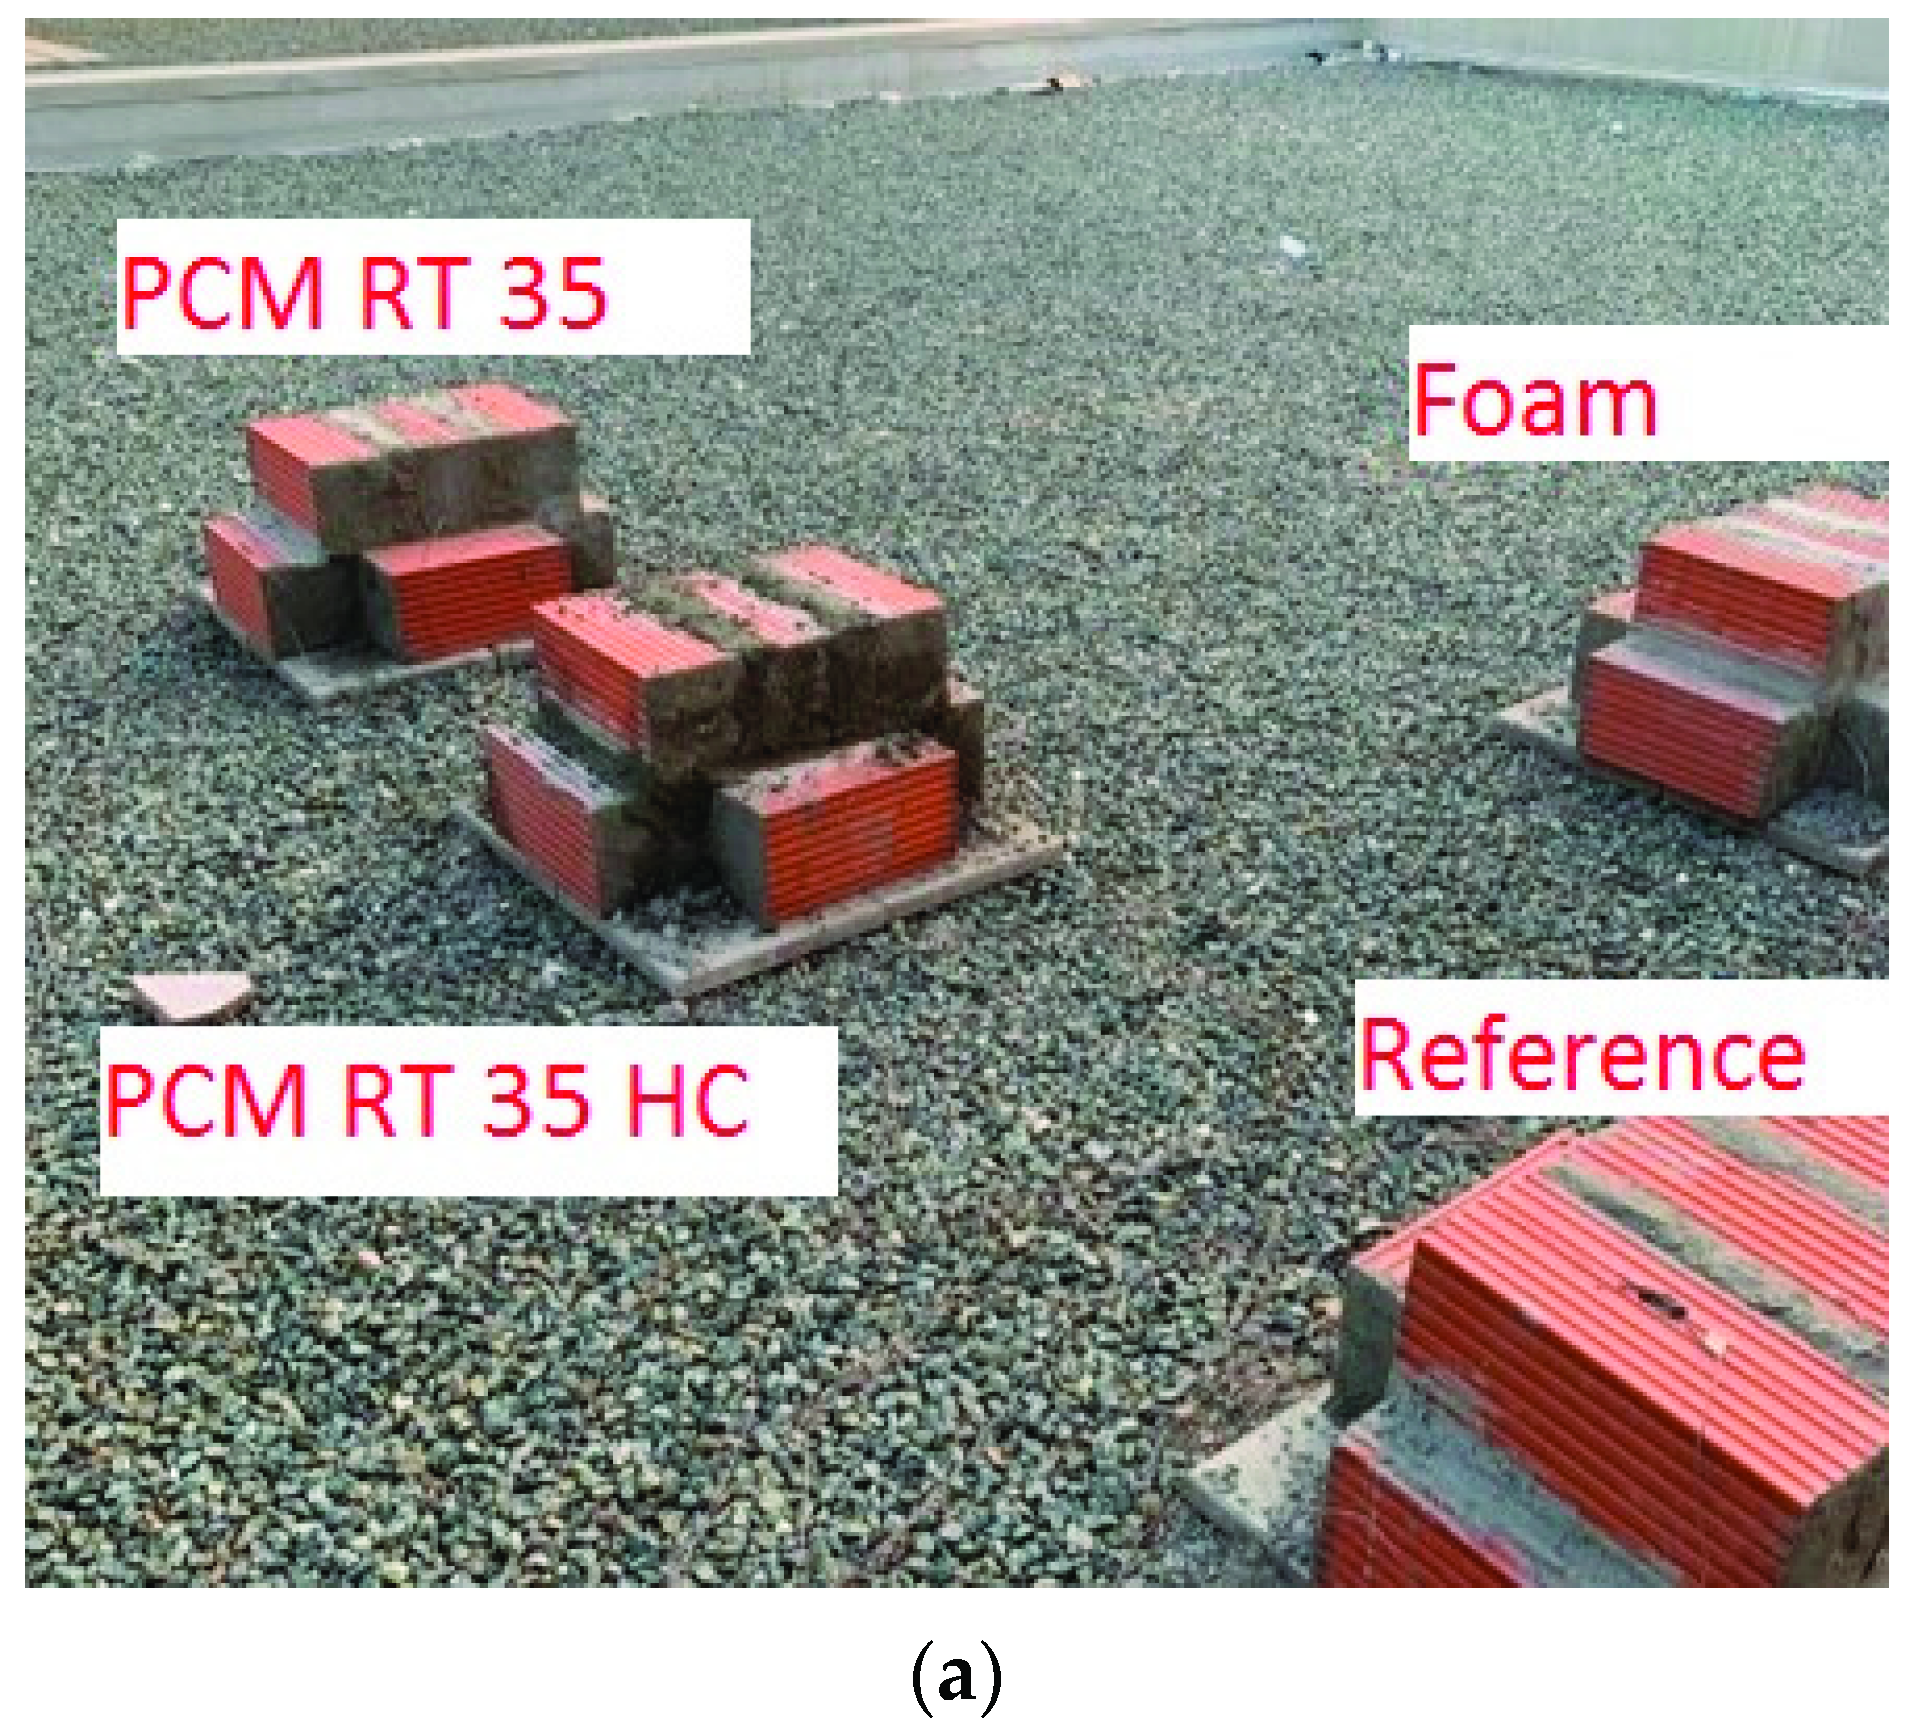
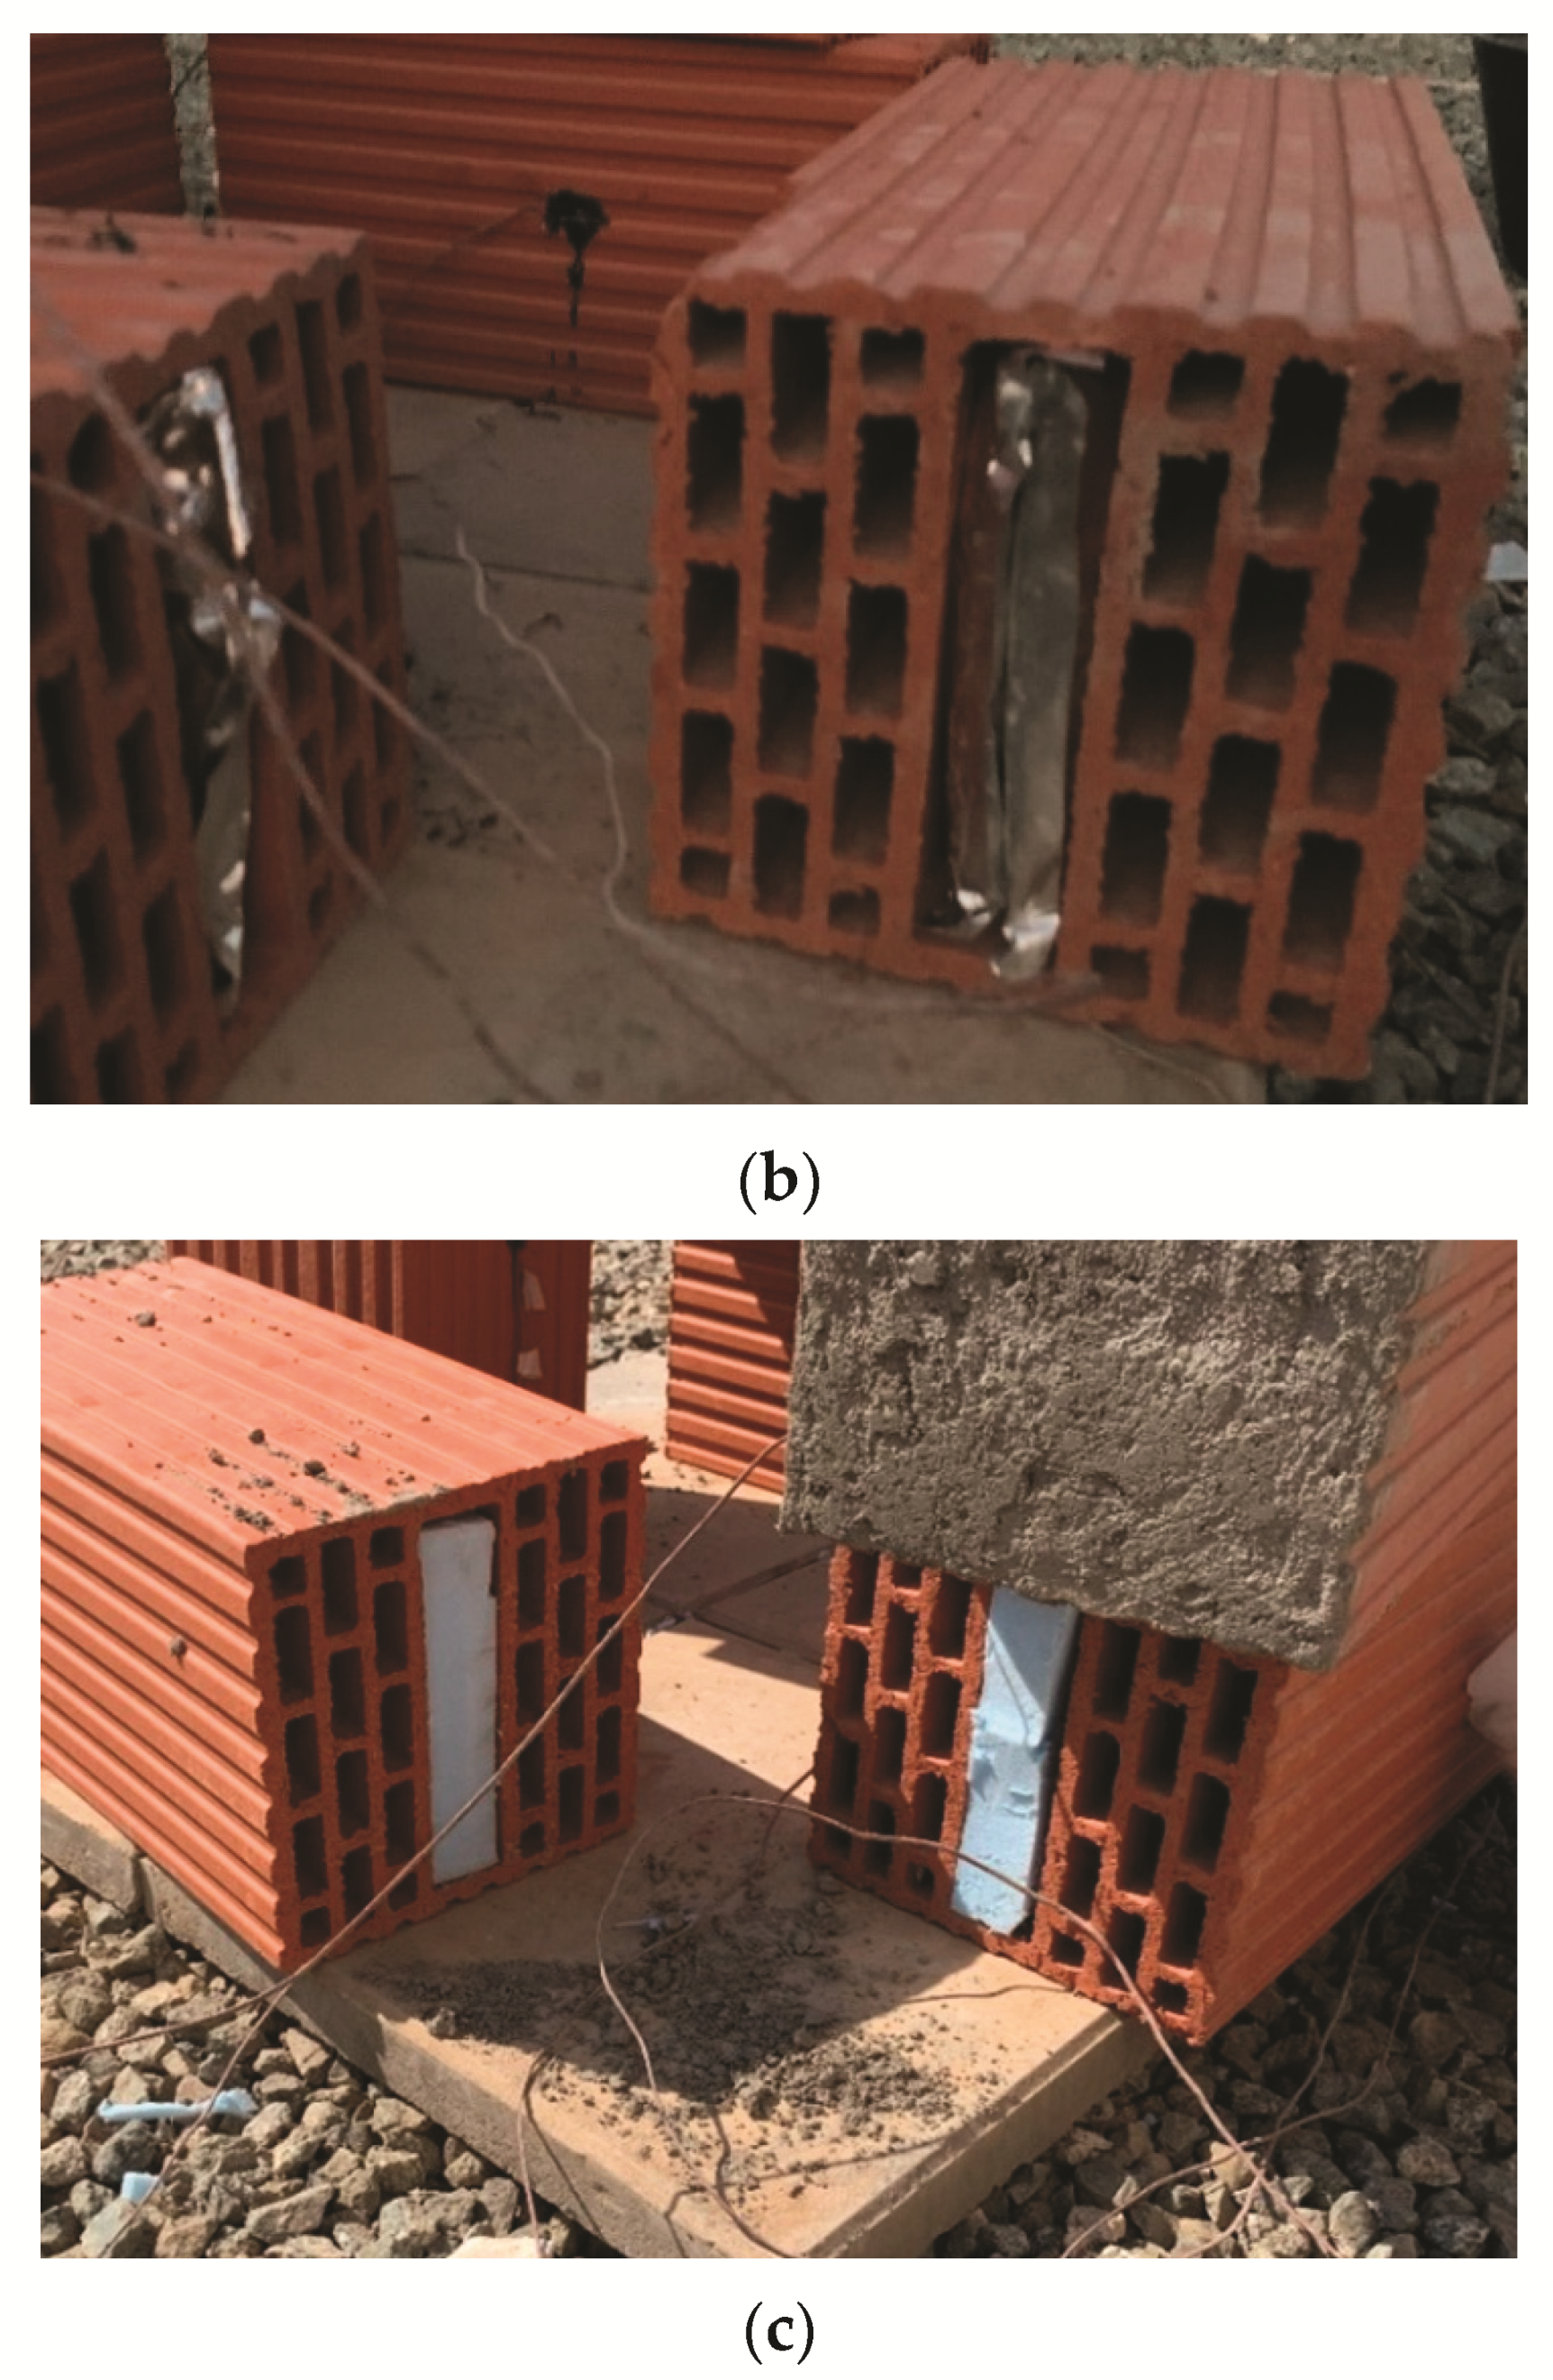
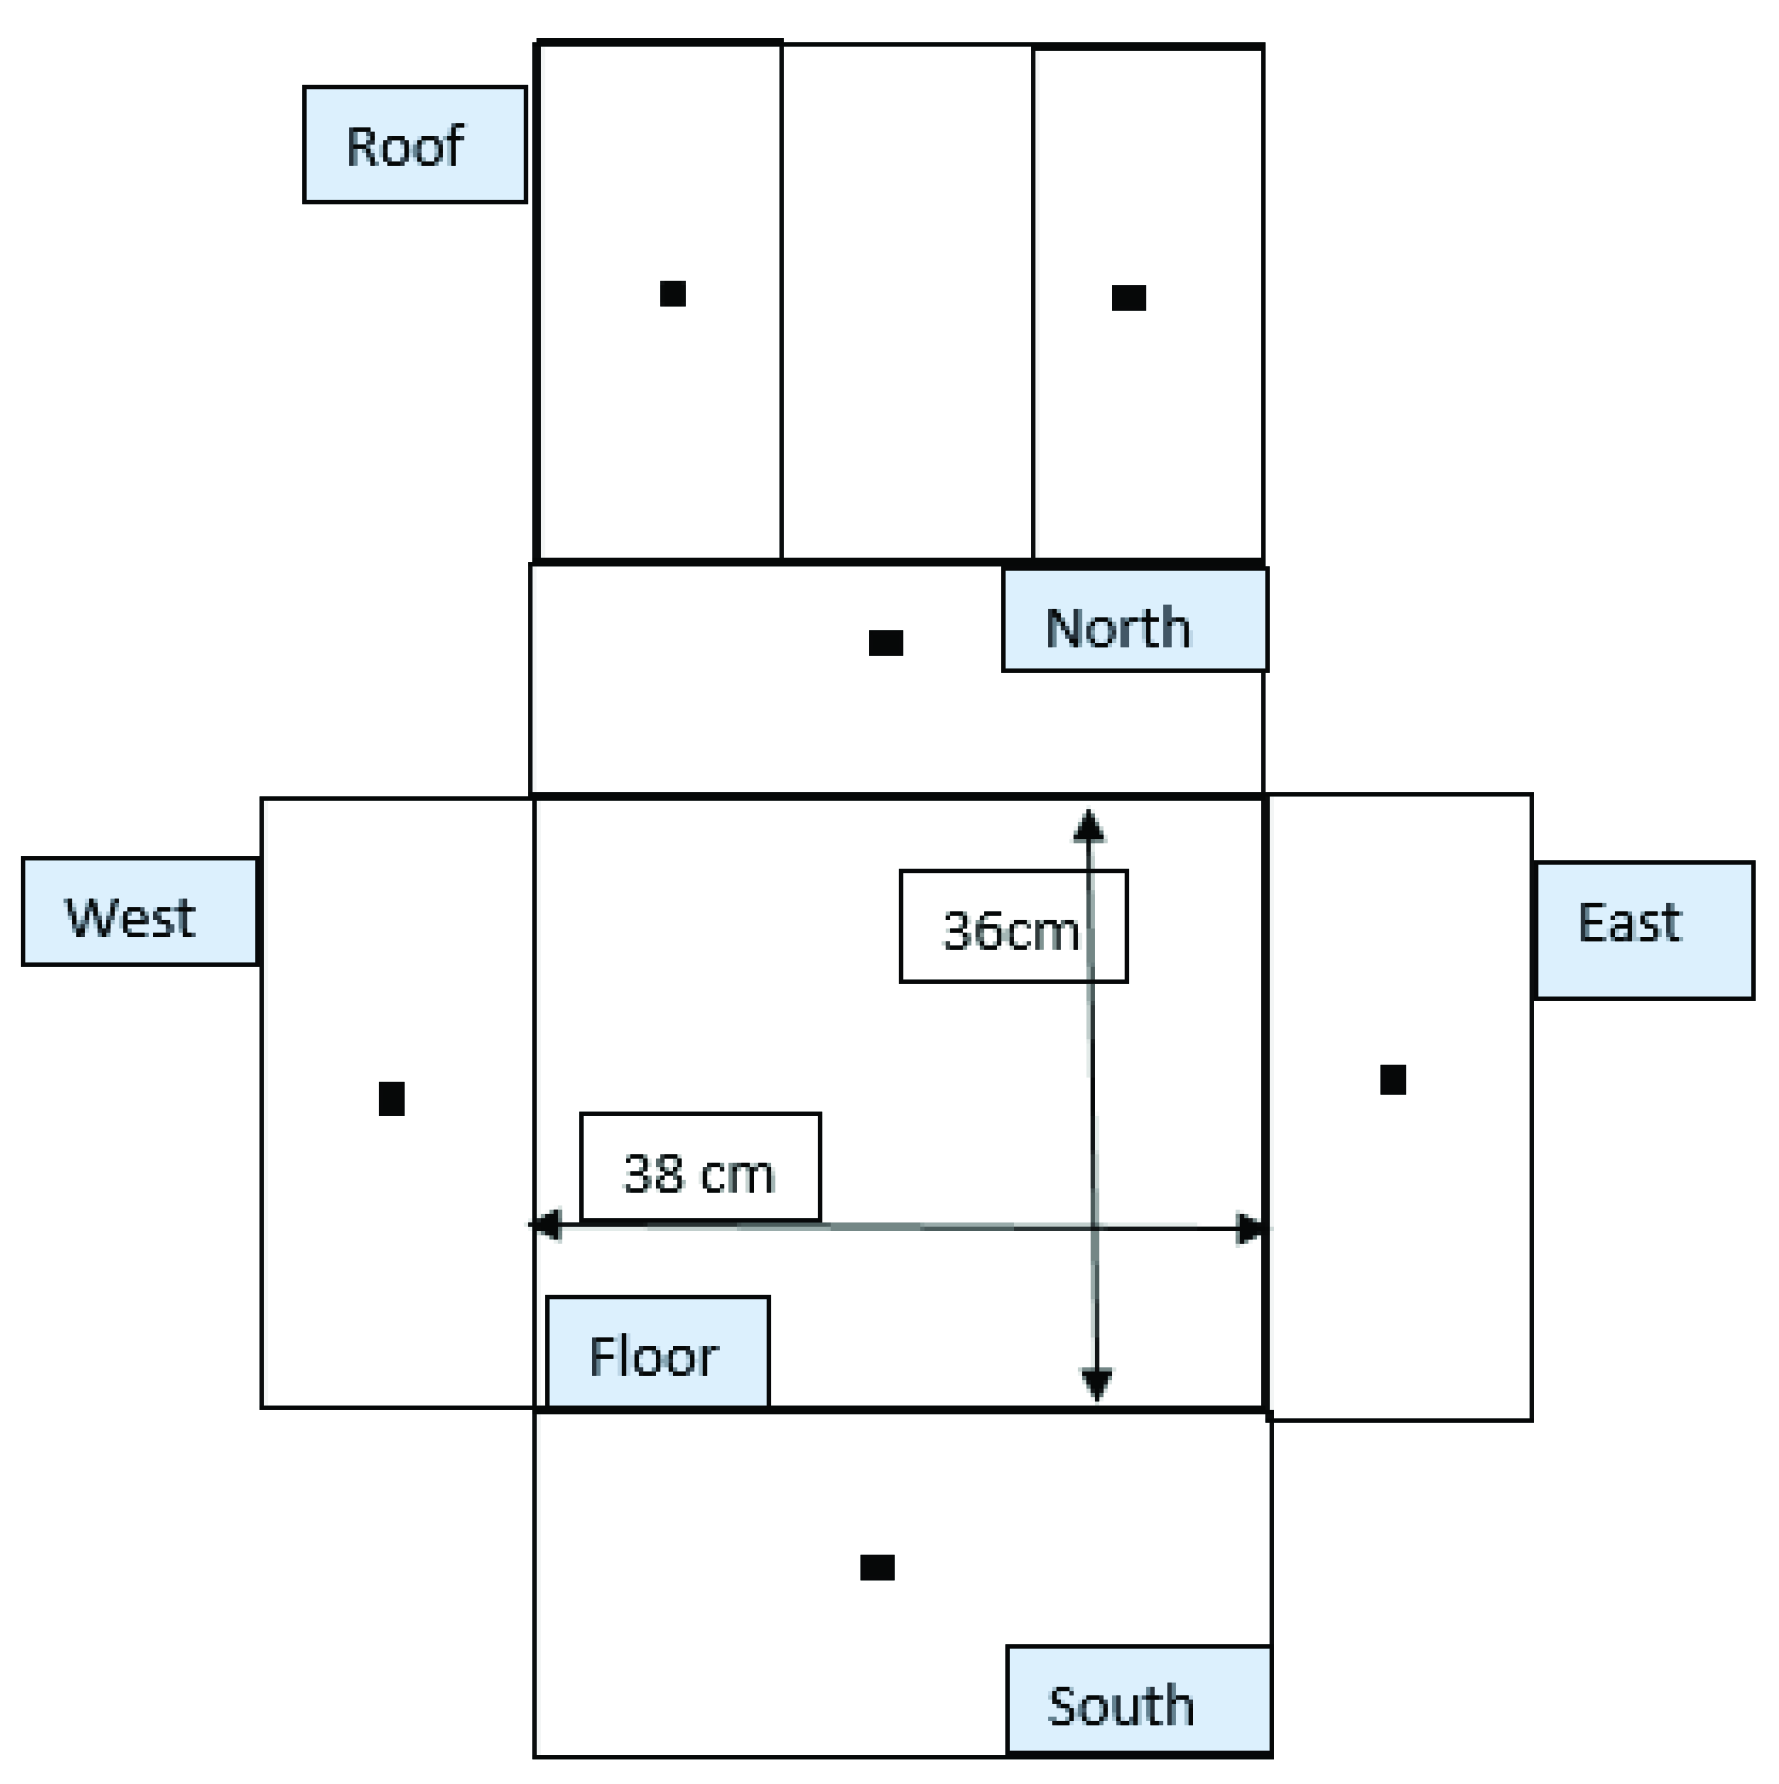
3.1. Experimental Setup
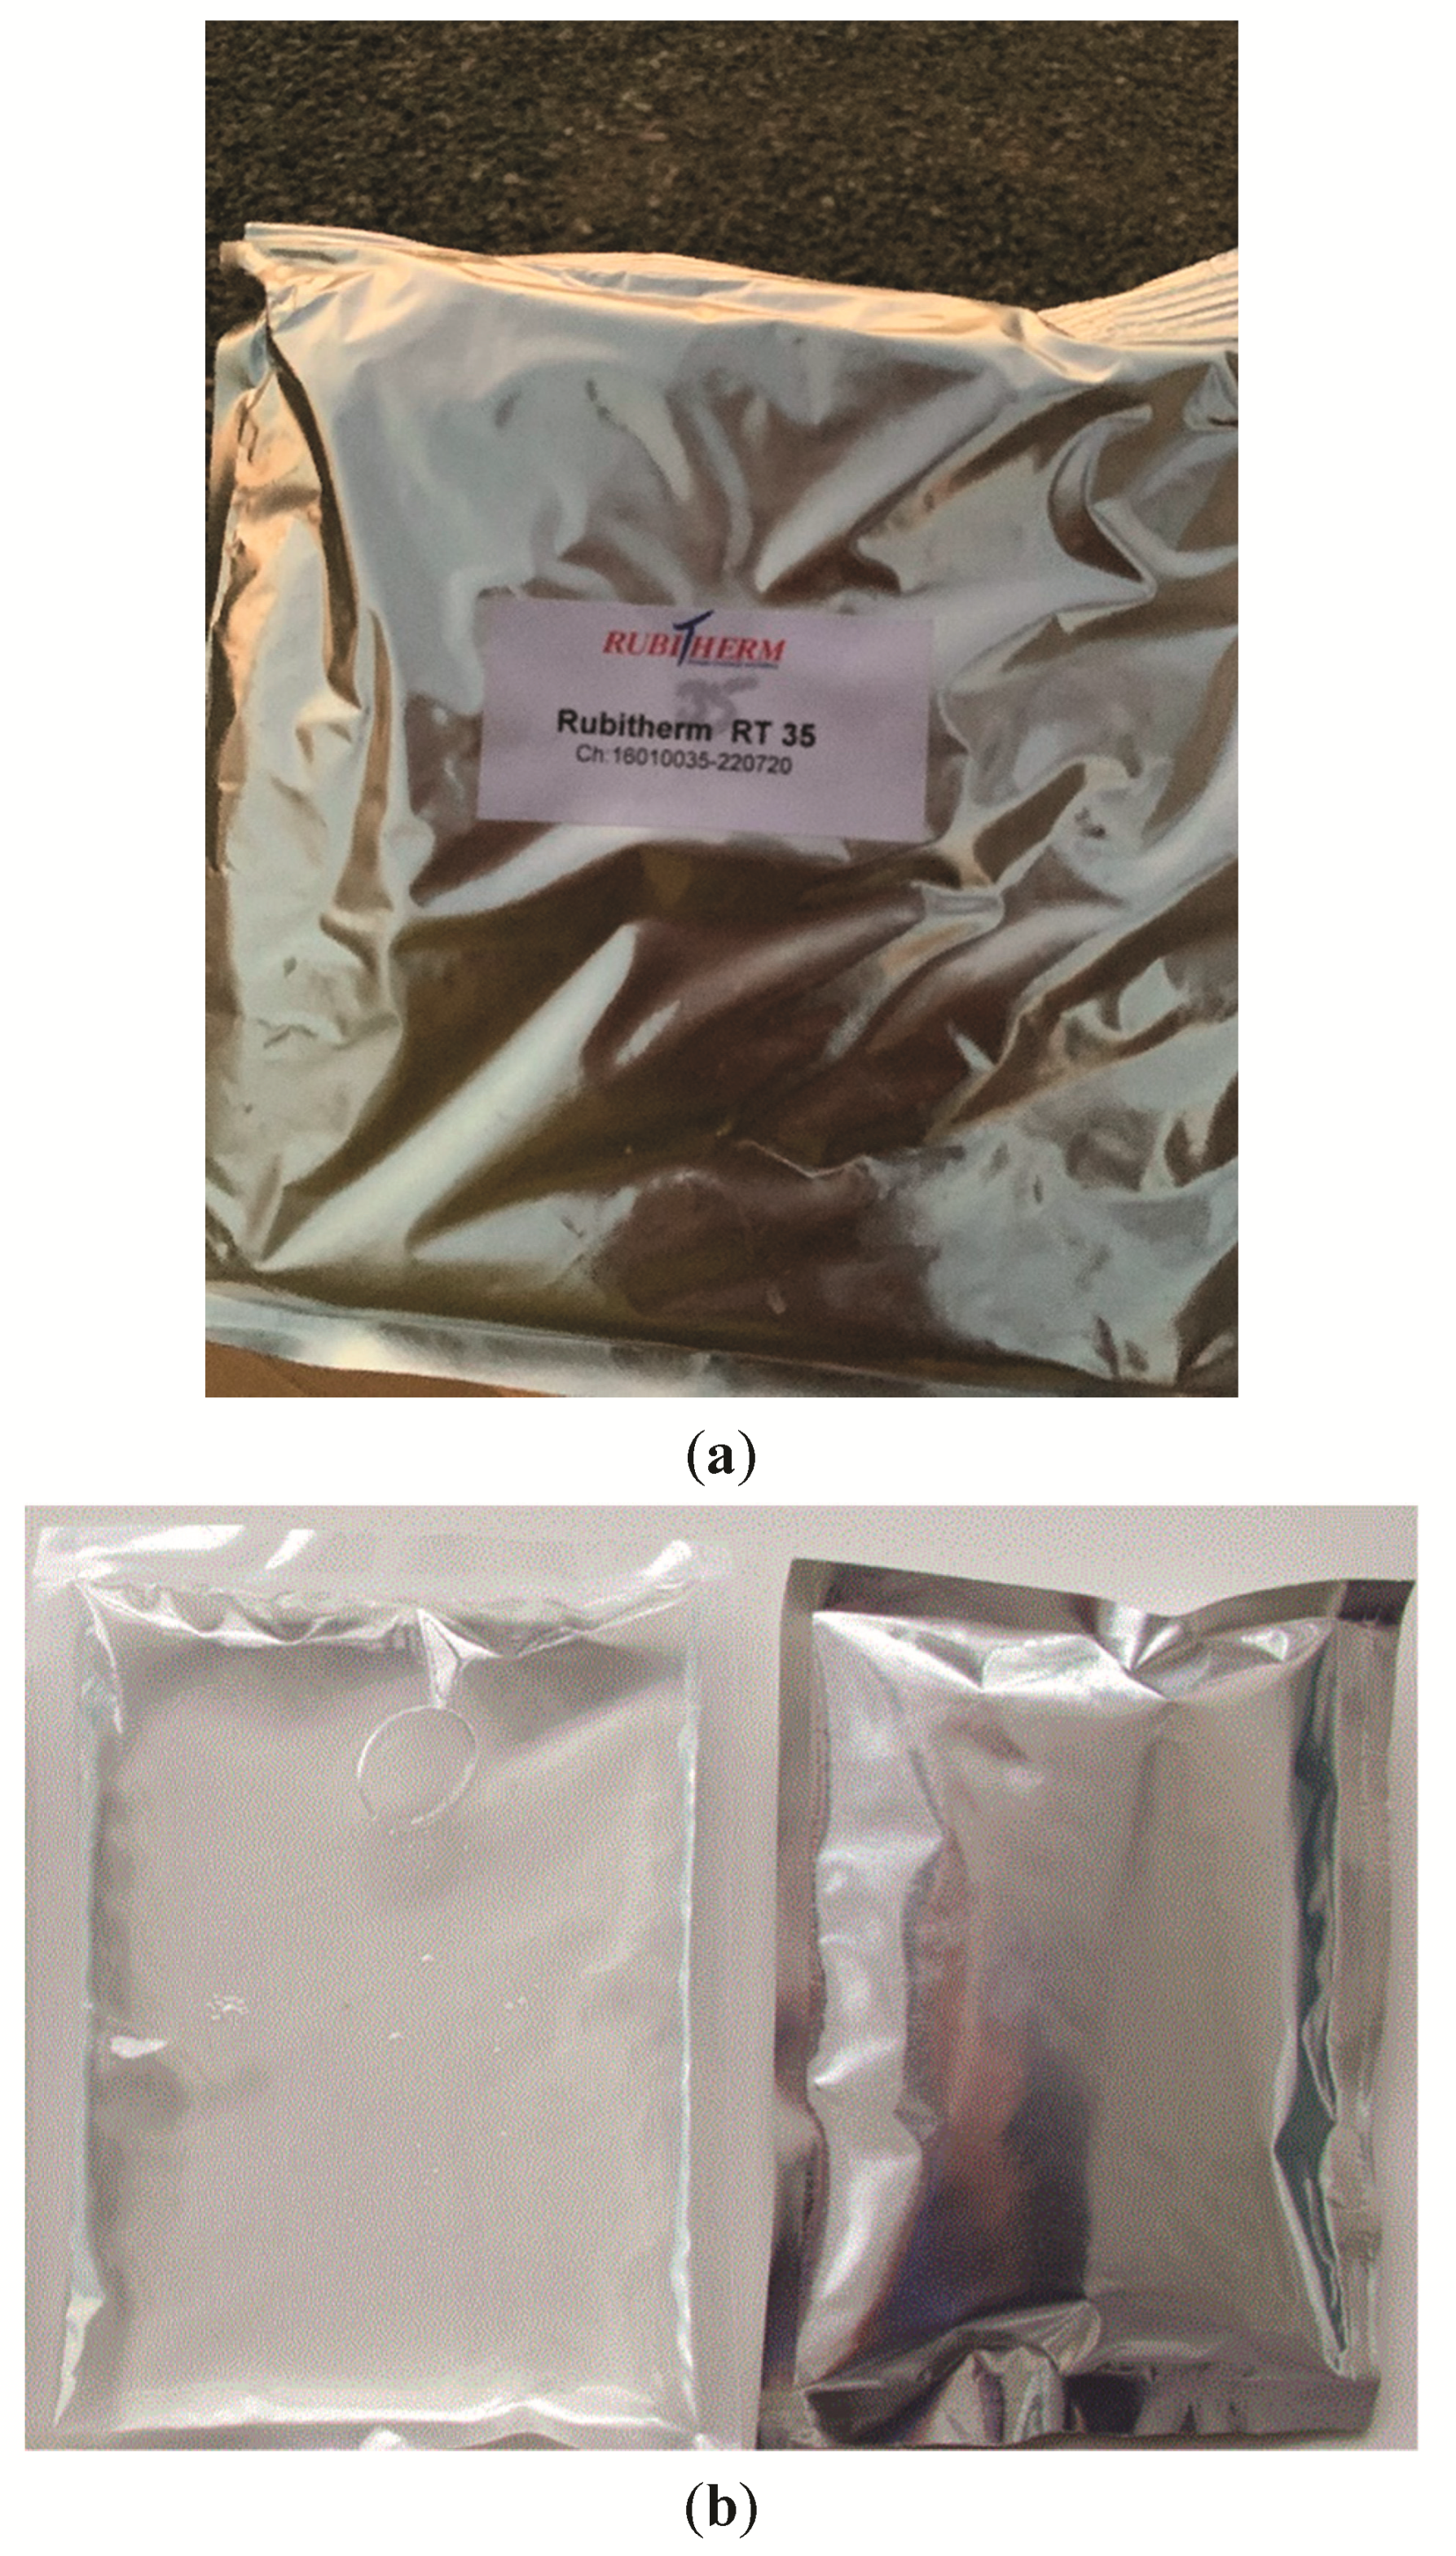
3.2. PCM and Polystyrene Foam Selection
3.3. Methodology
4. Results and Discussion
4.1. Thermal Behavior
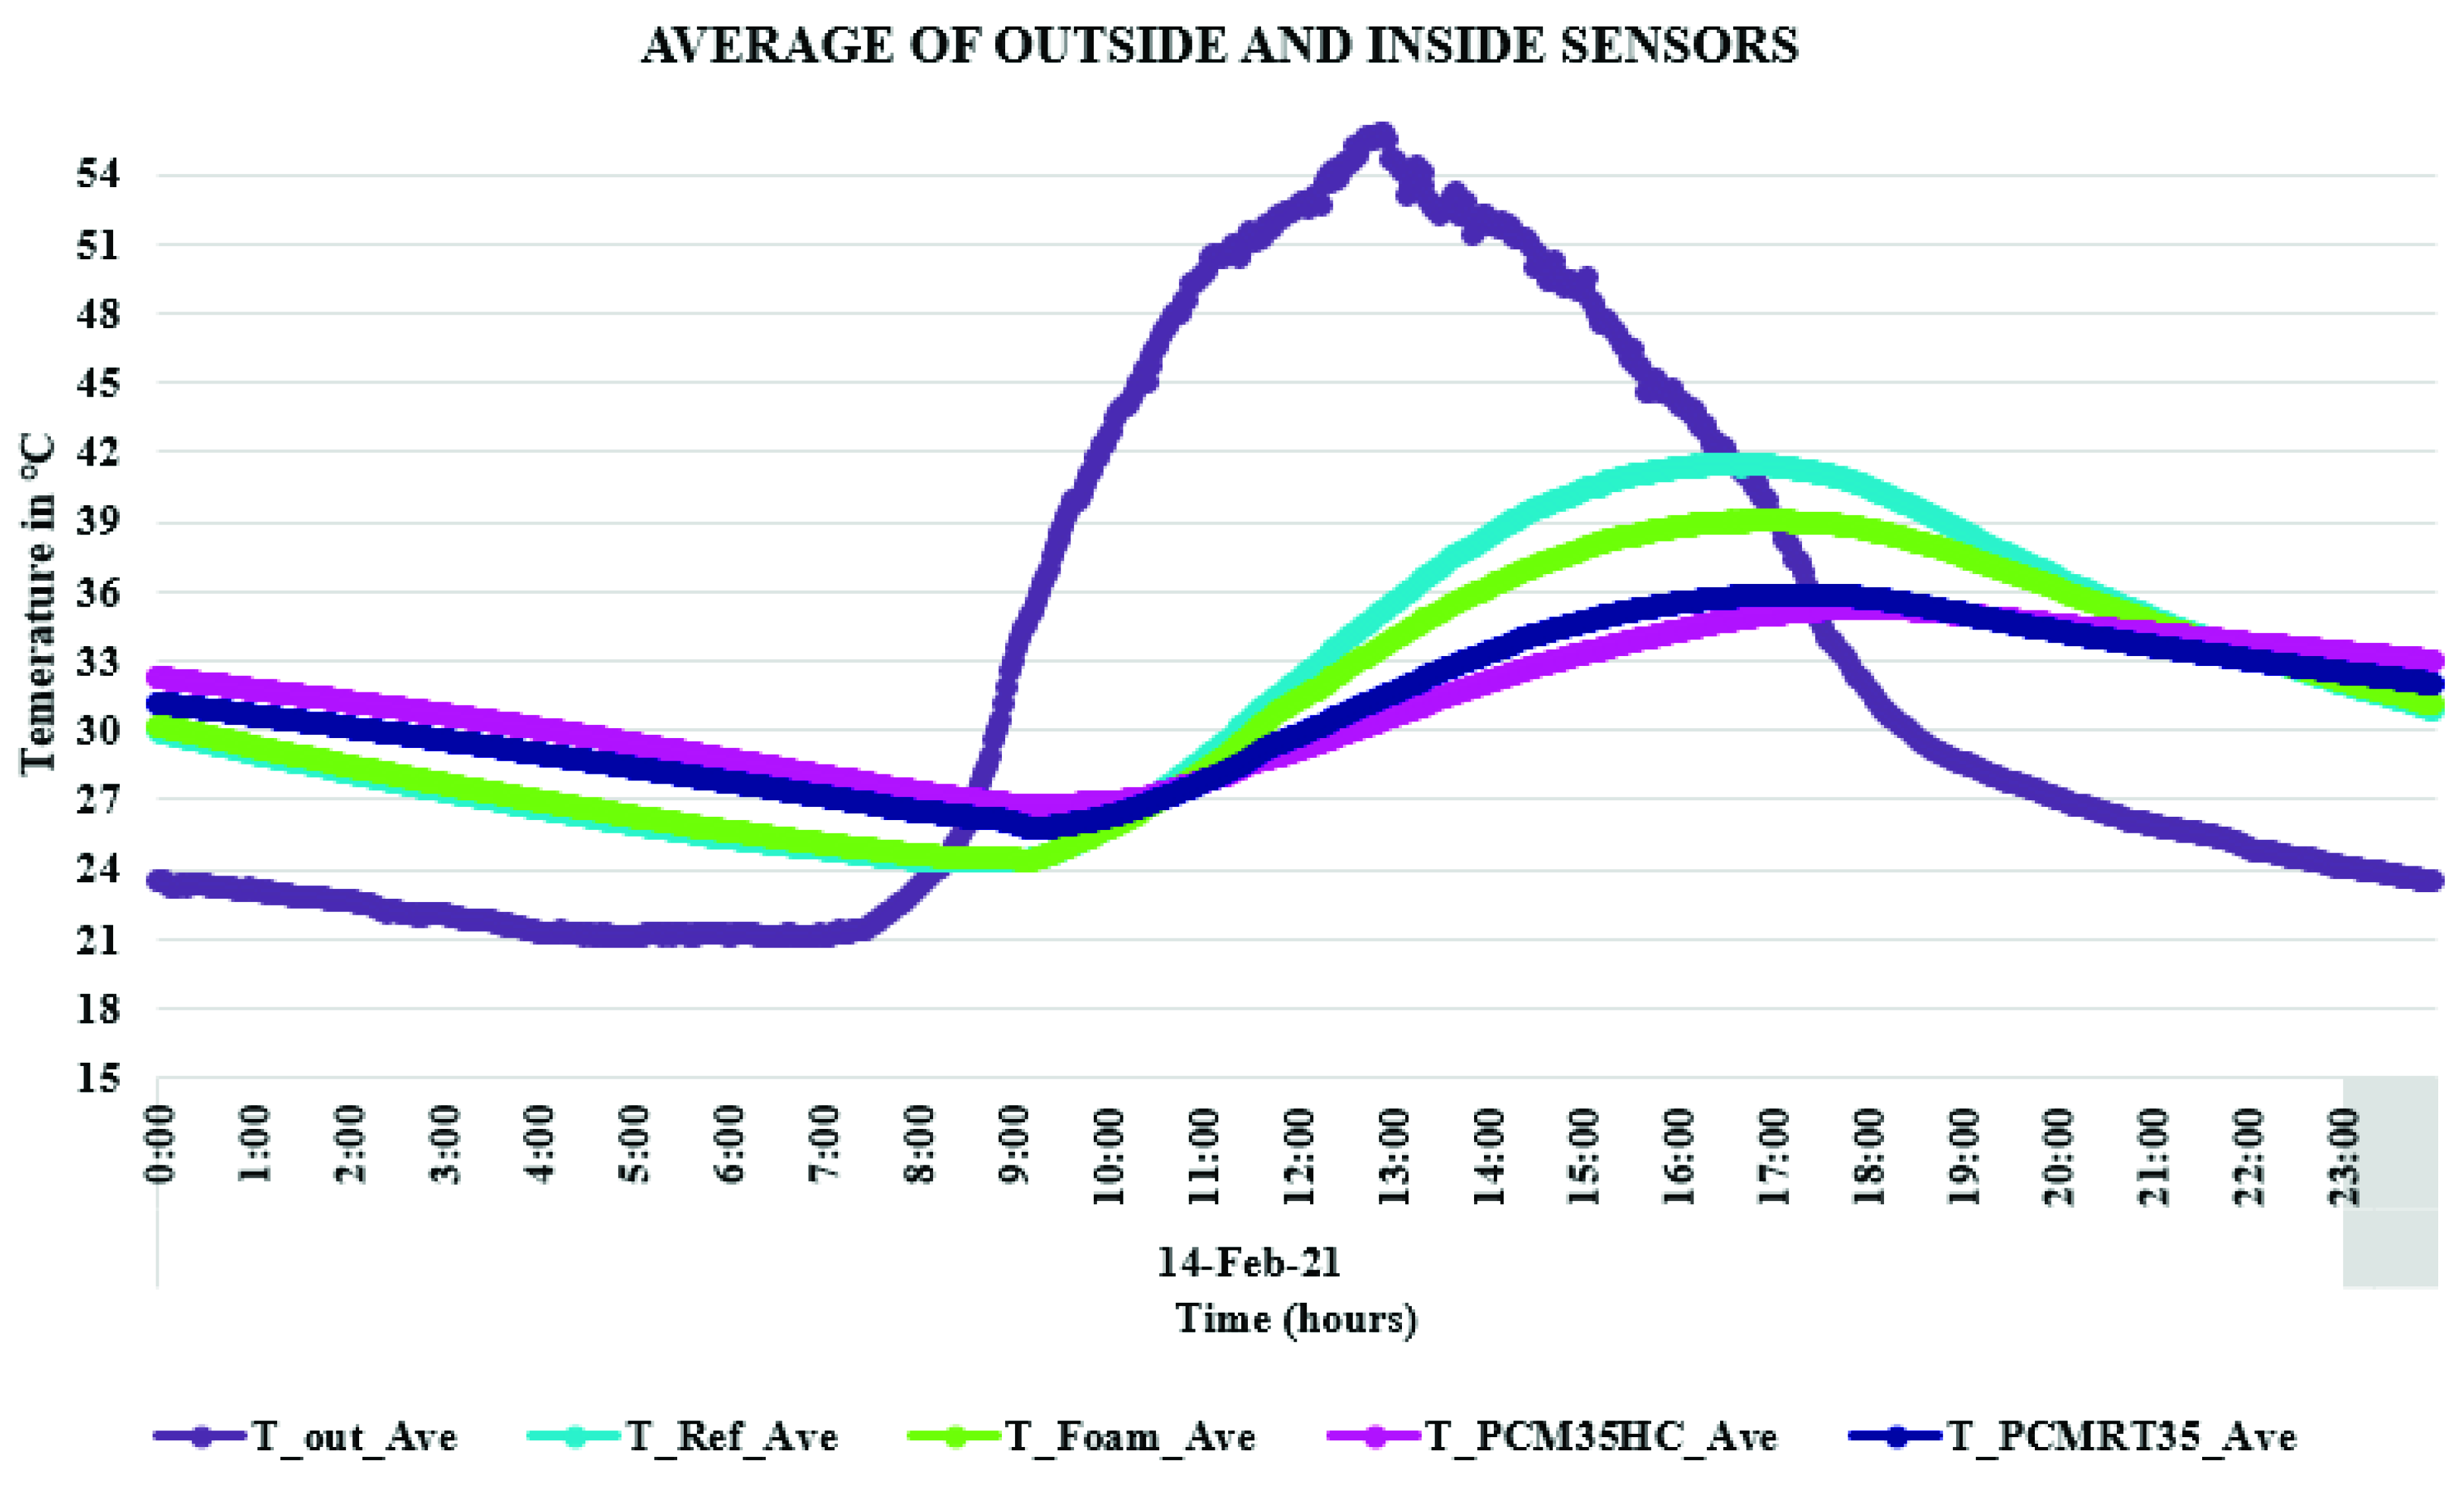
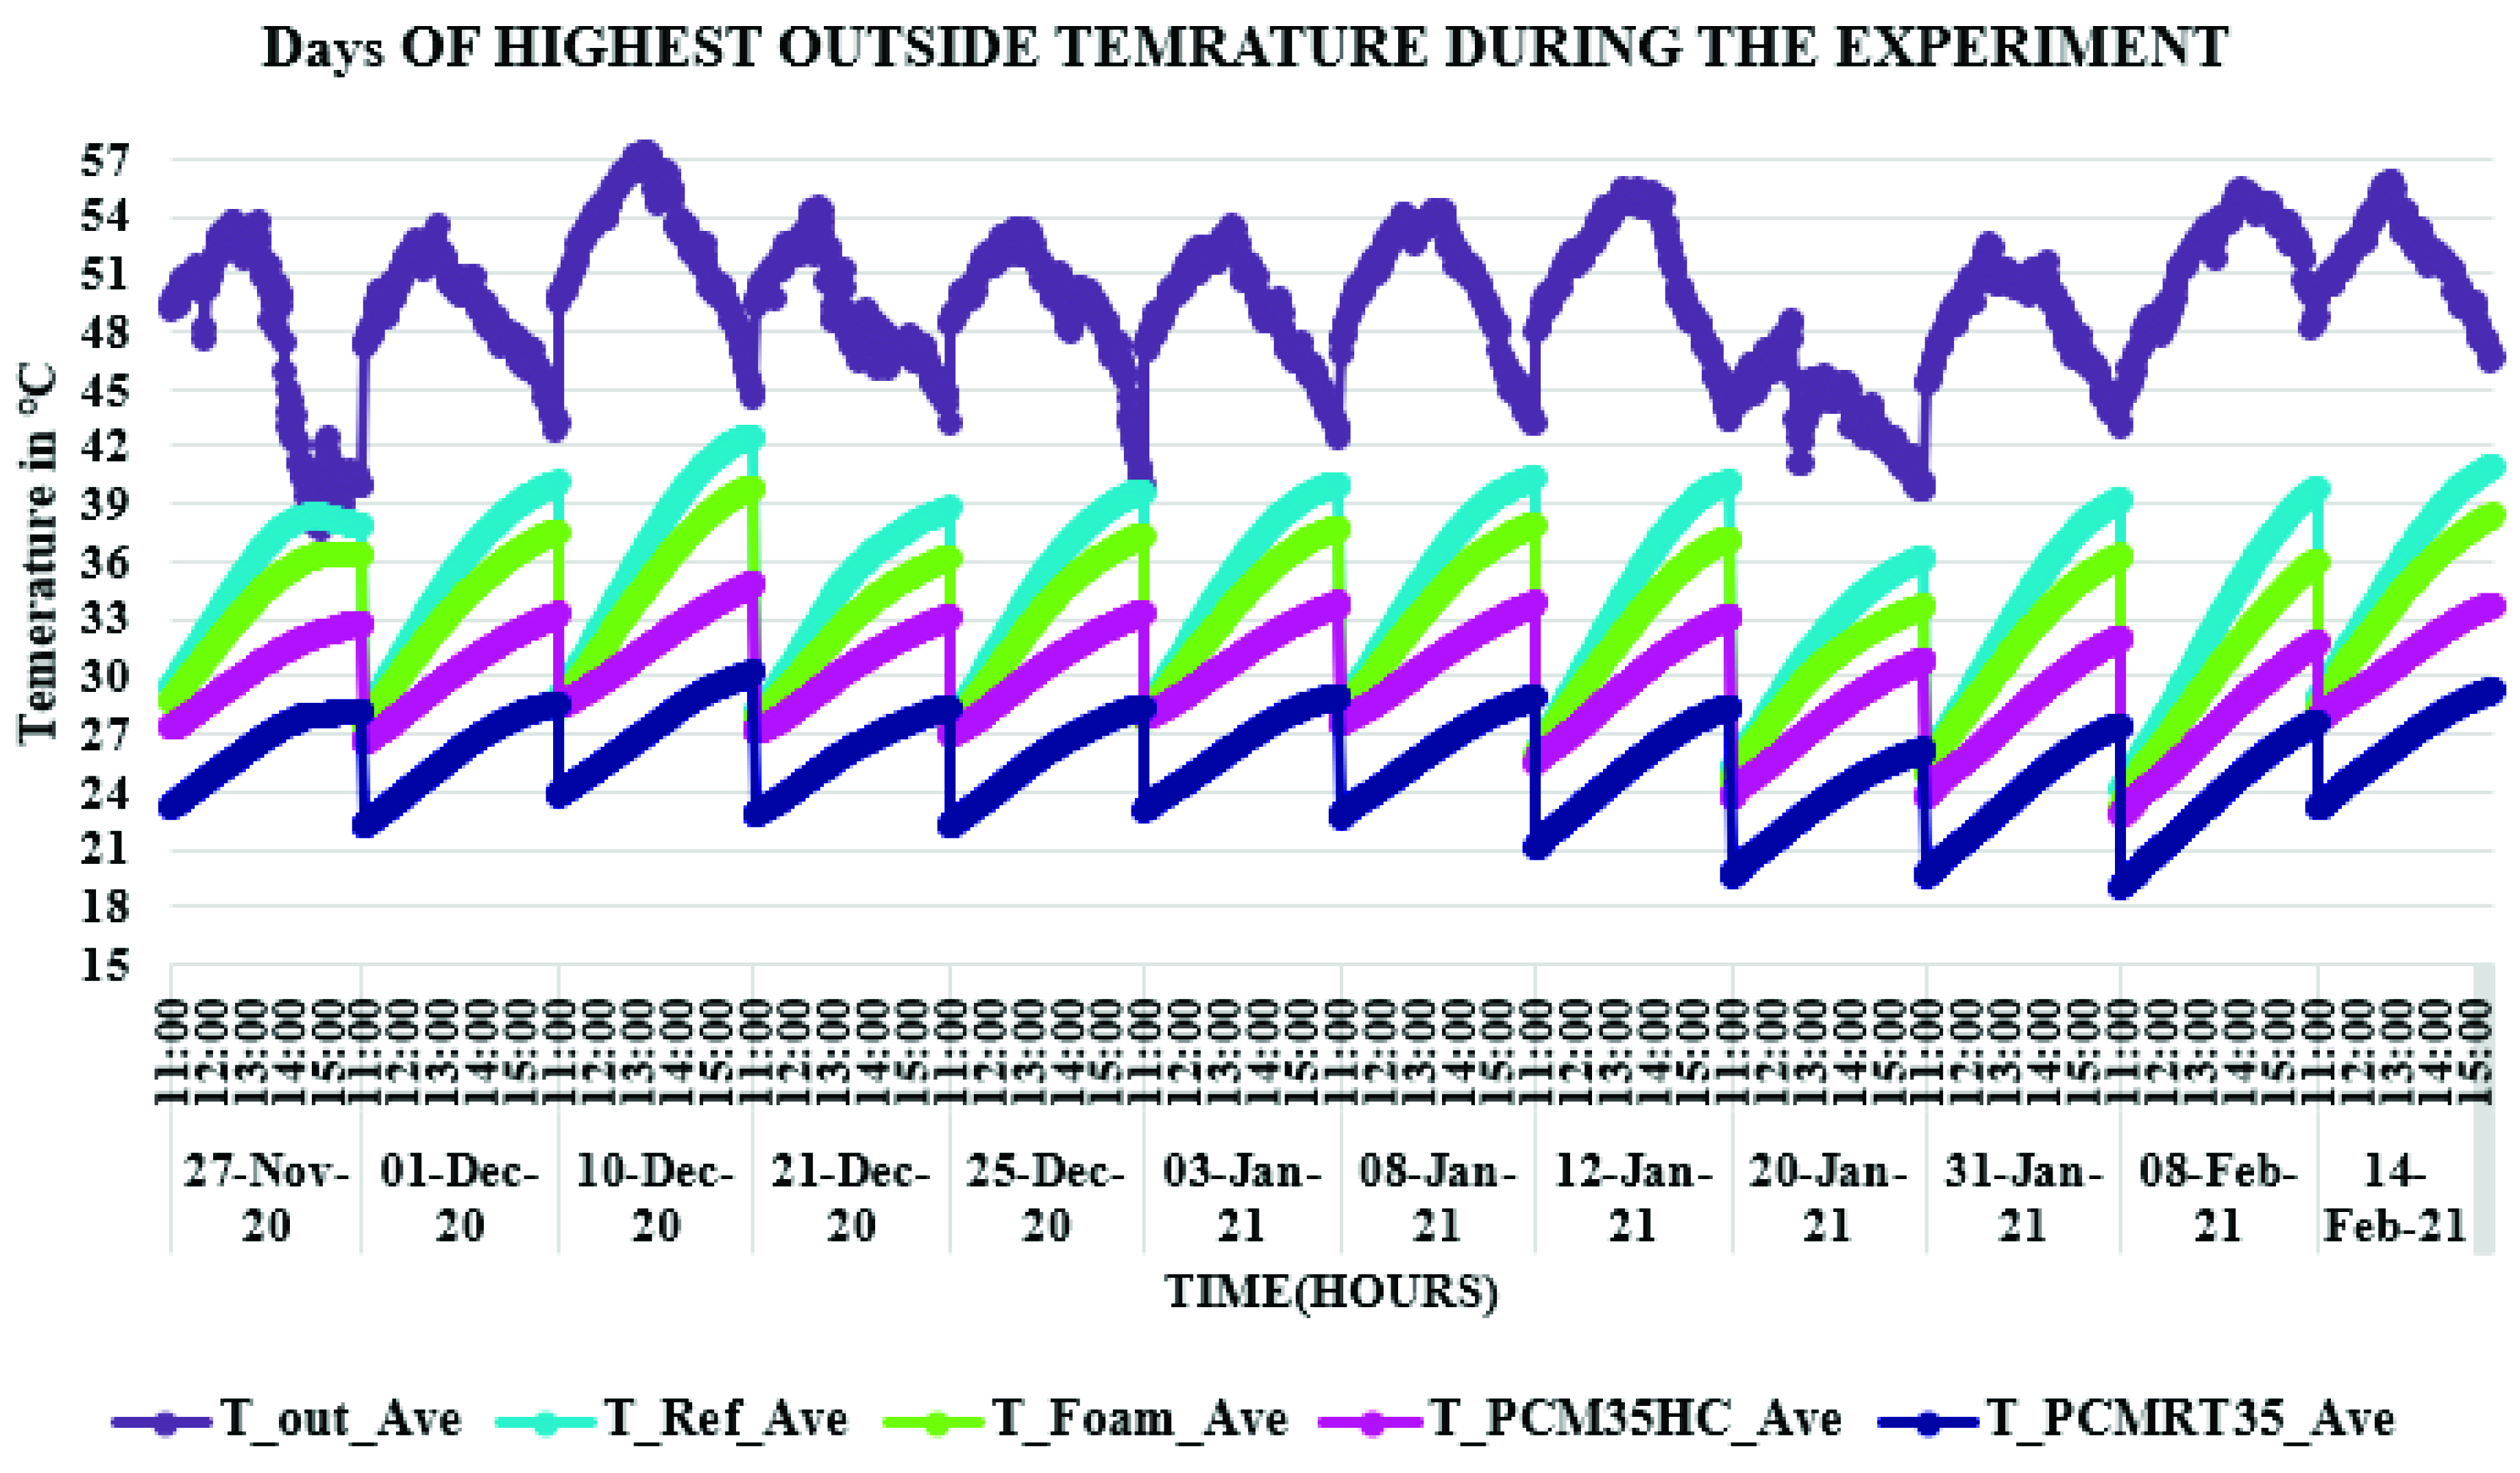
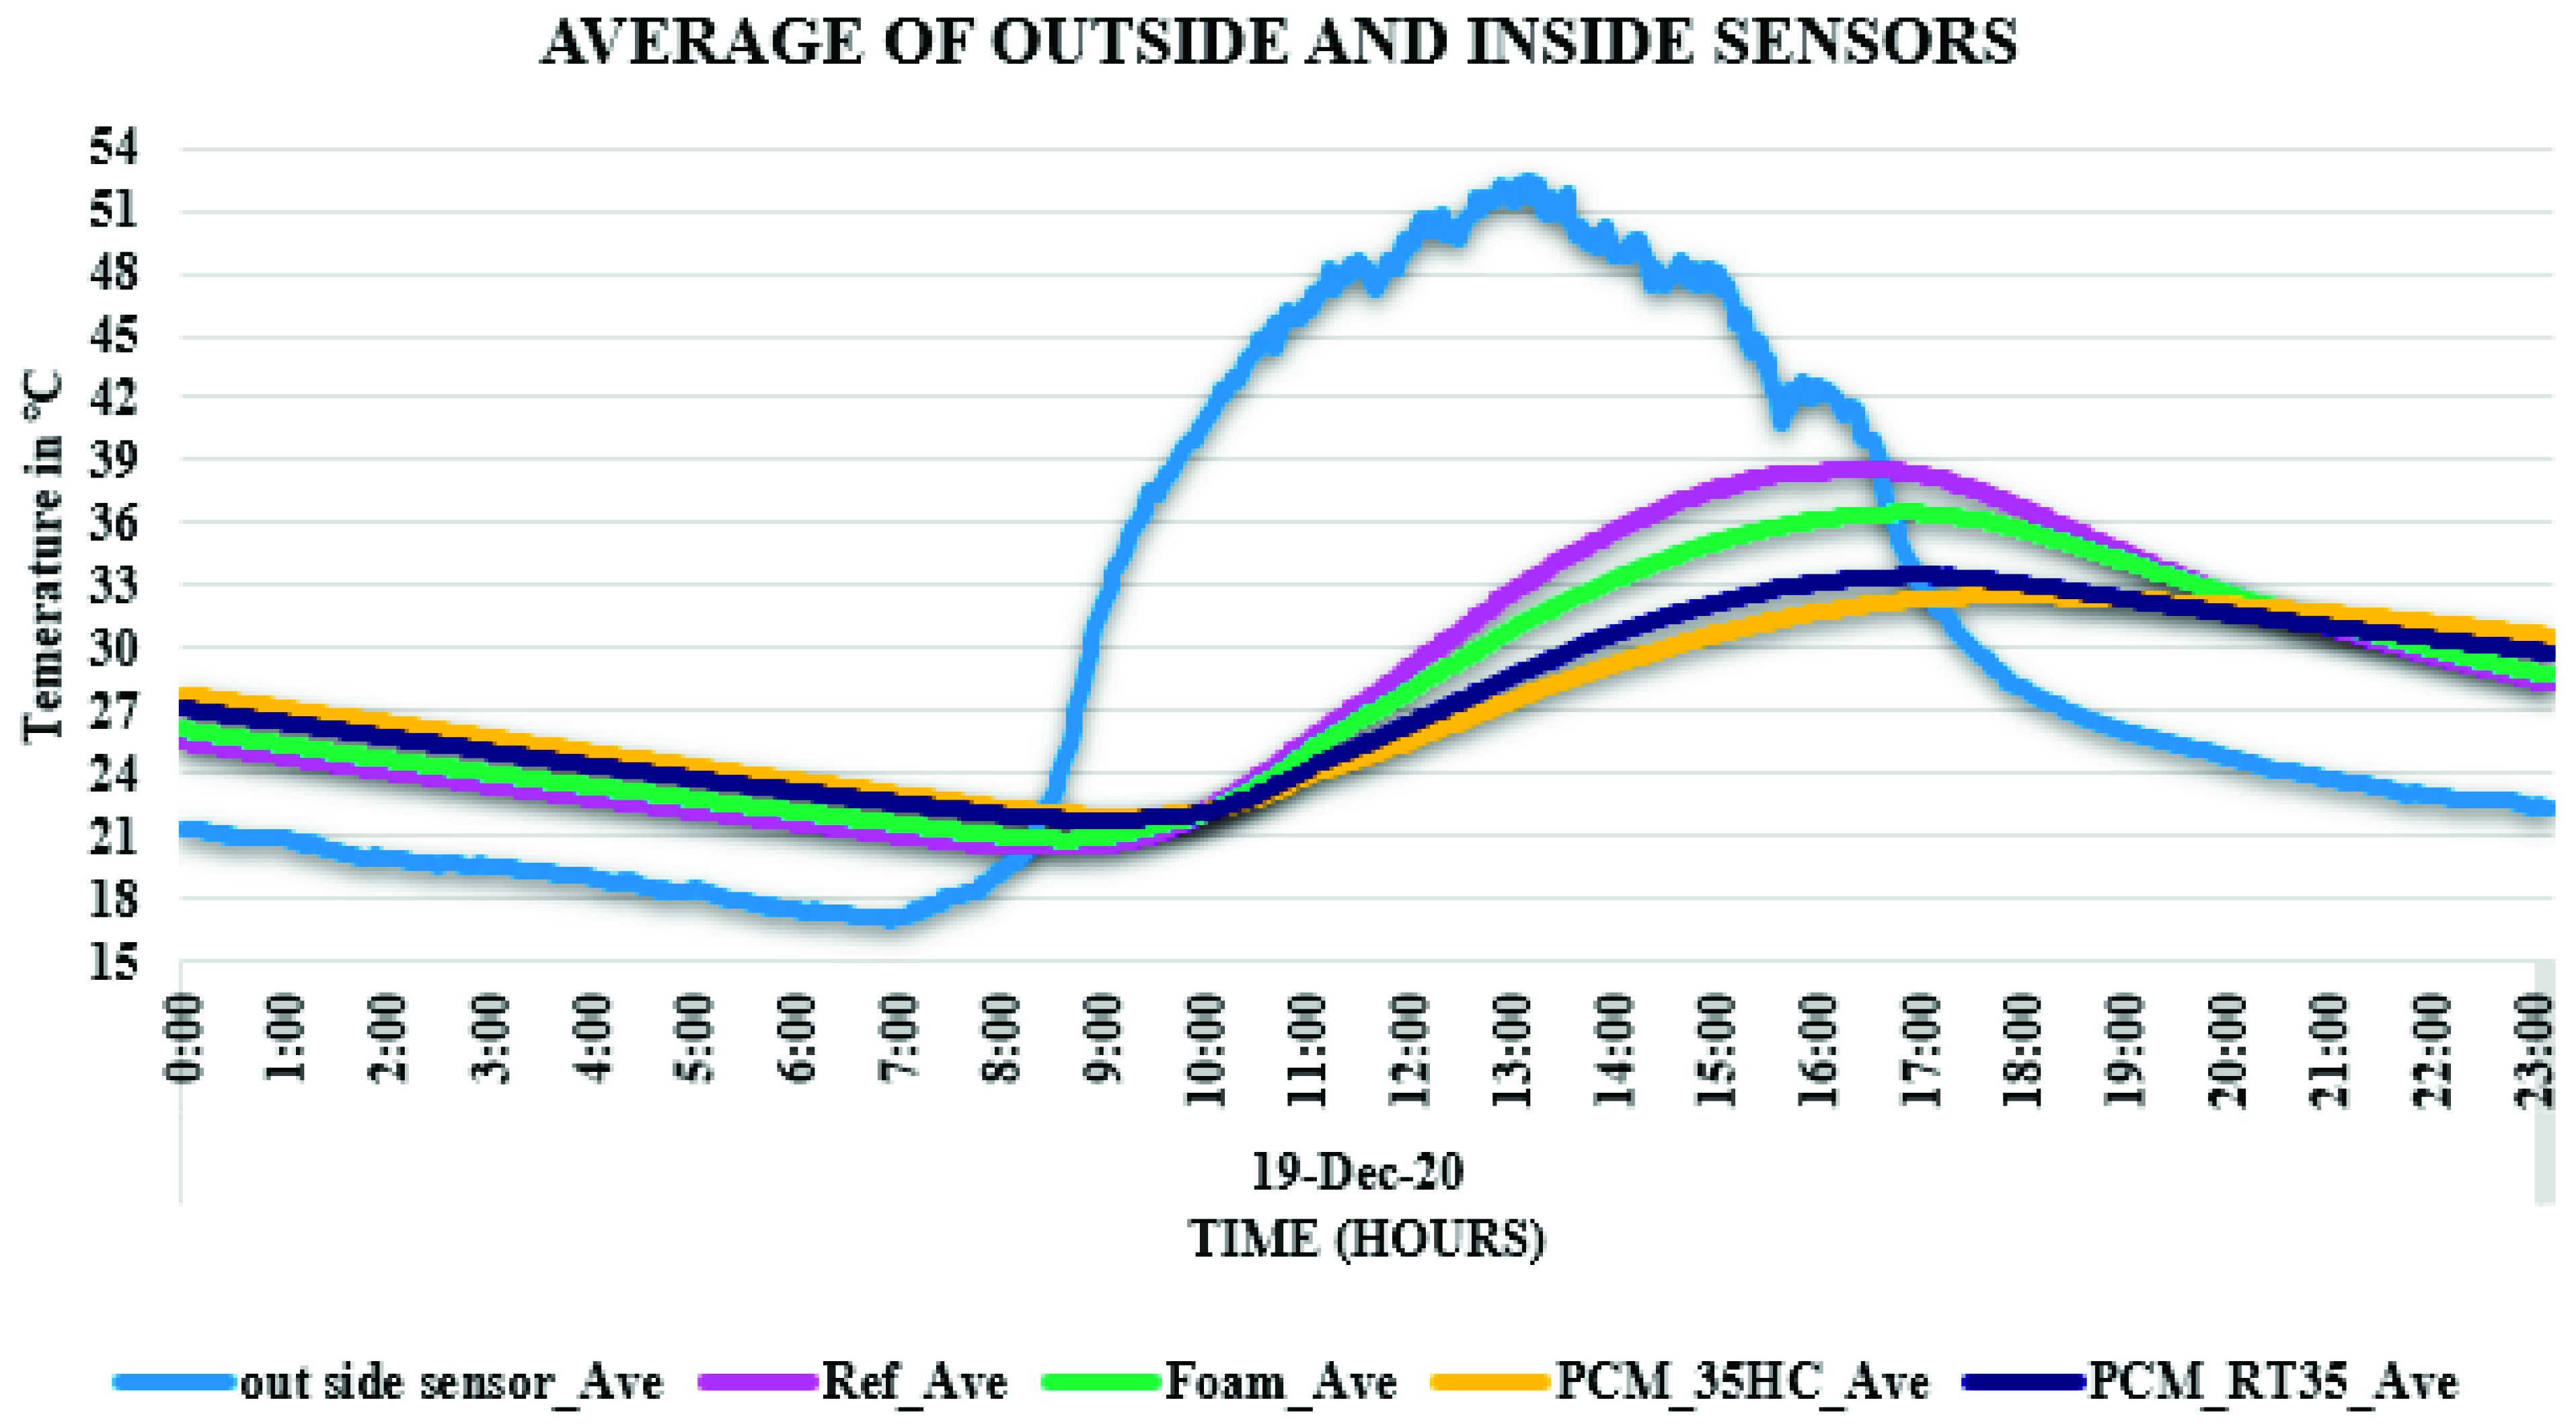
4.1.1. Highest Outside Temperature
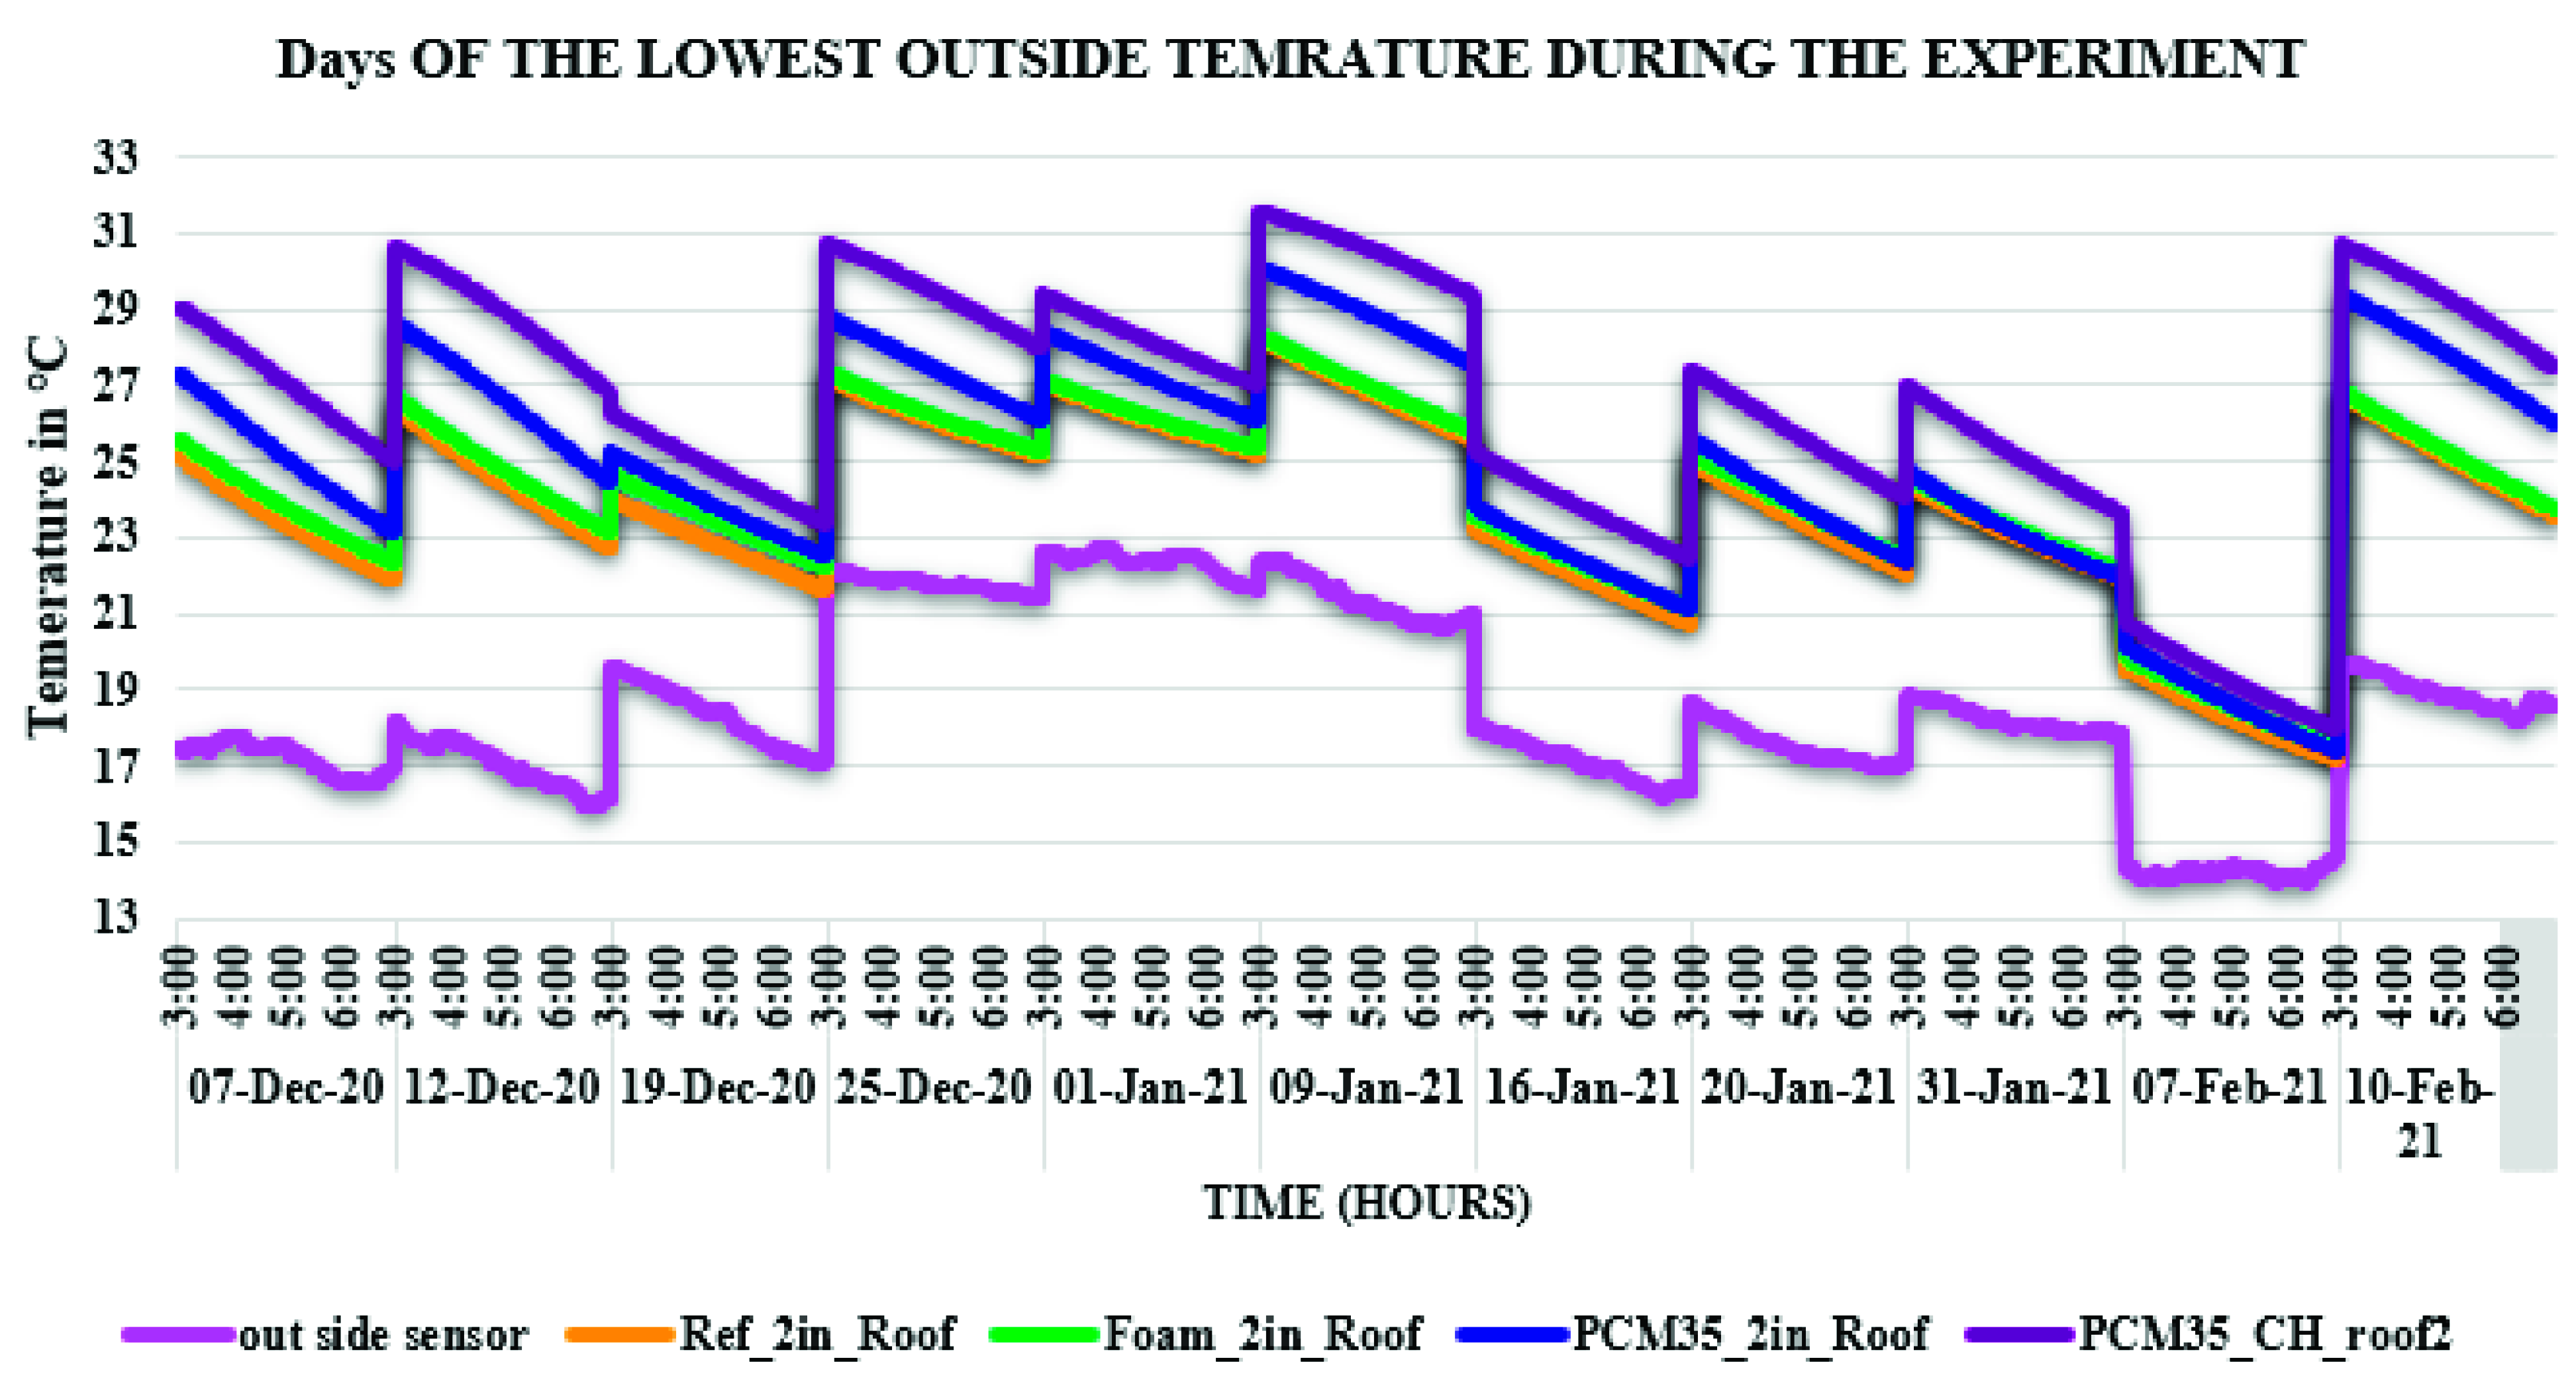
4.1.2. Lowest Outside Temperature Reached
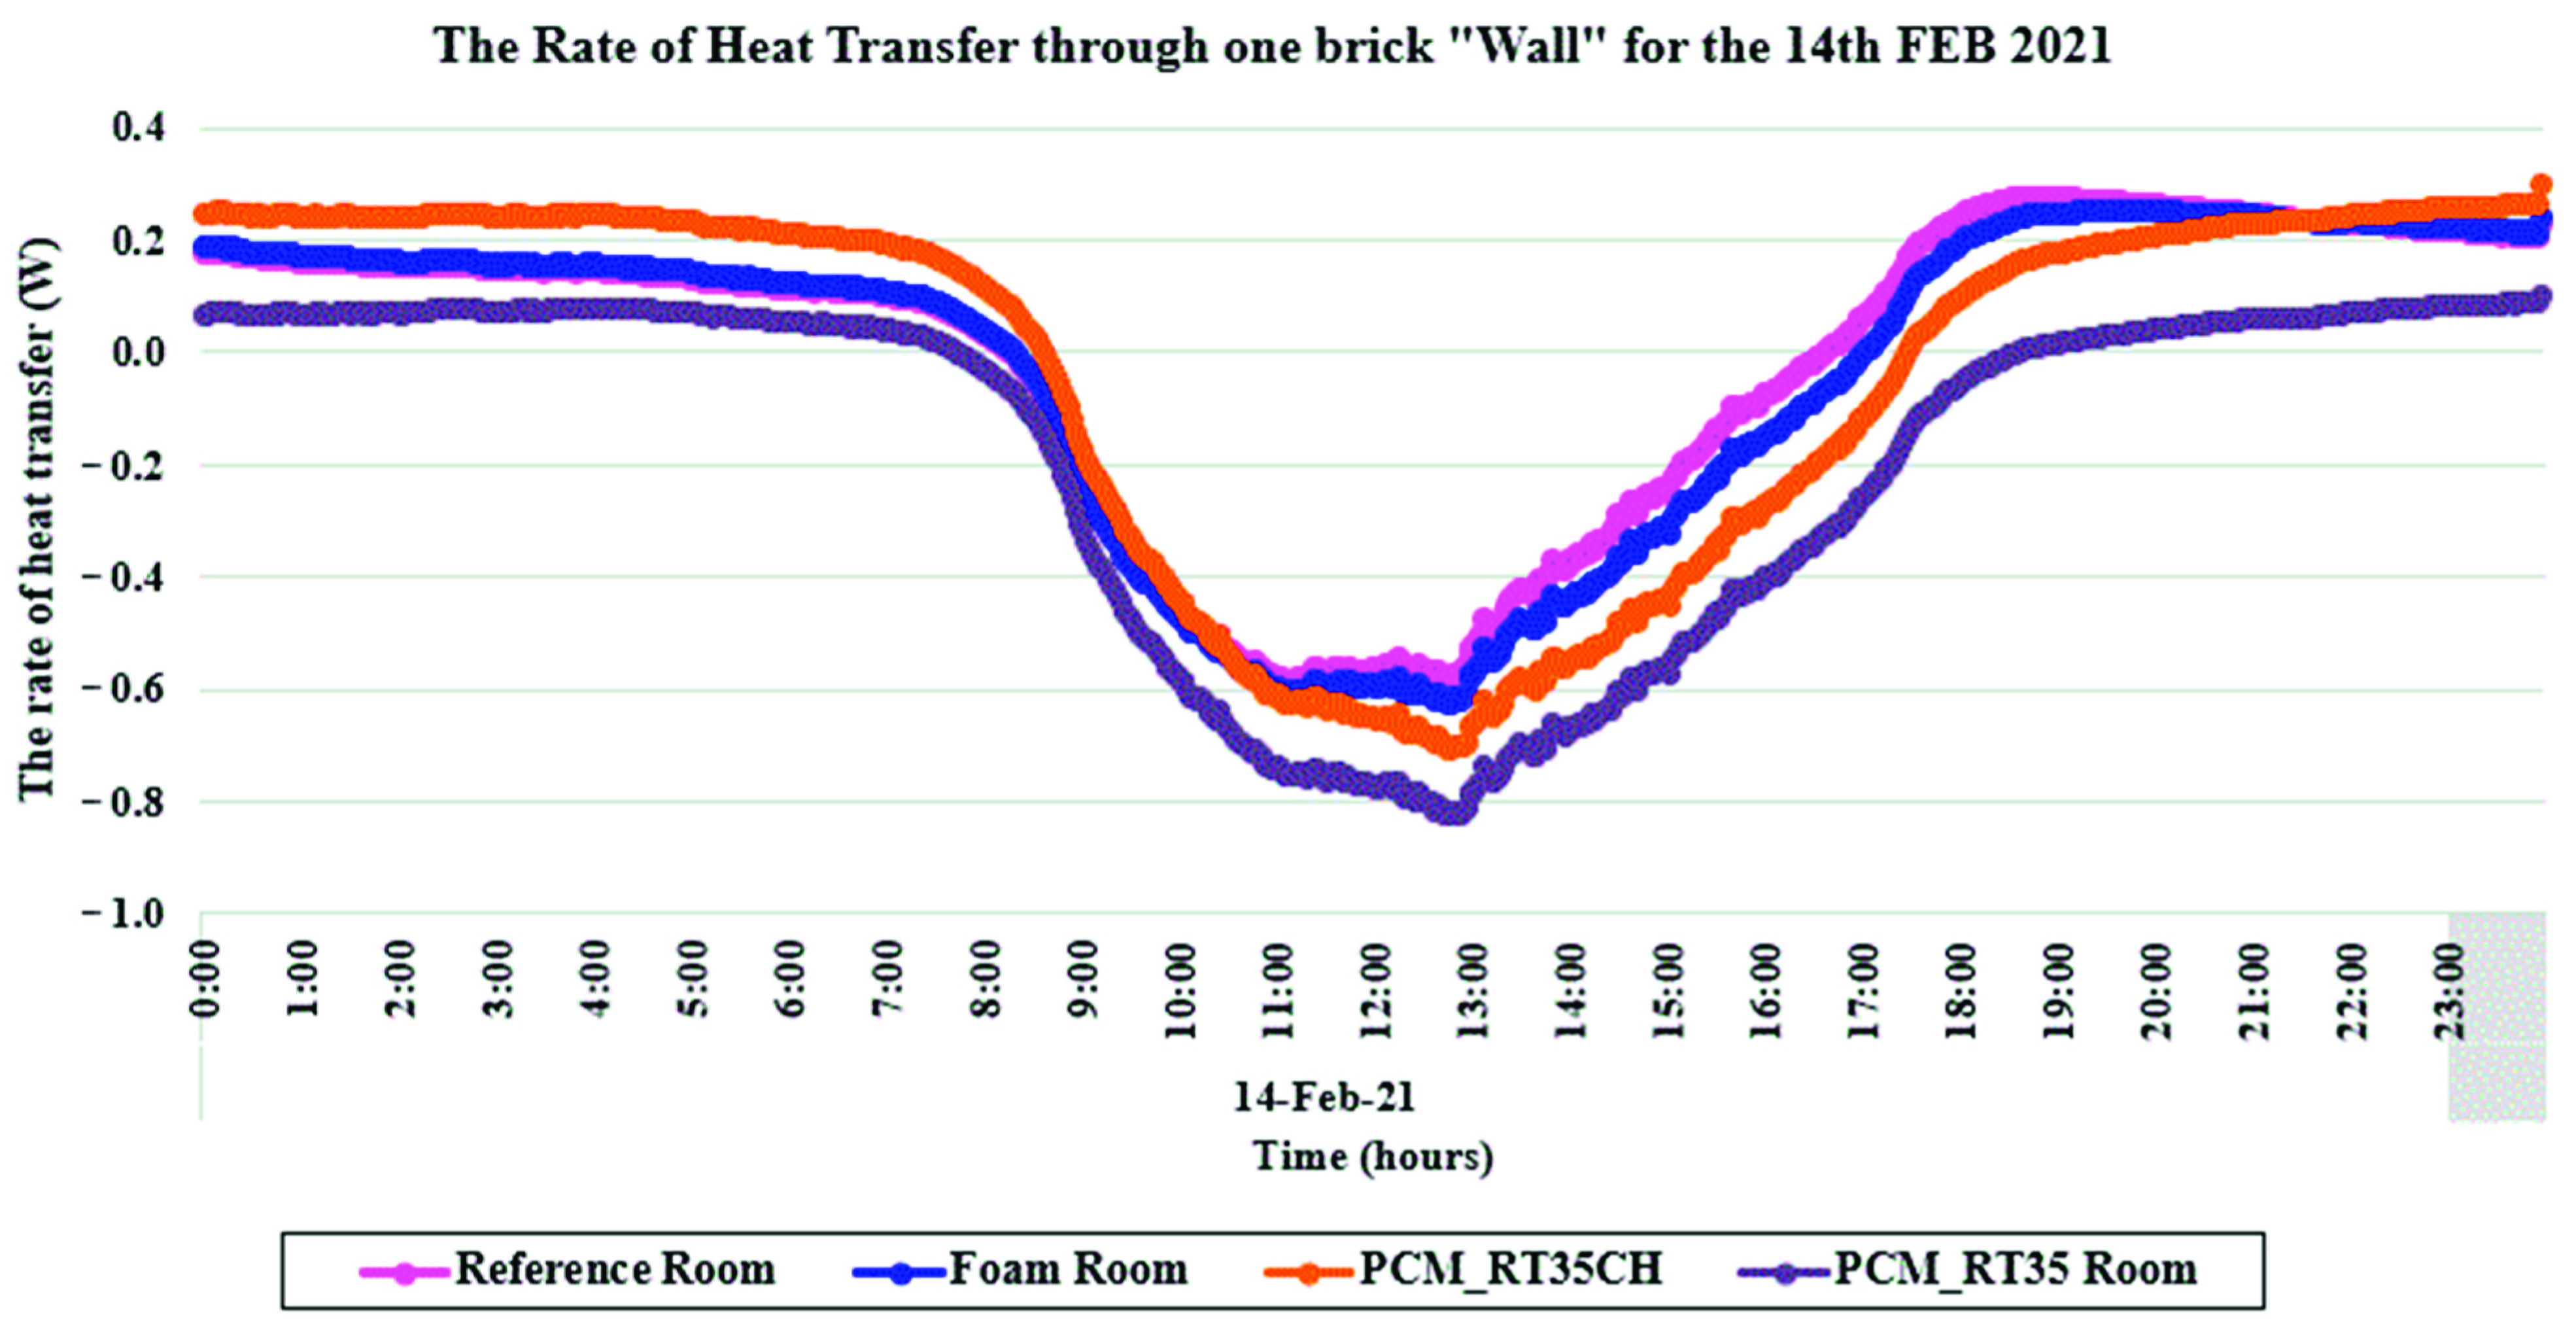
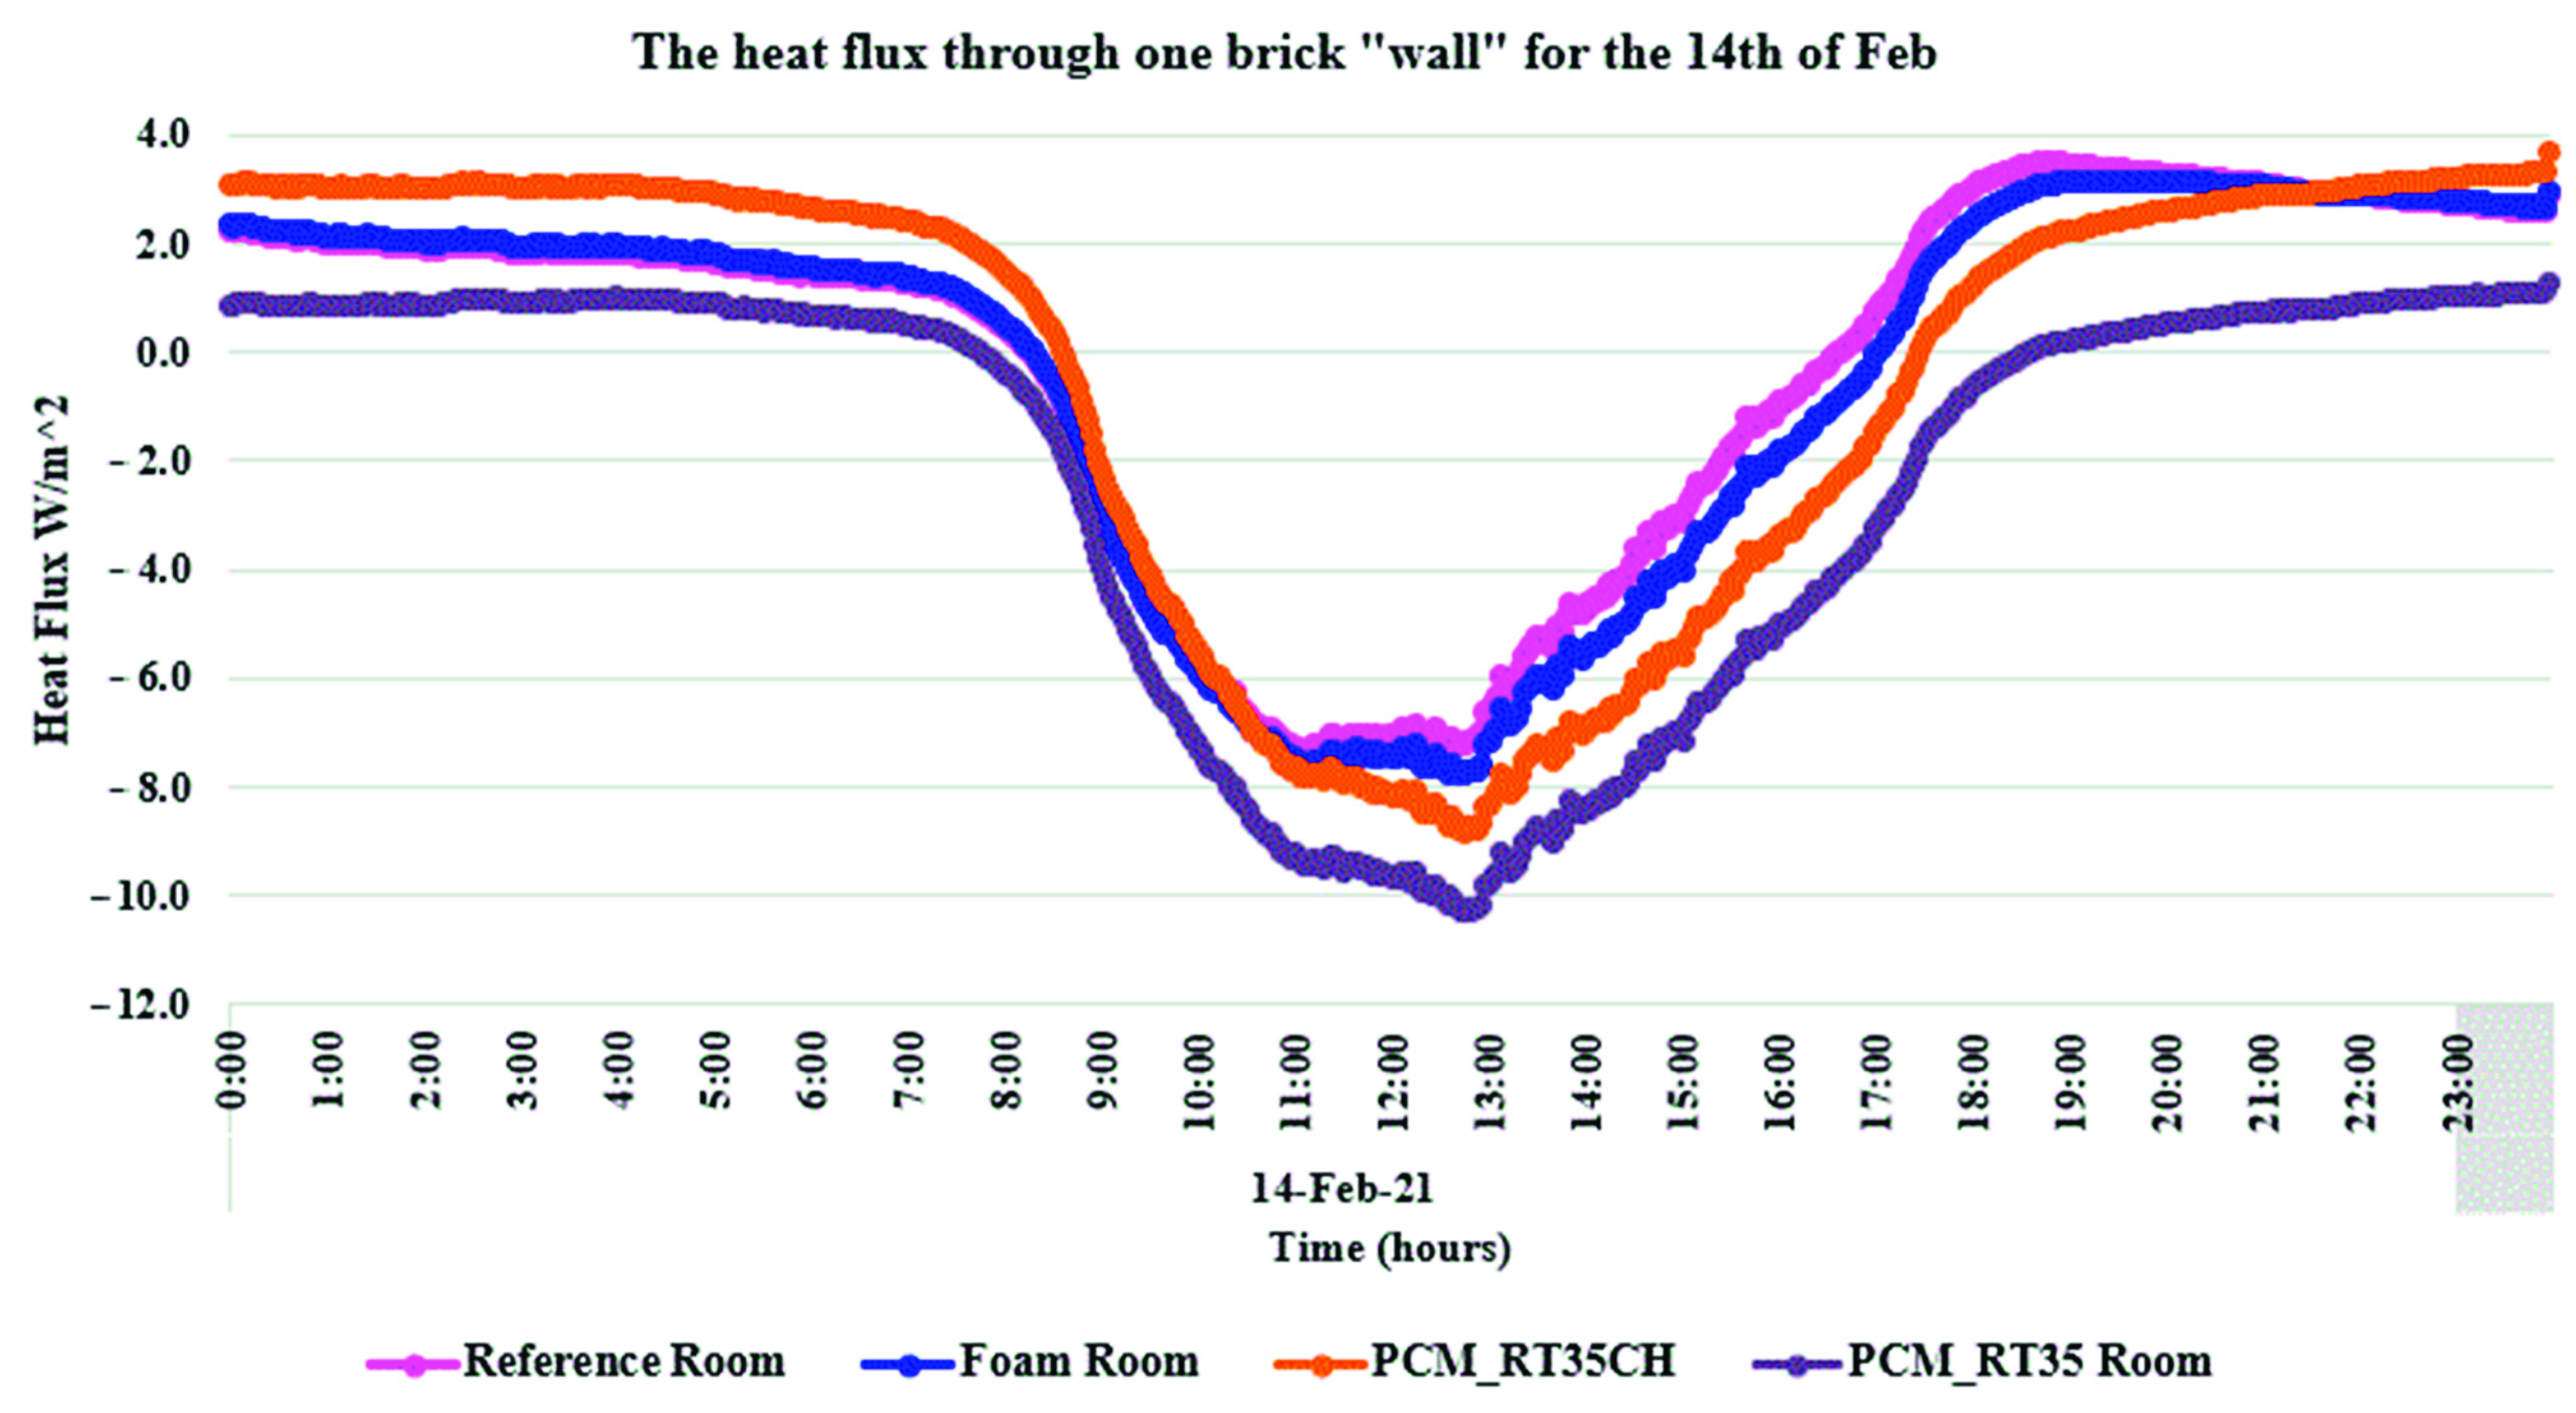
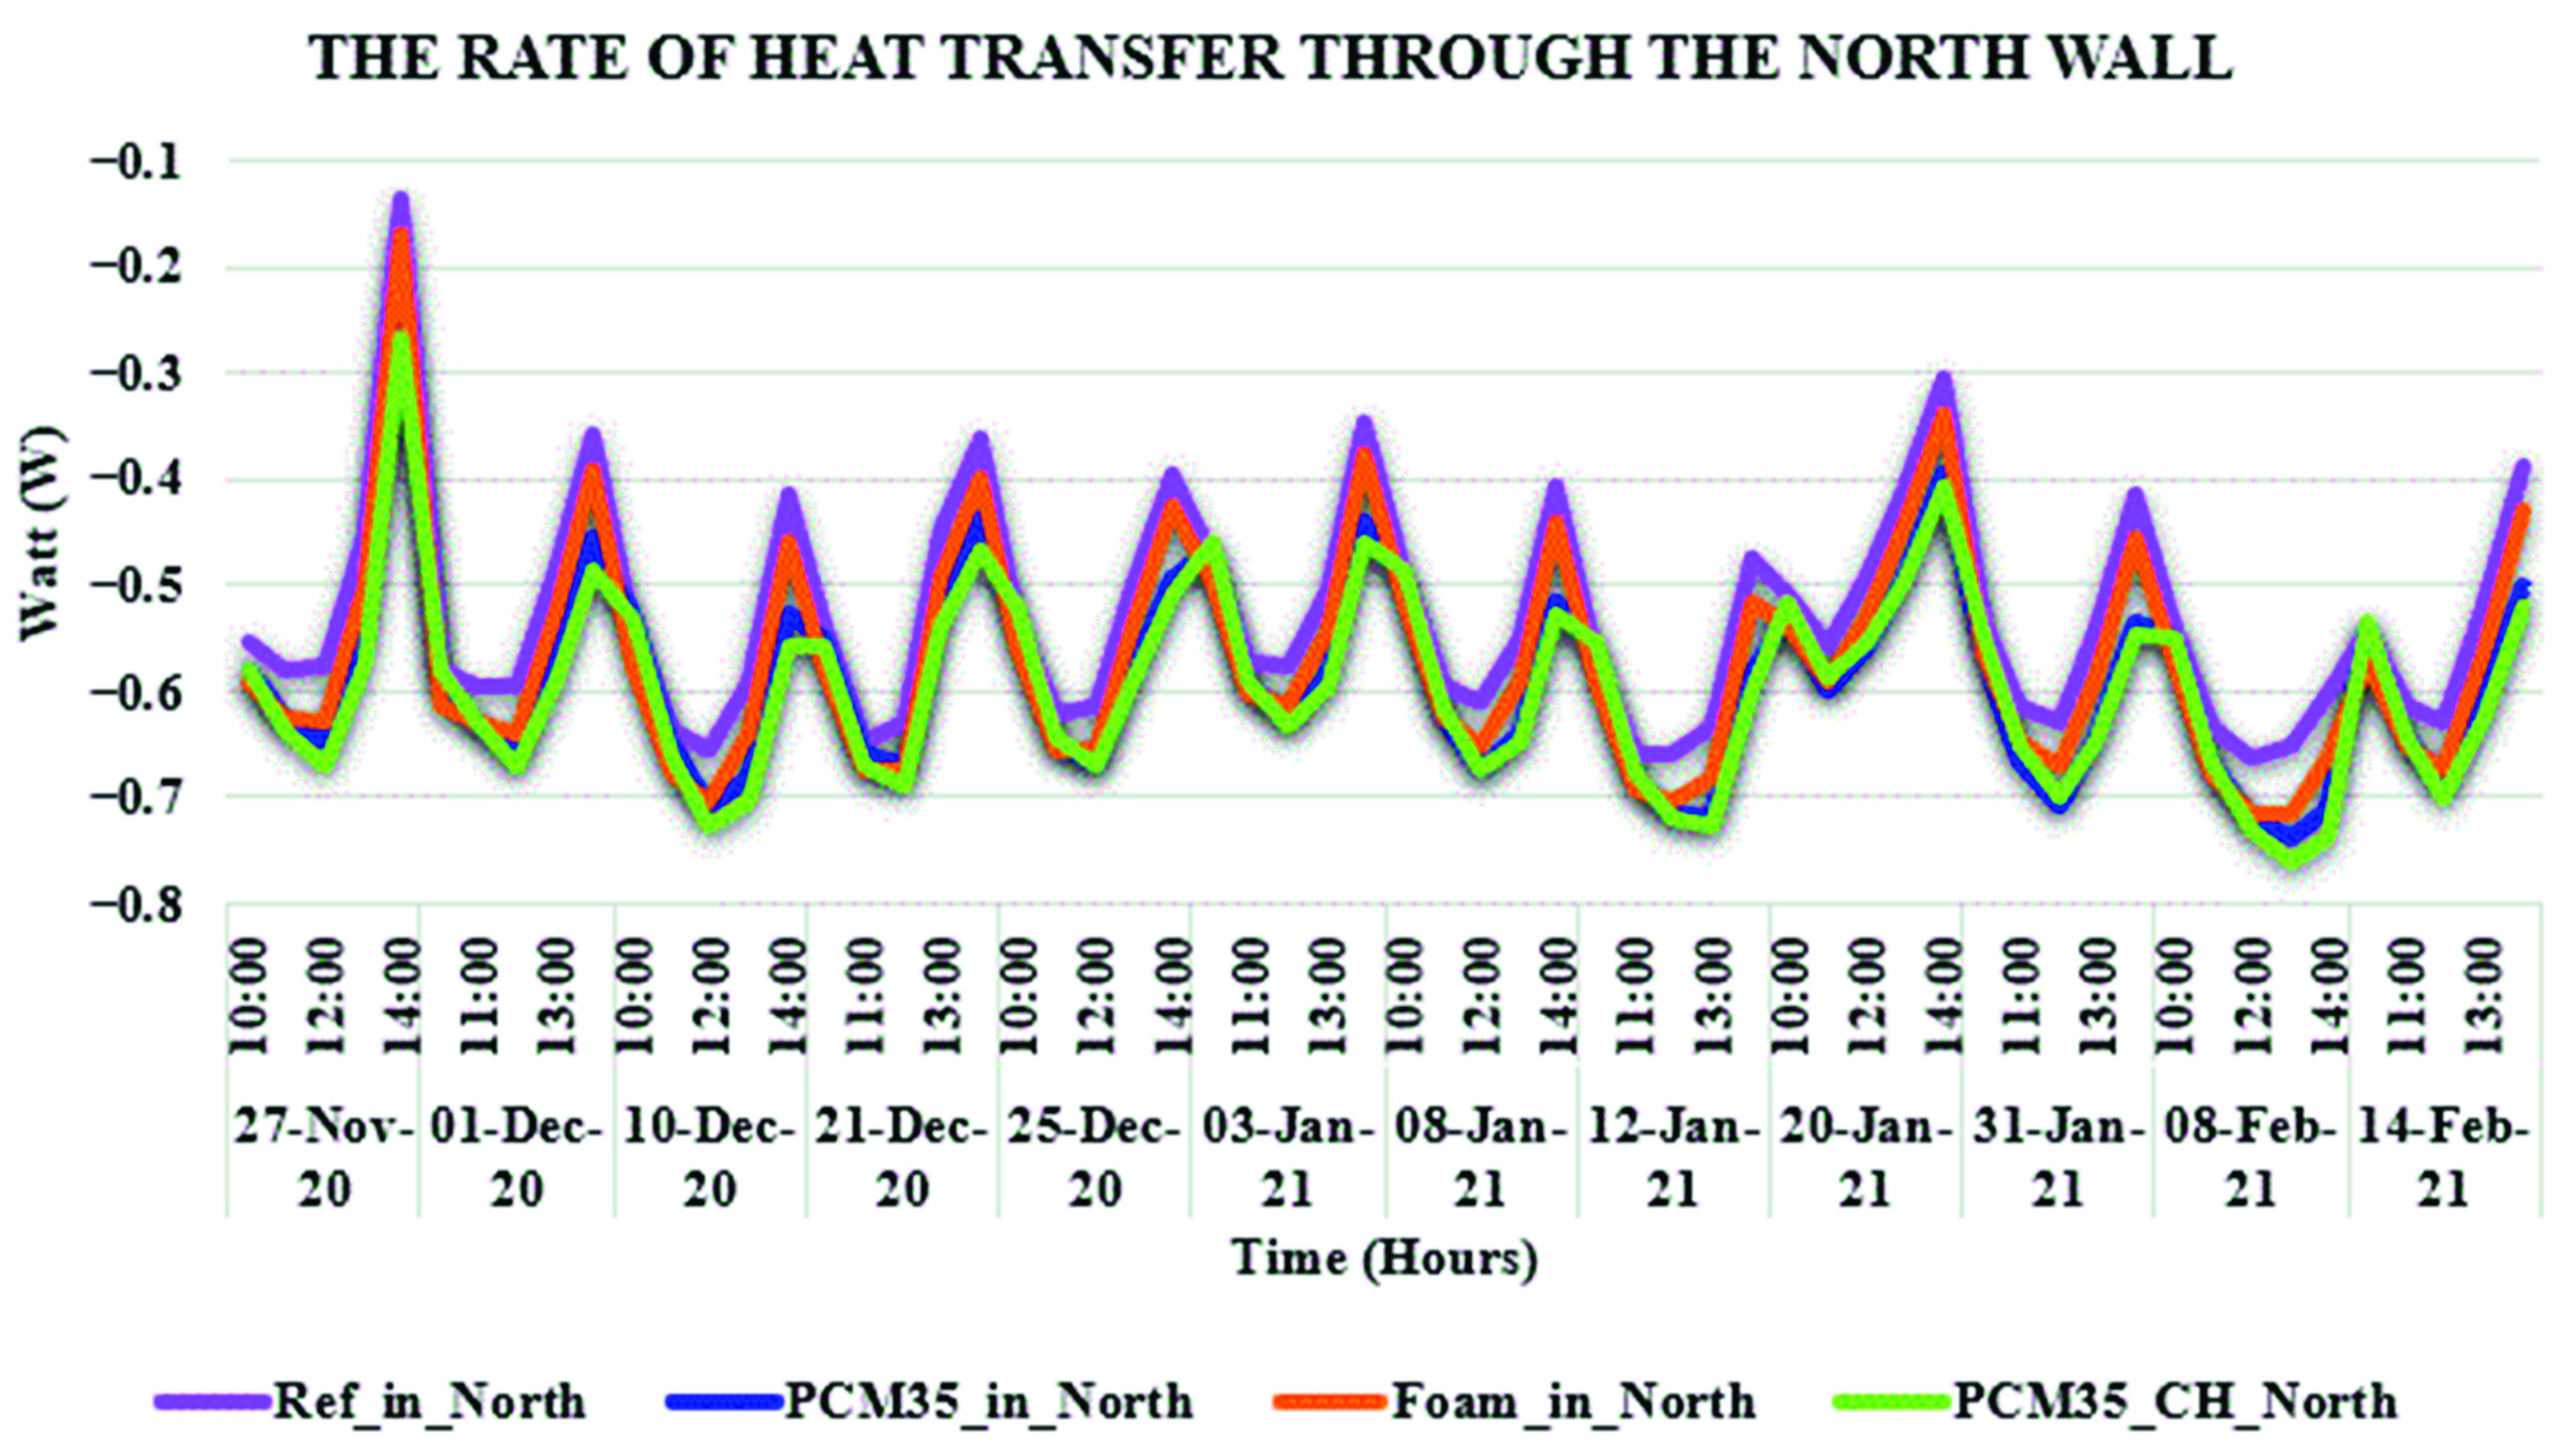
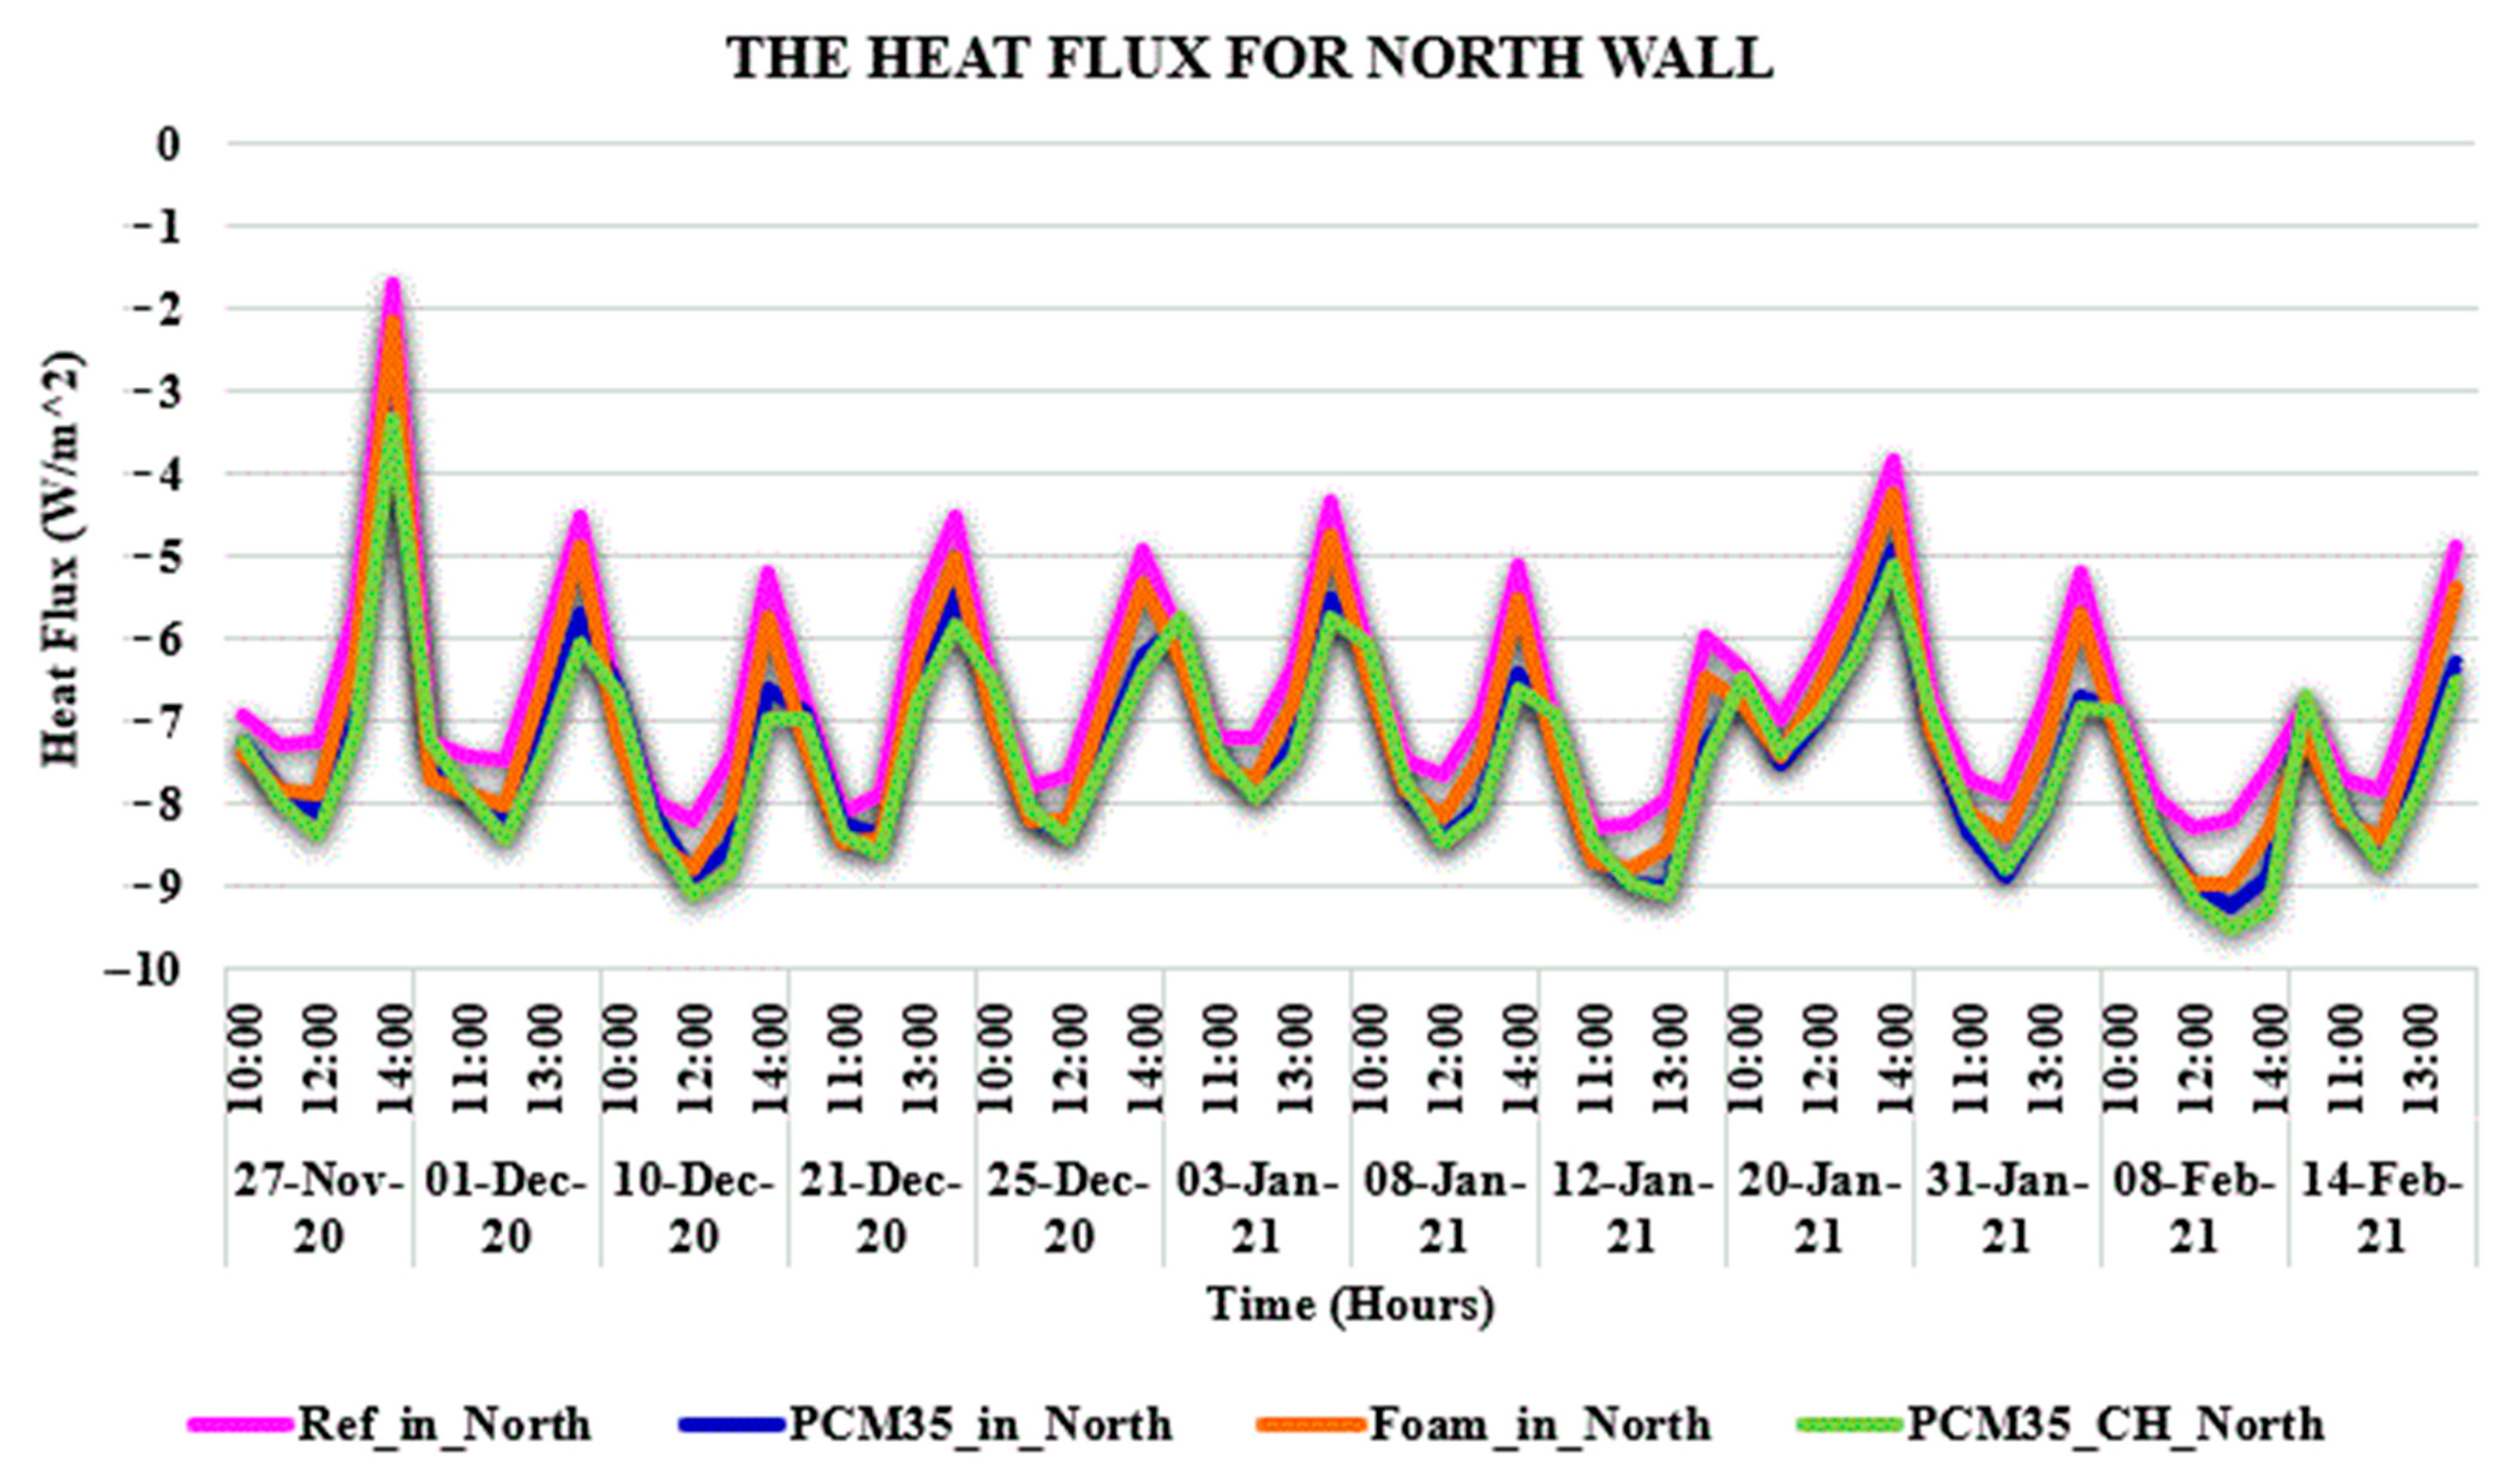
4.2. Rate of Heat Transfer and Heat Flux Based on The Collected Data
4.3. PCM Energy-Saving Expectations
4.4. Research Limitations
- The experiment studied the performance of insulation in only one location, which is inside hollow bricks.
- This experiment was just a small prototype to investigate PCMs as a building material and to study their thermal performance. The initial cost and energy consumption cost for the same materials used in the experiment can possibly be investigated in future research on an actual scale.
- The experiment chambers were fully closed, with no opening for ventilation to study the PCM behavior.
- The chambers were designed to be small due to the limited amount of PCMs and the affordability of their price.
- The experiment did not study the possibility of leakage when the PCMs reached the melting phase and became liquid.
5. Conclusions
- (1)
- At the highest temperature reached during the experiment:
- Both PCMs showed better thermal behavior than polystyrene foam and bricks alone at peak time.
- PCM RT35 produced a 13% better cooling effect than PCM 35HC; it was 24% better than foam and 28.56% better than hollow bricks alone.
- (2)
- At the lowest temperature reached during the experiment:
- The PCM RT35HC chamber showed better results in saving energy and kept the chamber warm than all other chambers; it was 9.5% better than the reference chamber, 7.0% better than the foam chamber, and 2.81% better than the PCM RT35 chamber.
Author Contributions
Funding
Institutional Review Board Statement
Informed Consent Statement
Data Availability Statement
Conflicts of Interest
References
- Conti, J.; Holtberg, P.; Diefenderfer, J.; LaRose, A.; Turnure, J.; Westfall, L. International Energy Outlook 2016 with Projections to 2040; USDOE Energy Information Administration (EIA): Washington, DC, USA, 2016. [Google Scholar]
- Al-Saadi, S.; Budaiwi, I. Performance-based envelope design for residential buildings in hot climates. In Proceedings of the Building Simulation, Beijing, China, 3–6 September 2007. [Google Scholar]
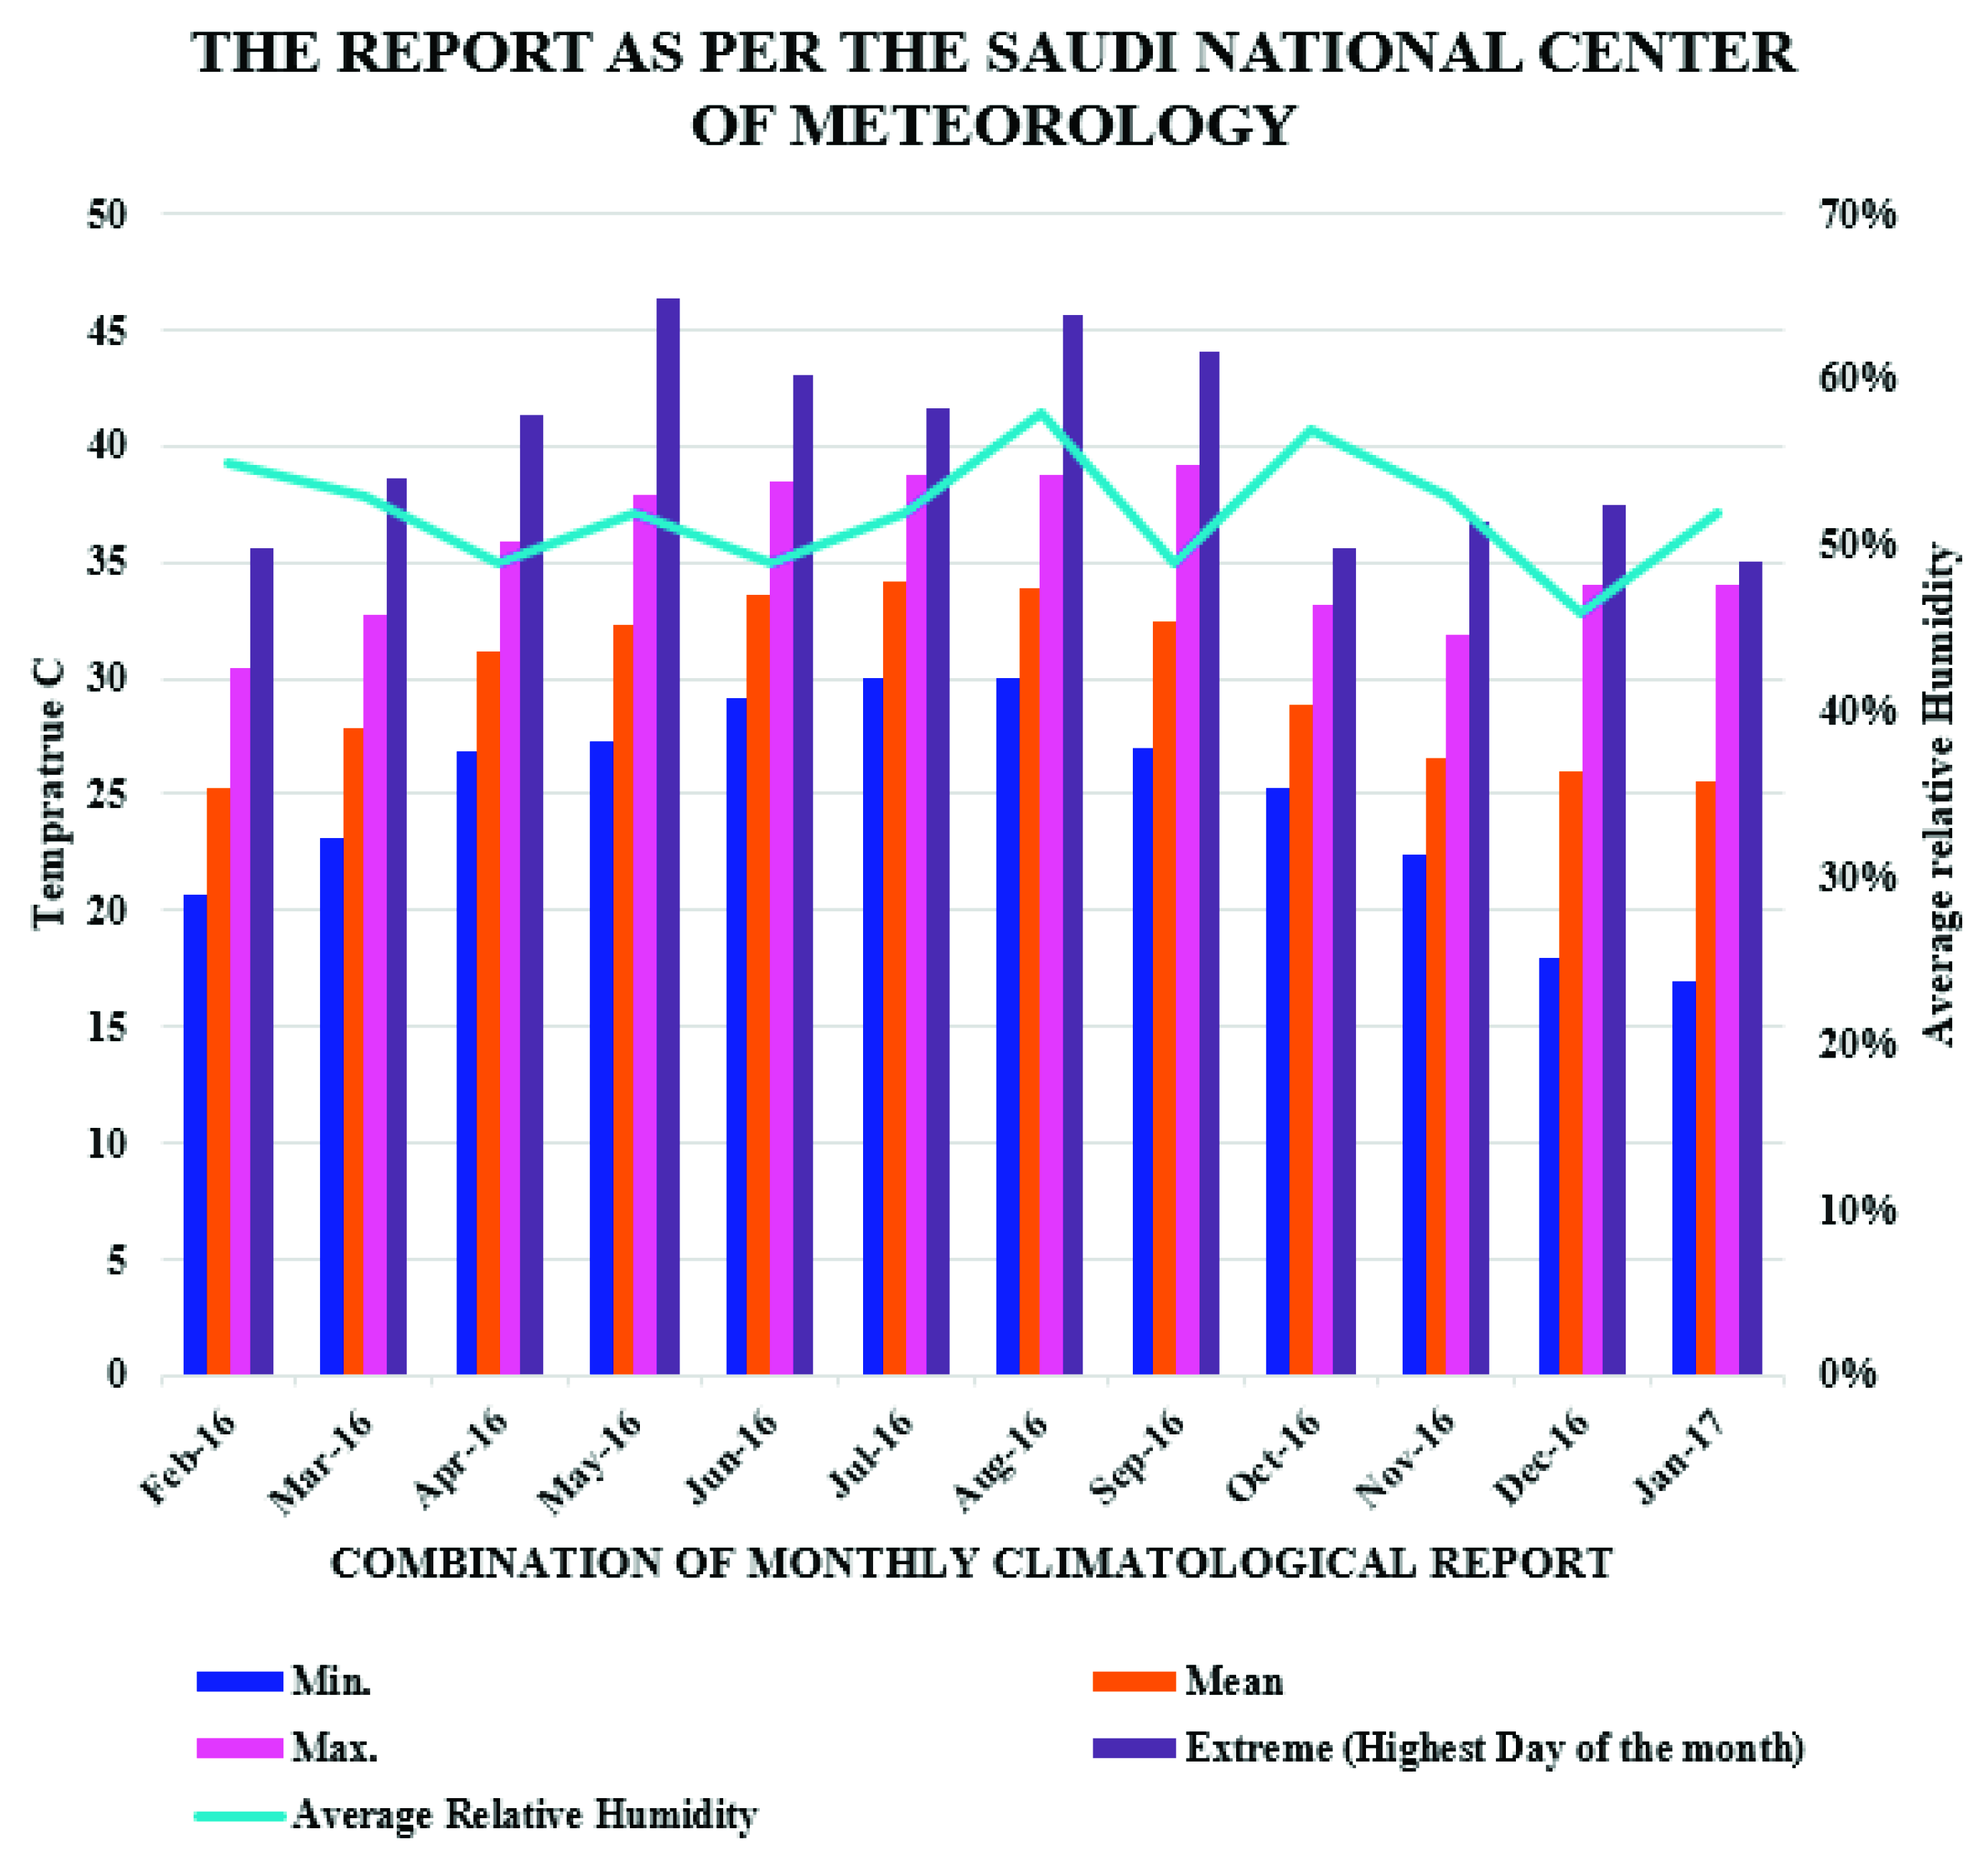
- Meteorology, National Center for Meteorology. KSA Climate. 2019. Available online: https://ncm.gov.sa/Ar/Climate/KSAClimate/Pages/TemperatureAndPrecipitation.aspx (accessed on 11 August 2019).
- Saudi Electricity Company. Electrical Data 2018; SEC: Jeddah, Saudi Arabia, 2020. [Google Scholar]
- General Authority for Statistics. Housing Survey Data; GAStat: Jeddah, Saudi Arabia, 2020. [Google Scholar]
- Costanzo, V.; Evola, G.; Marletta, L.; Nocera, F. The effectiveness of phase change materials in relation to summer thermal comfort in air-conditioned office buildings. Build. Simul. 2018, 11, 1145–1161. [Google Scholar] [CrossRef]
- Rathore, P.K.S.; Shukla, S.K. Potential of macroencapsulated PCM for thermal energy storage in buildings: A comprehensive review. Constr. Build. Mater. 2019, 225, 723–744. [Google Scholar] [CrossRef]
- Zhou, D.; Zhao, C.-Y.; Tian, Y. Review on thermal energy storage with phase change materials (PCMs) in building applications. Appl. Energy 2012, 92, 593–605. [Google Scholar] [CrossRef] [Green Version]
- Ben-Abdallah, R.; Leducq, D.; Hoang, H.; Fournaison, L.; Pateau, O.; Ballot-Miguet, B.; Delahaye, A. Experimental investigation of the use of PCM in an open display cabinet for energy management purposes. Energy Convers. Manag. 2019, 198, 111909. [Google Scholar] [CrossRef]
- Navarro, L.; de Gracia, A.; Colclough, S.; Browne, M.; McCormack, S.; Griffiths, P.; Cabeza, L.F. Thermal energy storage in building integrated thermal systems: A review. Part 1. Active storage systems. Renew. Energy 2016, 88, 526–547. [Google Scholar] [CrossRef] [Green Version]
- Navarro, L.; de Gracia, A.; Niall, D.; Castell, A.; Browne, M.; McCormack, S.J.; Griffiths, P.; Cabeza, L.F. Thermal energy storage in building integrated thermal systems: A review. Part 2. Integration as passive system. Renew. Energy 2016, 85, 1334–1356. [Google Scholar] [CrossRef] [Green Version]
- Vicente, R.; Silva, T. Brick masonry walls with PCM macrocapsules: An experimental approach. Appl. Therm. Eng. 2014, 67, 24–34. [Google Scholar] [CrossRef]
- Abu-Hamdeh, N.H.; Melaibari, A.A.; Alquthami, T.S.; Khoshaim, A.; Oztop, H.F.; Karimipour, A. Efficacy of incorporating PCM into the building envelope on the energy saving and AHU power usage in winter. Sustain. Energy Technol. Assess. 2021, 43, 100969. [Google Scholar]
- Chen, X.; Zhang, Q.; Zhai, Z.; Ma, X. Optimization and sensitivity analysis of design parameters for a ventilation system using phase change materials. Build. Simul. 2019, 12, 961–971. [Google Scholar] [CrossRef]
- Li, Y.; Zhang, N.; Ding, Z. Investigation on the energy performance of using air-source heat pump to charge PCM storage tank. J. Energy Storage 2020, 28, 101270. [Google Scholar] [CrossRef]
- Memon, S.A. Phase change materials integrated in building walls: A state of the art review. Renew. Sustain. Energy Rev. 2014, 31, 870–906. [Google Scholar] [CrossRef]
- Feldman, D.; Banu, D.; Hawes, D.; Ghanbari, E. Obtaining an energy storing building material by direct incorporation of an organic phase change material in gypsum wallboard. Sol. Energy Mater. 1991, 22, 231–242. [Google Scholar] [CrossRef]
- Konuklu, Y.; Ostry, M.; Paksoy, H.O.; Charvat, P. Review on using microencapsulated phase change materials (PCM) in building applications. Energy Build. 2015, 106, 134–155. [Google Scholar] [CrossRef]
- Cabeza, L.F.; Castell, A.; Barreneche, C.D.; De Gracia, A.; Fernández, A.I. Materials used as PCM in thermal energy storage in buildings: A review. Renew. Sustain. Energy Rev. 2011, 15, 1675–1695. [Google Scholar] [CrossRef]
- Raj, V.A.A.; Velraj, R. Review on free cooling of buildings using phase change materials. Renew. Sustain. Energy Rev. 2010, 14, 2819–2829. [Google Scholar] [CrossRef]
- Hasan, A.; Al-Sallal, K.A.; Alnoman, H.; Rashid, Y.; Abdelbaqi, S. Effect of Phase Change Materials (PCMs) Integrated into a Concrete Block on Heat Gain Prevention in a Hot Climate. Sustainability 2016, 8, 1009. [Google Scholar] [CrossRef] [Green Version]
- Lee, K.O.; Medina, M.A.; Raith, E.; Sun, X. Assessing the integration of a thin phase change material (PCM) layer in a residential building wall for heat transfer reduction and management. Appl. Energy 2015, 137, 699–706. [Google Scholar] [CrossRef]
- Jin, X.; Medina, M.A.; Zhang, X. On the placement of a phase change material thermal shield within the cavity of buildings walls for heat transfer rate reduction. Energy 2014, 73, 780–786. [Google Scholar] [CrossRef]
- Erlbeck, L.; Schreiner, P.; Schlachter, K.; Dörnhofer, P.; Fasel, F.; Methner, F.-J.; Rädle, M. Adjustment of thermal behavior by changing the shape of PCM inclusions in concrete blocks. Energy Convers. Manag. 2018, 158, 256–265. [Google Scholar] [CrossRef]
- Kośny, J.; Biswas, K.; Miller, W.; Kriner, S. Field thermal performance of naturally ventilated solar roof with PCM heat sink. Sol. Energy 2012, 86, 2504–2514. [Google Scholar] [CrossRef]
- Alva, G.; Liu, L.; Huang, X.; Fang, G. Thermal energy storage materials and systems for solar energy applications. Renew. Sustain. Energy Rev. 2017, 68, 693–706. [Google Scholar] [CrossRef]
- Campbell, K.R.; Sailor, D.J. Phase change materials as thermal storage for high performance homes. In Proceedings of the ASME International Mechanical Engineering Congress and Exposition, Denver, CO, USA, 11–17 November 2011. [Google Scholar]
- Heim, D.; Wieprzkowicz, A. Positioning of an isothermal heat storage layer in a building wall exposed to the external environment. J. Build. Perform. Simul. 2016, 9, 542–554. [Google Scholar] [CrossRef]
- Evola, G.; Marletta, L.; Sicurella, F. Simulation of a ventilated cavity to enhance the effectiveness of PCM wallboards for summer thermal comfort in buildings. Energy Build. 2014, 70, 480–489. [Google Scholar] [CrossRef]
- National Committee for the Saudi Building Code. Building Codes, Technical Requirements/Guidance; National Committee for the Saudi Building Code: Riyadh, Saudi Arabia, 2020. [Google Scholar]
- Bergman, T.L.; Incropera, F.P.; DeWitt, D.P.; Lavine, A.S. Fundamentals of Heat and Mass Transfer; John Wiley & Sons: Hoboken, NJ, USA, 2011. [Google Scholar]
- Neeper, D. Thermal dynamics of wallboard with latent heat storage. Sol. Energy 2000, 68, 393–403. [Google Scholar] [CrossRef]
- Hawes, D.; Banu, D.; Feldman, D. Latent heat storage in concrete. II. Sol. Energy Mater. 1990, 21, 61–80. [Google Scholar] [CrossRef]
- Heim, D.; Clarke, J.A. Numerical modelling and thermal simulation of PCM–gypsum composites with ESP-r. Energy Build. 2004, 36, 795–805. [Google Scholar] [CrossRef]
- Rubitherm, Phase Change Materials. Products, PCM RT-Line; Rubitherm Technologies GmbH: Berlin, Germany, 2020. [Google Scholar]
- El-Khayyat Red Bricks Factory. Red Bricks Products, Shield, 29 Holes; El-Khayyat Red Bricks Factory: Jeddah, Saudi Arabia, 2020. [Google Scholar]
- Ibtkar Al-Arabia Factory. Ibtkar Al-Arabia for Insulation System; Ibtkar Al-Arabia Factory: Rabigh, Saudi Arabia, 2019. [Google Scholar]
- Silva, T.; Vicente, R.; Soares, N.; Ferreira, V. Experimental testing and numerical modelling of masonry wall solution with PCM incorporation: A passive construction solution. Energy Build. 2012, 49, 235–245. [Google Scholar] [CrossRef]


| Properties | Melting Point (°C) | Solidification Point (°C) | Latent Heat | Specific Heat Capacity | Thermal Conductivity | Density |
|---|---|---|---|---|---|---|
| PCM RT35 [35] | 29–36 | 36–31 | 160 | 2 | 0.2 | |
| PCM RT35HC [35] | 34–36 | 36–34 | 240 | 2 | 0.2 | |
| Brick [36] | - | - | - | - | 0.378 | 1.861 |
| Polystyrene foam [37] | - | - | - | - | 0.033 | 0.032–0.035 |
| Epoxy resin | 130 | - | - | 1 | 0.2 | 0.002 |
| Cement mortar | - | - | - | 1 | 1 | 1.8 |
Publisher’s Note: MDPI stays neutral with regard to jurisdictional claims in published maps and institutional affiliations. |
© 2021 by the authors. Licensee MDPI, Basel, Switzerland. This article is an open access article distributed under the terms and conditions of the Creative Commons Attribution (CC BY) license (https://creativecommons.org/licenses/by/4.0/).
Share and Cite
Bagazi, M.S.; Melaibari, A.A.; Khoshaim, A.B.; Abu-Hamdeh, N.H.; Alsaiari, A.O.; Abulkhair, H. Using Phase Change Materials (PCMs) in a Hot and Humid Climate to Reduce Heat Gain and Energy Consumption. Sustainability 2021, 13, 10965. https://doi.org/10.3390/su131910965
Bagazi MS, Melaibari AA, Khoshaim AB, Abu-Hamdeh NH, Alsaiari AO, Abulkhair H. Using Phase Change Materials (PCMs) in a Hot and Humid Climate to Reduce Heat Gain and Energy Consumption. Sustainability. 2021; 13(19):10965. https://doi.org/10.3390/su131910965
Chicago/Turabian StyleBagazi, Mohammad S., Ammar A. Melaibari, Ahmed B. Khoshaim, Nidal H. Abu-Hamdeh, Abdulmohsen O. Alsaiari, and Hani Abulkhair. 2021. "Using Phase Change Materials (PCMs) in a Hot and Humid Climate to Reduce Heat Gain and Energy Consumption" Sustainability 13, no. 19: 10965. https://doi.org/10.3390/su131910965